Abstract
The electric energy metering box serves as a crucial node in power grid operations, offering essential protection for key components in the distribution network, such as smart meters, data acquisition terminals, and circuit breakers, thereby ensuring their safe and reliable operation. However, the non-metallic housings of these boxes are susceptible to aging under environmental stress, which can result in diminished flame-retardant properties and an increased risk of fire. Currently, there is a lack of rapid and accurate methods for assessing the fire resistance of non-metallic metering box enclosures. In this study, laser-induced breakdown spectroscopy (LIBS), which enables fast, multi-element, and non-contact analysis, was utilized to develop an effective assessment approach. Thermal aging experiments were conducted to systematically investigate the degradation patterns and mechanisms underlying the reduced flame-retardant performance of sheet molding compound (SMC), a representative non-metallic material used in metering box enclosures. The results showed that the intensity ratio of aluminum ionic spectral lines is highly correlated with the flame-retardant grade, serving as an effective performance indicator. On this basis, a one-dimensional convolutional neural network (1D-CNN) model was developed utilizing LIBS data, which achieved over 92% prediction accuracy for different flame-retardant grades on the test set and demonstrated high recognition accuracy for previously unseen samples. This method offers significant potential for rapid, on-site evaluation of flame-retardant grades of non-metallic electric energy metering boxes, thereby supporting the safe and reliable operation of power systems.
1. Introduction
Electric energy metering boxes are frequently subjected to complex service conditions, including elevated temperatures, high humidity, and fluctuations in electrical load. Under these conditions, the thermal aging of materials may lead to a degradation in flame retardancy, significantly increasing the risk of electrical fires. Sheet molding compound (SMC) features excellent insulation properties, corrosion resistance, thermal insulation performance, and mechanical strength, which makes it a preferred material for non-metallic enclosures of metering boxes. As such, SMC is typically expected to achieve an initial flame-retardant rating of no less than V-0. While most current research focuses on the initial flame-retardant properties of SMC materials, a systematic understanding of the coupling mechanisms between thermal aging and flame retardancy during long-term service remains insufficient [1,2,3,4,5]. Moreover, there is a pressing need for rapid, in situ evaluation methods suitable for field applications. The primary objective of this study is to investigate the evolution of SMC material performance under high-temperature conditions through systematic thermal aging experiments and flame retardancy tests. Specifically, the study aims to elucidate the mechanisms by which aging influences material properties and to develop a LIBS-based method for characterizing flame retardancy.
LIBS [6] is an emerging material composition detection technology. Its principle is to direct high-energy lasers at the sample surface through a lens such that the sample is ablated and excited to form a plasma. Subsequently, the atomic emission spectrum of the plasma is collected by a spectrometer to determine the elemental composition of the sample, thereby carrying out material identification, classification, and qualitative and quantitative analysis. Since the 1960s, the development of portable, low-cost lasers and high-resolution spectrometers has allowed LIBS technology to make remarkable advances in various fields, including extraterrestrial exploration, cultural heritage identification, life sciences, and environmental monitoring [7,8,9,10,11,12]. A typical LIBS detection system comprises the following parts: a laser emission system, optical path system, delay controller, spectral data acquisition system, spectrometer, and computer. The pulsed laser beam is focused onto the sample by an optical lens, generating plasma on the sample surface. A small portion of the sample is rapidly heated, ablated, dissociated, excited, and ionized, resulting in the formation of an approximately electrically neutral plasma. After cessation of the laser pulse, the plasma gradually cools and expands. As atoms and ions in the plasma transition from higher to lower energy levels, they emit photons at characteristic frequencies, thereby generating an emission spectrum that contains element-specific information. The wavelengths of the emission spectrum reveal the types of elements present in the material, while the spectral intensities correspond to the elemental concentrations. Under the control of the delay controller, the spectrometer collects the plasma emission spectra via a collection probe and transmits the data to the computer for analysis. Based on this spectral data, qualitative and quantitative analyses of the sample can be performed [13,14,15,16].
As an emerging technique for material analysis, LIBS has been widely investigated for the characterization of material properties. Sivakumar et al. [17] studied the influence of bulk density on LIBS measurements, with particular emphasis on how packing density in both single-component and composite samples composed of carbon and iron particles affects the relative standard deviation of spectral line intensities. Their results indicated that adjusting the ratio between laser spot size and particle size helps reduce measurement fluctuations. In composite samples, finer particles enhanced the uniformity of the laser–sample interaction zone, thereby reducing the relative standard deviation. Wang et al. [18] identified a linear relationship between the ablation depth of room-temperature vulcanized silicone rubber and the number of laser pulses, which was utilized to determine the thickness of surface coatings. He et al. [19] used LIBS to analyze Q235 steel with different copper plating thicknesses and found linear correlations between plasma temperature, the intensity ratio of ionic to atomic lines at the interface, and sample hardness. This demonstrates the feasibility of using LIBS to assess surface hardness in film-structured materials. In terms of electrical performance characterization, Chen et al. [20] investigated the correlation between the tracking resistance of silicone rubber modified with different mass fractions of aluminum trihydrate (ATH) and silica fillers, and LIBS spectral data. Their results demonstrated that, when combined with inclined plane testing and thermogravimetric analysis, principal component analysis and neural network models could effectively classify tracking resistance levels based on LIBS spectra.
In this study, SMC samples subjected to various thermal aging durations were prepared. The flame-retardant rating of each sample was then determined using vertical burning tests to assess the effects of aging on flame-retardant performance. Based on the obtained spectral data, the samples were classified according to their flame-retardant rating. LIBS was subsequently used to analyze SMC materials at different stages of thermal aging, and the relationship between LIBS spectral features and flame-retardant performance was investigated. A predictive model was developed to correlate the spectral data with flame-retardant grades. The effectiveness of LIBS for material performance evaluation was subsequently validated through experimental data analysis. By establishing a flame-retardant rating prediction model for SMC materials, this research provides a scientific basis for the maintenance and service life prediction of electric energy metering boxes.
2. Materials and Methods
2.1. Materials
The experimental material examined in this study is SMC, with the research primarily focusing on assessing its flame-retardant performance. Flame-retardants are essential for enhancing the fire resistance of polymer composites, operating through several synergistic mechanisms, such as heat absorption, gas-phase dilution, condensed-phase barrier formation, and the promotion of char layer development. The principal types of flame-retardants are halogen-based, phosphorus-based, nitrogen-based, and inorganic compounds, each exhibiting distinct mechanisms of action. Halogen-based flame retardants interrupt combustion by capturing free radicals, though their decomposition can release toxic gases. Phosphorus-based retardants facilitate the formation of stable char layers, while nitrogen-based agents release inert gases to dilute combustible components and are often used in combination with phosphorus-based compounds. Inorganic flame retardants, such as metal hydroxides, inhibit flame propagation by absorbing heat and reducing the surface temperature of the material [21,22].
In this study, aluminum hydroxide was selected as the flame retardant in the SMC formulation. The overall structure of SMC consists of a three-dimensional network formed by resin, glass fibers, and fillers. As illustrated in Figure 1, aluminum hydroxide is primarily distributed in the surface and sub-surface layers of the material, where it enhances fire resistance by absorbing heat and promoting char formation under high-temperature conditions.
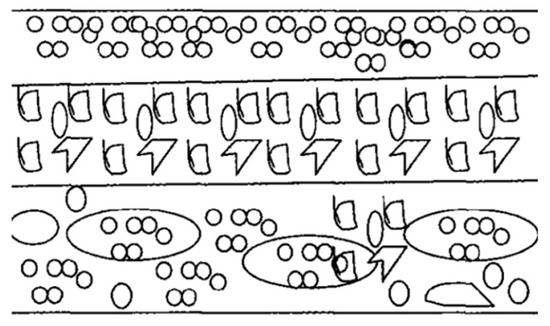
Figure 1.
Surface structure of SMC materials.
Prior to LIBS analysis, all samples underwent a standardized pretreatment procedure. Each sample was ultrasonically cleaned in anhydrous ethanol for 15 min to remove surface contaminants, then rinsed several times with distilled water. The samples were gently dried to eliminate residual moisture and subsequently stored at room temperature for 24 h to ensure complete surface dryness.
2.2. Vertical Burning Test for Flame-Retardant Rating
In this study, seven groups of SMC specimens were prepared, each comprising 20 standard test samples. All samples were fabricated with uniform dimensions of 125 mm × 13 mm × 3 mm in accordance with the requirements of the vertical burning test. To investigate the effects of thermal aging, an accelerated aging environment was established using a constant-temperature chamber maintained at 230 °C. The seven groups were subjected to different aging durations: 0 h, 24 h, 72 h, 120 h, 168 h, 240 h, and 336 h. Representative age samples are presented in Figure 2. For each group, five parallel specimens were selected for the initial round of testing. If the data obtained from this round exhibited variability exceeding the predefined threshold, additional specimens from the same group were tested to ensure data reliability.
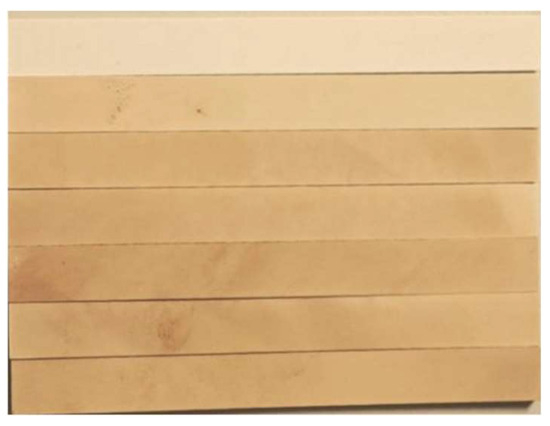
Figure 2.
Thermally aged specimens used in the vertical burning test.
The flame retardant performance tests were conducted in strict accordance with GB/T 5169.16 “Fire hazard testing for electric and electronic products Part 16: Test flames-50 W horizontal and vertical flame test methods” [23]. The vertical burning test system is illustrated in Figure 3. A specialized clamp was used to secure the specimen 6 mm from its upper end, ensuring that the longitudinal axis remained vertical. A cotton pad measuring 50 mm × 50 mm × 6 mm was placed directly beneath the sample. The burner was mounted on a three-dimensional positioning platform, enabling precise positioning across the test bench. The central axis of the burner nozzle was kept vertically oriented, and the distance between the top of the nozzle and the midpoint of the specimen’s lower edge was maintained at (10 ± 1) mm. During the ignition phase, the flame was applied to the specimen for (10 ± 0.5) seconds under programmed control. After ignition, the burner was automatically extinguished and retracted to a safe distance to ensure that the specimen was no longer affected by the flame.
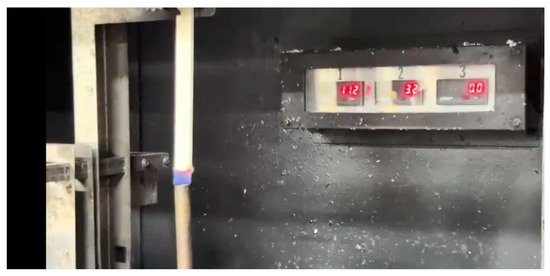
Figure 3.
Vertical flame test equipment.
Immediately after the flame is withdrawn, the first afterflame time t1 is recorded. Once the afterflame is extinguished, the burner nozzle is promptly repositioned to apply the second ignition, also maintained for (10 ± 0.5) seconds. Following the second ignition, the burner is extinguished and retracted. The second afterflame time t2 and afterglow time t3 are then recorded. After completing the full test procedure for all five specimens in each group, the total afterflame time tf is calculated using the following formula:
In the formula, tf represents the total afterflame time, which serves as a comprehensive indicator of the material’s flame-retardant performance and is measured in seconds. t1,i and t2,i denote the durations of the first and second afterflame periods for the i-th specimen, respectively, also in seconds. By conducting statistical analysis on the tf values across different groups, the flame-retardant ratings of SMC materials under various aging durations can be determined. The specific classification criteria are presented in Table 1.

Table 1.
Standards for determining flame retardancy in vertical burning tests.
The evolution of the flame-retardant rating of SMC samples with aging time is illustrated in Figure 4. Initially, the samples exhibited the highest flame-retardant rating, V-0. In the early stages of aging, this rating remained unchanged. However, as the aging duration increased, the flame-retardant rating gradually declined, ultimately reaching the lowest level, V-2.
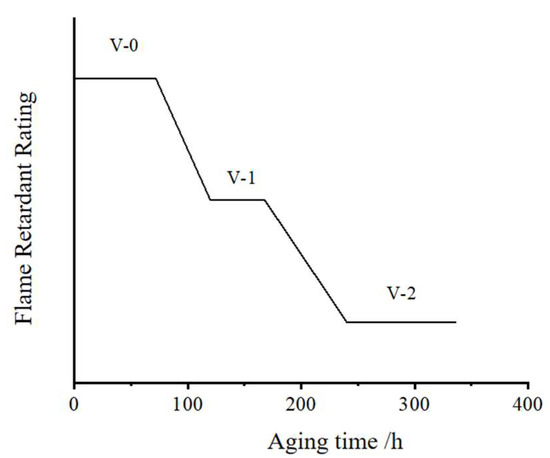
Figure 4.
Effect of aging duration on flame-retardant rating.
2.3. LIBS Experimental Platform
The experimental platform, depicted in Figure 5, consists of several key instruments. A nanosecond Nd:YAG laser (Nimma-900, Lei Bao Optoelectronics Company, Beijing, Ghina) served as the excitation source, supporting wavelength switching among 1064 nm, 532 nm, 355 nm, and 266 nm. For all measurements in this study, the 1064 nm wavelength was utilized. The laser’s main parameters are: maximum single-pulse energy of 900 mJ, pulse width ≤ 9 ns, adjustable repetition rate from 1 to 10 Hz, and operation in external trigger mode. Spectral acquisition was conducted using an Avantes AVS-RACKMOUNT-USB2 spectrometer (Beijing Avantes Co., Ltd., Beijing, China), which covers a wavelength range of 200–640 nm with a spectral resolution of 0.09–0.13 nm. Data collection and analysis were carried out using Avasoft 8.16 software. The optical path incorporates mirrors and a convex lens (6 cm in diameter) to enhance the collection of plasma emission. A fiber probe positioned at the focal point of the lens transmits the collected signal to the spectrometer. System synchronization was achieved using a DG645 eight-channel digital delay generator (Stanford Research Systems, Sunnyvale, CA, USA), offering a delay resolution of 5 ps per channel, channel jitter less than 25 ps, and delay setting accuracy of 1 ns. This device coordinated the timing of the laser Q-switch trigger and the external trigger of the spectrometer.
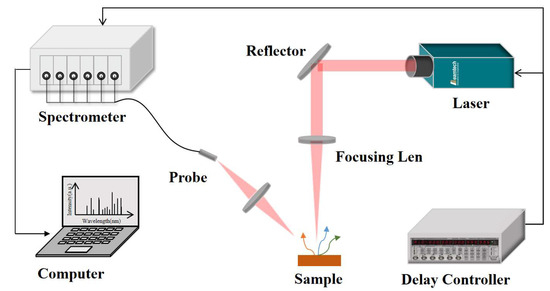
Figure 5.
Schematic diagram of the LIBS experimental platform.
In this study, LIBS data processing was conducted through a systematic sequence of steps. First, background spectral signals were removed to minimize the effects of ambient interference. Next, baseline correction and noise reduction were achieved using the discrete wavelet transform (DWT), improving the overall quality of the spectral data. The continuous wavelet transform (CWT) was subsequently applied for precise identification of spectral peaks. Finally, the central wavelengths of the detected peaks were compared with standard reference values from the NIST Atomic Spectra Database [24] to accurately assign elemental attribution to each spectral line.
3. Flame-Retardant Performance Degradation Mechanism of SMC and Characterization Based on LIBS
3.1. Flame-Retardant Performance Degradation Mechanism of SMC at High Temperatures
The degradation of the flame-retardant performance of SMC materials during thermal aging is primarily attributed to the following factors. Under prolonged high-temperature exposure, aluminum hydroxide undergoes premature decomposition, leading to reduced heat absorption efficiency during actual combustion. In this study, the thermal aging temperature was set to 230 °C, at which aluminum hydroxide predominantly experiences the initial stage of thermal decomposition, converting to boehmite (AlO(OH)) and releasing crystalline water. Additionally, the resin matrix undergoes molecular chain scission at elevated temperatures, resulting in the formation of low-molecular-weight carboxylic compounds. These compounds can locally react with the surfaces of aluminum hydroxide particles, thereby disrupting their dispersion stability within the resin and promoting agglomeration of the flame-retardant. This agglomeration markedly reduces the density of the protective surface layer. Furthermore, thermal stresses induce the formation of microcracks at the interface between the glass fibers and the resin matrix, providing rapid pathways for flame propagation.
The infrared spectrum of aluminum hydroxide is characterized by hydroxyl (-OH) stretching vibration peaks in the 3400–3700 cm−1 range. Figure 6 presents the changes in the intensity of these hydroxyl absorption peaks on the SMC surface after various aging durations. As shown in the figure, the intensity of the hydroxyl absorption peaks decreases progressively with increasing aging time, indicating the gradual degradation of the aluminum hydroxide-based flame-retardant system.
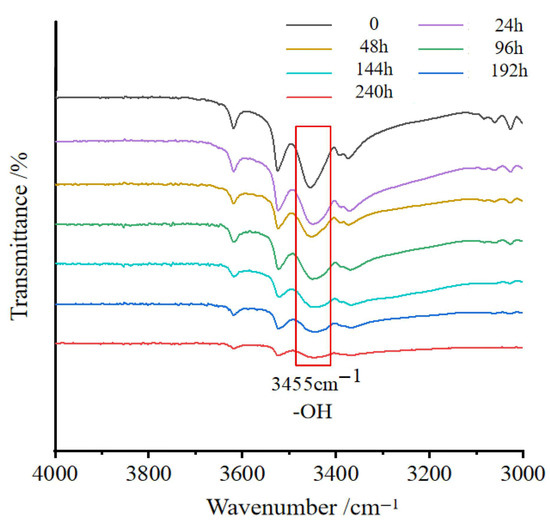
Figure 6.
Variation of hydroxyl absorption peak intensity on the SMC surface with different aging durations.
Furthermore, ICP test results indicate that the cumulative loss of aluminum content reached 68.27% after aging. This suggests that, in addition to the inherent thermal decomposition of aluminum hydroxide during thermal aging, degradation at the resin–filler interface also contributes to the loss of fine filler particles and their decomposition products. As a result, the heat absorption capacity of the flame retardant during combustion is diminished, leading to a reduction in the material’s flame-retardant rating.
3.2. Flame-Retardant Rating Characterization Using LIBS Spectral Data
LIBS tests were performed on each group of SMC samples using a laser operating at a continuous pulse frequency of 1 Hz. The laser beam was directed perpendicularly to the sample surface, with the spot size adjusted to 50 mm. The single-pulse laser energy was set to 45 mJ, and the detection delay time was fixed at 1.5 μs. Each sample underwent 20 consecutive laser pulses. The spectral lines used for Boltzmann plot calculations [25] are listed in Table 2. Based on these lines, the plasma temperature of each sample group was determined using the Boltzmann plot method, with the results presented in Figure 7.
Table 2.
Flame-retardant grade prediction results.
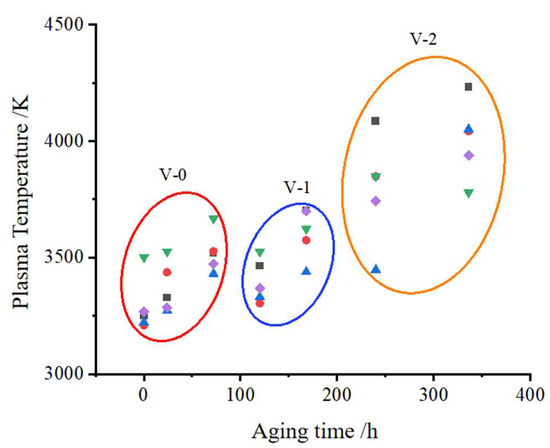
Figure 7.
Variation of plasma temperature in samples with different flame-retardant ratings.
In the figure, data points with different colors and shapes represent different samples measured at the same aging time. It can be observed that the plasma temperature generally increases with longer aging times. Samples with a flame-retardant rating of V-2 consistently exhibit higher plasma temperatures, while those rated V-0 and V-1 display relatively lower values. However, the difference in plasma temperature between the V-0 and V-1 groups is minimal.
Based on the previously discussed degradation mechanism of flame-retardant performance, prolonged high-temperature exposure leads to the decomposition of the flame retardant in the SMC material, thereby weakening the protective properties of the surface. As a result, when subjected to laser pulse ablation, the material’s ability to absorb energy diminishes, and heat transfer becomes less efficient. Consequently, more energy is concentrated at the site of laser ablation, resulting in an increased plasma temperature. Although there is a certain correlation between plasma temperature and the flame-retardant rating of the material, considerable fluctuations in plasma temperature are observed among individual samples within the same group. Therefore, plasma temperature can only serve as an auxiliary indicator for determining the flame-retardant grade and is insufficient for making precise classifications on its own.
According to the earlier analysis of the SMC flame-retardant system, the primary factor affecting the flame-retardant performance of SMC materials is the content of aluminum hydroxide. Therefore, the following section examines how the intensity of the aluminum elemental spectral line varies with aging time during the thermal aging process. Figure 8 and Figure 9, respectively, present the variations in the intensities of the main aluminum spectral lines for seven groups of samples subjected to different aging durations, with each group comprising five samples. For the atomic line Al I at 396.1520 nm, the intensity generally exhibits a decreasing trend as the aging time increases. However, significant fluctuations within the same group cause this trend to be unstable. In contrast, the intensity of the ionic line Al II at 559.3302 nm shows no clear pattern with respect to aging time. These findings indicate that considerable variation in plasma state occurs among samples with identical aging times during LIBS testing, which substantially affects the measured spectral intensities. Therefore, the intensity of the elemental spectral lines cannot be directly used as a criterion for assessing the flame-retardant performance of the samples.
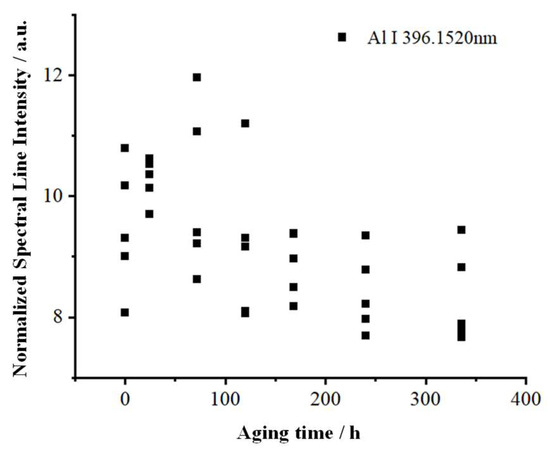
Figure 8.
Variation of Al I 396.1520 nm intensity at different aging times.

Figure 9.
Variation of Al II 559.3302 nm intensity at different aging times.
Theoretically, as the aluminum hydroxide flame retardant decomposes and is consumed, the concentration of aluminum on the sample surface should gradually decrease, which would be reflected by a continuous decline in the intensity of aluminum-related spectral lines in the spectra. However, the measured results indicate that the elemental spectral line intensities do not display a consistent downward trend. One possible explanation is the agglomeration of aluminum hydroxide particles during the aging process, which reduces their distribution uniformity within the SMC material, causing the LIBS spectra to inaccurately represent the average aluminum content. Another contributing factor may be that the deterioration of the material’s flame-retardant performance enhances plasma excitation, resulting in a higher degree of aluminum ionization and consequently an increase in the intensity of aluminum ionic spectral lines. Further analysis of the relationship between the intensity ratio of aluminum ionic to atomic spectral lines and the flame-retardant rating reveals that an increase in the ion-to-atom intensity ratio is generally associated with a reduction in flame-retardant grade, as illustrated in Figure 10.
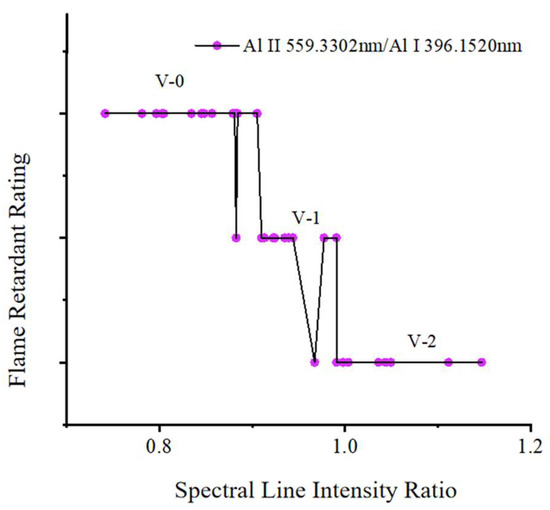
Figure 10.
Relationship between flame-retardant level and Al II/Al I spectral intensity ratio.
As shown in Figure 10, when the flame-retardant grade is V-0, the intensity ratio of aluminum ionic to atomic spectral lines remains relatively low, typically below 0.9, indicating a lower degree of aluminum ionization. When the flame-retardant grade declines to V-2, this ratio exceeds 1.0, suggesting a higher degree of ionization. For ratios that fall between these values, the flame-retardant grade is generally V-1. However, due to significant plasma fluctuations, the spectral line ratio may occasionally fall outside this range, making it difficult to accurately distinguish the V-1 grade. Consequently, for V-0 and V-2 grades, the ion-to-atom ratio can serve only as a reference indicator rather than a precise criterion.
In summary, while the flame-retardant grade of SMC materials exhibits a certain correlation with both plasma temperature and the aluminum ion-to-atom spectral line intensity ratio, these spectral parameters can serve only as auxiliary indicators. There is no direct or definitive relationship between these spectral characteristics and the flame-retardant grade. Therefore, further research is needed to develop more accurate and broadly applicable methods for evaluating flame-retardant performance.
4. Flame-Retardant Grade Prediction Based on Neural Networks
Analytical methods employed in previous studies typically focus on only one or a few spectral lines related to material properties. However, LIBS spectra can contain hundreds of elemental lines and also capture synergistic interactions among different elements, as well as information on the plasma excitation state. To fully utilize this wealth of spectral information, this study employs a convolutional neural network (CNN) model to predict the flame-retardant ratings of SMC samples.
4.1. Introduction to One-Dimensional Convolutional Neural Networks
CNNs are bio-inspired deep learning models, whose architecture is motivated by the concepts of “local receptive fields” and “hierarchical information processing” found in biological visual systems. The core strength of CNNs lies in their capacity to automatically learn hierarchical representations, extracting both local features and global semantic information through the integration of convolutional operations, pooling layers, and nonlinear activation functions.
The basic architecture of CNNs comprises an input layer, an output layer, convolutional layers, and pooling layers. Convolutional layers extract low-level features by applying convolution kernels across local regions of the input data, and as multiple convolutional layers are stacked, these low-level features are gradually aggregated into higher-level representations. Pooling layers, on the other hand, downsample the feature maps, reducing spatial dimensionality while retaining essential information and improving the model’s robustness. Activation functions enhance the nonlinear representational capacity of neural networks, allowing them to approximate complex input-output relationships [26,27].
As the LIBS spectral data analyzed in this study are one-dimensional signals, a one-dimensional convolutional neural network (1D-CNN) model was employed. The structural schematic of the 1D-CNN is presented in Figure 11. Key spectral features, including the positions, intensities, and shapes of characteristic peaks, often appear as distinct local patterns within specific wavelength ranges. By sliding convolutional kernels along the wavelength axis, the 1D-CNN can directly capture local correlations between adjacent spectral bands. Moreover, by utilizing convolutional kernels of varying sizes, the model can effectively extract features such as narrow peaks, broad peaks, and radiation background signals [28].
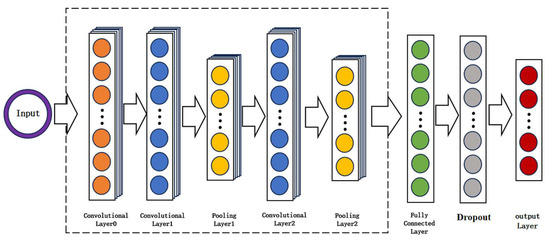
Figure 11.
Schematic diagram of the 1D-CNN architecture.
Compared to traditional spectral classification methods such as support vector machines (SVM), which frequently require dimensionality reduction techniques like principal component analysis (PCA) for preprocessing, the 1D-CNN is capable of automatic data compression and feature extraction through end-to-end training. This enables the model to efficiently learn complex nonlinear mappings from raw spectral data to class labels, making it particularly well-suited for analyzing high-dimensional data with intricate nonlinear characteristics.
As depicted in Figure 12, the workflow for flame-retardant rating prediction based on LIBS spectral data and a 1D-CNN comprises several essential steps. Initially, LIBS measurements and spectral preprocessing are performed in parallel with flame-retardant rating evaluations. The collected dataset is then divided into two subsets: one subset is allocated for model development, which includes the training, validation, and test sets, while the other serves as an independent dataset that is excluded from the training process. The training data are used to develop and evaluate the predictive model based on the 1D-CNN architecture. After the model has been trained and validated, it is applied to predict the flame-retardant ratings of samples within the independent dataset.
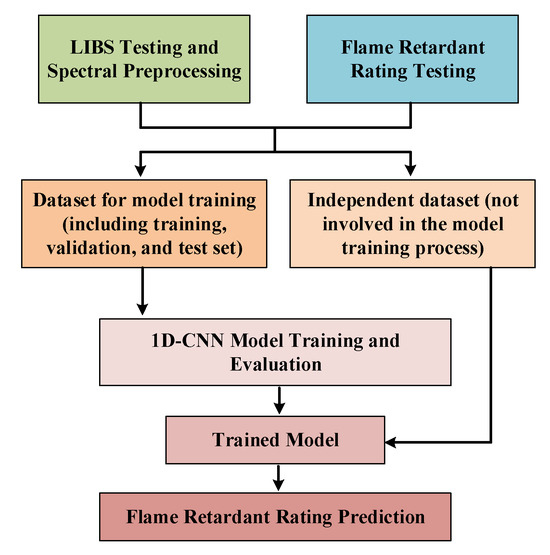
Figure 12.
Flowchart for predicting flame retardant performance based on 1D-CNN and spectral data.
4.2. Training and Testing of the Neural Network Model
In this study, seven groups of aged SMC samples were investigated, with each group comprising five samples. For each sample, five measurement points were selected, and each point was subjected to twenty LIBS measurements, resulting in a total of 3500 spectral datasets for subsequent analysis. Each dataset included intensity values at 10,542 discrete wavelengths. A 1D-CNN classification model was developed, utilizing standardized LIBS spectra as input. The dataset of 3500 samples was divided into training, validation, and test sets in proportions of 75%, 15%, and 10%, respectively. Stratified sampling was employed to ensure balanced class distributions, thus minimizing potential biases in data partitioning and their impact on model performance.
The network architecture consists of three convolutional layers. The first convolutional layer employs 64 one-dimensional convolutional kernels with a kernel width of 50 and utilizes the ReLU activation function to extract broad peak features from the spectra. This layer is followed by batch normalization and max-pooling with a window size of 4, reducing the data dimension to 2635. The second convolutional layer comprises 128 convolutional kernels with a width of 25, which are designed to capture medium-scale spectral peak features; after max-pooling, the data dimension is further reduced to 658. The third convolutional layer contains 256 kernels of width 10, enabling the extraction of narrow and fine spectral features. Subsequent application of global average pooling reduces the data dimension to 256. The fully connected layer consists of 512 nodes, integrating features extracted from the preceding convolutional and pooling layers. Finally, the output layer generates a probability distribution corresponding to the predicted flame-retardant grades. The model was trained using the Adam optimization algorithm with an initial learning rate of 0.005. To enhance model robustness and generalization, a dropout rate of 0.3 was employed, thereby mitigating the risk of overfitting. The maximum number of training epochs was set to 200, with a batch size of 64.
As shown in Figure 13, the 1D-CNN model achieved overall accuracies of approximately 90% across the training, validation, test, and total datasets, indicating robust predictive performance. Specifically, the model demonstrated the highest classification accuracy for samples with a flame-retardant grade of V-0, with accuracies of 97.1%, 97.3%, and 96.7% in the training, total, and test sets, respectively. For V-2 samples, the model also maintained relatively high accuracies, whereas the prediction accuracy for V-1 samples was comparatively lower, with values around 88–90%. Notably, the confusion matrices reveal that misclassification primarily occurred among V-1 samples, which were more frequently predicted as either V-0 or V-2. In contrast, the probability of misclassifying V-0 as V-2 or vice versa remained very low across all datasets, underscoring the model’s discriminative capability between these two grades. This trend is consistent with the previously observed correlation between the aluminum spectral line intensity ratio and flame-retardant grade, where V-1 samples were found to exhibit more ambiguous spectral characteristics. In summary, after training and evaluation, the 1D-CNN model accurately predicted the flame-retardant grades of various SMC samples, achieving over 90% accuracy on an independent test set. These results demonstrate the model’s strong generalization capability and its potential applicability for flame-retardant grade classification in practical settings.
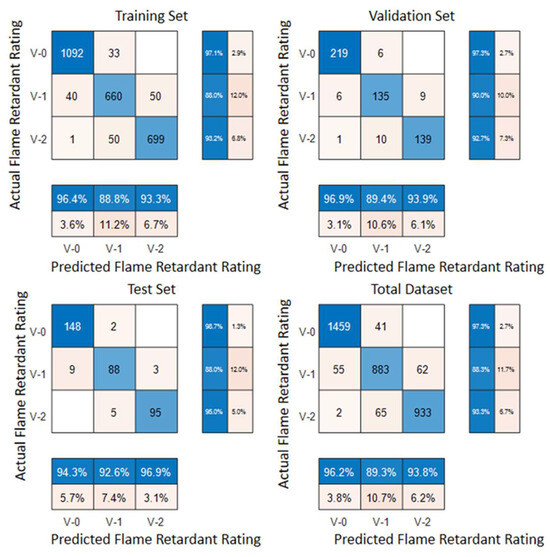
Figure 13.
Neural network training results.
4.3. Prediction Study of Flame-Retardant Performance for Unknown Samples
During the LIBS testing process, multiple repeated measurements are typically performed at the same point on a given sample to minimize the randomness introduced by plasma fluctuations. Consequently, when predicting the flame-retardant grade of a sample, all spectra obtained from multiple measurements can be input into the neural network model. By statistically analyzing the prediction outcomes for each individual spectrum, the probability distribution of the sample’s flame-retardant grade can be determined, enabling a more reliable final classification. This ensemble approach significantly enhances the model’s predictive accuracy for previously unseen samples. From each of the seven SMC groups with different aging levels that were not included in the model training dataset, one sample was selected for testing. For each sample, five test points were chosen, and each test point was subjected to ten repeated laser pulses, resulting in a total of 350 spectral datasets. These spectra were input into the pre-trained neural network model to predict the flame-retardant grade. Subsequently, the probability distribution of the predicted grades was calculated for each group. For each group, five independent statistical predictions were performed, and the mean and standard deviation were determined. The results are presented in Table 3.
Table 3.
Probability distribution and standard deviation of predicted flame-retardant grades.
The prediction results indicate that the CNN model demonstrates high accuracy and stability in classifying samples with a flame-retardant grade of V-0, as exemplified by samples 1, 2, and 3, which all exhibit predicted probabilities exceeding 97% and low standard deviations. For V-1 samples (samples 4 and 5), the probabilities of correct classification are approximately 80%, with higher standard deviations relative to V-0, reflecting greater variability and less reliable predictions for this group. Notably, sample 4 presents a substantial probability of misclassification as V-0, whereas sample 5 is less susceptible to such errors. For V-2 samples, the model generally achieves correct prediction probabilities above 80%. In particular, sample 7 attains an accuracy exceeding 98% with a low standard deviation, suggesting robust and consistent predictions. Conversely, although sample 6 is correctly identified as V-2 in 82.8% of cases, it is misclassified as V-1 in 16% of instances, indicating the model’s occasional difficulty in distinguishing between adjacent classes.
According to the flame-retardant grade criteria outlined in Table 3, the primary distinction between grades V-0 and V-1 lies in the afterflame and afterglow durations, which both require that all five samples within a group satisfy the testing threshold. In contrast, grades V-1 and V-2 present an overlapping and relatively broad range of afterflame durations. The only distinguishing factor is the presence or absence of molten droplet formation. This classification scheme can result in considerable variability in the actual flame-retardant performance among samples assigned to the same grade. For individual samples, the boundaries between V-0 and V-1, as well as between V-1 and V-2, are rather ambiguous, which may account for the neural network model’s tendency to generate misclassifications between these adjacent grades.
5. Conclusions
This study systematically investigated the flame-retardant performance and its degradation mechanisms in aged SMC samples. Vertical burning tests revealed that the flame-retardant grade of SMC declines progressively with increased aging duration, attributable to the failure of the aluminum hydroxide flame-retardant system, as evidenced by decreasing hydroxyl peak intensity and aluminum content. Spectral analysis showed a clear correlation between plasma temperature, spectral intensity ratios, and flame-retardant grade: V-2 samples exhibited generally higher plasma temperatures and higher aluminum ion-to-atom intensity ratios compared to V-0 and V-1 samples. A 1D-CNN model was developed and successfully applied for predicting flame-retardant grades based on LIBS spectra. The model demonstrated strong generalization, achieving over 95% correct classification for V-0 samples and maintaining good accuracy for unknown samples, though higher misclassification rates were noted for V-1 and V-2. Despite these promising findings, certain limitations remain. The applicability of the proposed method to materials with different flame-retardant systems has yet to be established, and the accelerated aging protocols used here may not fully reflect all real-world conditions. Future studies will focus on extending and validating this approach across a broader range of flame-retardant systems and operational environments.
Author Contributions
Conceptualization, Q.L. and X.W.; Data curation, J.Y., C.Z., X.C., and H.J.; Formal analysis, Z.X.; Investigation, Z.X., J.Y., C.Z., Y.W., J.L., X.C., and H.J.; Methodology, Q.L.; Project administration, X.W.; Resources, X.W.; Software, Q.L.; Validation, Q.L., Z.X., J.Y., C.Z., J.L., X.C., and H.J.; Visualization, J.Y., Y.W., and J.L.; Writing—original draft, Q.L. and Z.X.; Writing—review and editing, C.Z. and Y.W.; Supervision, X.W.; Funding acquisition, X.W. All authors have read and agreed to the published version of the manuscript.
Funding
The authors declare that this study received funding from the Transmission Operation & Maintenance Branch of Hainan Power Grid Corporation, China Southern Power Grid Co., Ltd. (grant number 075700KC23100004). The funder had the following involvement with the study.
Data Availability Statement
The original contributions presented in this study are included in the article. Further inquiries can be directed to the corresponding author.
Conflicts of Interest
Authors Qishuai Liang, Zhongchen Xia, Jiang Ye, Chuan Zhou, Yufeng Wu and Jie Li were employed by the Transmission Operation & Maintenance Branch of Hainan Power Grid Corporation, China Southern Power Grid Co., Ltd. The remaining authors declare that the research was conducted in the absence of any commercial or financial relationships that could be construed as a potential conflict of interest.
References
- Shinohara, H. Approach on practical applications of phenolic sheet molding compound (SMC). J. Netw. Polym. 2011, 32, 43–48. [Google Scholar]
- Chen, Z.; Li, Y.; Shao, Y.; Huang, T.; Xu, H.; Li, Y.; Chen, W.; Zeng, D.; Avery, K.; Kang, H.; et al. A comparative study of two RVE modelling methods for chopped carbon fiber SMC. In Proceedings of the WCX™ 17: SAE World Congress Experience, Detroit, MI, USA, 4–6 April 2017. [Google Scholar]
- Ebrahimian, F.; Rodriguez, S.; Di Lorenzo, D.; Chinesta, F. Optimization of precharge placement in sheet molding compound process. Int. J. Mater. Form. 2024, 17, 34. [Google Scholar] [CrossRef]
- Shinoura, Y.; Ishikawa, T.; Kobayashi, T.; Miyauchi, T.; Sugawara, H. Process Simulation and Mechanical Testing of Sheet Molding Compound Products. In Proceedings of the 37th International Conference of the Polymer Processing Society (PPS-37), Fukuoka, Japan, 11–15 April 2022. [Google Scholar]
- Feng, X.; Guo, F.; Luo, L.; Wang, Y.; Long, Y.; Zhao, X.; Pan, F.; Guo, L.; Zeng, Q.; Feng, J.; et al. Engineering Design of Feedstock Powder and Relevant Thermal–Mechanical Performance of Thermal/Environmental Barrier Coatings. J. Adv. Ceram. 2025, 14, 9221033. [Google Scholar] [CrossRef]
- Guo, L.-B.; Zhang, D.; Sun, L.-X.; Yao, S.-C.; Zhang, L.; Wang, Z.-Z.; Wang, Q.-Q.; Ding, H.-B.; Lu, Y.; Hou, Z.-Y.; et al. Development in the Application of Laser-Induced Breakdown Spectroscopy in Recent Years: A Review. Front. Phys. 2021, 16, 22500. [Google Scholar] [CrossRef]
- Qiu, Y.; Shi, M.; Guo, X.; Li, J.; Wu, J.; Zhou, Y.; Sun, H.; Hang, Y.; Li, X.; Li, Y. Sensitivity improvement in the measurement of minor components by spatial confinement in fiber-optic laser-induced breakdown spectroscopy. Spectrochim. Acta B At. Spectrosc. 2023, 209, 106800. [Google Scholar] [CrossRef]
- Yao, S.; Yu, Z.; Hou, Z.; Guo, L.; Zhang, L.; Ding, H.; Lu, Y.; Wang, Q.; Wang, Z. Development of laser-induced breakdown spectroscopy based spectral tandem technology: A topical review. TrAC Trends Anal. Chem. 2024, 177, 117795. [Google Scholar] [CrossRef]
- Liu, X.; Chen, M.; Zhao, J.; Zhang, H.; Peng, Y.; Wang, Q. Unique Composite Architecture of Phosphor-in-Glass Film Coated on Different Heat-Conducting Substrates for High-Brightness Laser Lighting. J. Adv. Ceram. 2025, 14, 9221027. [Google Scholar] [CrossRef]
- Tognoni, E.; Palleschi, V. Calibration-free laser-induced breakdown spectroscopy: A critical review. Spectrochim. Acta B At. Spectrosc. 2019, 158, 105679. [Google Scholar]
- Lopes, T.; Cavaco, R.; Capela, D.; Dias, F.; Teixeira, J.; Monteiro, C.S.; Lima, A.; Guimarães, D.; Jorge, P.A.S.; Silva, N.A. Improving LIBS-Based Mineral Identification with Raman Imaging and Spectral Knowledge Distillation. Talanta 2025, 283, 127110. [Google Scholar] [CrossRef]
- Jin, G.; Liu, J.; Liu, C.; Zhang, C. Evaluating Chemical Weathering Degree of Basalts Using Laser-Induced Breakdown Spectroscopy (LIBS) and Its Implications for Mars. Spectrochim. Acta Part B At. Spectrosc. 2025, 231, 107257. [Google Scholar] [CrossRef]
- Fortes, F.J.; Laserna, J.J. The development of fieldable laser-induced breakdown spectrometer: No limits on the horizon. Spectrochim. Acta B At. Spectrosc. 2010, 65, 975–990. [Google Scholar] [CrossRef]
- Fu, G.; Hu, W.; Xie, W.; Yao, X.; Xu, J.; Yang, P.; Yao, M. Quantitative analysis of Cd based on the stress effect of minerals in rice by laser-induced breakdown spectroscopy. Anal. Methods 2023, 15, 5867–5874. [Google Scholar] [CrossRef] [PubMed]
- Cui, M.; Xiong, S.; Yang, N.; Wang, Y.; Wang, Z.; Luo, M.; Yao, C.; Deguchi, Y. Applications of laser-induced breakdown spectroscopy in industrial measurement and monitoring: Multi-technology combination. Appl. Spectrosc. Rev. 2025, 60, 243–291. [Google Scholar] [CrossRef]
- Tawfik, W. Recent advances in the investigation of textiles using laser-induced breakdown spectroscopy (LIBS). Preserv. Restor. Tech. Anc. Egypt. Text. 2023, 143–163. [Google Scholar]
- Sivakumar, P.; Taleh, L.; Markushin, Y.; Melikechi, N. Packing density effects on the fluctuations of the emission lines in laser-induced breakdown spectroscopy. Spectrochim. Acta B At. Spectrosc. 2014, 92, 84–89. [Google Scholar] [CrossRef]
- Wang, X.L.; Wang, H.; Ha, Z.D.; Wang, L.M.; Zhang, X.H.; Gan, D.G.; Li, Y.W. A new method to measure RTV coatings thickness with laser-induced breakdown spectroscopy (LIBS) technique. In Proceedings of the 2016 IEEE Electrical Insulation Conference (EIC), Montreal, QC, Canada, 19–22 June 2016; pp. 81–84. [Google Scholar]
- He, Y.; Deng, Y.; Yang, C.; Wang, X.; Mei, H.; Liu, H.; Jia, Z. Hardness determination of thin film structural materials using laser-induced breakdown spectroscopy. IEEE Trans. Plasma Sci. 2023, 51, 705–714. [Google Scholar] [CrossRef]
- Chen, P.; Wang, X.; Li, X.; Lyu, Q.; Wang, N.; Jia, Z. A quick classifying method for tracking and erosion resistance of htv silicone rubber material via laser-induced breakdown spectroscopy. Sensors 2019, 19, 1087. [Google Scholar] [CrossRef]
- Elbasuney, S. Novel multi-component flame-retardant system based on nanoscopic aluminium-trihydroxide (ATH). Powder Technol. 2017, 305, 538–545. [Google Scholar] [CrossRef]
- Könnicke, D.; Kühn, A.; Mahrholz, T.; Sinapius, M. Polymer nanocomposites based on epoxy resin and ATH as a new flame-retardant for CFRP: Preparation and thermal characterisation. J. Mater. Sci. 2011, 46, 7046–7055. [Google Scholar] [CrossRef]
- GB/T 5169.16; Fire Hazard Testing for Electric and Electronic Products Part 16: Test Flames-50 W Horizontal and Vertical Flame Test Methods. General Administration of Quality Supervision, Inspection and Quarantine of the People’s Republic of China and Standardization Administration of the People’s Republic of China: Beijing, China, 2017.
- NIST Atomic Spectra Database Lines Form. Available online: https://physics.nist.gov/PhysRefData/ASD/lines_form.html (accessed on 1 August 2025).
- Bousquet, B.; Gardette, V.; Ros, V.M.; Gaudiuso, R.; Dell, M.; De Giacomo, A. Plasma Excitation Temperature Obtained with Boltzmann Plot Method: Significance, Precision, Trueness and Accuracy. Spectrochim. Acta Part B At. Spectrosc. 2023, 204, 106686. [Google Scholar] [CrossRef]
- Alzubaidi, L.; Zhang, J.; Humaidi, A.J.; Al-Dujaili, A.; Duan, Y.; Al-Shamma, O.; Santamaría, J.; Fadhel, M.A.; Al-Amidie, M.; Farhan, L. Review of deep learning: Concepts, CNN architectures, challenges, applications, future directions. J. Big Data 2021, 8, 1–74. [Google Scholar] [CrossRef] [PubMed]
- Salehi, A.W.; Khan, S.; Gupta, G.; Alabduallah, B.I.; Almjally, A.; Alsolai, H.; Siddiqui, T.; Mellit, A. A study of CNN and transfer learning in medical imaging: Advantages, challenges, future scope. Sustainability 2023, 15, 5930. [Google Scholar] [CrossRef]
- Ahmed, A.A.; Ali, W.; Abdullah, T.A.A.; Malebary, S.J. Classifying cardiac arrhythmia from ECG signal using 1D CNN deep learning model. Mathematics 2023, 11, 562. [Google Scholar] [CrossRef]


Disclaimer/Publisher’s Note: The statements, opinions and data contained in all publications are solely those of the individual author(s) and contributor(s) and not of MDPI and/or the editor(s). MDPI and/or the editor(s) disclaim responsibility for any injury to people or property resulting from any ideas, methods, instructions or products referred to in the content. |
© 2025 by the authors. Licensee MDPI, Basel, Switzerland. This article is an open access article distributed under the terms and conditions of the Creative Commons Attribution (CC BY) license (https://creativecommons.org/licenses/by/4.0/).