Article

Design of a High-Performance Current Controller for Permanent Magnet Synchronous Motors via Multi-Frequency Sweep Adjustment

by
Pengcheng Lan
,
Ming Yang
* and
Chaoyi Shang
School of Electrical Engineering and Automation, Harbin Institute of Technology, Harbin 150001, China
*
Author to whom correspondence should be addressed.
Energies 2025, 18(16), 4306; https://doi.org/10.3390/en18164306
Submission received: 14 July 2025 / Revised: 8 August 2025 / Accepted: 9 August 2025 / Published: 13 August 2025
(This article belongs to the Special Issue Advances in Control Strategies of Permanent Magnet Motor Drive)

Abstract

In practical applications, precise tuning of current controllers is essential for achieving desirable dynamic performance and stability margins. Traditional tuning techniques rely heavily on accurate plant parameter identification. However, this process is often challenged by inherent nonlinearities and unmodeled dynamics in motor systems. To address this issue, this paper proposes a current loop parameter tuning algorithm based on open-loop frequency sweeping. As the swept Bode diagram reveals nonlinear factors typically neglected during modeling, it provides a basis for control parameter correction. A pulse-sine voltage injection method is first introduced to identify motor parameters, serving as initial values for the controller. By analyzing the magnitude and phase characteristics of the open-loop transfer function, the delay time constant in the high-frequency range can be accurately identified, and mismatched parameters in the low-to-mid frequency range can be corrected. This method does not rely on complex model structures or extensive online adaptation mechanisms. Experimental results on a mechanical test platform demonstrate that the proposed tuning strategy significantly enhances the current loop’s closed-loop bandwidth and dynamic performance.

1. Introduction

In the modern industrial control systems, permanent magnet synchronous motors (PMSMs) are widely adopted due to their simple structure, high power density, and low torque ripple [1,2,3]. These advantages make PMSMs ideal for applications requiring high efficiency and precise control [4,5,6]. However, the design of a current loop—especially current controller—is closely tied to the electrical parameters of motor, such as stator resistance and inductance, as well as the equivalent delay introduced by the control system. In model-based strategies like model predictive control or deadbeat control, accurate parameter knowledge is essential to predict the current trajectory of motor and generate appropriate control voltage vectors. Even for the widely used proportional–integral (PI) controllers in industrial settings, reliable motor parameters are a prerequisite for applying pole-zero cancellation, which is often used to reshape the closed-loop response [7,8,9,10,11]. This method enables the elimination of dominant time constants in motor model, thereby improving system dynamics and ensuring more precise and stable current regulation [12].
Moreover, accurate identification of motor parameters and delay time contributes significantly to the refinement of current-loop-related algorithms, such as d-q axis voltage decoupling, active resistance compensation, disturbance observers, and model predictive current control [13,14,15]. Given that system delay affects both the discretization of current controller parameters and key frequency-domain specifications—such as phase margin and closed-loop bandwidth—precise evaluation of the control loop delay is essential. Such detailed estimation facilitates more effective tuning of controller gains, ultimately enhancing the dynamic performance and robustness of the current regulation system [16].
In the field of parameter identification for permanent magnet synchronous motors (PMSMs), numerous studies have been carried out in recent years by researchers worldwide. A variety of identification techniques have been investigated, including the least squares method [17], model reference adaptive systems [18], neural networks [19], genetic algorithms [20,21], and particle swarm optimization [22]. Despite this progress, online multi-parameter identification of PMSMs still encounters several challenges, such as rank deficiency [23] strong inter-parameter coupling [24], and limited estimation accuracy [25]. To overcome these issues, Reference [26] proposed a multi-parameter online identification method based on terminal voltage measurement. By designing a specialized voltage sensing circuit, this approach enables the simultaneous online identification of four critical motor parameters: d-axis inductance, q-axis inductance, stator resistance, and permanent magnet flux linkage. Similarly, Reference [27] addressed the problem of multi-parameter identification by injecting a negative-sequence weak magnetic current into the stator’s d-axis. Data were collected under two operating conditions—negative-sequence current injection and conventional vector control—ensuring sufficient observability. The identification process was carried out using a chaos-perturbed sparrow search particle swarm optimization algorithm with optimized initial parameters, achieving high-precision estimation of the motor’s electromagnetic characteristics.
The essence of parameter identification lies in estimating motor parameters using measured input–output data, particularly voltage and current signals. In practical applications, since motor parameters are often unknown at the initial stage, it is common to perform open-loop voltage injection to identify resistance and inductance values [28]. However, this approach is susceptible to nonlinearities inherent in voltage-source inverters, especially when the phase current falls below the critical threshold determined by parasitic capacitance. Under such conditions, the discrepancy between the commanded voltage from the controller and the actual output voltage is significantly amplified [29]. This is primarily because the inverter outputs high-frequency PWM voltage pulses, which cannot be directly measured using conventional techniques unless additional terminal voltage sensing circuits are introduced. Compared to the low-current region, the voltage distortion caused by inverter nonlinearities tends to be more stable and less sensitive to current variations in the high-current saturation region [30]. Therefore, a practical and relatively simple solution is to inject a larger d-axis bias current during the resistance and inductance identification process. By conducting multiple identification runs and averaging the results, the adverse impact of inverter nonlinearity can be effectively mitigated, thereby improving the accuracy of parameter estimation [31]. Reference [32] proposed an online parameter identification method using d-axis high-frequency current injection to accurately estimate motor parameters without adding torque harmonics. Reference [33] developed a high-frequency small-signal impedance model considering iron loss resistance and applied a forgetting-factor recursive least squares algorithm to estimate stator resistance and flux linkage. Reference [34] used a virtual back electromotive force to build a full-rank identification model eliminating position errors and VSI nonlinearities, with estimators designed via a PSO algorithm.
Given the critical role of PMSM resistance–inductance parameters and current loop delay modeling in controller tuning, this paper proposes a parameter calibration method based on open-loop frequency sweeping. Initially, the motor’s preliminary resistance and inductance parameters are identified by injecting proposed pulse–sine voltage signal under open-loop conditions. The identified inverse motor model is then used as a gain function for the open-loop frequency sweep. This sweeping process is performed in the rotating (d-q) reference frame. By analyzing the frequency response of the controlled plant obtained from experimental measurements, the degree of mismatch in the initially identified motor parameters can be directly assessed, enabling more accurate calibration.
Building on this foundation, the equivalent delay time of the current loop is identified simultaneously. By conducting frequency sweep experiments and analyzing the measured Bode plot, the total phase lag—caused by factors such as controller computation time, sampling delay, and inverter dead time—can be intuitively obtained. To minimize the influence of sampling noise and inverter nonlinearity on the identification results, an equivalent inverter model combined with the least squares method is employed to estimate the equivalent delay in the high-frequency range. Furthermore, theoretical derivations demonstrate that the identified delay is largely insensitive to inductance mismatches, allowing for the simplification of the identification process. The transfer function of the controlled plant in the current loop, constructed from frequency-domain measurement data, provides a more concrete model foundation for subsequent controller tuning and design. Finally, experimental validation is carried out on a PMSM test platform, and the results confirm the effectiveness and accuracy of the proposed identification method.
This paper is organized as follows. Section 2 introduces an offline motor parameter identification strategy based on pulse–sine voltage injection. A multi-stage injection scheme is employed to mitigate the effects of inverter nonlinearities, while ensuring that the motor remains stationary during the procedure. Considering the significance of delay time constants in controller tuning, Section 3 presents a method for identifying the delay time constant using the phase characteristics of the open-loop frequency response at high frequencies. This approach is shown to be robust against parameter mismatch. Section 4 proposes a multi-frequency-point correction strategy for controller parameters, which takes into account the effects of both resistance and inductance. Furthermore, a moving average filter is applied to improve identification accuracy. Section 5 provides a brief summary of the work presented in this paper.

2. Preliminary Motor Parameter Identification

To obtain the initial motor parameters required for subsequent correction, this section proposes an offline identification strategy based on sinusoidal and pulse excitation signals. In this method, identification signals are simultaneously injected into both the d- and q-axes, enabling the estimation of three key parameters—stator resistance, d-axis inductance, and q-axis inductance—while keeping the motor in a stationary state.

2.1. Current Loop Modeling and Parameter Identification Sequence

Disregarding the impacts of hysteresis and saturation of PMSMs, the fundamental voltage equation for the three-phase winding of the motor can be derived. By applying the Clarke and Park transformations, the voltage equations in the two-phase rotating reference frame can be obtained, as shown in Equation (1):
u d u q = R + p L d ω e L q ω e L d R + p L q i d i q + ω e 0 ψ f
where ud and uq are d-q axis voltage instructions; id and iq are d-q axis feedback currents; ωe is electric angular velocity of the motor; p stands for differential operator.
Under the condition that the voltage equation exhibits a rank of two while four parameters are to be identified, a rank deficiency problem naturally arises. Consequently, it is necessary to carefully determine the sequence of parameter identification to ensure reliable estimation. In the context of current loop PI controller tuning, the resistance and inductance values are of primary importance, whereas the flux linkage is typically treated as the final parameter to be identified. Notably, the stator resistance appears exclusively in the d-axis voltage equation, and due to its relatively simpler estimation process compared to that of inductance, it is selected as the initial target for identification. The overall identification sequence of the motor parameters is illustrated in Figure 1.
The methodology proposed in this paper facilitates the completion of parameter identification under the stationary condition of motor (ωe = 0), which allows for the coupling terms in Equation (1) to be neglected. However, Equation (1) does not adequately account for the nonlinear error voltage introduced by the inverter. To compensate for this limitation, the error terms Δud_error and Δuq_error are incorporated, leading to the revised formulation presented in Equation (2).
u d = R i d + p L d i d + Δ u d _ error u q = R i q + p L q i q + Δ u q _ error
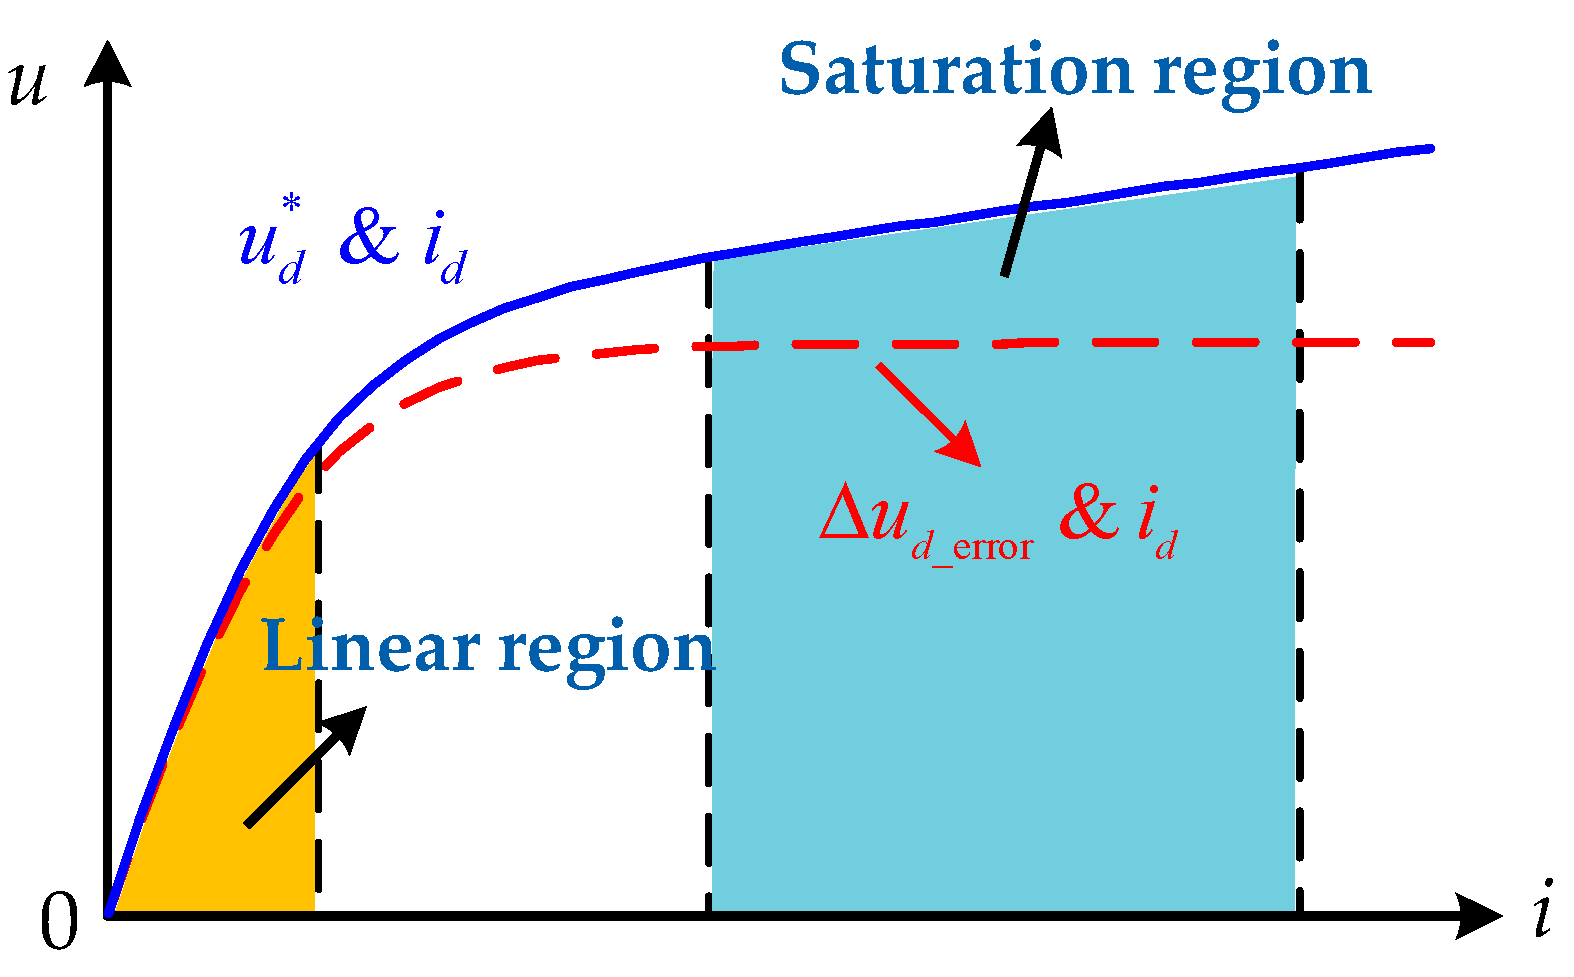
where Δud_error and Δuq_error are the inverter’s nonlinear error voltages of d-q axis. The inverter’s nonlinear error voltage is attributed to various nonlinear factors of power devices, including but not limited to dead-time, turn-on/turn-off delay of switching tube, and parasitic capacitance. The nonlinear error voltage characteristics are shown in Figure 2 (take Δud_error as an example).
The back electromotive force term, ωeΨf, is defined by the product of the permanent magnet flux and the electrical angular velocity of motor. As such, flux identification relies on motor rotation to activate this back EMF component. Since the primary objective of this study is to perform parameter identification under stationary conditions, the identification of flux linkage is not considered within the scope of the proposed method. Instead, the focus is placed on the estimation of the stator resistance R, and the d-axis and q-axis inductances Ld and Lq.

2.2. The Proposed Sinusoidal–Pulse Identification Strategy and Conventional Method

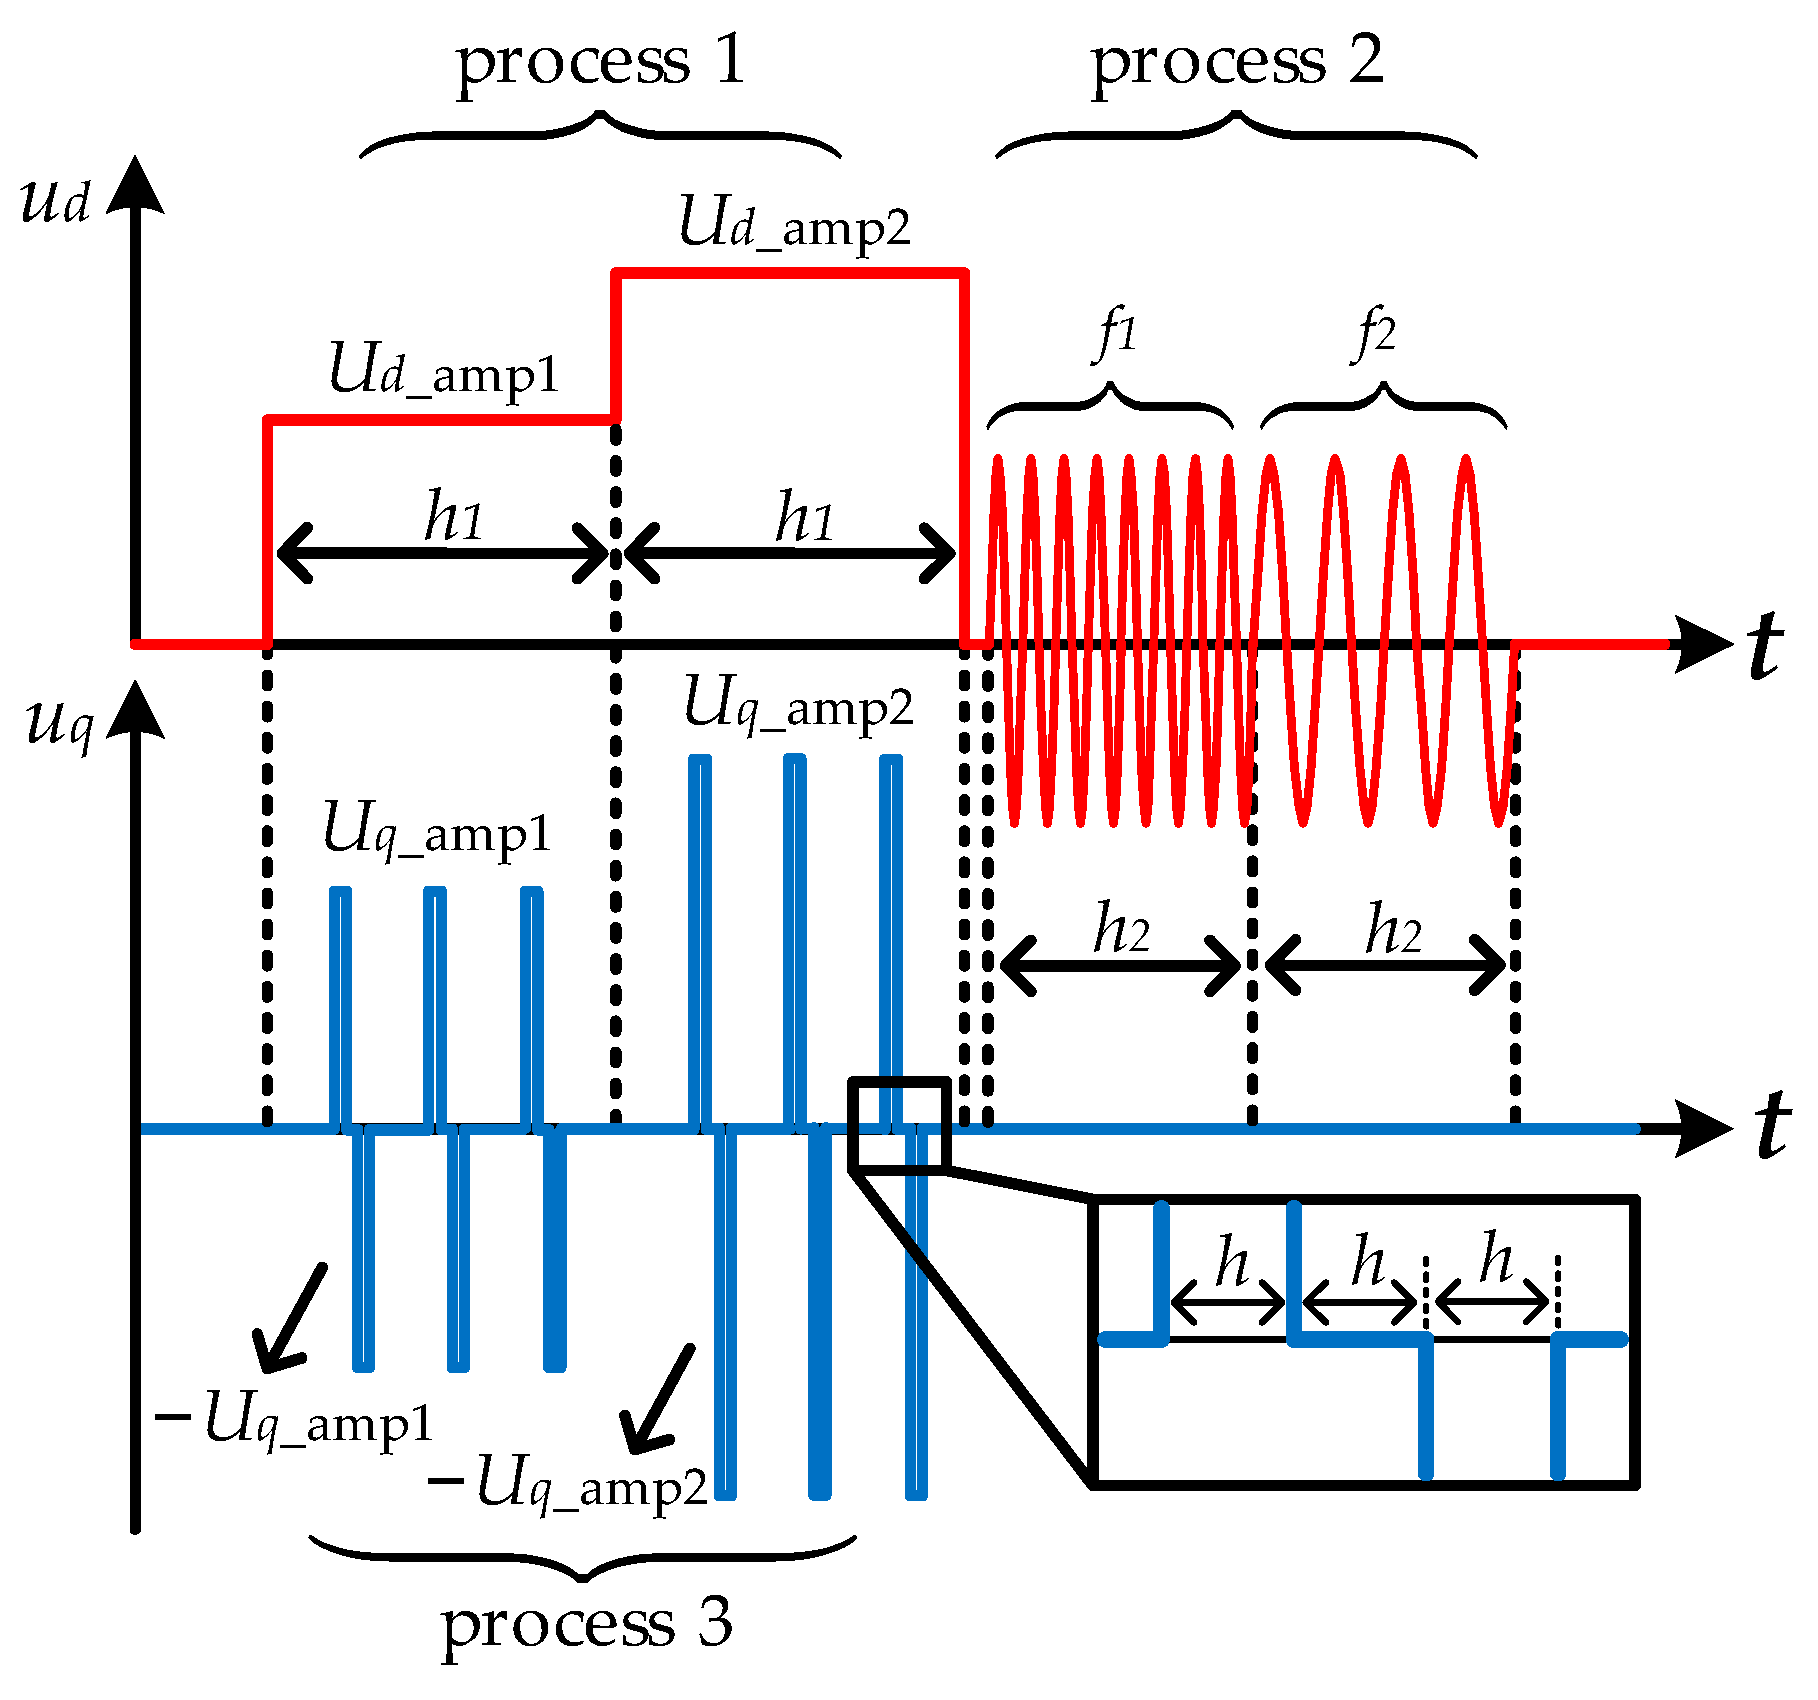
First, the proposed sinusoidal–pulse voltage injection strategy is presented. The corresponding waveform of the voltage commands applied to the d-q axes is illustrated in Figure 3. The following formulas are used for calculating the motor parameters:
R = U d _ amp 2 U d _ amp 1 I d _ ave 2 I d _ ave 1 L d = R I d _ qh 2 2 I d _ qh 1 2 I d _ qh 1 2 ω h 1 2 I d _ qh 2 2 ω h 2 2 L q = U q _ amp 2 U q _ amp 1 I q _ ave 2 I q _ ave 1 h
The meaning of each parameter in Equation (3) is explained below. The proposed identification strategy can be mainly divided into the following three parts:
Process 1—Stator resistance (R) identification: Two distinct DC voltage commands, Ud_amp1 and Ud_amp2, are applied sequentially over a fixed duration h1. During this period, multiple excitations are performed to obtain corresponding d-axis voltage measurements. By subtracting these measured voltages, the influence of the inverter’s nonlinear voltage error term, Δud_error, is effectively reduced. Following this compensation, the stator resistance R is estimated accurately using the relationship defined in Equation (3). This approach helps enhance the robustness of resistance identification by mitigating inverter-induced distortions.
Process 2—d-axis inductance (Ld) identification: Two sinusoidal voltage signals with frequencies f1 (ωh1 =f1) and f2 (ωh2 =f2) are injected sequentially, each lasting for a duration h2. The corresponding d-axis voltage responses are measured during these excitation intervals. Id_qh1 and Id_qh2 represent the amplitudes of the high-frequency current feedback obtained during the two sinusoidal injection periods, respectively. By subtracting the obtained voltage measurements, the effect of the inverter’s nonlinear voltage error term, Δud_error, is significantly reduced. Subsequently, the d-axis inductance Ld is calculated according to the formula provided in Equation (3). This method improves the accuracy of inductance estimation by compensating for inverter-induced distortions.
Process 3—q-axis inductance (Lq) identification: The maximum q-axis feedback current is obtained by injecting pulse pairs with an amplitude of Uq_amp1 and a duration of h. After injecting three such pulse pairs, the q-axis feedback current is filtered to calculate the average current Iq_ave1. Subsequently, pulse pairs with a higher amplitude Uq_amp2 and the same duration h are injected, and the corresponding filtered average q-axis current Iq_ave2 is derived in the same manner. Using these results, the q-axis inductance Lq is determined according to Equation (3), which helps to mitigate the influence of the inverter’s nonlinear voltage error term Δuq_error, thereby improving the accuracy of the parameter estimation.
It is important to note that the motor remains stationary throughout the entire signal injection process. Initially, the pulse voltage applied to the q-axis has a very short duration (h = 1 × 10⁻⁴ s), and due to the relatively large electromechanical time constant of the motor, any resulting motion is negligible. To further suppress potential rotation, a subsequent pulse of equal amplitude but opposite polarity is applied, forming a symmetrical pulse pair. This counteracting pulse effectively mitigates any residual rotational tendency. Additionally, the injection of voltage along the d-axis has been shown to further reduce the likelihood of motor movement. As illustrated in Figure 3, Process 3 (Lq identification) and Process 1 (resistance R identification) are carried out simultaneously. This coordinated execution helps ensure that the motor remains in a non-rotating state during the identification of Lq.
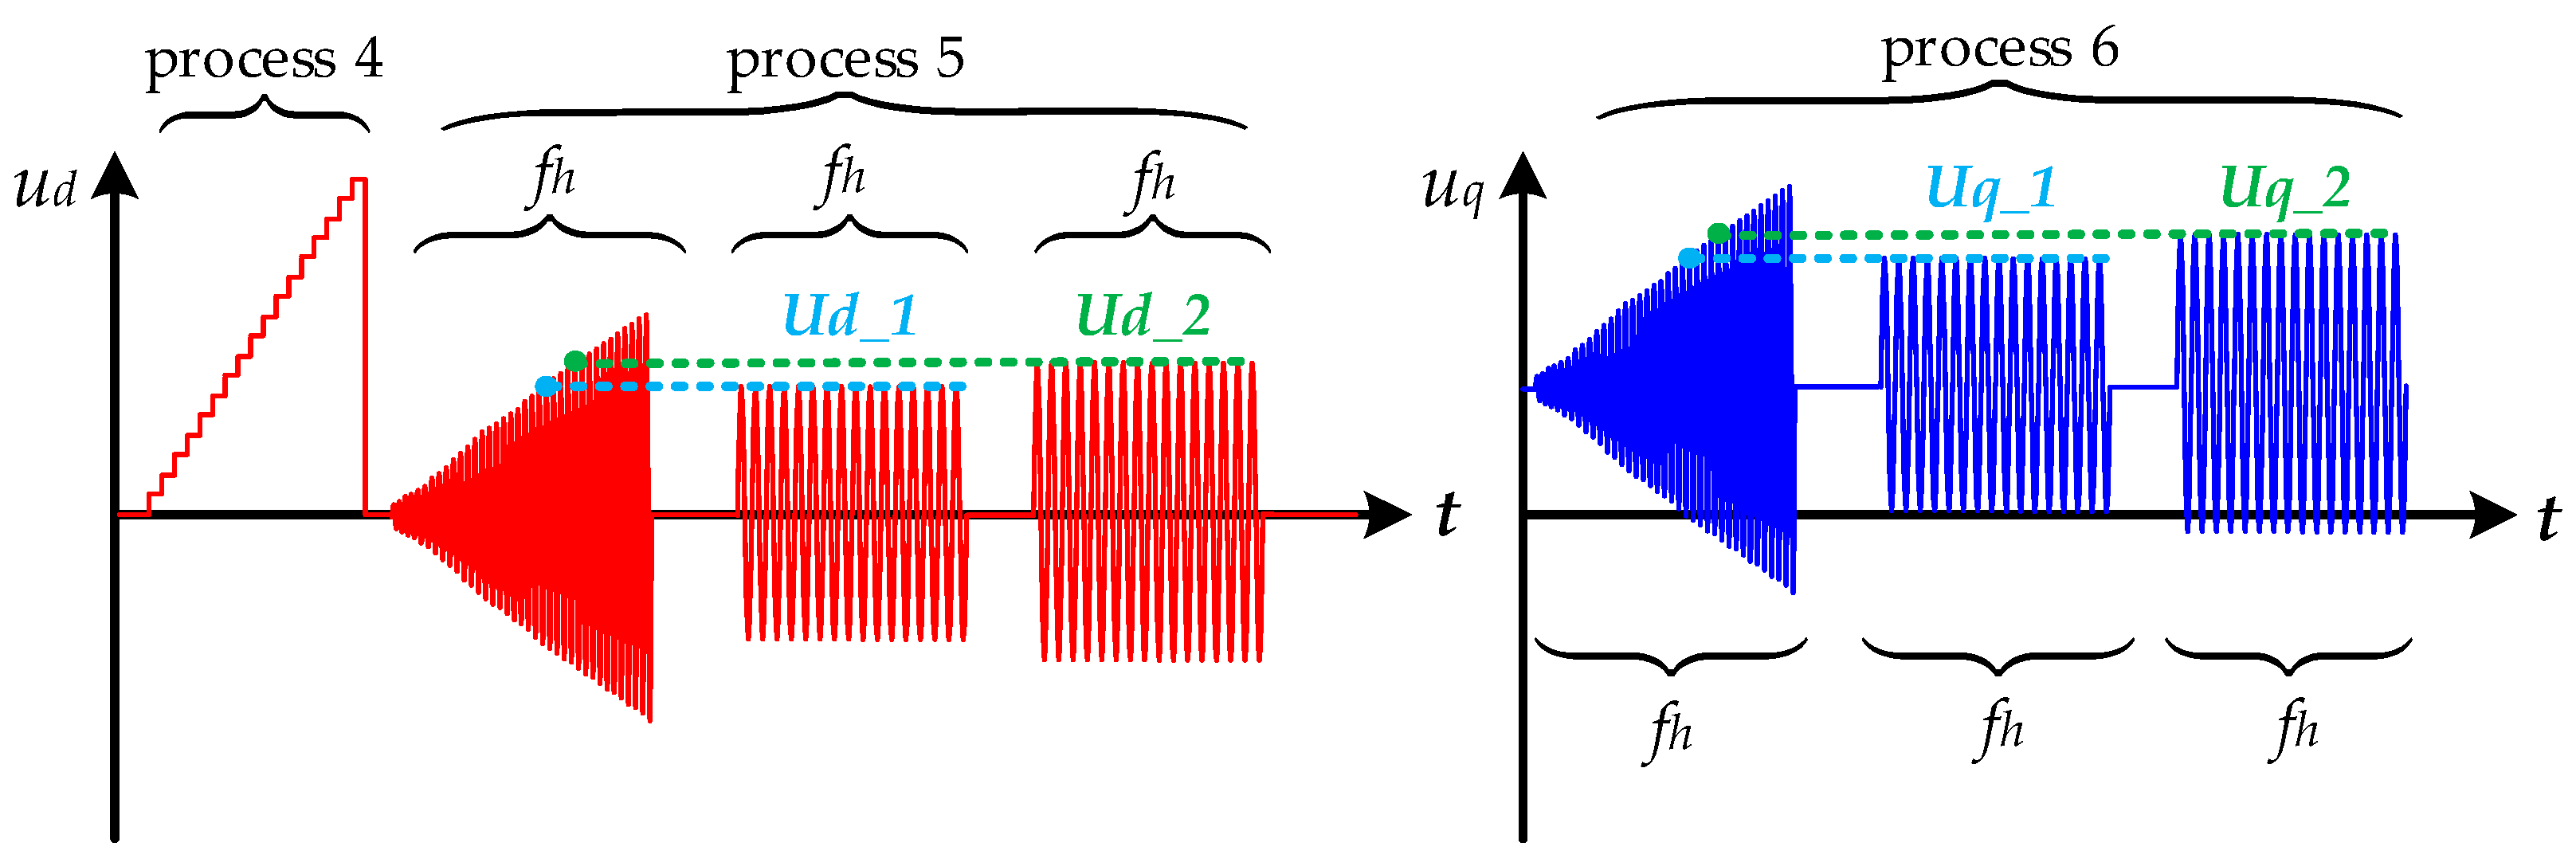
To highlight the advantages of the proposed methodology, a conventional parameter identification approach is introduced for comparison. The waveform of the d-axis voltage command used in the conventional method is illustrated in Figure 4.
Process 4—Stator resistance (R) identification: A slope-shaped voltage command is injected into the d-axis, and the stator resistance R is estimated using the least squares method by establishing a linear relationship between the voltage command and the feedback current id. According to [10], the inverter is considered to operate in the saturation region when id exceeds 80% of its rated value. Under this condition, the predicted resistance value can help reduce the influence of the nonlinear voltage error term Δud_error, thereby improving the accuracy of the identification.
Process 5—d-axis inductance (Ld) identification: The procedure begins with the definition of two current threshold values. Sinusoidal voltages with gradually increasing amplitudes are then injected into the d-axis. When the feedback current reaches each predefined threshold, the corresponding voltage amplitudes, Ud_1 and Ud_2, are recorded. Subsequently, sinusoidal voltages with amplitudes Ud_1 and Ud_2 are applied, and the resulting high-frequency current responses, Idh1 and Idh2, are extracted using the discrete Fourier transform. The frequency of the injected signal is set to fh = 1 kHz. Finally, the d-axis inductance Ld is calculated using Equation (4).
Process 6—q-axis inductance (Lq) identification: According to reference [10], the effect of magnetic saturation should be considered during the identification of the q-axis inductance. Therefore, an additional DC bias is added to the q-axis voltage command, with the DC voltage waveform shown in Figure 4. Similar to Process 5, the voltage amplitudes Uq_1 and Uq_2 as well as the high-frequency feedback currents Iqh1 and Iqh2 are recorded, and Lq is finally calculated using (4).
R = j = 1 n i d j u d j 1 n j = 1 n i d j j = 1 n u d j j = 1 n i d j 2 1 n j = 1 n i d j 2 L x = U x _ 2 U x _ 1 I x h 2 I x h 1 2 π f h , x = d o r q

2.3. Experimental Verification

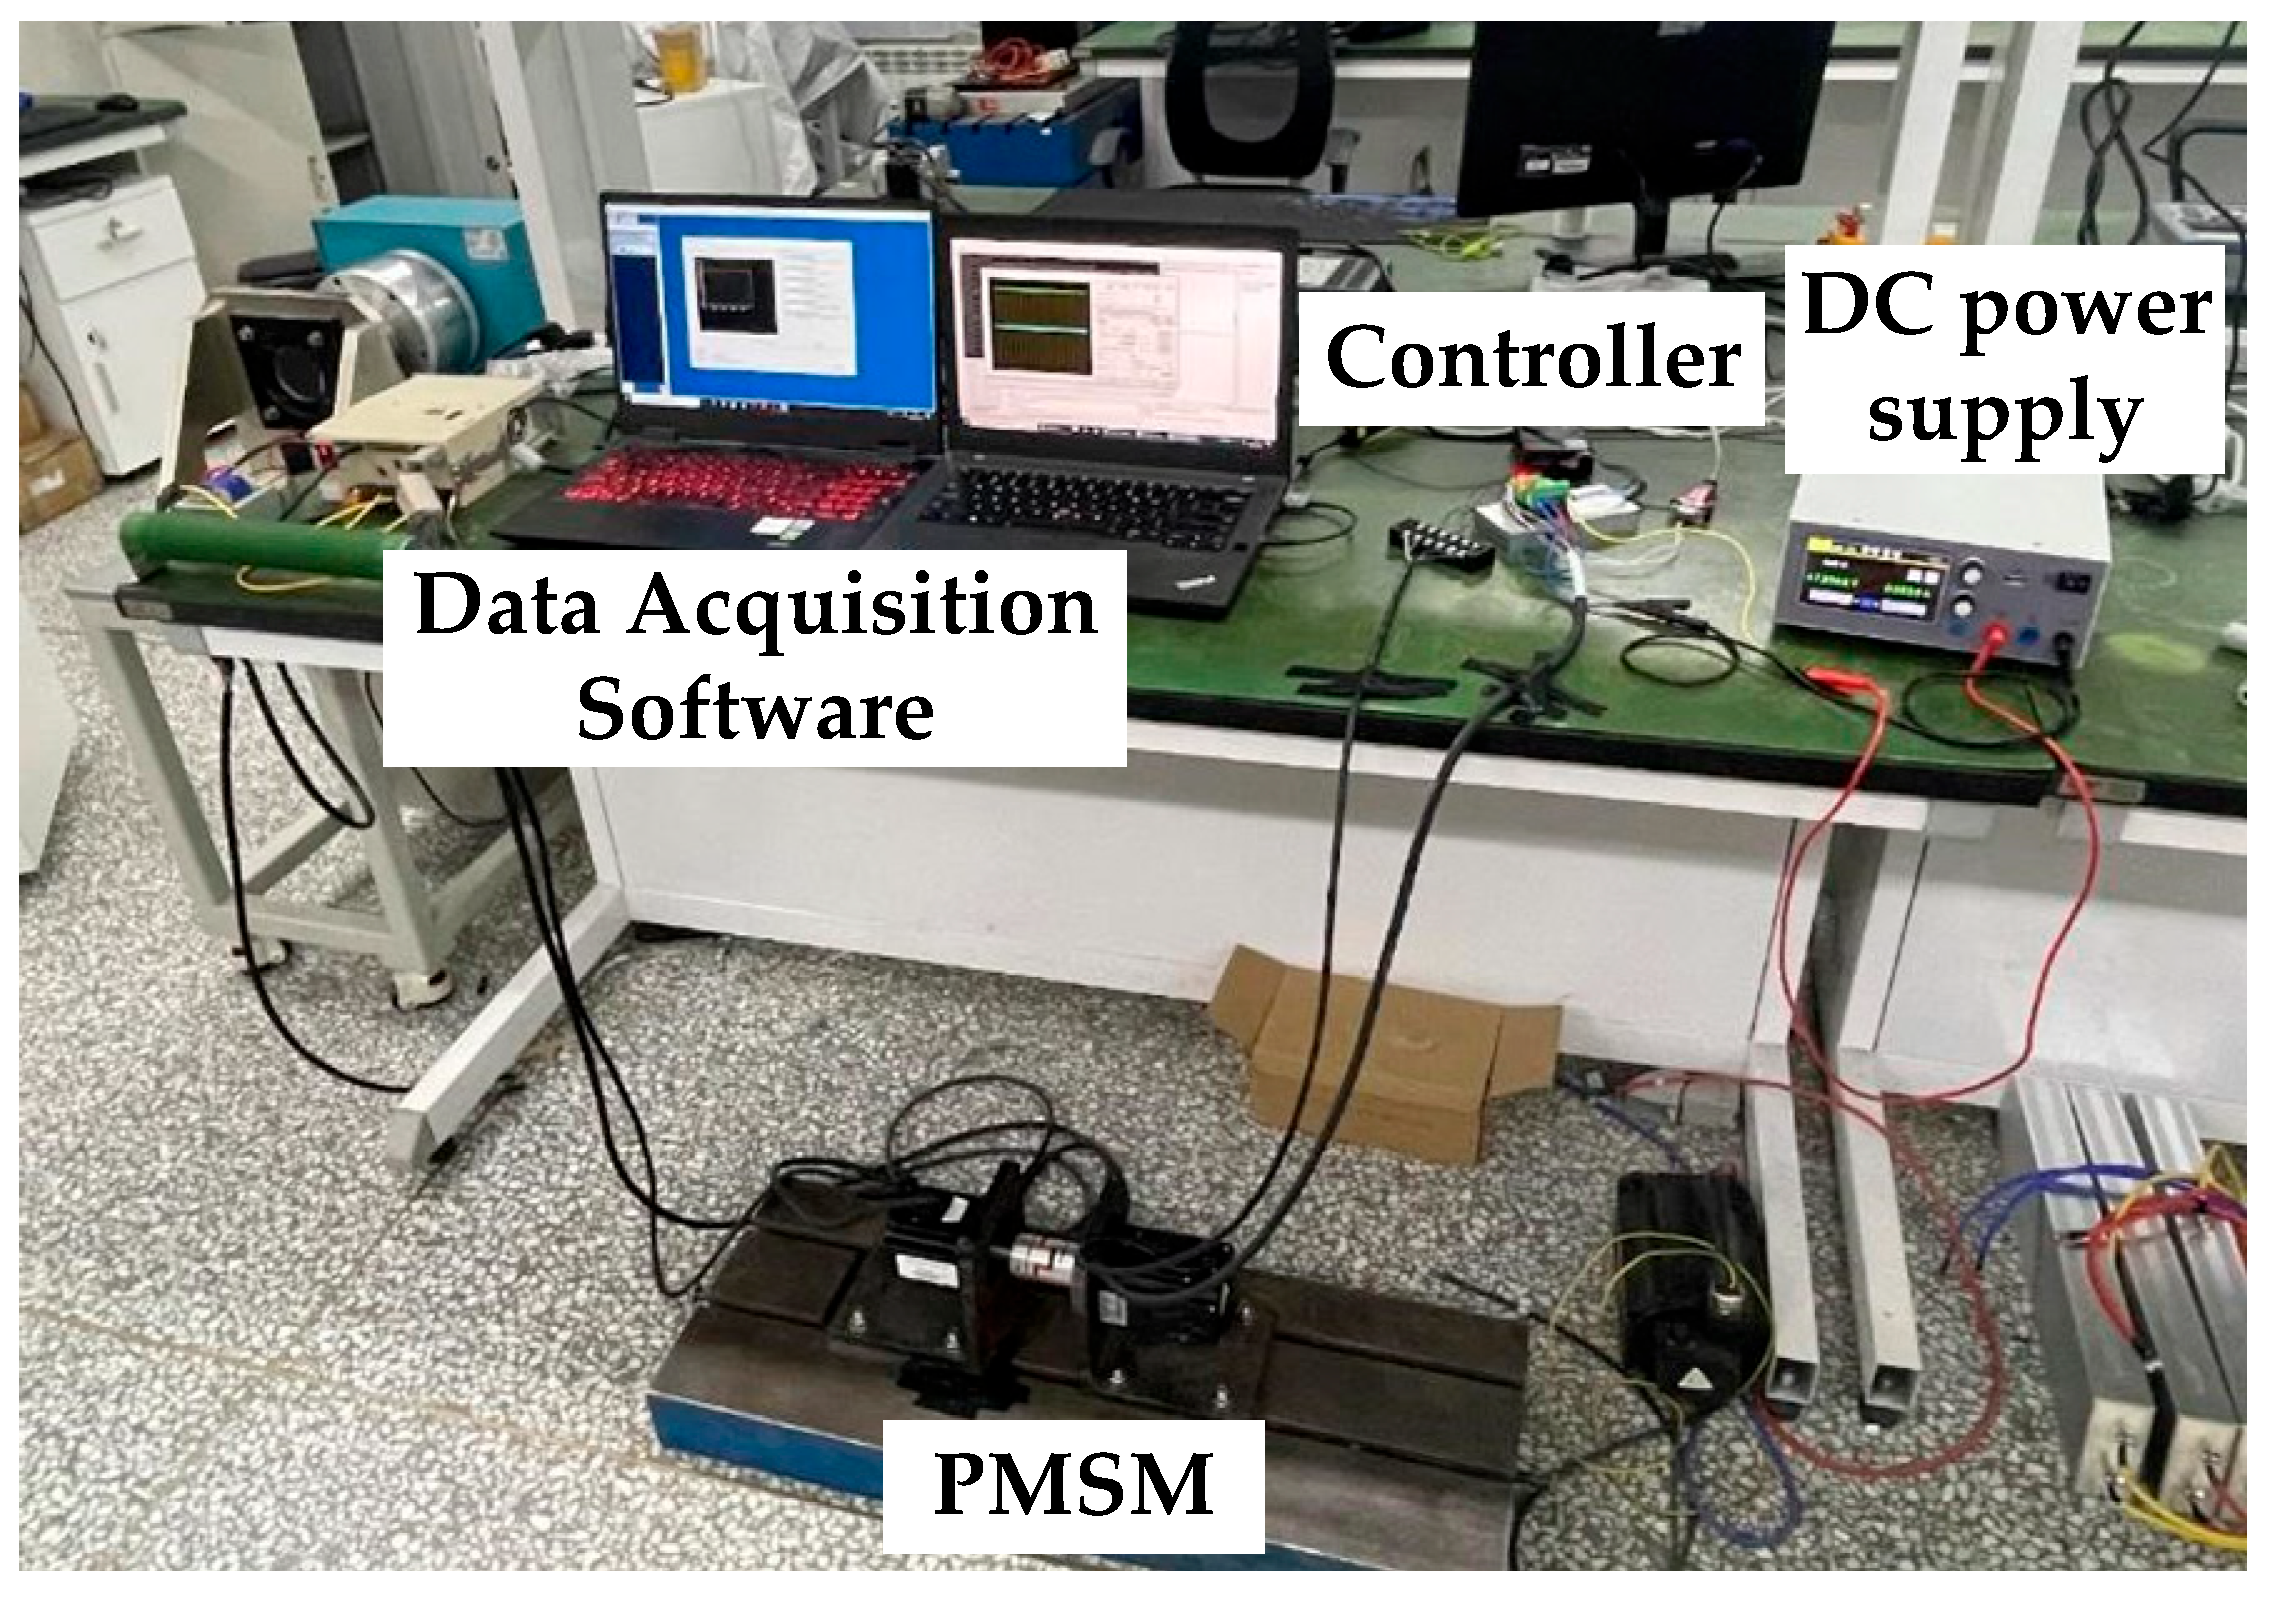
The experimental setup, shown in Figure 5, consists of a PMSM drive system and a loading system. A Yaskawa ∑7 servo motor is rigidly coupled to the test motor to provide load torque. The drive unit is a compact industrial-grade controller equipped with a single-core DSP (TMS320F28335) and low-side current sensing. Data are acquired in real time from FRAM via RS-232 at the sampling rate, and the sweep results are processed using a Savitzky–Golay filter. The controller and motor parameters are listed in Table 1.
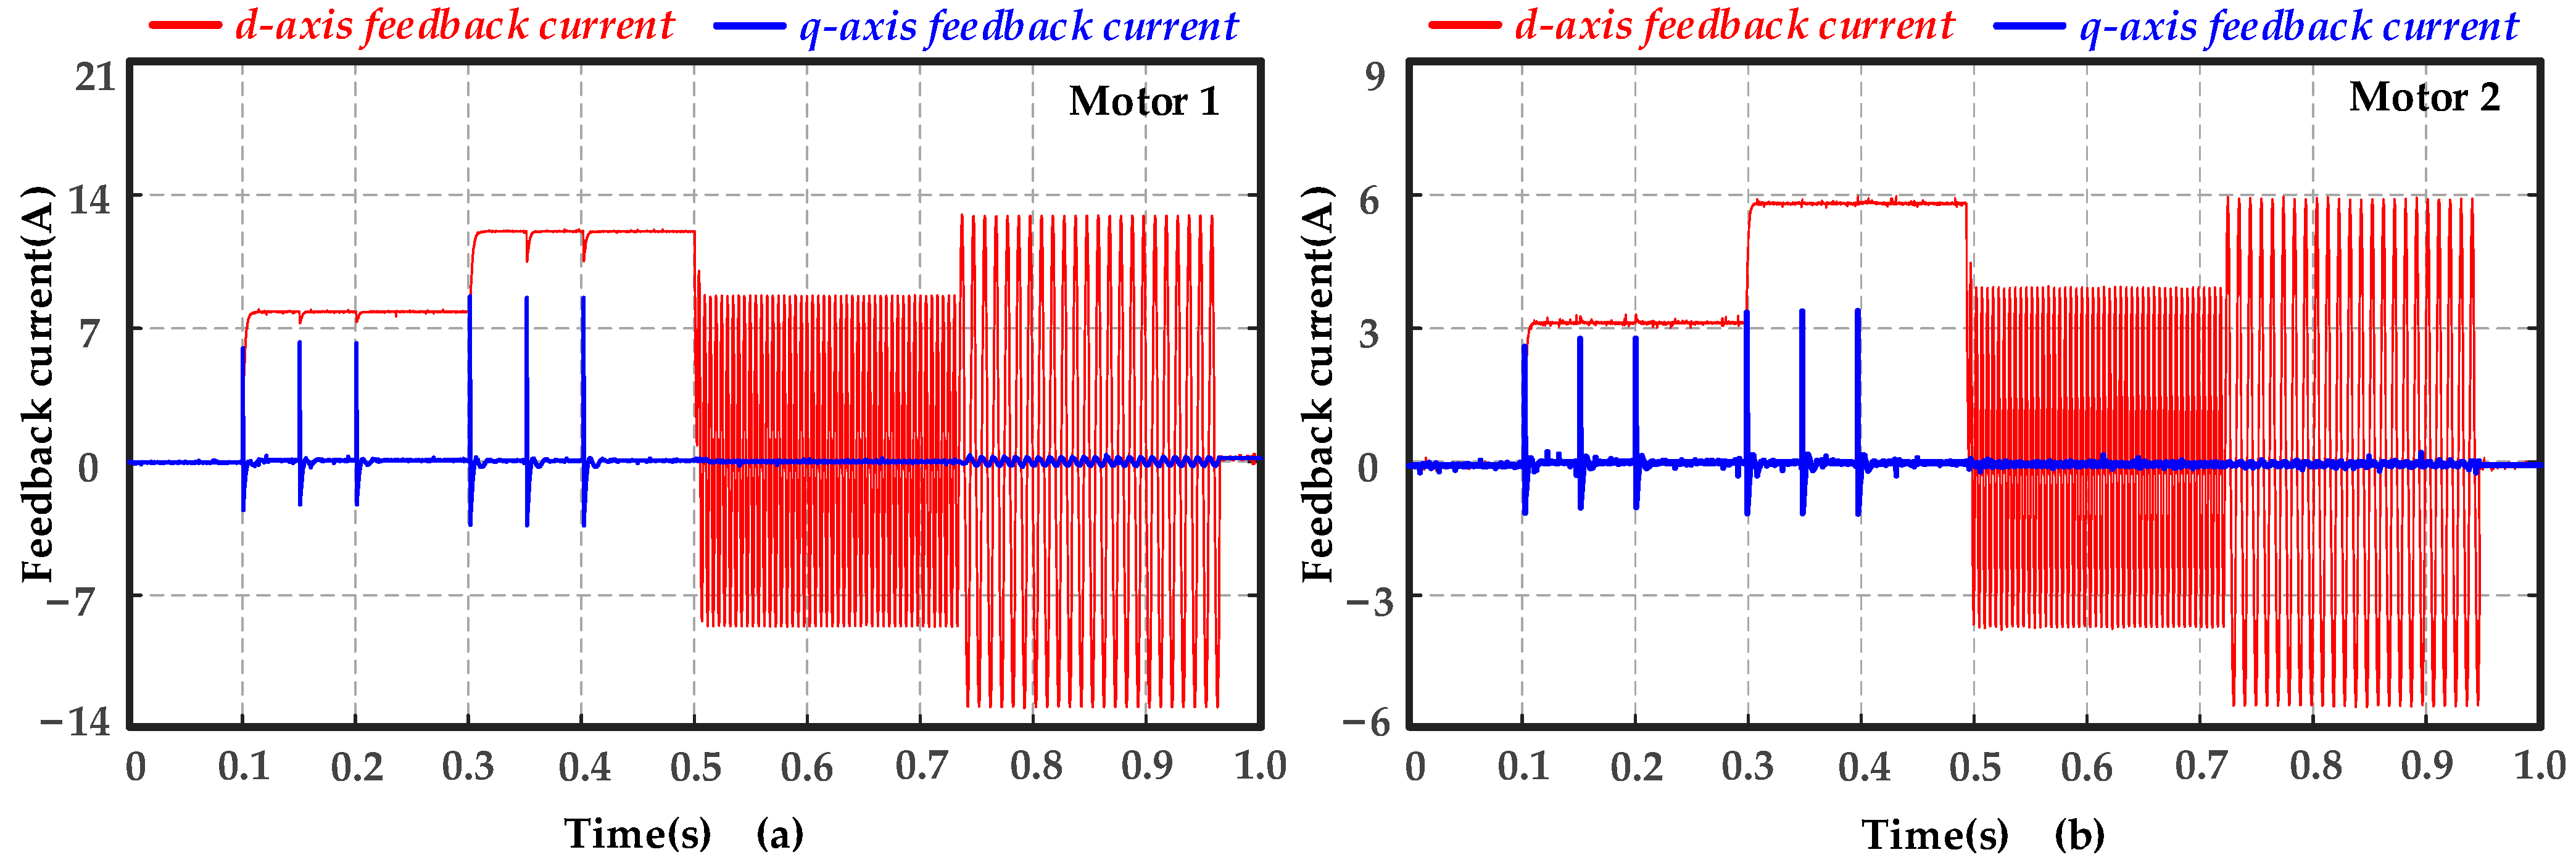
For Motor 1, Ud_amp1 and Ud_amp2 in Process 1 are 0.8 V and 1.1 V respectively while h1 is 0.2 s; f1 and f2 in Process 2 are 200 Hz and 100 Hz respectively, while h2 is 0.23 s; Uq_amp1 and Uq_amp1 in Process 3 are 5.6 V and 7.8 V, respectively, while h is 2 × 10⁻⁴ s. Figure 6a presents the feedback current waveform of Motor 1.
For Motor 2, Ud_amp1 and Ud_amp2 in Process 1 are 1.2 V and 1.8 V, respectively, while h1 is 0.2 s; f1 and f2 in Process 2 are 200 Hz and 100 Hz, respectively, while h2 is 0.23 s; Uq_amp1 and Uq_amp1 in Process 3 are 8.0 V and 9.6 V, respectively, while h is 2 × 10⁻⁴ s. Figure 6b presents the feedback current waveform of Motor 2. The corresponding motor speed waveform and identification results are shown in Figure 7. The identification results and errors of each parameter of the motors are shown in the Table 2.
Next, the conventional parameter identification method is evaluated. For both Motor 1 and Motor 2, the same voltage injection strategy is employed. In Process 4, the ramp voltage command has an incremental amplitude of 2 × 10⁻⁶. In Process 5, the frequency fh of the high-frequency voltage signal is set to 1 kHz, with current thresholds corresponding to Ud_1 = 0.3 pu and Ud_2 = 0.4 pu, respectively. The feedback current waveform of Motor 1 and Motor 2 are displayed in Figure 8a and Figure 8b, respectively. In Process 6, the DC bias is set to 8 V; the voltage commands and current feedback waveforms injected into Motor 1 and Motor 2 are shown in Figure 9a,b, respectively. The identification results and errors of each parameter of the motors are shown in the Table 3.
As indicated by Equations (3) and (4), both the proposed strategy and the conventional identification method utilize a subtraction-based approach to mitigate the influence of inverter nonlinear error voltage. As shown in Table 2 and Table 3, the proposed offline parameter identification strategy achieves higher identification accuracy, thereby providing more reliable initial motor parameters for the subsequent procedures. By substituting the identified motor parameters into Equation (4) and incorporating the delay time constant T obtained in the following section, the initial control parameters of the current loop can be determined.

3. Identification of Current Loop Delay Time Constant

The parameters identified in the previous section provide a reliable foundation for controller tuning. Nevertheless, nonlinear factors such as dead time and magnetic saliency may still cause a deviation between the tuned controller and the actual system characteristics, resulting in less-than-ideal dynamic performance. To improve the closed-loop bandwidth and dynamic response of the current loop, this section introduces the principle and significance of identifying the loop delay time constant, which enables more accurate pole-zero cancellation.

3.1. Delay Model of the Current Loop

To identify the delay time constant of the current loop, it is first necessary to establish a model of the controlled plant in the current loop. This includes the zero-order hold (ZOH) effect equivalent to the inverter behavior, the motor model, and the delay element. The motor used is a salient-pole PMSM, for which Ld = Lq. The frequency response of the zero-order hold is given as follows:
G Z O H j ω = 1 e T s j ω j ω T s = sin ω T s / 2 ω T s / 2 e j ω T s / 2
Within the frequency range 0 < ω < 2π/Ts, the phase lag introduced by the zero-order hold can be approximated by a pure time delay of half the sampling period. This equivalent delay is denoted as Th. In addition to the zero-order hold equivalent delay Th, the current loop also includes the controller computation delay Tc, inverter dead time Td, and current sampling/filtering delay Tf. Therefore, the total delay of the current loop can be expressed as follows:
T Σ = T h + T c + T d + T f
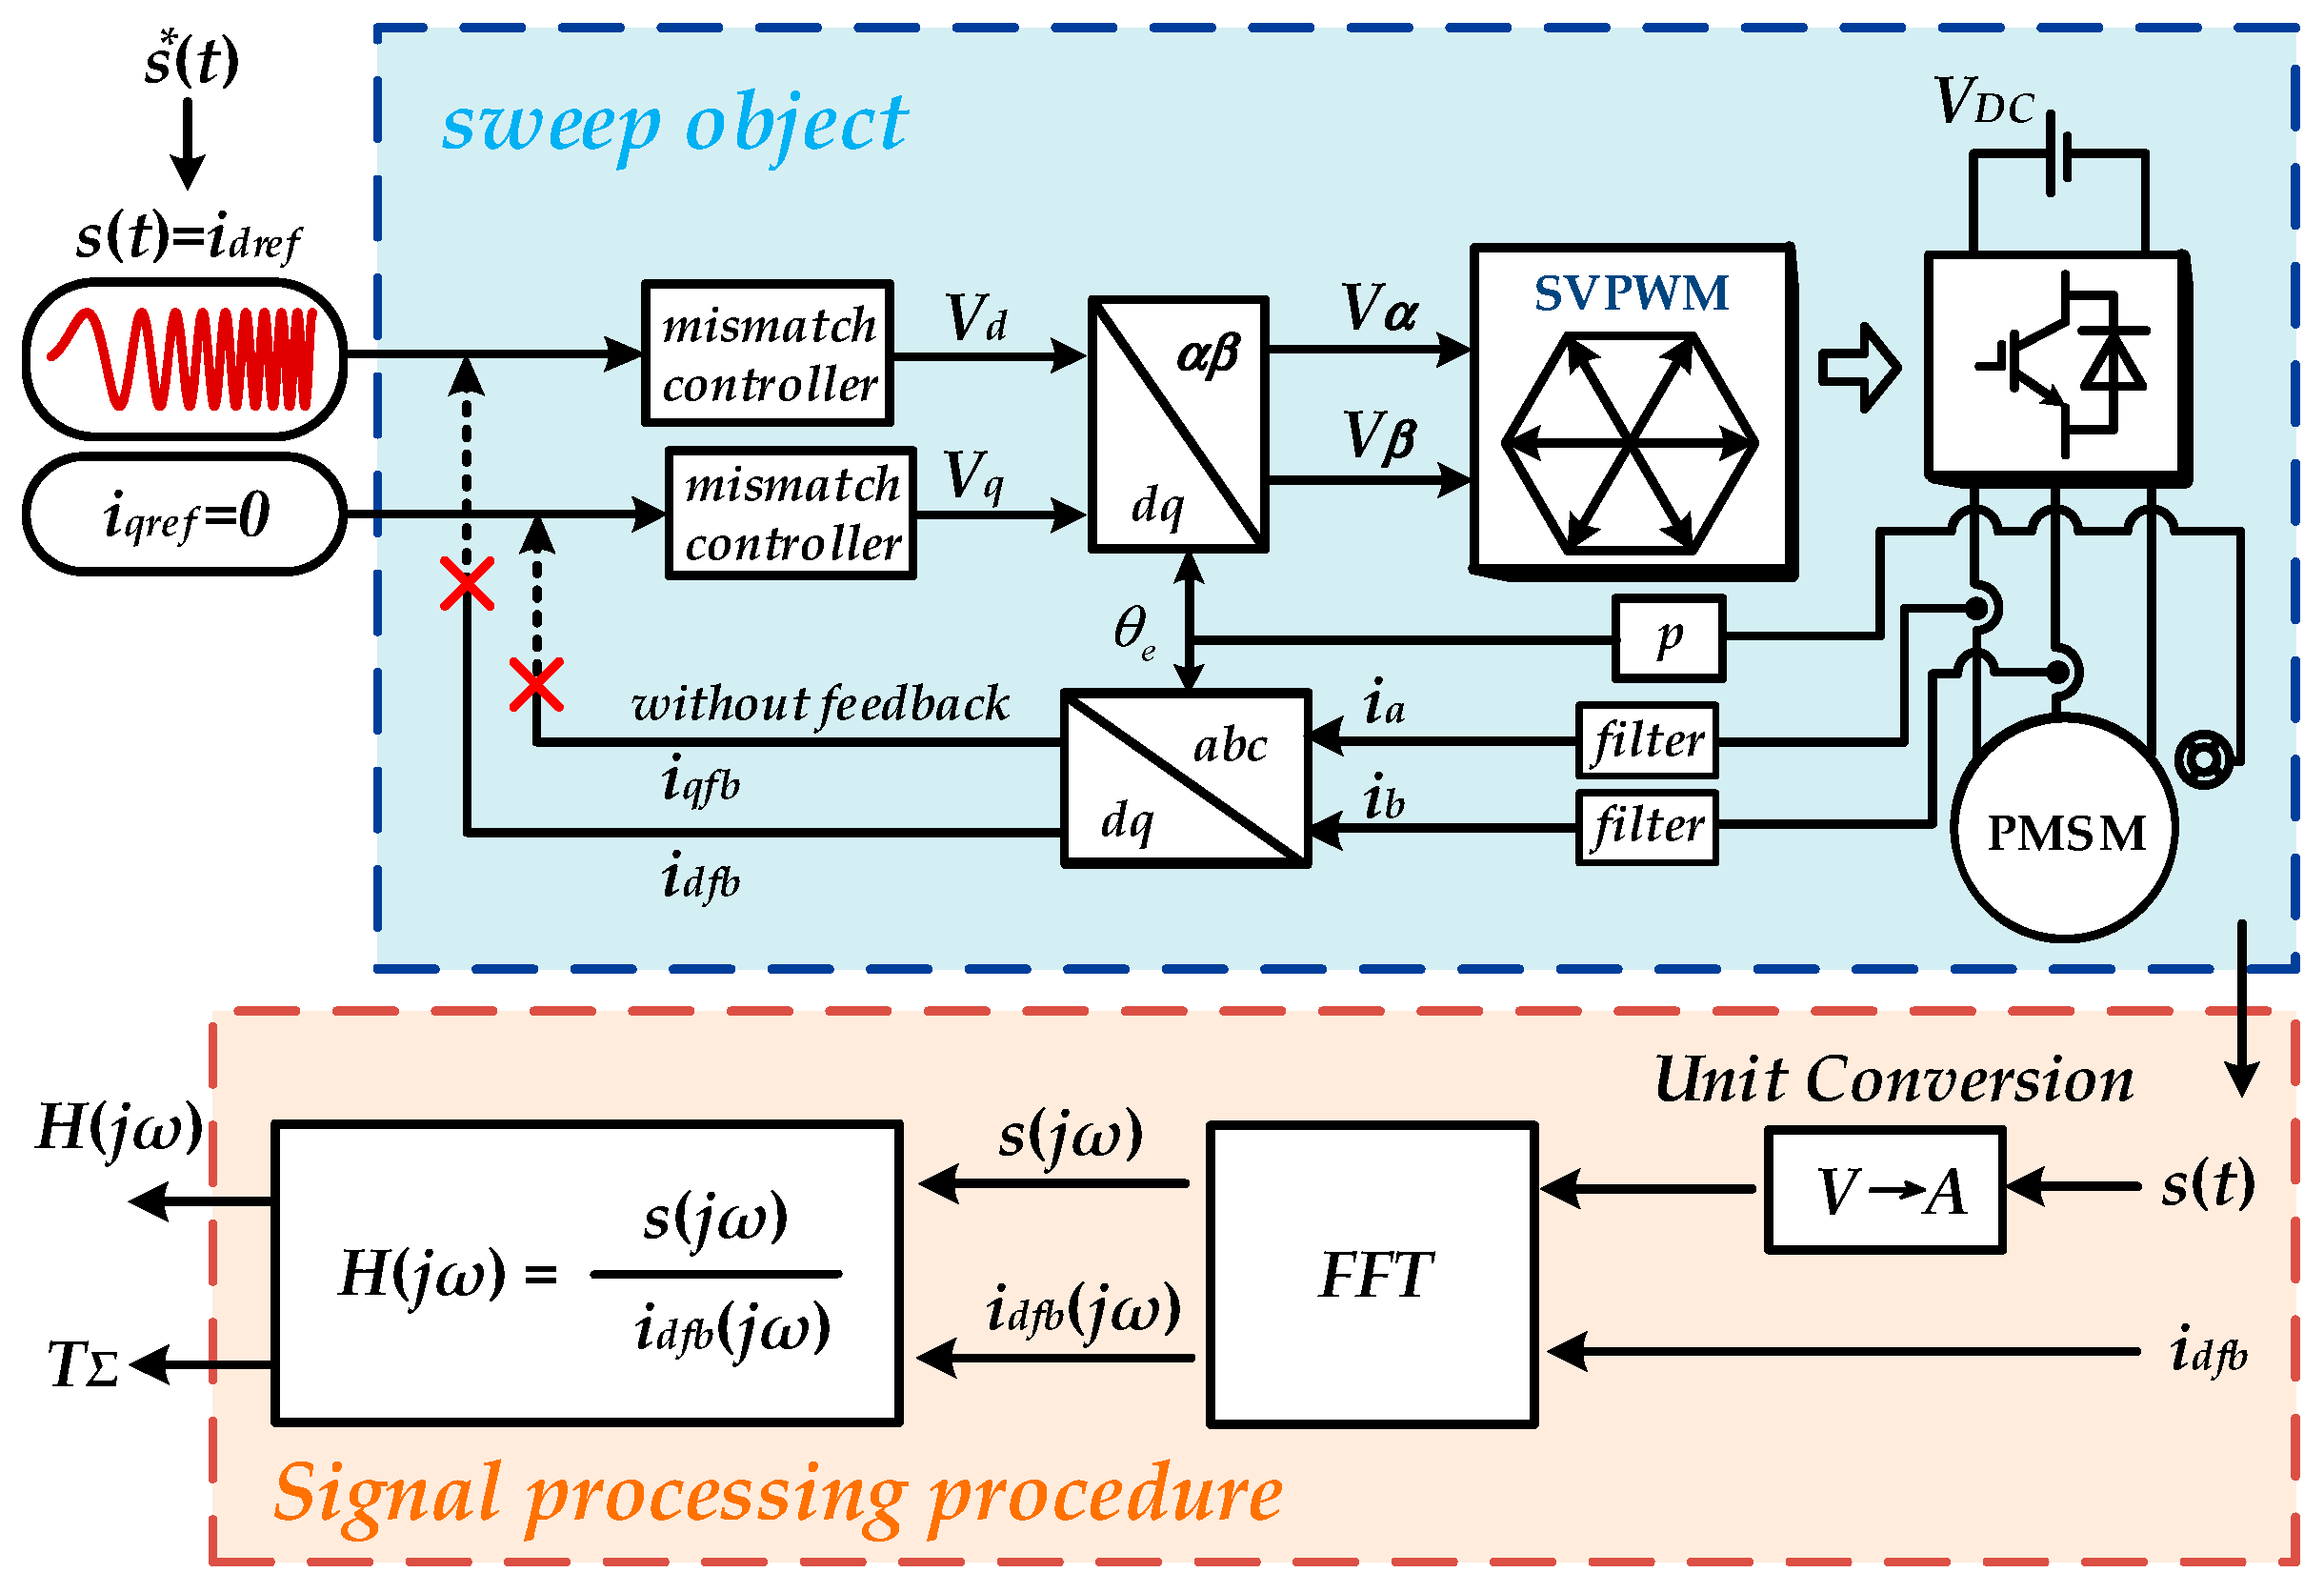
Considering the influence of the inverter’s nonlinear error voltage, Δudq_error is treated as a disturbance at the voltage command input. The detailed block diagram of the delay part in the current loop is shown in Figure 10. Figure 11 presents the block diagram used for delay time constant identification and parameter correction.

3.2. Identification of Delay Time Constant in the High-Frequency Range

As shown in Figure 10, the motor is modeled as a first-order inertia system, with its transfer function obtained using the following equation:
P s = 1 L s + R
To facilitate parameter tuning, a cascaded PI controller is employed in the current loop, which is expressed as GPI(s) = Kp(1 + Ki/s). Under the framework of linear control theory, the widely used and effective pole-zero cancellation (ZPC) method is adopted for PI parameter design. Accordingly, the designed PI parameters are obtained as follows:
K p = L s T Σ s , K i = R s L s
where Rs, Ls, and TΣS represent the measured value of R, L and TΣ, respectively. Then, the open-loop transfer function Gol(s) and the close-loop transfer function Gcl(s) of the current loop can be obtained.
G o l s = e s T Σ s T Σ S s L s + R s s L + R G c l s = 1 1 + s L + R s L s + R s s T Σ S e s T Σ
Equation (9) also serves as both the open-loop and the closed-loop transfer function in the presence of parameter mismatches. The open-loop and the closed-loop functions for parameter adaptation will be deduced later. According to (9), the phase expressions of the open-loop transfer function of the current loop can be derived as follows:
G o l j ω = π 2 ω T Σ + tan 1 ω L s R s tan 1 ω L R φ e r r
The phase error term caused by parameter mismatch in Equation (10) is denoted as φerr. Let xω = ωL/R, Ls = KL × L, and Rs = KR × R; then, the derivative of φerr with respect to frequency xω can be simplified as follows:
d φ e r r x ω d x ω = 1 ε ε x ω 2 1 1 + x ω 2 1 + ε 2 x ω 2 1 ε ε ε 2 x ω 2 ε = K L K R
Since xω >> ε is a reasonable assumption in the high-frequency range, the derivative of ∠Gol() can be approximated as follows:
d G o l j ω d ω = L R d φ e r r x ω d x ω d ω T Σ d ω T Σ
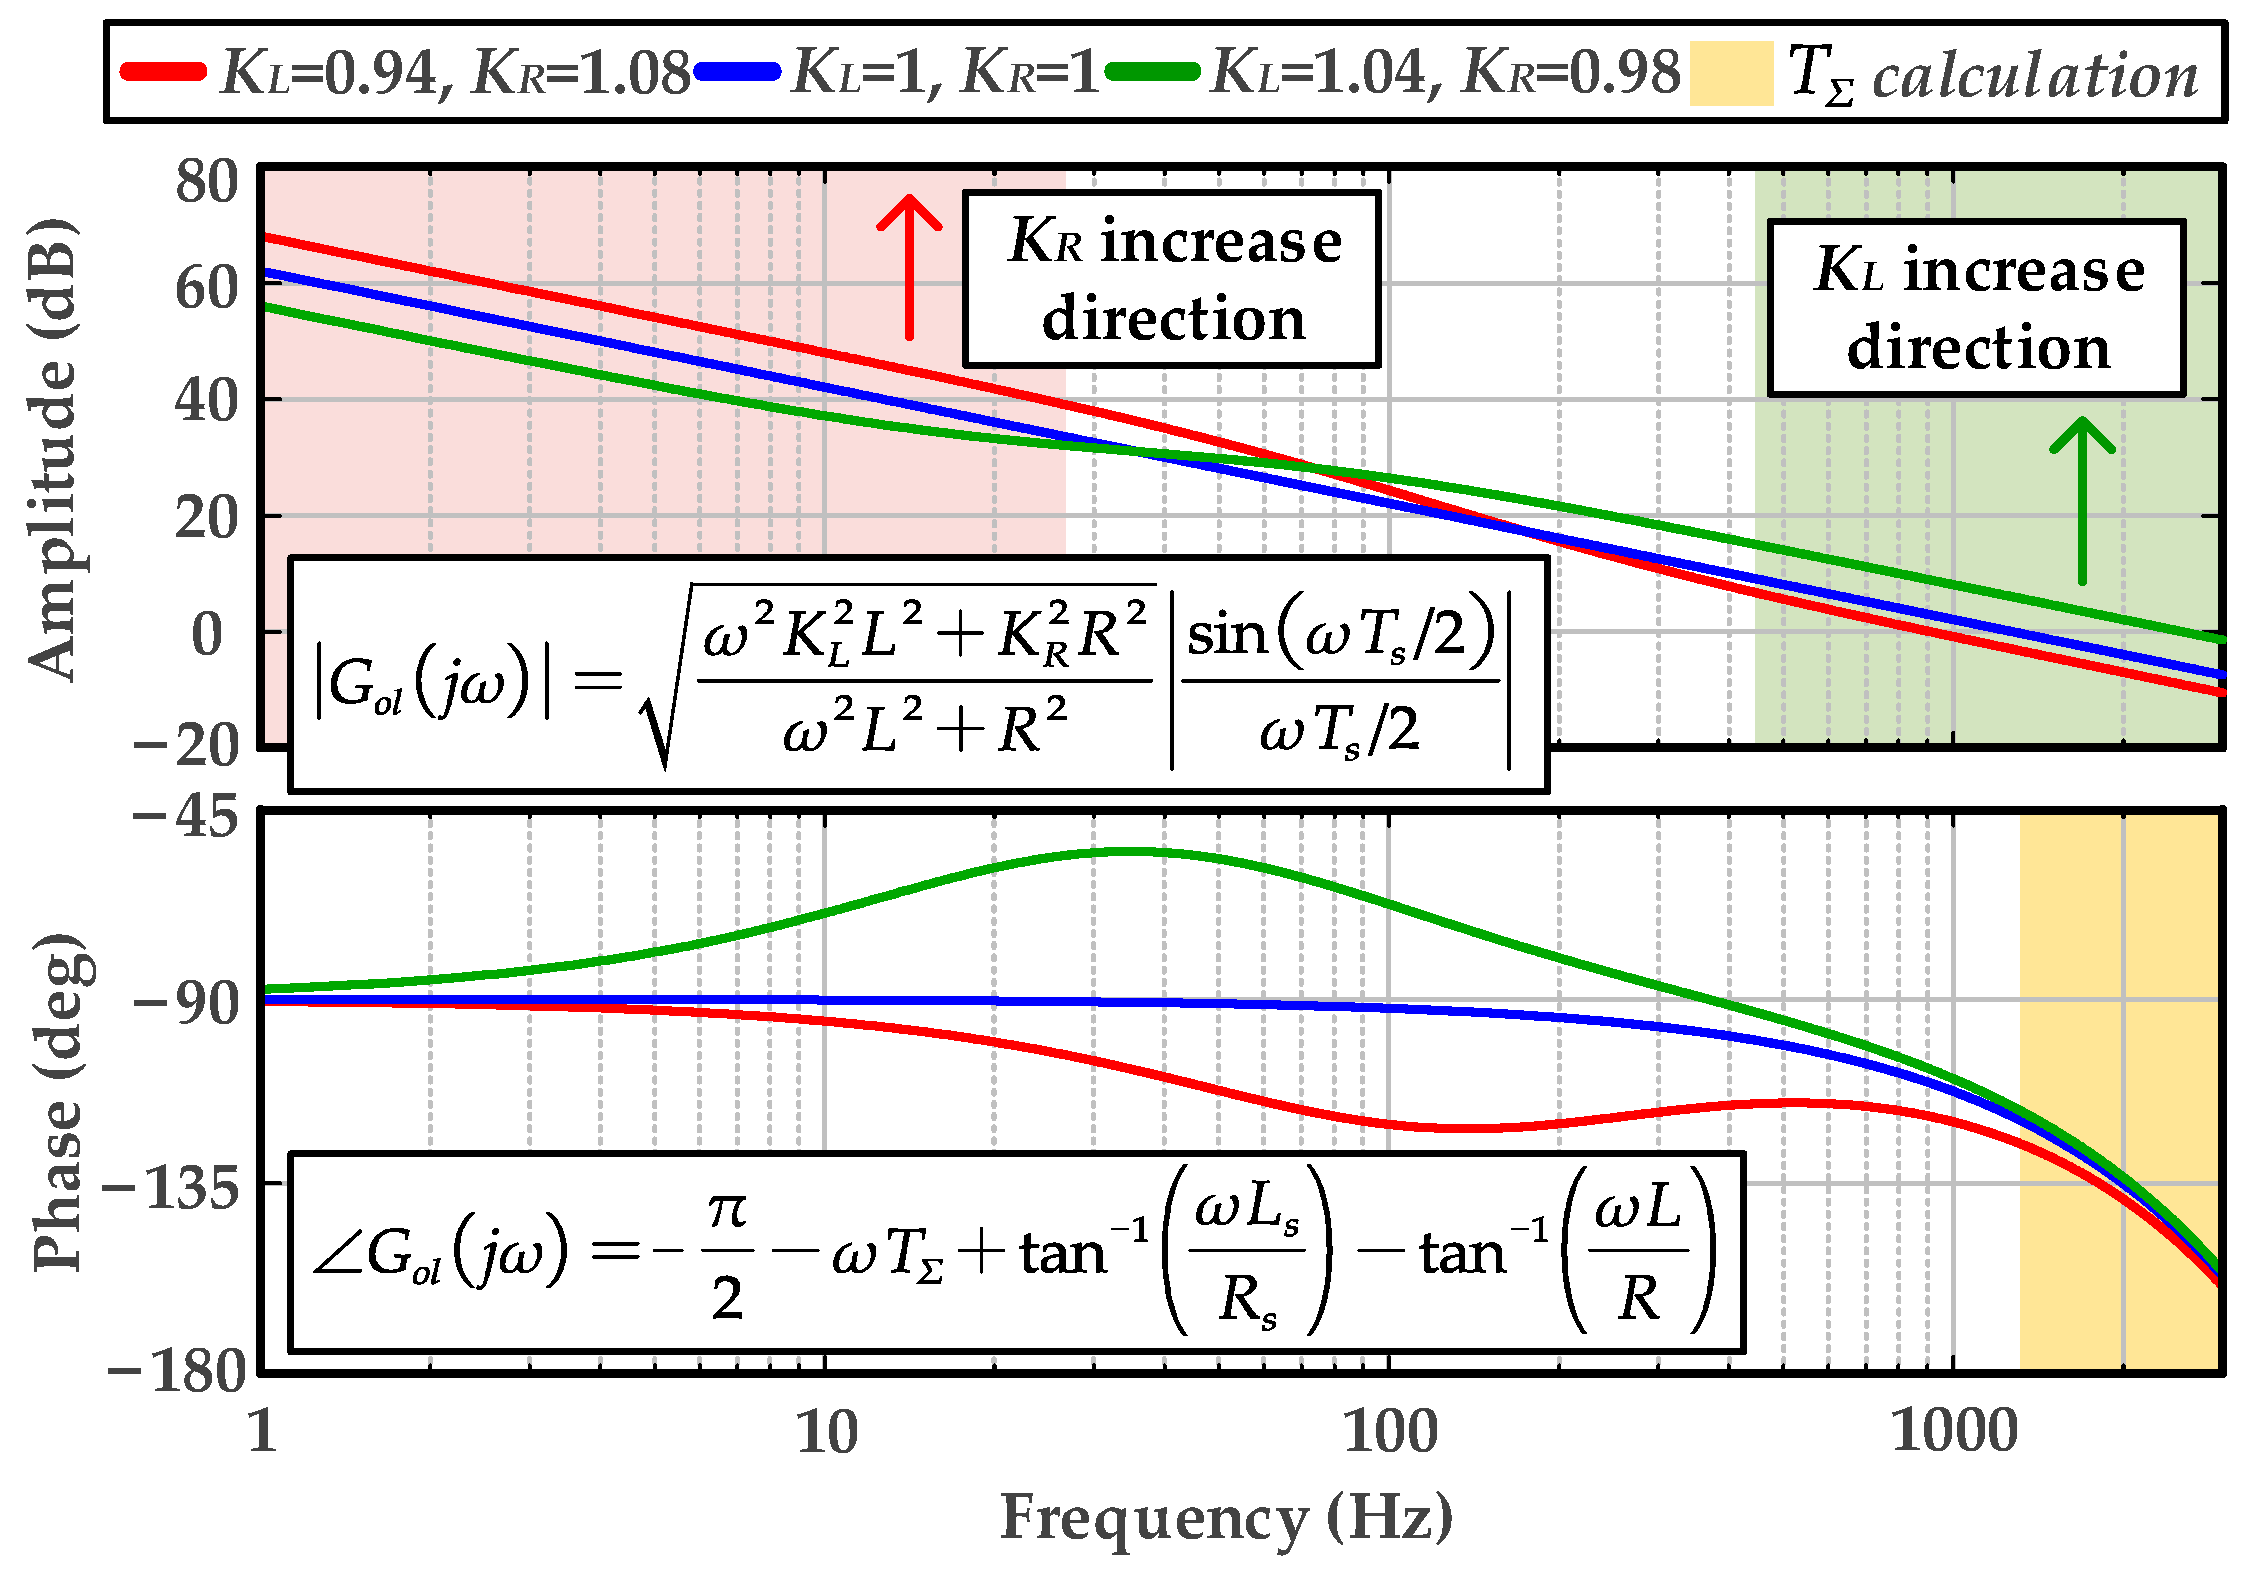
In Figure 12, the cases of KL = 0.94, KR = 1.08, and KL = 1.04, KR = 0.98 represent deviations between the identified inductance and resistance values and the actual system characteristics, as discussed in the last section. The phase responses of the three curves exhibit nearly identical slopes in the high-frequency region, indicating that the identification of the current loop delay time constant TΣ is unaffected by parameter mismatch. Therefore, frequency components above 1 kHz are selected as the effective range for delay time constant identification. This constant can be estimated using linear regression. In addition, the magnitude characteristics in Figure 12 provide a direct visual indication of the extent of parameter deviation.

3.3. Experimental Verification

The experimental platform used in this section is the same as that in the previous section. Additionally, it should be noted that both the switching frequency and the sampling frequency of the servo driver are 10 kHz. This implies that the theoretical value of the delay time constant TΣ is 100 µs.
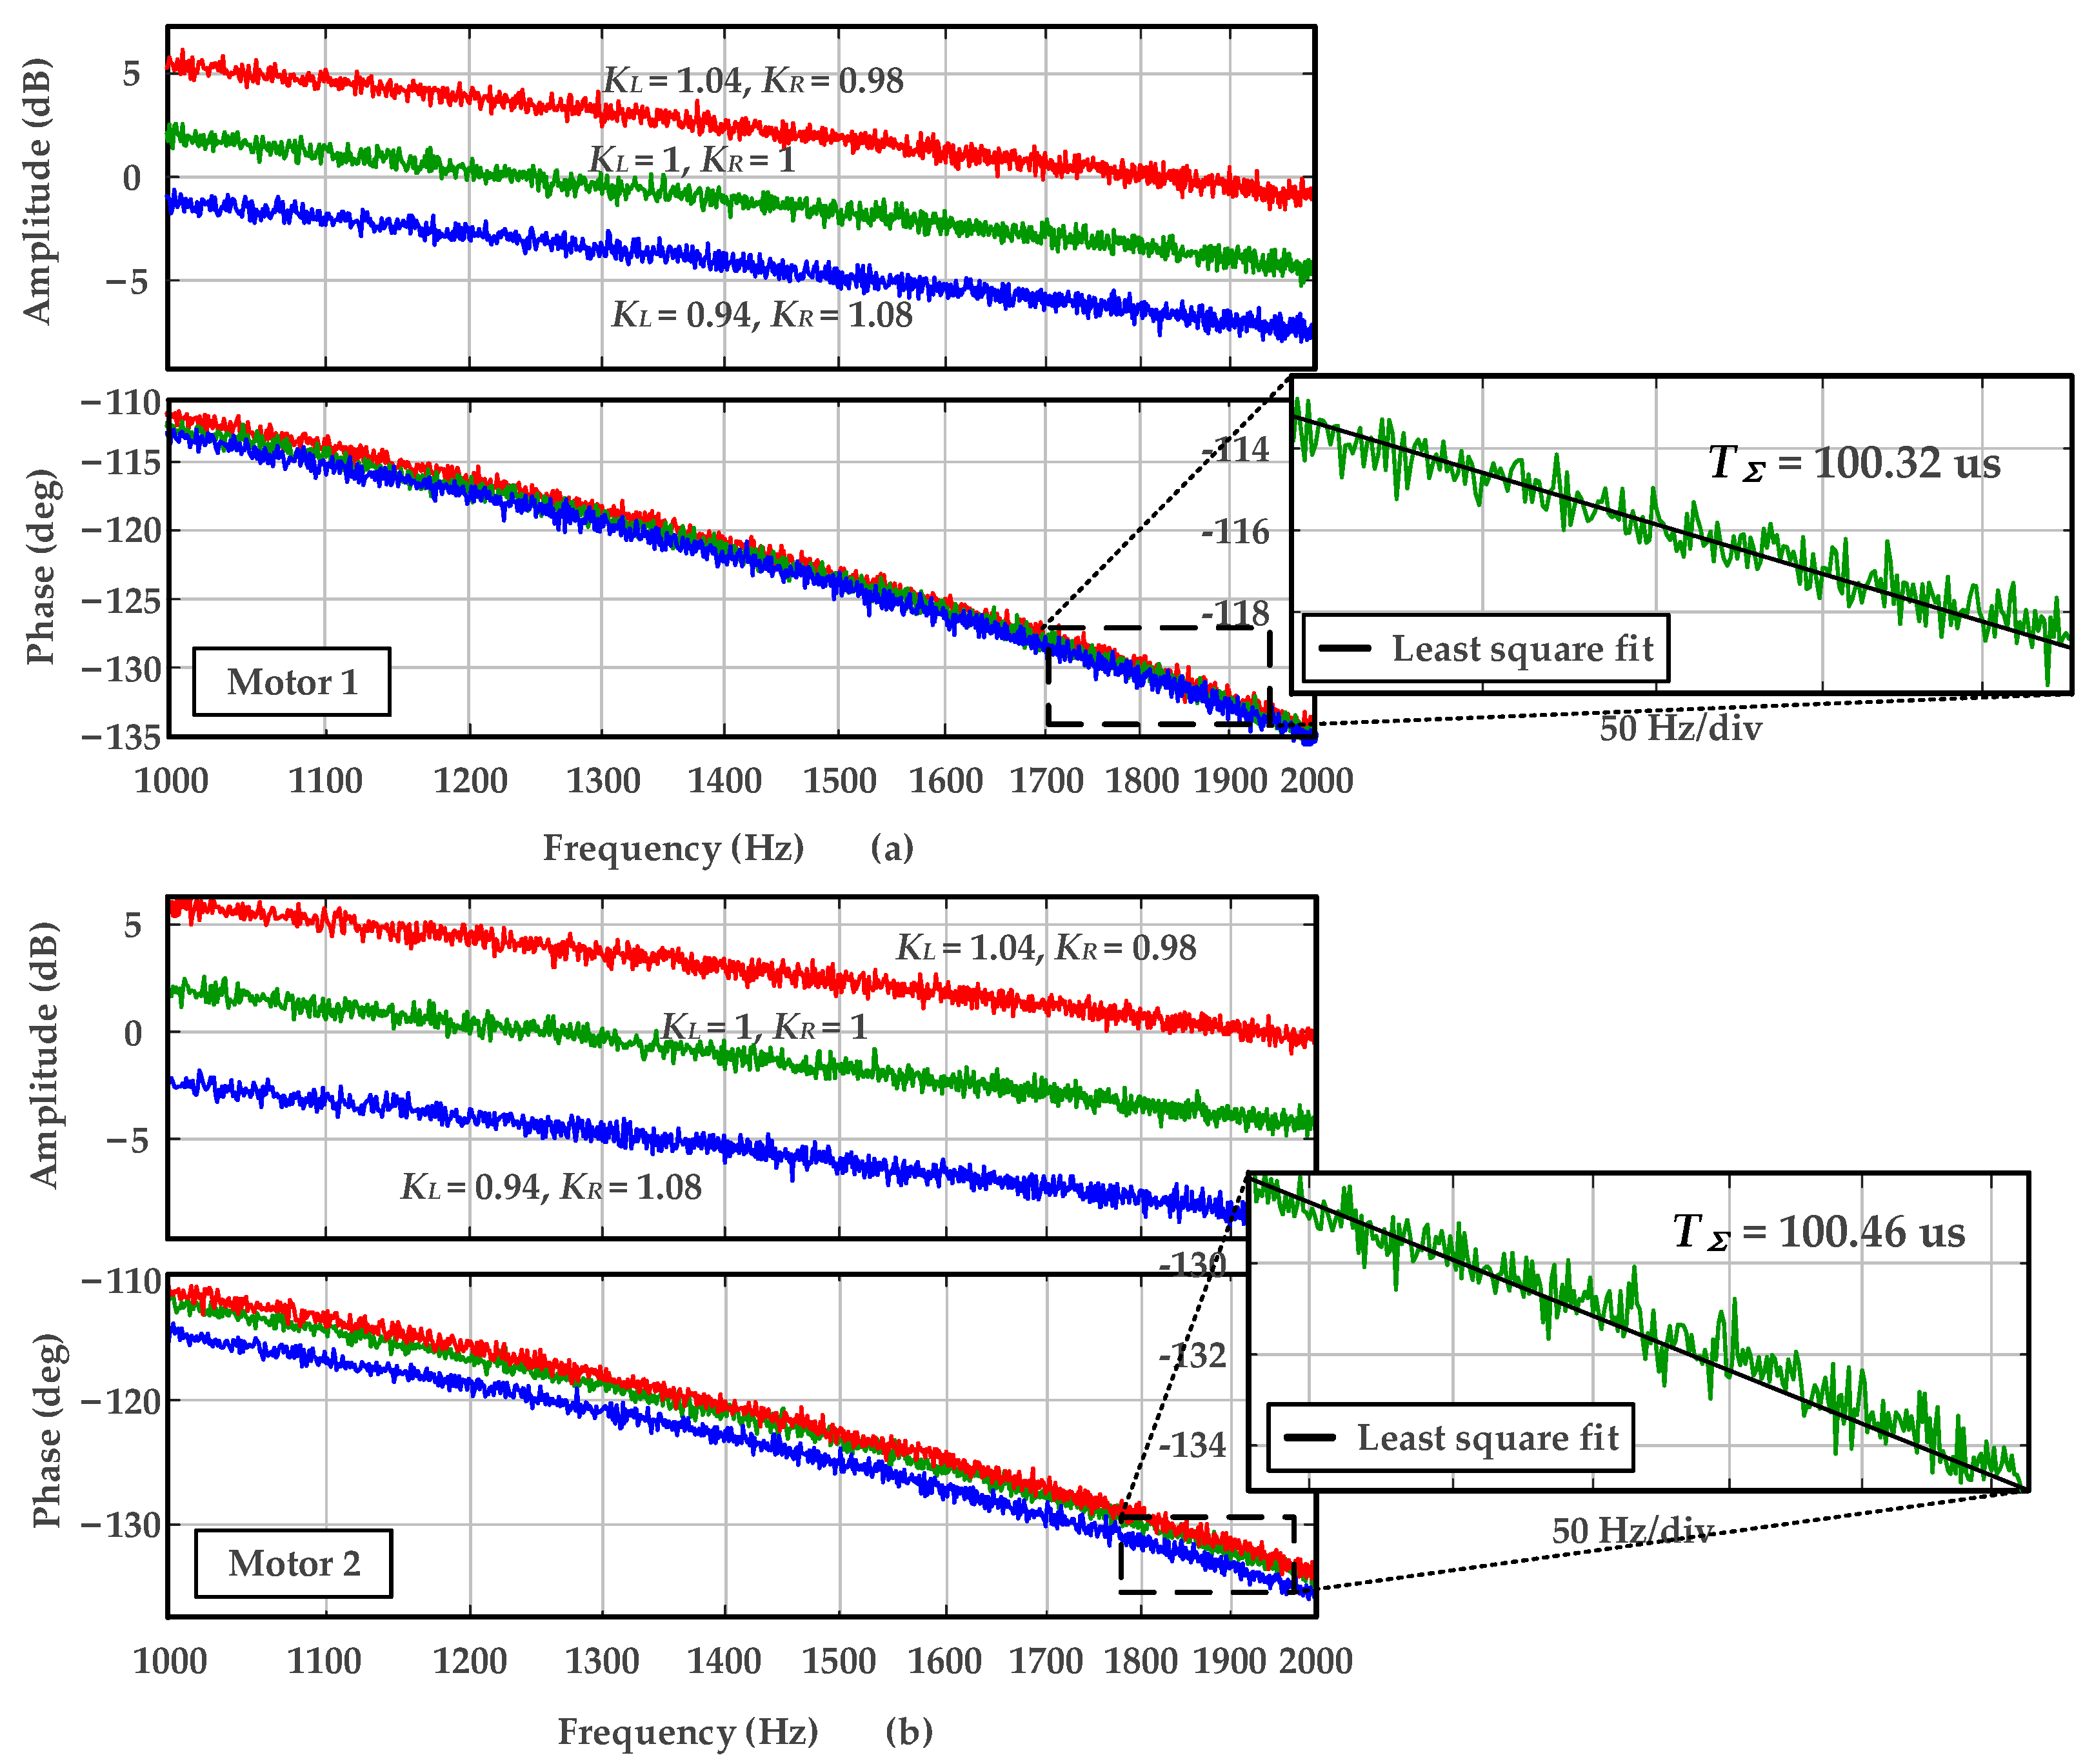
Figure 13a,b show the identified delay time constant TΣ using Motor 1 and Motor 2 as the plant under three different RL mismatch conditions. It is obvious that, despite differences in magnitude, the phase–frequency curves exhibit nearly identical slopes. The identified delay time constant TΣ in Figure 13a,b are 100.32 μs and 100.46 μs, respectively. The experimental results align well with the theoretical values, indicating that the proposed delay time constant identification strategy is not affected by parameter mismatch.

4. Bandwidth Adjustment Scheme Under Open-Loop Control

The parameters identified in previous sections are sufficient to ensure satisfactory dynamic performance of the current loop. To further enhance system performance, this section introduces a control parameter adjustment strategy within an open-loop framework, where the closed-loop bandwidth of the current loop serves as the performance metric. A normalized gain is incorporated to improve the dynamic response and enable bandwidth tuning of the current loop.

4.1. Multi-Frequency Parameter Adjustment Scheme

The structure of the current loop plant and the open-loop sweep-based correction scheme are shown in Figure 10 and Figure 11, respectively. In Equation (9), the term (sL + R)/(sLS + RS) in the denominator of the closed-loop transfer function Gcl() can be decomposed into its real and imaginary parts.
s L + R s L s + R s = j ω L + R j ω L s + R s = R R s + ω 2 L L s R s 2 + ω 2 L s 2 + j ω L R s L s R R s 2 + ω 2 L s 2
Similar to the approximation used in the delay identification section, the following approximation holds over the entire frequency range: LRSLSR. Therefore, the imaginary part in Equation (13) can be neglected. The real part in Equation (13) is defined as the adjustment factor Kadj:
K a d j = R R S + ω 2 L L S R S 2 + ω 2 L S 2
According to (9) and (14), the expression for the open-loop magnitude of the current loop can be derived as |Gol()|. When Kadj = 1, |Gol()| = |Gmatch()|; when Kadj ≠ 1, |Gol()| = |Gmismatch()|.
G mismatch j ω = 1 K a d j 1 ω T Σ S G match j ω = 1 ω T Σ S
By combining Equations (10) and (15), the set of equations used for correcting the resistance and inductance parameters can be obtained as follows:
ω 2 L S 2 + R S 2 ω 2 L L S + R R S = G mismatch j ω G match j ω = ω T Σ S G mismatch j ω L = R tan tan 1 ω L S R S G mismatch j ω π 2 ω T Σ S ω
In Equation (16), LS and RS represent the resistance and inductance parameters obtained from the offline identification in Section 2. |Gmismatch()| and ∠Gmismatch() denote the magnitude and phase of the open-loop transfer function of the current loop to be adjusted, respectively. These values can be directly obtained from the Bode plot derived through frequency sweep analysis. TΣS is the delay time constant identified in Section 3. L and R are the adjusted inductance and resistance parameters.
As shown in Figure 12, changes in the values of KL and KR result in corresponding shifts in the magnitude curve of the open-loop Bode plot. The influence of KL and KR on the high-frequency magnitude characteristics differs slightly. To reduce potential loss in adjustment accuracy, their effects are analyzed in the following.
At the high-frequency range, for example, when ωL > 10R, as shown in Equation (17), the influence of KR on the open-loop magnitude curve can be neglected, and the tuning curve is primarily determined by the linear variation of the inductance.
K e r r K e r r _ h = L / L S = 1 / K L f h i g h > 10 R 2 π L
In the low-frequency range, for example, when RωL, as shown in Equation (18), the influence of KR on the open-loop magnitude curve can no longer be neglected. In this case, the tuning curve is affected by both KL and KR. Therefore, selecting the low-frequency range for parameter adjustment allows for both resistance and inductance effects to be considered, ensuring accurate adjustment of both parameters.
K a d j K e r r _ l = R / R S = 1 / K R f l o w R 2 π L
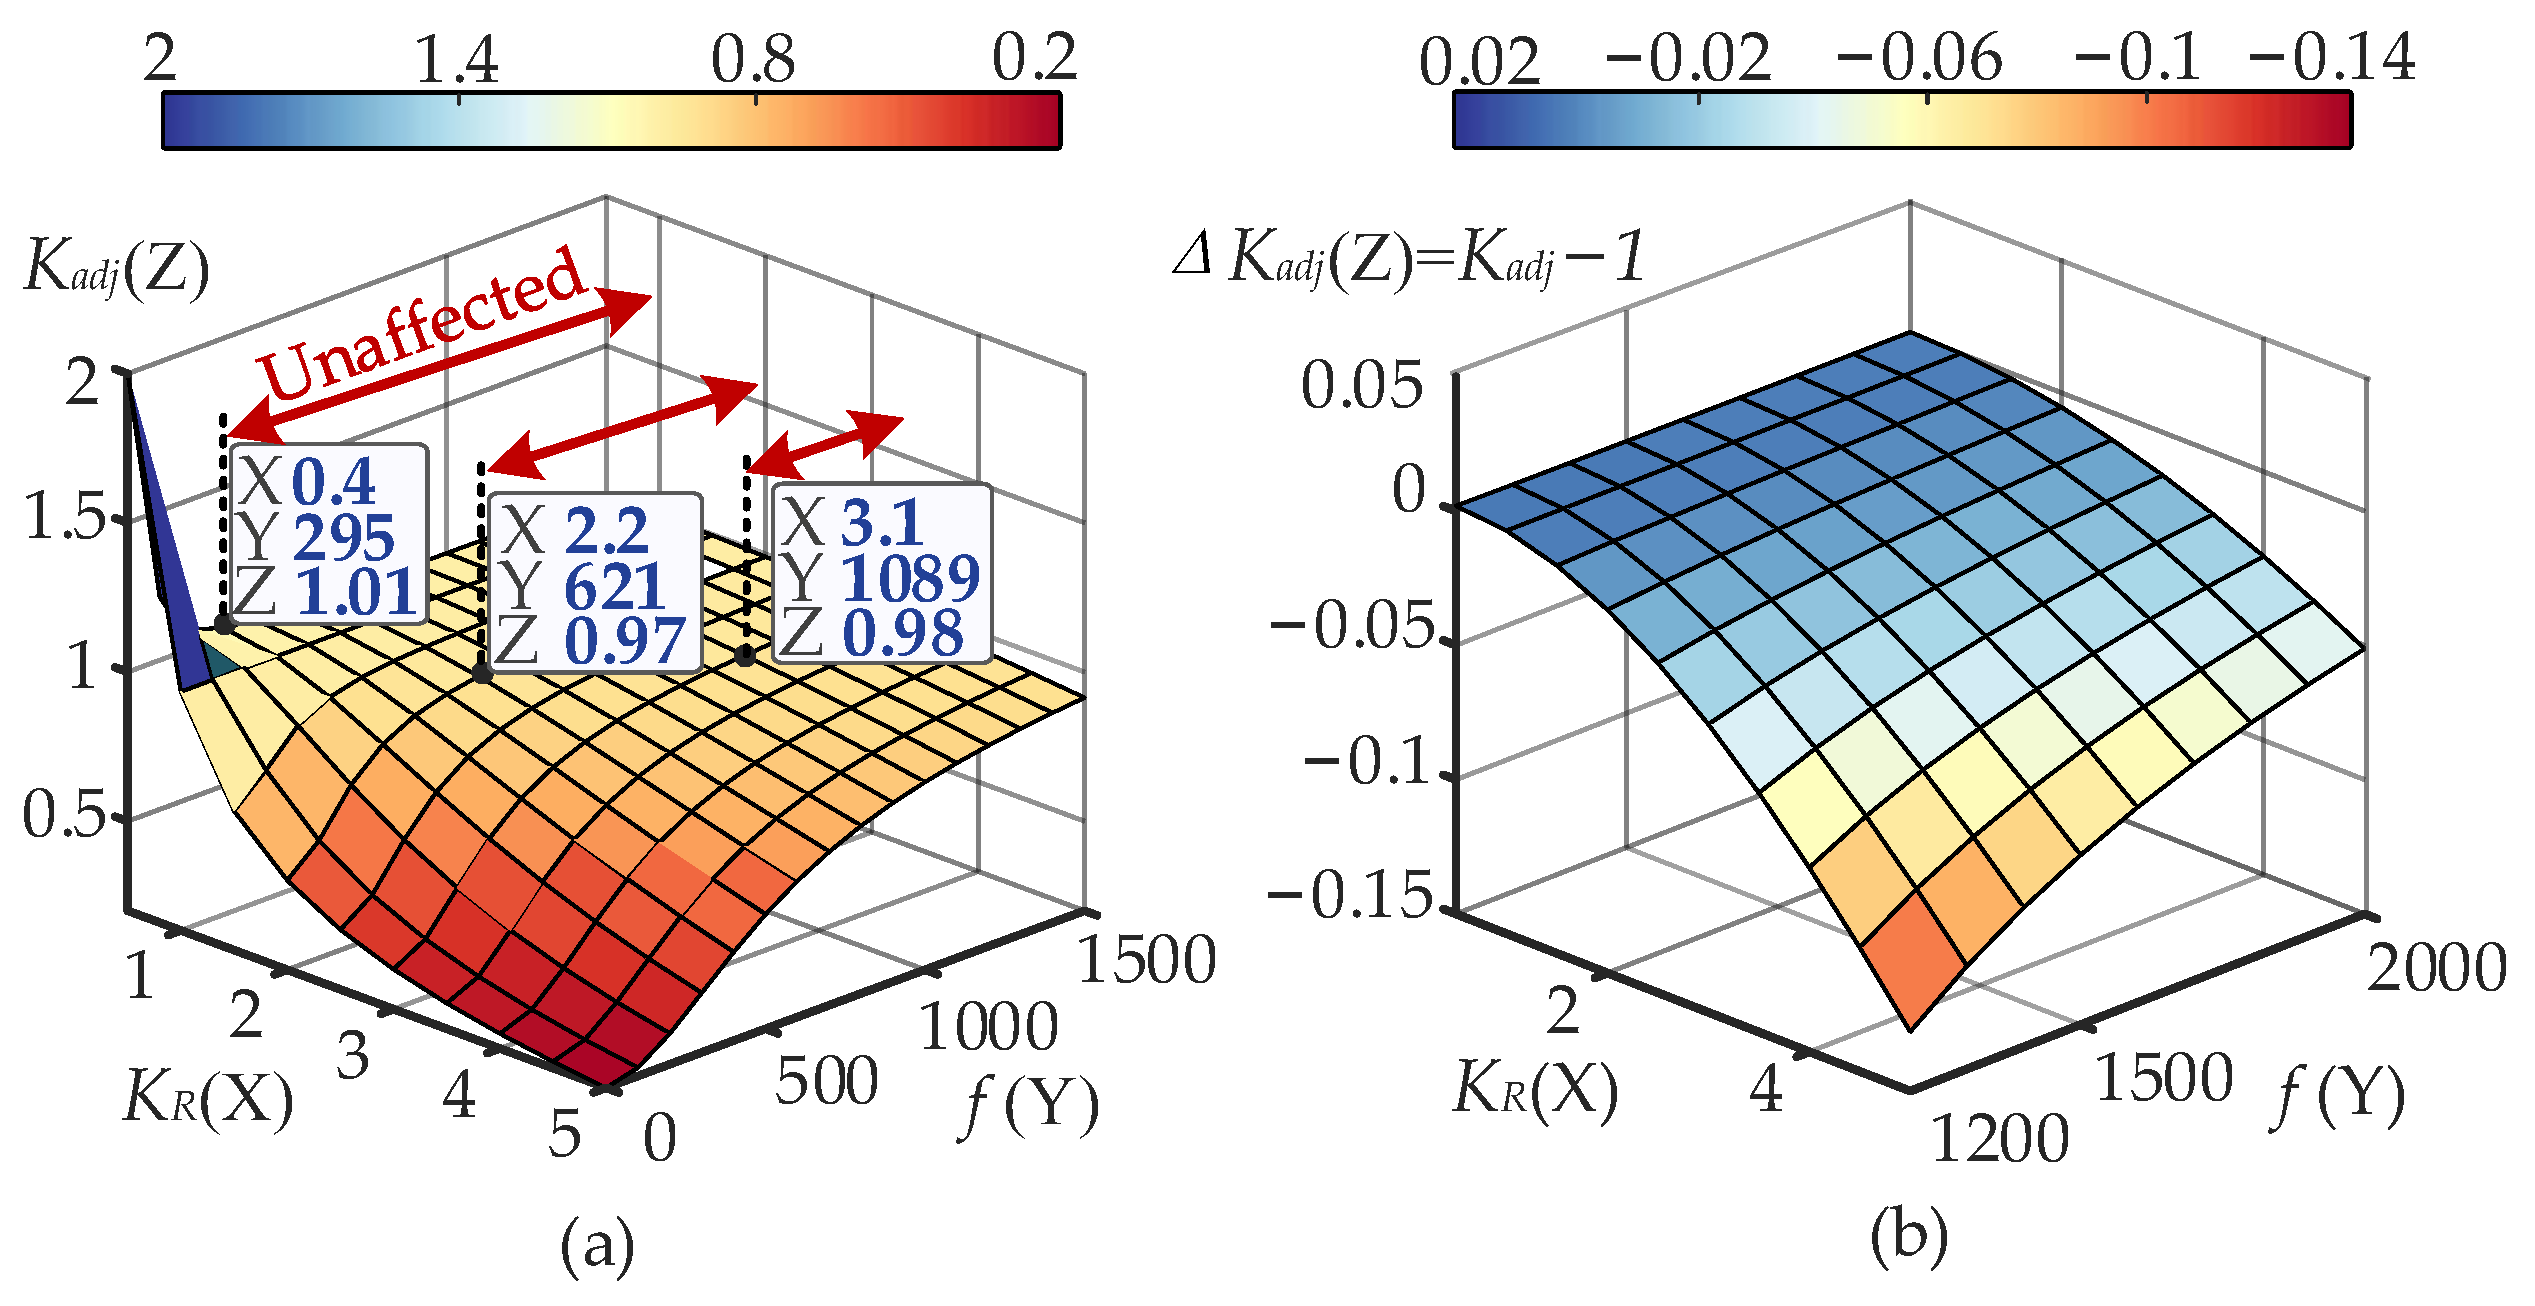
Figure 14 illustrates the impact of KR on parameter adjustment across different frequency ranges. In Figure 14a, as the frequency (Y-axis) increases, the influence of KR gradually diminishes, resulting in flatter curves. When the frequency decreases, Kadj decreases with increasing KR. Therefore, the parameter adjustment process in this paper is carried out within the 1–500 Hz frequency range.
At each frequency point ω in the low-frequency range, resistance and inductance parameters can be adjusted. By selecting n frequency points, n sets of adjusted Li and Ri values are obtained. To reduce the impact of sample error, mean filtering is applied to the adjusted parameters.
L final = i = 1 n L i n , R final = i = 1 n R i n
The final adjusted resistance Rfinal and inductance Lfinal are obtained based on the Equation (19). By substituting Rfinal and Lfinal into Equation (8), more precise pole-zero cancellation can be achieved, thereby increasing the current loop bandwidth. Furthermore, the concept of normalized gain γ is introduced to enable closed-loop bandwidth adjustment [17]. Accordingly, (8) is reformulated as follows:
K p = γ L final T Σ S , K i = R final L final
Accordingly, the open- and closed-loop transfer functions of the current loop in (9) are reformulated as follows:
G o l s = γ e s T Σ s T Σ S s L final + R final s L + R G c l s = γ γ + s L + R s L final + R final s T Σ S e s T Σ

4.2. Experimental Verification

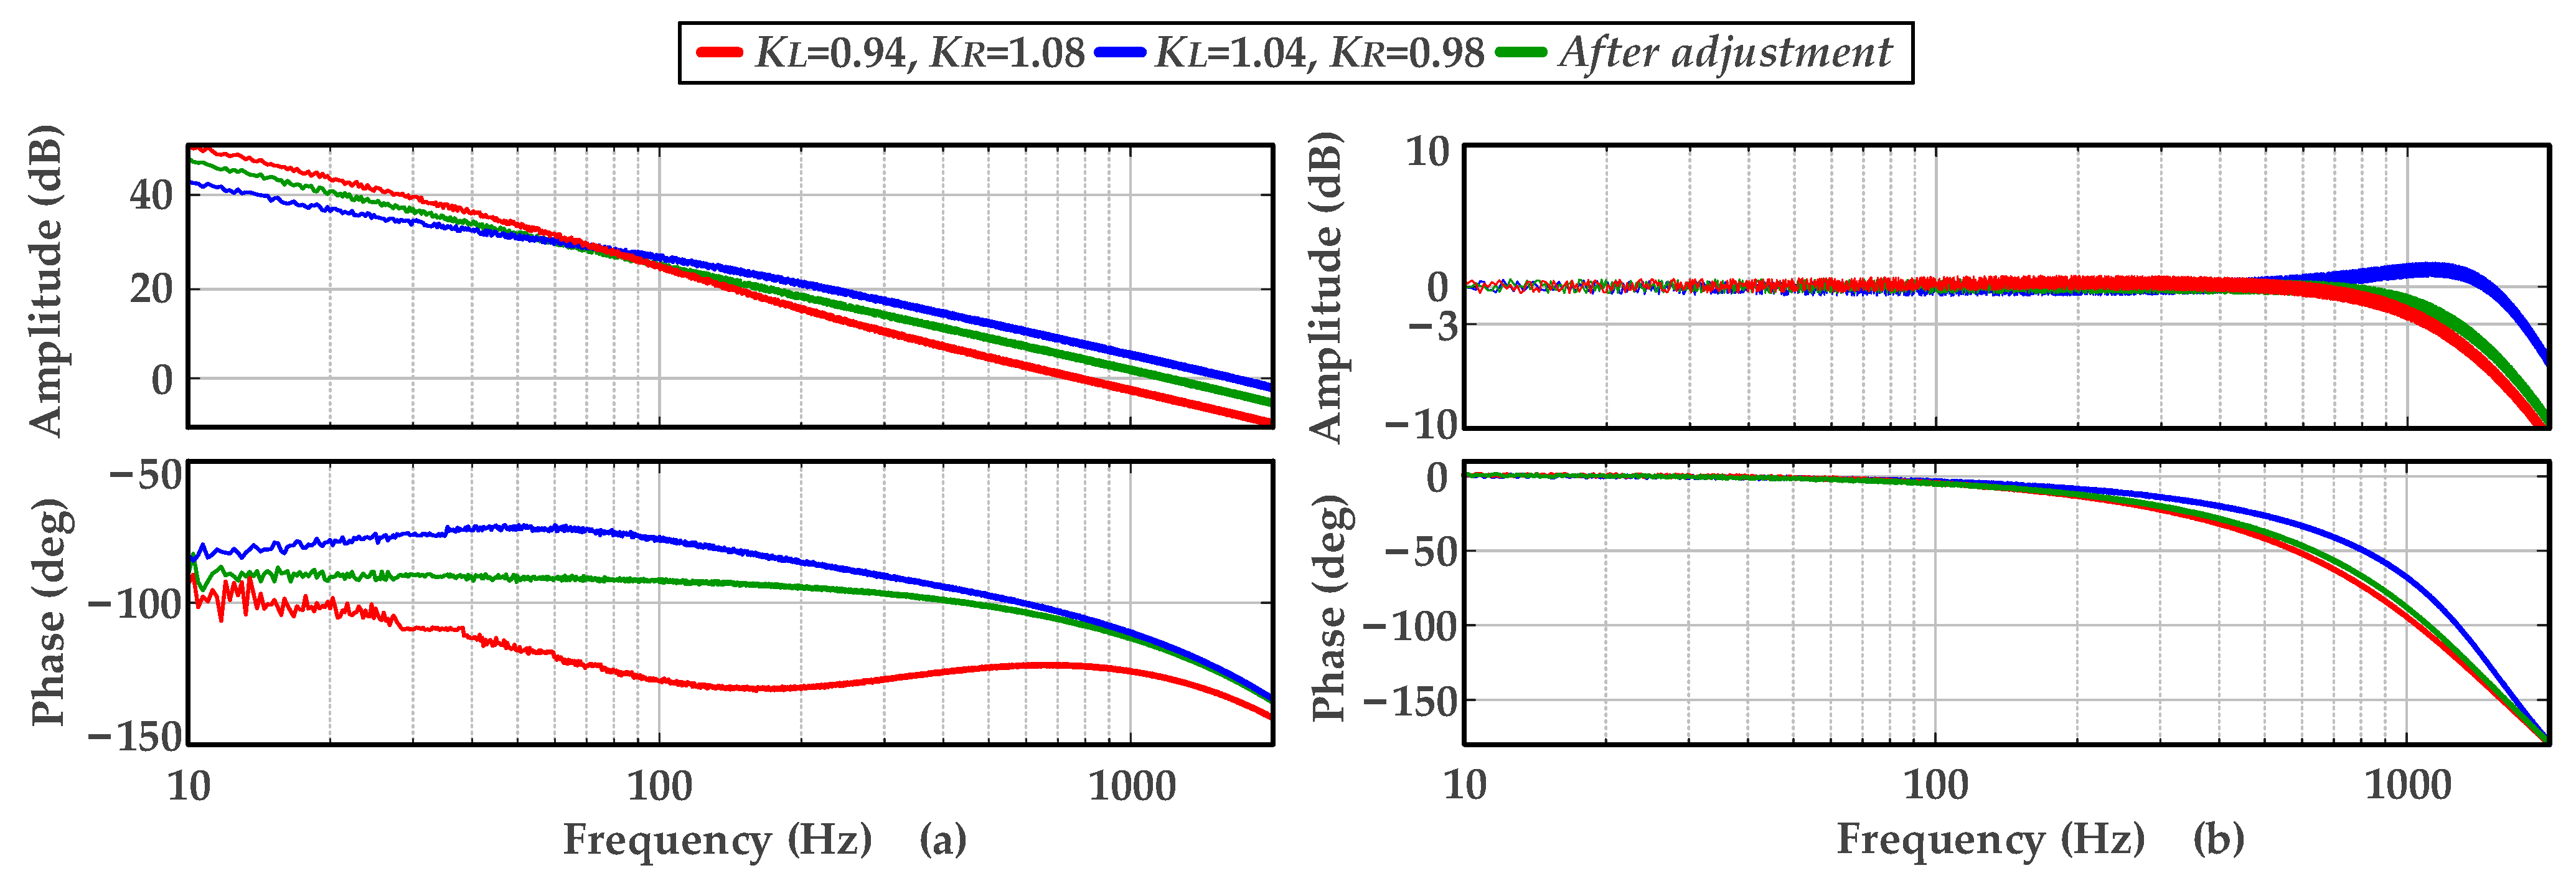
The hardware and software experimental platforms used in this section are the same as those described above. This section presents experiments based on Motor 1, where the inductance and resistance identified in Section 2 serve as the parameters to be adjusted: (1) KL = 0.94, KR = 1.08; (2) KL = 1.04, KR = 0.98. The normalized gain γ is set to the default value of 0.5. The frequency characteristics of the open- and closed-loop systems, before and after adjustment, are obtained through sweep and filtering (the raw data collected are smoothed by the Hample filter, Savitzky–Golay filter, and Gaussian filter [35]), as illustrated in Figure 15.
As shown in Figure 15 and Table 4, case 2 exhibit higher cutoff frequency and bandwidth, while resonance peaks appear in the high-frequency region of the closed-loop magnitude response, which significantly affect system stability. The adjusted system achieves an increased bandwidth while maintaining system stability. To illustrate the impact of parameter adjustment on time-domain performance, a square wave (0.25–0.75 pu) is applied to evaluate step response under different cases. Experimental waveforms for the three cases are shown in Figure 16. The adjusted current loop system demonstrates improved dynamic response performance, characterized by smaller overshoot and shorter settling time.
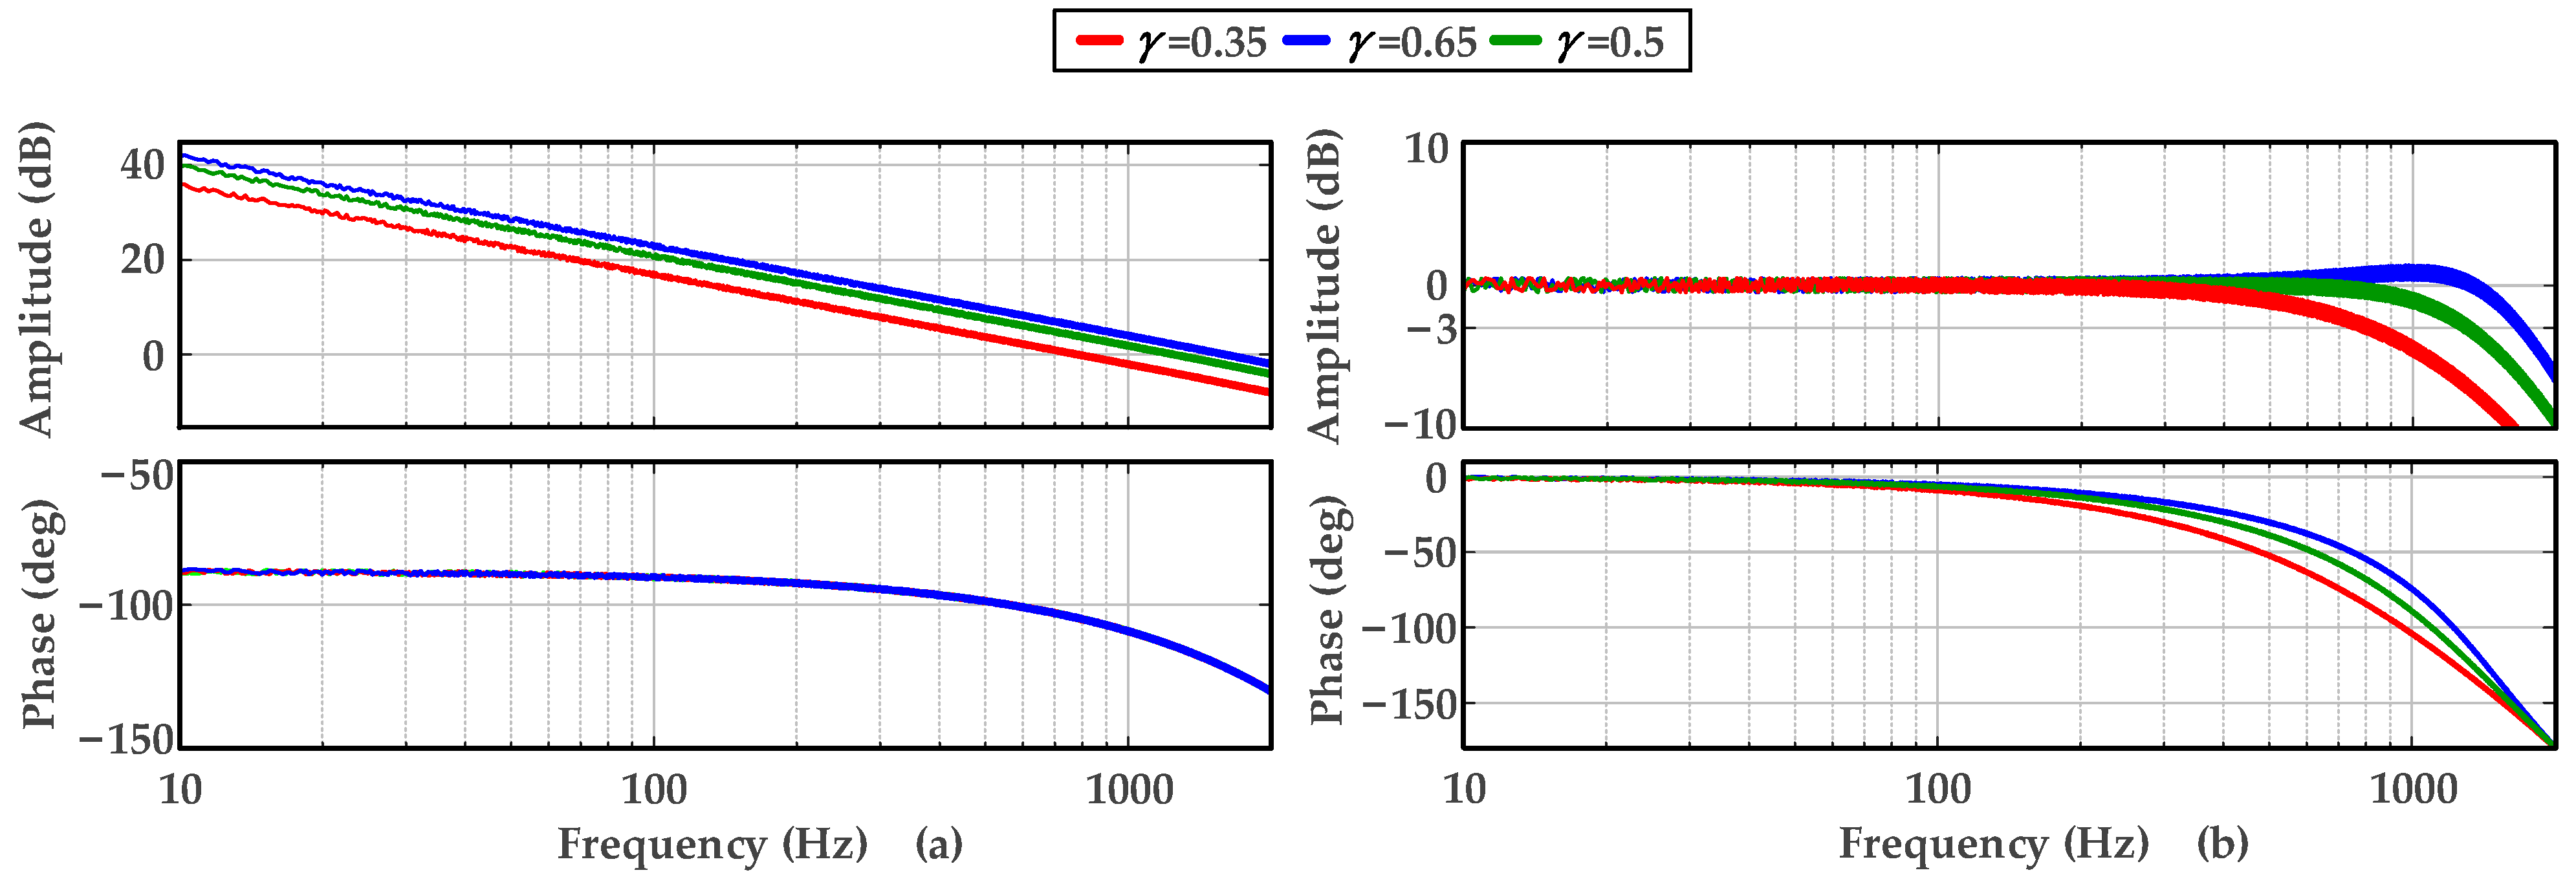
Based on the adjusted system shown in Figure 17, fine-tuning of bandwidth and dynamic performance can be achieved by modifying the normalized gain γ. Three comparison groups are defined as follows: (1) γ = 0.35; (2) γ = 0.5; (3) γ = 0.65. The open- and closed-loop Bode plots of the current loop under the three conditions are shown in Figure 17.
As shown in Figure 17 and Figure 18 and Table 5, modifying the normalized gain γ leads to changes in the current loop cutoff frequency and closed-loop bandwidth, thereby affecting the time-domain performance. Typically, γ = 0.5 is selected as the default value.
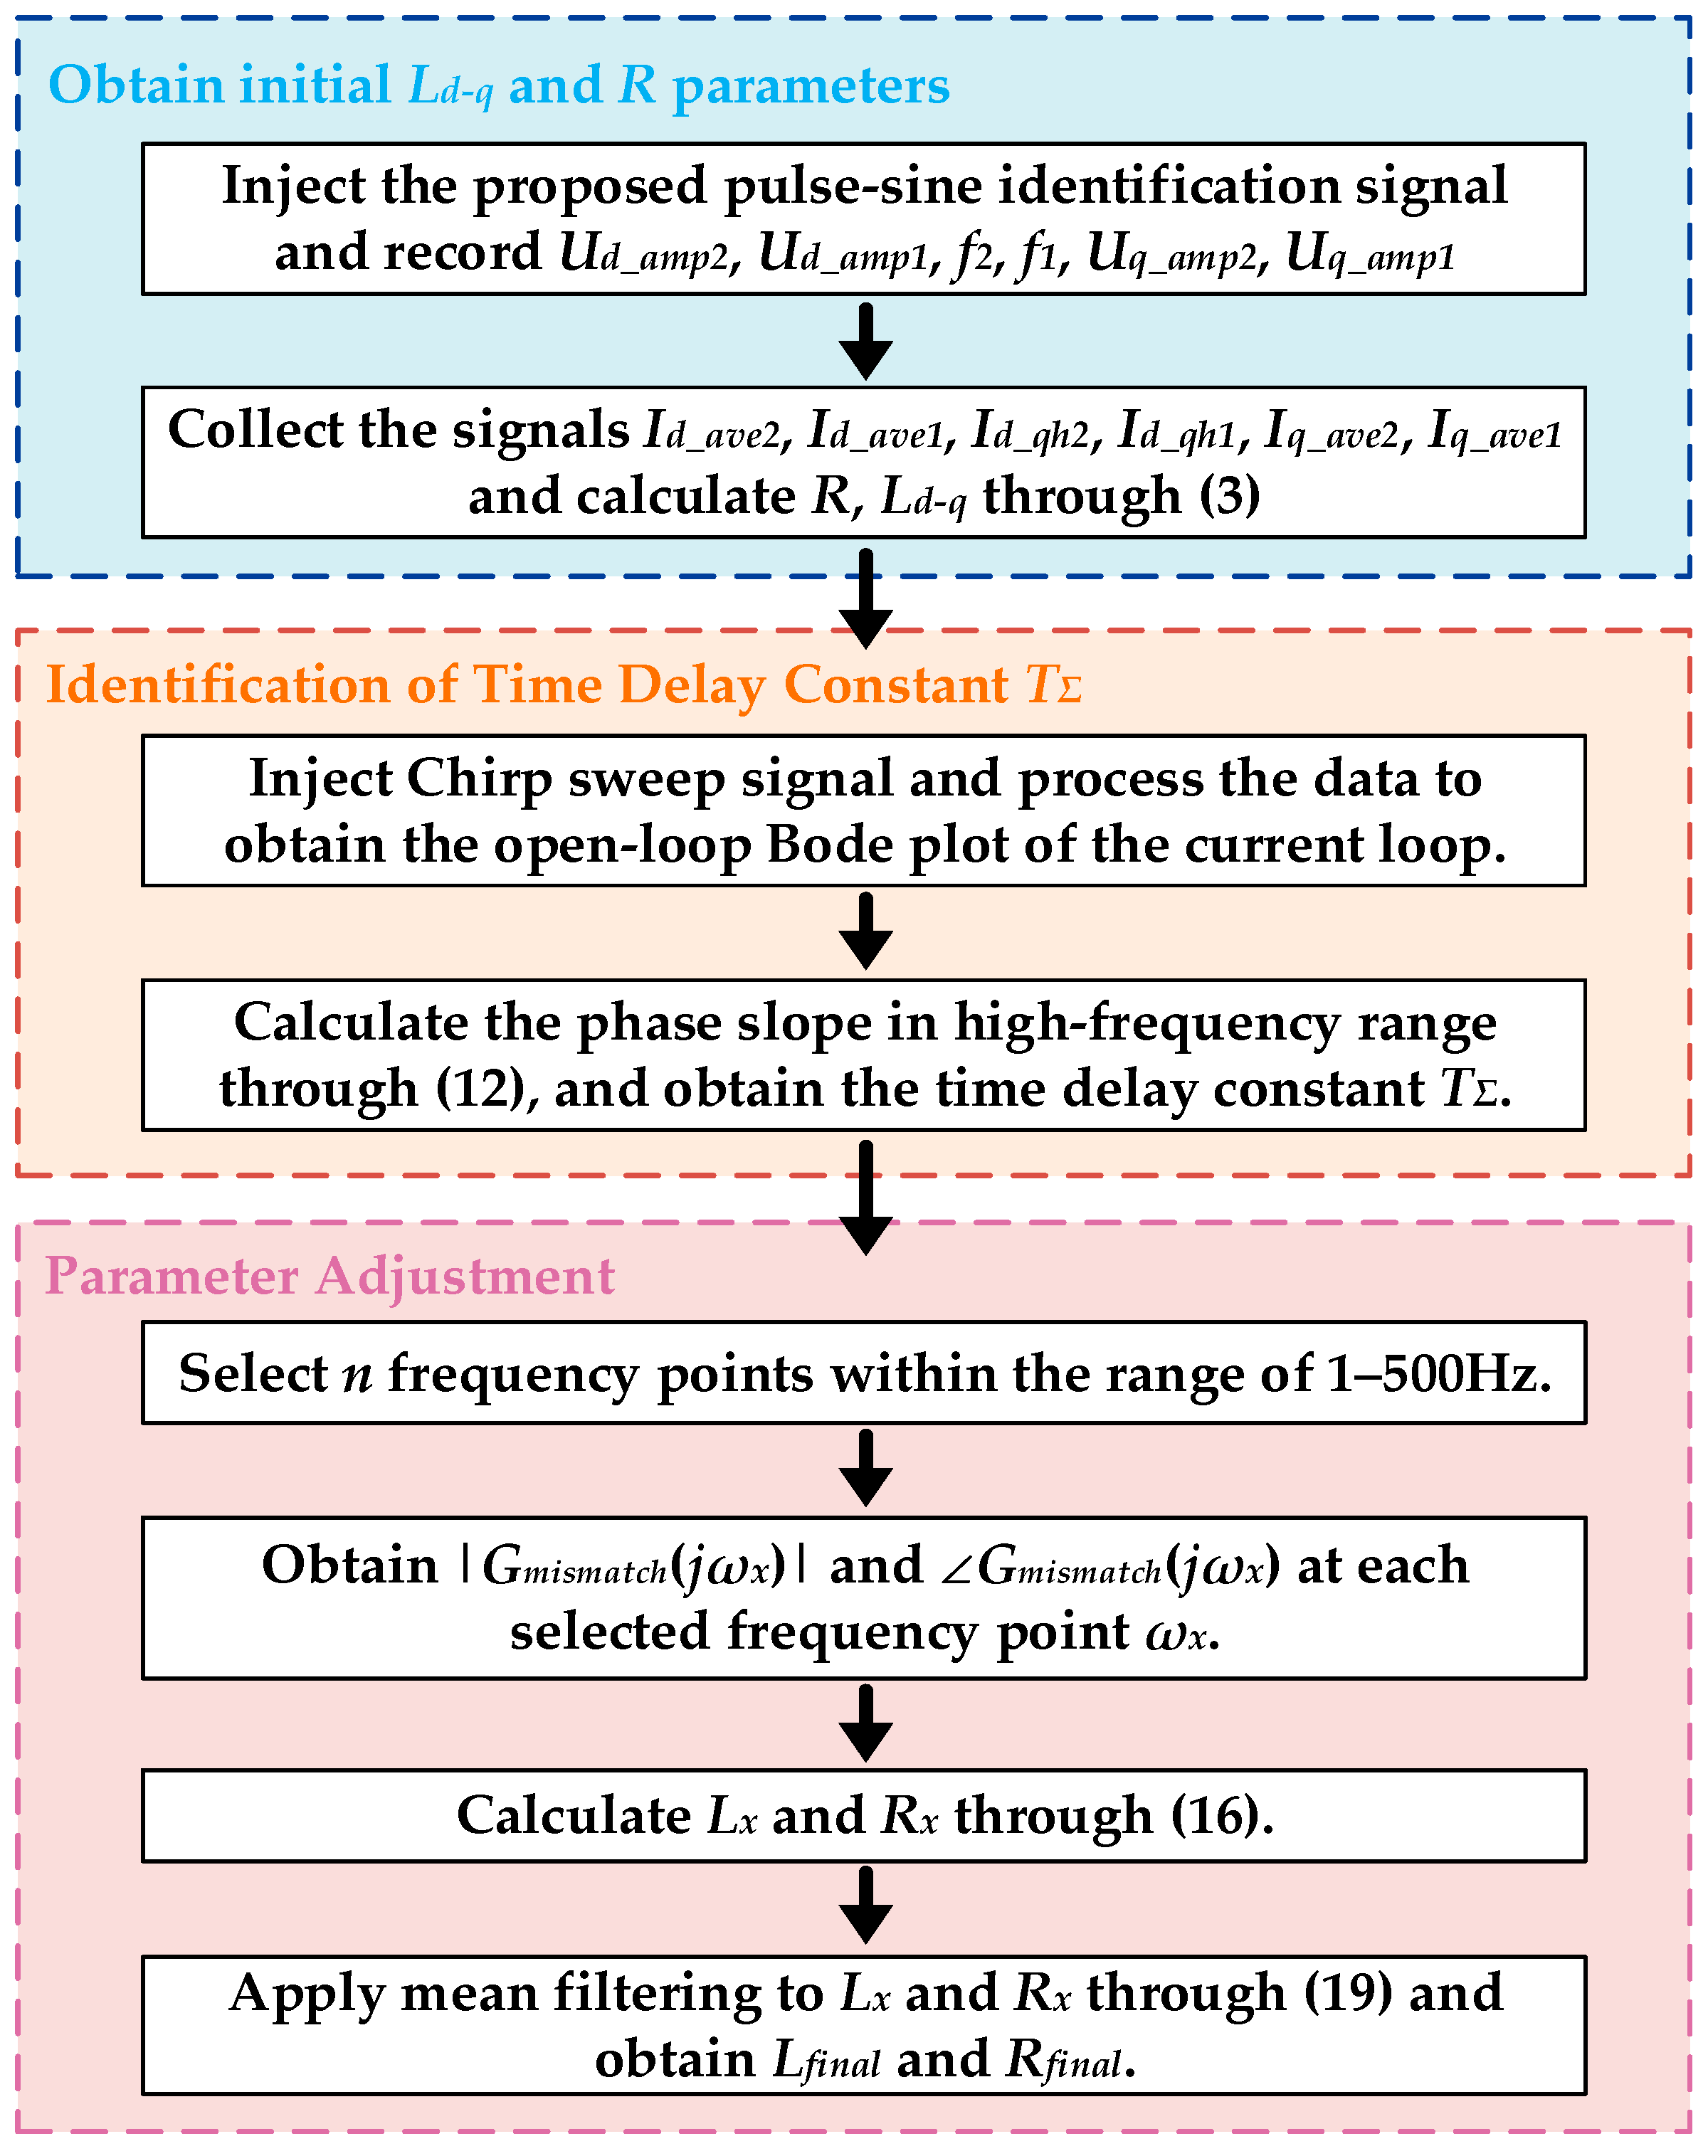
As a summary, the proposed parameter identification and adjustment algorithms are presented across three sections, and their interrelations are illustrated in Figure 19. The ultimate goal of this paper is to enhance the current loop bandwidth and achieve superior current dynamic response performance.
In the experimental parts of the aforementioned sections, changes in parameter values correspond to variations in experimental results (e.g., different normalized gains γ result in different frequency responses of the system), which confirms the effectiveness of the proposed algorithm. Nevertheless, formal verification methods, such as statistical model checking [36], could also be employed to facilitate systematic and rigorous comparisons across different configurations.

5. Conclusions

This paper presents a tuning algorithm for current loop control parameters based on open-loop frequency sweeping. Since the Bode diagram reflects nonlinear factors that are neglected in modeling, their influence can be utilized to correct control parameters. First, a pulse–sine voltage injection method is proposed to identify motor parameters, which serve as the initial values for the current controller. To mitigate the effects of inverter nonlinearity while maintaining algorithmic efficiency, a differencing technique is employed to improve identification accuracy. Based on the ZPC principle, the delay time constant required for controller tuning is identified by fitting the open-loop phase slope at high frequencies. This method is robust to parameter variations. Finally, an open-loop adjustment strategy with normalized gain is further introduced to refine dynamic performance and improve bandwidth tunability. Experimental results demonstrate that the proposed method significantly improves current loop bandwidth and dynamic performance, thereby validating its effectiveness. Future work will focus on the tuning of speed and position loop controllers to achieve high-precision control of the overall servo system.

Author Contributions

Conceptualization, M.Y.; methodology, P.L. and C.S.; project administration, M.Y.; software, P.L. and C.S.; validation, P.L.; writing—original draft, P.L. and C.S.; writing—review and editing, P.L. All authors have read and agreed to the published version of the manuscript.

Funding

This research received no external funding.

Data Availability Statement

The original contributions presented in this study are included in the article. Further inquiries can be directed to the corresponding author(s).

Conflicts of Interest

The authors declare no conflicts of interest.

References

  1. Maeda, Y.; Iwasaki, M. Rolling Friction Model-Based Analyses and Compensation for Slow Settling Response in Precise Positioning. IEEE Trans. Ind. Electron. 2013, 60, 5841–5853. [Google Scholar] [CrossRef]
  2. Ohishi, K.; Furusawa, R. Actuators for Motion Control: Fine Actuator Force Control for Electric Injection Molding Machines. IEEE Ind. Electron. Mag. 2012, 6, 4–13. [Google Scholar] [CrossRef]
  3. Montonen, J.-H.; Nevaranta, N.; Lindh, T.; Alho, J.; Immonen, P.; Pyrhönen, O. Experimental Identification and Parameter Estimation of the Mechanical Driveline of a Hybrid Bus. IEEE Trans. Ind. Electron. 2018, 65, 5921–5930. [Google Scholar] [CrossRef]
  4. Östring, M.; Gunnarsson, S.; Norrlöf, M. Closed-loop identification of an industrial robot containing flexibilities. Control Eng. Pract. 2003, 11, 291–300. [Google Scholar] [CrossRef]
  5. Cameron, F.; Seborg, D.E. A self-tuning controller with a PID structure. Int. J. Control 1983, 38, 401–417. [Google Scholar] [CrossRef]
  6. Hang, C.C.; Åström, K.J.; Ho, W.K. Refinements of the Ziegler-Nichols tuning formula. Proc. Inst. Elect. Eng. 1991, 138, 111–118. [Google Scholar] [CrossRef]
  7. Ziegler, J.G.; Nichols, N.B. Optimum settings for automatic controllers. J. Fluids Eng. 1942, 64, 759–765. [Google Scholar] [CrossRef]
  8. Rad, A.B.; Lo, W.L.; Tsang, K.M. Self-tuning PID controller using Newton-Raphson search method. IEEE Trans. Ind. Electron. 1997, 44, 717–725. [Google Scholar]
  9. MartÃn, D.; Caballero, B.; Haber, R. Optimal tuning of a networked linear controller using a multi-objective genetic algorithm. Application to a complex electromechanical process. In Proceedings of the International Conference on Intelligent Data Communication Technologies and Internet of Things, Dalian, China, 18–20 June 2008; p. 91. [Google Scholar]
  10. Cheng, K.Y.; Tzou, Y.Y. Fuzzy optimization techniques applied to the design of a digital PMSM servo drive. IEEE Trans. Power Electron. 2004, 19, 1085–1099. [Google Scholar] [CrossRef]
  11. Tursini, M.; Parasiliti, F.; Zhang, D. Real-time gain tuning of PI controllers for high-performance PMSM drives. IEEE Trans. Ind. Appl. 2002, 38, 1018–1026. [Google Scholar] [CrossRef]
  12. Yepes, A.G.; Vidal, A.; Malvar, J.; López, O.; Doval-Gandoy, J. Tuning method aimed at optimized settling time and overshoot for synchronous proportional-integral current control in electric machine. IEEE Trans. Power Electron. 2014, 29, 3041–3054. [Google Scholar] [CrossRef]
  13. Boshi, C. Electric Drag Automatic Control System: Motion Control System; Machinery Ind. Press: South Norwalk, CT, USA, 2003. [Google Scholar]
  14. Kim, H.; Degner, M.; Guerrero, J.; Briz, F.; Lorenz, R. Discrete-time current regulator design for AC machine drives. IEEE Trans. Ind. Appl. 2010, 46, 1425–1435. [Google Scholar] [CrossRef]
  15. Yang, S.M.; Lin, K.W. Automatic control loop tuning for permanent-magnet AC servo motor drives. IEEE Trans. Ind. Electron. 2016, 63, 1499–1506. [Google Scholar] [CrossRef]
  16. Erturk, F.; Akin, B. Spatial Inductance Estimation for Current Loop Auto-Tuning in IPMSM Self-Commissioning. IEEE Trans. Ind. Electron. 2020, 67, 3911–3920. [Google Scholar] [CrossRef]
  17. Shang, C.; Yang, M.; You, J. High Bandwidth Current Regulator Design for PMSM Based on Frequency Sweep Correction. IEEE Trans. Ind. Electron. 2024, 71, 1768–1778. [Google Scholar] [CrossRef]
  18. Franklin, G.; Powel, J.; Emami-Naeini, A. Feedback Control of Dynamical Systems; Prentice Hall: Hoboken, NJ, USA, 2015. [Google Scholar]
  19. Aström, K.J.; Hagglund, T. Automatic tuning of simple regulators with specifications on phase and amplitude margins. Automatica 1984, 20, 645–651. [Google Scholar] [CrossRef]
  20. Li, K. PID tuning for optimal closed-loop performance with specified gain and phase margins. IEEE Trans. Control Syst. Technol. 2013, 21, 1024–2030. [Google Scholar] [CrossRef]
  21. Chen, P.; Luo, Y. Analytical Fractional-Order PID Controller Design With Bode’s Ideal Cutoff Filter for PMSM Speed Servo System. IEEE Trans. Ind. Electron. 2023, 70, 1783–1793. [Google Scholar] [CrossRef]
  22. Elso, J.; Gil-Martinez, M.; Garcia-Sanz, M. Quantitative feedback control for multivariable model matching and disturbance rejection. Int. J. Robust Nonlinear Control 2017, 27, 121–134. [Google Scholar] [CrossRef]
  23. Fan, Y.; Cheng, Y.; Zhang, P.; Lu, G. An active disturbance rejection control design for the distillation process with input saturation via quantitative feedback theory. J. Process Control 2023, 128, 103029. [Google Scholar] [CrossRef]
  24. Maeda, Y.; Iwasaki, M. Circle Condition-Based Feedback Compensa-tion With Frequency Shaping for Improvement of Settling Performance. IEEE Trans. Ind. Electron. 2014, 61, 5500–5508. [Google Scholar] [CrossRef]
  25. Balestrino, A.; Corsanini, D.; Landi, A.; Sani, L. Circle-based criteria for performance evaluation of controlled dc–dc switching converters. IEEE Trans. Ind. Electron. 2006, 53, 1862–1869. [Google Scholar] [CrossRef]
  26. Balestrino, A.; Landi, A.; Sani, L. Complete root contours for circle criteria and relay autotune implementation. IEEE Control Syst. Mag. 2002, 22, 82–91. [Google Scholar]
  27. Chen, Y.; Moore, K.L. Relay feedback tuning of robust PID controllers with iso-damping property. IEEE Trans. Syst. 2005, 35, 23–31. [Google Scholar] [CrossRef] [PubMed]
  28. Yaniv, O.; Mollov, S. Synthesizing all filtered proportional-integral and PID controllers satisfying gain, phase, and sensitivity specifications. IEEE Trans. Ind. Electron. 2023, 70, 2939–2947. [Google Scholar] [CrossRef]
  29. Tan, K.K.; Guo, W.Q.; Chieh, H.C.; Hagglund, T. Advances in PID Controllers; Advances in Industrial Control; Springer: London, UK, 2000. [Google Scholar]
  30. Mercader, P. Robust PID design based on QFT and convex-concave optimization. IEEE Trans. Control Syst. Technol. 2016, 25, 441–452. [Google Scholar] [CrossRef]
  31. Shang, C.; Yang, M.; You, J. A General Parallel Disturbance Controller for PMSM Drives Based on Frequency Domain Design. IEEE Trans. Ind. Electron. 2025, 72, 768–780. [Google Scholar] [CrossRef]
  32. Xia, B.; Huang, S.; Zhang, J.; Zhang, W.J.; Liao, W.; Huang, X.H.; Huang, S.D. Encoderless Deadbeat Predictive Current Control for SPMSM Drives With Online Parameter Identification. IEEE Trans. Transp. Electrif. 2025, 11, 761–773. [Google Scholar] [CrossRef]
  33. Li, Y.; Wang, C.; Hang, J.; Ding, S.C. Parallel Iron Loss Resistance Equivalent Impedance Model Method for Online Full Parameters Identification of PMSM. IEEE J. Emerg. Sel. Top. Power Electron. 2025, 13, 1783–1791. [Google Scholar] [CrossRef]
  34. Wang, P.; Zhu, Z.Q.; Liang, D.W. Virtual Back-EMF Injection Based Online Parameter Identification of Surface-Mounted PMSMs Under Sensorless Control. IEEE Trans. Ind. Electron. 2025, 72, 5579–5590. [Google Scholar] [CrossRef]
  35. Zhou, R.; Yang, M.; Shang, C.; Zeng, Q. A Frequency Domain Identification Method of General Mechanical Drive System. In Proceedings of the 2023 IEEE 4th China International Youth Conference on Electrical Engineering (CIYCEE), Chengdu, China, 8–10 December 2023; pp. 1–7. [Google Scholar]
  36. Novak, M.; Grobelna, I.; Nyman, U.; Blaabjerg, F. Application of Statistical Model Checking for Robustness Comparison of Power Electronics Controllers. In Proceedings of the 2024 IEEE 15th International Symposium on Power Electronics for Distributed Generation Systems (PEDG), Luxembourg, 18 September 2024; pp. 1–6. [Google Scholar]
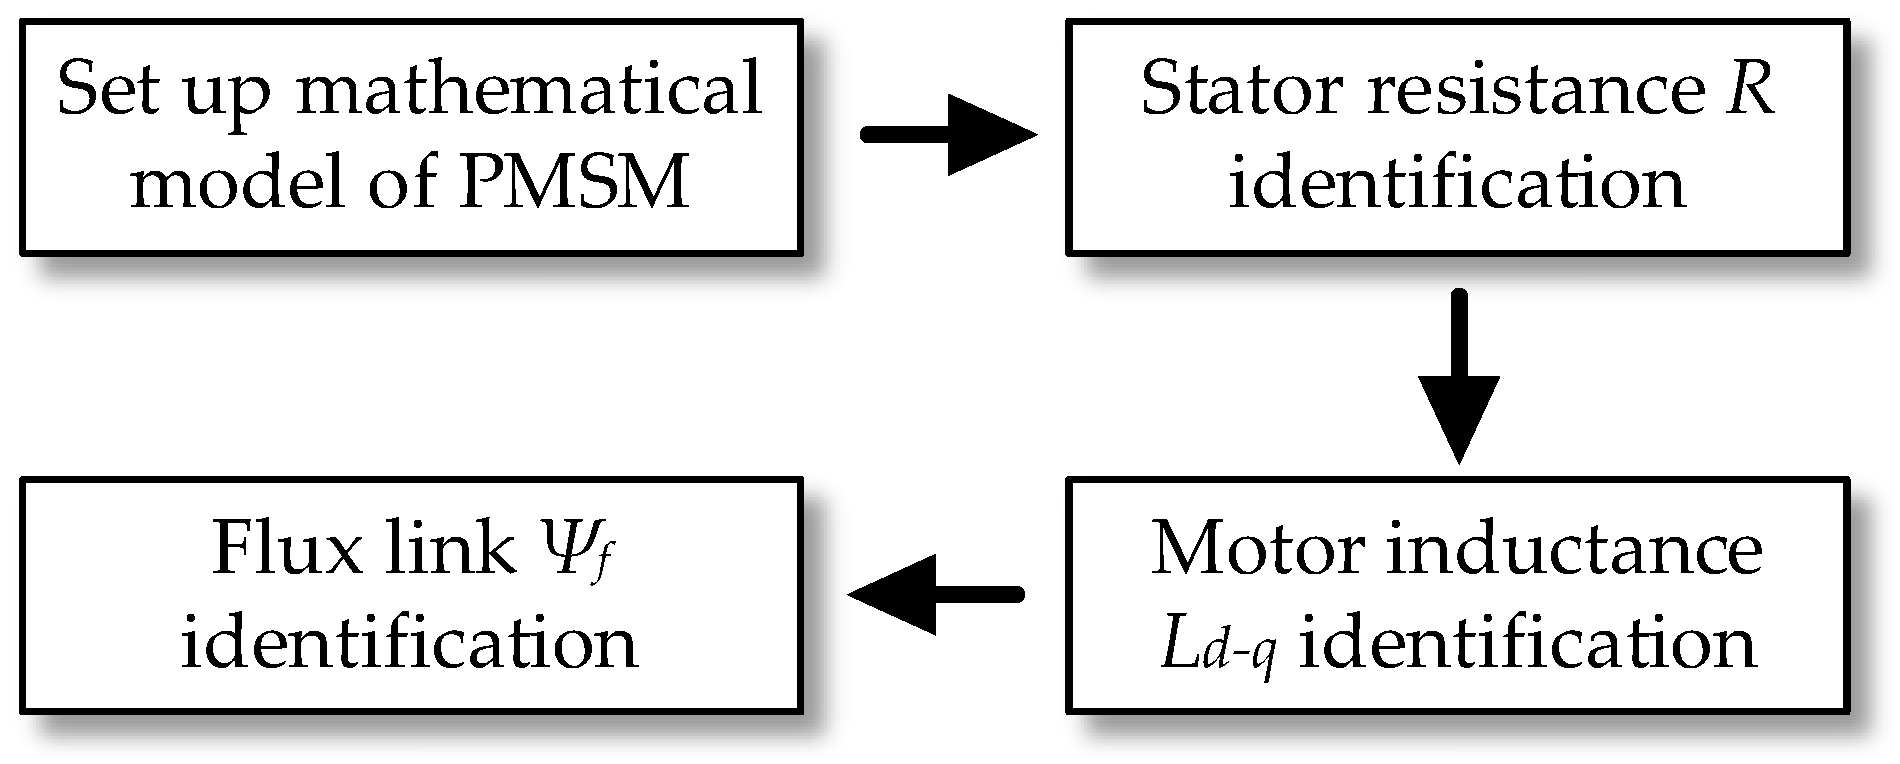
Figure 1. The sequence of parameter identification.
Energies 18 04306 g001
Figure 2. Diagram of inverter nonlinear error voltage characteristics. * means the reference signal.
Energies 18 04306 g002
Figure 3. Time-domain waveform of the proposed d-q axis voltage instruction. The red curve represents the d-axis reference voltage, while the blue curve represents the q-axis reference voltage.
Energies 18 04306 g003
Figure 4. Time-domain waveform of d-q-axis voltage instruction. The red curve represents the d-axis reference voltage, while the blue curve represents the q-axis reference voltage.
Energies 18 04306 g004
Figure 5. Software and hardware experimental platform.
Energies 18 04306 g005
Figure 6. Feedback current waveform of motors using the proposed method. (a) Motor 1. (b) Motor 2.
Energies 18 04306 g006
Figure 7. Motor speed waveform and parameter identification results. The blue curve represents the motor speed. (a) Speed waveform of Motor 1. (b) Parameter identification results of Motor 1. (c) Speed waveform of Motor 2. (d) Parameter identification results of Motor 2.
Energies 18 04306 g007
Figure 8. Feedback current waveform of motors using traditional method. (a) Motor 1. (b) Motor 2.
Energies 18 04306 g008
Figure 9. Uq and iq waveforms of motors using traditional method. (a) Motor 1. (b) Motor 2.
Energies 18 04306 g009
Figure 10. Current loop plant diagram. * denotes the reference signal.
Energies 18 04306 g010
Figure 11. Block diagram of the frequency sweep strategy. * denotes the reference signal, the red cross marks indicate loop disconnection.
Energies 18 04306 g011
Figure 12. Frequency characteristics of open-loop curve under different RL mismatch. The red and green shades represent the primary influence ranges of KR and KL on the curve, respectively.
Energies 18 04306 g012
Figure 13. TΣ identification tests with various R and L values. (a) Motor 1. (b) Motor 2.
Energies 18 04306 g013
Figure 14. Effect of KR on analysis and correction. (a) The influence of KR on Kadj. (b) The influence of KR on ΔKadj.
Energies 18 04306 g014
Figure 15. The Bode plots of the current loop before and after controller parameter adjustment. (a) Open loop. (b) Closed loop.
Energies 18 04306 g015
Figure 16. Square wave response experiments under different parameter conditions. (a) KL = 0.94, KR = 1.08. (b) KL = 1.04, KR = 0.98. (c) After adjustment.
Energies 18 04306 g016
Figure 17. The Bode plots of the current loop under various normalized gain. (a) Open loop. (b) Closed loop.
Energies 18 04306 g017
Figure 18. Square wave response experiments under different normalized gain. (a) γ = 0.35. (b) γ = 0.65. (c) γ = 0.5.
Energies 18 04306 g018
Figure 19. Flowchart of the proposed algorithm in this paper.
Energies 18 04306 g019
Table 1. Key parameters of the hardware platforms.
Key ParameterMotor 1Motor 2
Stator resistance0.063 Ω0.232 Ω
d-q axis inductance0.13 mH0.31 mH
Rated torque2.39 N·m1.92 N·m
Rated current7.07 A6.54 A
Rated speed3000 rpm2800 rpm
Power750 W600 W
Motor inertia1.64 × 10−4 kg·m23.62 × 10−4 kg·m2
Pole pairs54
Table 2. Motor parameter identification results based on the proposed algorithm.
ParameterMotor 1Motor 2
R0.068 Ω0.231 Ω
R error7.936%0.431%
Ld/mH0.125 mH0.295 mH
Ld error3.846%4.839%
Lq/mH0.129 mH0.324 mH
Lq error0.769%4.516%
Table 3. Motor parameter identification results based on the conventional method.
ParameterMotor 1Motor 2
R0.069 Ω0.234 Ω
R error9.524%0.862%
Ld/mH0.121 mH0.353 mH
Ld error6.923%13.87%
Lq/mH0.137 mH0.284 mH
Lq error5.372%8.46%
Table 4. Frequency-domain metrics of the open- and closed-loop systems under different cases.
Parameter Matching DegreeCutoff FrequencyBandwidth
Case 1: KL = 0.94, KR = 1.08807.2 Hz1231.8 Hz
Case 2: KL = 1.04, KR = 0.981532.6 Hz1785.4 Hz
After Adjustment1186.4 Hz1446.5 Hz
Table 5. Frequency-domain metrics of the open- and closed-loop systems under different γ.
Normalized GainCutoff FrequencyBandwidth
γ = 0.35764.6 Hz810.4 Hz
γ = 0.51186.4 Hz1446.5 Hz
γ = 0.651623.8 Hz1843.0 Hz
Disclaimer/Publisher’s Note: The statements, opinions and data contained in all publications are solely those of the individual author(s) and contributor(s) and not of MDPI and/or the editor(s). MDPI and/or the editor(s) disclaim responsibility for any injury to people or property resulting from any ideas, methods, instructions or products referred to in the content.