Article

Artificial Intelligence in Assessing Electricity and Water Demand in Oilseed Processing

1
Institute of Mechanical Engineering, Warsaw University of Life Sciences, 166 Nowoursynowska St., 02-787 Warsaw, Poland
2
Faculty of Electrical and Computer Engineering, Cracow University of Technology, 24 Warszawska St., 31-155 Krakow, Poland
*
Author to whom correspondence should be addressed.
Energies 2025, 18(16), 4300; https://doi.org/10.3390/en18164300
Submission received: 5 June 2025 / Revised: 17 July 2025 / Accepted: 7 August 2025 / Published: 12 August 2025

Abstract

The aim of this study was to explore the use of neural networks as a decision-support tool for sustainable oilseed processing. The investigation focused on how different production profiles (crude vegetable oil, refined oil, hydrogenated oil and margarine) affect electricity and water use in selected Polish processing plants. The collected data were first grouped with cluster analysis to identify similar operational cases. The clusters were then visualized with a Self-Organizing Map (SOM), producing a two-dimensional topological feature map. This analysis indicated a subset of data for which it was appropriate to build predictive models of electricity and water consumption. Multi-layer perceptron (MLP) neural networks yielded highly accurate predictions of electricity (R2 = 0.967 on the test set) and water (R2 = 0.967 on the test set) use in oilseed processing. The resulting models can assist in selecting the most energy- and water-efficient processing configuration.

1. Introduction

Technological advances are giving rise to smart energy systems that combine conventional and innovative energy solutions with Internet-of-Things (IoT) and artificial intelligence (AI) technologies. Such systems diversify energy sources and enable the optimal consumption of energy carriers and process water under the most favorable production conditions. In the search for optimal solutions, high-quality input data and precise, comprehensive energy demand modeling tools are essential. The reviews by Majidi et al. [1] and Wang et al. [2] survey the tools currently in use and assess their suitability for future smart energy applications. The choice of tool depends on the specific requirements of the system in question. Smart energy systems seek to improve production efficiency in line with sustainability principles while lowering the cost of energy procurement and use, which calls for innovative modeling approaches. Key objectives include optimizing energy consumption, predicting the variability of renewable energy supply, balancing loads, and refining resource allocation strategies. The continuous evolution of such systems therefore poses new challenges: modeling tools must be adapted and updated, and detailed, industry-specific input databases, such as those for the agri-food sector must be developed. Energy efficiency is defined as the ratio of the quantity of raw material processed (or product obtained) to the amount of energy consumed in the production process. It can also be expressed through specific energy consumption indicators that take account of plant-specific data. In practice, improving energy efficiency involves reducing the use of energy carriers during conversion, transmission, and end-use stages through technological upgrades or organizational changes. Such rationalization should maintain or even increase production output while cutting energy demand. This approach simultaneously enhances environmental performance by conserving energy, lowering the use of natural resources, reducing pollutant emissions, and decreasing the mass of waste generated at each stage of raw material processing [3,4,5,6,7]. Oilseeds are processed both for food use and for technical applications such as heating or biodiesel production [8,9]. It is noteworthy that, to date, no studies have applied artificial intelligence to support the sustainable processing of oilseeds.

2. Analysis of Oilseed Processing

Energy carrier consumption in oilseed-processing plants depends primarily on the scale and product mix of operations. Additional determinants include raw material quality, the processing technologies employed, the level of mechanization, and the degree of capacity utilization. Figure 1 presents a simplified flow diagram of energy carrier transformations within such plants, together with the ranges of specific energy consumption indicators used to evaluate plant efficiency; points of energy loss are also indicated [10].
The indicators shown in Figure 1 mean, respectively, the following:
Wc—plant rate of unit heat consumption per day (Wc = AC∙Z−1), [GJ/103 kg] seeds.
We—plant rate of unit consumption of electricity for a daily period (We = Ae∙Z−1), [kWh/103 kg] seeds.
Ww—plant rate of unit consumption of water for a daily period (Ww = Aw∙Z−1), [m3/103 kg] seeds.
WT—technological rate of unit consumption of energy carrier or water.
WP—production rate of unit consumption of energy carrier or water.
WZ—plant rate of unit consumption of energy carrier or water.
AC—daily heat consumption (AC = Brz  Q W r where Brz is real fuel consumption;  Q W r —calorific value of the fuel) [GJ/24 h].
Ae—daily consumption of active electricity [kWh/24 h].
Aw—daily water consumption [m3/24 h].
Z—daily processing of oilseeds [103 kg/24 h].
Measurements for the present study were taken at six oilseed-processing plants during the summer. For each facility, data sets were compiled for 50 consecutive 24 h operating periods. At the time of the survey, the sector’s annual processing capacity totalled approximately 800 × 103 thousand kg of oilseeds, of which the surveyed plants accounted for 720 × 103 thousand kg. The preliminary statistical analysis involved fitting stepwise regression equations to the data. Previous studies [6,11,12,13] have documented similar trends in the energy intensity of oilseed-processing plants. Table 1 and Table 2 summarize the main characteristics of the facilities investigated.
The indicators in Table 1 mean, respectively, the following:
  • At1—total energy consumption (considering the conversion rate 1 kWh = 12 MJ, At1 = 0.012Ae + Ac) [GJ/24 h].
  • At2—total energy consumption (considering the conversion rate 1 kWh = 3.6 MJ, At2 = 0.0036Ae + Ac) [GJ/24 h].
The indicators in Table 2 mean, respectively, the following:
Wt1—the plant’s total unit energy consumption rate (including recalculation 1 kWh = 12.0 MJ) [GJ/103 kg seeds].
Wt2—the plant’s total unit energy consumption rate (including recalculation 1 kWh = 3.6 MJ) [GJ/103 kg seeds].
EEe—the energy efficiency ratio for electricity [kg seeds/kWh].
For a robust evaluation of a given processing technology’s energy performance, analysts should rely on a plant-wide energy consumption indicator that captures the total energy use of the facility. The metrics reported in this study therefore provide a basis for benchmarking other oilseed-processing plants with comparable production technologies and analytical methodologies [7,14]. Total energy consumption At2 represents a straightforward unit conversion and does not account for the processes involved in converting primary fuels into electricity. In contrast, total energy consumption At1 includes losses associated with electricity generation in utility-scale power plants and its transmission to end users. Under Polish conditions, more than 60% of electricity is generated in coal-fired power plants. A comparison between At1 and At2 values, as well as their corresponding specific energy consumption indicators Wt1 and Wt2, highlights the potential for electricity savings when energy is produced directly on-site, for example, from renewable energy sources. Table 3 summarizes plant-level water use and wastewater discharge—parameters that are critical to the sector’s environmental footprint.
The values Z, Z1 and Z4 showed no significant effect on the dependent variable. The indicators in Table 3 mean, respectively, the following:
S1—the total area of land owned by the production plant [m2].
P1—installed power of extrusion equipment [kW].
P2—installed capacity of plant auxiliary equipment [kW].
Z—daily seed processing [103 kg/24 h].
Z1—daily refined oil production [103 kg/24 h].
Z2—daily crude oil production [103 kg/24 h].
Z3—daily hydrogenated oil production of [103 kg/24 h].
Z4—daily margarine production [103 kg/24 h].
Because oilseeds are processed into many different product streams, it is essential to identify the causes of variation in energy intensity while concurrently accounting for water consumption and seeking conditions that maximize overall process efficiency. Accordingly, the authors examined the determinants of plant-wide energy intensity, recognizing their links to the environmental profiles of the employed technologies and to quantitative impact assessments [6,13,15,16].

3. Data Analysis

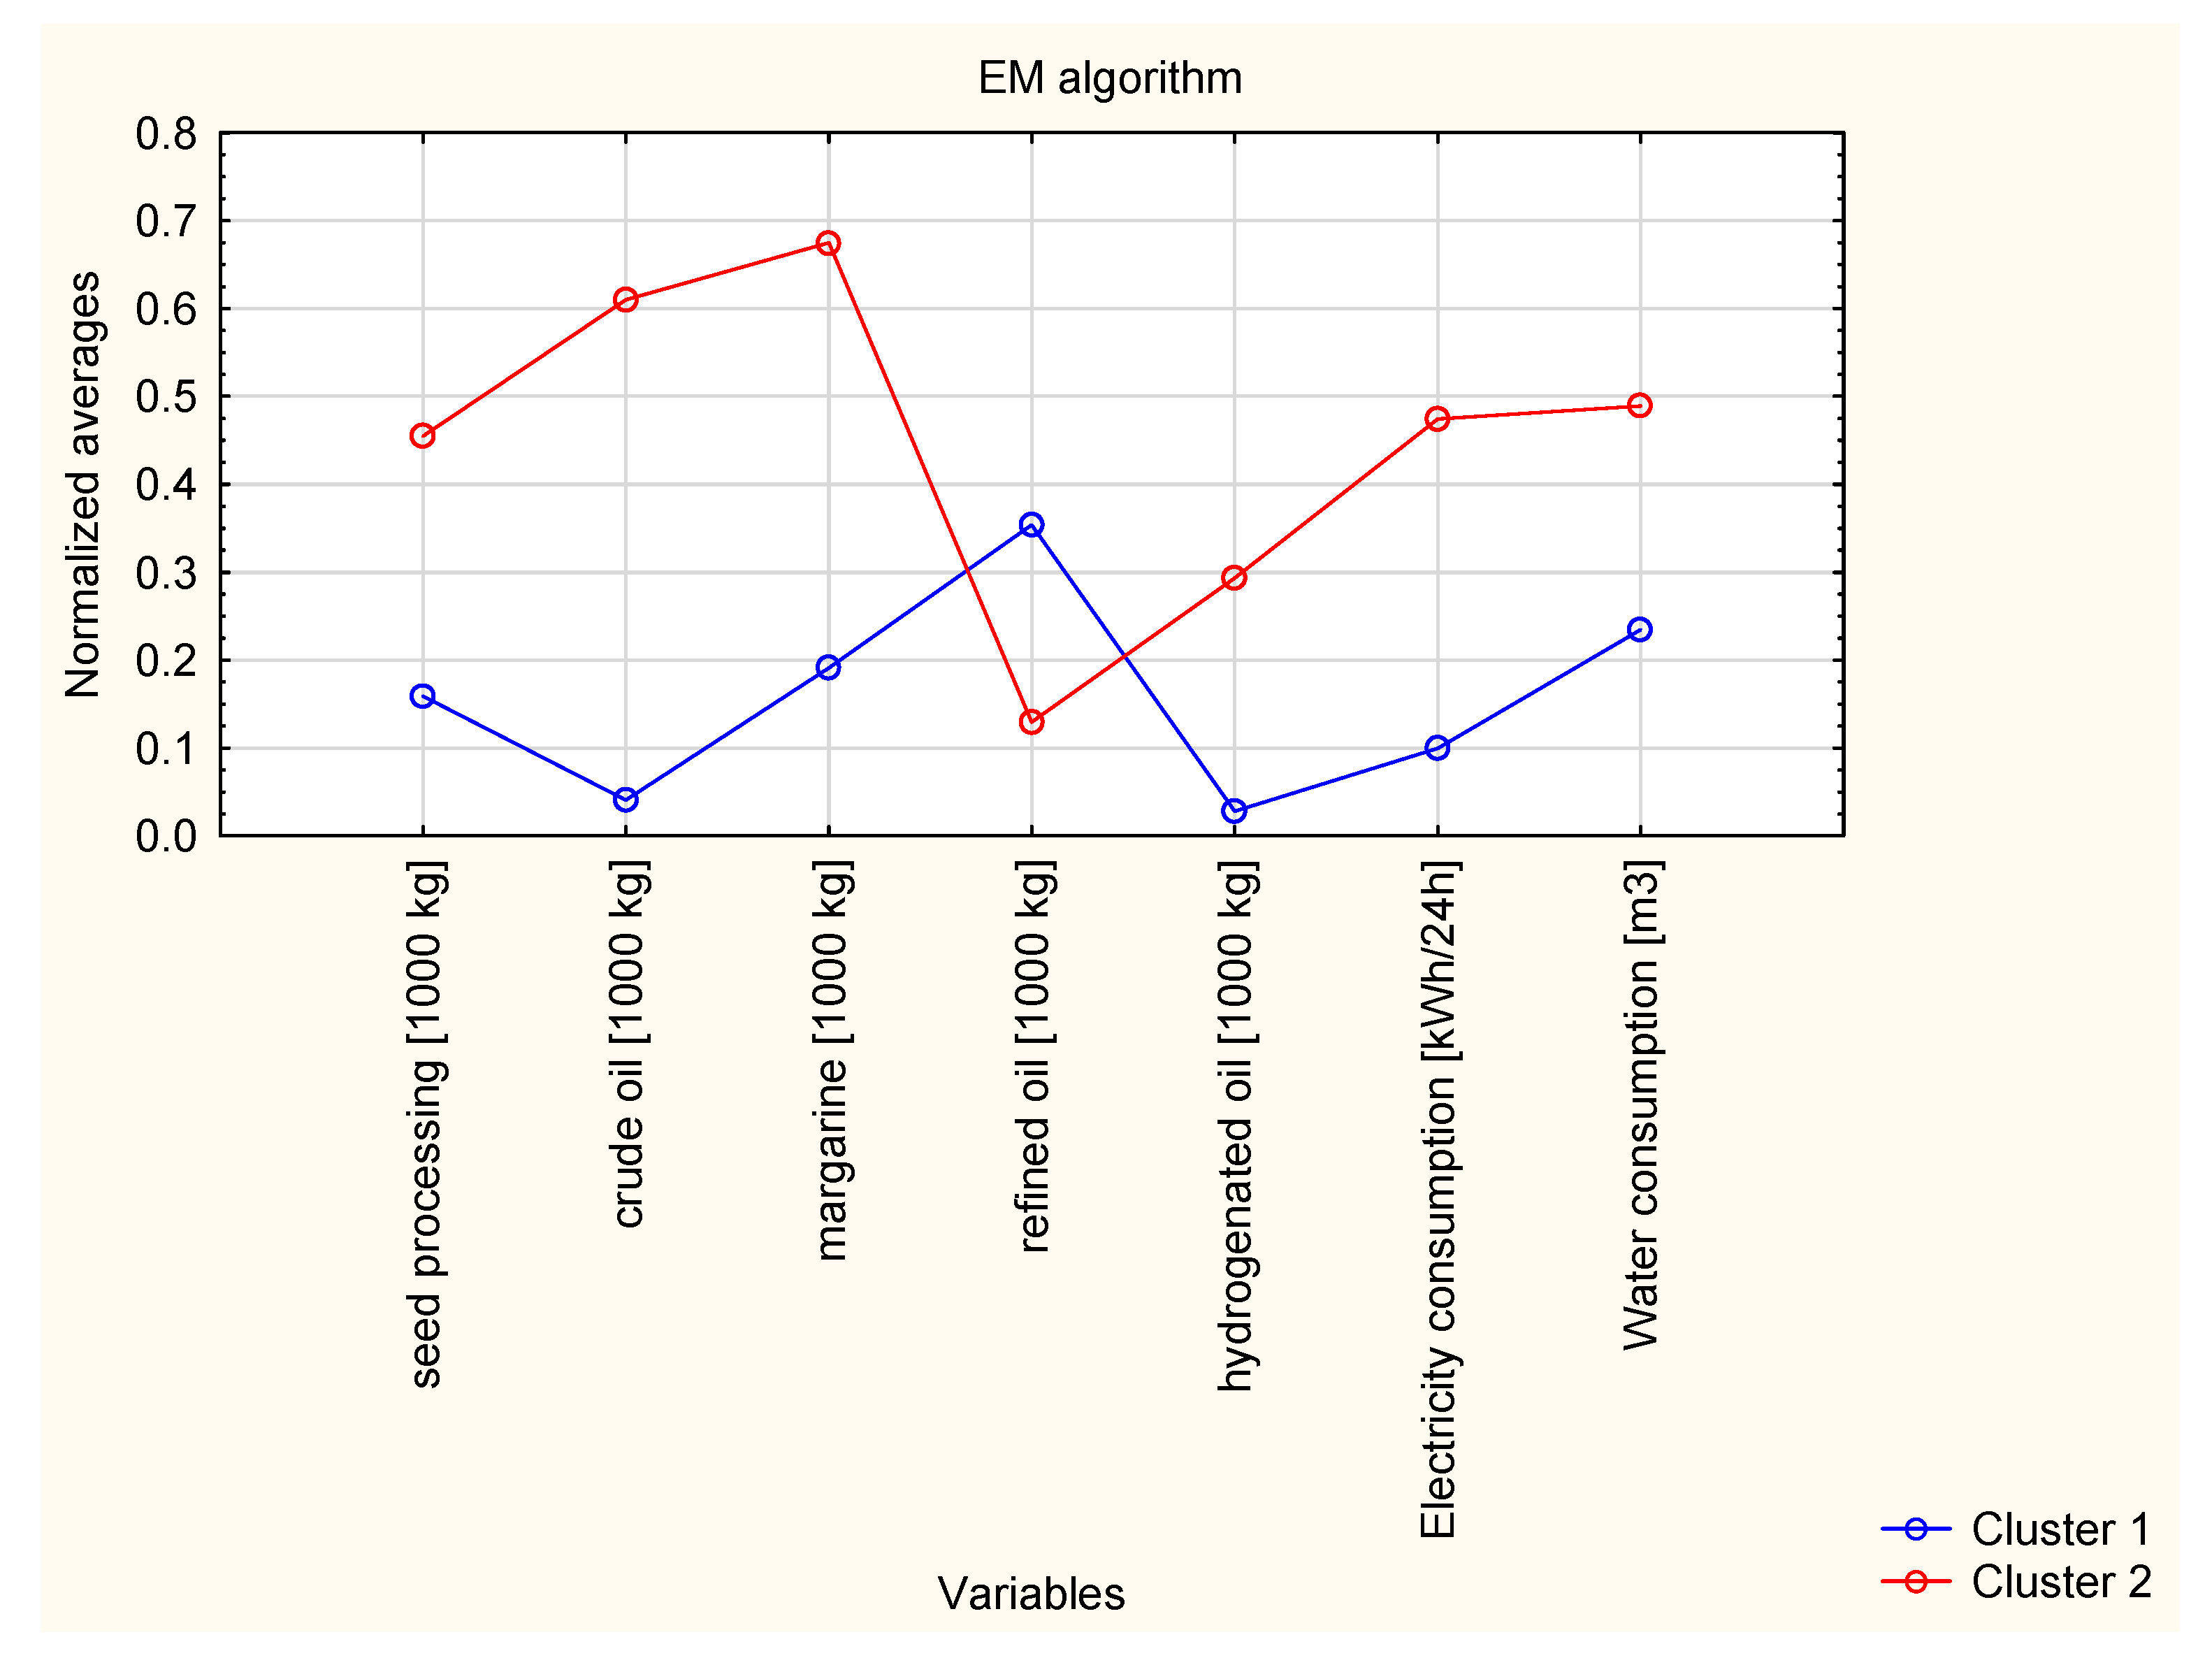
In order to identify groups of similar operational profiles in oilseed processing, 224 data points were analyzed with a non-hierarchical cluster-analysis technique based on the Expectation–Maximization (EM) algorithm [17]. In the study, 10-fold cross-validation was applied. The optimal number of clusters was determined using a cost sequence plot, where a minimum relative decrease of 5% was used as the selection criterion. As a result, two clusters were identified (Figure 2).
Cluster 1 (n = 106) corresponds to production runs with elevated outputs of margarine and refined oil, i.e., operation close to the plant’s minimum processing capacity. Under these conditions the mean daily consumptions were 13,921.7 [kWh] of electricity and 1553.6 [m3] of water. Cluster 2 (n = 118) represents periods of high seed throughput and a full product portfolio: high outputs of crude oil and margarine and moderate outputs of refined and hydrogenated oils. The corresponding mean daily consumptions rose to 66,362.2 kWh of electricity and 2838.6 [m3] of water.
To visualize and explore the 224-record data set, we employed a Self-Organizing Map (SOM, or Kohonen network). The training algorithm positions records that describe similar operating conditions close to one another, thereby producing a topologically ordered, two-dimensional map. This arrangement facilitates the discovery of clusters, the construction of hierarchical relationships, the extraction of salient features from high-dimensional spaces, and the detection of novel patterns. The SOM was trained on five input variables: seed throughput and the daily outputs of crude, refined and hydrogenated oils, and margarine. After training, each production case was mapped onto the SOM’s output layer—the two-dimensional lattice itself. The size of the topological map is determined based on the number of training samples, and the number of map units should not exceed the number of training instances. Subsequently, progressively smaller map sizes are tested, and the one with the fewest empty units and the highest network quality is selected. Trial runs showed that a 14 × 14 grid yielded the lowest quantization and topographic errors and was therefore adopted for further analysis (Figure 3).
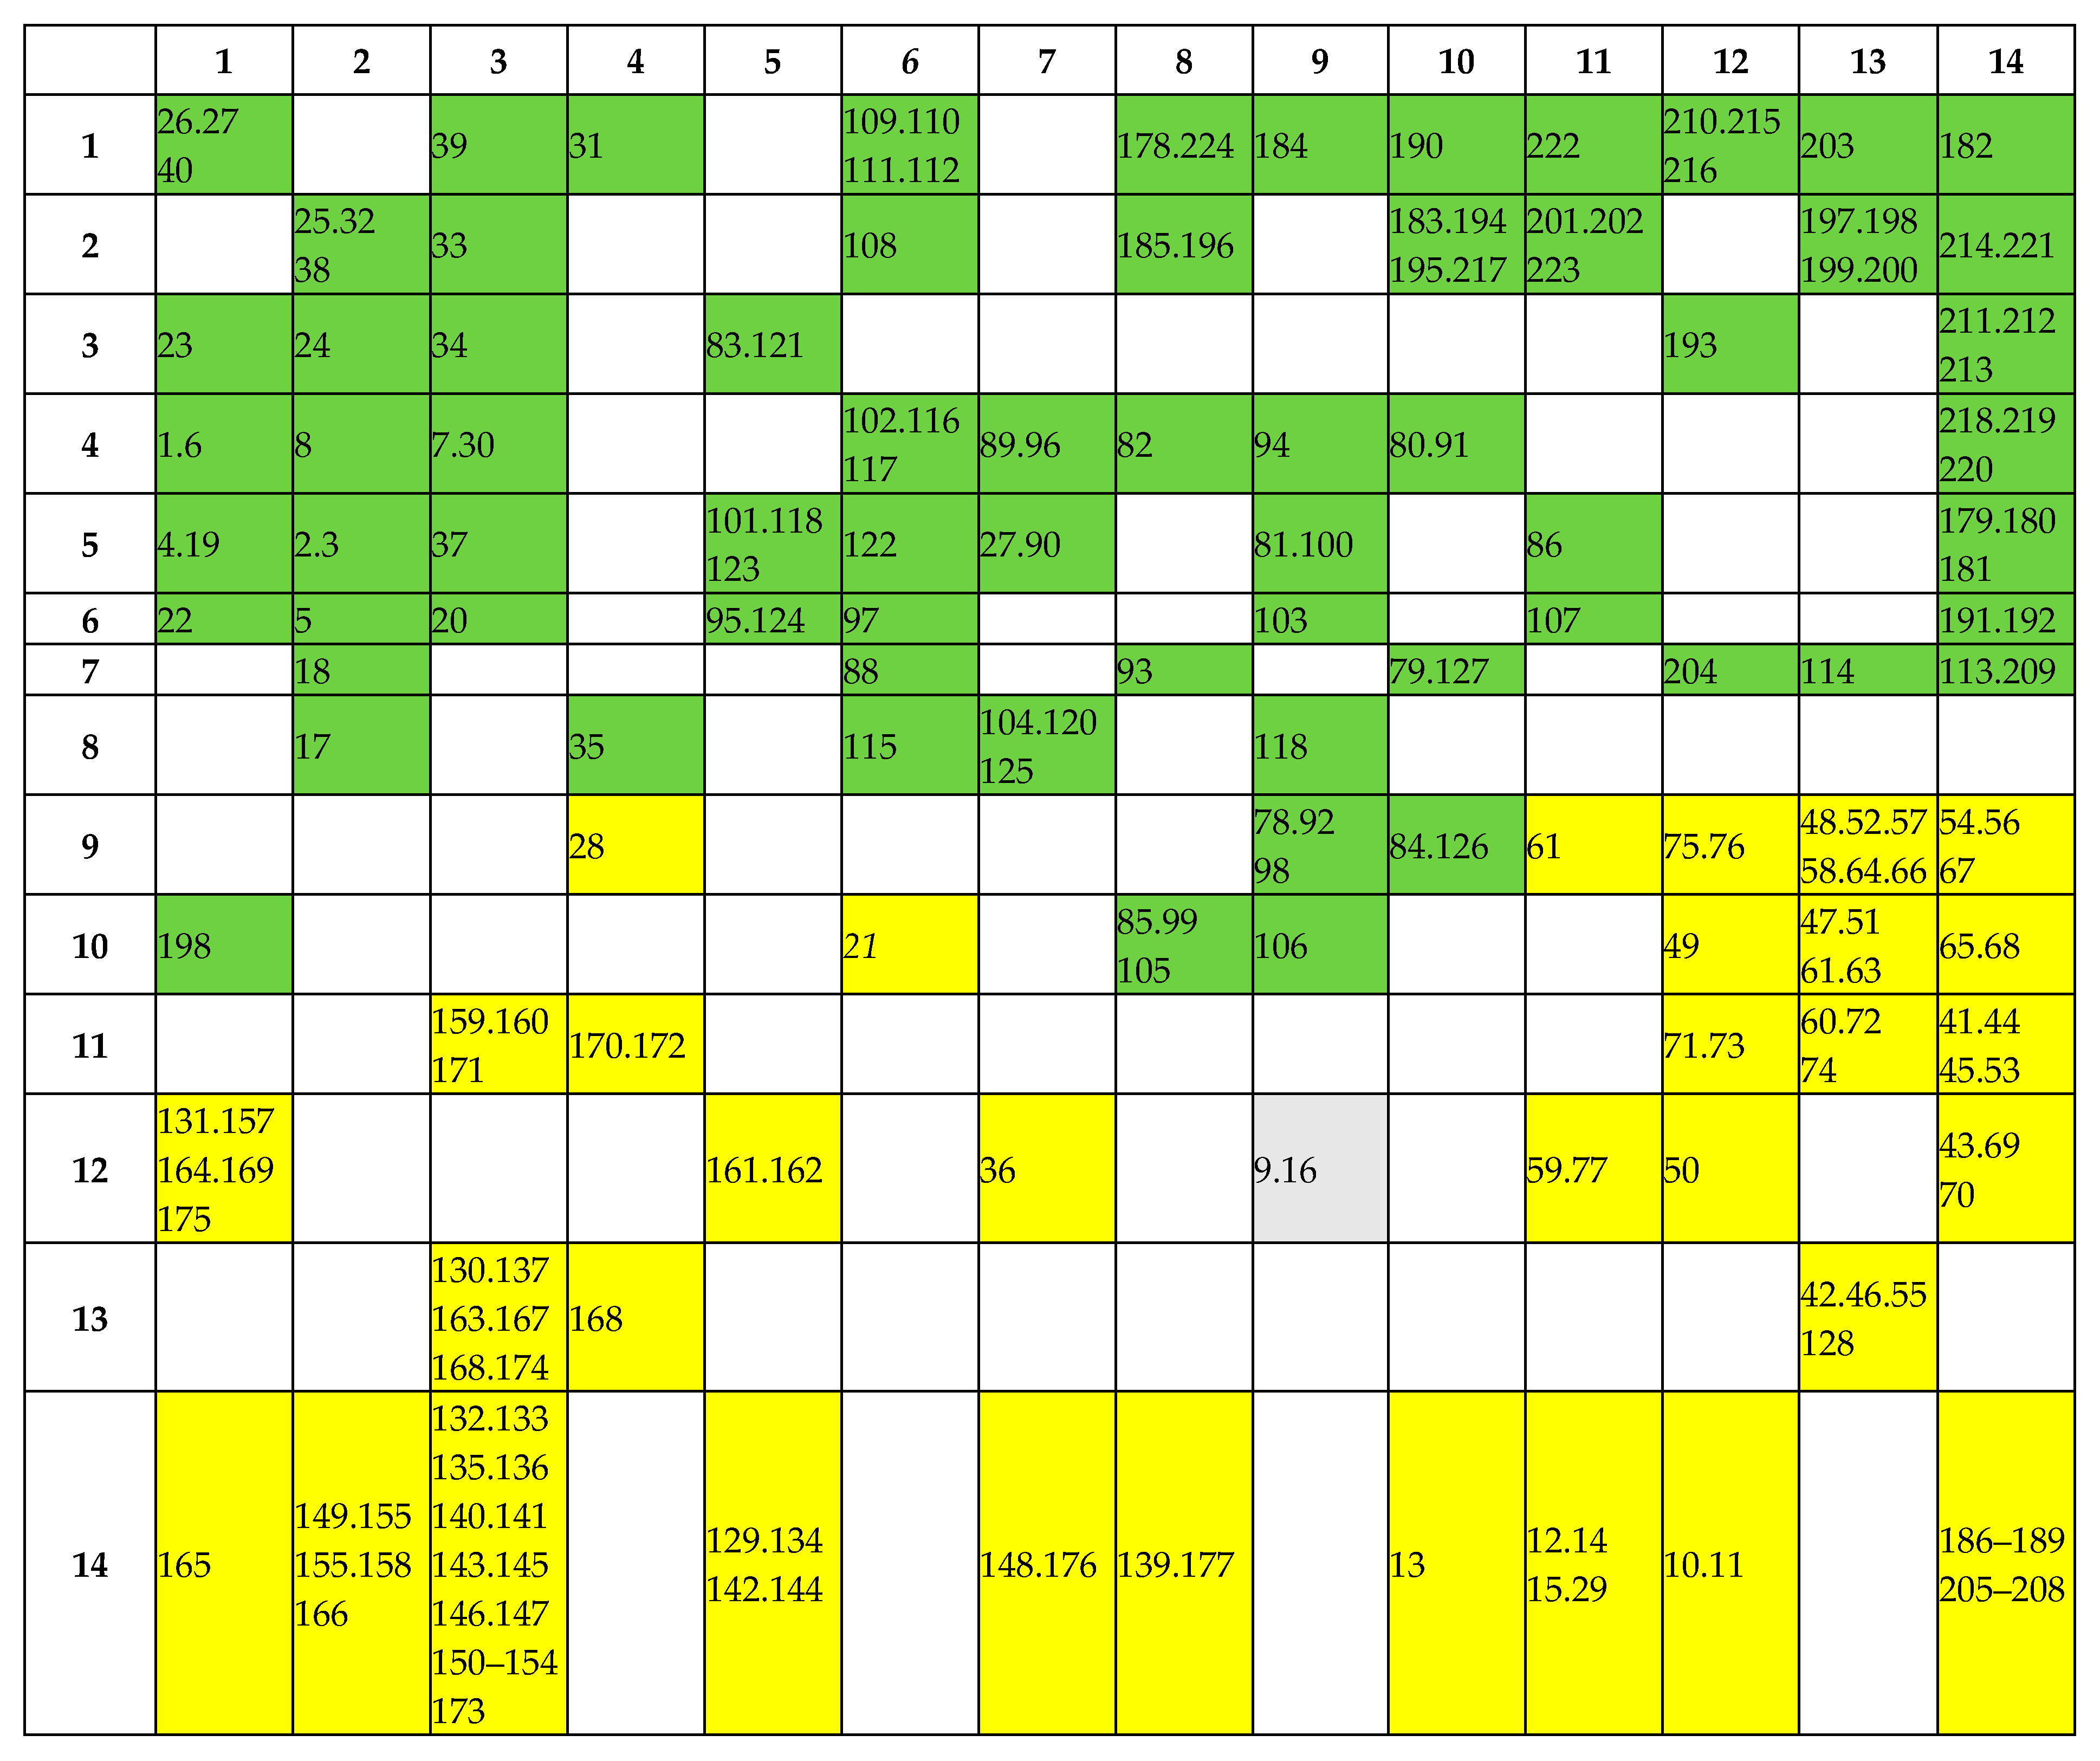
Classification performance for the regression task was assessed with the SOM clustering error calculated for the training and test sets. Among the network architectures examined, the 14 × 14 Self-Organizing Feature Map (SOFM 5-196) achieved the lowest clustering errors: 0.000808 for the training set and 0.008548 for the test set (the clustering error is defined as the sum of Euclidean distances between the records in a cluster and their centroid). Figure 4 presents the topological map generated in Statistica v. 13 [18]. Shading indicates each neuron’s occupancy frequency, and symbols show the locations of cases belonging to clusters 1 and 2 identified in the earlier EM-based cluster analysis. The map reveals that cluster 1 is concentrated mainly in the lower half, whereas cluster 2 occupies the upper half. The high-occupancy neurons in the lower region indicate lower internal diversity within cluster 1 compared with cluster 2.
We next examined how electricity consumption is distributed across the (SOM) lattice. Three consumption bands were defined:
  • Below average—from the observed minimum to the overall mean (21,000–66,362.2 [kWh/day]).
  • Average—from the median to the overall mean (56,480–66,362.2 [kWh/day]).
  • Above average—from the overall mean to the observed maximum (66,362.2–139,300 [kWh]/day).
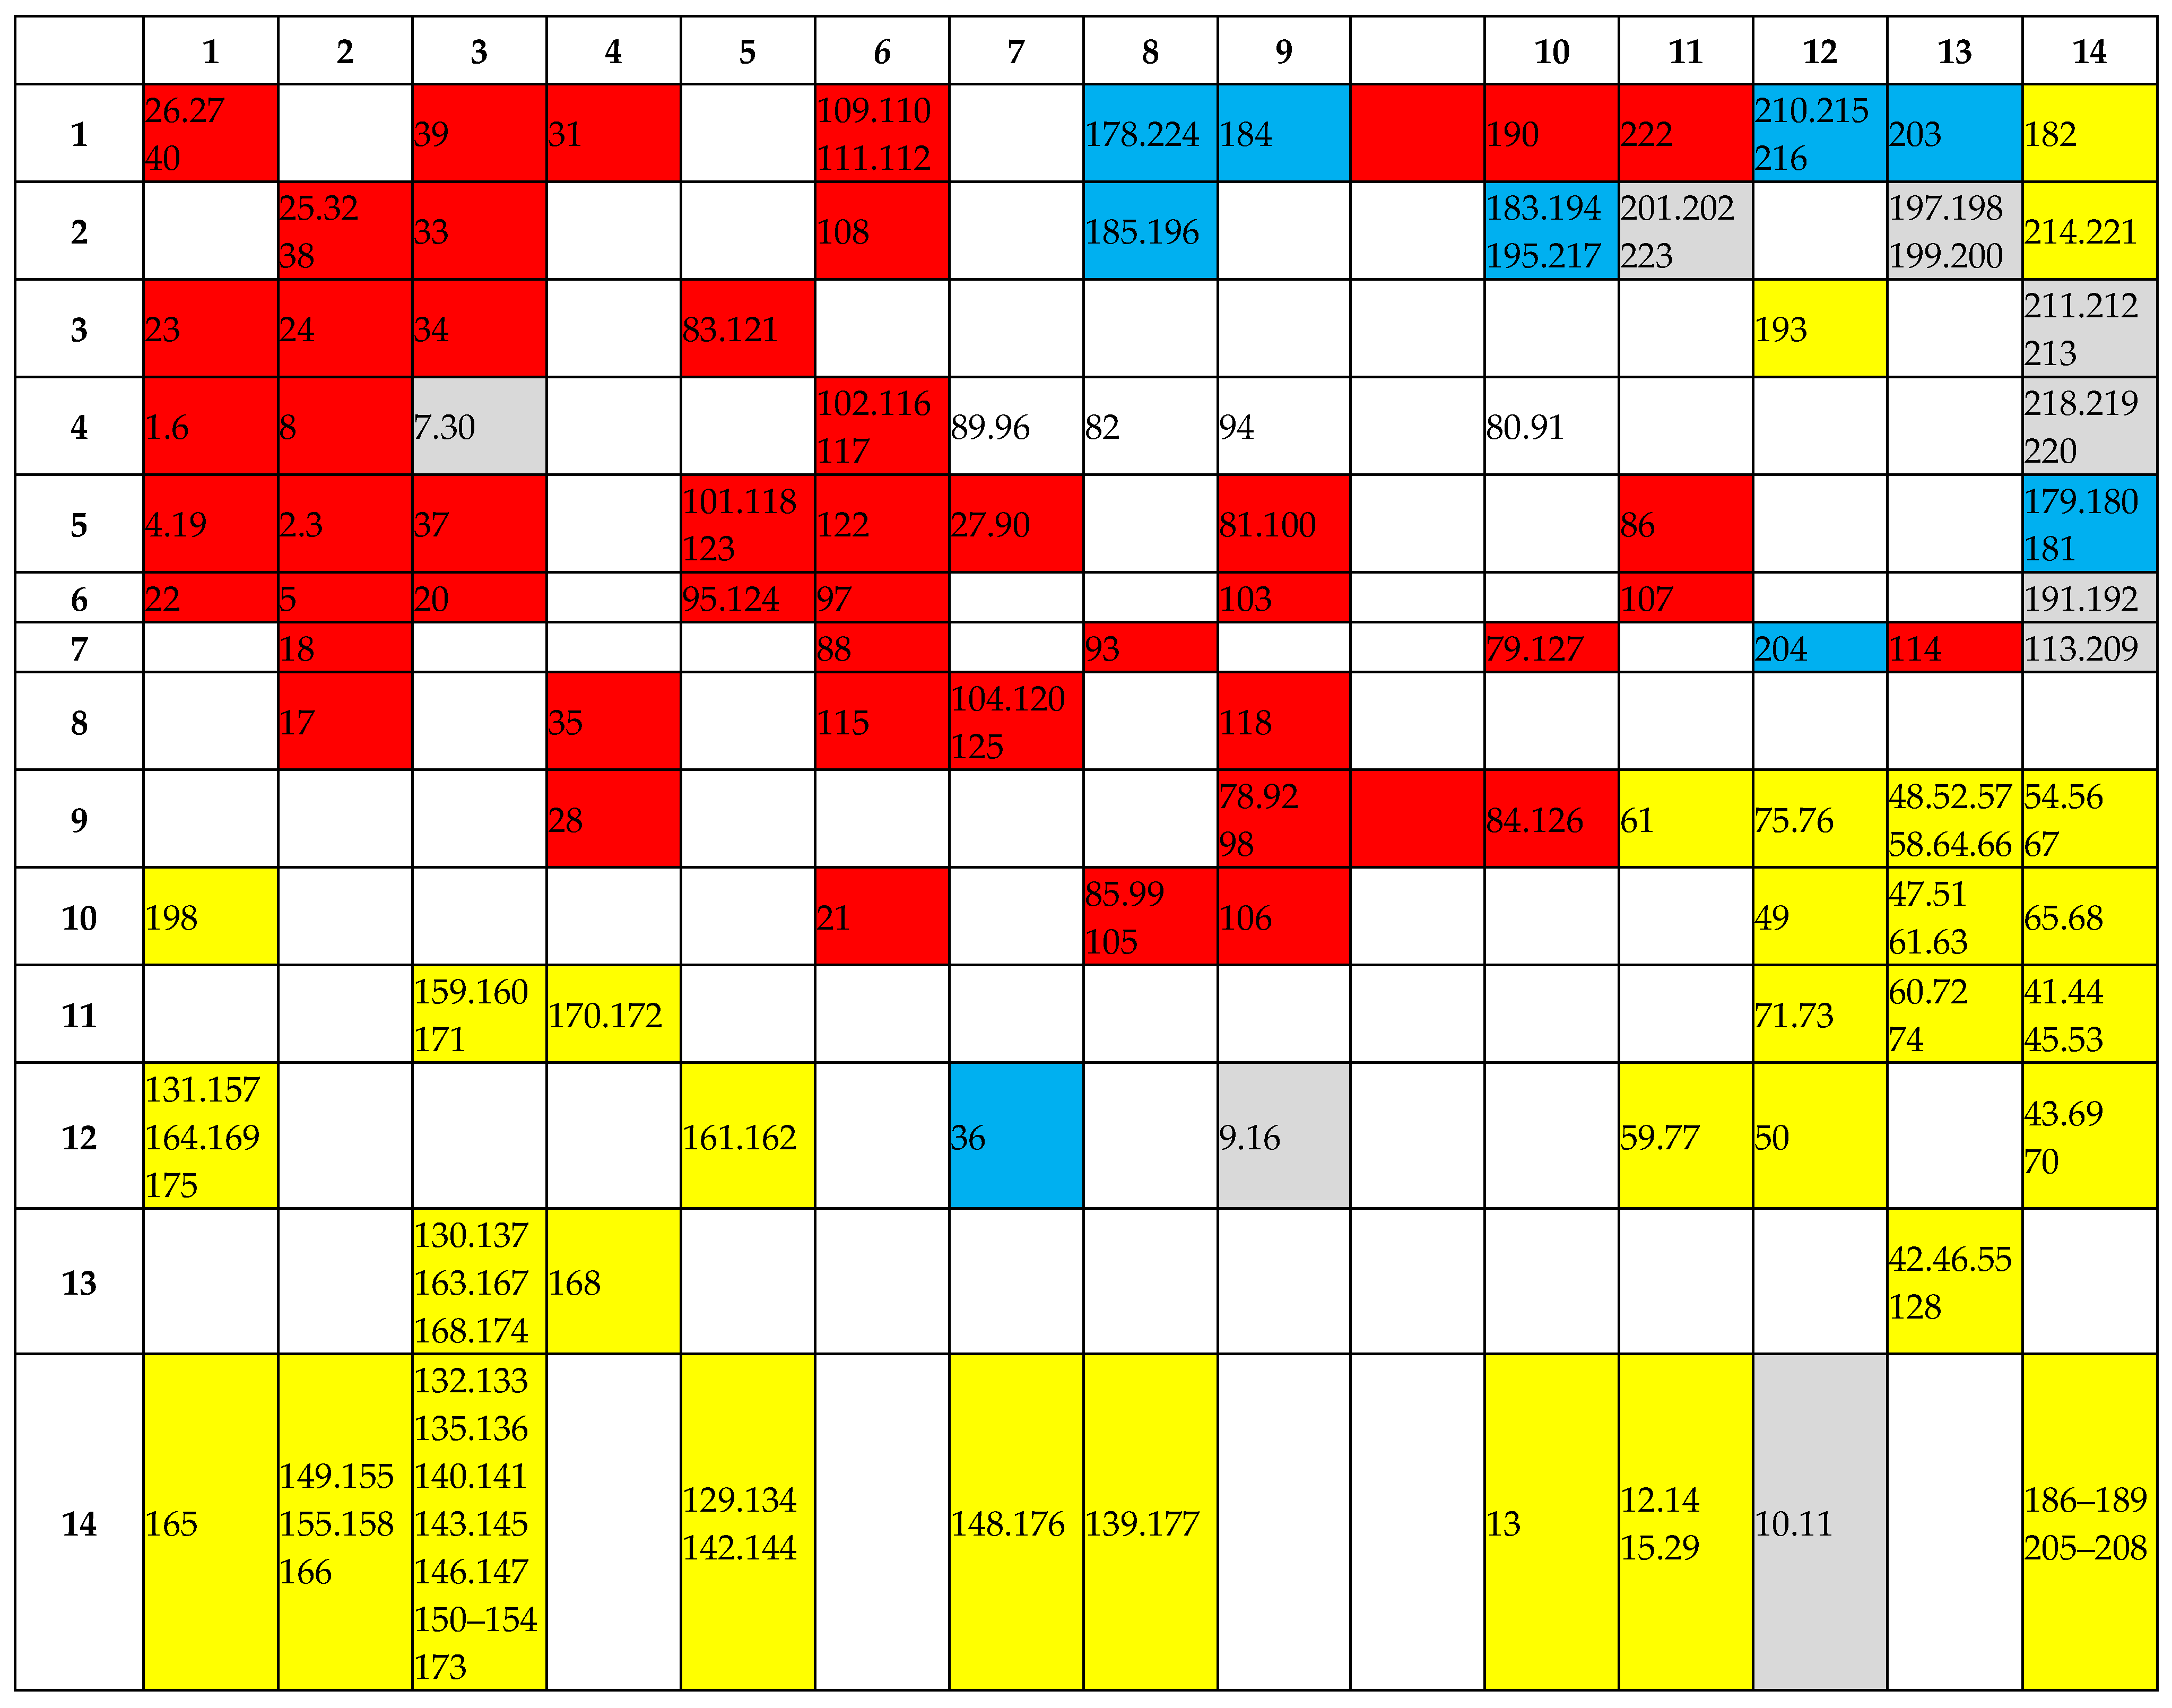
The results are visualized in Figure 5. The map shows that electricity use variability is the greatest in cluster 2, whereas cluster 1 displays markedly lower variability (indicated by the predominantly yellow shading) and contains many high-occupancy neurons whose cases share similar consumption values.
We then examined water consumption patterns across the (SOM) lattice. Three consumption bands were defined:
  • Below average—from the observed minimum to the overall mean (275–2838.6 [m3] day−1).
  • Average—from the median to the overall mean (1910–2838.6 m3 day−1).
  • Above average—from the overall mean to the observed maximum (2838.6–5880 [m3] day−1).
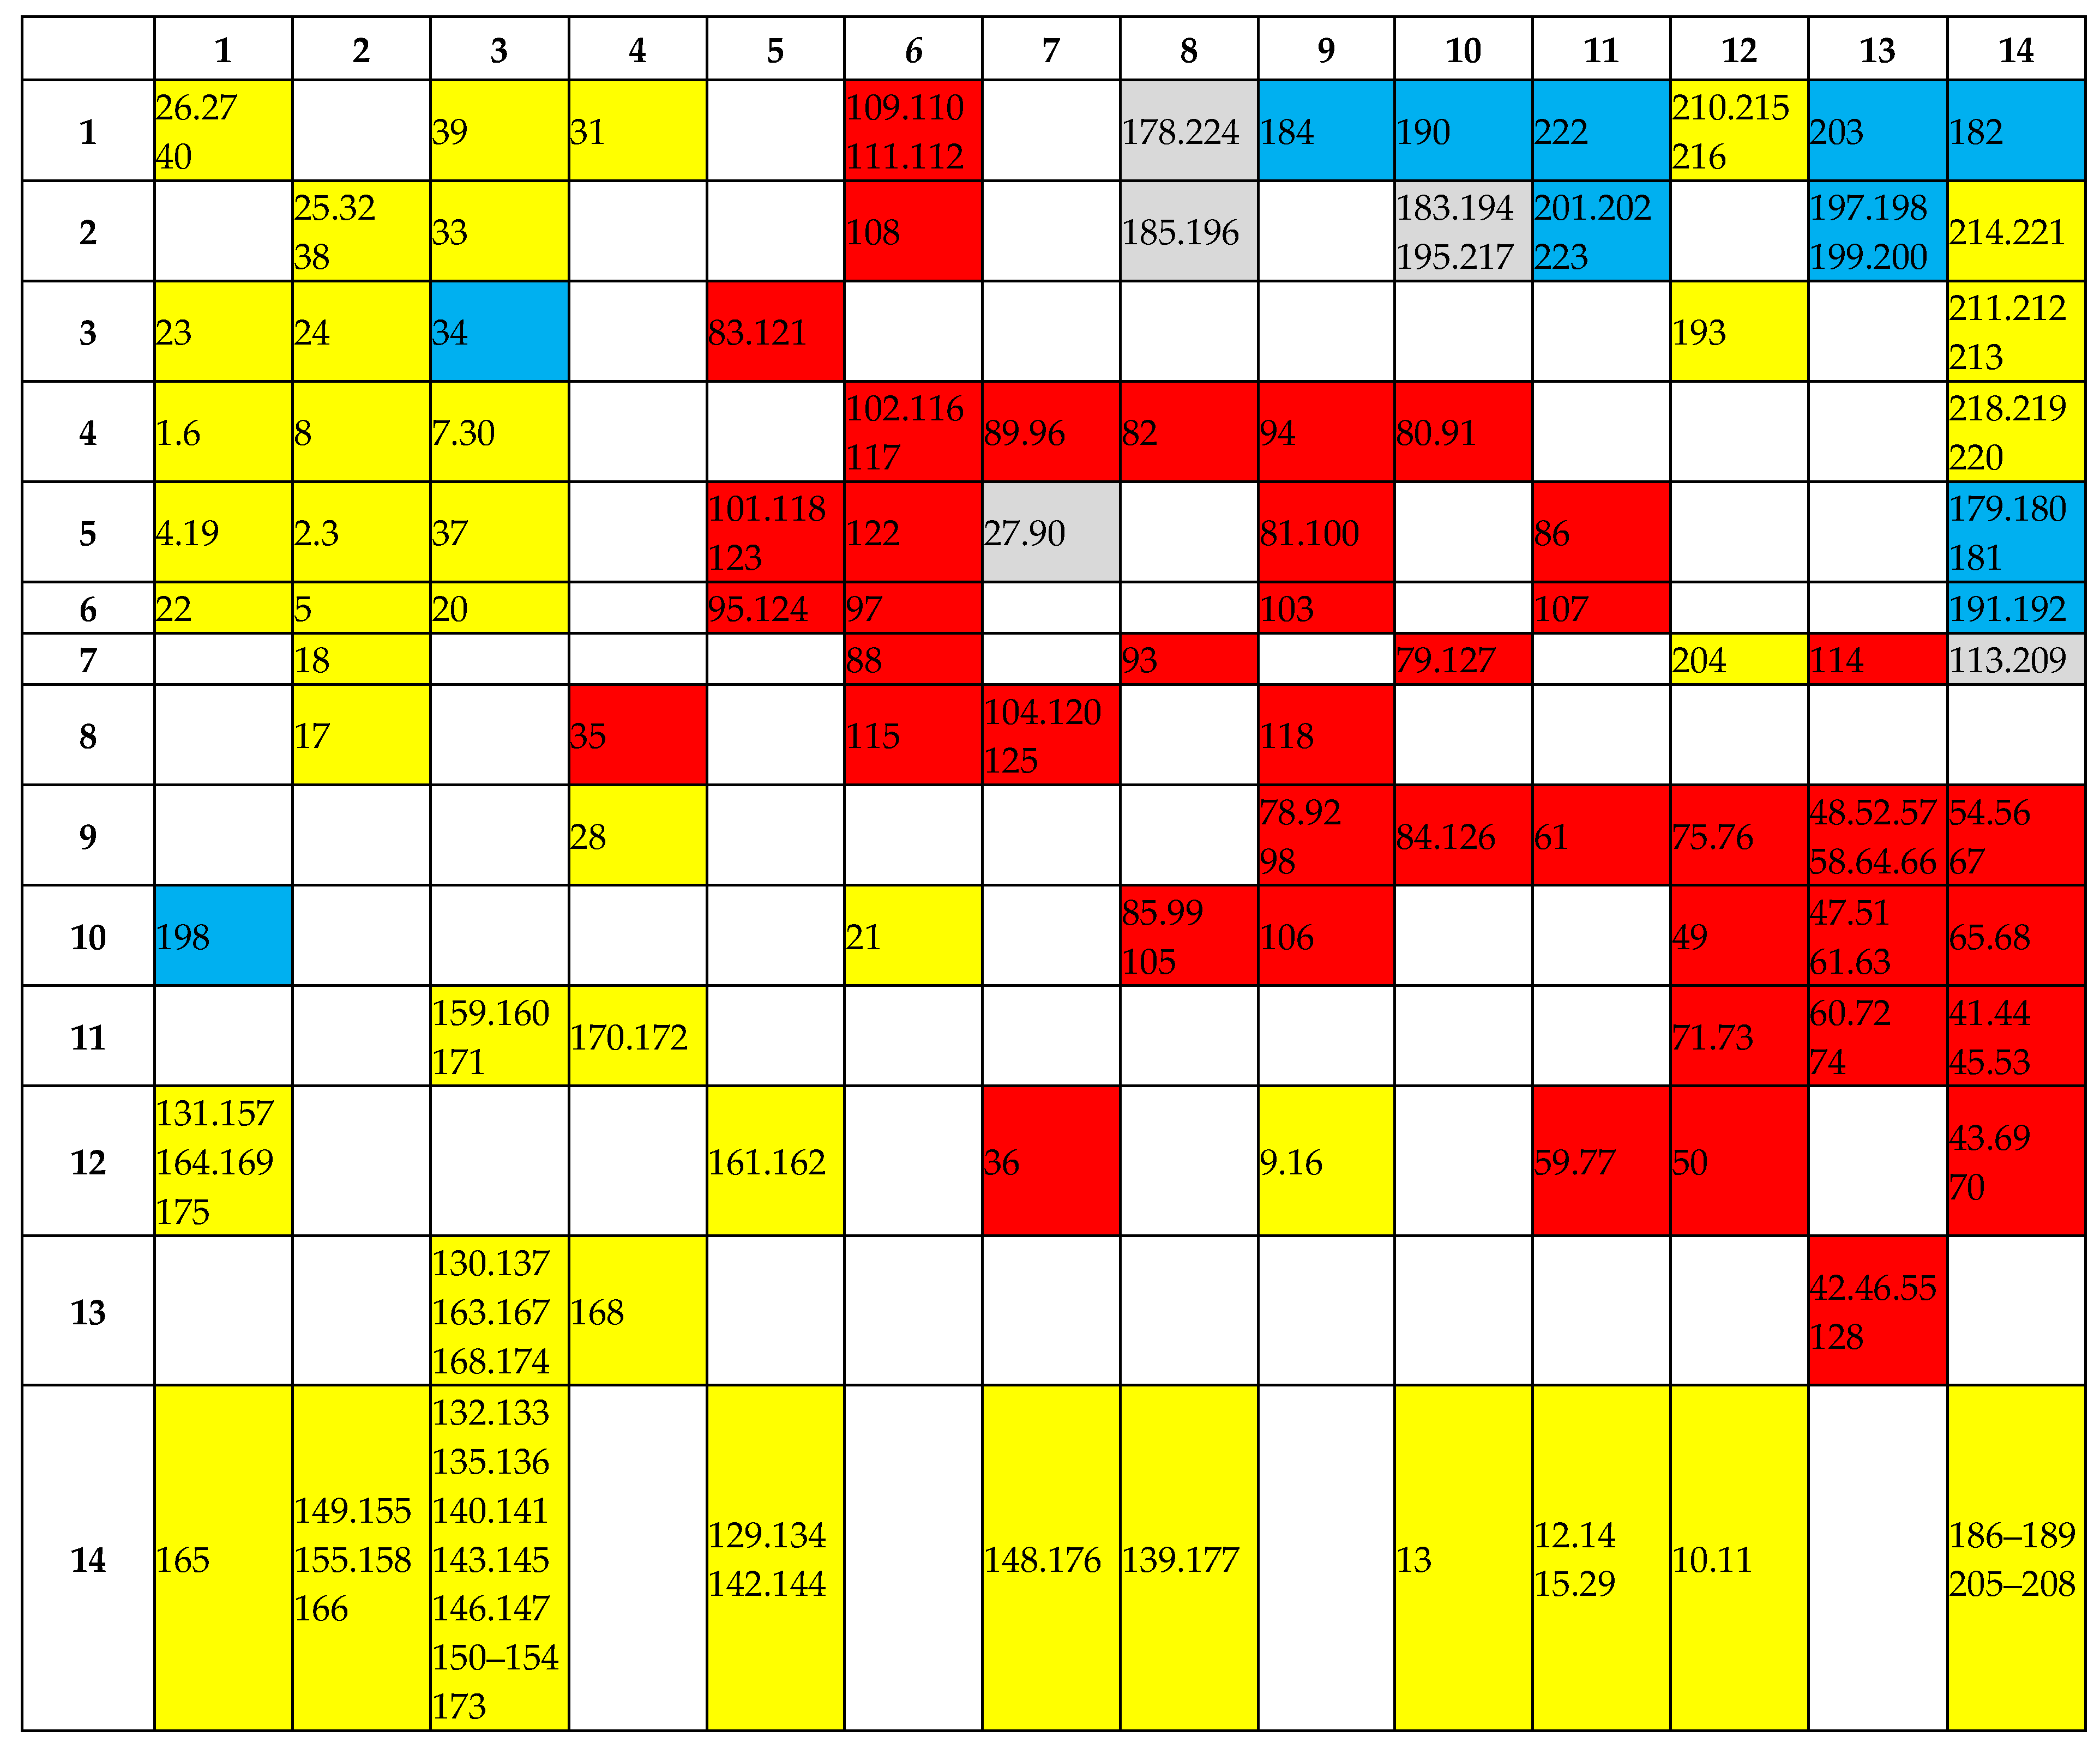
The distribution is visualized in Figure 6. The map shows that water use variability is the greatest in cluster 2, although several high-consumption cases appear in the upper-right portion of cluster 1 (red shading). Most cluster 1 nodes display below-average water consumption (yellow shading).
When electricity and water consumption indicators are considered simultaneously, the upper-right corner of the SOM contains cases with average values for both indicators, whereas the whole lower half of the map corresponds to the lowest values of both indicators. In contrast, the areas of peak electricity demand do not coincide with those of peak water demand. These findings suggest that a predictive model of electricity and water use should be developed for cluster 2, while consumption in cluster 1 can be assessed directly from the SOM.

4. Processing Technology Selection System

The choice of the most energy- and water-efficient oilseed-processing configuration can be assessed by simulating alternative product mix scenarios and matching seed throughput levels. To support such analyses, we developed a multi-layer perceptron (MLP) neural network model that predicts electricity and water use. Model development was restricted to cluster 2, whose observations display substantial variability in both utilities and therefore provide an informative training set. The input variables were seed throughput and the daily outputs of crude, refined and hydrogenated oils, plus margarine. In the study, the training, validation, and test sets were randomly divided in proportions of 70%, 15%, and 15%, respectively. Various network architectures were evaluated, and the optimal model was selected based on the simplest structure that simultaneously provided the best neural network performance across all three data subsets, with minimal variation between them. This approach ensured that the network was neither overfitted nor underfitted. After testing numerous network topologies in Statistica v. 13 [18], we selected the architecture that produced the most accurate electricity consumption forecasts (Table 4). The resulting performance metrics confirm the model’s high predictive accuracy.
Sensitivity analysis (Table 5) ranks the input variables of the electricity consumption model. Seed throughput and hydrogenated oil output exert the strongest influence on plant-wide electricity demand.
The network hyper-parameters for the water consumption model are listed in Table 6; the associated performance metrics confirm the model’s high predictive accuracy.
A subsequent sensitivity analysis (Table 7) shows that hydrogenated oil output is also the dominant driver of daily water use.
To examine how alternative product mix scenarios affect utility demand, we generated illustrative forecasts for several production structures and their corresponding seed throughput levels. This required a third MLP model that predicts seed throughput from the daily outputs of crude, refined and hydrogenated oils and margarine (Table 8).
Sensitivity analysis for this model (Table 9) again highlights hydrogenated oil output as the variable with the greatest impact on seed throughput.
Using the neural network models and the input sequence seed throughput, crude oil, margarine, refined oil, and hydrogenated oil, we simulated the corresponding electricity and water requirements (Table 10). All simulated production levels fall within the ranges observed for cluster 2.
The illustrative forecasts reveal considerable variation in utility demand across alternative product mixes. Electricity demand peaks when crude oil output is maximized, whereas water demand reaches its maximum under the highest hydrogenated oil output scenario.

5. Conclusions

The analyses of oilseed-processing technologies confirmed the hypothesis that the product mix significantly influences plant-wide electricity and water use. The SOM-based classification showed that the greatest variability in utility demand occurs in large-scale production runs (cluster 2). Classification quality for the 14 × 14 Self-Organizing Feature Map (SOFM 5-196) was satisfactory, with clustering errors of 0.000808 for the training set and 0.008548 for the test set (clustering error = sum of Euclidean distances between cluster members and the centroid). The resulting topological map can act as a detector for new observations, enabling their rapid assignment to the appropriate cluster and an immediate estimate of utility demand. The neural predictive models developed for cluster 2 provide fast forecasts of electricity and water consumption, thereby supporting the selection of the optimal processing configuration. These findings apply to summer operating conditions, when seed processing is at its peak. The guidelines presented here may help verify energy benchmarks and facilitate the implementation of sustainable production principles. An alternative in cases where complex processes are difficult to describe formally is the use of experimental or laboratory studies; however, this approach is costly and requires access to appropriate instrumentation [19,20].

Author Contributions

Supervision, Neural Modeling, Conceptualization, Writing—Review and Editing, Project Administration, J.T.; Methodology, Data Processing, Formal Analysis, Investigation, B.D.; Neural Modeling, Validation, Writing—Review and Editing, R.S.; Original Draft, Supervision, Writing, J.W. All authors have read and agreed to the published version of the manuscript.

Funding

This research received no external funding.

Data Availability Statement

The data presented in this study are available upon request from the corresponding author. The data are not publicly available due to business confidentiality.

Acknowledgments

During the preparation of this manuscript, the authors used GenAI. GenAI has been used for purposes such as generating text. The authors have reviewed and edited the output and take full responsibility for the content of this publication.

Conflicts of Interest

The authors declare that they have no known competing financial interests or personal relationships that could have appeared to influence the work reported in this paper.

References

  1. Majidi, H.; Hayati, M.M.; Breyer, C.; Mohammadi-ivatloo, B.; Honkapuro, S.; Karjunen, H.; Laaksonen, P.; Sihvonen, V. Overview of energy modeling requirements and tools for future smart energy systems. Renew. Sustain. Energy Rev. 2025, 212, 115367. [Google Scholar] [CrossRef]
  2. Wang, Q.; Li, Y.; Li, R. Integrating artificial intelligence in energy transition: A comprehensive review. Energy Strategy Rev. 2025, 57, 101600. [Google Scholar] [CrossRef]
  3. Fantozzi, F.; Ferico, S.D.; Desideri, U. Study of a cogeneration plant for agro-food industry. Appl. Therm. Eng. 2000, 20, 993–1017. [Google Scholar] [CrossRef]
  4. Kaur, M.; Sharma, H.K.; Kumar, N. Processing of Oilseeds. In Agro-Processing and Food Engineering: Operational and Application Aspects; Springer: Singapore, 2022; pp. 483–533. [Google Scholar]
  5. Sandouqa, A.; Al-Hamamre, Z. Energy analysis of biodiesel production from jojoba seed oil. Renew. Energy 2019, 130, 831–842. [Google Scholar] [CrossRef]
  6. WS Atkins Int. Environmental Protection in the Agri-Food Industry; Environmental Standards; Ochrona Środowiska w Przemyśle Rolno-Spożywczym. Standardy Środowiskowe; FAPA: Warszawa, Poland, 1998; pp. 37–41, 78, 82, 85, 87, 105. [Google Scholar]
  7. Zaki, M.A.M.; Ooi, J.; Ng, W.P.Q.; How, B.S.; Lam, H.L.; Foo, D.C.; Lim, C.H. Impact of industry 4.0 technologies on the oil palm industry: A literature review. Smart Agric. Technol. 2025, 10, 100685. [Google Scholar] [CrossRef]
  8. Batchelor, S.E.; Booth, E.J.; Walker, K.C. Energy analysis of rape methyl ester (RME) production from winter oilseed rape. Ind. Crops Prod. 1995, 4, 193–202. [Google Scholar] [CrossRef]
  9. Jóźwiak, D.; Szlęk, A. Ocena oleju rzepakowego jako paliwa kotłowego. Energetyka I Ekol. 2006, 6, 449–451. [Google Scholar]
  10. Wojdalski, J.; Dróżdż, B. Podstawy Analizy Energochłonności Produkcji Zakładów Przemysłu Rolno-Spożywczego; MOTROL, Motoryzacja i Energetyka Rolnictwa: Lublin, Poland, 2006; pp. 294–304, Tom 8A. [Google Scholar]
  11. Bystram, K. Assessment of Energy Intensity of Production in the Food Industry; Oil Industry; Ocena Energochłonności Produkcji w Przemyśle Spożywczym. Branża Olejarska; IBMER: Warszawa, Poland, 1986. [Google Scholar]
  12. Dróżdż, B.; Wojdalski, J. Effect of Selected Technical and Technological Factors on Energy Consumption in the Oil Seed Processing Plants. Ann. Wars. Agric. Univ. 2001, 40, 59–66. [Google Scholar]
  13. Dróżdż, B.; Wojdalski, J. Conditions of energy management in oilseed processing plants [Uwarunkowania gospodarki energetycznej zakładów przetwórstwa nasion oleistych]. Inżynieria Rol. 2003, 8, 117–124. [Google Scholar]
  14. Teixeira, M.A. Heat and power demands in babassu palm oil extraction industry in Brazil. Energy Convers. Manag. 2005, 46, 2068–2074. [Google Scholar] [CrossRef]
  15. Husain, Z.; Zainal, Z.A.; Abdullah, M.Z. Analysis of biomass-residue-based cogeneration system in palm oil mills. Biomass Bioenergy 2003, 24, 117–124. [Google Scholar] [CrossRef]
  16. Svanes, E.; Waalen, W.; Uhlen, A.K. Environmental impacts of rapeseed and turnip rapeseed grown in Norway, rape oil and press cake. Sustainability 2020, 12, 10407. [Google Scholar] [CrossRef]
  17. Witten, I.H.; Frank, E. Data Mining: Practical Machine Learning Tools and Techniques; Morgan Kaufmann: New York, NY, USA, 2000. [Google Scholar]
  18. Data Analysis Software System, version 13; TIBCO Software Inc.: Santa Clara, CA, USA, 2017.
  19. Bondarenko, A.V.; Islamov, S.R.; Ignatyev, K.V.; Mardashov, D.V. Laboratory studies of polymer compositions for well-kill under increased fracturing. Perm J. Pet. Min. Eng. 2020, 20, 37–48. [Google Scholar] [CrossRef] [PubMed]
  20. Belousov, A.; Lushpeev, V.; Sokolov, A.; Sultanbekov, R.; Tyan, Y.; Ovchinnikov, E.; Shvets, A.; Bushuev, V.; Islamov, S. Experimental Research of the Possibility of Applying the Hartmann–Sprenger Effect to Regulate the Presure of Natural Gas in Non-Stationary Conditions. Processes 2025, 13, 1189. [Google Scholar] [CrossRef]
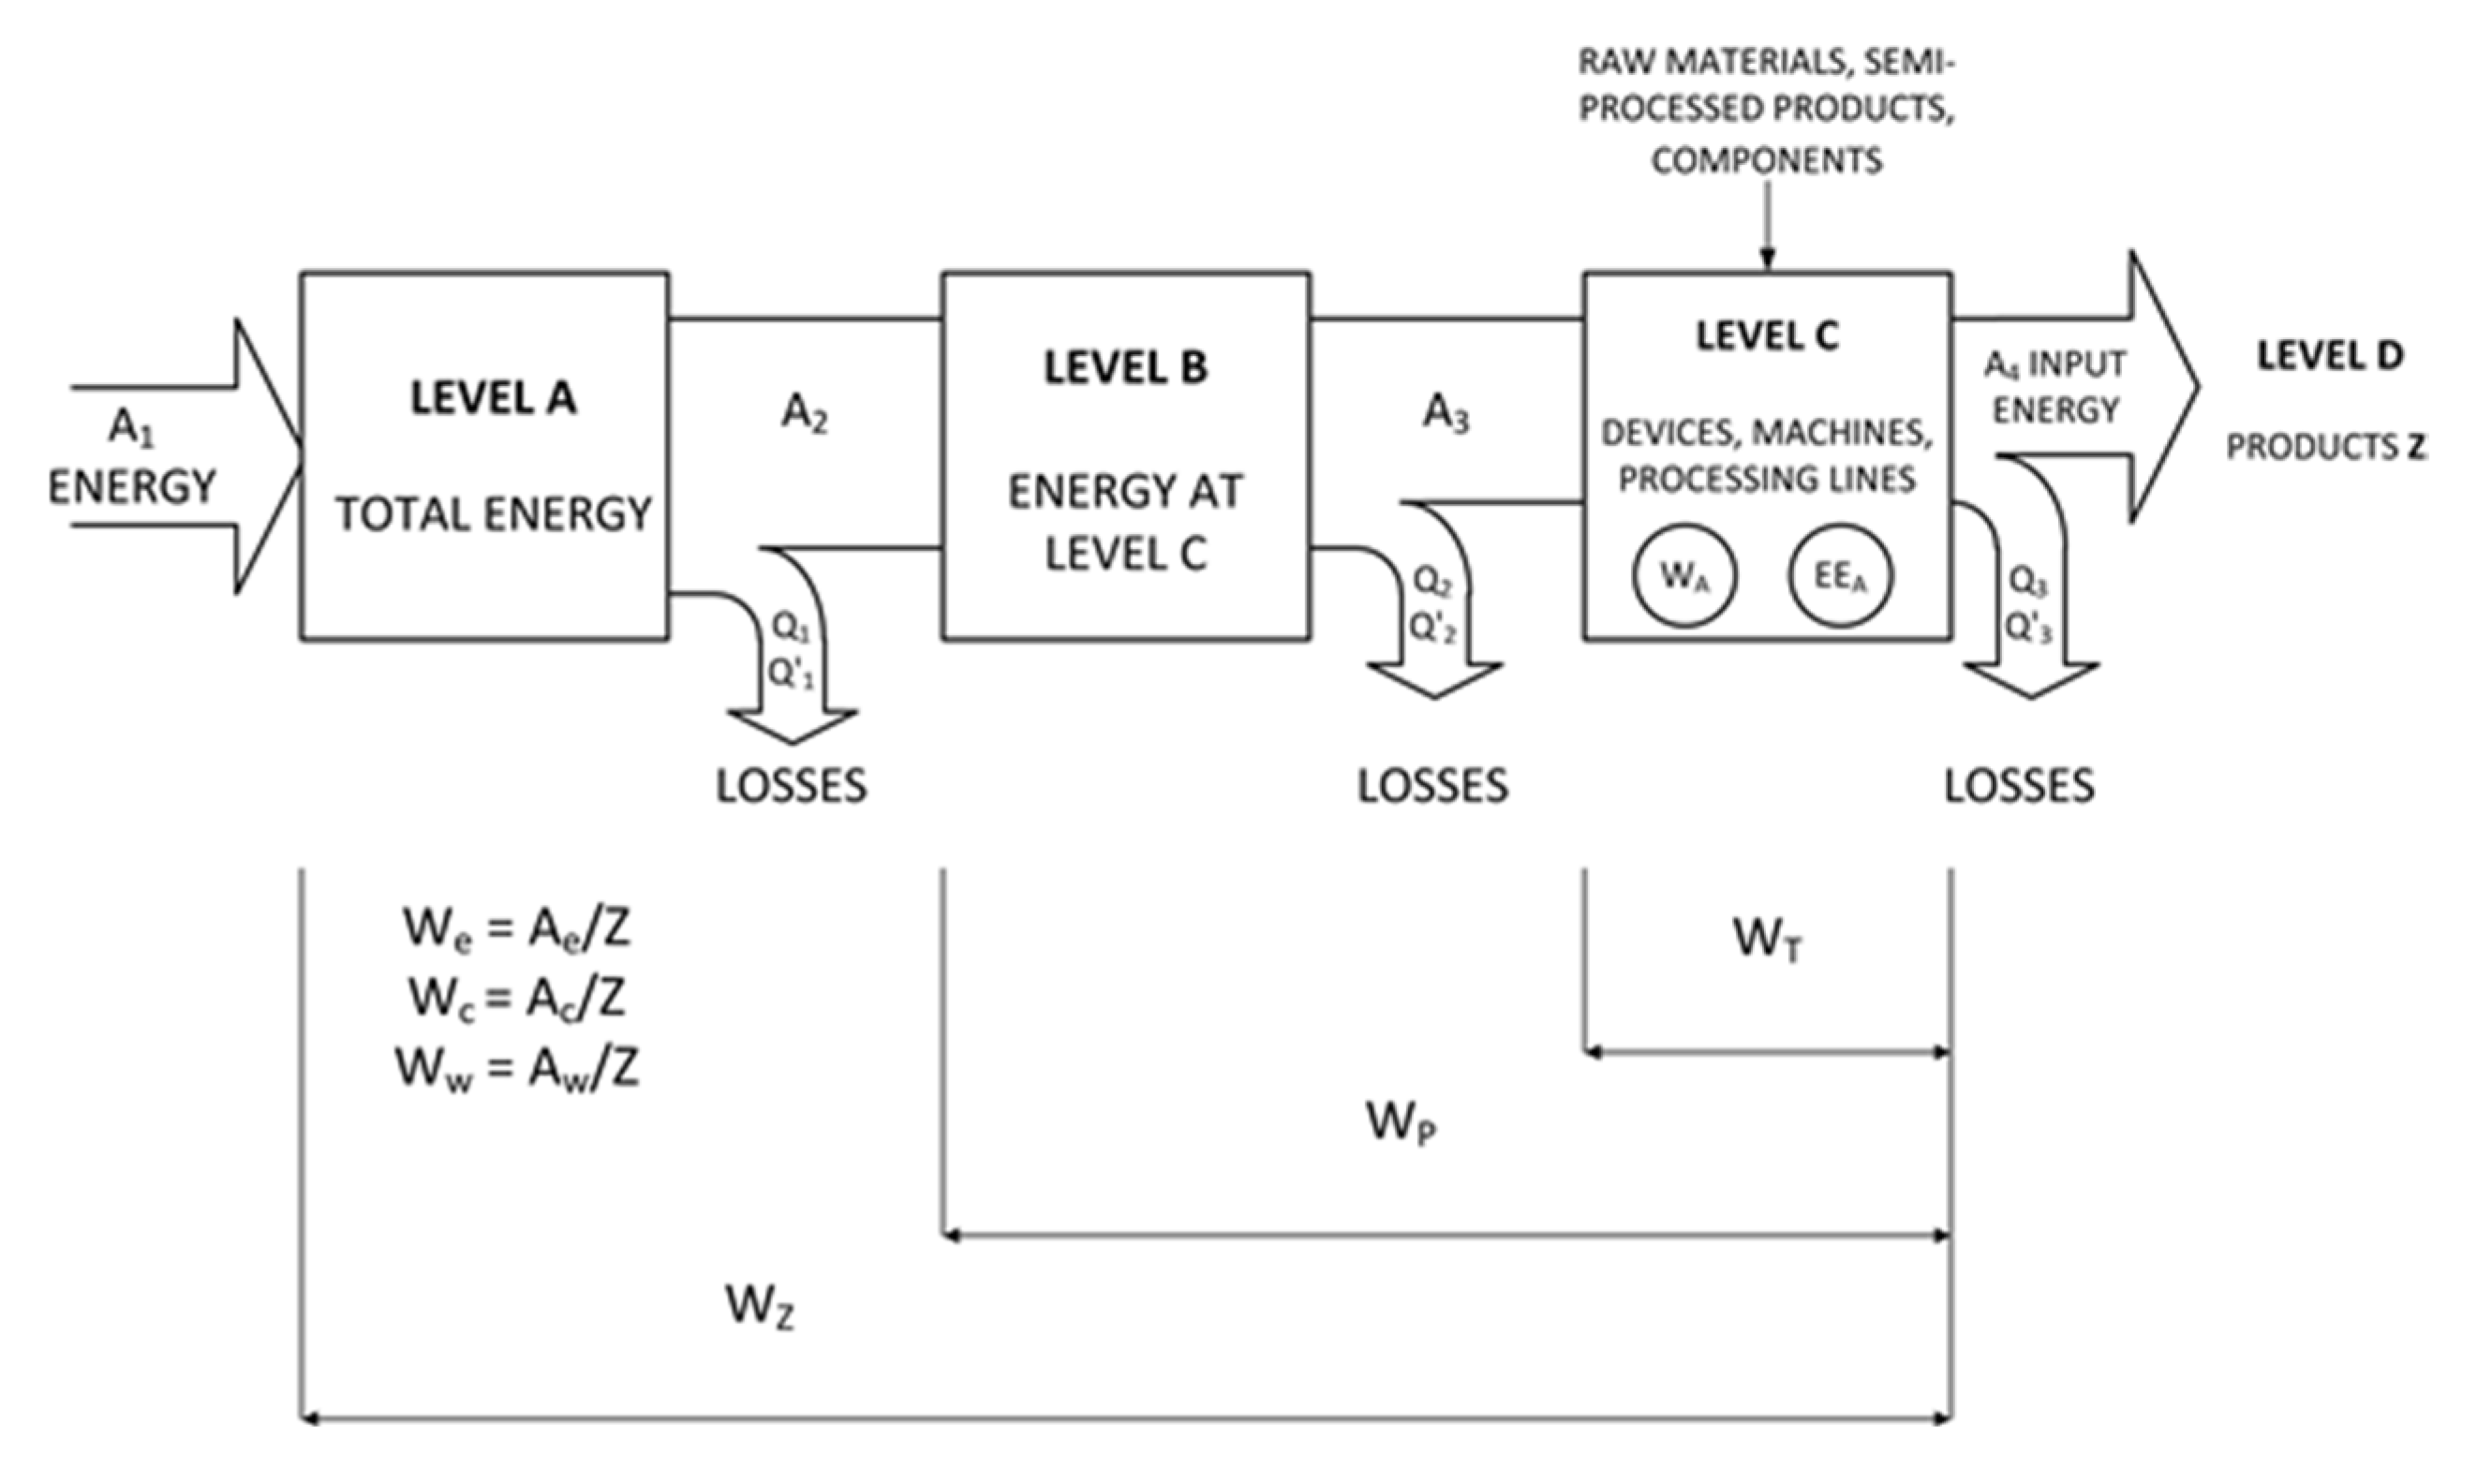
Figure 1. Structure of energy and water consumption in oilseed-processing plants.
Energies 18 04300 g001
Figure 2. Cluster analysis using the EM algorithm—graph of average quantitative variables of the oilseed processing process.
Energies 18 04300 g002
Figure 3. SOM network structure, input variables—seed processing, crude, refined and hydrogenated oil production and margarine production, output variables—14 × 14 topological map.
Energies 18 04300 g003
Figure 4. Topological map 14 × 14, case numbers shown on the map, yellow color cases for cluster 1, green color for cluster 2, gray color for ambiguous assignment.
Energies 18 04300 g004
Figure 5. Electricity consumption on the topological map, yellow color—cases with values below average, blue color—average consumption, red color—above average consumption, gray color—ambiguous assignment.
Energies 18 04300 g005
Figure 6. Water consumption on the topological map, yellow color—cases with values below average, blue color—average consumption, red color—above average consumption, gray color—ambiguous assignment.
Energies 18 04300 g006
Table 1. Characteristics of the examined oilseed-processing plants, taking into account selected technical and technological factors.
FactoryDaily Processing Capacity
[103 kg]
(Product)
Total Installed Power of Electrical Devices P [kW]Km Indicator for the Daily Period (Average Value)
[kW/103 kg]
Daily Energy and Water Consumption
(Average Value)
Ae
[kWh]
Ac
[GJ]
At1
[GJ]
At2
[GJ]
Aw
[m3]
1165
(margarine)
17007.9723,3031022.01301.61105.92006.3
2180
(refined oil, margarine)
600046.1944,078999.41528.31158.1343.1
31228
(refined oil, margarine)
12,64020.4111,333317.9453.9358.72958.1
4160
(refined oil, crude oil)
237414.9196,7401823.12984.02171.44919.5
5337
(refined oil, margarine)
810023.2410,952594.0725.4633.4520.8
6240
(refined oil, hydrogenated oil)
255010.4232,2041093.01479.41208.9497.6
Table 2. Unit energy consumption indicators in the surveyed plants.
FactorySpecific Energy Consumption Indicators in Relation to 103 [kg]
of Raw Material for a Daily Period (Average Values)
We
[kWh/103 kg]
Wc
[GJ/103 kg]
Wt1
[GJ/103 kg]
Wt2
[GJ/103 kg]
Ww
[m3/103 kg]
EEe
[kg/kWh]
1108.64.776.085.167.399.21
2135.62.874.493.352.117.37
348.31.361.941.5314.3120.70
4145.52.724.463.247.826.87
567.93.684.493.922.4914.73
6212.48.3610.909.121.564.71
Table 3. Selected technical and technological factors influencing water consumption in oil industry plants.
Multiple Regression EquationsR2Independent Variables
Markings/DimensionNumber Range
Aw = 562.19 + 3.13 S10.66S1 [104 m2]58.6–1377.3
Aw = −1296.5 + 4.712 P1 + 444.809 logP20.94P4 [kW]
P11 [kW]
192.2–1087.0
100.0–3875.0
Aw = 51.69 + 4.775 Z2 − 1900/Z2 + 2400/Z30.71Z2 [103 kg]
Z3 [103 kg]
10.0–338.0
1.0–97.0
Table 4. Neural predictive model of electricity consumption, cluster 2.
Network TypeQuality (Learn.)Quality (Test)Quality (Valid.)Error (Learn.)Error (Test)Error (Valid.)Learning AlgorithmError FunctionActivation (Hidden)Activation (Output)
MLP 5-5-10.94520.96650.93980.05580.03150.0507BFGS 13SOSExponent.Tanh
Table 5. Sensitivity analysis for the neural model of electricity consumption, cluster 2.
Network TypeSeed Processing
103 [kg]
Hydrogenated Oil
103 [kg]
Raw Oil
103 [kg]
Margarine
103 [kg]
Refined Oil
103 [kg]
MLP 5-5-13.12343.57781.71041.02841.0071
Table 6. Neural predictive model of water consumption, cluster 2.
Network TypeQuality (Learn.)Quality (Test)Quality (Valid.)Error (Learn.)Error (Test)Error (Valid.)Learning AlgorithmError FunctionActivation (Hidden)Activation (Output)
MLP 5-5-10.98780.96890.99240.01160.03340.0100BFGS 51SOSTanhLogistic
Table 7. Sensitivity analysis for the neural model of water consumption, cluster 2.
Network TypeHydrogenated Oil [kg]Refined Oil
103 [kg]
Seed Processing
103 [kg]
Margarine
103 [kg]
Raw Oil
103 [kg]
MLP 5-5-125.77305.37062.31791.16881.1328
Table 8. Neural predictive model of seed consumption, cluster 2.
Network TypeQuality (Learn.)Quality (Test)Quality (Valid.)Error (Learn.)Error (Test)Error (Valid.)Learning AlgorithmError FunctionActivation (Hidden)Activation (Output)
MLP 4-5-10.82980.95920.96030.16040.07480.0492BFGS 6SOSTanhLogistic
Table 9. Sensitivity analysis for the neural model of seed consumption, cluster 2.
Network TypeHydrogenated Oil
103 [kg]
Refined Oil
103 [kg]
Margarine
103 [kg]
Raw Oil
103 [kg]
MLP 4-5-125.77305.37061.16881.1328
Table 10. Simulation results of electricity and water consumption for average seed processing.
Processing of SeedsCrude Oil
103 [kg]
Margarine
103 [kg]
Refined Oil
103 [kg]
Hydrogenated Oil
103 [kg]
Electricity Consumption
[kWh/day]
Water
Consumption
[m3]
377.83267.00222.9014.300.6973,055.351223.15
329.63162.00338.0014.300.6955,351.341566.94
271.44162.00222.9070.000.6953,217.13643.41
125.78162.00222.9014.302.3328,979.755853.86
361.40162.00222.9014.300.6955,204.671001.78
Disclaimer/Publisher’s Note: The statements, opinions and data contained in all publications are solely those of the individual author(s) and contributor(s) and not of MDPI and/or the editor(s). MDPI and/or the editor(s) disclaim responsibility for any injury to people or property resulting from any ideas, methods, instructions or products referred to in the content.