Abstract
This study investigates the operational behavior and voltage stability of a 1 kW-class AIP PEMFC stack under high-pressure H2 and O2 conditions. AIP PEMFCs, unlike conventional air-based systems, operate in enclosed environments using stored O2, requiring designs that minimize parasitic power losses while ensuring stable operation. To establish a performance baseline, single cell tests were conducted to isolate the effects of in-plane components, including the MEA, GDL, and flow field geometry. Results indicated that temperature and pressure significantly influenced performance, whereas humidity and flow rate had minimal effects under the tested conditions. A 27-cell stack was then assembled and evaluated under various current densities, flow rates, and humidity levels. Time-resolved voltage measurements revealed that low flow rates (stoichiometry ≤ 1.5) led to voltage instability, particularly at high humidity and current density. Instability was more pronounced in cells positioned farthest from the inlet and outlet ports. These findings underscore the importance of optimizing operational parameters and stack architecture to achieve stable AIP PEMFC performance under reduced flow conditions. The results provide key insights for developing compact, efficient, and durable AIP fuel cell systems for use in enclosed or submerged environments such as submarines or unmanned underwater vehicles, while highlighting key challenges associated with AIP-targeted applications.
1. Introduction
In response to escalating global concerns regarding greenhouse gas emissions, the energy sector is undergoing a transition from fossil fuel-based systems to hydrogen-driven infrastructure. Among various hydrogen technologies, PEMFCs have emerged as a core component due to their superior efficiency, operational durability, and moderate operating temperatures (60–90 °C). A typical PEMFC system comprises a fuel cell stack and a balance of plant, which governs hydrogen and oxidant supply, regulates flow rates and pressures, and facilitates thermal management to ensure sustained and stable performance.
The automotive sector represents the primary area of application for PEMFC technology, with leading manufacturers such as Hyundai and Toyota actively advancing the development of FCEVs [1,2,3]. In parallel, major institutions have formulated performance evaluation protocols specifically designed for automotive implementations [4,5]. In addition, various research institutions are actively working to enhance fuel cell performance and durability by applying technologies from outside the traditional fuel cell domain [6,7]. Beyond the automotive domain, the adoption of PEMFCs has expanded to include applications in maritime vessels, rail transport, unmanned aerial systems, urban air mobility platforms, and distributed energy generation systems.
Although significant progress has been made in the development of terrestrial PEMFC applications, research on fuel cell-based AIP systems, which operate independently of atmospheric oxygen, remains comparatively limited. In contrast to conventional PEMFCs that utilize atmospheric oxygen, AIP fuel cells must function within sealed environments, requiring the storage of high-pressure oxygen in a manner analogous to hydrogen storage. AIP systems, which are essential for platforms such as submarines, space shuttles, and underground power facilities, offer unique advantages including low acoustic signatures, zero emissions, and high operational efficiency over extended durations [8,9,10].
Compared to conventional air-fed PEMFCs, AIP fuel cell systems operate under distinctly different conditions. As the name suggests, AIP systems function in fully enclosed environments, isolated from atmospheric air. Consequently, like hydrogen, oxygen must also be supplied from compressed storage tanks. To maximize volumetric efficiency, nearly pure oxygen—rather than air—is used as the oxidant. In addition, since AIP systems are required to operate for extended periods under isolated conditions, the system must operate under conditions of minimal reactant and coolant flow rates to minimize parasitic power consumption by the BOP. To make the most efficient use of the limited hydrogen and oxygen resources, AIP systems are typically operated in recirculation or dead-end modes [11,12,13]. From the perspective of the stack and individual cells, achieving high energy efficiency is paramount, which necessitates operation at elevated voltages. Higher reactant pressures improve reaction kinetics at the electrodes, and since the system utilizes high-pressure gas tanks, additional compression energy is not required. As a result, AIP fuel cell stacks can operate at relatively high pressures compared to their air-fed counterparts.
These unique operational demands impose significant requirements on MEA design. First, to enable operation at elevated pressures, the electrolyte membrane must be significantly thicker—typically in the range of 50 to 100 μm—which is approximately three to five times thicker than conventional PEMFC membranes. This design reduces gas crossover under high-pressure conditions. Additionally, to maximize performance at higher operating voltages, the electrodes are fabricated with higher platinum loadings compared to those used in standard PEMFC systems.
From a stack design perspective, AIP PEMFC systems require optimization to withstand high reactant pressures and to operate effectively under limited flow rate conditions. Achieving this necessitates meticulous engineering to ensure gas-tight sealing between bipolar plates, as well as structural designs that enable uniform distribution of low reactant flows across all cells while facilitating efficient removal of liquid water. Also, safety risks are exacerbated by the inherent hazards of operating under high-pressure hydrogen and oxygen environments, which significantly increase the likelihood of fire and explosion. As a result, the majority of previous studies on AIP PEMFCs have been confined to single cell evaluations, and experimental data for multi-cell, high-capacity stacks under AIP-relevant conditions remain scarce compared to the extensive datasets available for conventional air-fed PEMFC systems. Nevertheless, stack-level evaluations are essential for the development and operational optimization of AIP-specific PEMFCs. To the best of our knowledge, there is a notable lack of literature and foundational data on stack design, operation, and performance tailored for AIP conditions.
In this study, MEAs developed for AIP conditions were incorporated into a 1 kW-class PEMFC stack, for which dedicated stack components were designed and fabricated. An operational map defining feasible temperature, pressure, flow rate, and humidity ranges was established through single cell evaluations, and the voltage behavior was monitored under varying current loads. The stack was then evaluated for voltage stability under the same operating conditions as the single cell tests. Both single cell and stack evaluations were conducted—using modified test stations with oxygen-specific components for the former, and the latter was conducted at an outdoor site to ensure safety. The results provide insights into the operational challenges and design considerations necessary for the future development of AIP-oriented PEMFC stacks.
2. Experiments
2.1. MEA Specifications
The MEA used in this study was developed by KOLON Industry Co., Seoul, Republic of Korea for use in AIP-type PEMFC systems. The electrolyte membrane consisted of a reinforced composite membrane with a thickness of approximately 50 μm, also developed by KOLON Industry. The anode and cathode electrodes were fabricated with platinum loadings of 0.20 and 0.60 mgPt/cm2, respectively. For the carbon support, a high-crystallinity carbon black with a specific surface area of 200–300 m2/g was selected to enhance chemical stability under high-voltage operation. The geometric active area of the MEA used for both the single cell and 1 kW stack tests was 70 cm2.
2.2. Single Cell Fabrication
Stack components compatible with the 70 cm2 active area MEA provided by KOLON Industry Co. were designed and fabricated for this study. The GDL used was the JNT20-A6L model from JNTG Co., Hwaseong, Republic of Korea with a specified thickness of 210 μm. A 160 μm thick spacer made of glass fiber-coated PTFE was incorporated to maintain a compression ratio of 20–25%. This configuration was applied identically to both the anode and cathode sides.
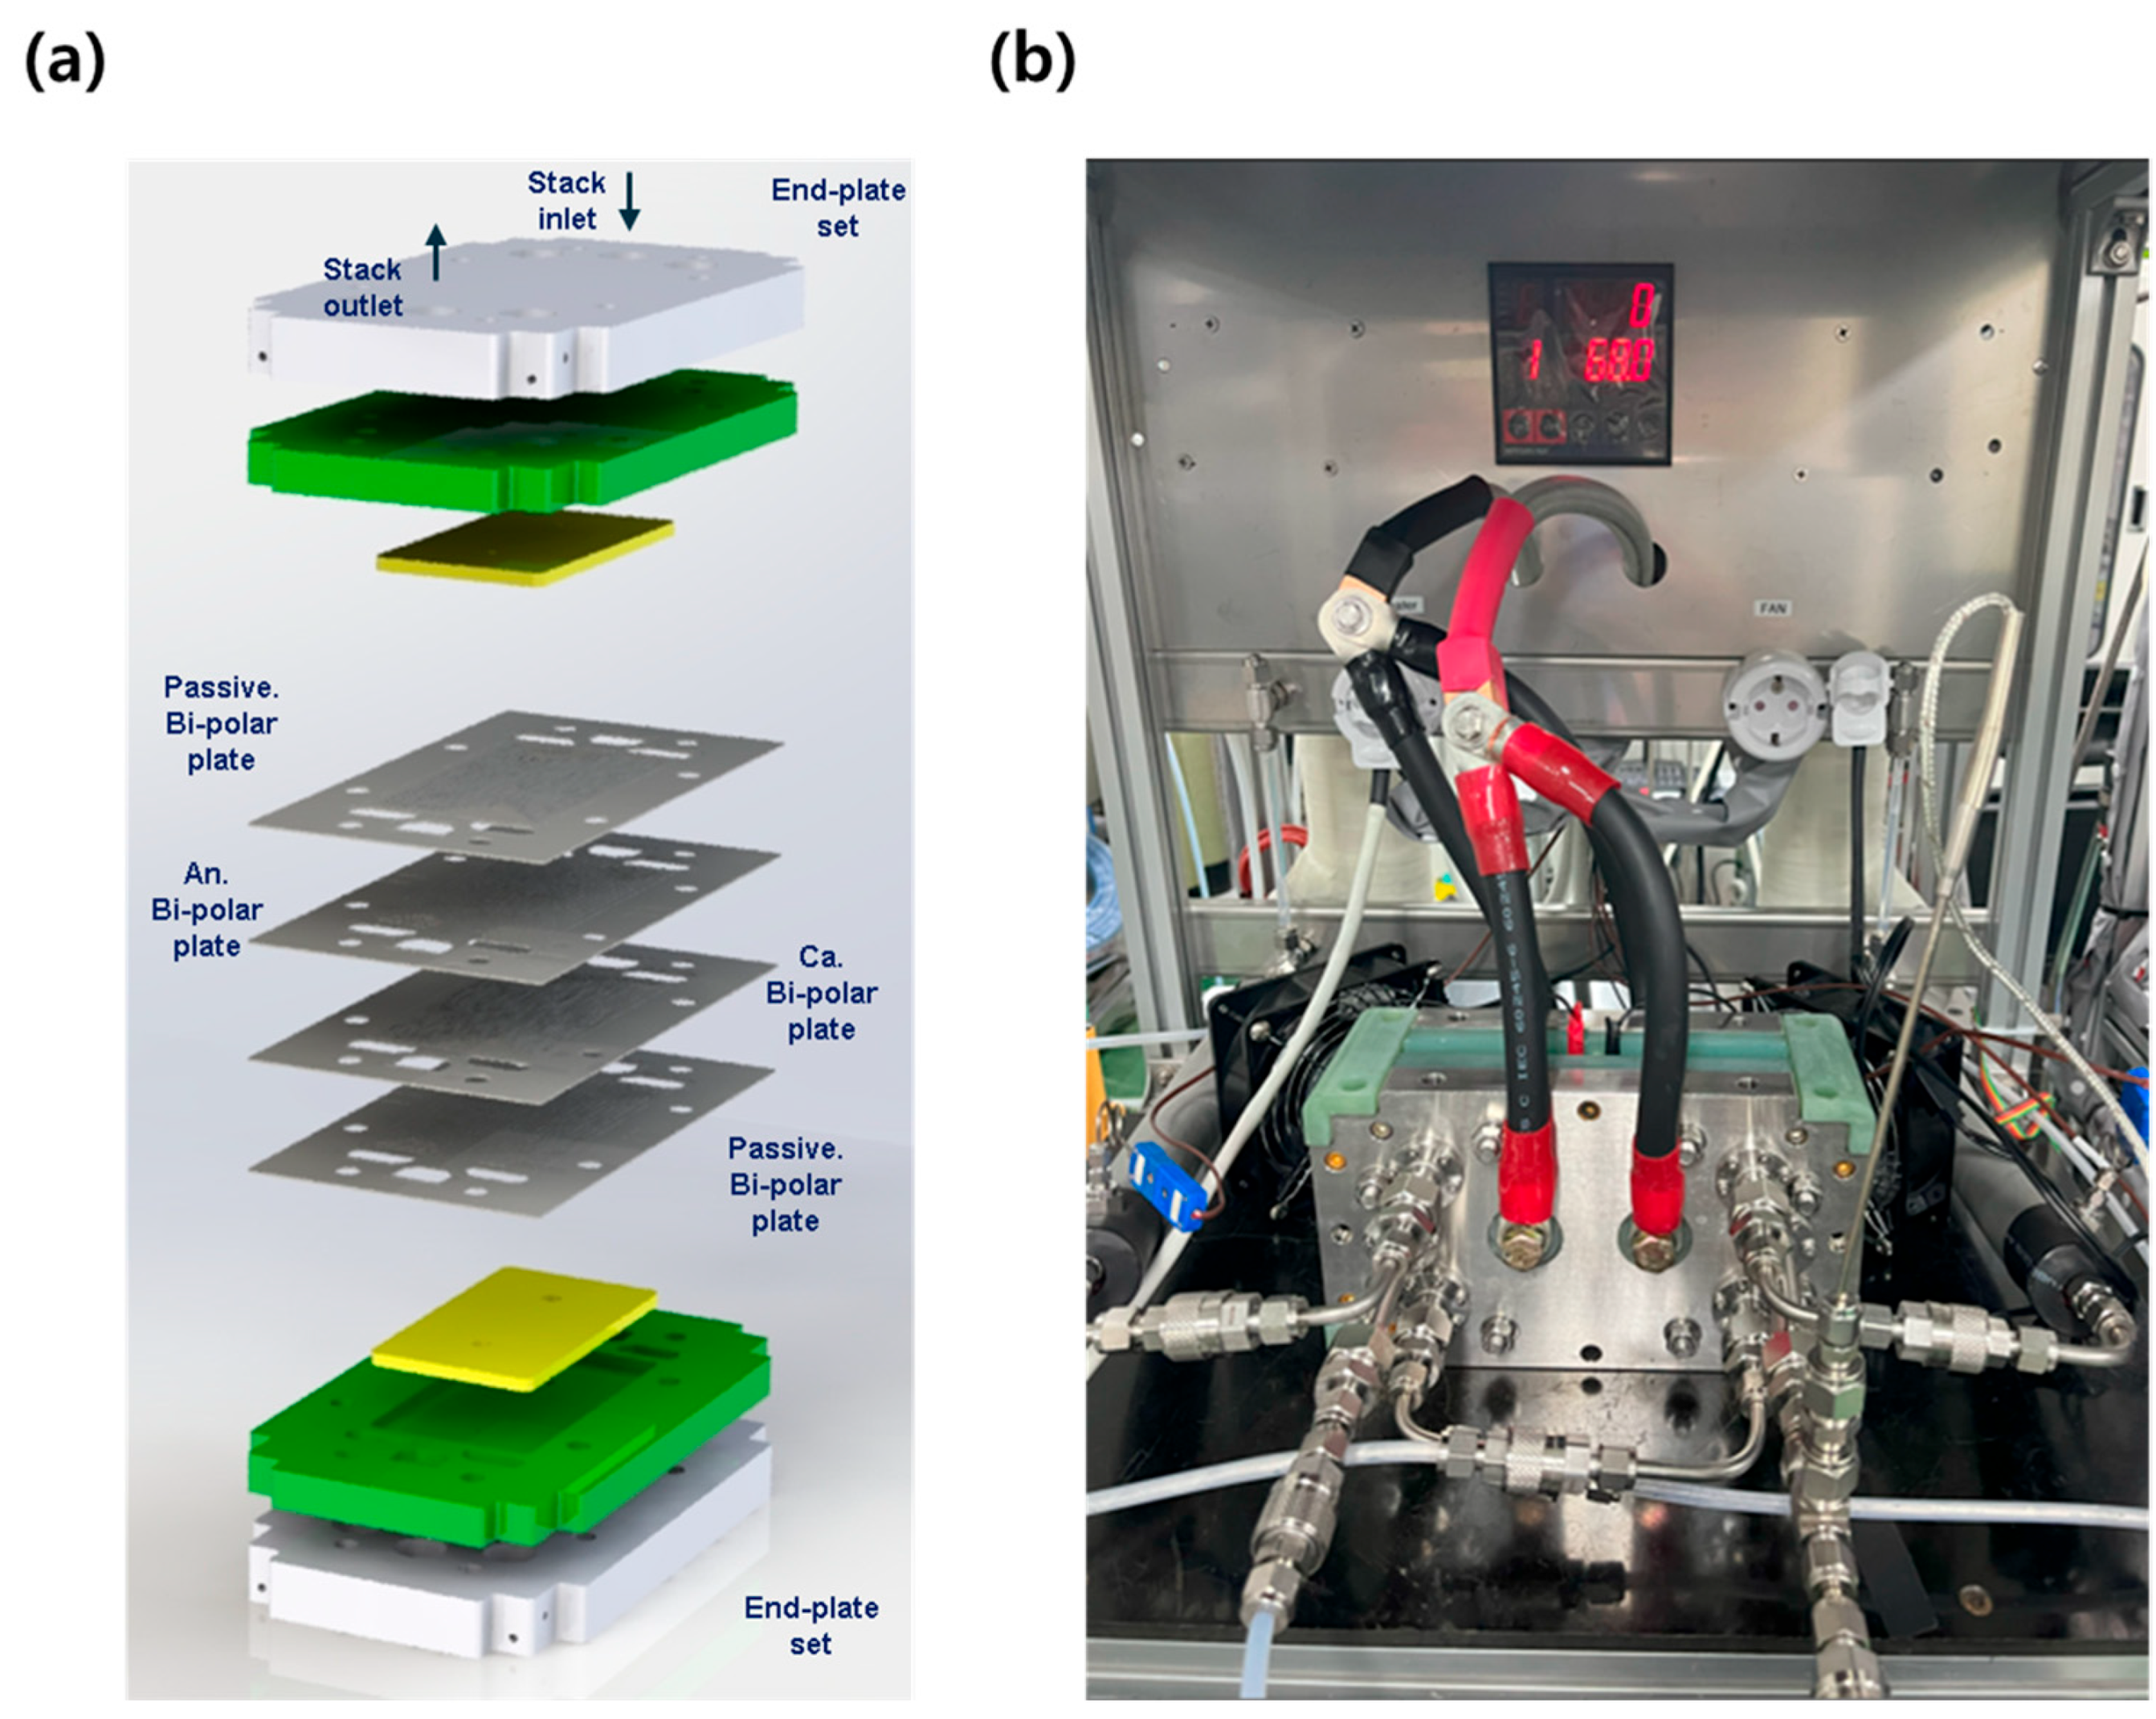
The single cell configuration is illustrated in Figure 1a. Bipolar plates for both the anode and cathode were fabricated from 3 mm-thick graphite. The flow field on the anode side was machined in a serpentine pattern to accommodate hydrogen flow, with a GDL contact land width of 1.25 mm. On the cathode side, a similar serpentine flow field was machined to accommodate oxygen flow, with a GDL contact land width of 0.50 mm. The opposite sides of the bipolar plates were machined to form cooling channels upon assembly.
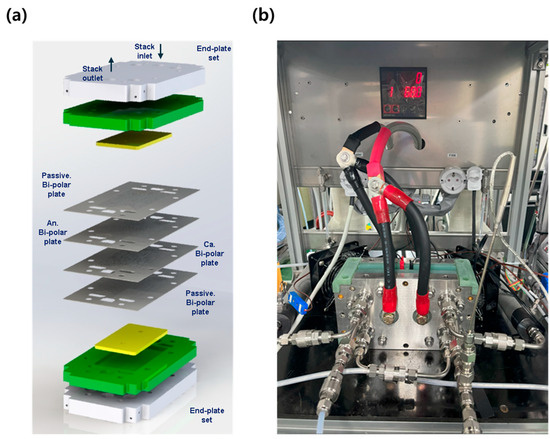
Figure 1.
(a) Design and configuration of the single cell components; (b) photograph of the single cell mounted on the test station during evaluation.
To minimize heat loss in the end cells, an additional passive bipolar plate without flow channels and MEA was inserted between the end cells and the end plates. The manifolds, which collect hydrogen, oxygen, or water immediately before or after each cell, were designed with a hydraulic diameter of approximately 17 mm. The inlet and outlet manifolds for hydrogen and oxygen were fabricated symmetrically.
The stack assembly was secured with a total of eight bolts, with torque gradually applied in a balanced manner. The final torque for each bolt was set to 60 kgf·cm2.
2.3. Single Cell Evaluation
For single cell evaluation, a standard air-fed fuel cell test station (SCITECH, Seoul, Republic of Korea) was modified by replacing the MFC with an oxygen-specific MFC. Deionized water was used as the coolant, and an external circulator (JEIOTECH, Daejeon, Republic of Korea) was employed to maintain temperature control. Figure 1b shows the actual test setup used for the single cell evaluations.
Prior to performance testing, the cell underwent an activation process to stabilize its performance. Activation was conducted in CC mode, where a constant current is applied at each step, by incrementally stepping the current density from 0.0 to 3.0 A/cm2 in 0.1 A/cm2 increments, with each step held for 5 s. A minimum voltage of 0.40 V was set as a safety threshold, at which point the current density was reset to 0.0 A/cm2 and the cycle repeated. The activation process continued until no further voltage increases were observed, requiring approximately 1.5 days to complete. During activation, the coolant inlet temperature was maintained at 65 °C, and the flow rates of hydrogen and oxygen were set to 4.0 L/min and 2.7 L/min, respectively. Both gases were supplied at ambient pressure, and the relative humidity for both hydrogen and oxygen was maintained at 100%.
Performance evaluation of the single cell was conducted in CC mode using polarization (IV) curve measurements. A total of 12 operational modes were tested to evaluate the effects of various operating parameters, including relative humidity, flow rate, pressure, and temperature. The specific test conditions for each mode are summarized in Table 1. The reference condition (IV1) served as the baseline for variations.

Table 1.
Summary of operating parameters and test conditions for single cell performance evaluation.
The minimum flow rate for each condition was set to correspond to the stoichiometry required for a current density of 0.20 A/cm2. For each IV test, the current density was held for 2 min at each point, and the average cell voltage during the final 30 s was recorded as the representative voltage for that current density. Each IV test was repeated three times under each set of conditions, and the final IV results reported in this study were based on the third measurement.
2.4. 1 kW Stack Fabrication
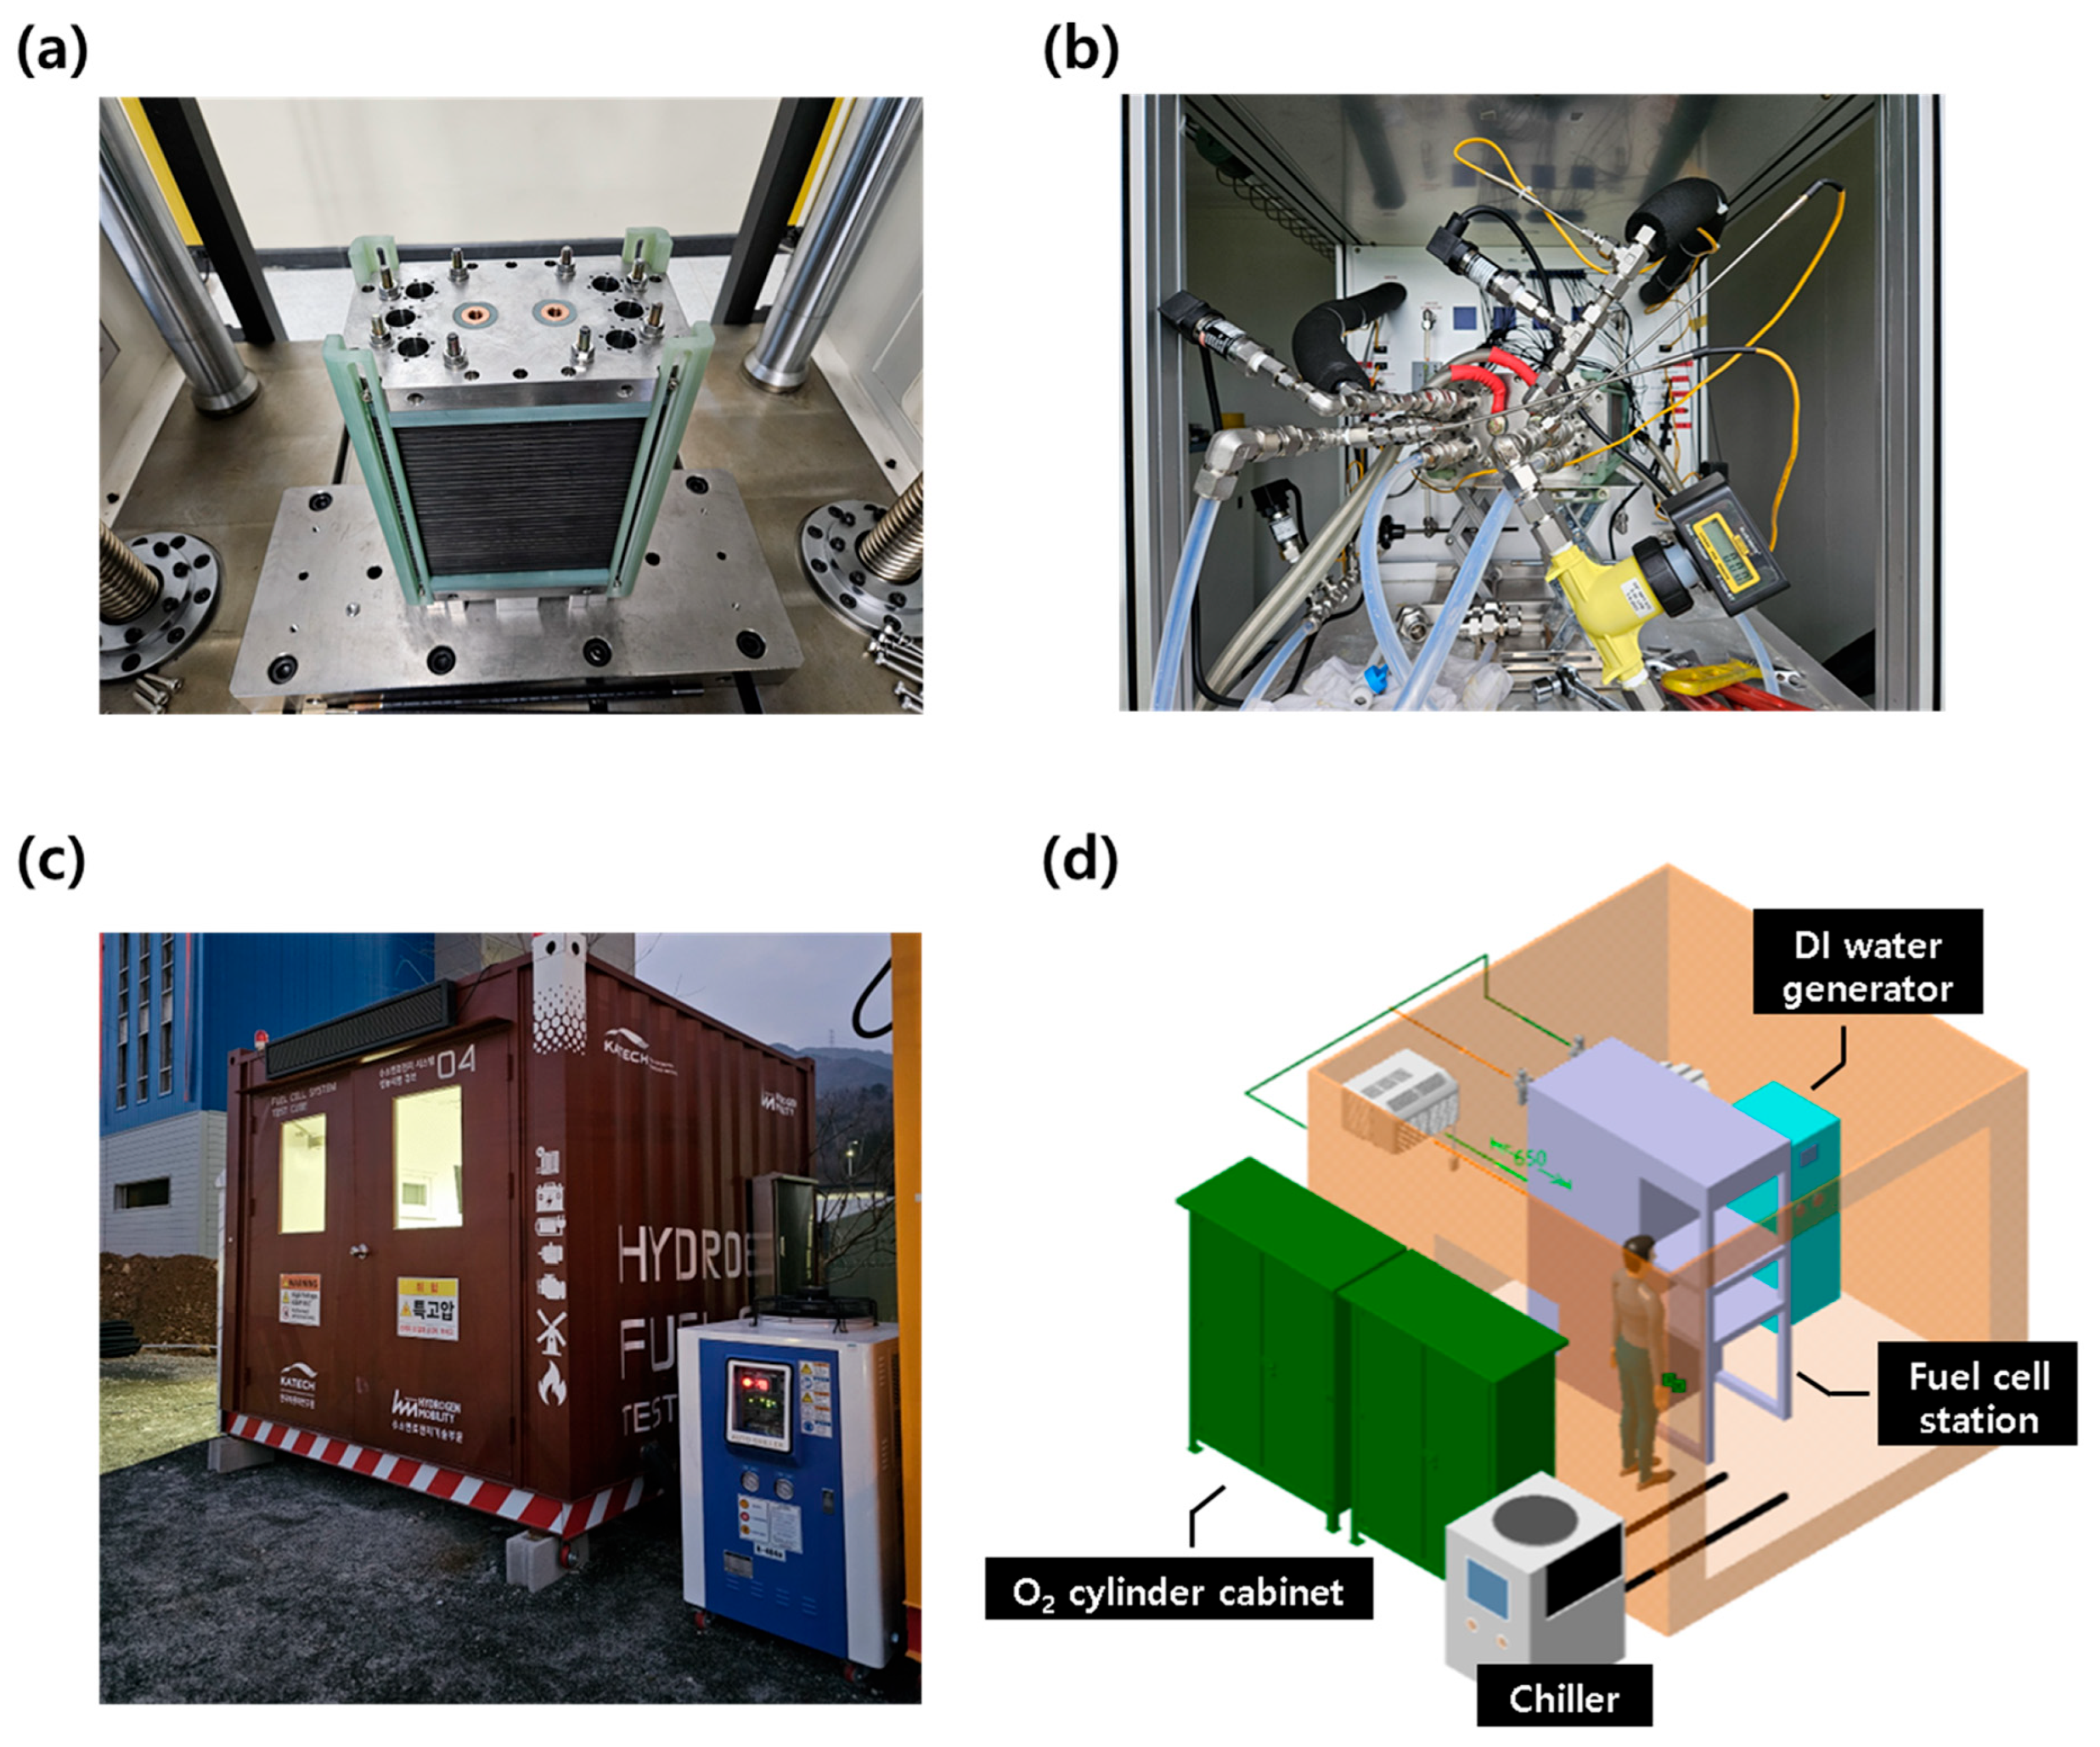
The 1 kW stack was assembled using the same 70 cm2 MEAs that were employed in the single cell evaluations, with a total of 27 cells configured in series. The stack was assembled under the same conditions as the single cell, with uniform torque applied to each component. To ensure stable assembly, a dedicated stack pressing machine (SIMPAC, Republic of Korea) was used to apply a compressive load of 2 tons. A real image of the completed stack is shown in Figure 2a.
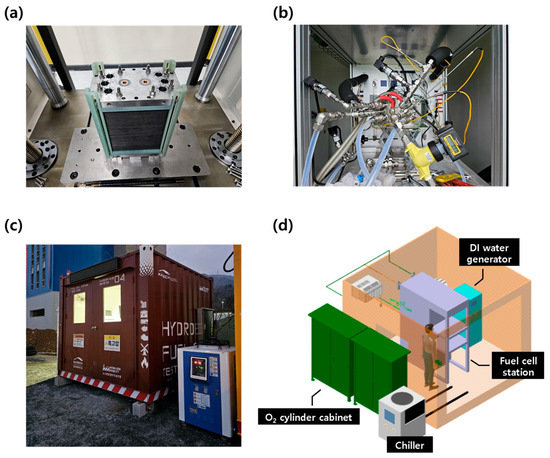
Figure 2.
Test facility setup for the 1 kW stack evaluation. (a) Stack press machine and assembled 27-cell stack; (b) 1 kW stack mounted on the test station; (c) outdoor container setup and auxiliary equipment for safe high-pressure evaluation; and (d) utility layout and configuration for outdoor testing.
2.5. 1 kW Stack Evaluation
To configure the test system for the 1 kW stack evaluation, a standard 5 kW air-based test station (CNL Energy, Seoul, Republic of Korea) was modified by replacing several key components—including the electronic loader, MFCs, and cell voltage sensors—to meet the specifications of the 1 kW stack. The completed test setup is shown in Figure 2b, where the stack was connected to the modified test system.
Given the safety risks associated with evaluating a 1 kW-class fuel cell stack using high-pressure hydrogen and oxygen, the experiments were conducted outdoors in a temporary structure (3 × 3 × 3 m3 container) for safety, as shown in Figure 2c. The container was equipped with the necessary test equipment, including the stack evaluation system, a deionized water generator, and an external 5 kW chiller for stack cooling. An external O2 cylinder cabinet (capacity: 4 cylinders) was installed adjacent to the container for oxygen supply, while hydrogen was supplied from a large H2 trailer located at the research facility. Additional utilities such as water supply and electrical connections were also integrated into the container. For safety, the setup included a ventilation system and an explosion-proof remote CCTV system for real-time monitoring. The internal layout of the evaluation container is illustrated in Figure 2d.
The voltage stability and performance of the 1 kW stack were evaluated under various operating conditions. Three current density levels were selected for testing: 0.30 A/cm2 for low-load operation, 0.55 A/cm2 for medium-load operation, and 1.00 A/cm2 for high-power operation. For each current density, constant current tests were conducted for approximately 30 min to monitor the voltage behavior over time. The coolant inlet temperature (65 °C) and gas pressures (2.5/2.5 bara for H2/O2) were kept constant throughout the tests, while humidity and flow rates were varied systematically. Humidity levels of 30% and 50% were tested, and for each humidity condition, the stoichiometric flow ratios of both H2 and O2 were set to 1.3, 1.5, 1.8, and 2.0. The detailed test matrix is summarized in Table 2. Prior to stack testing, activation procedures were performed under the same conditions as those used for the single cell evaluations.

Table 2.
Summary of operating parameters and test conditions for 1 kW stack performance evaluation.
3. Results and Discussion
3.1. Single Cell Evaluation
To derive insights relevant to the design of stack components, it is essential to first understand the behavior of a stack under various operational conditions. Initiating experiments directly at the multi-cell level introduces uncertainties regarding the origin of observed phenomena, as it becomes difficult to distinguish whether performance and stability characteristics arise from intrinsic cell properties or from the effects of cell stacking. Therefore, to isolate the behavior of individual MEAs and eliminate stacking effects, a single cell evaluation with selected MEA was conducted prior to stack assembly, and these results served as a reference for the subsequent stack-level evaluation.
The reference MEA used in this study was developed by KOLON Industry Co., for AIP applications. It incorporates a reinforced composite membrane that is approximately 2–3 times thicker than those typically used in automotive PEMFCs, providing enhanced stability under high-pressure hydrogen and oxygen environments. Electrodes were prepared with platinum loadings approximately twice as high as those used in conventional air-based PEMFCs, in order to ensure high efficiency under high-voltage operation. Furthermore, highly crystalline carbon supports are utilized to mitigate carbon corrosion under high-humidity and high-voltage operation [14,15,16], although this approach entails a trade-off, namely reduced porosity and specific surface area [17,18]. As a result, electrodes are fabricated with increased thickness to maintain equivalent Pt loading levels, further contributing to greater electrode thickness.
Key operating parameters examined in the single cell tests included cell temperature, gas pressure, relative humidity, and stoichiometric flow rates. In AIP fuel cell systems, the BOP components must operate with minimal power consumption, which necessitates reduced use of recirculation pumps. Since both hydrogen and oxygen are supplied from high-pressure storage tanks, no additional energy is required for compression, enabling high operating pressures without added energy cost. However, excessive pressure increases the risk of gas crossover [19], necessitating appropriate pressure regulation to ensure system reliability. In this study, the maximum operating pressure was limited to 2.5 bara. Even without an external humidifier, humidity levels of at least 50% can be maintained through the recirculation of product gases. Based on this assumption, the reference condition was set at 65 °C cell temperature, 1.3 stoichiometric flow, 50% relative humidity, and 2.5 bara pressure (see Table 1). Under these reference conditions, systematic variations in pressure, temperature, humidity, and flow rate were applied to assess their individual effects on cell performance.
3.1.1. Gas Pressure (1.0~2.5 bara)
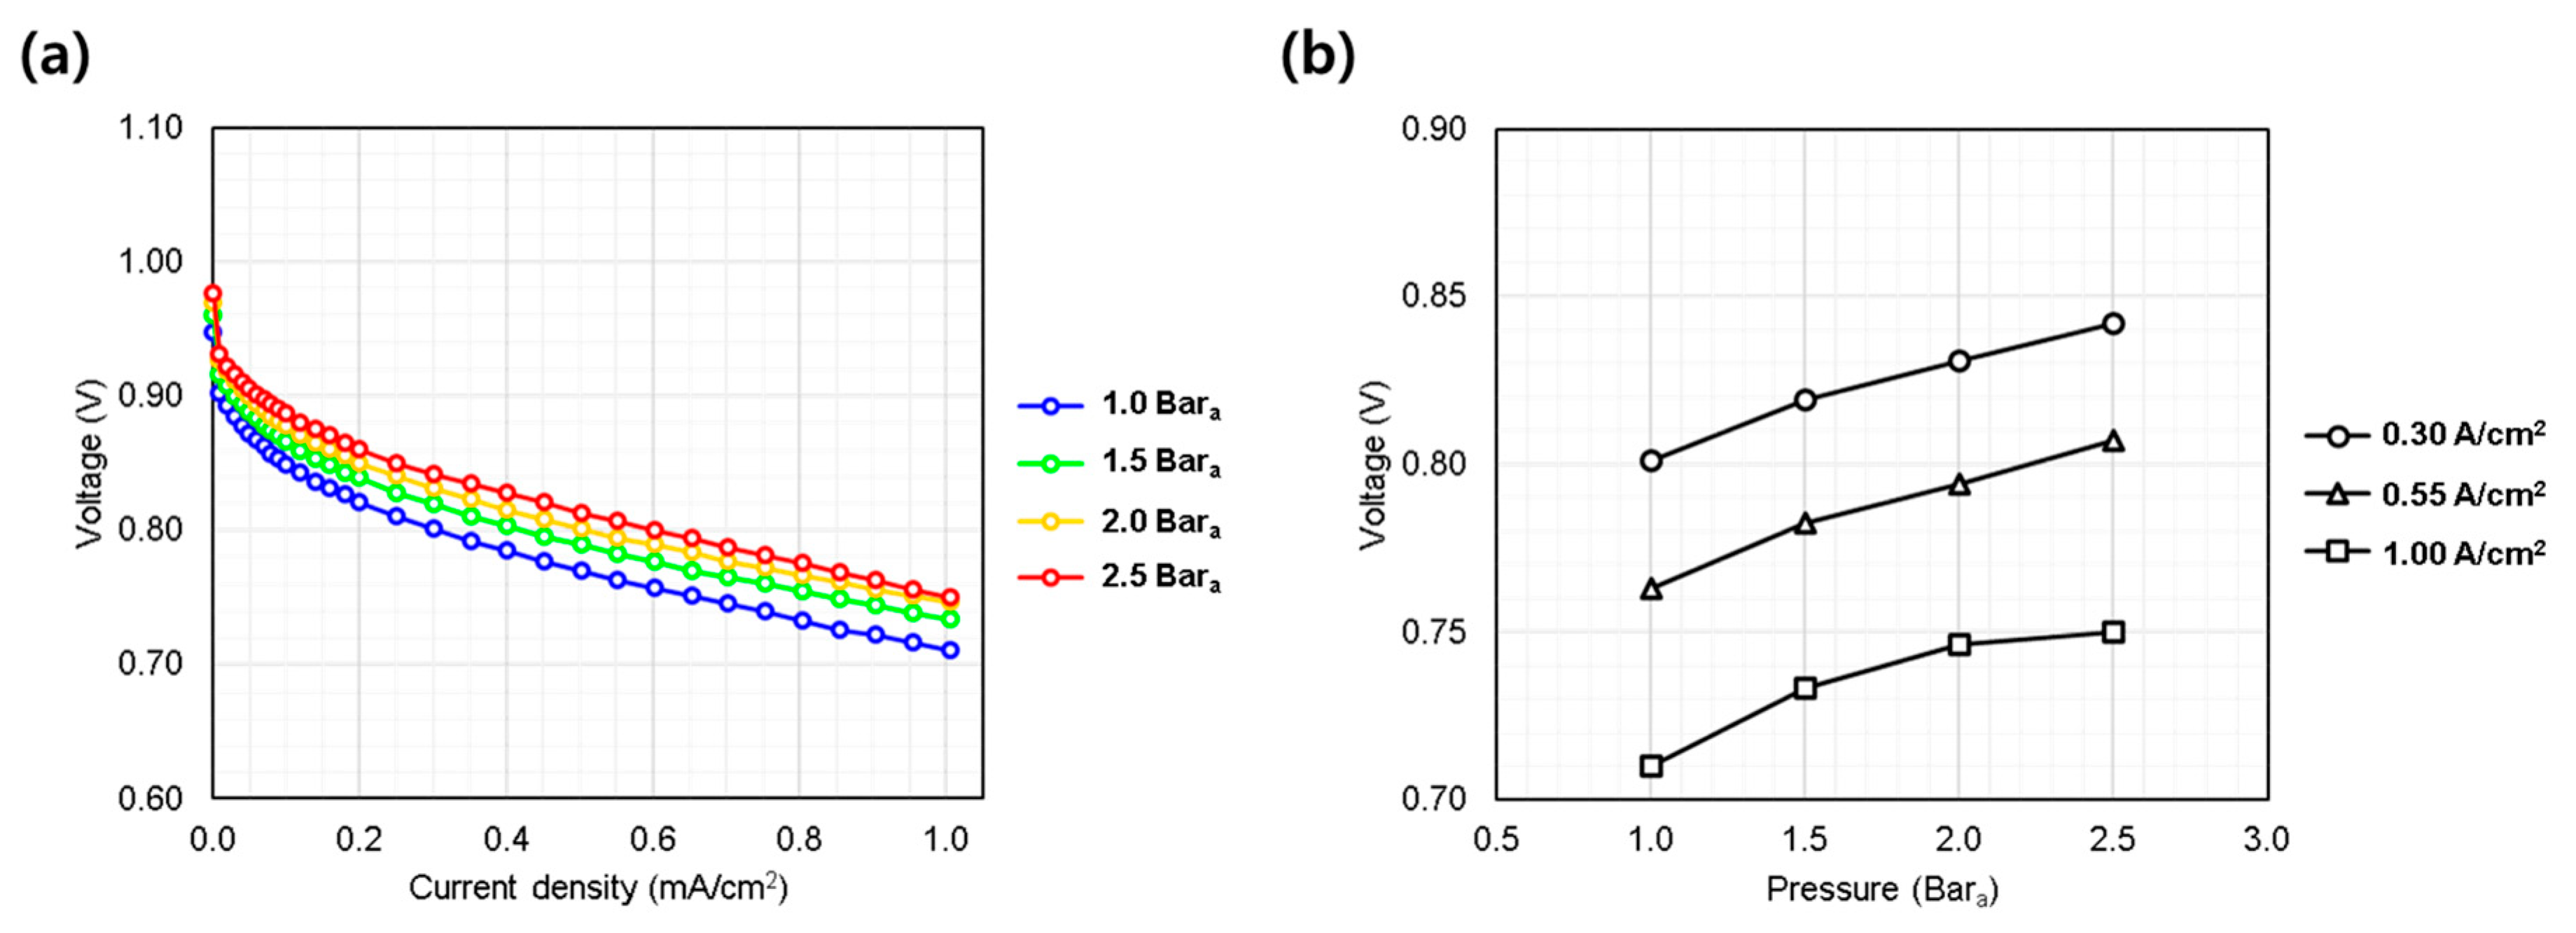
Figure 3a presents the polarization curves obtained at pressures of 1.0, 1.5, 2.0, and 2.5 bara. As expected, higher pressure enhanced the overall performance, particularly in the low current density region, through increased thermodynamic potential and reaction kinetics. However, beyond 0.4 A/cm2, the IV curves converged to nearly parallel slopes, suggesting that the primary effect of pressure was limited to activation polarization. The diminishing performance gain at higher pressures (e.g., from 2.0 to 2.5 bara) suggests a saturation effect (Figure 3b). Although increased pressure enhances performance, the benefit decreases at higher levels, highlighting the need to optimize operating pressure by balancing performance gains against membrane durability and system stability. Excessive pressure may accelerate membrane degradation and compromise reliability [19]; thus, appropriate depressurization and membrane thickness selection are essential for stable AIP operation.
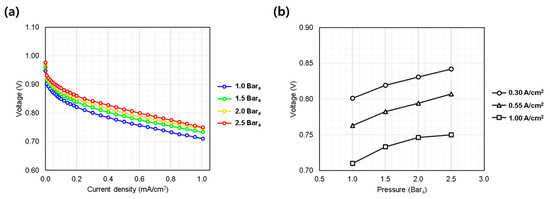
Figure 3.
Single cell performance evaluation under varying hydrogen/oxygen gas pressures (1.0~2.5 bara). (a) IV curves measured from 0.0 to 1.0 A/cm2; (b) voltage behavior at representative current densities: low (0.30 A/cm2), medium (0.55 A/cm2), and high (1.00 A/cm2).
3.1.2. Cell Temperature (35~90 °C)
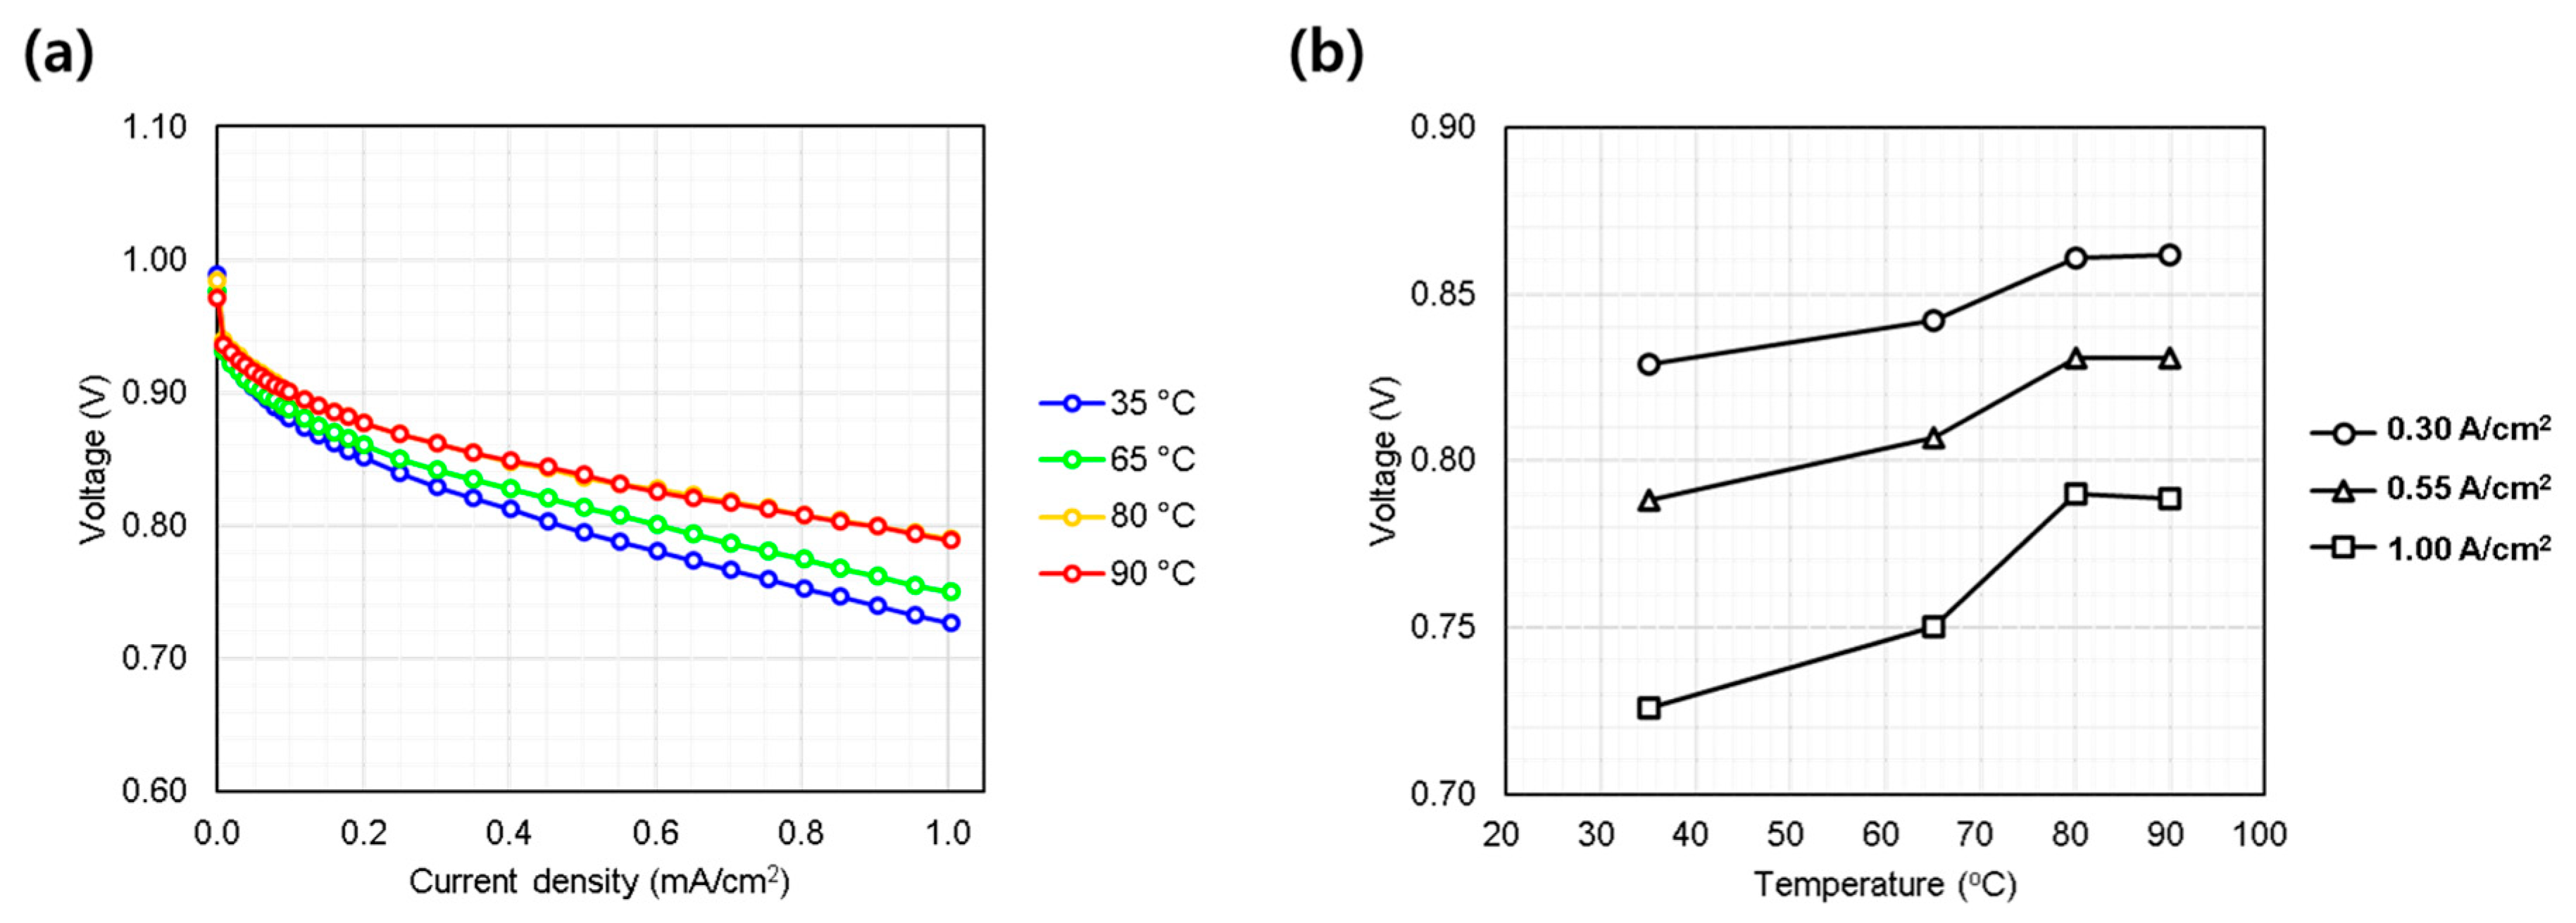
Figure 4a shows the temperature dependence of performance, evaluated at 35, 65, 80, and 90 °C. Performance improved with increasing temperature, consistent with known trends due to enhanced electrode kinetics and proton conductivity [20]. Unlike the pressure test, temperature influenced both the low and high current density regimes, as evidenced by diverging slopes above 0.4 A/cm2. This indicates that thermal activation also reduces ohmic overpotentials, benefiting both catalyst and membrane performance. Notably, performance gains between 80 and 90 °C were marginal, likely due to internal heating effects reducing the net thermal difference in the MEA (Figure 4b). While higher cell temperatures generally enhance the reaction kinetics and proton conductivity within the fuel cell [20], this same effect applies to the kinetics of degradation reactions. Therefore, temperatures above 90 °C are rarely adopted in conventional PEMFC systems, as they accelerate membrane chemical degradation and compromise long-term durability. Furthermore, in practical applications, it is difficult for BOP to precisely control relative humidity as in laboratory evaluations. Under high-temperature operation, the system is more likely to experience low-humidity conditions, which can negatively impact both cell performance and membrane durability. Consequently, cell temperature must be optimized in consideration of both the intended application and the capabilities of the BOP to ensure stable and reliable fuel cell operation.
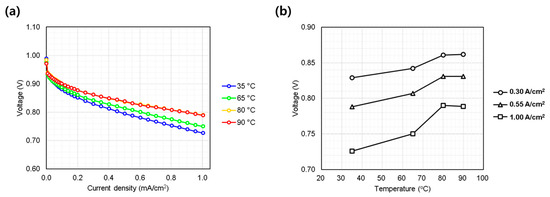
Figure 4.
Single cell performance evaluation under varying cell coolant temperature (35~90 °C at inlet port). (a) IV curves measured from 0.0 to 1.0 A/cm2; (b) voltage behavior at representative current densities: low (0.30 A/cm2), medium (0.55 A/cm2), and high (1.00 A/cm2).
3.1.3. Relative Humidity (30~100%)
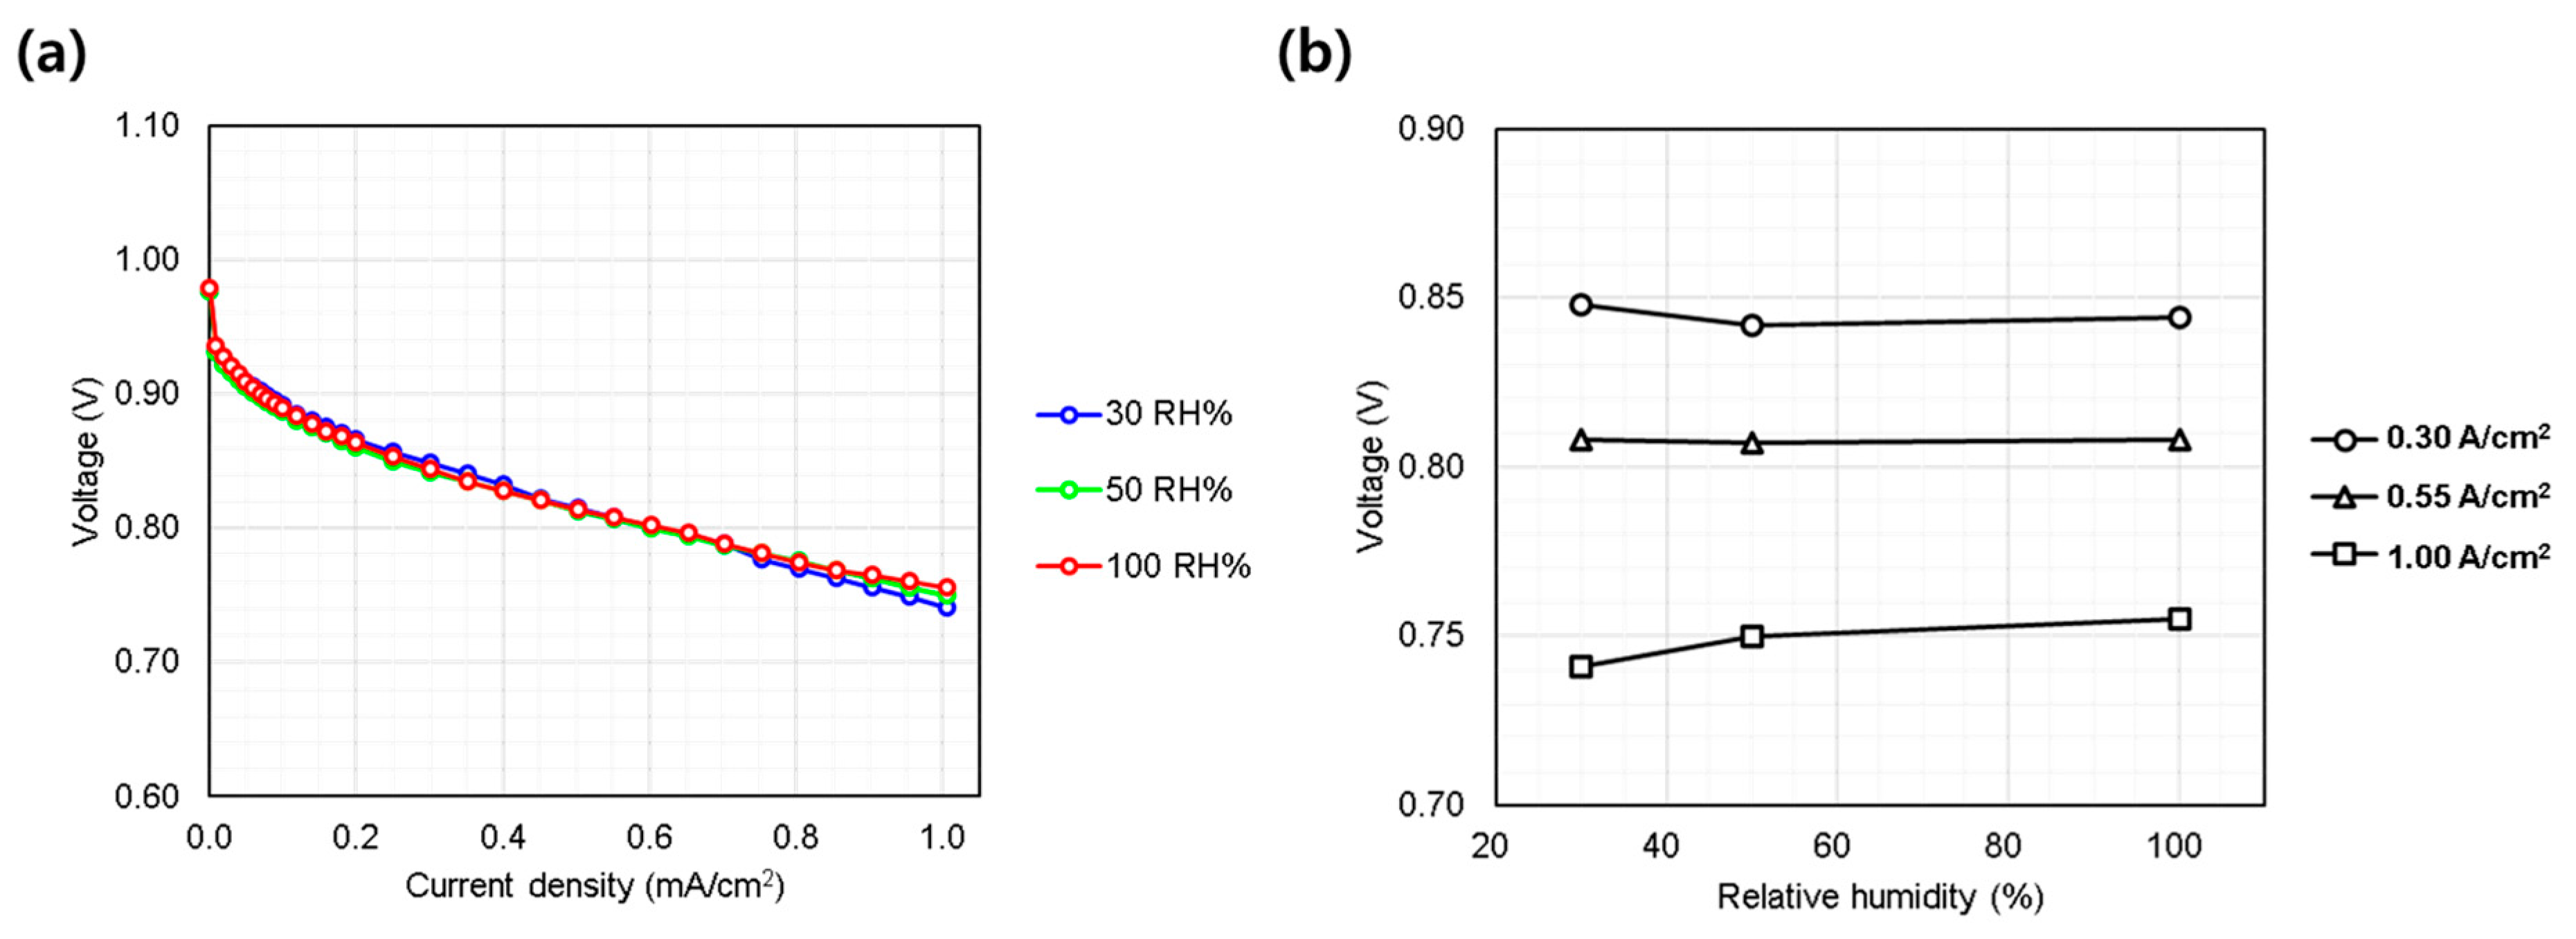
Humidity effects were evaluated by varying relative humidity from 30% to 100% (Figure 5a). In general, except in cases where flooding occurs and water removal becomes insufficient, higher humidity levels tend to improve performance [20] due to enhanced proton conductivity through the membrane and ionomer within the electrodes. However, in the current study, the single cell showed minimal sensitivity to humidity variations (Figure 5b). This unusual behavior, differing from typical automotive PEMFC systems, can be attributed to the MEA design, particularly the thick membrane and electrodes, which help retain water and maintain internal humidification. Additionally, the high-pressure oxygen environment reduces the entropic overpotential, leading to lower heat generation within the electrodes compared to conventional PEMFCs. This thermal moderation helps retain water within the cell, even under low-humidity conditions (as low as 30%), preventing excessive evaporation and maintaining adequate hydration for ionic conduction. Furthermore, the relatively low current densities employed in this study (≤1.0 A/cm2) minimize the risk of flooding within the electrodes, ensuring stable performance and eliminating instability or performance degradation typically associated with excessive humidity (≥50%). Consequently, the AIP-specific MEA developed by KOLON Industry, which served as the reference in this study, exhibited negligible sensitivity to humidity variations under the evaluated conditions. These findings provide valuable insights for subsequent stack-level evaluations.
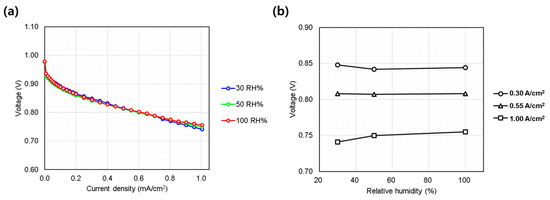
Figure 5.
Single cell performance evaluation under varying hydrogen/oxygen relative humidity (30~50%). (a) IV curves measured from 0.0 to 1.0 A/cm2; (b) voltage behavior at representative current densities: low (0.30 A/cm2), medium (0.55 A/cm2), and high (1.00 A/cm2).
3.1.4. Stoichiometric Flow Rate (1.3~2.0 Stoi’)
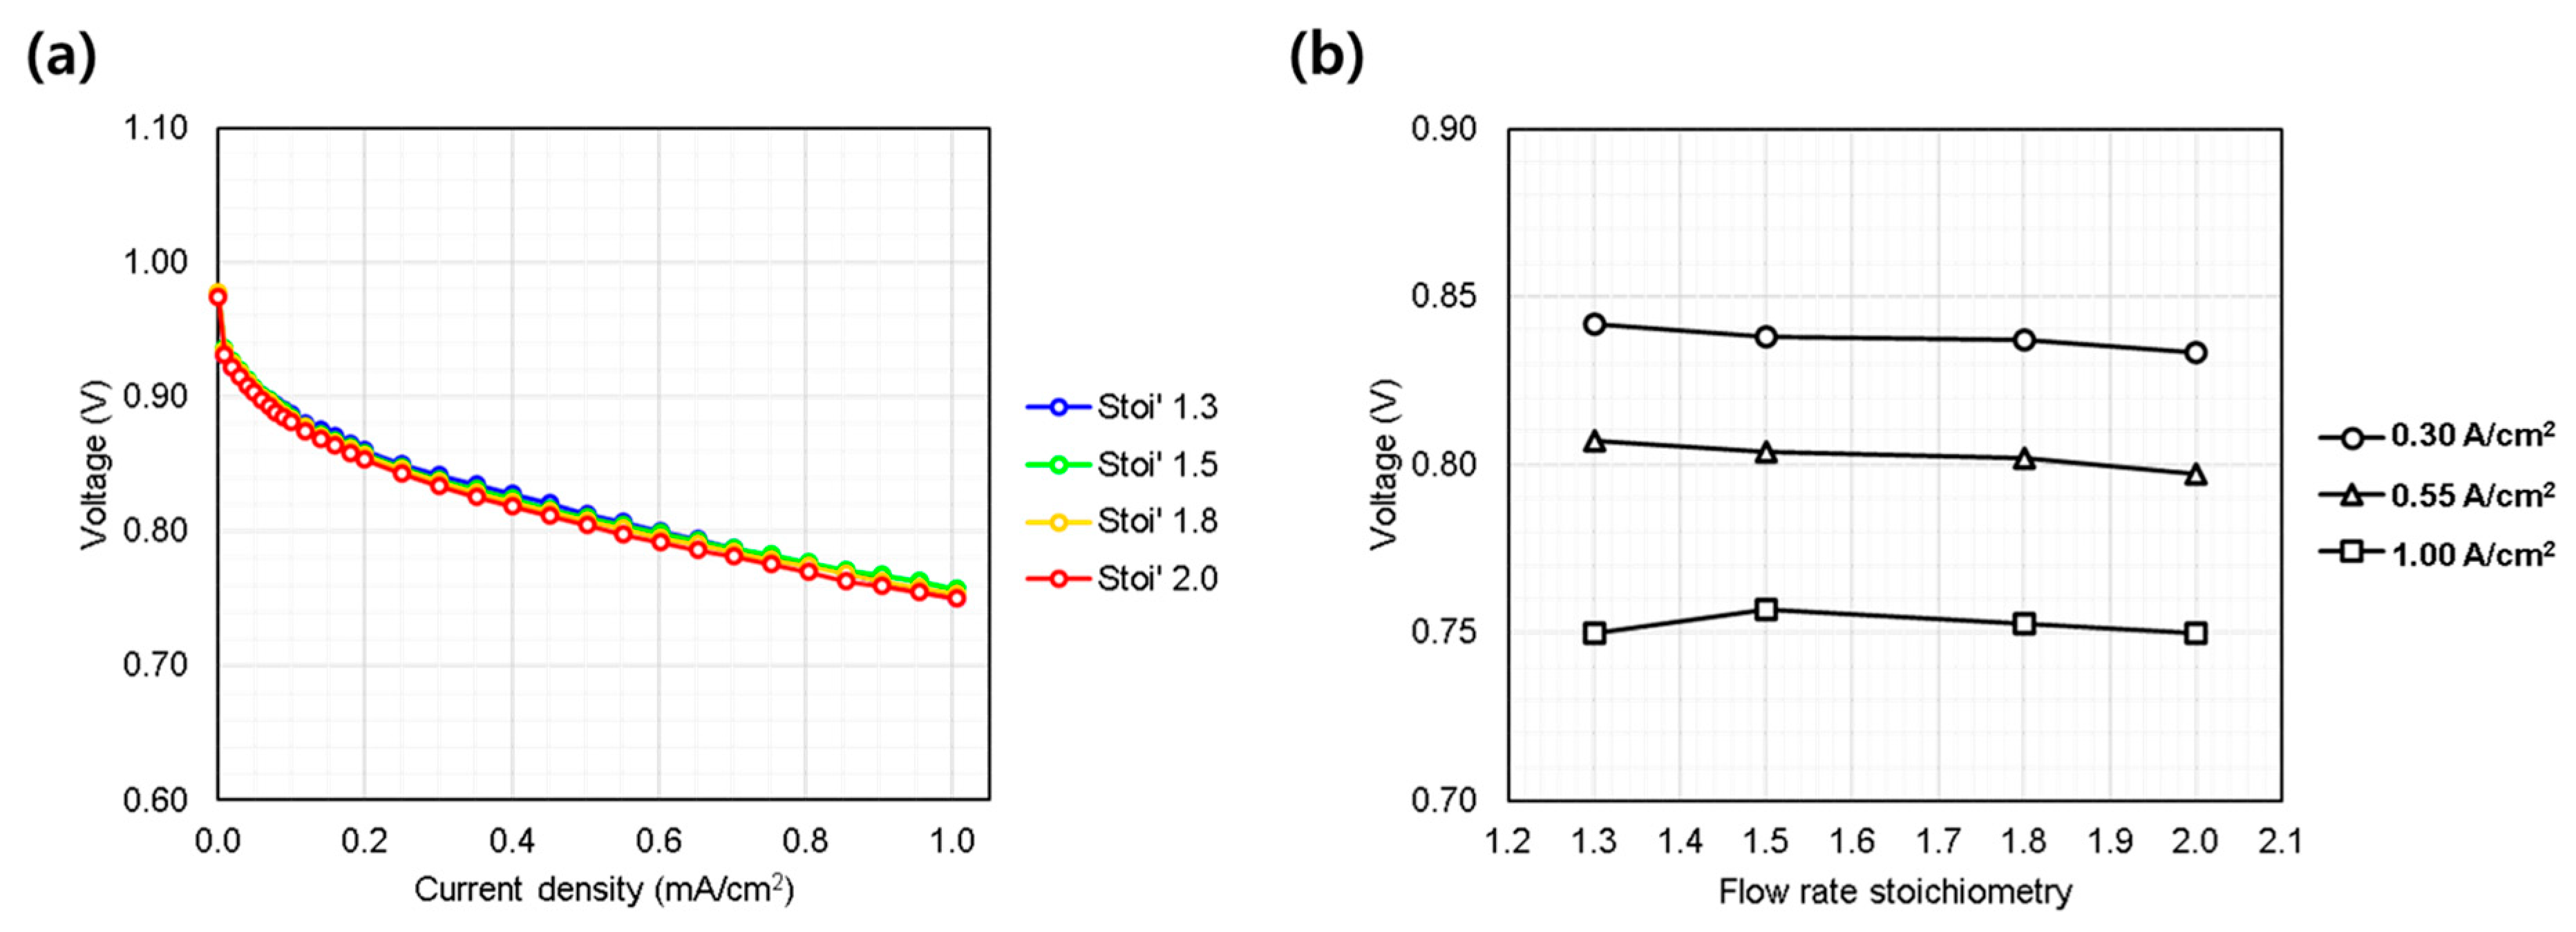
The stoichiometric flow ratio varied from the reference condition of 1.3 to 1.5, 1.8, and 2.0 to investigate the effect of reactant flow rate on cell performance. As observed in Figure 6a,b, the single cell performance showed minimal sensitivity to variations in flow rate. Typically, the performance of conventional fuel cells becomes sensitive to variations in flow rate primarily at high current densities, where mass transport limitations become more pronounced [2,21,22], or under conditions where excessive flooding occurs [23]. However, in this study, evaluations were conducted only at current densities below 1.0 A/cm2. Furthermore, since the oxidant was high-purity oxygen rather than air containing only 21% oxygen, the oxygen diffusion characteristics within the GDL and catalyst layers were expected to remain sufficiently high, independent of flow rate variations.
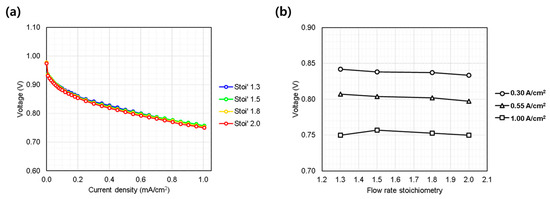
Figure 6.
Single cell performance evaluation under varying hydrogen/oxygen gas flow rate (Stoichiometry ratio: 1.3~2.0). (a) IV curves measured from 0.0 to 1.0 A/cm2; (b) voltage behavior at representative current densities: low (0.30 A/cm2), medium (0.55 A/cm2), and high (1.00 A/cm2).
In this section, the effects of key operating parameters on the single cell performance of the AIP fuel cell were investigated. Pressure and cell temperature had a significant impact on performance, whereas relative humidity and flow rate showed minimal influence. In addition to performance analysis, Figures S1–S4 present the time-dependent voltage profiles measured at representative current densities for each polarization curve discussed above. Across all evaluated cases, the voltage profiles demonstrated stable behavior over time, indicating reliable operation under the tested conditions.
3.2. 1 kW Stack Evaluation
Single cell evaluations primarily focus on the in-plane behavior of fuel cells, effectively isolating the impact of the MEA, GDL, and flow channel characteristics while minimizing the influence of stacking effects. In such configurations as we have seen in Section 3.1, pressure and temperature have a direct influence on cell performance, whereas humidity and flow rate exhibit relatively minor effects. Since these dependencies may vary depending on specific in-plane (cell) component designs, the single cell results obtained in this study serve as a reference baseline for subsequent stack evaluations. Given that the same cell configuration was used, polarization curves were not deemed necessary for the stack tests. Instead, the stack-level analysis focused on voltage stability over time at representative current densities, similar to the single cell evaluations (Figures S1–S4). Because the stack components and the MEA were developed separately, some mismatch likely occurred—most notably in the compression of the GDLs—which may have limited maximum performance and hindered water removal. Nevertheless, since the configuration was kept constant throughout testing, the setup was still appropriate for analyzing stack voltage behavior under varying operating conditions. While better component matching could potentially improve performance, it does not affect the validity of the study’s objective.
For the 1 kW stack tests, the in-plane components (i.e., in-cell components) were identical to those used in the single cell evaluations, enabling a focused investigation of the differences arising from stacking (through-plane) effects. In particular, the through-plane behavior—such as the ability to manage product water across stack manifold—was emphasized over electrochemical performance (related to cell and MEA characteristics). Therefore, the stack tests were designed to evaluate the mechanical handling of generated water under varying humidity and flow rate distribution, while tests involving pressure and temperature variations were excluded, as outlined in Table 2. Representative current densities for low (0.30 A/cm2), medium (0.55 A/cm2), and high (1.00 A/cm2) load conditions were selected to systematically evaluate voltage stability.
3.2.1. Current Density: 0.30 A/cm2
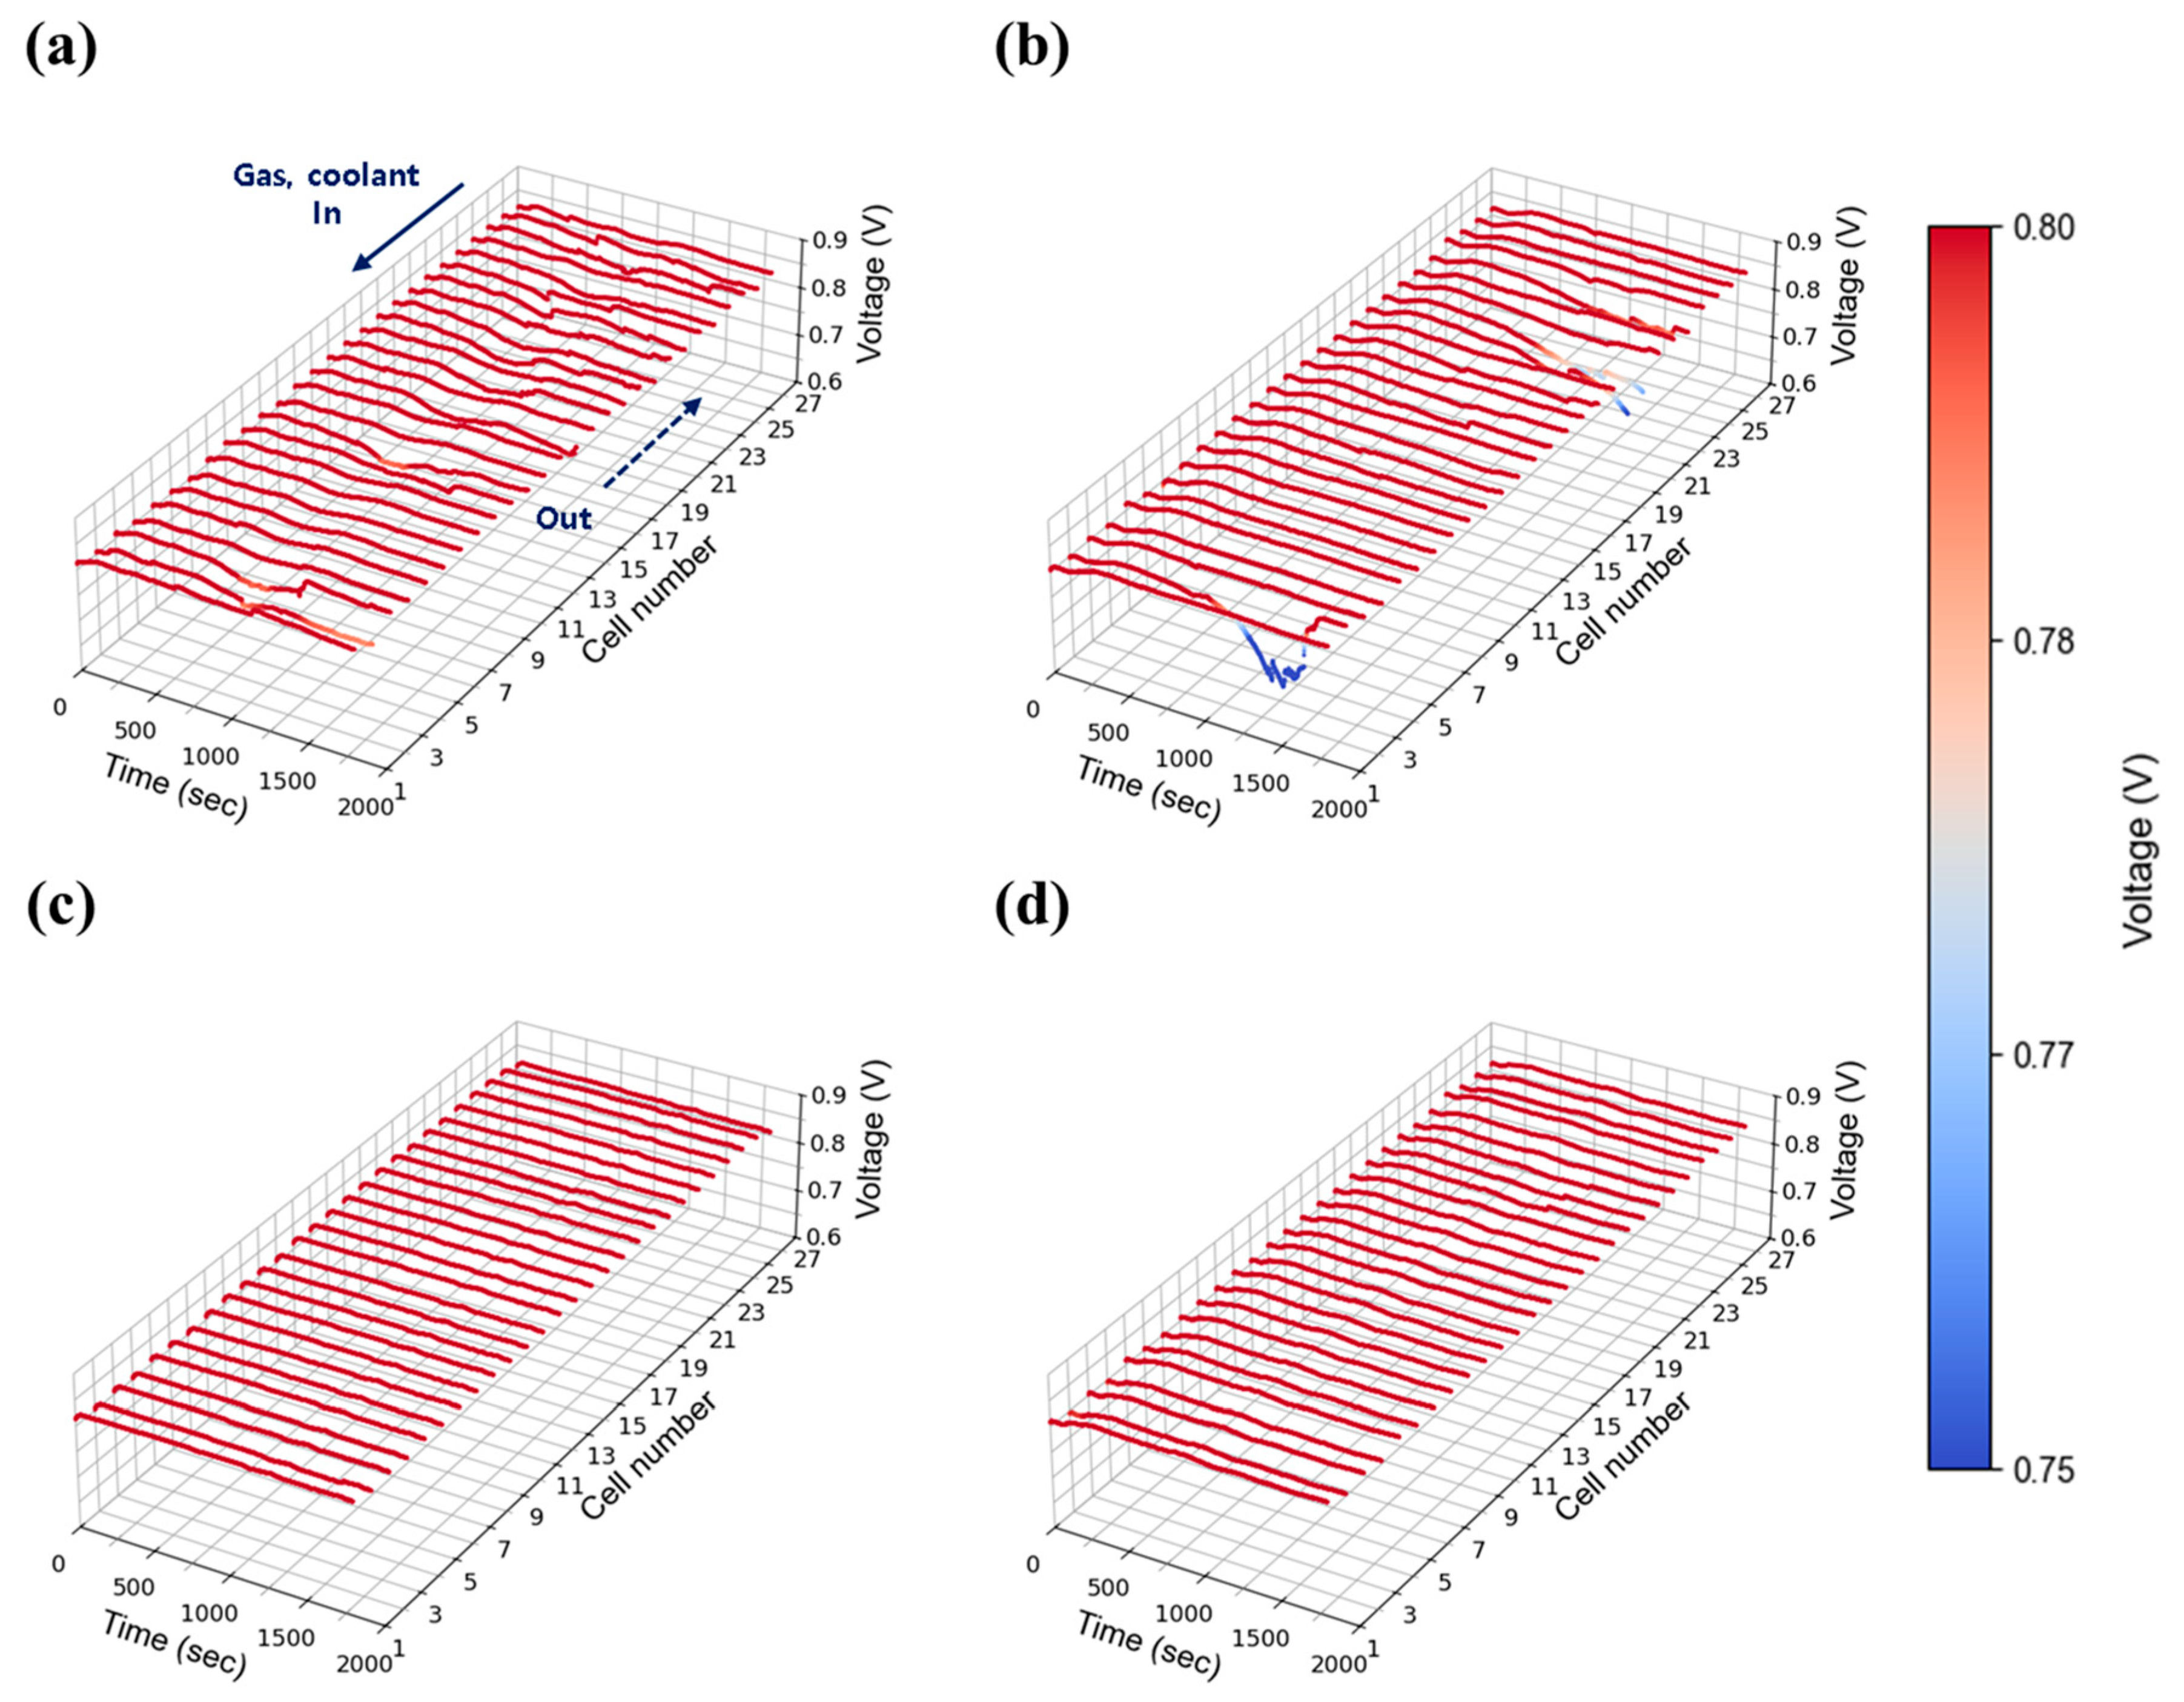
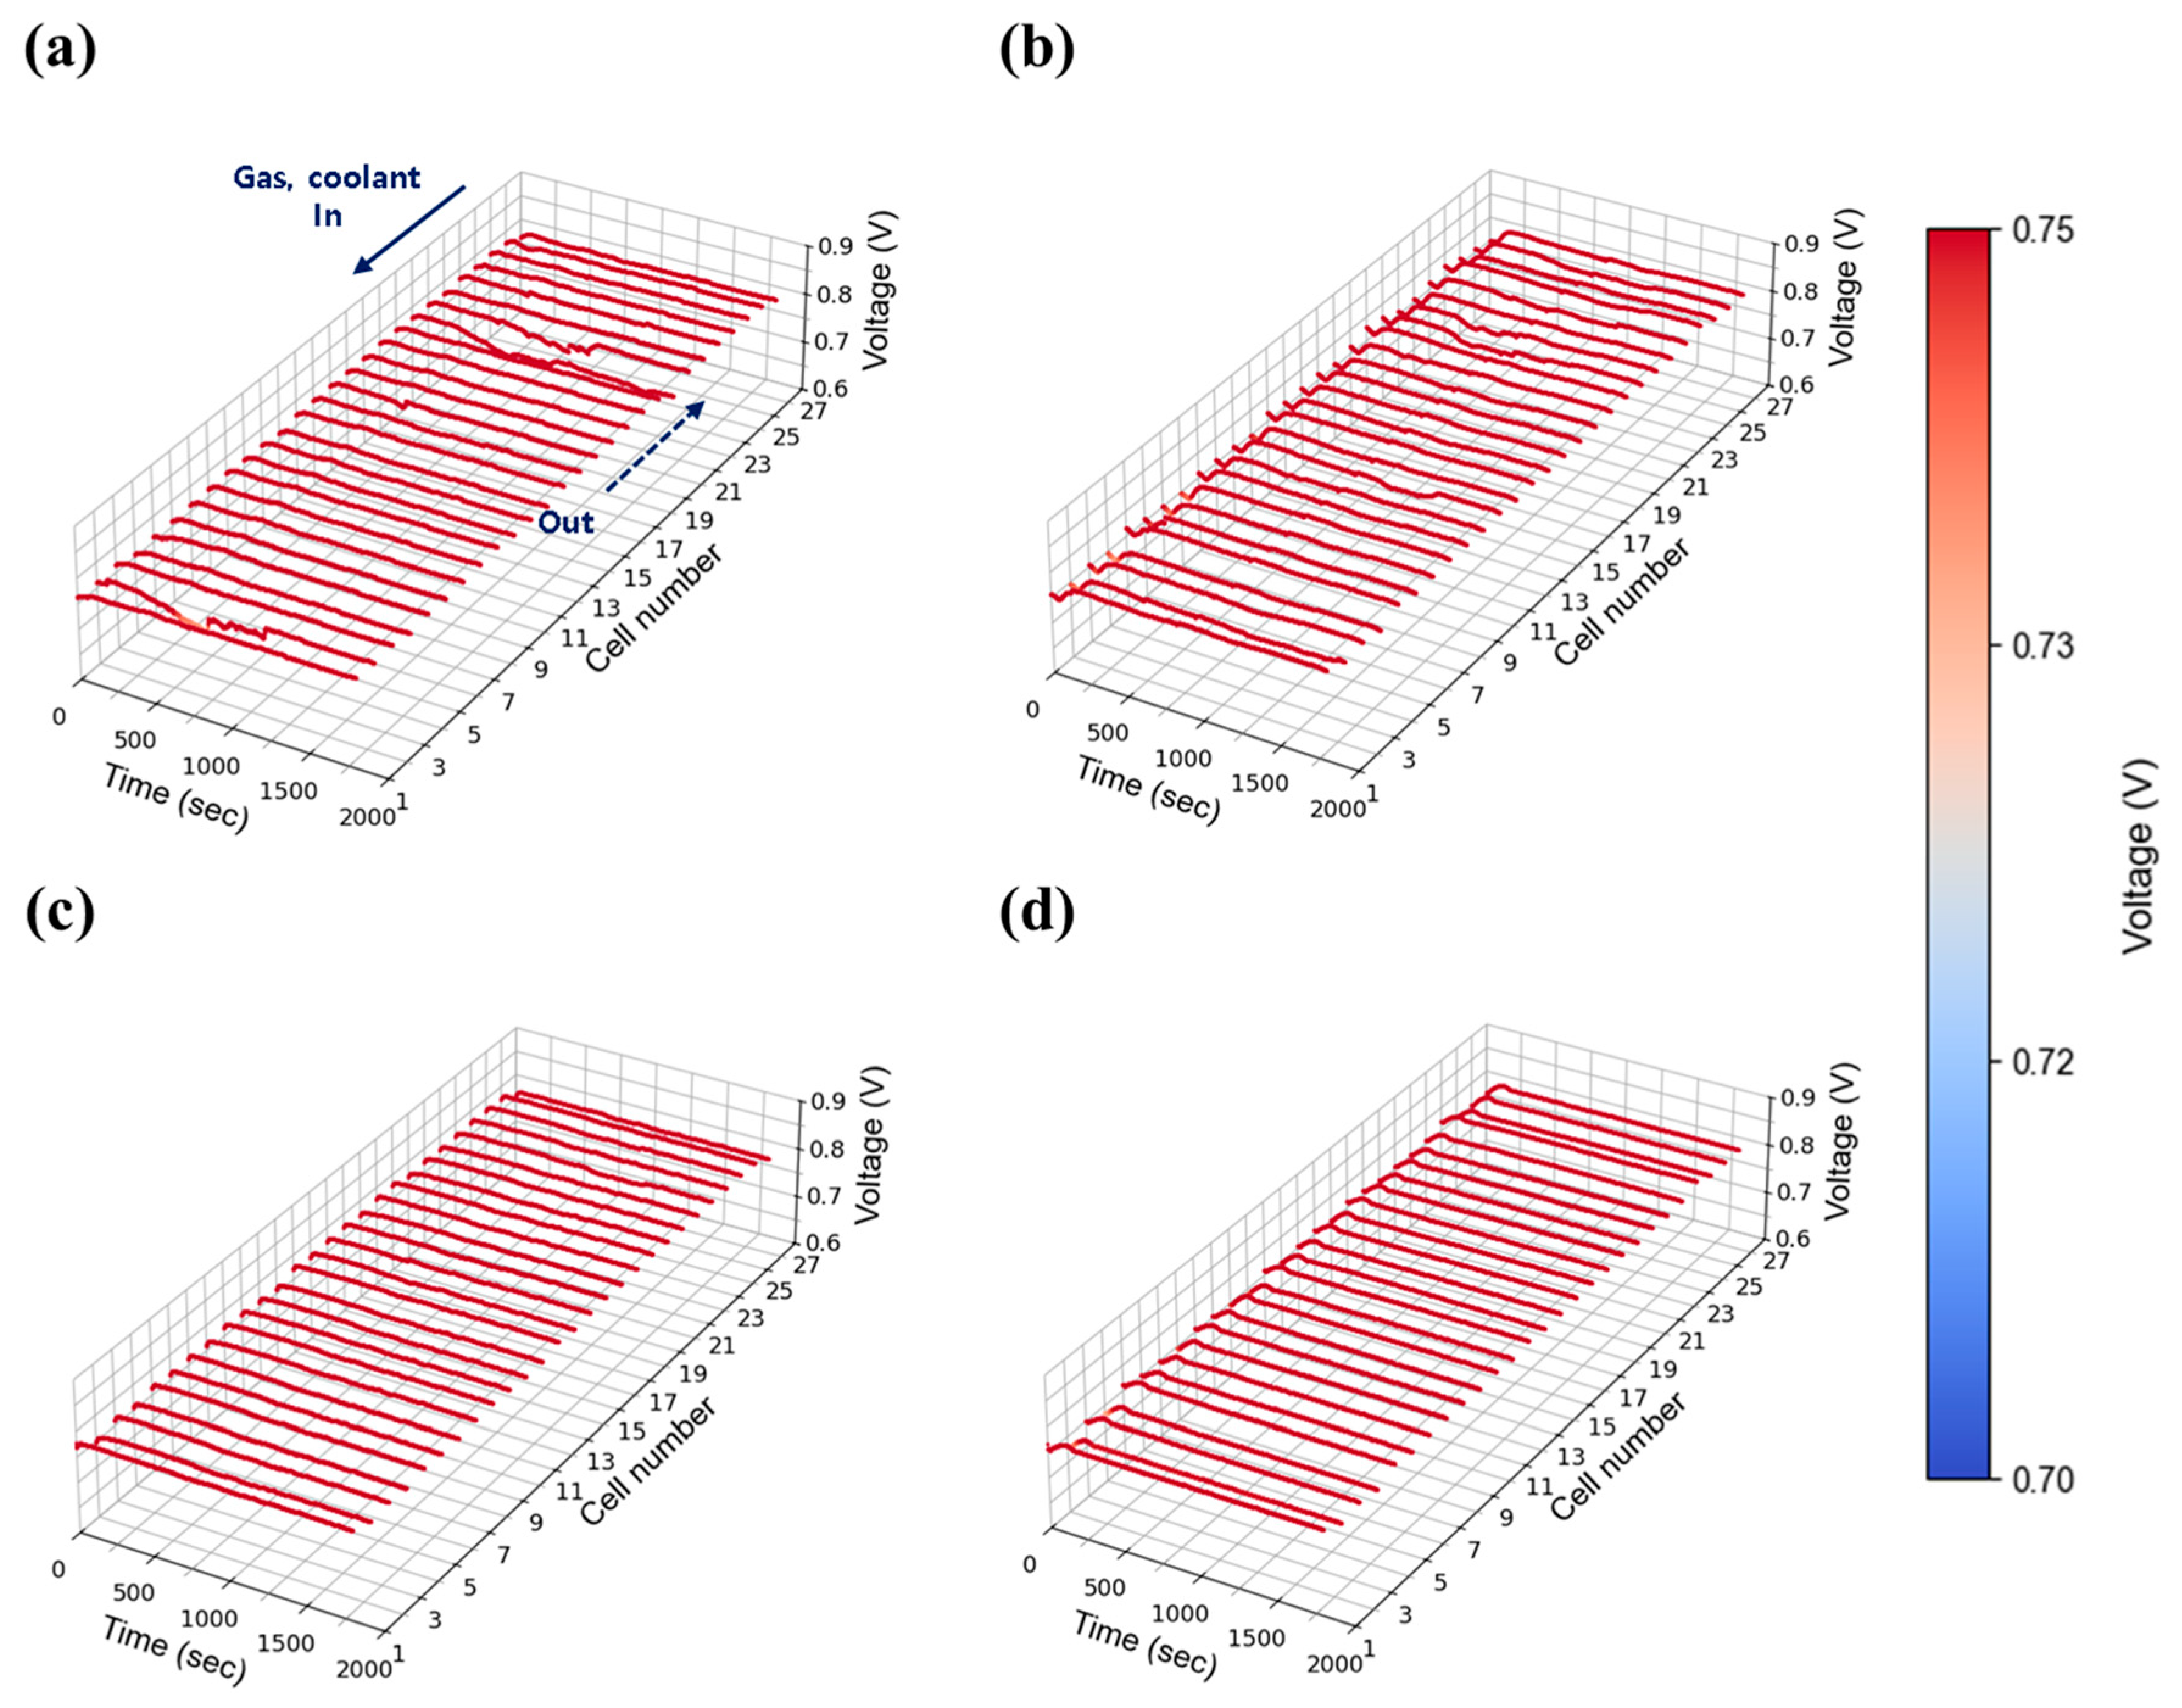
At a low current density of 0.30 A/cm2, the stack’s behavior was evaluated under varying flow rates and humidity conditions. Figure 7a–d present the time-dependent voltage profiles at 30% relative humidity, with stoichiometric flow rates adjusted to 1.3, 1.5, 1.8, and 2.0, respectively. Consistent with single cell data for Figure 6, overall performance showed minimal variation across flow rates and humidity. However, unstable voltage behavior was observed at lower flow rates (stoichiometry 1.3 and 1.5) as shown in Figure 7a,b, which gradually stabilized when the flow was increased to 2.0 and above (Figure 7c,d). This suggests that even at low current densities—where water generation is limited—insufficient absolute flow rates hinder the mechanical removal of water from the cells. Given that flow rate is proportional to current density with stoichiometry ratio, the absolute gas flow at 0.30 A/cm2 (e.g., 2.84 LPM O2 at stoichiometry 1.3) was inherently low compared to the stack capacity, limiting the effective diffusion of reactant gases within the stack and further contributing to instability.
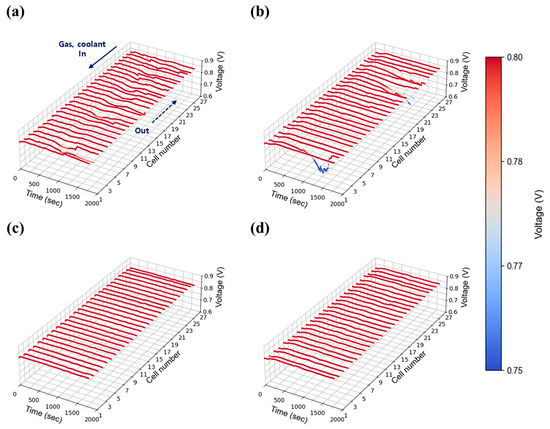
Figure 7.
Constant current evaluation of the 1 kW stack (27 cells) at 0.30 A/cm2 and 30% relative humidity: H2/O2 flow rate stoichiometry (a) 1.3, (b) 1.5, (c) 1.8, and (d) 2.0.
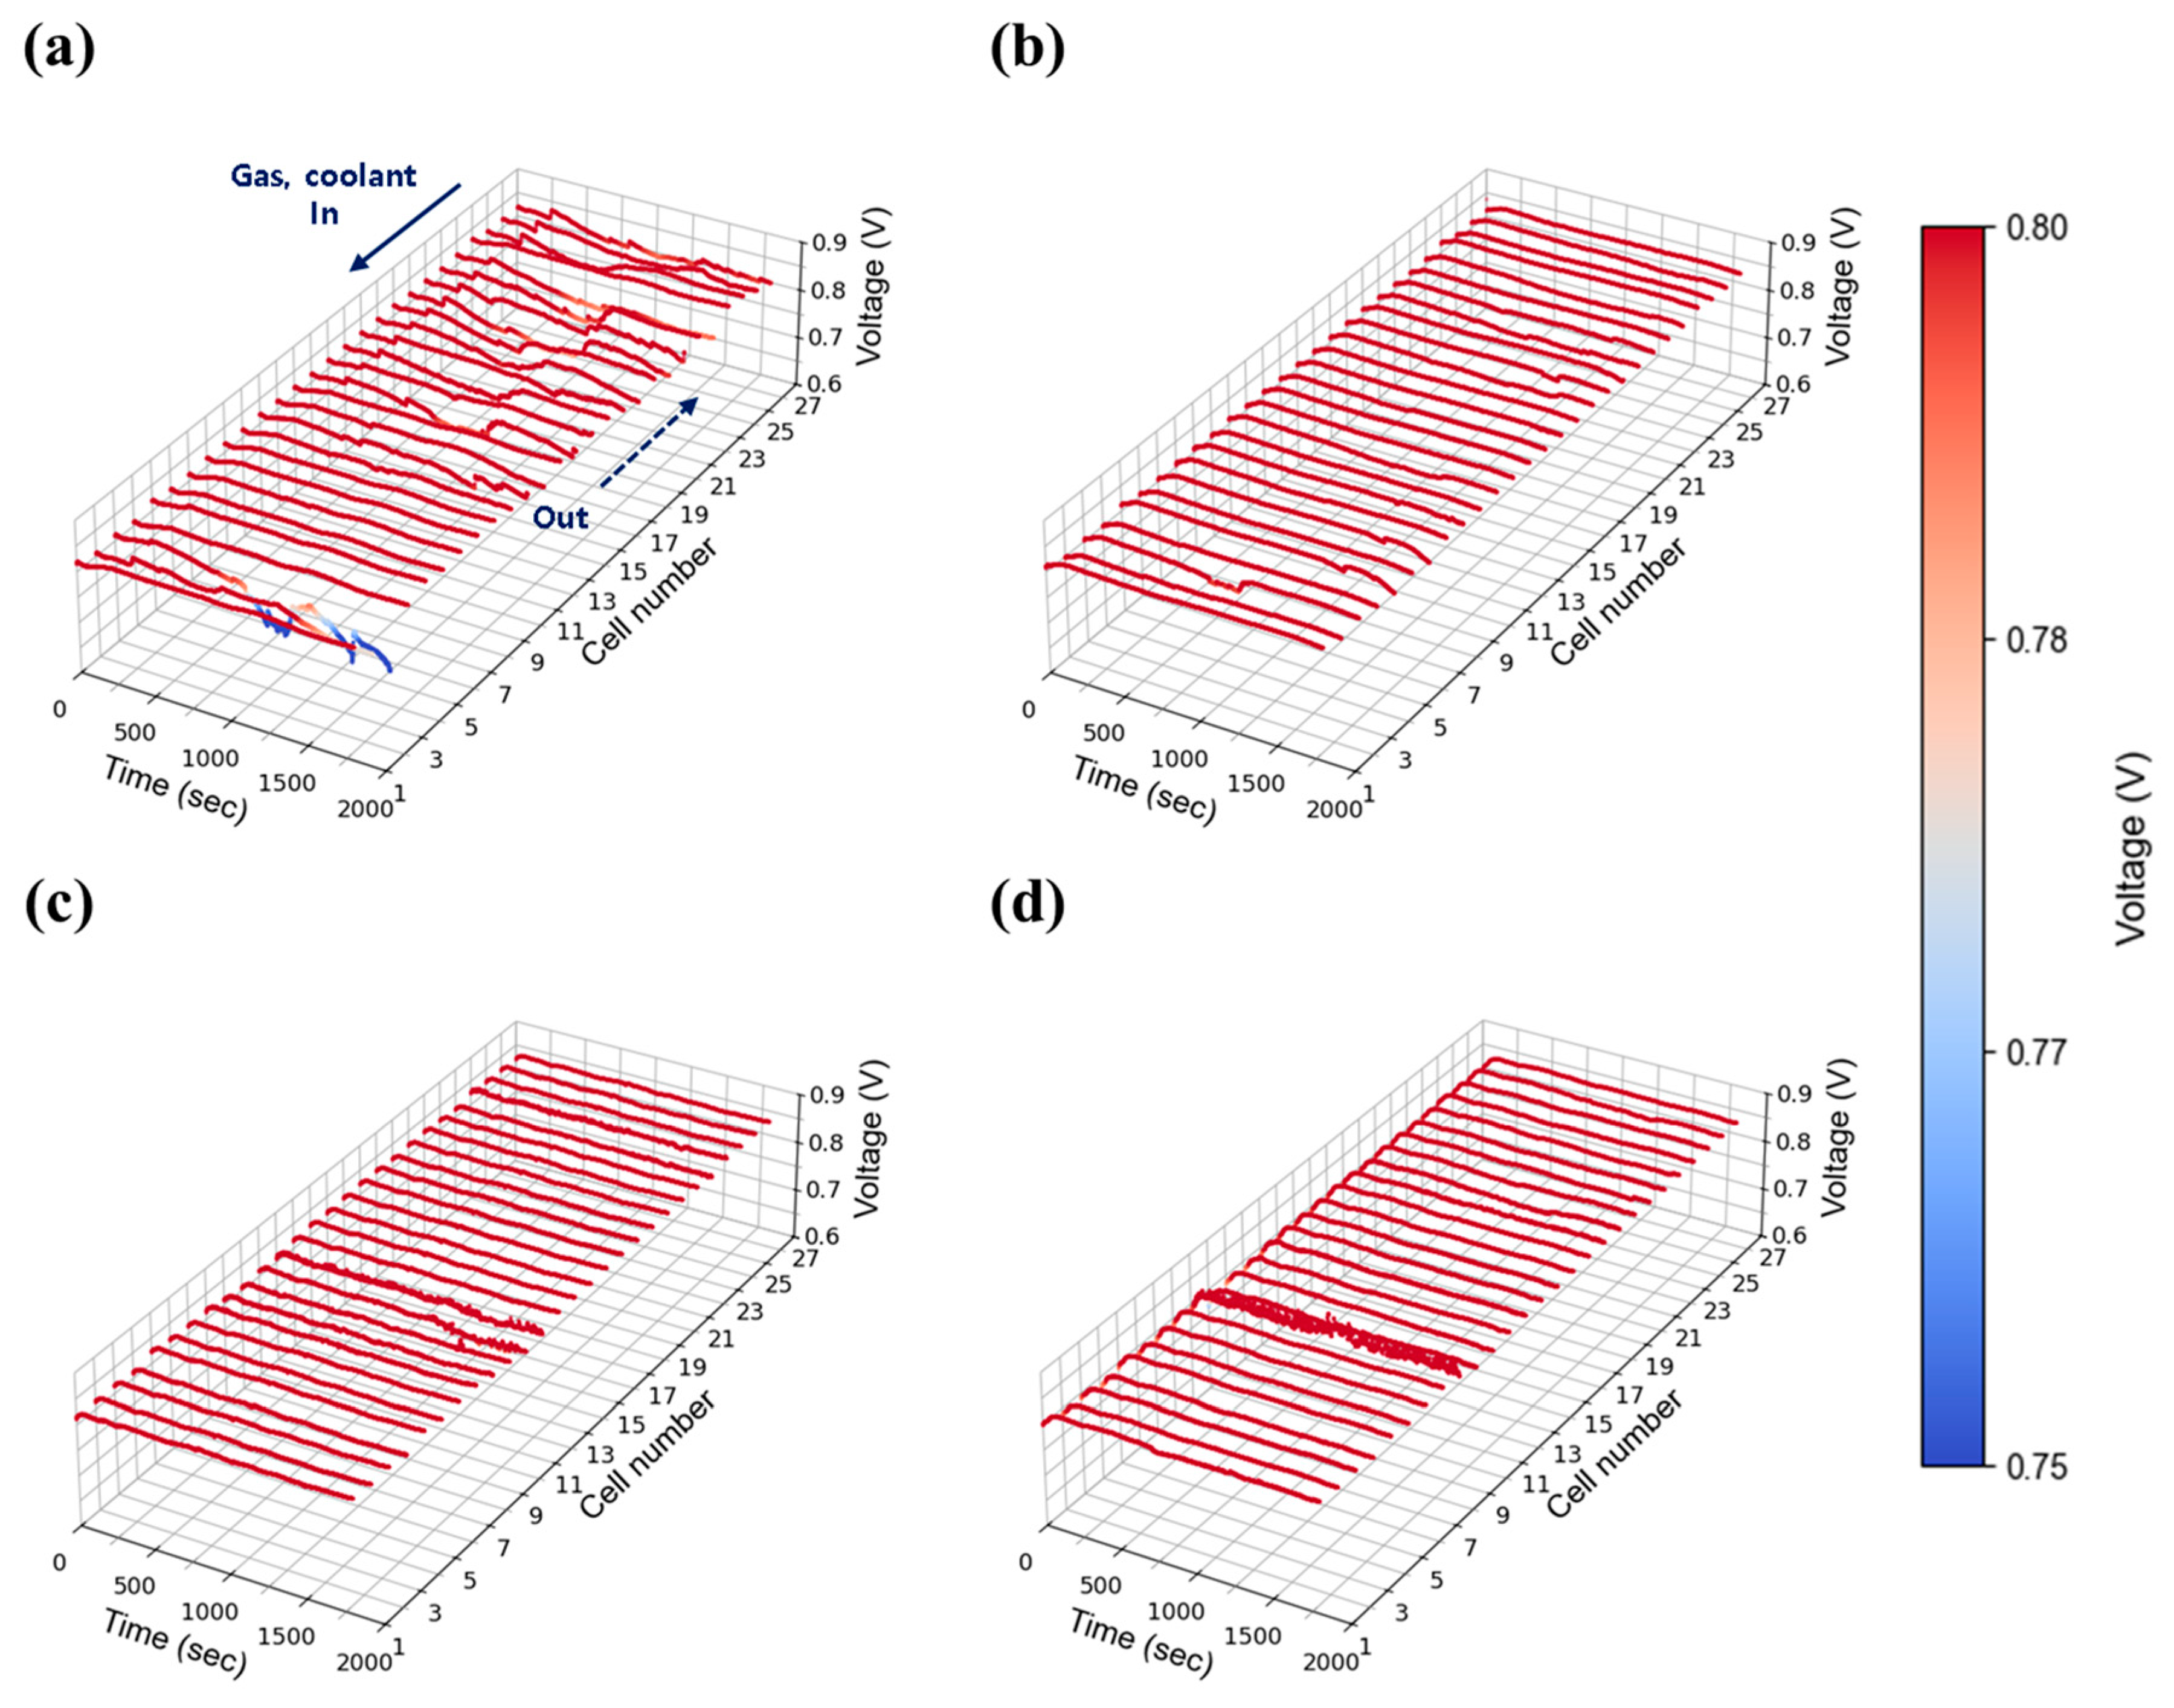
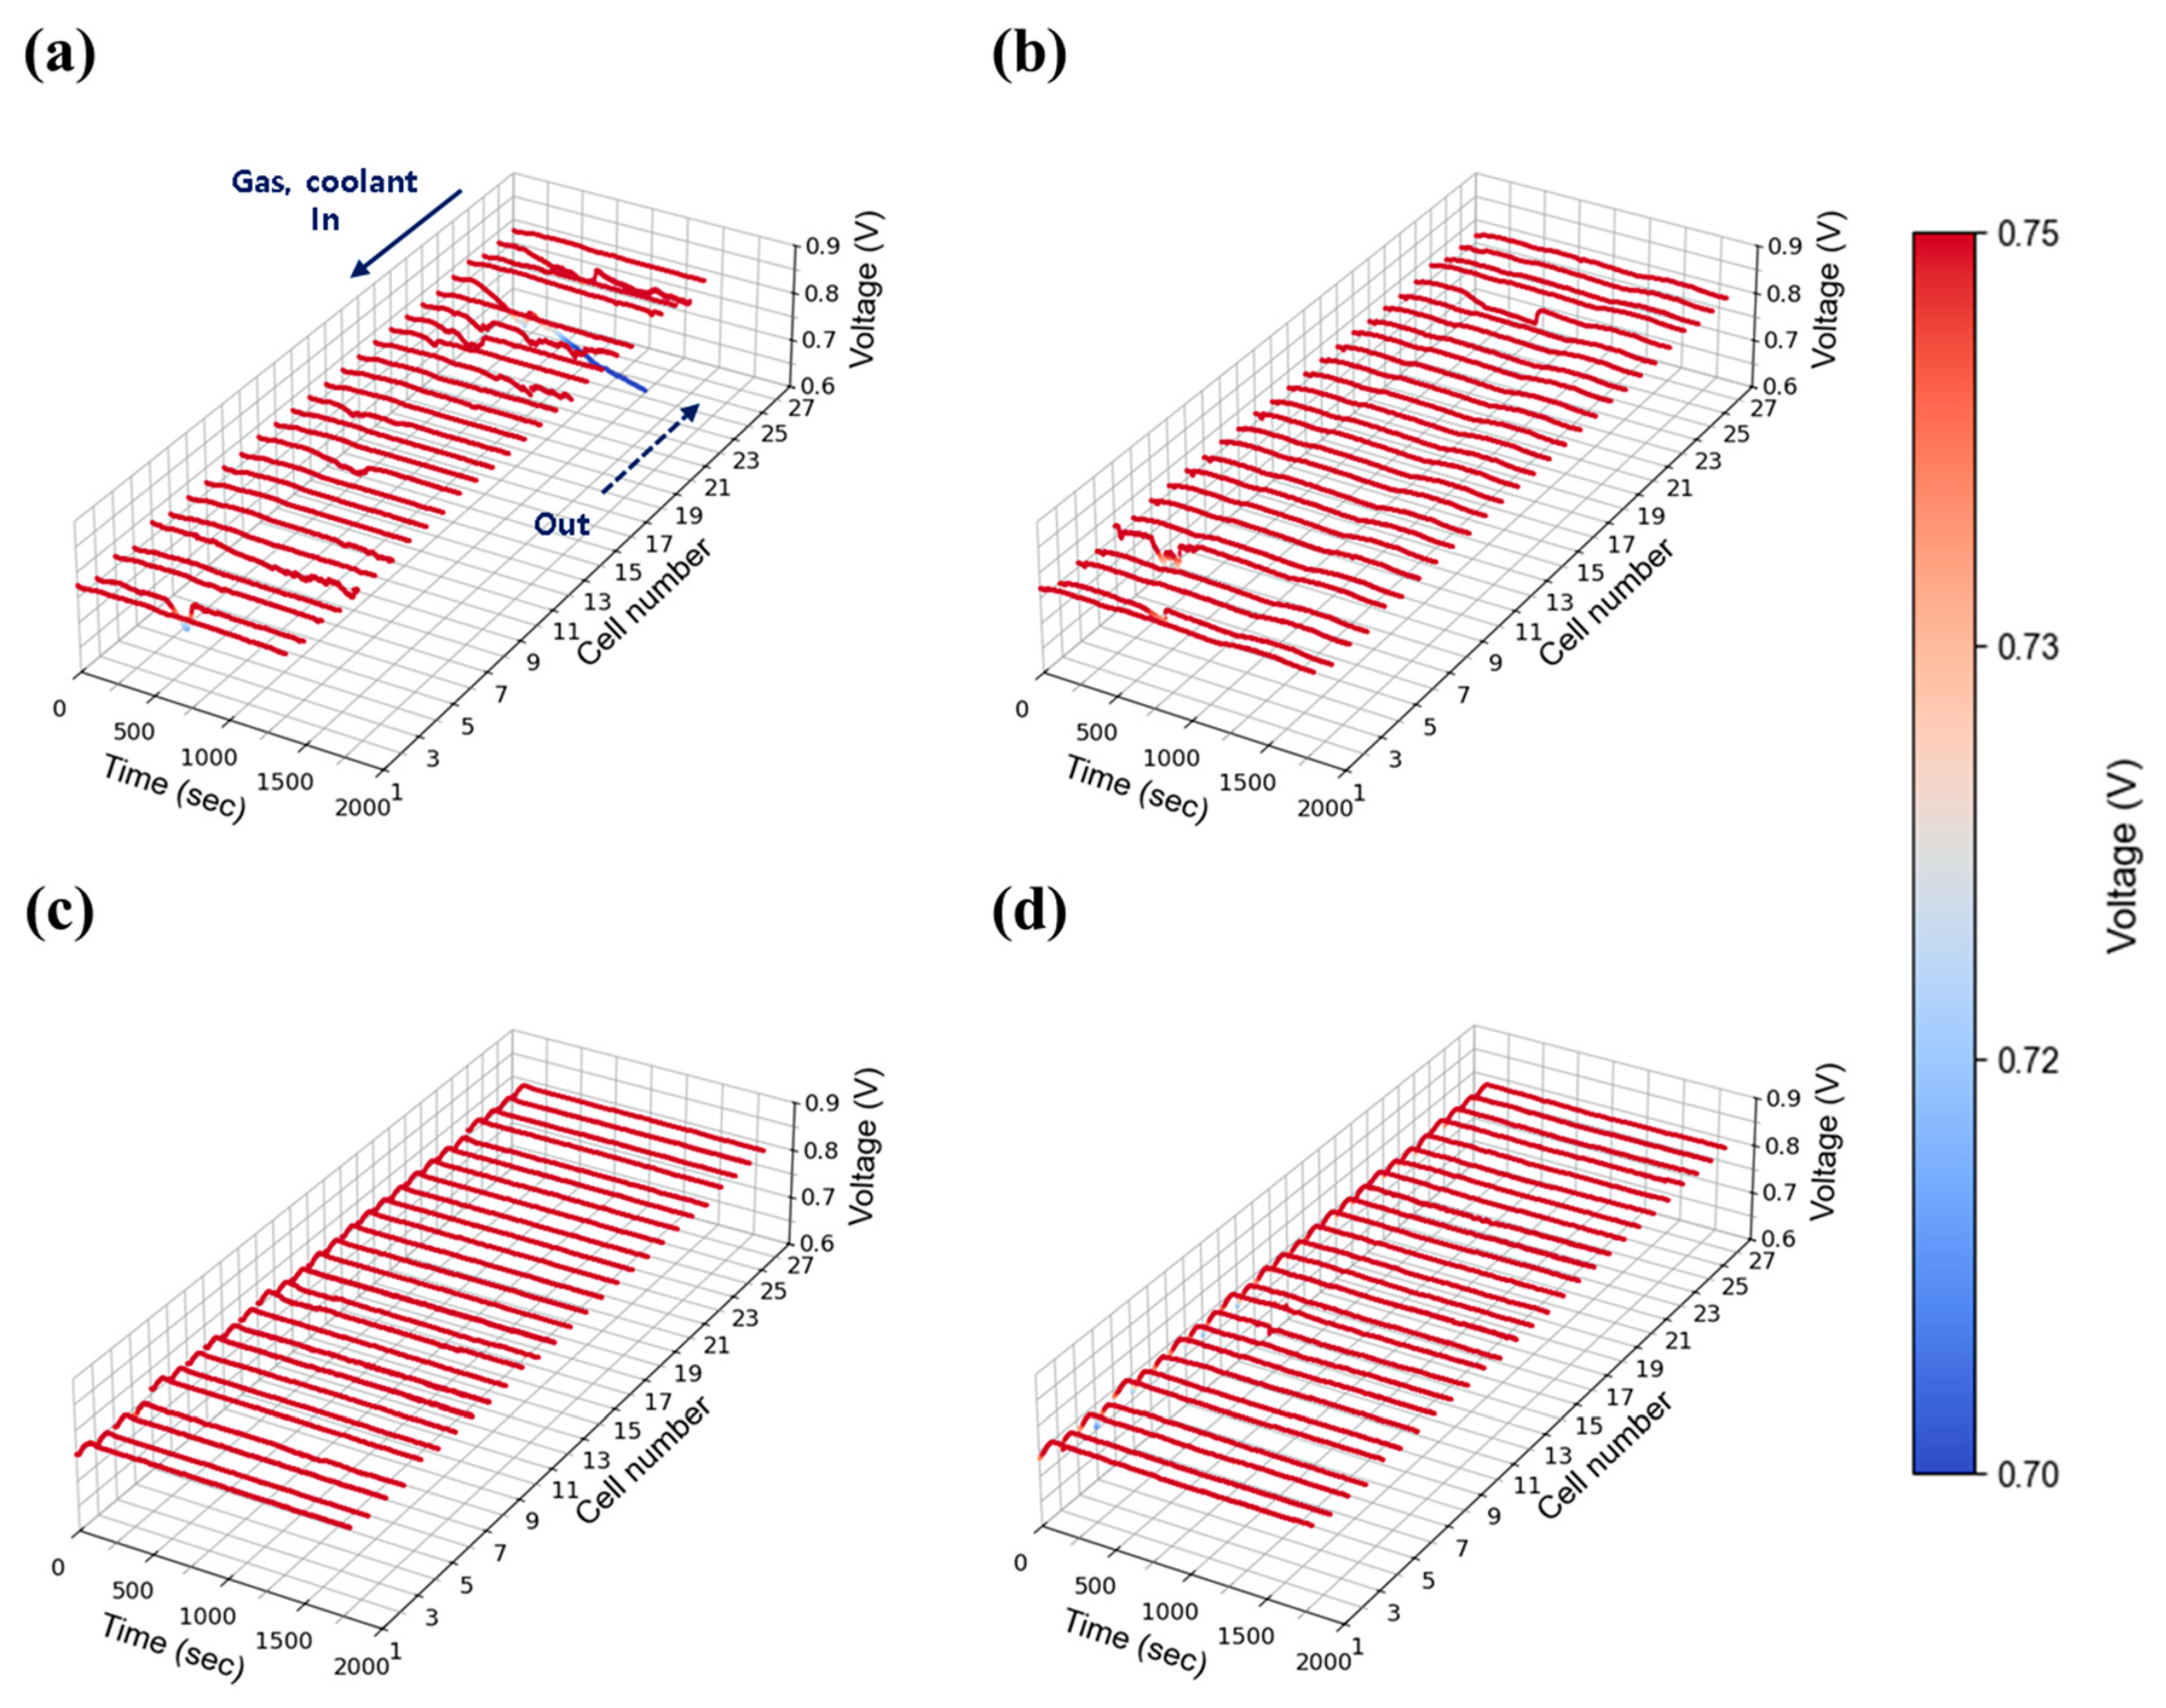
Figure 8a–d show the results at 50% relative humidity under the same current density and flow conditions. Similar trends were observed, with unstable voltage behavior at low flow rates (1.3 and 1.5) and improved stability above 2.0. In both humidity cases, although this tendency appears somewhat randomly across all cells, the cells located furthest from the stack inlet and outlet (#1 cell side in Figure 7, Figure 8, Figure 9, Figure 10, Figure 11 and Figure 12) exhibited the largest voltage fluctuations. The uninsulated coolant’s manifold of stack adds approximately 16 cm (length of 27 cells) to the path, potentially lowering temperatures of those end region cells and promoting water condensation. Additionally, in the stack configuration the gas flow in the discharging manifold near cell #1 (furthest from the inlet and outlet) is inherently lower than #27 cell nearby region (close to stack inlet and outlet), as the cumulative flow of discharging manifold from upstream cells (#1 cell nearby) continuously feeds into downstream cells (#27 cell side). This results in a relatively lower flow rate at the #1 cell, thereby hindering the effective removal of product water in that region. The extended flow paths also contribute to increased flow resistance of those #1 cell nearby regions. Taken together, these findings indicate that cells located furthest from the inlet and outlet ports (#1 cell nearby region) face greater challenges in removing generated water and reactant gas diffusion for maintaining stable operation. However, it is worth noting that noticeable voltage deviations can also occur near the inlet region, such as the cell #27 side, as observed in Figure 7b. This phenomenon is presumably due to the fact that cells located at both ends of the stack are more susceptible to water condensation, as they are more exposed to the ambient environment and thus more prone to heat loss.
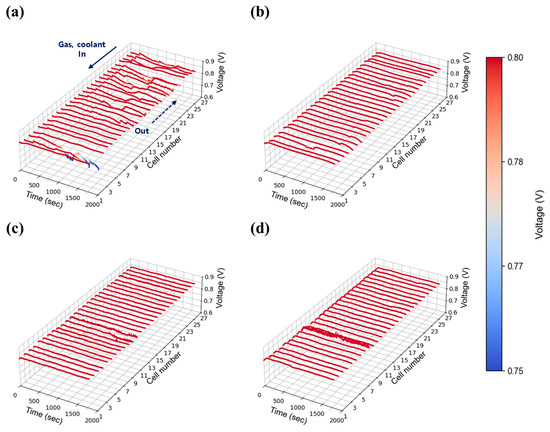
Figure 8.
Constant current evaluation of the 1 kW stack (27 cells) at 0.30 A/cm2 and 50% relative humidity: H2/O2 flow rate stoichiometry (a) 1.3, (b) 1.5, (c) 1.8, and (d) 2.0.
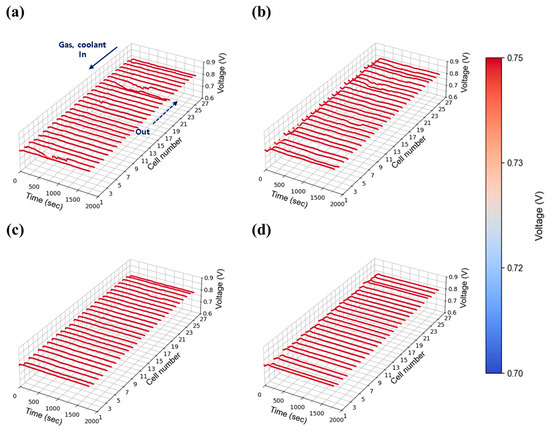
Figure 9.
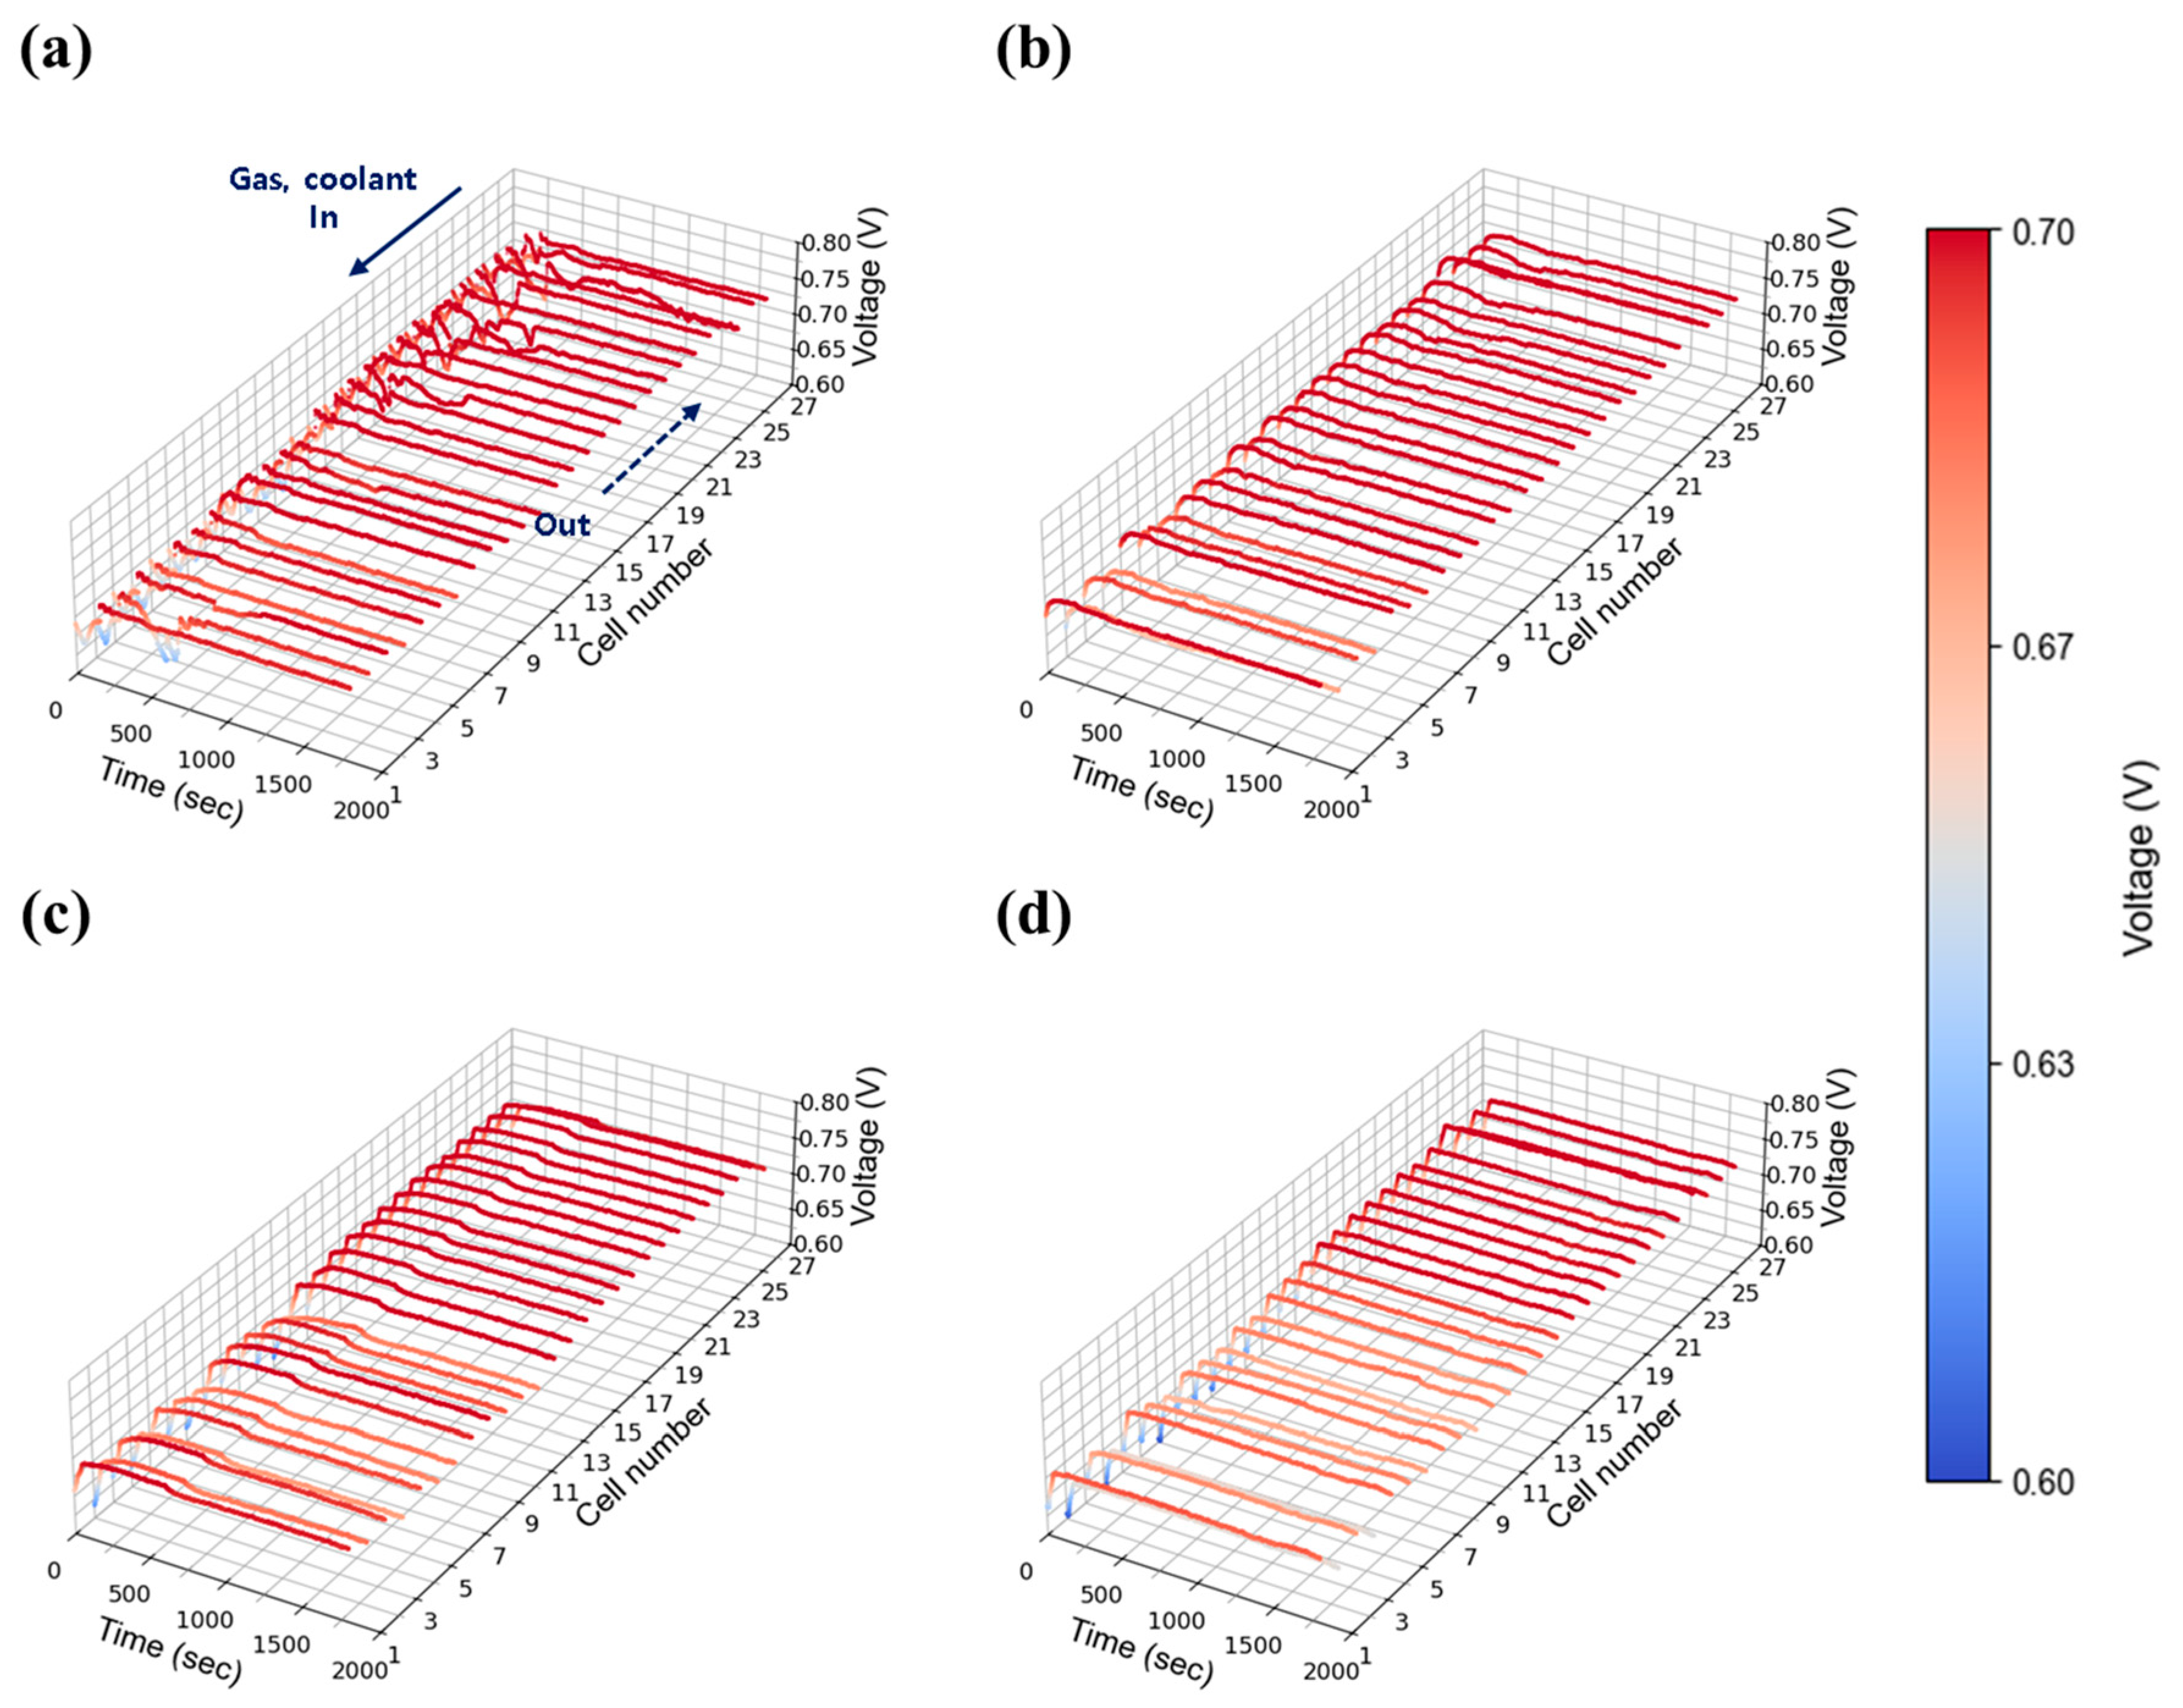
Constant current evaluation of the 1 kW stack (27 cells) at 0.55 A/cm2 and 30% relative humidity: H2/O2 flow rate stoichiometry (a) 1.3, (b) 1.5, (c) 1.8, and (d) 2.0.
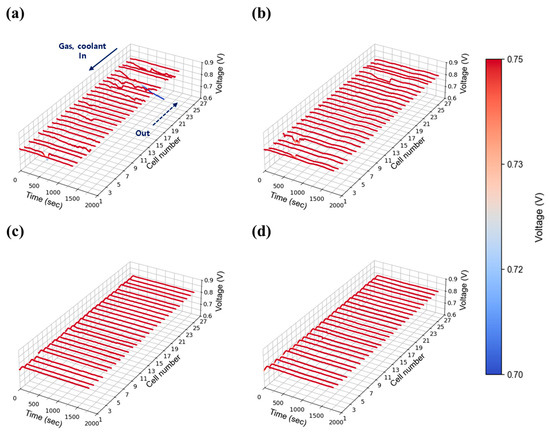
Figure 10.
Constant current evaluation of the 1 kW stack (27 cells) at 0.55 A/cm2 and 50% relative humidity: H2/O2 flow rate stoichiometry (a) 1.3, (b) 1.5, (c) 1.8, and (d) 2.0.
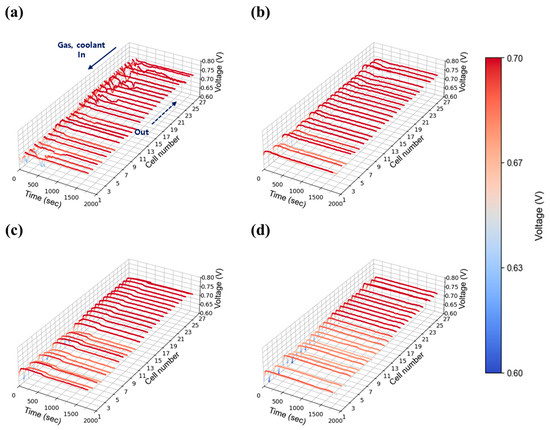
Figure 11.
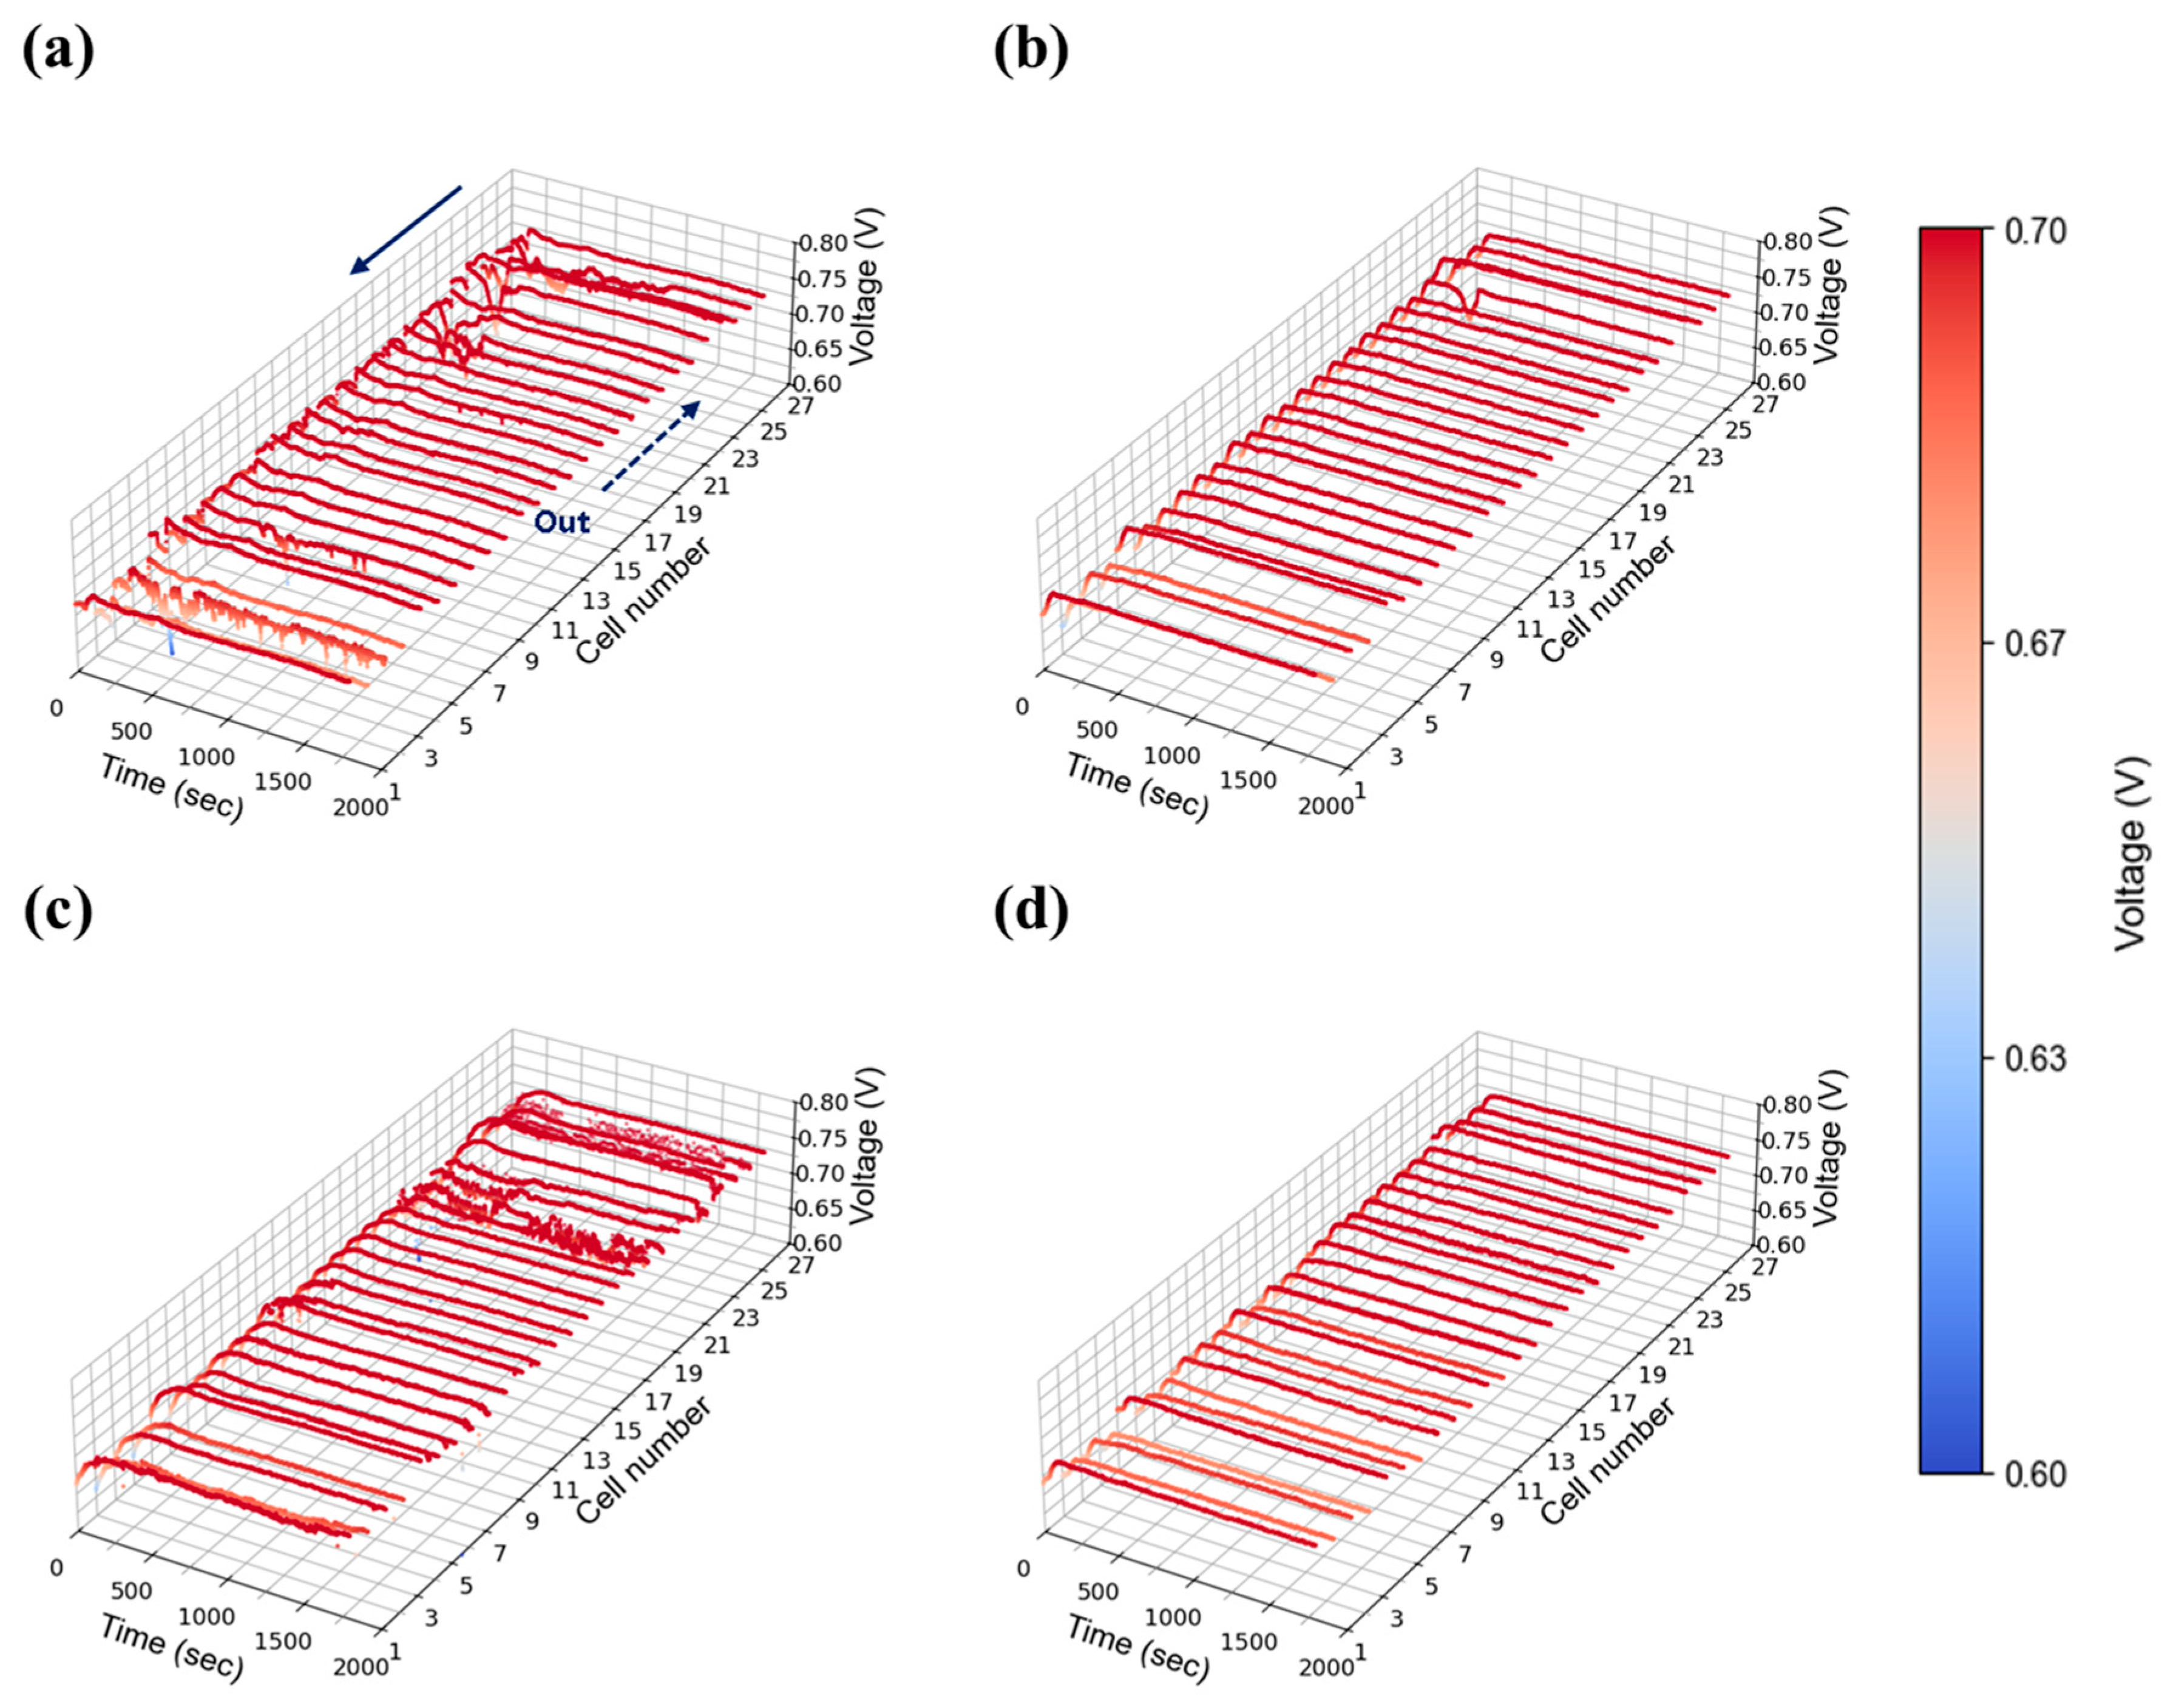
Constant current evaluation of the 1 kW stack (27 cells) at 1.00 A/cm2 and 30% relative humidity: H2/O2 flow rate stoichiometry (a) 1.3, (b) 1.5, (c) 1.8, and (d) 2.0.
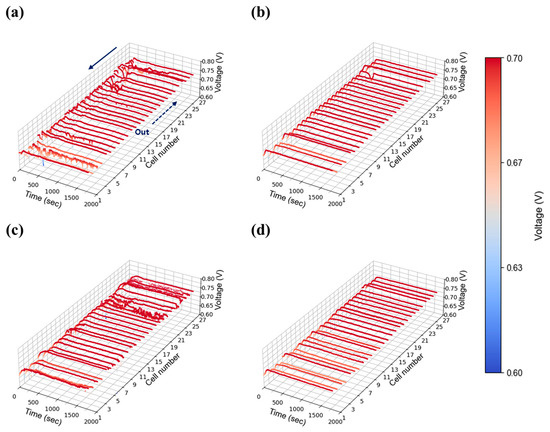
Figure 12.
Constant current evaluation of the 1 kW stack (27 cells) at 1.00 A/cm2 and 50% relative humidity: H2/O2 flow rate stoichiometry (a) 1.3, (b) 1.5, (c) 1.8, and (d) 2.0.
3.2.2. Current Density: 0.55 A/cm2
The intermediate current density of 0.55 A/cm2 was selected to represent medium-load operation. Figure 9 shows the voltage stability results at 30% relative humidity. Compared to the 0.30 A/cm2 case, voltage stability improved, indicating that the fluctuations observed at low current density were primarily due to insufficient absolute flow rates. As current density increased, the total flow rates at each stoichiometric condition rose proportionally, improving gas distribution and facilitating water removal across the stack. Nevertheless, as shown in Figure 9a,b, unstable voltage behavior was still observed at stoichiometries of 1.3 and 1.5. In contrast, as shown in Figure 9c,d, stable voltage profiles were achieved at flow rates of 2.0 and above. Figure 10 presents the results at 50% relative humidity. Here, voltage instability became more pronounced compared to 30% relative humidity case at low flow rates (1.3 and 1.5) as shown in Figure 10a,b, likely due to increased water accumulation resulting from higher humidity. Nevertheless, as shown in Figure 10c,d, stability was restored at flow rates above 2.0, mirroring the trends observed in the 30% humidity case. Interestingly, the behavior observed at 50% humidity contrasts sharply with the single cell results (Figure 6 and Figure S4), where no significant voltage instability was detected. This suggests that in-plane components alone do not contribute to instability, and that the observed fluctuations are primarily attributable to through-plane effects arising from the stack configuration.
3.2.3. Current Density: 1.00 A/cm2
A high current density of 1.00 A/cm2 was evaluated to reflect the operational characteristics of AIP systems, which prioritize high-efficiency operation at elevated voltages. As shown in Figure 11a, severe voltage fluctuations were observed at stoichiometry 1.3 under 30% relative humidity, indicating that water generated at this current density could not be adequately removed at the lowest flow setting. As stoichiometry increased to 1.5 (Figure 11b), voltage instability was reduced but not fully eliminated, whereas stable operation was achieved at flow rates of 2.0 and above as shown in Figure 11c,d. At 50% relative humidity, voltage instability was significantly exacerbated compared to the 30% case. Unlike at lower humidity, where instability was confined to specific cells, the higher humidity condition induced widespread voltage fluctuations across nearly all cells as shown in Figure 12a. The impact of water generation became more pronounced at higher current density, and the propagation of instability throughout the in-plane regions became evident. Notably, even a stoichiometry of 2.0 (Figure 12c), which previously provided stable operation, exhibited instability at 50% humidity, suggesting that higher humidity increases the minimum flow rate required to maintain stability. This issue was resolved at a stoichiometry of 2.0, where stable voltage profiles were restored as shown in Figure 12d.
3.2.4. Quantitative Comparison of Standard Deviations
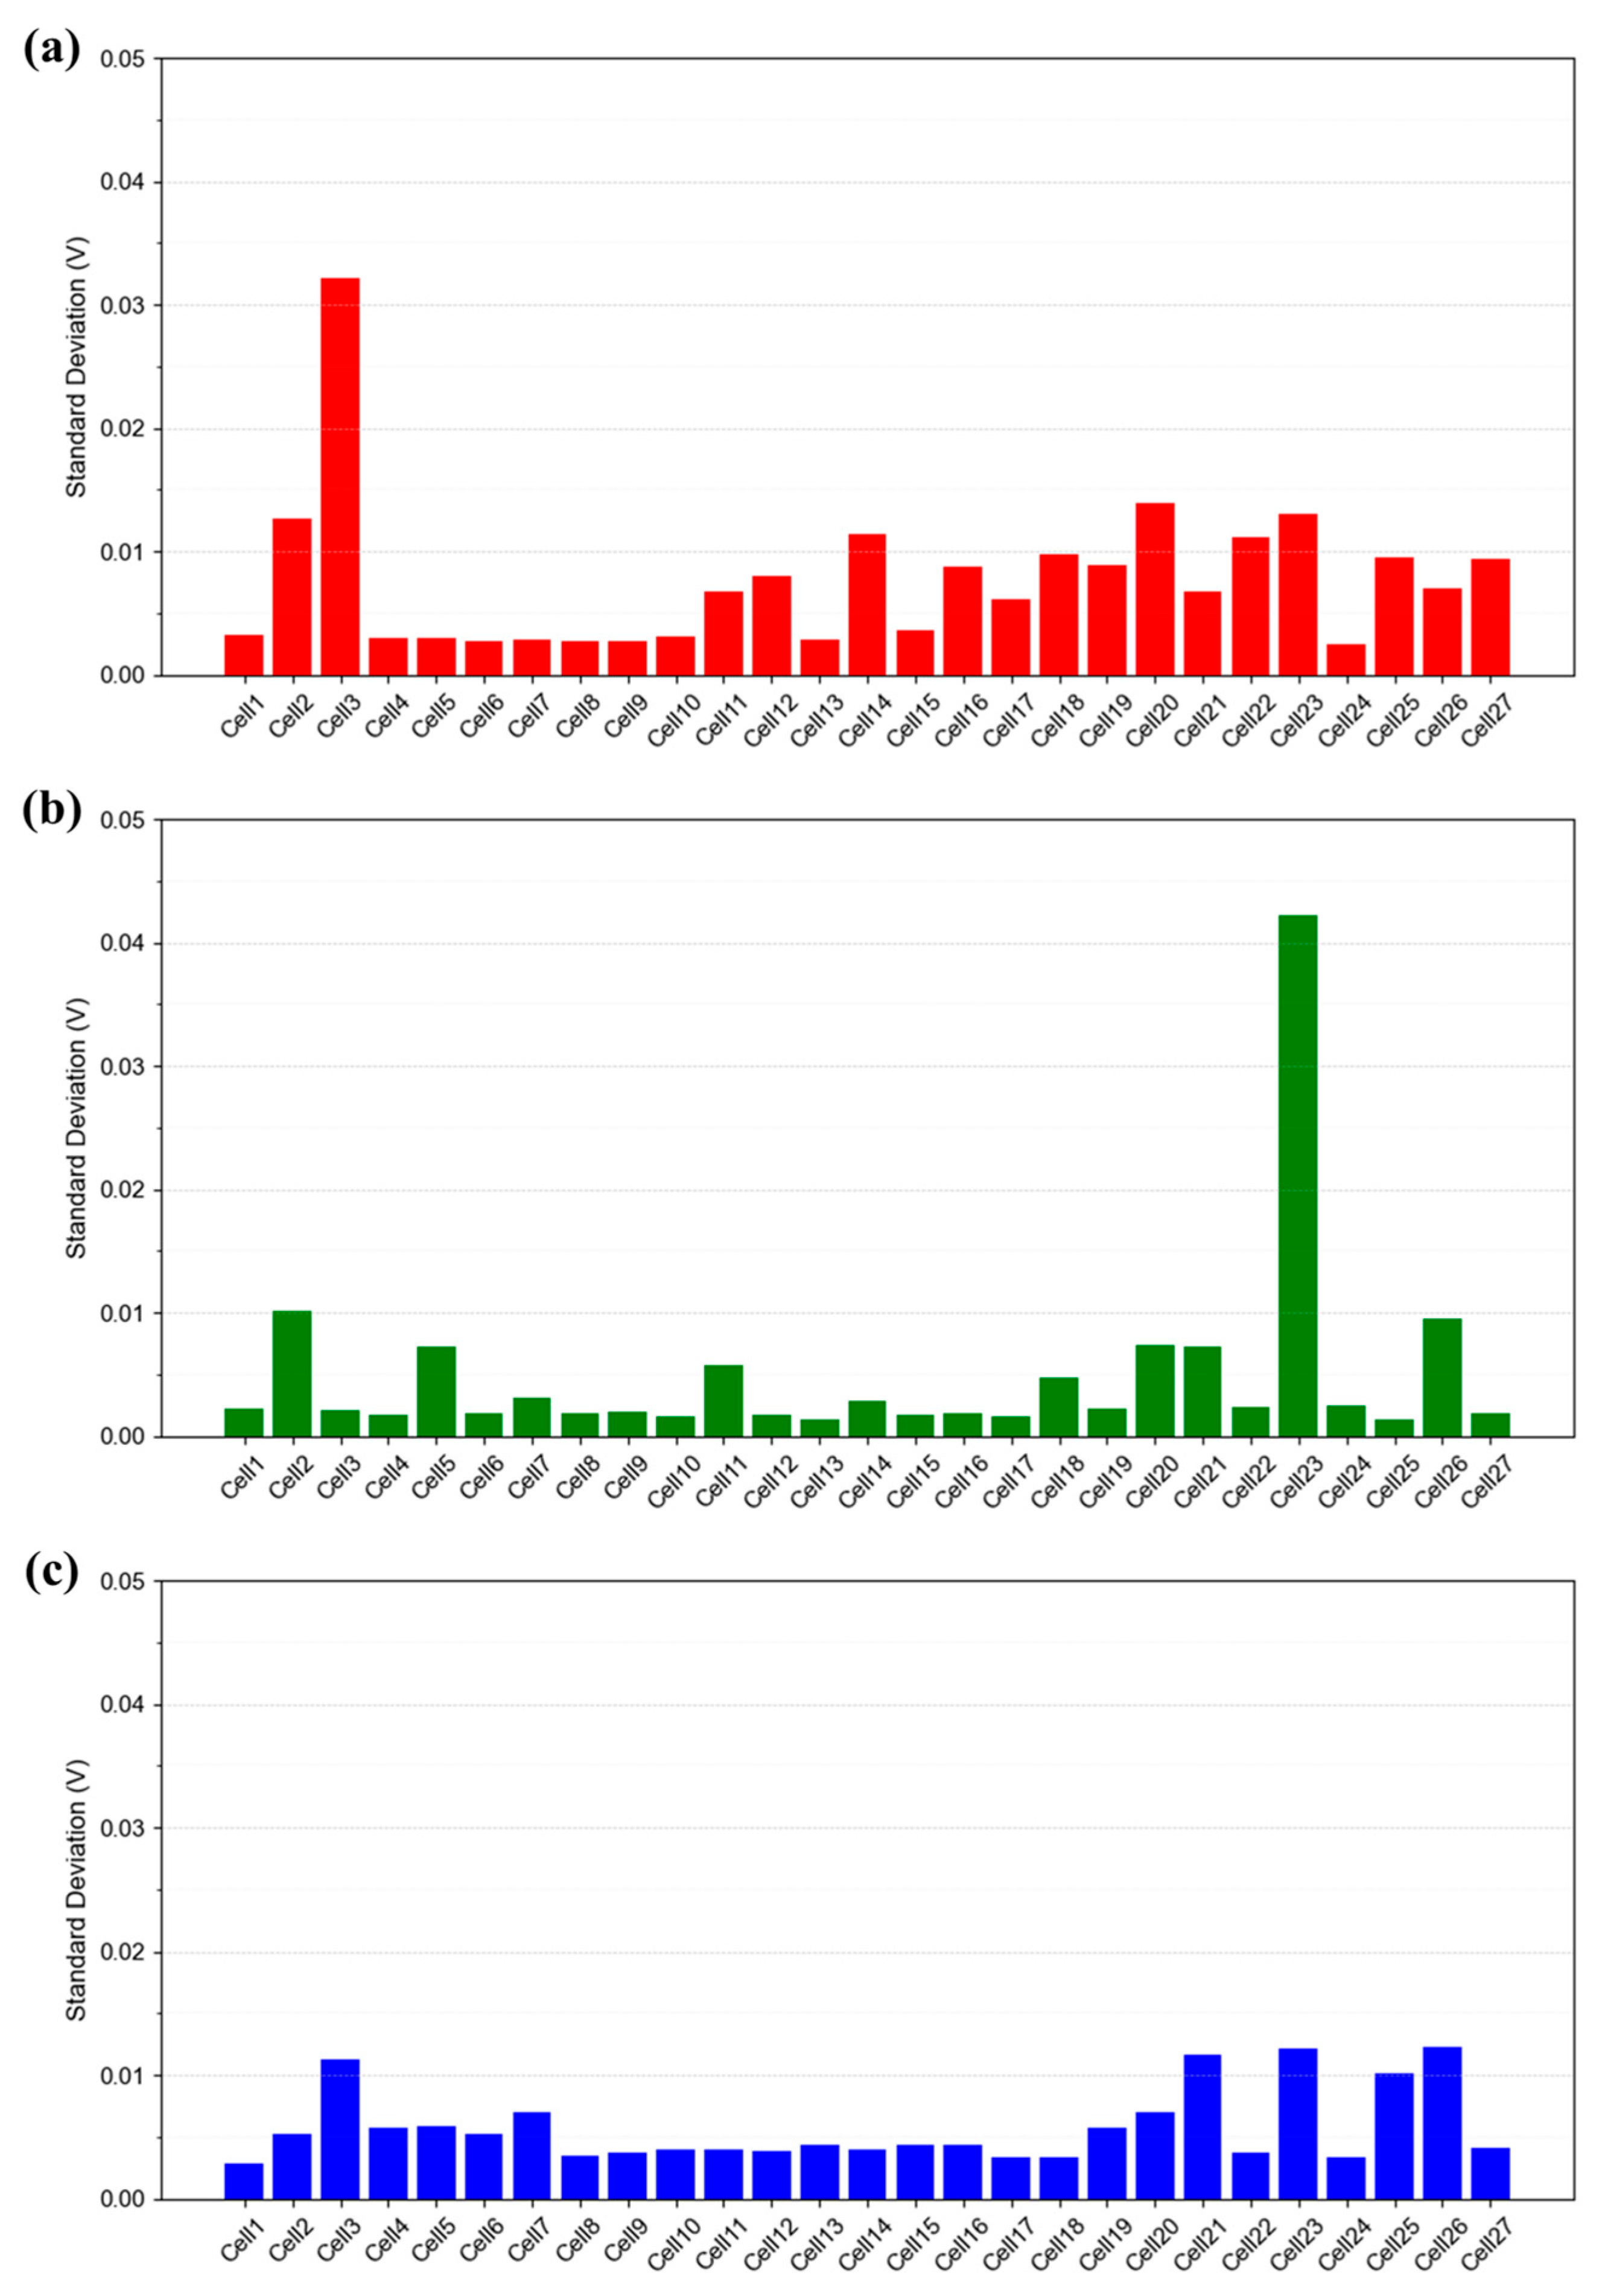
Figure 13 presents a quantitative comparison of the standard deviation over time for each cell under the IV1 condition, which serves as the reference condition defined in Table 1. As observed in Figure 8, Figure 10 and Figure 12, the time-resolved standard deviation tends to increase at both ends of the stack. In addition to Figure 13, data obtained under the same operating conditions with a flow rate stoichiometry of 2.0 (IV6 in Table 1) show that the standard deviation of cells without voltage instability generally remains below 0.005 V (Figure S5). In contrast, cells exhibiting instability display more scattered values, typically ranging from 0.01 to 0.04 V. Considering that the open circuit voltage (OCV) of each cell is approximately 1.0 V, such deviations are not negligible. These findings suggest that voltage instability may not only reflect operational instability at the system level, but also lead to performance degradation due to internal water accumulation. Therefore, identifying and eliminating the root causes of voltage instability is essential for improving both performance and durability of the stack.
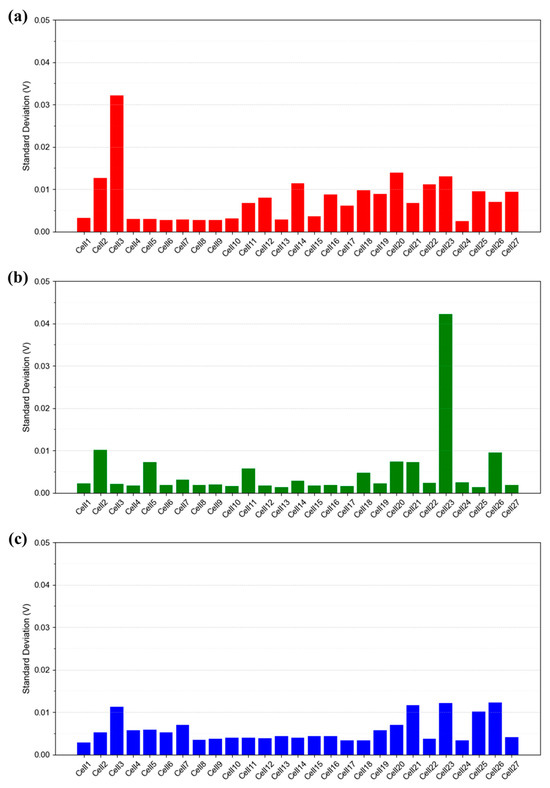
Figure 13.
Time-resolved standard deviation of each cell (27 total) in the 1 kW stack measured under the IV1 condition described in Table 1. Current density: (a) 0.30 A/cm2, (b) 0.50 A/cm2, and (c) 1.00 A/cm2.
In summary, this study highlights the critical role of both humidity and flow rate in determining the voltage stability of AIP fuel cell stacks. Supplementary Figures S3 and S4 provide time-resolved single cell voltage data, showing that single cell operation remained stable regardless of changes in humidity and flow rate. This contrasts with the stack-level results, where voltage instability became more pronounced under low flow rate and high-humidity conditions. These findings underscore the importance of considering water accumulation and flow distribution effects that emerge only at the stack scale. Stable operation was achieved at stoichiometries of 1.8–2.0 [8], corresponding to typical flow rates used in conventional air-fed PEMFC systems. However, due to the need to minimize parasitic power consumption from recirculation pumps in AIP applications, it is desirable to reduce stoichiometry to the range of 1.3–1.5. Given that AIP systems employ pure oxygen rather than air, the absolute volumetric flow is inherently lower, further amplifying challenges in maintaining stable stack operation. These results underscore the necessity for careful optimization of operating conditions and the development of dedicated stack structures specifically designed for low-flow operation. In particular, the manifold, coolant channel, and flow field configurations must be refined to ensure uniform gas distribution and effective water removal, even under reduced flow rates, thereby enabling stable and efficient AIP fuel cell operation within confined environments. This includes the consideration of parallel-flow field layouts and uniform coolant distribution strategies to mitigate end-cell degradation caused by longer gas and coolant paths.
4. Conclusions
This study investigated the performance and voltage stability of a 1 kW-class AIP PEMFC stack, focusing on the influence of operating parameters such as humidity, flow rate, and current density under high-pressure hydrogen and oxygen environments. Single cell evaluations were conducted as a reference to isolate the effects of in-plane components—MEA, GDL, and flow field geometry—without the complexities introduced by stacking. The results demonstrated that cell temperature and pressure significantly affect single cell performance, whereas variations in relative humidity and flow rate have minimal impact.
Stack-level evaluations, however, revealed pronounced through-plane challenges, particularly in relation to product water management. While stable voltage profiles were maintained under low-humidity and high-flow conditions, voltage instability was observed at low flow rates (stoichiometry ≤ 1.5), especially in cells located farthest from the inlet and outlet ports. This instability became more severe at higher humidity levels and current densities, indicating that water accumulation and distribution become increasingly problematic as operational demands intensify.
The findings underscore the critical need to optimize both operating conditions and stack design to ensure stable AIP PEMFC performance. Specifically, maintaining sufficient flow rates is essential for effective water removal, but excessive flow increases parasitic power losses in the BOP. Therefore, future work should focus on designing stacks that enable stable operation at minimal flow rates by improving manifold geometries, flow field configurations, and water management strategies.
Overall, this study provides a comprehensive reference for AIP PEMFC stack development, offering insights into the interplay between in-plane and through-plane factors under realistic operational conditions. Rather than presenting a specific solution to a defined problem, this work aims to identify and examine the unique challenges that may arise in AIP-targeted PEMFC applications. The results serve as a foundation for future design improvements aimed at achieving durable and efficient AIP fuel cell systems, while also highlighting the need for long-term durability assessments and lifetime prediction strategies [24] in subsequent research.
Supplementary Materials
The following supporting information can be downloaded at: https://www.mdpi.com/article/10.3390/en18164270/s1, Figure S1: Time-resolved voltage stability profiles during IV evaluation of the single cell at different gas pressures; Figure S2: Time-resolved voltage stability profiles during IV evaluation of the single cell at different cell coolant inlet temperature; Figure S3: Time-resolved voltage stability profiles during IV evaluation of the single cell at different relative humidity; Figure S4: Time-resolved voltage stability profiles during IV evaluation of the single cell at different gas flow rate stoichiometry ratio; Figure S5: Time-resolved standard deviation of each cell (27 total) in the 1 kW stack measured under the IV6.
Author Contributions
J.L.: Conceptualization, Data curation, Investigation, Visualization, Writing—original draft, Writing—review and editing, Project administration; S.H.: Formal analysis, Methodology; Y.G.: Supervision, Funding acquisition. All authors have read and agreed to the published version of the manuscript.
Funding
This work was supported by Korea Research Institute for defense Technology planning and advancement (KRIT) grant funded by the Korea government (DAPA (Defense Acquisition Program Administration)) (No. 17-202-407-044, Humidifier-less fuel cells module technology, 2025).
Data Availability Statement
The datasets presented in this article are not readily available because the project is classified and subject to confidentiality restrictions. Requests to access the datasets should be directed to Jinhyuk Lim (jhlim@katech.re.kr), Korea Automotive Technology Institute.
Acknowledgments
The authors would like to express their gratitude to Korea Research Institute for defense Technology planning and advancement (KRIT) and Korea government’s DAPA (Defense Acquisition Program Administration) No. 17-202-407-044, Humidifier-less fuel cells module technology 2025 for fundings, Kolon Industries for supplying MEA samples and Bumhan Fuel Cell for designing fuel cell stack components.
Conflicts of Interest
The authors declare that they have no known competing financial interests or personal relationships that could have appeared to influence the work reported in this paper.
Abbreviations
AIP: air-independent propulsion; PEMFC: polymer electrolyte membrane fuel cell; FCEV: fuel cell electric vehicles; MEA: membrane–electrode assemblies; BOP: balance of plant; GDL: gas diffusion layers; PTFE: poly tetra fluoroethylene; MFC: mass flow controller; CC: constant current; RH: relative humidity; Pt: platinum.
References
- Tanaka, S.; Nagumo, K.; Yamamoto, M.; Chiba, H.; Yoshida, K.; Okano, R. Fuel cell system for Honda CLARITY fuel cell. Etransportation 2020, 3, 100046. [Google Scholar] [CrossRef]
- Jinnouchi, R.; Kudo, K.; Kodama, K.; Kitano, N.; Suzuki, T.; Minami, S.; Shinozaki, K.; Hasegawa, N.; Shinohara, A. The role of oxygen-permeable ionomer for polymer electrolyte fuel cells. Nat. Commun. 2021, 12, 4956. [Google Scholar] [CrossRef]
- Nonobe, Y. Development of the fuel cell vehicle mirai. IEEJ Trans. Electr. Electron. Eng. 2017, 12, 5–9. [Google Scholar] [CrossRef]
- NEDO Fuel Cell and Hydrogen Technology Development Roadmap. Available online: https://www.nedo.go.jp/library/battery_hydrogen.html (accessed on 5 February 2023).
- Fuel Cell Technical Team Roadmap. Available online: https://www.energy.gov/eere/vehicles/articles/us-drive-fuel-cell-technical-team-roadmap?nrg_redirect=418538 (accessed on 21 November 2017).
- Lim, J.; Shim, J.W.; Kim, D.J.; Park, J.S.; Koo, J.; Shim, J.H. Improvement of fuel cell catalyst performance through zirconia protective layer coating by atomic layer deposition. J. Power Sources 2021, 498, 229923. [Google Scholar] [CrossRef]
- Shang, Z.; Hossain, M.M.; Wycisk, R.; Pintauro, P.N. Poly(phenylene sulfonic acid)-expanded polytetrafluoroethylene composite membrane for low relative humidity operation in hydrogen fuel cells. J. Power Sources 2022, 535, 231375. [Google Scholar] [CrossRef]
- Hasvold, O.; Storkersen, N.J.; Forseth, S.; Lian, T. Power sources for autonomous underwater vehicles. J. Power Sources 2006, 162, 935–942. [Google Scholar] [CrossRef]
- Psoma, A.; Sattler, G. Fuel cell systems for submarines: From the first idea to serial production. J. Power Sources 2002, 106, 381–383. [Google Scholar] [CrossRef]
- Choi, J.W.; Hwang, Y.S.; Seo, J.H.; Lee, D.H.; Cha, S.W.; Kim, M.S. An experimental study on the purge characteristics of the cathodic dead-end mode PEMFC for the submarine or aerospace applications and performance improvement with the pulsation effects. Int. J. Hydrogen Energy 2010, 35, 3698–3711. [Google Scholar] [CrossRef]
- Han, I.S.; Kho, B.K.; Cho, S. Development of a polymer electrolyte membrane fuel cell stack for an underwater vehicle. J. Power Sources 2016, 304, 244–254. [Google Scholar] [CrossRef]
- Han, I.S.; Jeong, J.; Shin, H.K. PEM fuel-cell stack design for improved fuel utilization. Int. J. Hydrogen Energy 2013, 38, 11996–12006. [Google Scholar] [CrossRef]
- Dashti, I.; Asghari, S.; Goudarzi, M.; Meyer, Q.; Mehrabani-Zeinabad, A.; Brett, D.J.L. Optimization of the performance, operation conditions and purge rate for a dead-ended anode proton exchange membrane fuel cell using an analytical model. Energy 2019, 179, 173–185. [Google Scholar] [CrossRef]
- Meyers, J.P.; Darling, R.M. Model of carbon corrosion in PEM fuel cells. J. Electrochem. Soc. 2006, 153, A1432–A1442. [Google Scholar] [CrossRef]
- Roen, L.M.; Paik, C.H.; Jarvic, T.D. Electrocatalytic corrosion of carbon support in PEMFC cathodes. Electrochem. Solid-State Lett. 2004, 7, A19–A22. [Google Scholar] [CrossRef]
- Hegge, F.; Sharman, J.; Moroni, R.; Thiele, S.; Zengerle, R.; Breitwieser, M.; Vierrath, S. Impact of Carbon Support Corrosion on Performance Losses in Polymer Electrolyte Membrane Fuel Cells. J. Electrochem. Soc. 2019, 166, F956–F962. [Google Scholar] [CrossRef]
- Simon, C.; Kartouzian, D.; Müller, D.; Wilhelm, F.; Gasteiger, H.A. Impact of Microporous Layer Pore Properties on Liquid Water Transport in PEM Fuel Cells: Carbon Black Type and Perforation. J. Electrochem. Soc. 2017, 164, F1697–F1711. [Google Scholar] [CrossRef]
- Soboleva, T.; Zhao, X.S.; Mallek, K.; Xie, Z.; Navessin, T.; Holdcroft, S. On the Micro-, Meso- and Macroporous Structures of Polymer Electrolyte Membrane Fuel Cell Catalyst Layers. ACS Appl. Mater. Inter. 2010, 2, 375–384. [Google Scholar] [CrossRef] [PubMed]
- Borup, R.; Meyers, J.; Pivovar, B.; Kim, Y.S.; Mukundan, R.; Garland, N.; Myers, D.; Wilson, M.; Garzon, F.; Wood, D.; et al. Scientific aspects of polymer electrolyte fuel cell durability and degradation. Chem. Rev. 2007, 107, 3904–3951. [Google Scholar] [CrossRef]
- Liu, L.Y.; Chen, W.D.; Li, Y.Q. An overview of the proton conductivity of nafion membranes through a statistical analysis. J. Membrane Sci. 2016, 504, 1–9. [Google Scholar] [CrossRef]
- Lee, C.H.Y.; Kort-Kamp, W.J.M.; Yu, H.R.; Cullen, D.A.; Patterson, B.M.; Arman, T.A.; Babu, S.K.; Mukundan, R.; Borup, R.L.; Spendelow, J.S. Grooved electrodes for high-power-density fuel cells. Nat. Energy 2023, 8, 685–694. [Google Scholar] [CrossRef]
- Lim, J.; Lim, S.; Park, S.; Yang, K.; Park, J.; Kim, M.; Goo, Y.; Um, S.; Shin, D. Modulating the electrode pore structure using the magnetic field for reduced local-oxygen transport resistance in polymer electrolyte membrane fuel cell. Chem. Eng. J. 2024, 498, 155378. [Google Scholar] [CrossRef]
- Su, A.; Weng, F.B.; Hsu, C.Y.; Chen, Y.M. Studies on flooding in PEM fuel cell cathode channels. Int. J. Hydrogen Energy 2006, 31, 1031–1039. [Google Scholar] [CrossRef]
- Tang, X.; Shi, L.; Li, M.; Xu, S.; Sun, C. Health State Estimation and Long-Term Durability Prediction for Vehicular PEM Fuel Cell Stacks Under Dynamic Operational Conditions. IEEE Trans. Power Electron. 2025, 40, 4498–4509. [Google Scholar] [CrossRef]
Disclaimer/Publisher’s Note: The statements, opinions and data contained in all publications are solely those of the individual author(s) and contributor(s) and not of MDPI and/or the editor(s). MDPI and/or the editor(s) disclaim responsibility for any injury to people or property resulting from any ideas, methods, instructions or products referred to in the content. |
© 2025 by the authors. Licensee MDPI, Basel, Switzerland. This article is an open access article distributed under the terms and conditions of the Creative Commons Attribution (CC BY) license (https://creativecommons.org/licenses/by/4.0/).

