Article

Energy Arbitrage Analysis for Market-Selection of a Battery Energy Storage System-Based Venture

Department of Electrical & Computer Engineering, Faculty of Engineering and Applied Science, Memorial University of Newfoundland, 240 Prince Phillip Drive, St. John’s, NL A1B 3X5, Canada
*
Author to whom correspondence should be addressed.
Energies 2025, 18(16), 4245; https://doi.org/10.3390/en18164245
Submission received: 16 July 2025 / Revised: 7 August 2025 / Accepted: 7 August 2025 / Published: 9 August 2025

Abstract

The increasing integration of intermittent renewable energy sources necessitates effective energy storage solutions, with battery energy storage systems (BESSs) emerging as promising candidates for energy arbitrage operations. This study conducted a comprehensive comparative analysis of 29 European electricity markets to identify optimal locations for utility-scale BESS-enabled energy arbitrage ventures. Using hourly wholesale electricity price data spanning January 2015 to December 2023, we employed statistical analysis techniques, 3D surface plots, and developed a novel energy arbitrage feasibility (EAF) score-based ranking system that integrates electricity market volatility metrics with regulatory and economic variables including gross domestic product per capita, index of economic freedom, and electricity supply-origin risk (ESOR). Five investor preference scenarios were analyzed: risk-averse, ESOR-sensitive, economy-sensitive, volatility-sensitive, and equally weighted approaches. Results demonstrated that Estonia ranked highest in three scenarios, achieving the maximum absolute EAF score of 0.558197 in the volatility-sensitive scenario, while Luxembourg led in the ESOR and economy-sensitive scenarios. Estonia’s market characteristics support single daily charge–discharge cycles, whereas Luxembourg enables dual cycles, offering different operational strategies. The EAF scoring methodology provides a standardized framework for cross-country investment decision-making in energy arbitrage ventures. These findings indicate that market selection significantly impacts the BESS arbitrage profitability, with Estonia and Luxembourg representing the most favorable investment destinations.

1. Introduction

Understanding how modern electricity markets evolved is critical to appreciate the emergence of BESS-enabled energy arbitrage as a feasible commercial opportunity and its widespread adoption on a global scale. Revisiting key milestones in this evolution highlights how regulatory and market reforms have shaped energy investment prospects globally. Many markets continue this evolution, building on the groundwork laid by early movers. This study evaluated 29 countries—Austria, Belgium, Bulgaria, Croatia, Czechia, Denmark, Estonia, Finland, France, Germany, Greece, Hungary, Ireland, Italy, Latvia, Lithuania, Luxembourg, the Netherlands, North Macedonia, Norway, Poland, Portugal, Romania, Serbia, Slovakia, Slovenia, Spain, Sweden, and Switzerland—across various stages of market development. Figure 1 shows the dataset’s geographic coverage.

1.1. Post-1970s Electricity Market Development

Prior to the 1970s, electricity markets were dominated by vertically integrated monopolies [1]. These utilities controlled generation through to distribution, offering predictable supply but at the cost of inefficiencies and high prices [2]. These monopolistic utilities exercised comprehensive authority over all aspects of electricity provision, from power generation facilities through transmission networks to the final distribution to end consumers [3]. While this integrated approach provided a predictable and reliable electricity supply to consumers, it came at significant economic costs due to operational inefficiencies and artificially elevated pricing structures that lacked competitive market pressures [4]. The oil crises of the 1970s and the simultaneous growth in environmental awareness catalyzed reforms [5]. These reforms exposed vulnerabilities tied to fossil fuel dependence and triggered a global interest in alternatives like solar and wind [6]. The broader economic ramifications of these disruptions manifested in severe sectoral contractions, most notably a devastating 25% decline in shipping industry revenue that cascaded through interconnected maritime commerce networks [7]. These economic shocks generated extensive ripple effects that propagated through critical supporting industries, particularly impacting the labor market and mining sectors, thereby exposing the dangerous over-reliance on single economic pillars and highlighting the urgent imperative for comprehensive economic diversification strategies [8].
In response, many countries across Europe began deregulating their energy sectors [9]. Previously state-owned monopolies began to unbundle generation, transmission, and distribution [10]. European markets were among the first movers in this direction [11]. The UK and Norway led this transformation through legislative and policy instruments [12]. Other countries across Europe, like Sweden, closely followed suit in the deployment of new market structures for their electricity supply chain [13]. The 1990s marked a period of accelerated electricity market liberalization as governments and regulatory bodies worldwide pursued comprehensive deregulation policies aimed at dismantling traditional monopolistic structures in favor of competitive market mechanisms [14]. These ambitious reform initiatives were fundamentally driven by three primary objectives: achieving enhanced operational efficiency through market competition, facilitating the integration of renewable energy sources into previously rigid grid systems, and empowering the end consumers with greater choice and control over their electricity service providers [15]. However, these changes introduced new challenges around market manipulation [16]. Other challenges facing regulators included increased volatility due to the loss of pricing control, and uncertainty introduced by new market entrants, especially from the private sector [17].
To resolve these concerns, the European Union initiated legislative reforms [18]. The First Energy Package in 1996 mandated market competition and structural unbundling [19]. Independent power producers emerged, supported by incentives like feed-in tariffs and the Renewable Energy Directive. By the 2000s, fossil-dominant systems were giving way to hybrid mixes featuring natural gas, wind, and solar. Technological innovations—such as HVDC lines and distributed generation—enabled cross border power exchange [20]. These changes enabled a more robust regional integration across Europe’s electricity supply chain [21]. Furthermore, the emergence of distributed generation technologies revolutionized the traditional centralized power model by allowing smaller-scale renewable energy installations to feed electricity back into the grid, thereby enabling seamless cross-border power exchange and fostering unprecedented levels of regional energy market integration [22].
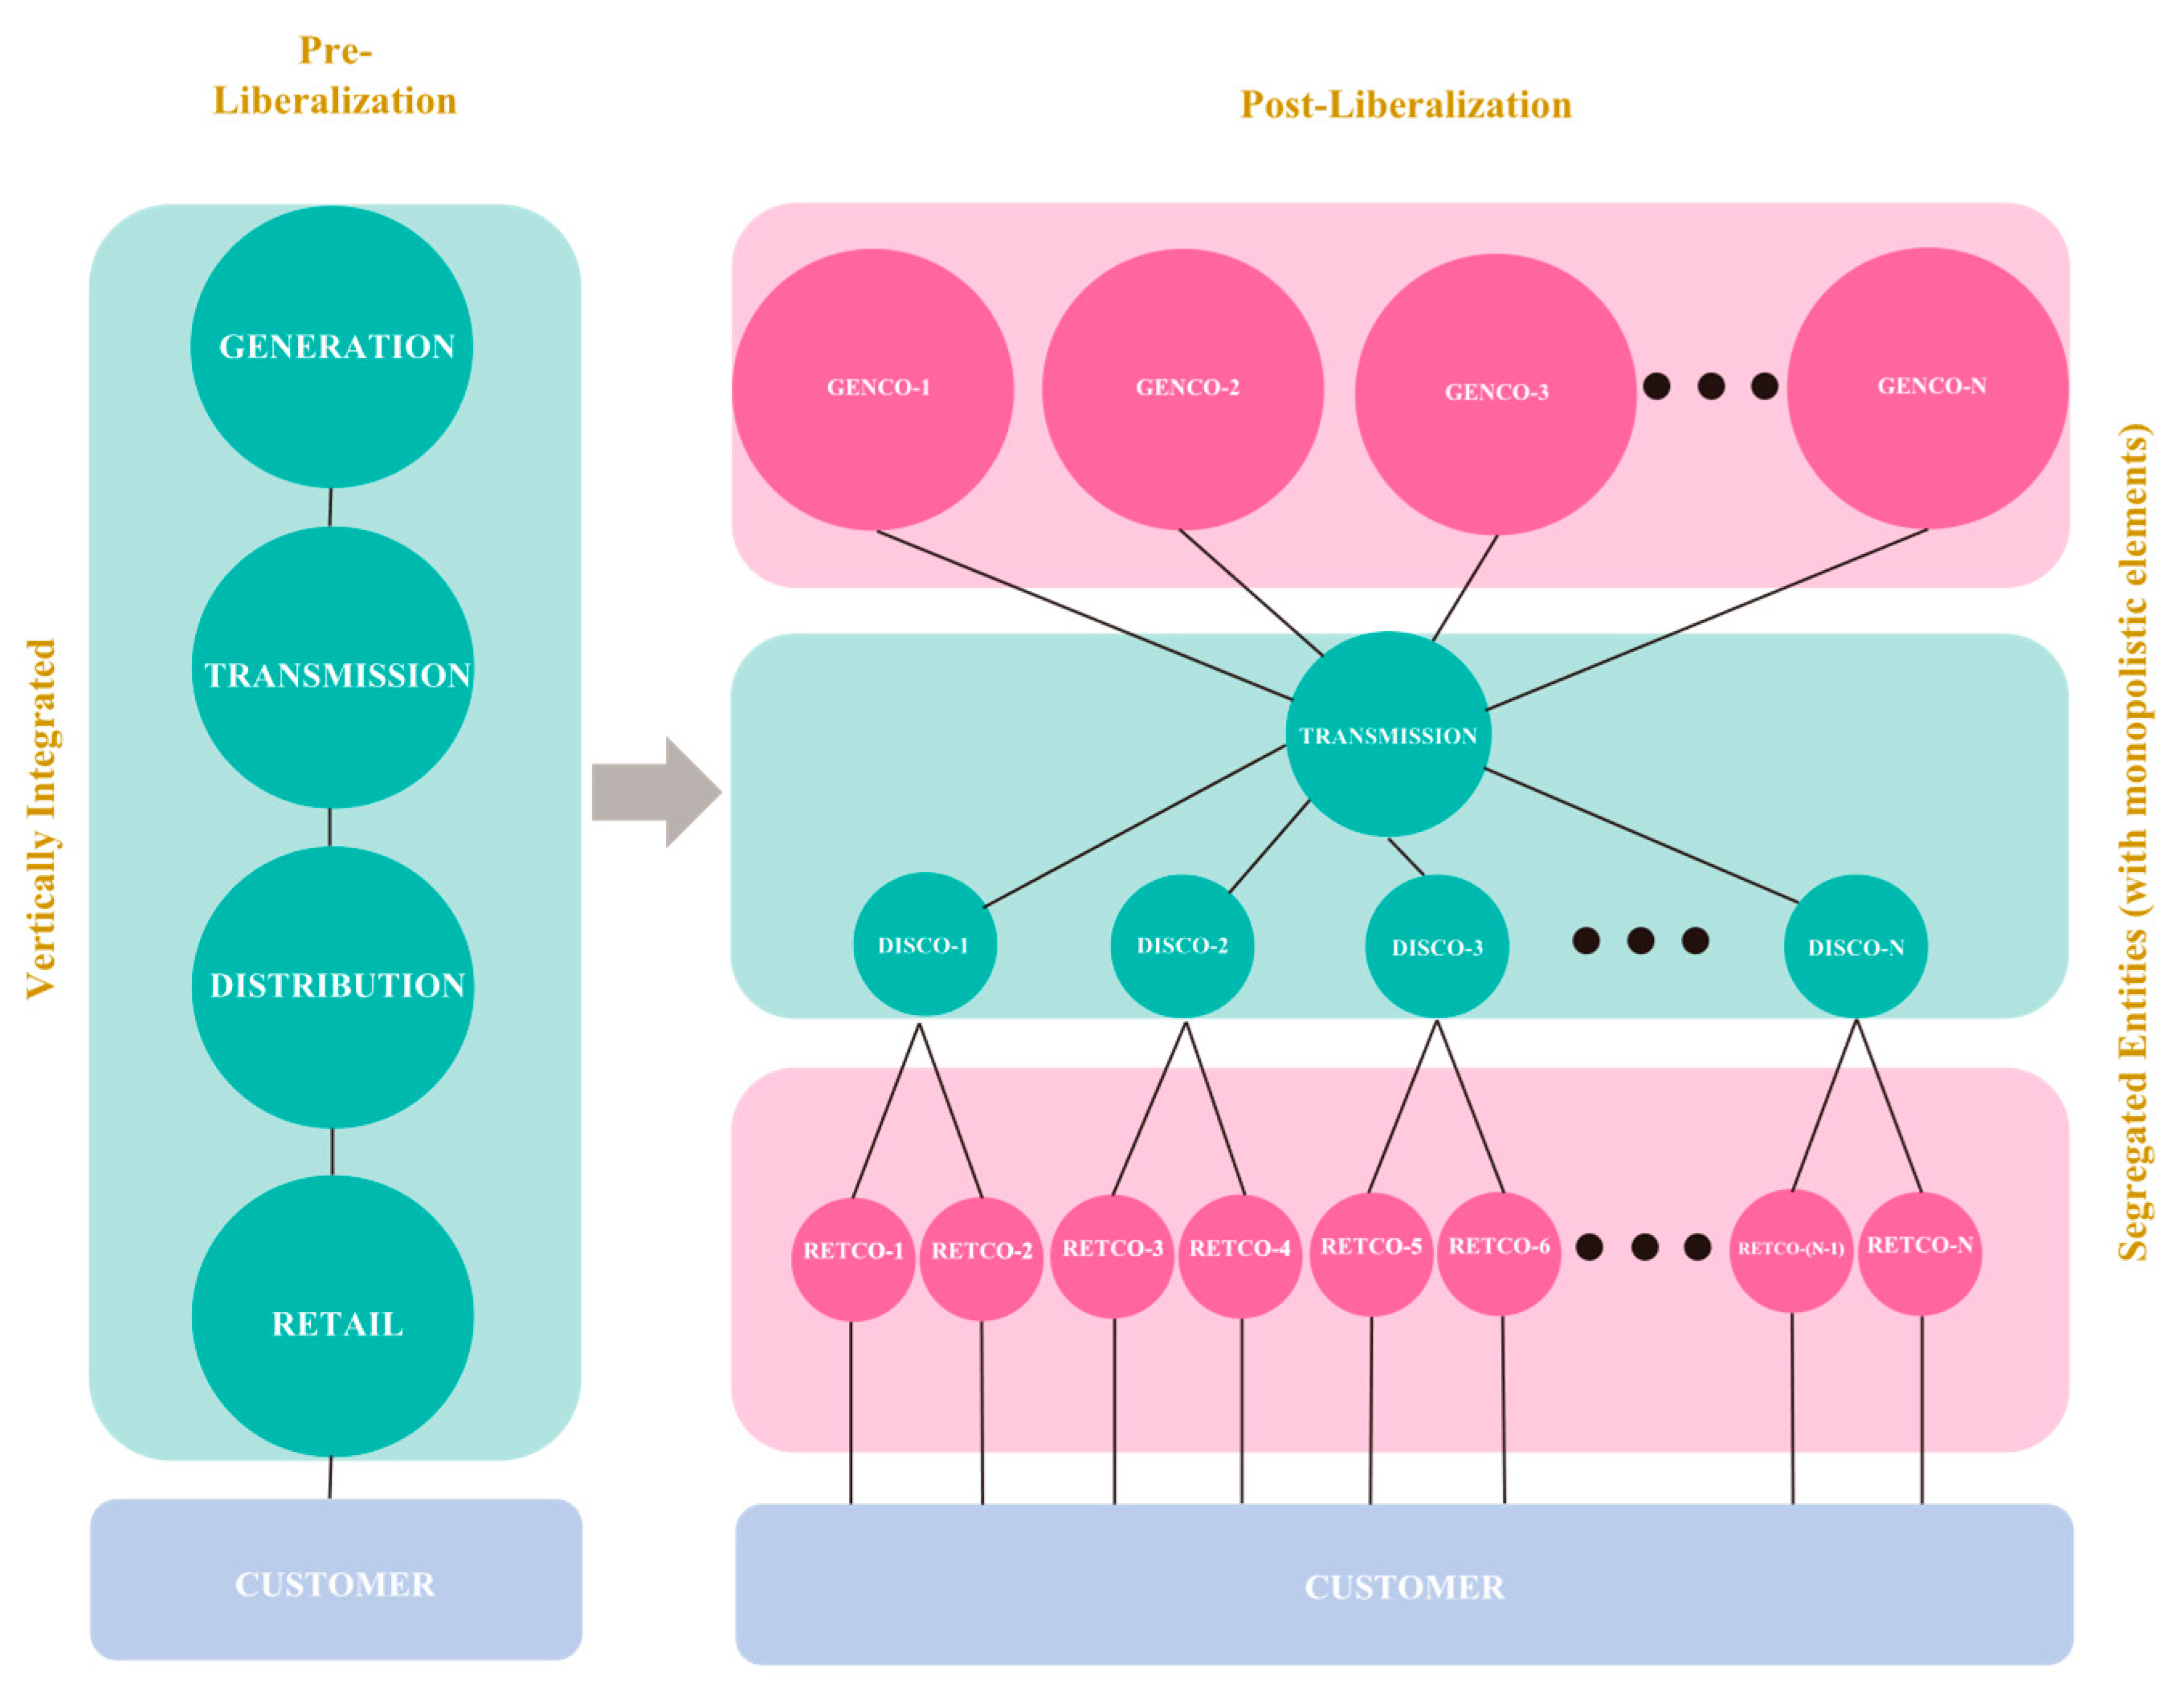
Environmental priorities further reshaped energy strategies, exemplified by Germany’s Energiewende, which committed to a nuclear-free, low-carbon grid [23]. Figure 2 summarizes the liberalization process and unbundling of vertical monopolies. From a legal point of view, electricity market reform developed in four legislative waves [24]. These focused on access, transparency, integration, and—most recently—renewable energy and flexibility. Key legal milestones include the PreussenElektra case (2001) supporting feed-in tariffs, and rulings against market abuse (e.g., E.ON, GDF Suez, Alpiq), which clarified the legal boundaries of market behavior.

1.2. State of Electricity Trading in Europe Today—Case of the European Power Exchange SE (EPEX SPOT)

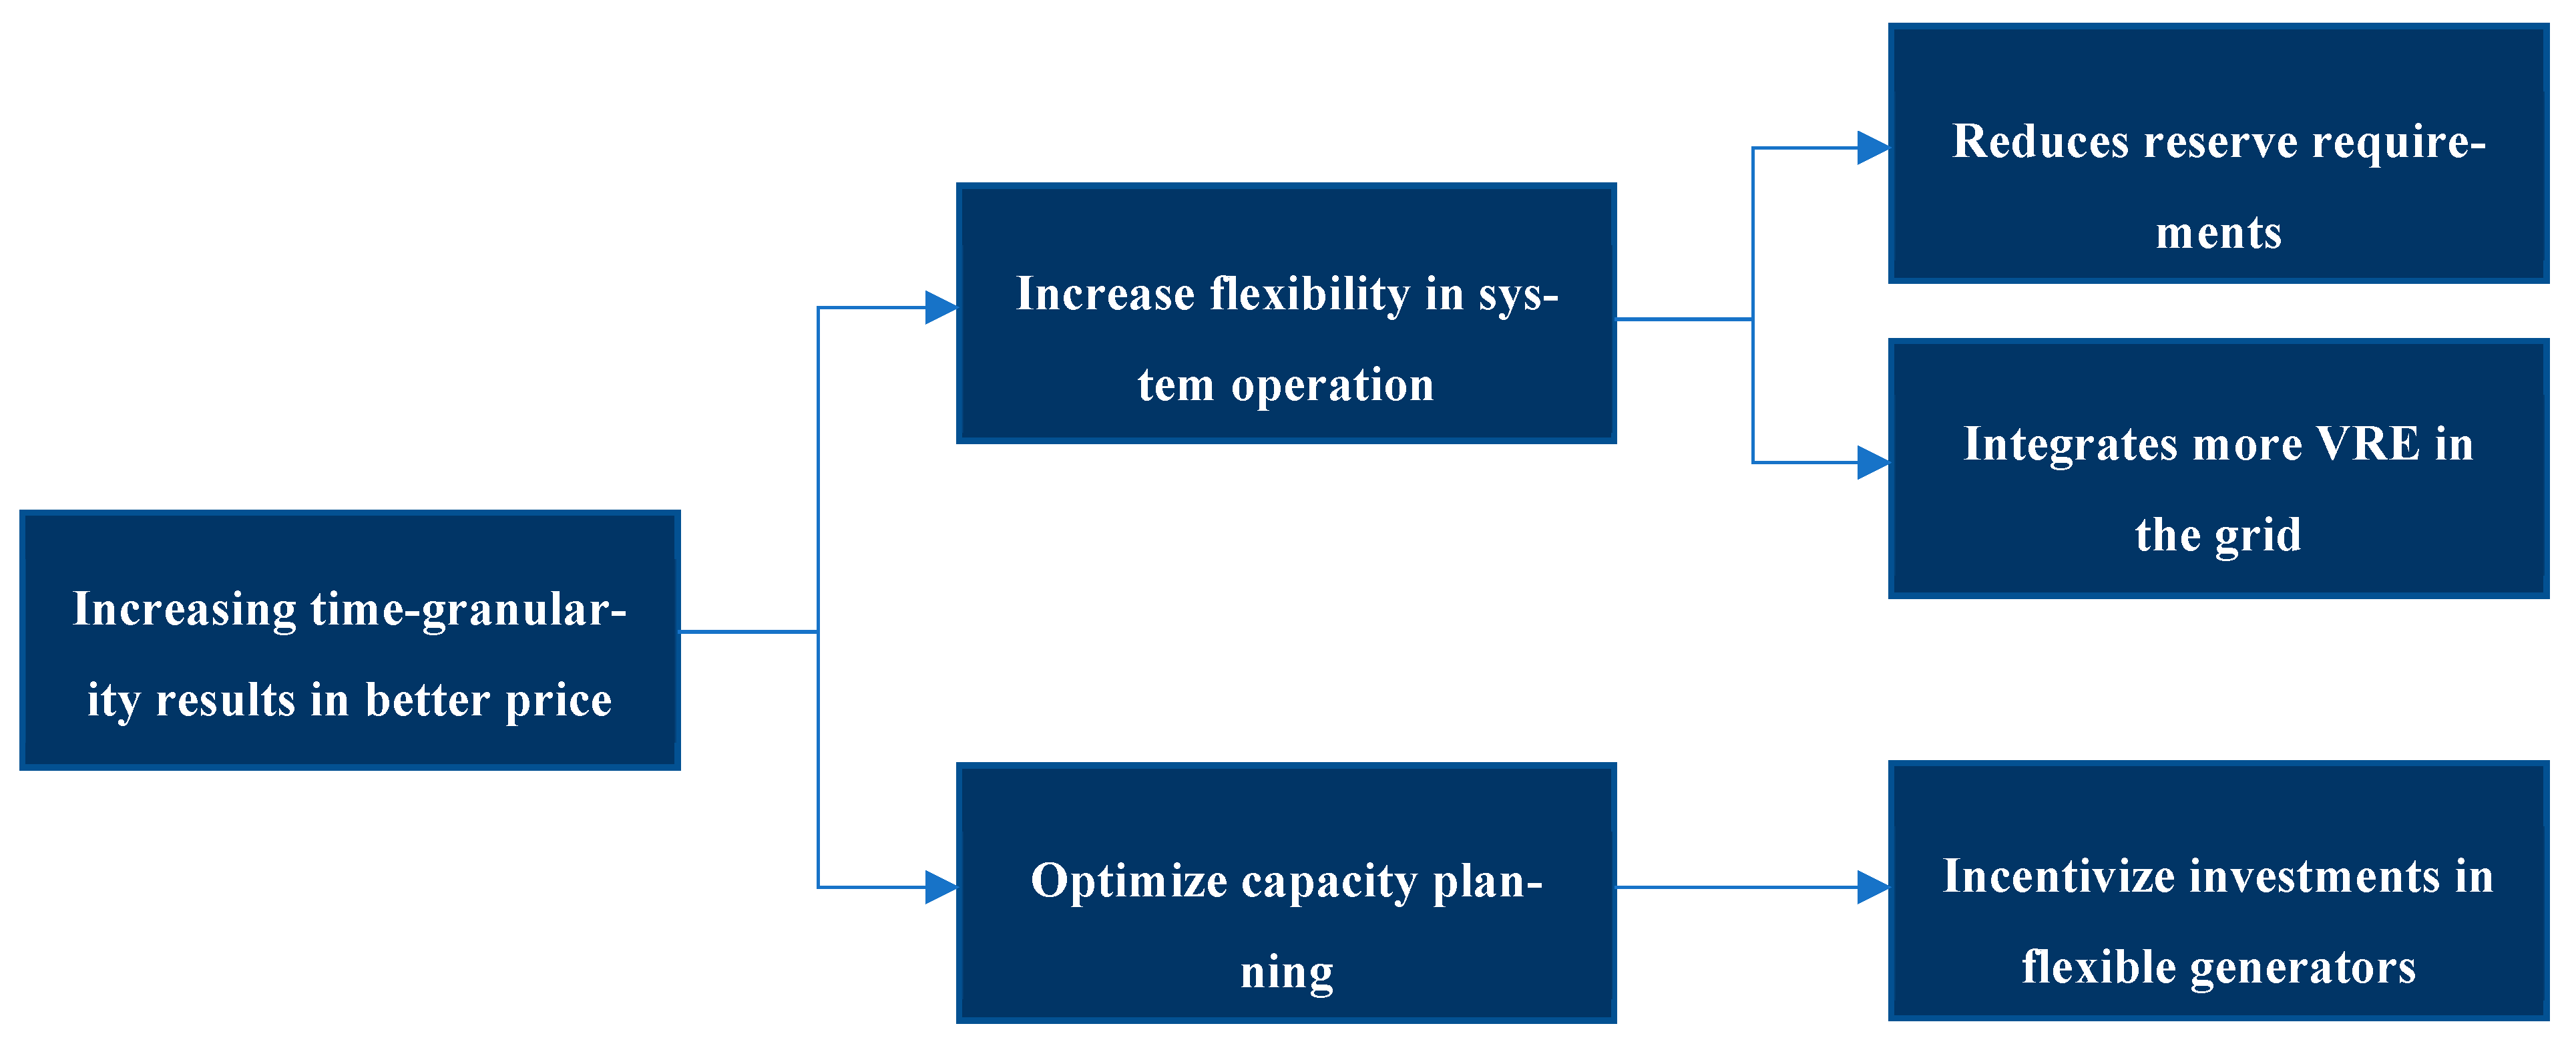
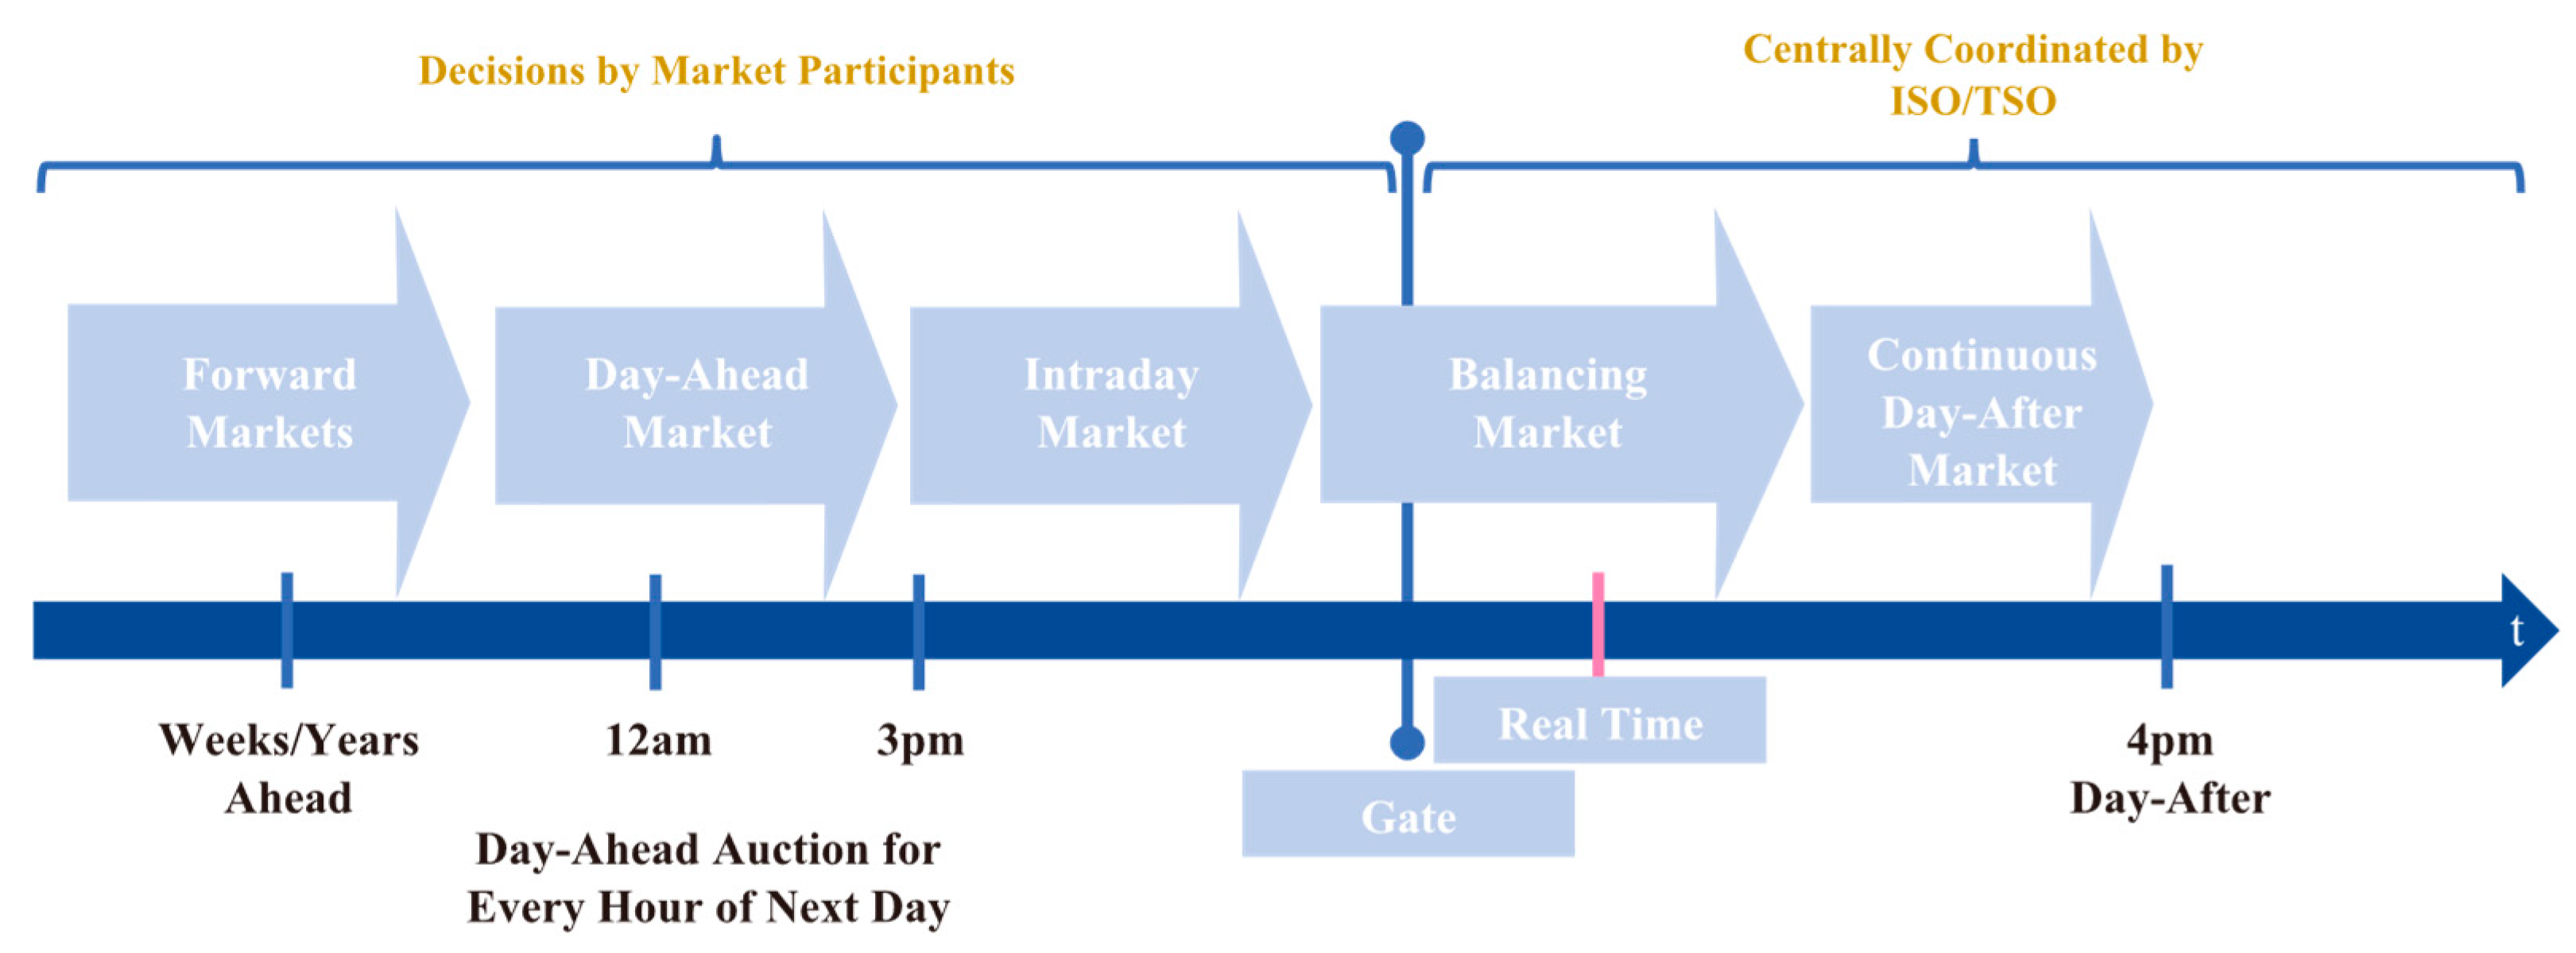
Europe’s electricity trading is now highly structured, with exchanges like EPEX SPOT enabling high-frequency, transnational electricity trading [25]. The foundational architecture for this advanced trading infrastructure was established through the pioneering work of key power exchanges (PXs), most notably Nordpool (established in 1993), which emerged as one of the world’s first multinational electricity exchanges and laid crucial groundwork for modern European energy trading [26]. The European Energy Exchange (EEX), established in 2002, and the Amsterdam Power Exchange (APX), launched in 1999, further consolidated the continent’s trading capabilities by creating integrated market mechanisms that would become essential components of today’s interconnected European electricity trading ecosystem [27]. These sophisticated trading platforms established the foundation for transparent, competitive, and digitally-enabled trading mechanisms that revolutionized electricity market operations by providing real-time price discovery, automated execution capabilities, and standardized contract processing that eliminated many inefficiencies of traditional bilateral trading arrangements [28]. The technological innovations introduced during this period included the comprehensive development of forward and futures contracts, which enabled market participants to hedge against price volatility and secure predictable revenue streams by locking in electricity prices for delivery periods ranging from months to several years in advance [29]. Additionally, the implementation of contracts for difference (CfDs) and Guarantees of Origin systems provided essential tools for managing investment risks and supporting renewable energy integration, with CfDs offering price stability mechanisms that protected developers from market volatility while Guarantees of Origin created certification frameworks that enabled consumers to verify the renewable source of their electricity purchases [30]. EPEX SPOT, the largest PX in Europe, enabled 611 TWh of electricity trading in 2022 across 13 countries [31]. Time resolution enhancements have improved price signaling, integrated more VRE (variable renewable energy), and incentivized flexible generation (Figure 3). With over 350 participating entities, it facilitates day-ahead and intraday trading with time granularities as fine as 15 min. These mechanisms support flexible generation, better planning, and enable BESS-based arbitrage strategies to capitalize on temporal price variation. Figure 4 illustrates the market timeframes managed via EPEX SPOT.

1.3. BESS-Enabled Energy Arbitrage—Opportunity and Contribution

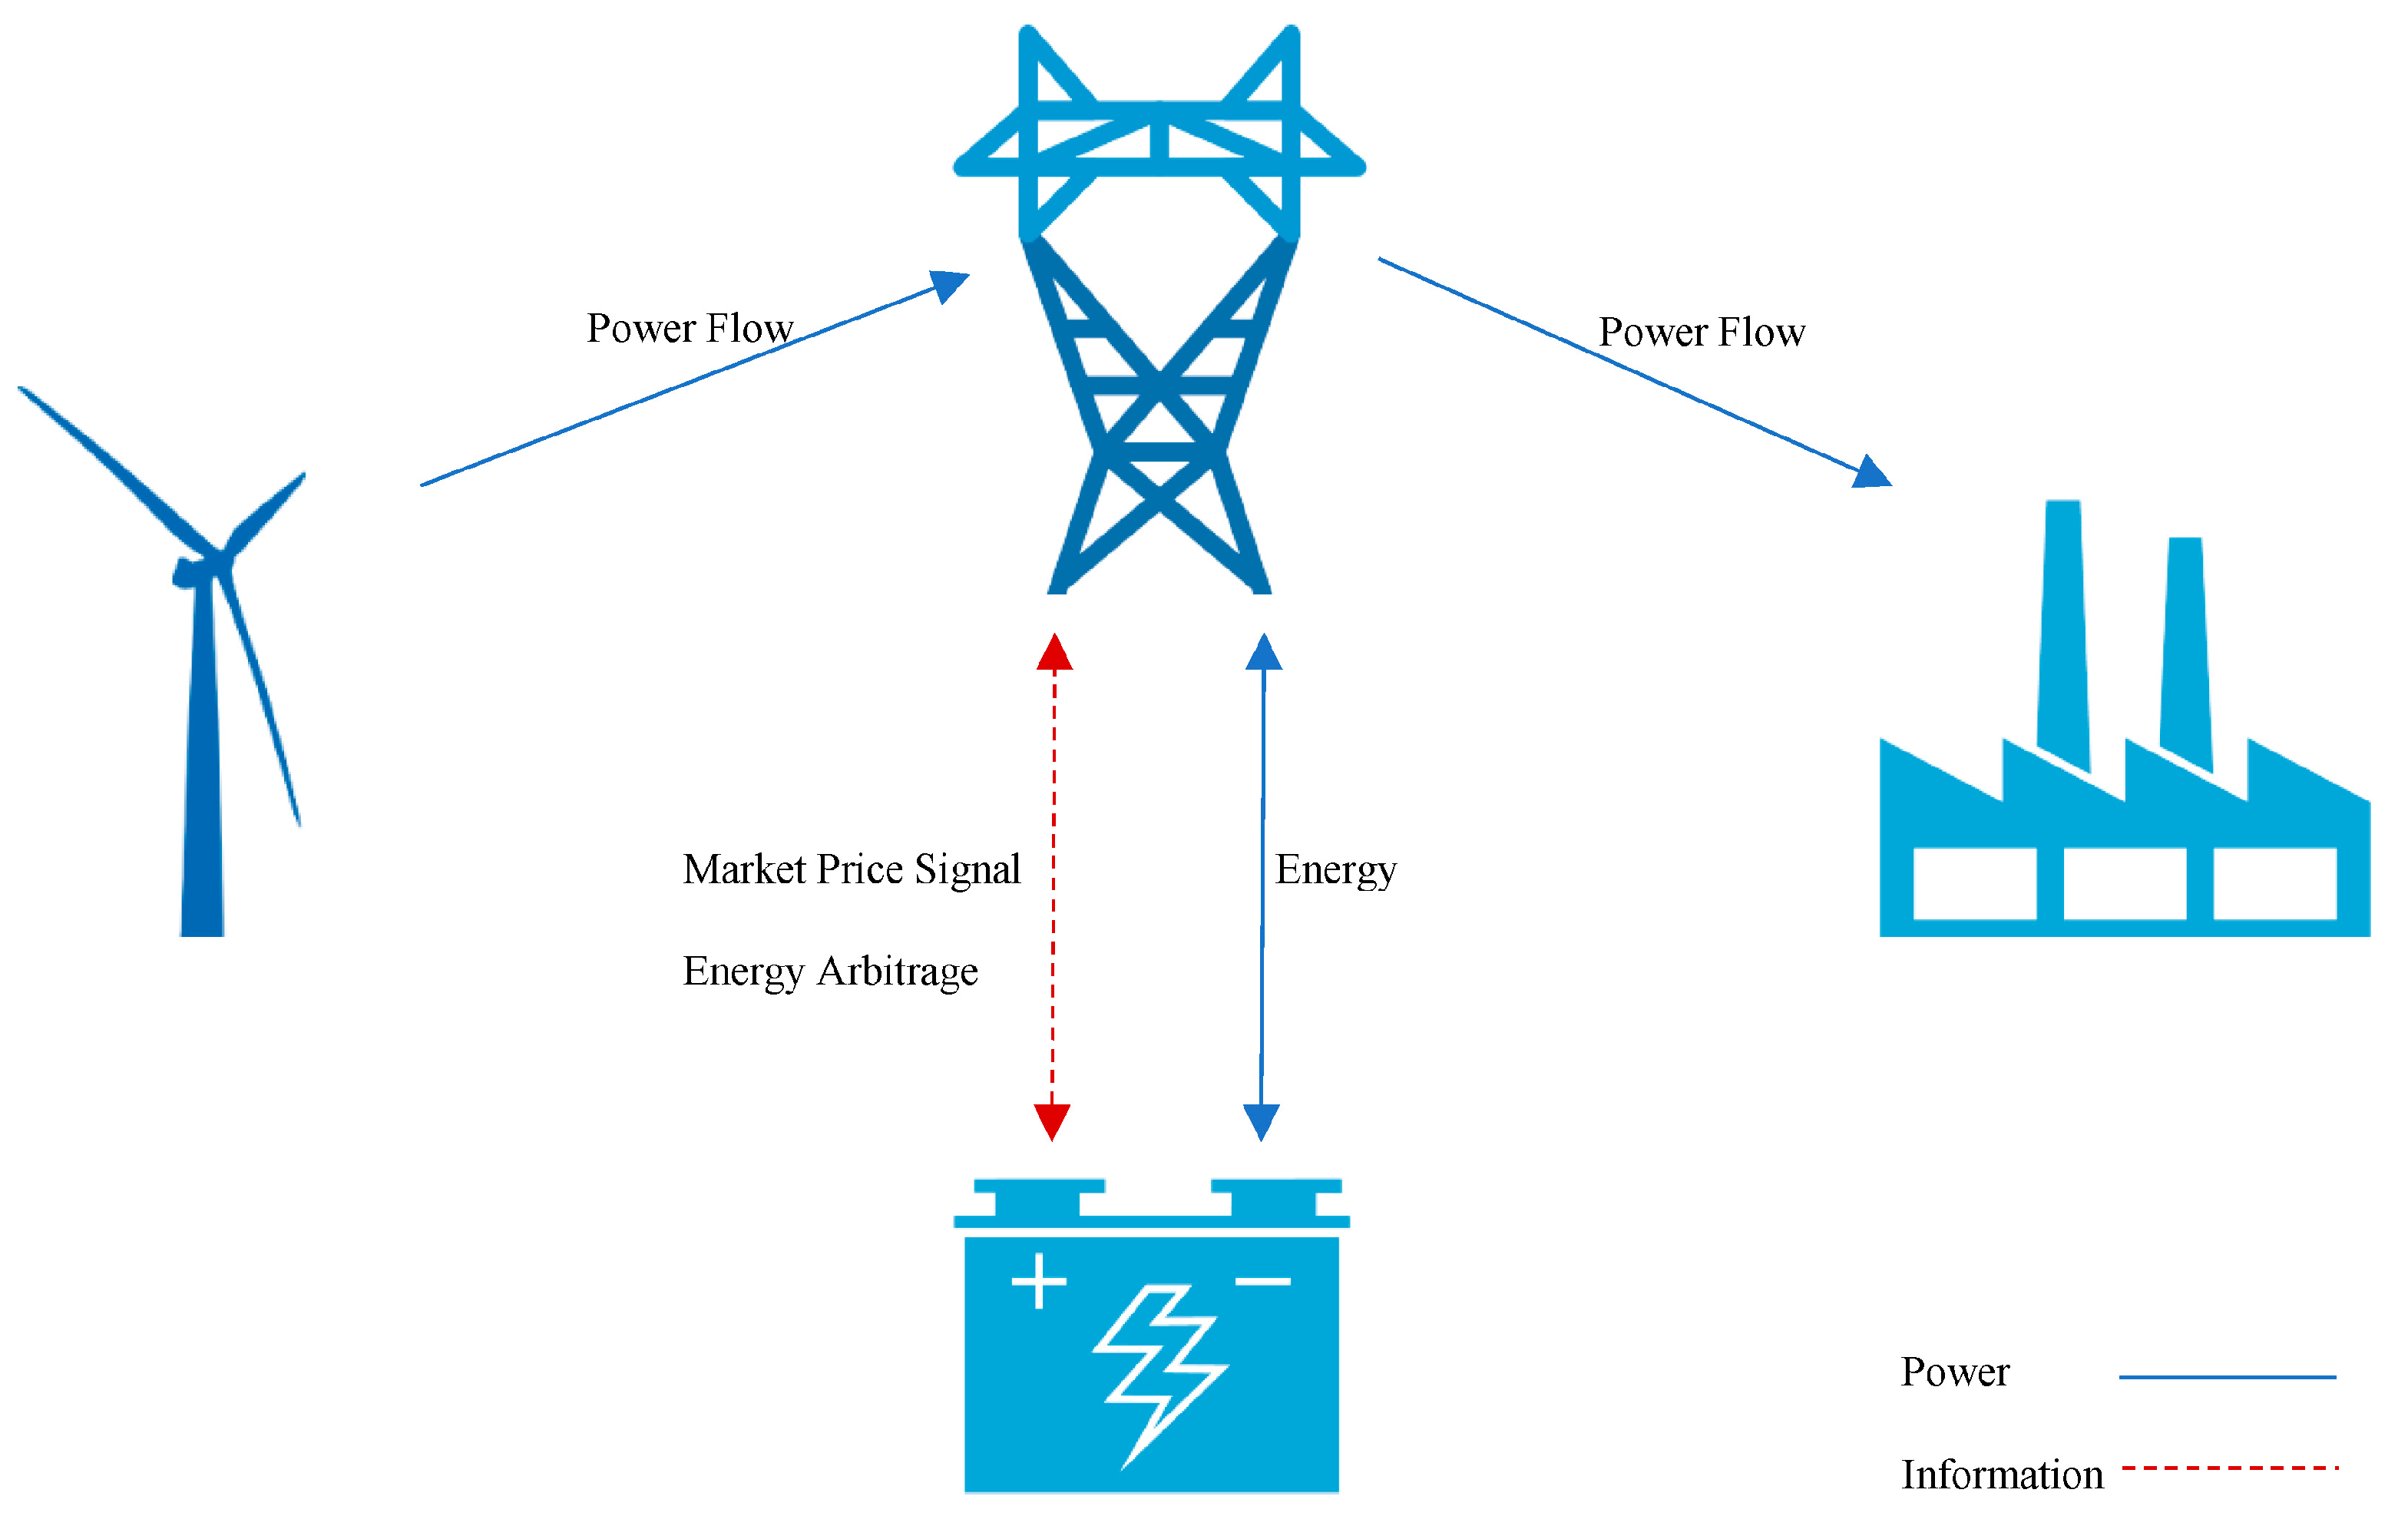
BESS solutions offer both ancillary and energy arbitrage functionalities [32]. Arbitrage involves buying electricity during low-price periods, storing it, and then discharging it during high-price periods—stabilizing the grid while generating profit [33]. Apart from energy arbitrage, BESSs have provided key ancillary services necessary for stabilizing the grid in stress events [34]. However, the integration of BESSs in distribution networks must consider battery technology, SOH degradation, sizing, control, and location [35]. Despite high CAPEX and operational demands, declining BESS costs (Figure 5) and the rapid development of power converters (Figure 6) are driving widespread deployment [36]. Enhanced converter ratings allow for faster charge–discharge cycles, increasing the arbitrage efficiency. Moreover, BESS-EA helps mitigate the volatility caused by rising behind-the-meter renewable generation. Electricity’s unique behavior as a commodity—non-storability, negative pricing events, and low price elasticity—supports the arbitrage model. For instance, Austria’s wholesale market saw −500 EUR/MWhe at 1200 h on 2 July 2023 [37], illustrating the arbitrage potential. Studies have also confirmed electricity’s increasing inelasticity over time [38]. Figure 7 illustrates energy arbitrage as a system responsive to price signals. This paper focuses on how spatial factors—regulatory risk, market volatility, and economic indicators—affect the locational choice for BESS-EA investment. Today’s electricity market operates in cycles as short as 15 min. Participants range from GENCOs, DISCOs, and TSOs to aggregators and prosumers, each with defined roles (Table 1).
The BESS-enabled energy arbitrage problem can be formulated with the following objective function and constraints:
  • Maximize:
α = t = 1 T P t × E t s e l l t = 1 T C t × E t b u y t = 1 Z [ Ω t a m o r t ] t = 1 T Ψ t t = 1 T γ t } ,
where:
  • α is the profit from energy arbitrage operation over the entire operation horizon T;
  • t = 1 T P t × E t s e l l is the total revenue obtained by selling battery energy to the grid:
    P t is the price at which energy is sold by the BESS-EA venture to the grid at time index t;
    E t s e l l is the battery energy quantum sold to the grid at time index t.
  • t = 1 T C t × E t b u y is the total cost incurred by purchasing energy from the grid to charge the battery:
    C t is the hourly electricity price offered by the grid at time index t;
    E t b u y is the battery energy quantum bought from the grid at time index t.
  • t = 1 Z [ Ω t a m o r t ] is the accumulated and amortized CAPEX debt component over the debt payoff period Z:
    Ω t a m o r t is the CAPEX debt amortization cost at time index.
  • t = 1 T Ψ t is the OPEX accumulated over the operation horizon T:
    Ψ t is the OPEX cost component at time index t.
  • t = 1 T γ t is the battery state-of-health (SOH) degradation costs accumulated during operation:
    γ t is the battery SOH cost component at time index t.
  • Constraints:
i. 
Energy Balance:
t = 1 T E t c h a r g e t = 1 T { E t d i s c h a r g e } = 0 ,
where:
  • t = 1 T E t c h a r g e is the total energy quantum charged (bought from the grid) over the entire operation horizon T:
    E t c h a r g e is the battery energy quantum bought (charged) at time index t.
  • t = 1 T { E t d i s c h a r g e } is the total battery energy quantum discharged (sold to the grid) over the entire operation horizon T:
    E t d i s c h a r g e is battery energy quantum sold (discharged) at time index t.
ii. 
BESS Capacity:
0 E t E m a x
where:
  • E t is the battery energy quantum stored in the battery at time index t;
  • E m a x is the maximum energy storage capacity of the Battery energy storage system (BESS).
iii. 
Minimum SOC Requirement:
S O C m i n S O C t
where:
  • S O C t is the battery state-of-charge at time index t, representing the current energy level of the battery as a fraction or percentage of its total capacity;
  • S O C m i n is the minimum state-of-charge allowed by the battery manufacturer for optimal battery life and performance.
The major contributions of this paper can be summarized as follows:
  • Developed the first systematic comparative methodology for evaluating BESS-enabled energy arbitrage opportunities across 29 European electricity markets, integrating 8 years of hourly price data (2015–2023) with regulatory, economic, and supply-origin risk variables to create a holistic investment decision framework.
  • Introduced and validated a standardized energy arbitrage feasibility (EAF) scoring methodology that combines normalized electricity market volatility metrics with country-specific risk factors, enabling a quantitative comparison of investment opportunities across diverse European markets through five investor-preference scenarios.
  • Designed Algorithm 1 for generating investor-friendly 3D surface plots that visualize complex temporal price patterns, coupled with novel statistical metrics (including ESOR, AHPD, and ICR) specifically tailored for energy arbitrage analysis, providing actionable insights for BESS scheduling and market entry strategies.
Algorithm 1 Three-Dimensional Surface Plot Generation Method
Input: 
Cleaned and pre-processed hourly electricity price table data for “country” (78,144 rows, and 3 columns)
Output: 
Three-dimensional surface plot
1:
Convert data to platform-compliant format
2:
Extract the hour and year from the DatetimeUTC column
3:
Store the hour and year in new columns in the imported input “country” table
4:
Create a grid for the years and hours in data, with one axis representing years (2015–2023) and the other axis representing “hour of the day” (0–23)
5:
Compute the average of all prices observed at 0000 Hours every day for the year 2015. Repeat for each hour-of-day in 2015. Store the 24 values generated for the year 2015 in the grid created in Step 4
6:
Repeat step 5 for each of the remaining years in the data
7:
Interpolate the price data using the Gaussian filter
8:
Create labelled plot axes: Year on x-axis; Hour of Day on y-axis; and Price(Eur) on z-axis
9:
Generate a plot using the populated grid from Step 4
The remainder of this article is organized as follows. Section 2 outlines the data sources, preprocessing steps, and methodological framework employed to analyze the electricity markets and evaluate the locational feasibility of battery energy storage system (BESS)-enabled energy arbitrage ventures. This includes the development of statistical metrics, economic indicators, and the energy arbitrage feasibility (EAF) scoring system. Section 3 presents the empirical results and comparative analysis across 29 European electricity markets under multiple investor preference scenarios. Section 4 discusses the implications of the findings for investors and policymakers, highlighting strategic considerations for market selection. Finally, Section 5 concludes the paper with a summary of key insights and suggestions for future research.

2. Data and Methodology

2.1. Data

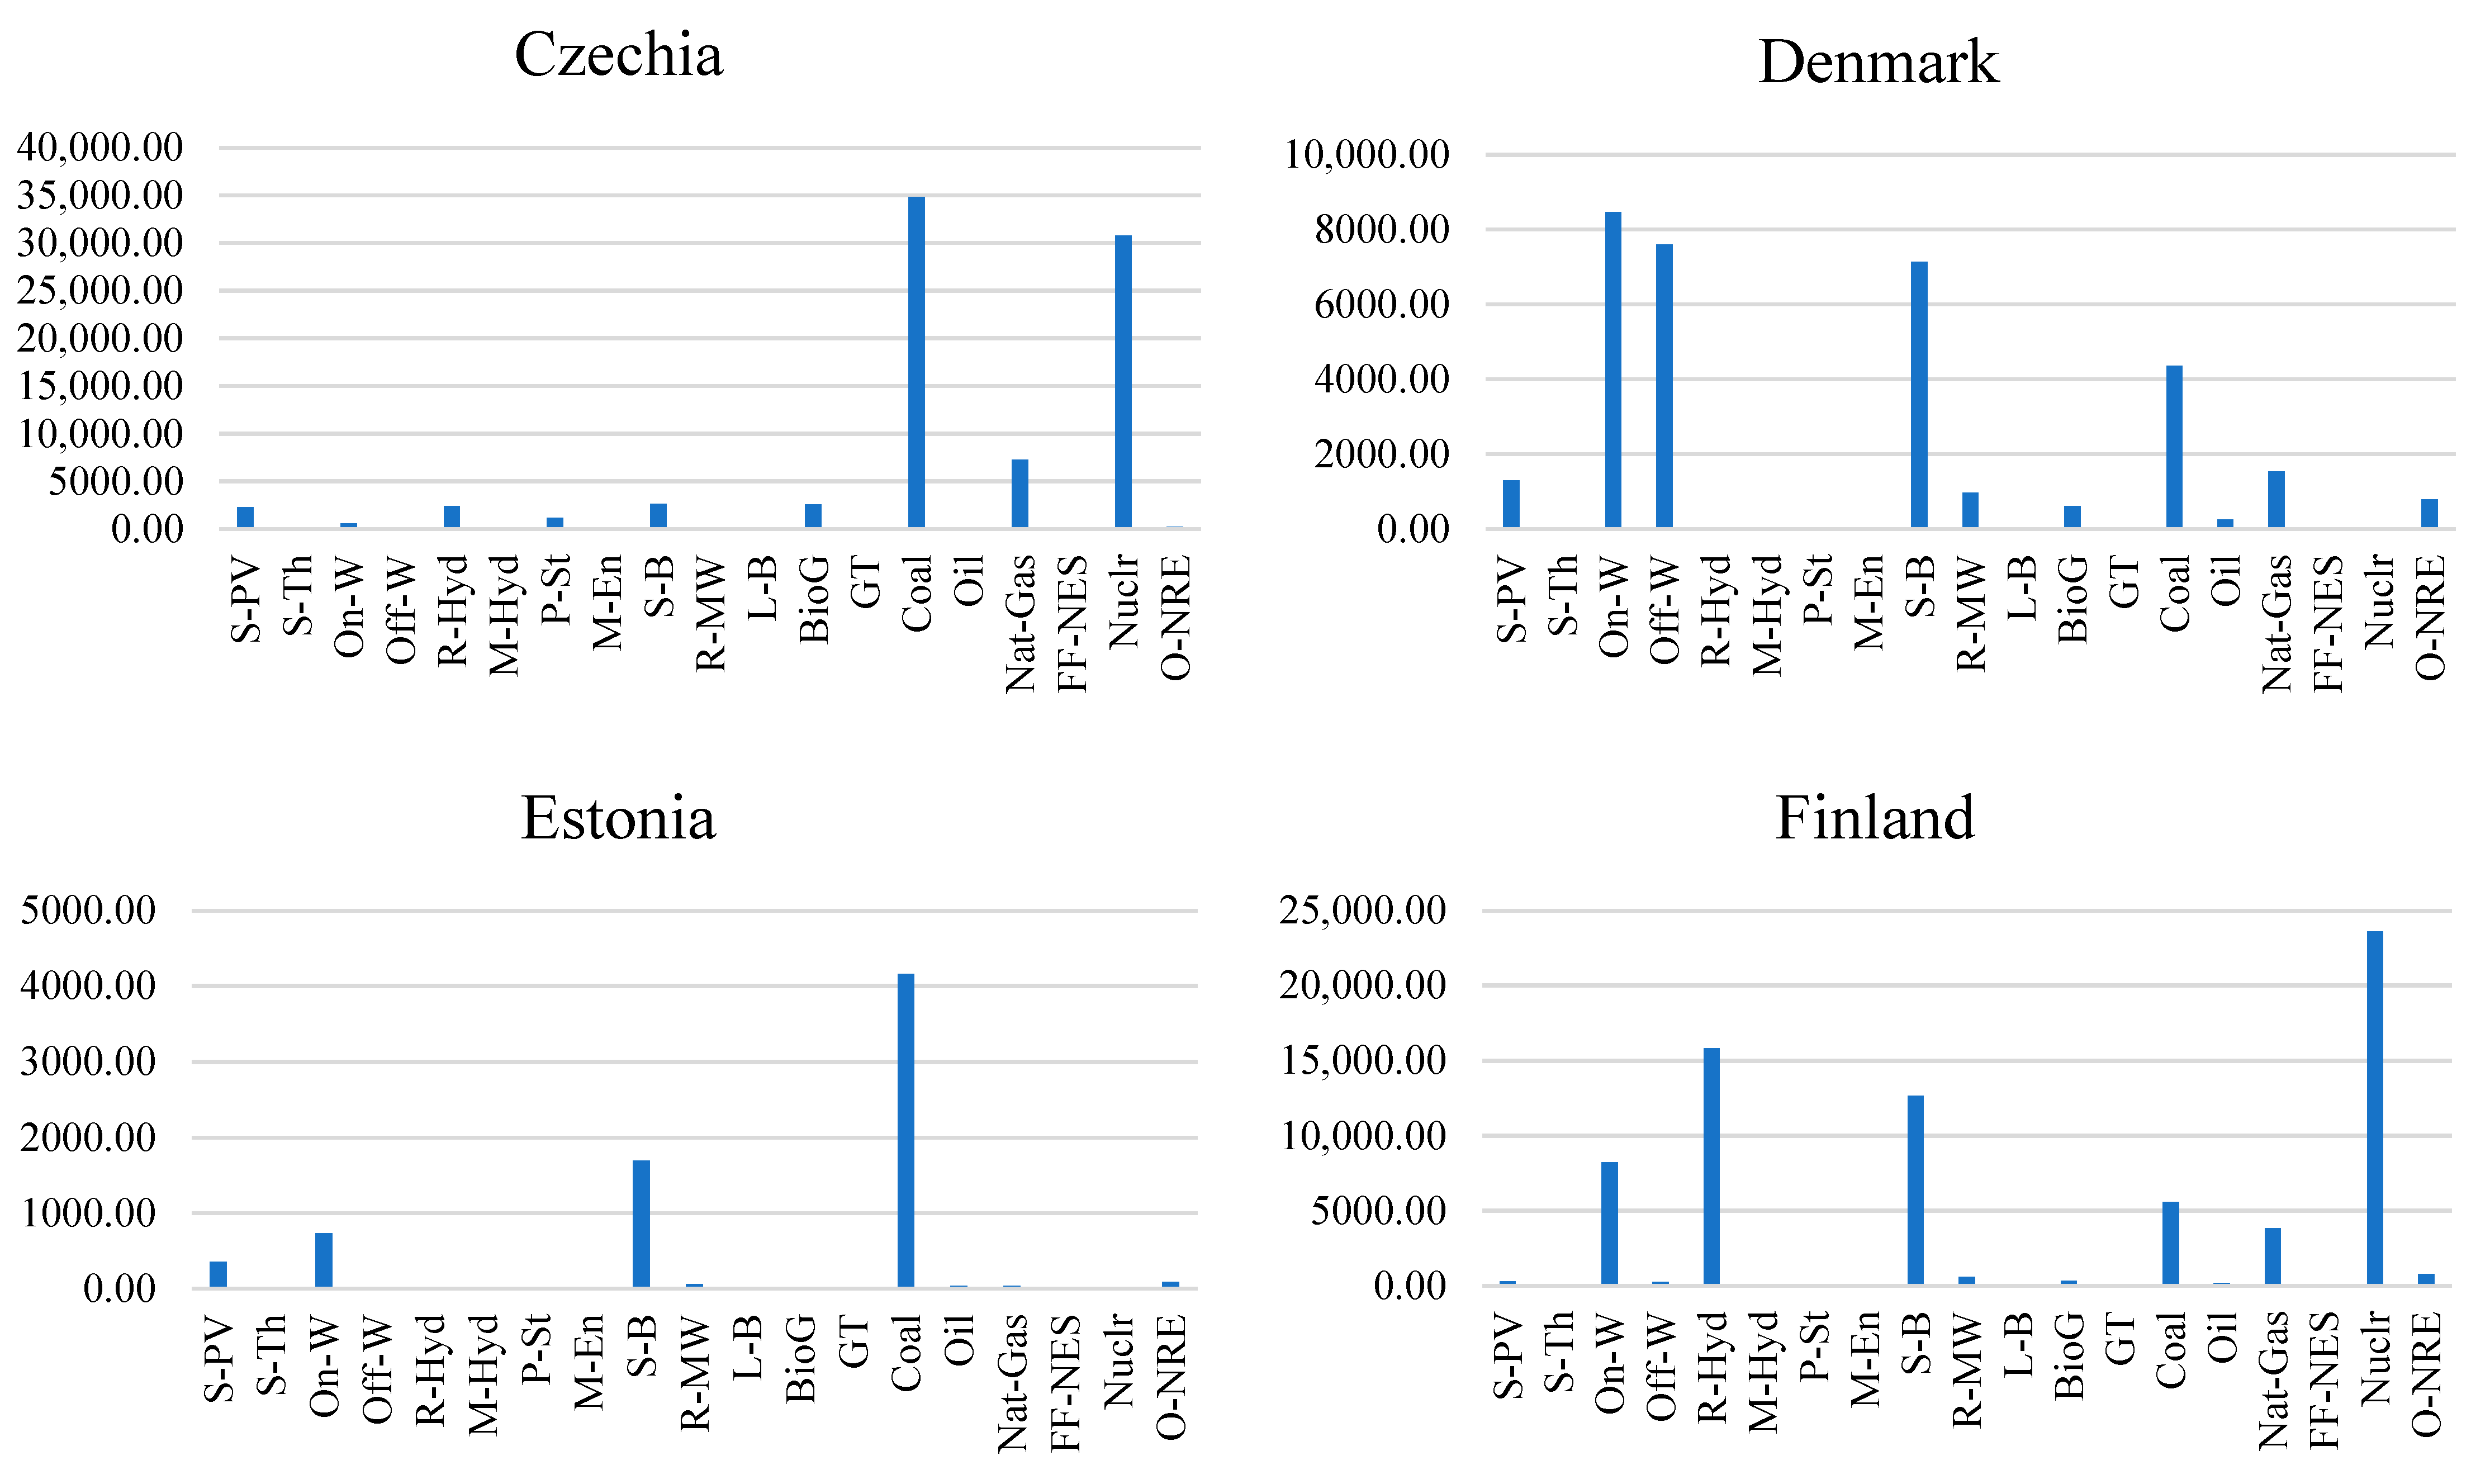
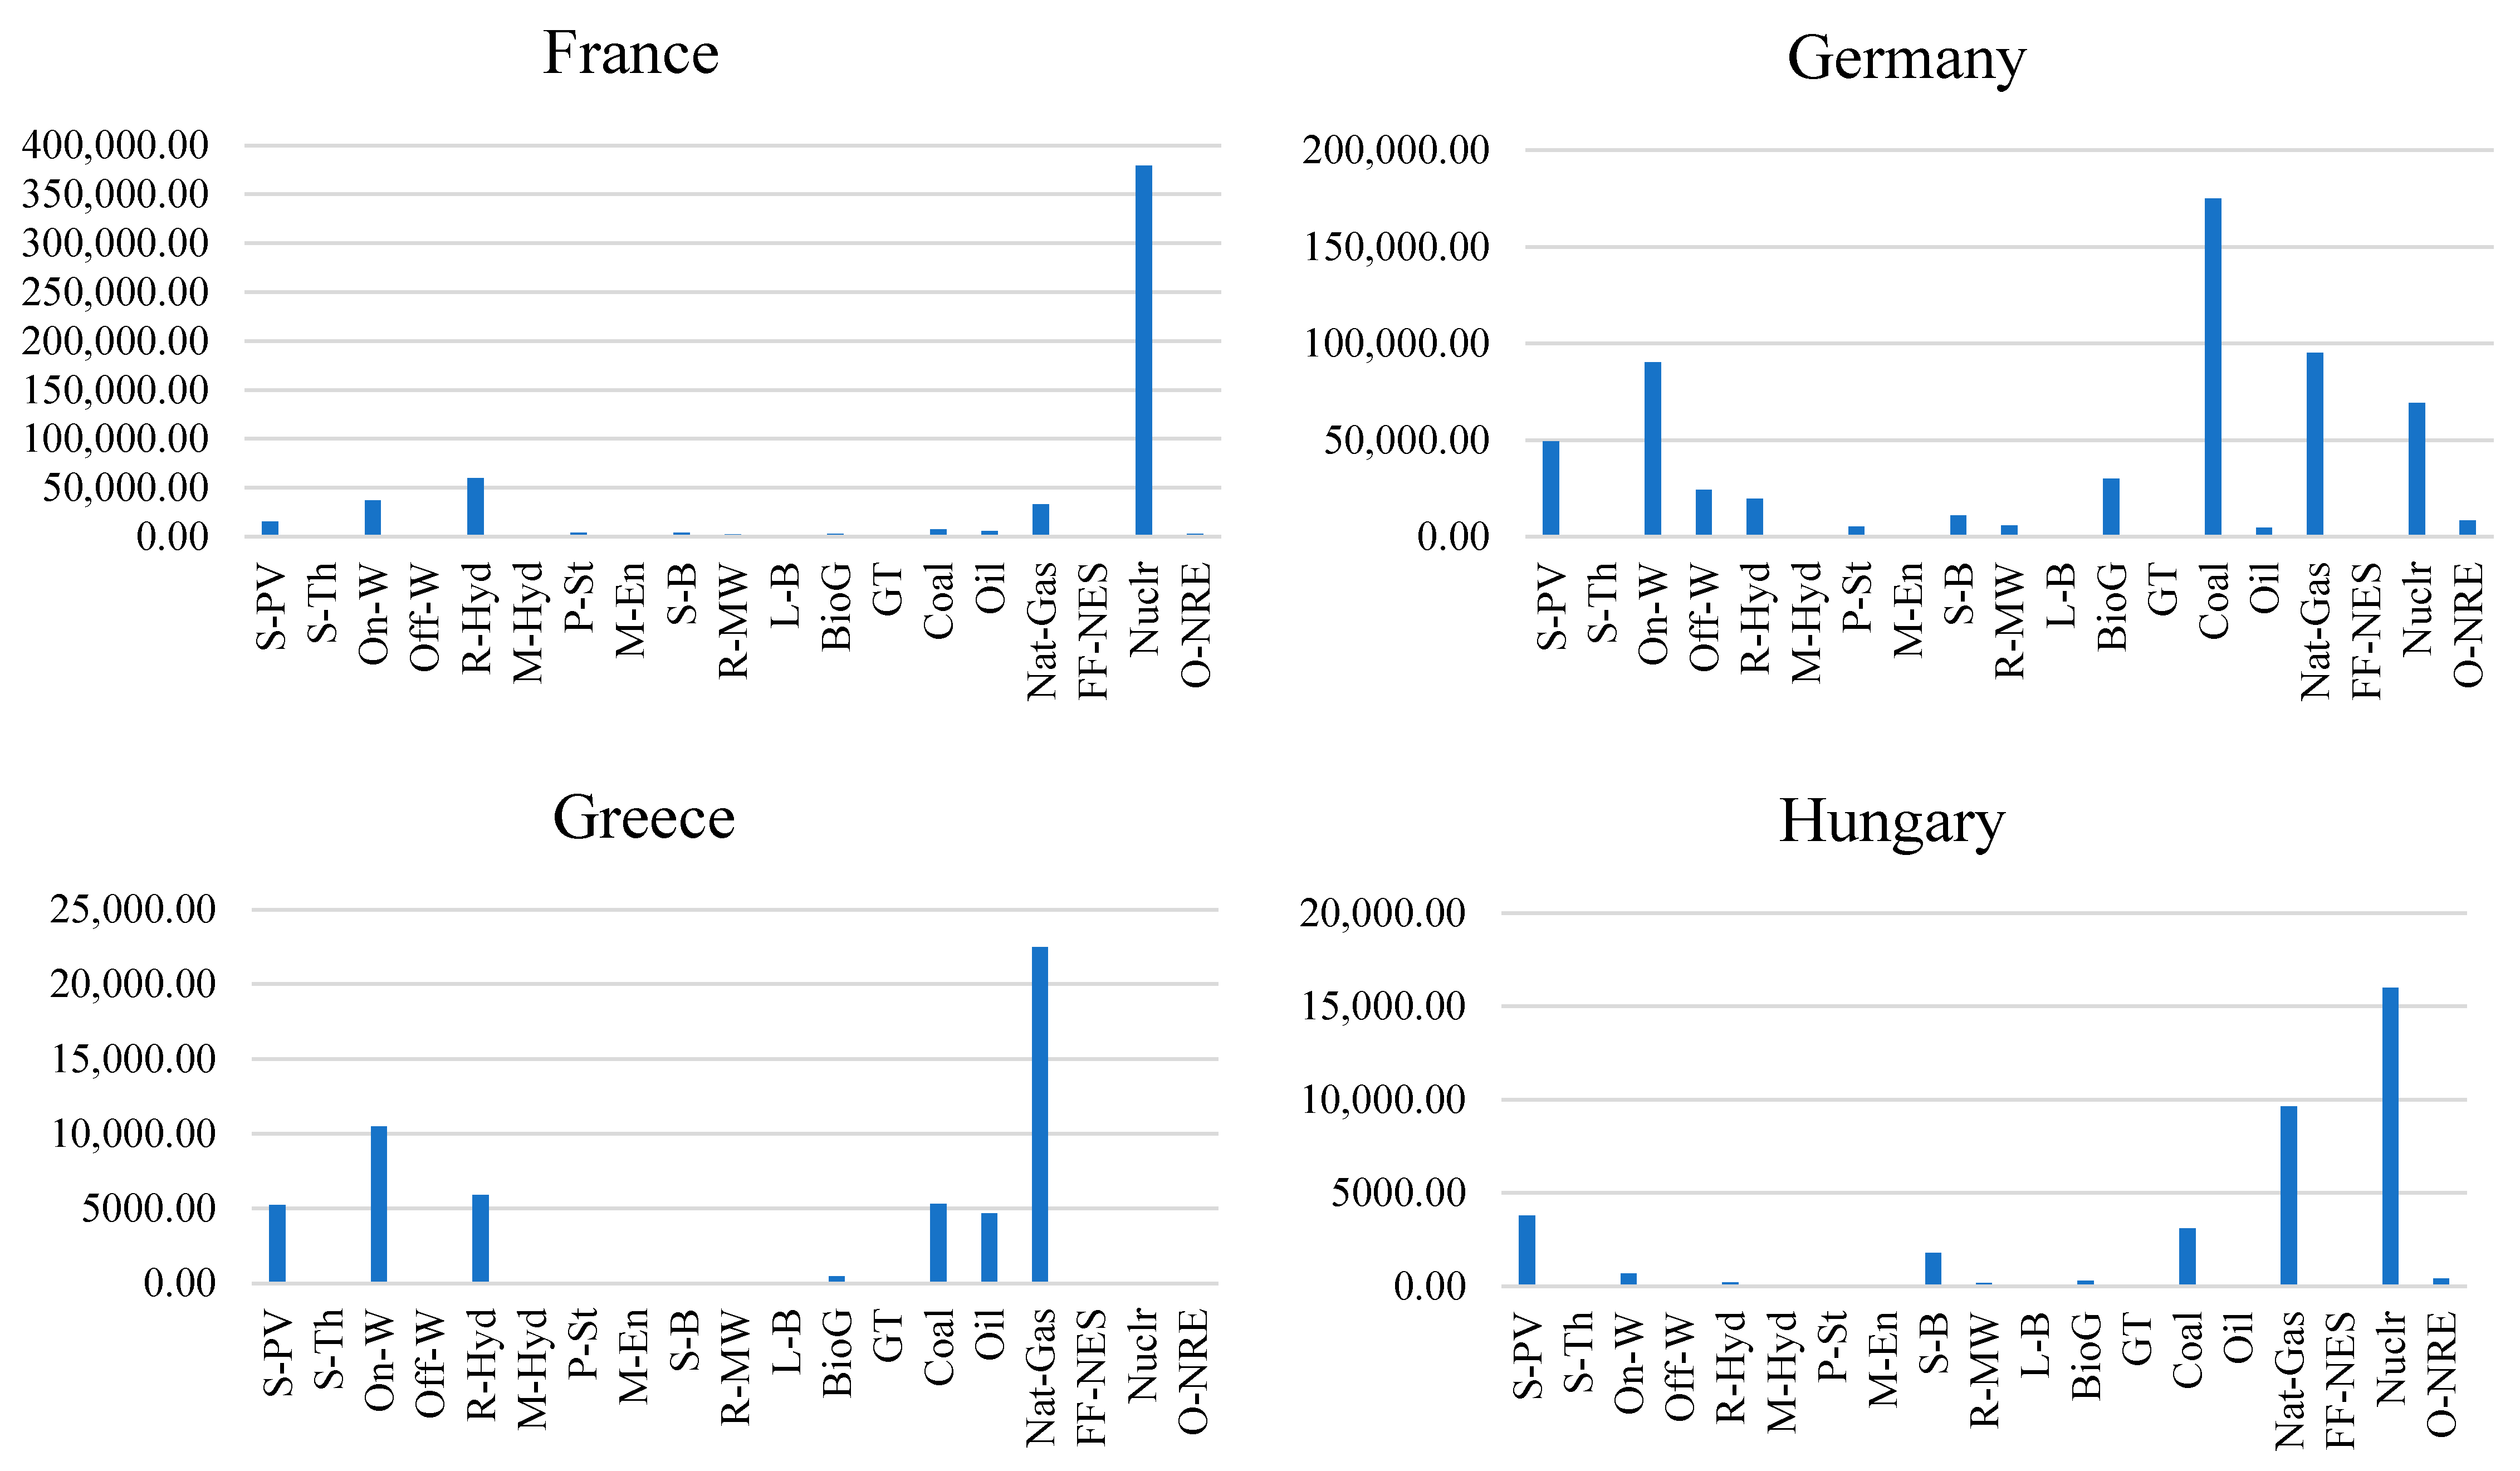
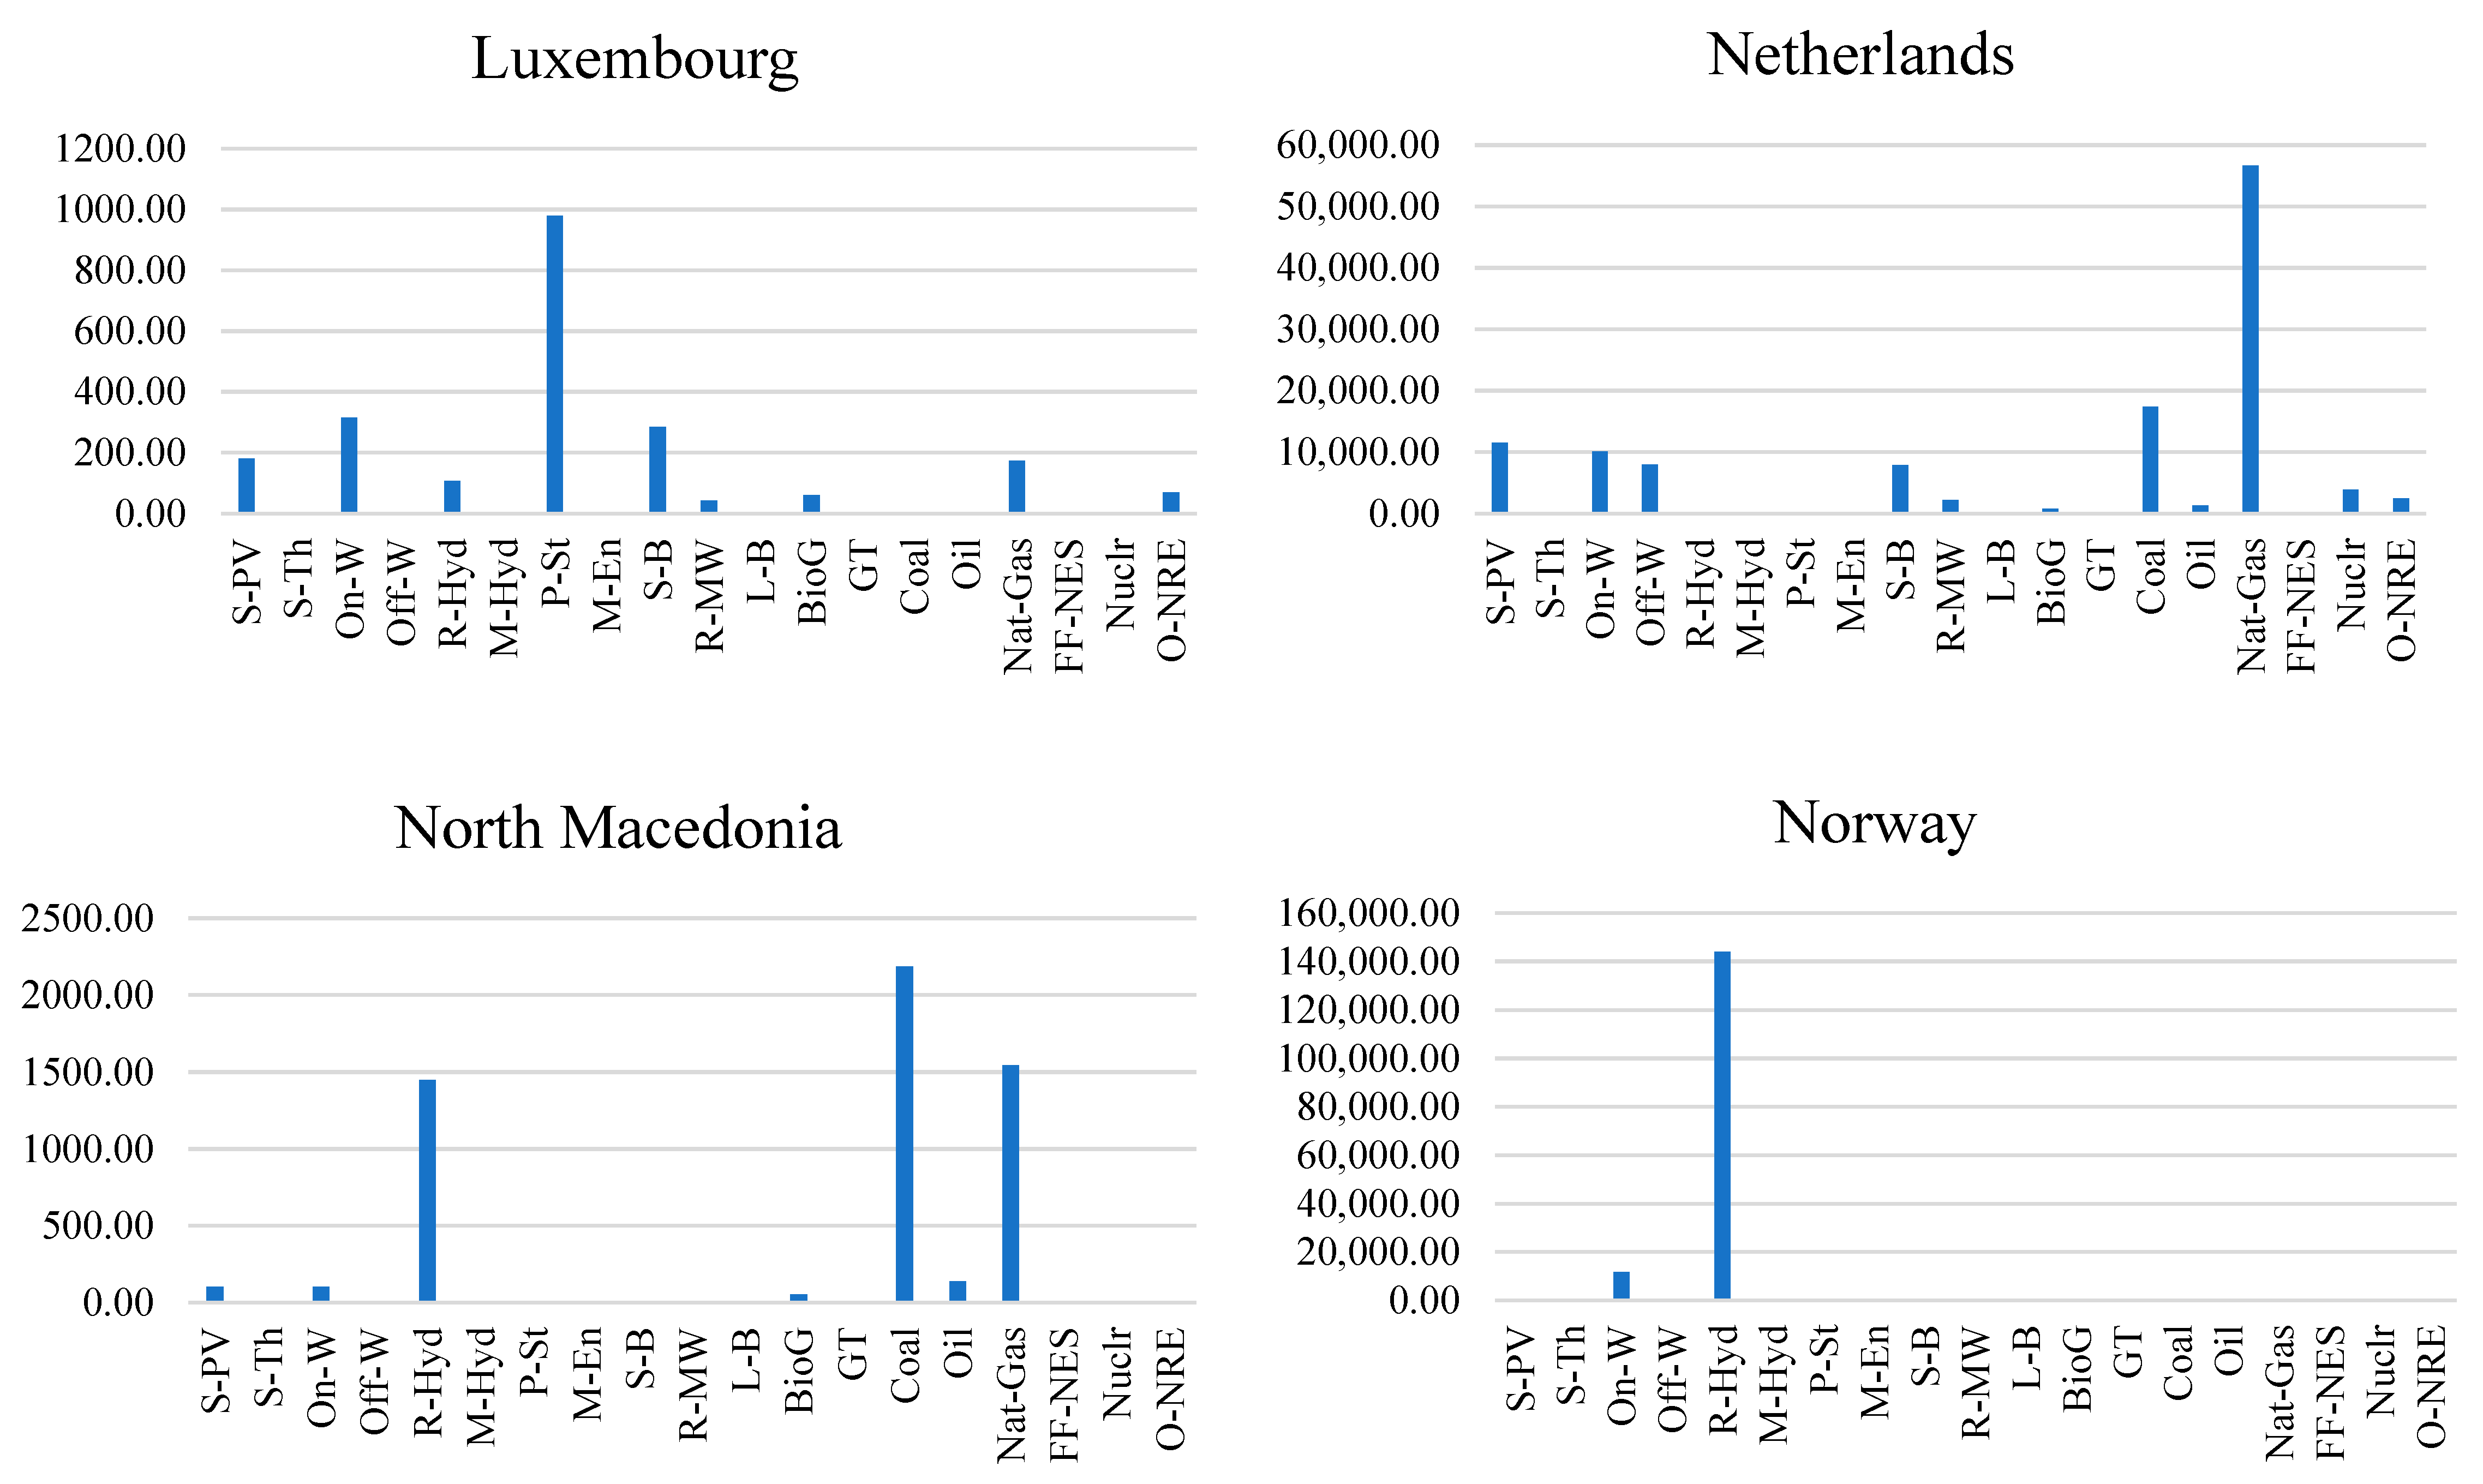
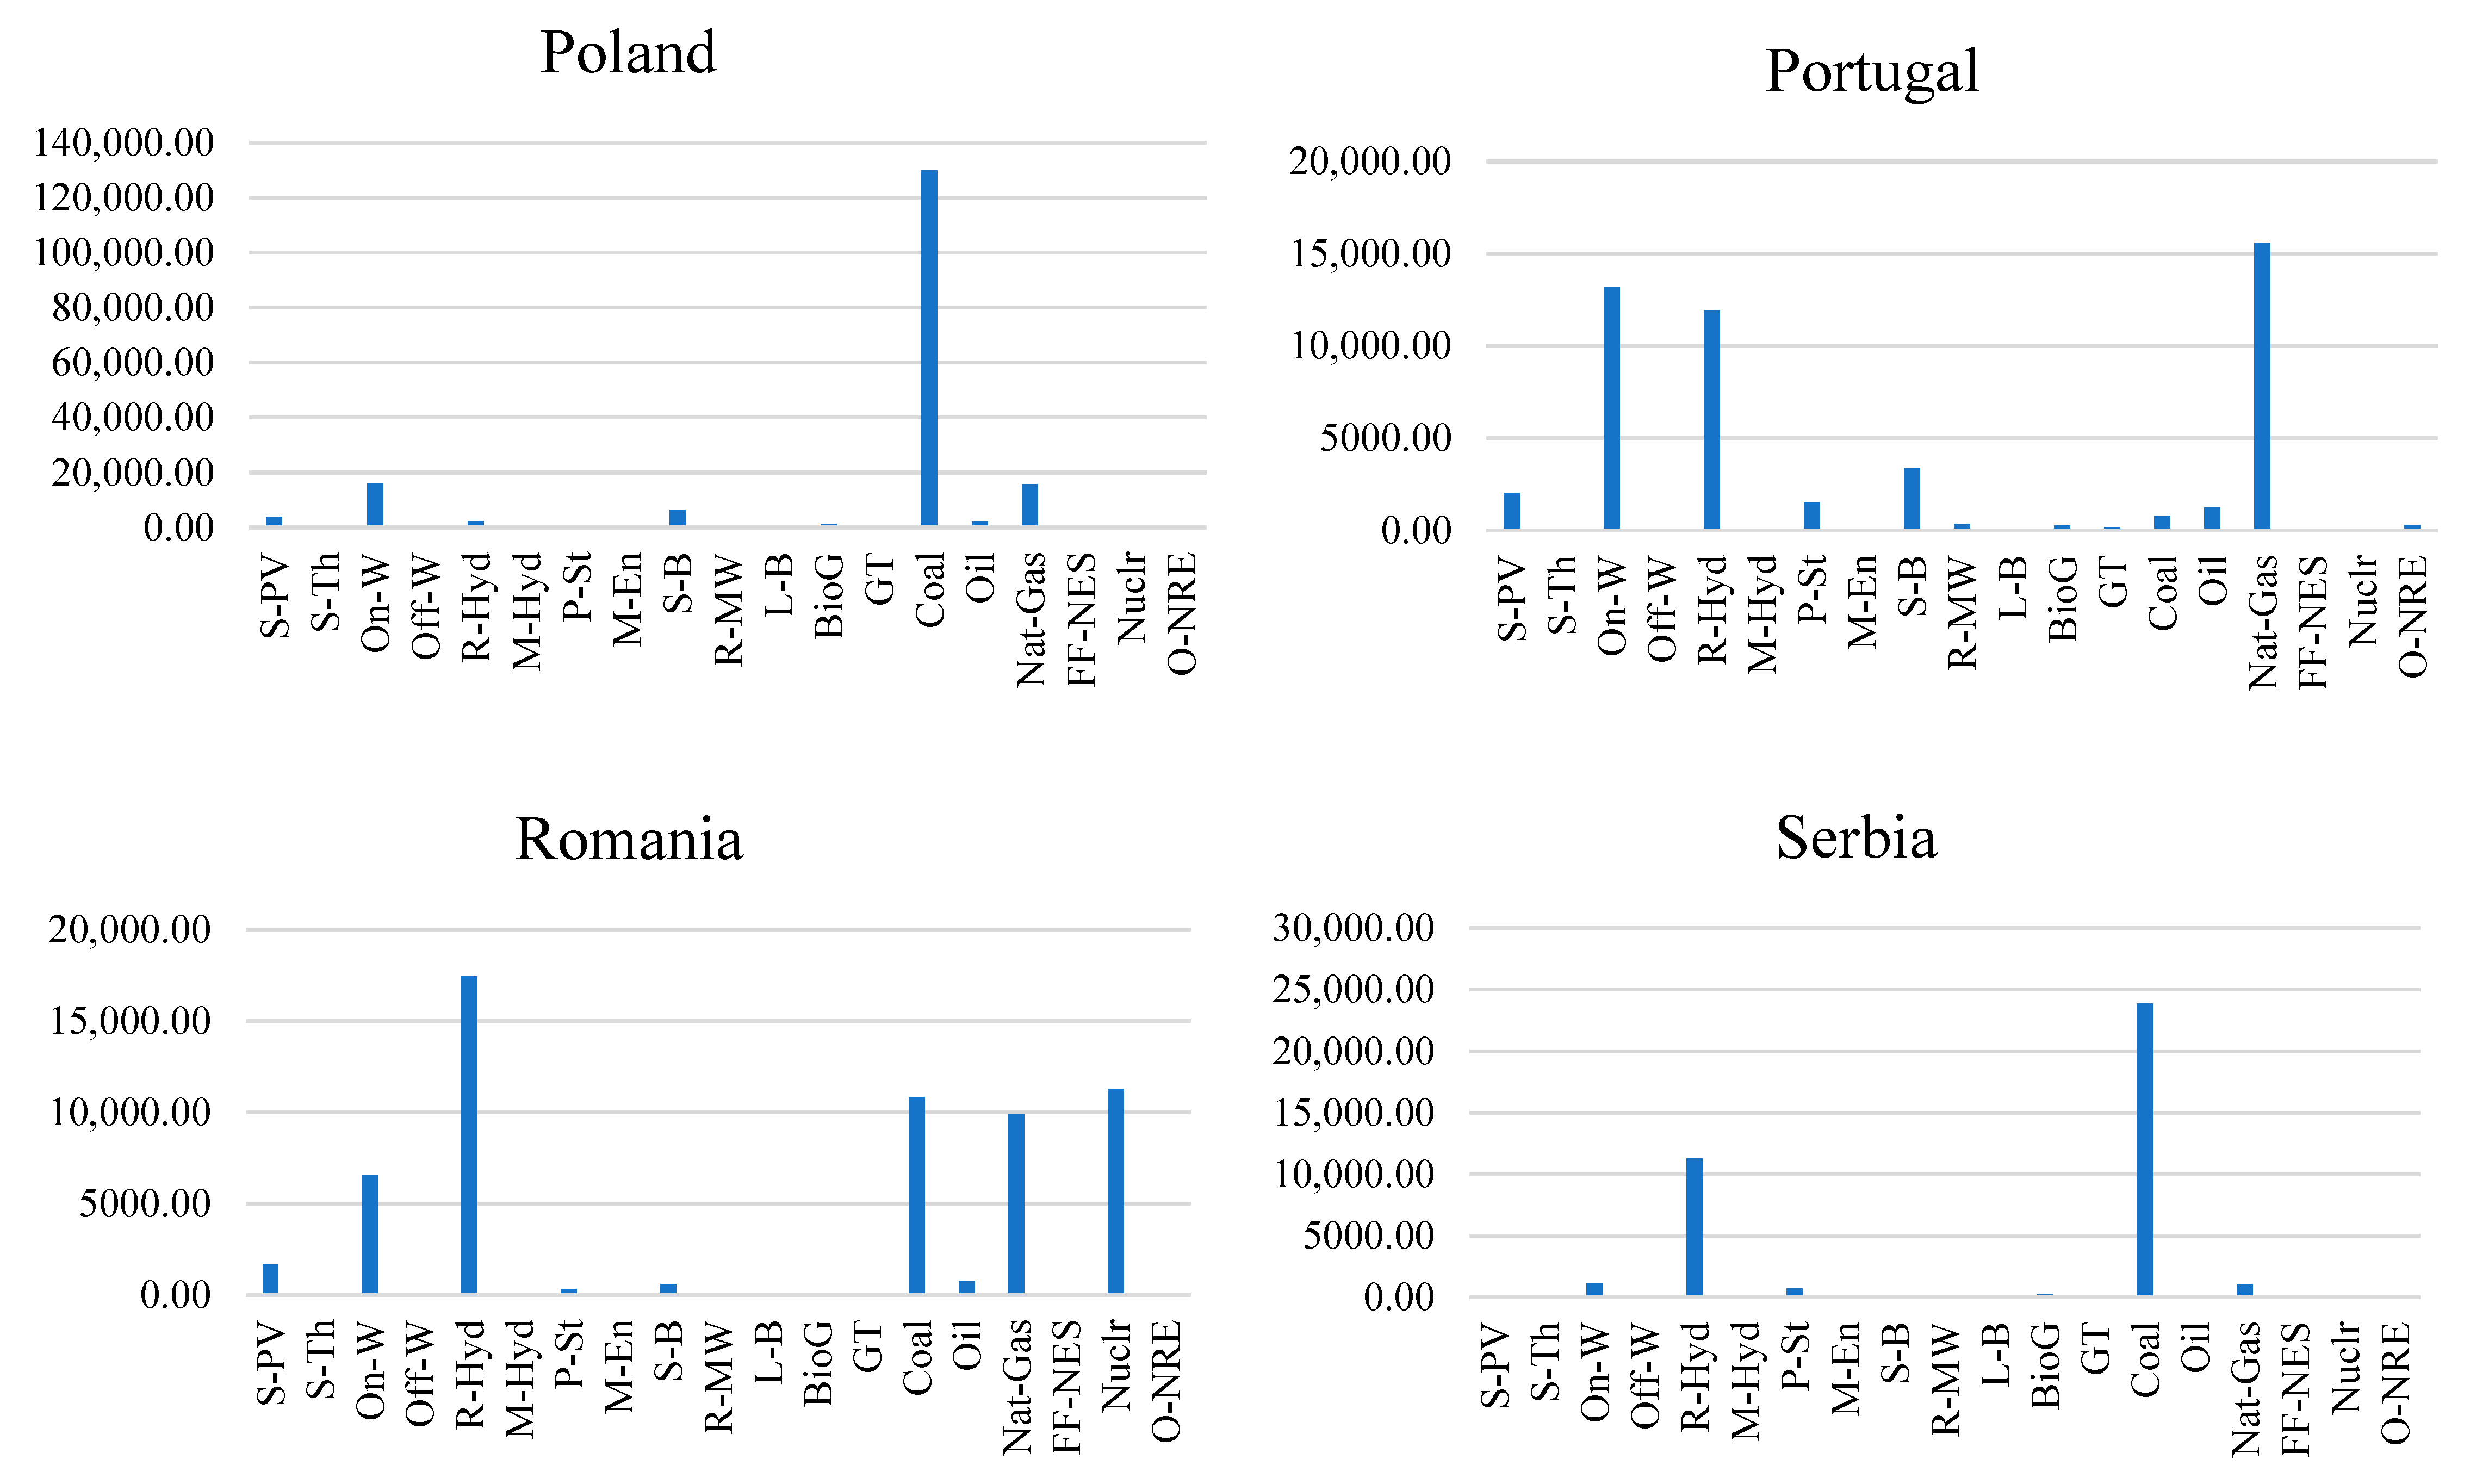
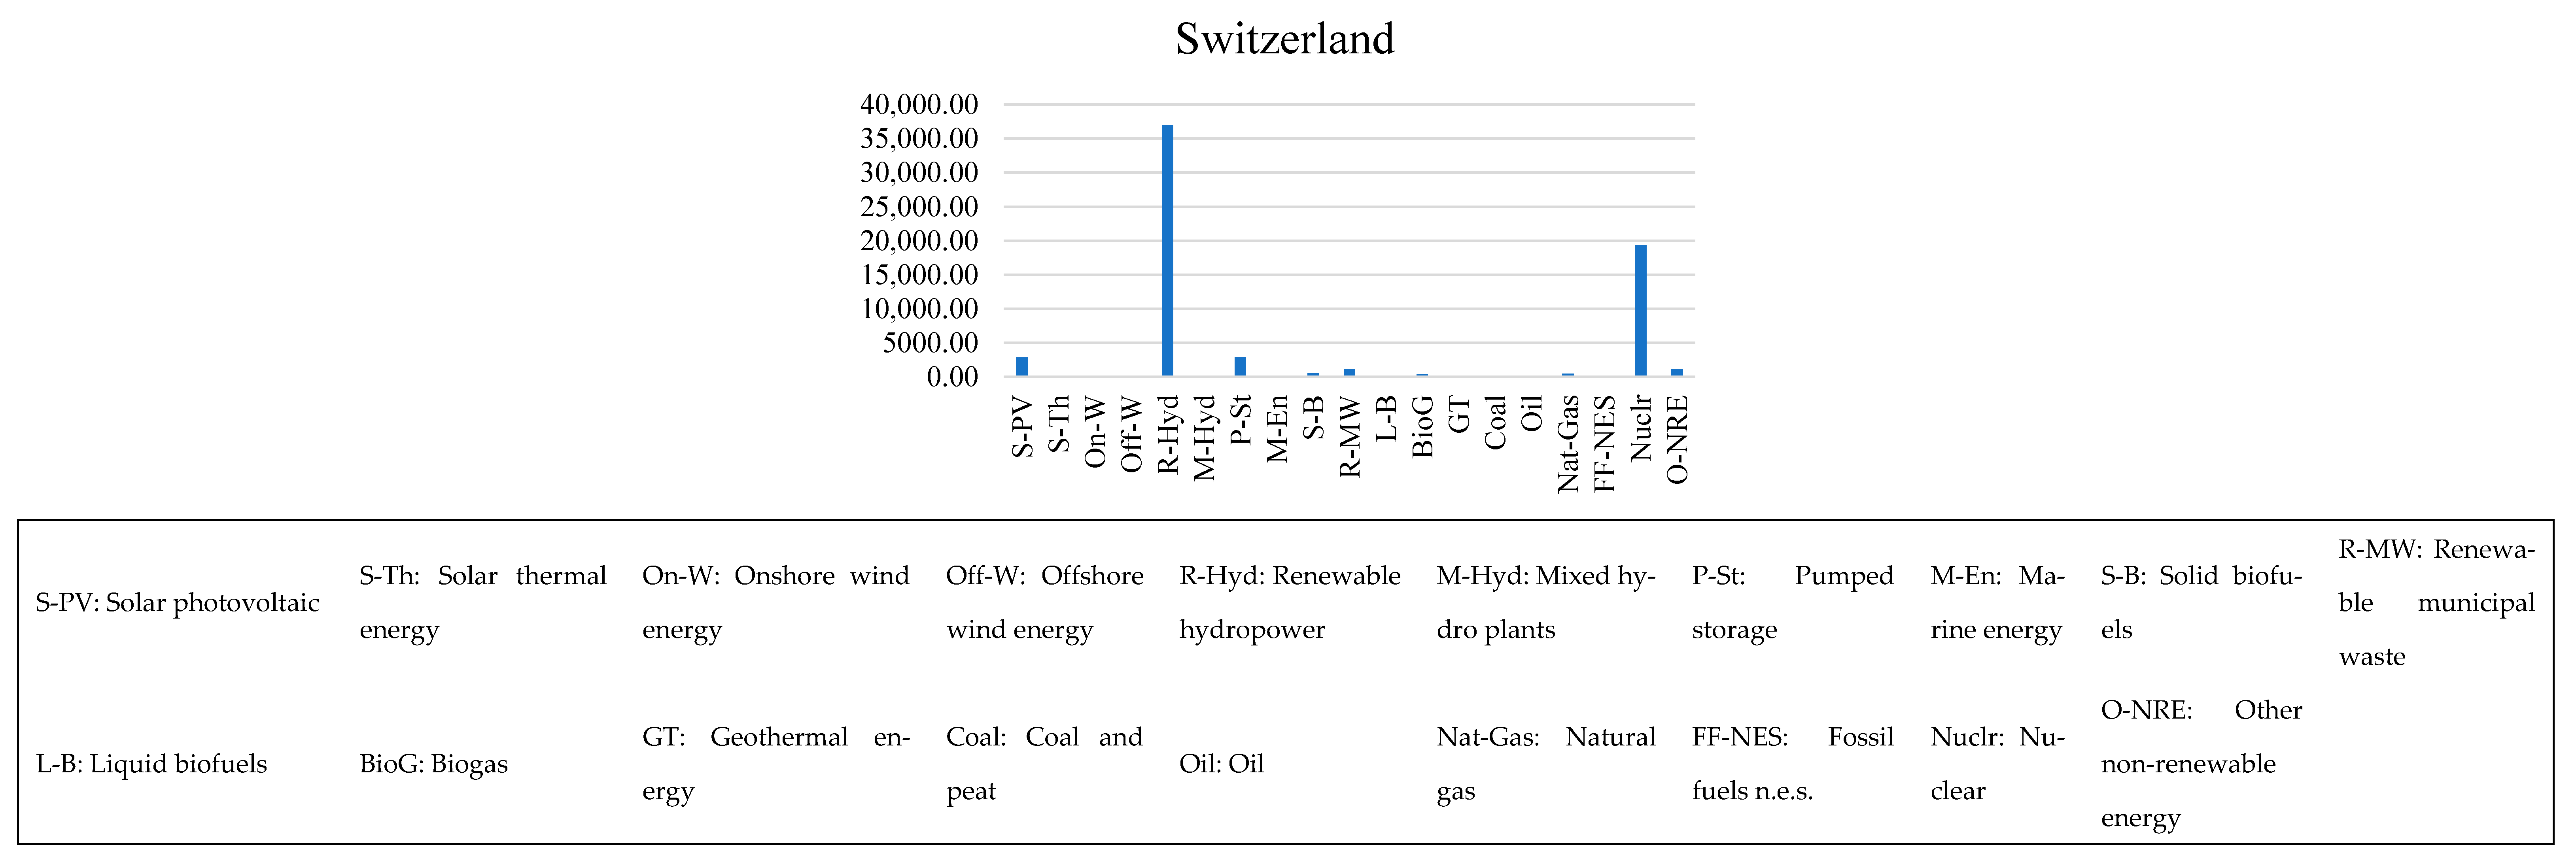
For this paper, the wholesale day-ahead electricity price data for 29 countries from the continent of Europe were sourced from the European Network of Transmission System Operators for Electricity (ENTSO-e); the dataset begins from 0000 h on 1 January 2015 and ends at 0000 h on 1 December 2023 [37]. Installed capacity data (Table 2) were sourced from the International Renewable Energy Agency (IRENA-2022) [39], which includes both on-grid and off-grid capacities. IRENA maintains a comprehensive annual power-information database on 224 countries/territories with the capacity and generation data on 19 different technology categories and their respective grid mode (on/off), starting from 2000 until 2022; the technology categories cover the major fossil-fuel sources, nuclear, and renewable sources such as solar, wind, biogas, and hydropower, among others. The electricity generation and consumption data in Table 2 were sourced from ENTSO-e [40]. Table 2 provides this information on the markets considered in this study. Using IRENA data [39], graphs of each country’s on-grid electricity generation mix are illustrated in Figure 8; these charts naturally capture information on power dispatch-order policies in vogue in the countries considered in this study. Power dispatch order policies are relevant since they are a major factor in determining the country risk for the locational decision under consideration in this paper.
The information presented in Table 2 and Figure 8 demonstrate the large variation of characteristics across the markets considered. Despite the global policy push, some of the considered markets are still heavily concentrated in non-renewable technologies (see Table 2) for their electrical energy needs such as Bulgaria (85.97%), Czechia (87.48%), Hungary (84.08%), the Netherlands (85.61%), and Poland (80.82%). This would be a red flag for any investor, since the adoption of the United Nations’ “2030 Agenda for Sustainable Development” [41] by all of the countries in the dataset requires a commitment of the transition to cleaner and sustainable forms of energy. Such a transition requires large scale legislative developments, capital deployments, and policy shifts from the private and public sector of any country; such a transition is a highly capital-intensive and slow process with results that are not guaranteed. Such markets will undergo massive changes to their energy infrastructure in order to meet their commitments across the global policy landscape, a fact that implies high levels of energy-sector instability over the foreseeable lifetime of a BESS-based venture. Investors tend to avoid taking on additional risks, and this information would be a significant factor in their country-risk calculations. In contrast, we have examples in our dataset from the other end of the spectrum with massive renewable penetration such as Norway (97.93%), Luxembourg (81.82%), Denmark (74.12%), Latvia (71.11%), and Austria (70.24%). Furthermore, the data show that the region of Europe is highly connected with cross-border electrical transmission lines and a massive trade of electrical energy [40]. This fact is demonstrated by the net-consumption column in Table 2, which shows that consumption levels are not the same as the generation levels. Net-consumption levels lower than generation levels are favorable for the investor since it demonstrates self-sufficiency. With countries having net-consumption levels lower than their generation, a higher net-consumption level is favorable, since it demonstrates a higher demand for BESS-EA venture participation in the market. Figure 7 also illustrates the capacity-concentration risk associated with each country’s electricity generation. For instance, Bulgaria and Czechia demonstrate a high dependence on coal and nuclear for their generation, which indicates a higher risk associated with these countries’ electricity supply-chain. Poland demonstrates a high dependence on coal as its major source of electricity. Similarly, Italy shows a high dependence on natural gas. Denmark, on the contrary, shows a relatively more balanced generation mix with on-shore wind, off-shore wind, and solid biofuels roughly contributing similar levels and aggregatively the major supply component. On the renewable front, hydropower has the highest penetration: Norway, Sweden, and Switzerland show a high concentration of its supply coming from renewable hydropower, which is a positive sign since it is renewable and therefore sustainable, and a relatively developed and mature technology in the renewable category itself due to its early adoption across the globe. Following the lead of hydropower, wind energy is the second most preferred source of energy in the renewable category, with Denmark, Ireland, Lithuania, Portugal, and Spain showing a major contribution of their respective supply coming from wind. Within the wind energy category, on-shore wind energy is the more prevalent segment.
Furthermore, economic and regulatory health data from multiple international agencies (such as The World Bank, International Monetary Fund, U.S. Energy Information Administration among others) were used in the analysis to make the country-selection analysis holistic. The fact remains that however lucrative a market may appear on all fronts, if metrics such as regulatory health are ignored in the locational decision analysis, the BESS-EA venture’s financial contracts may not be upheld by rogue market participants in the selected market and will result in massive losses for the investors if a legal recourse is not available, or is practically ineffective.

2.2. Methodology

Various tools and metrics were employed to analyze the publicly available data for each country in the dataset. Each tool and metric are defined in this section and subsequently, a comparative analysis will be conducted in the next section (Empirical Results). The EAF-score based ranking will also be defined in this section, which enabled the generation of numeric scores for the BESS-EA’s locational decision under consideration in this paper.

2.2.1. Three-Dimensional (3D) Surface Plot

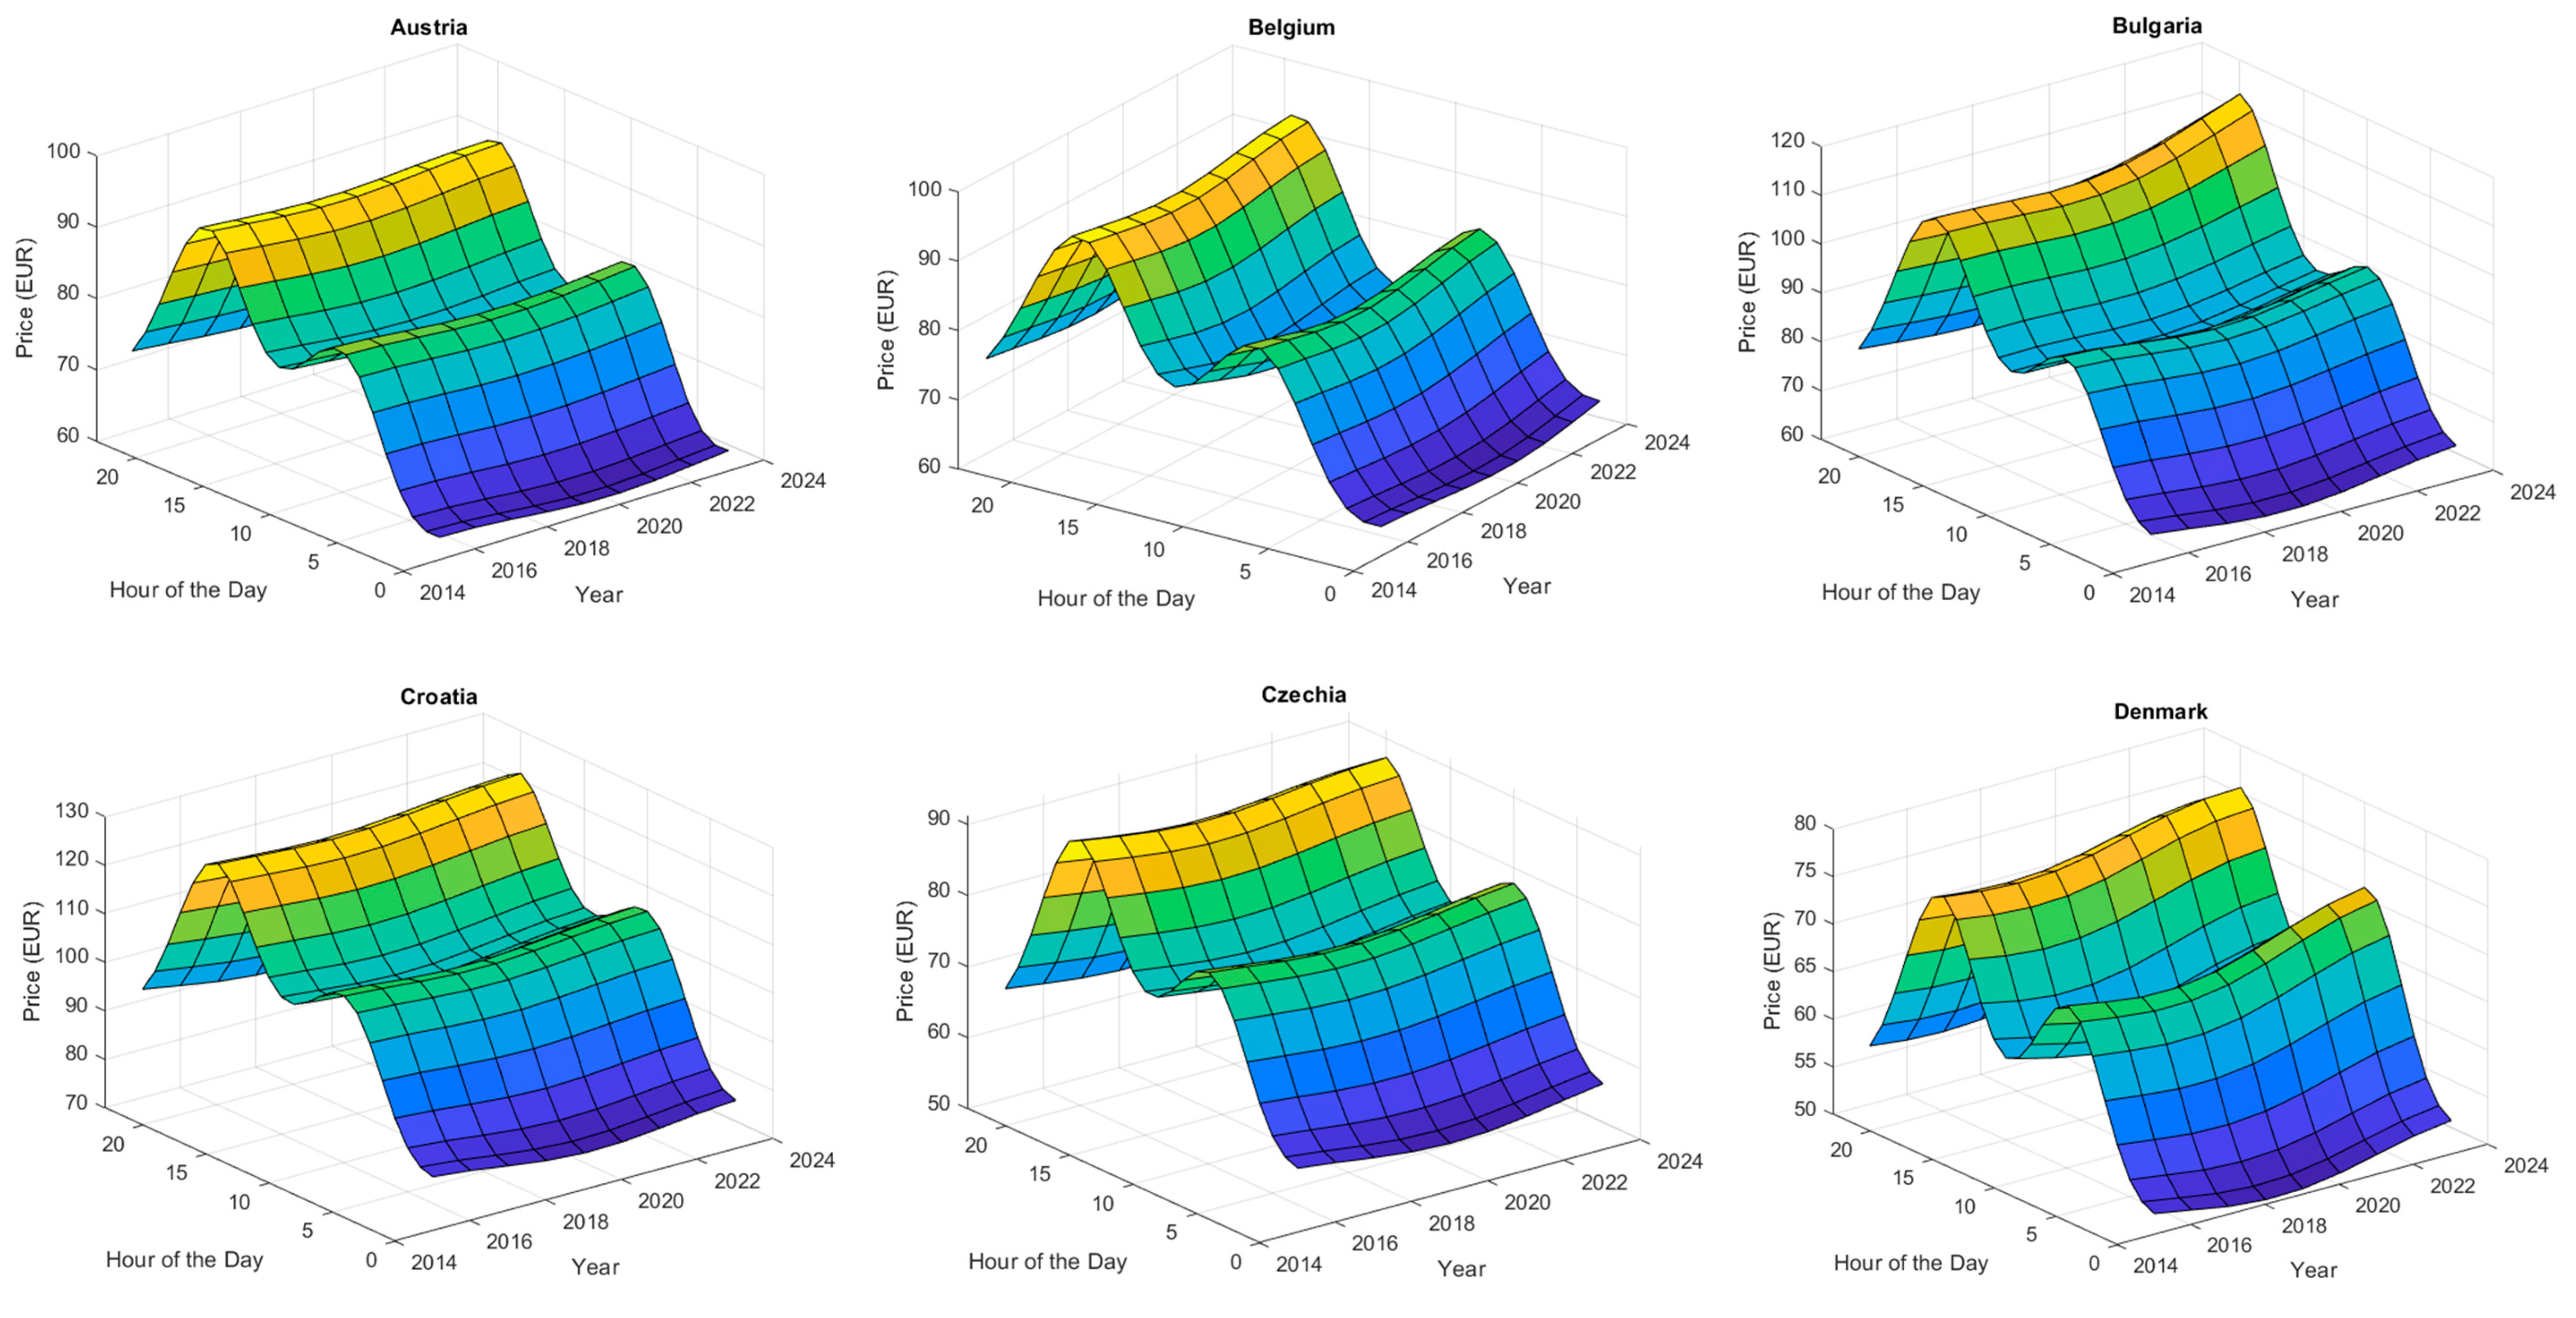
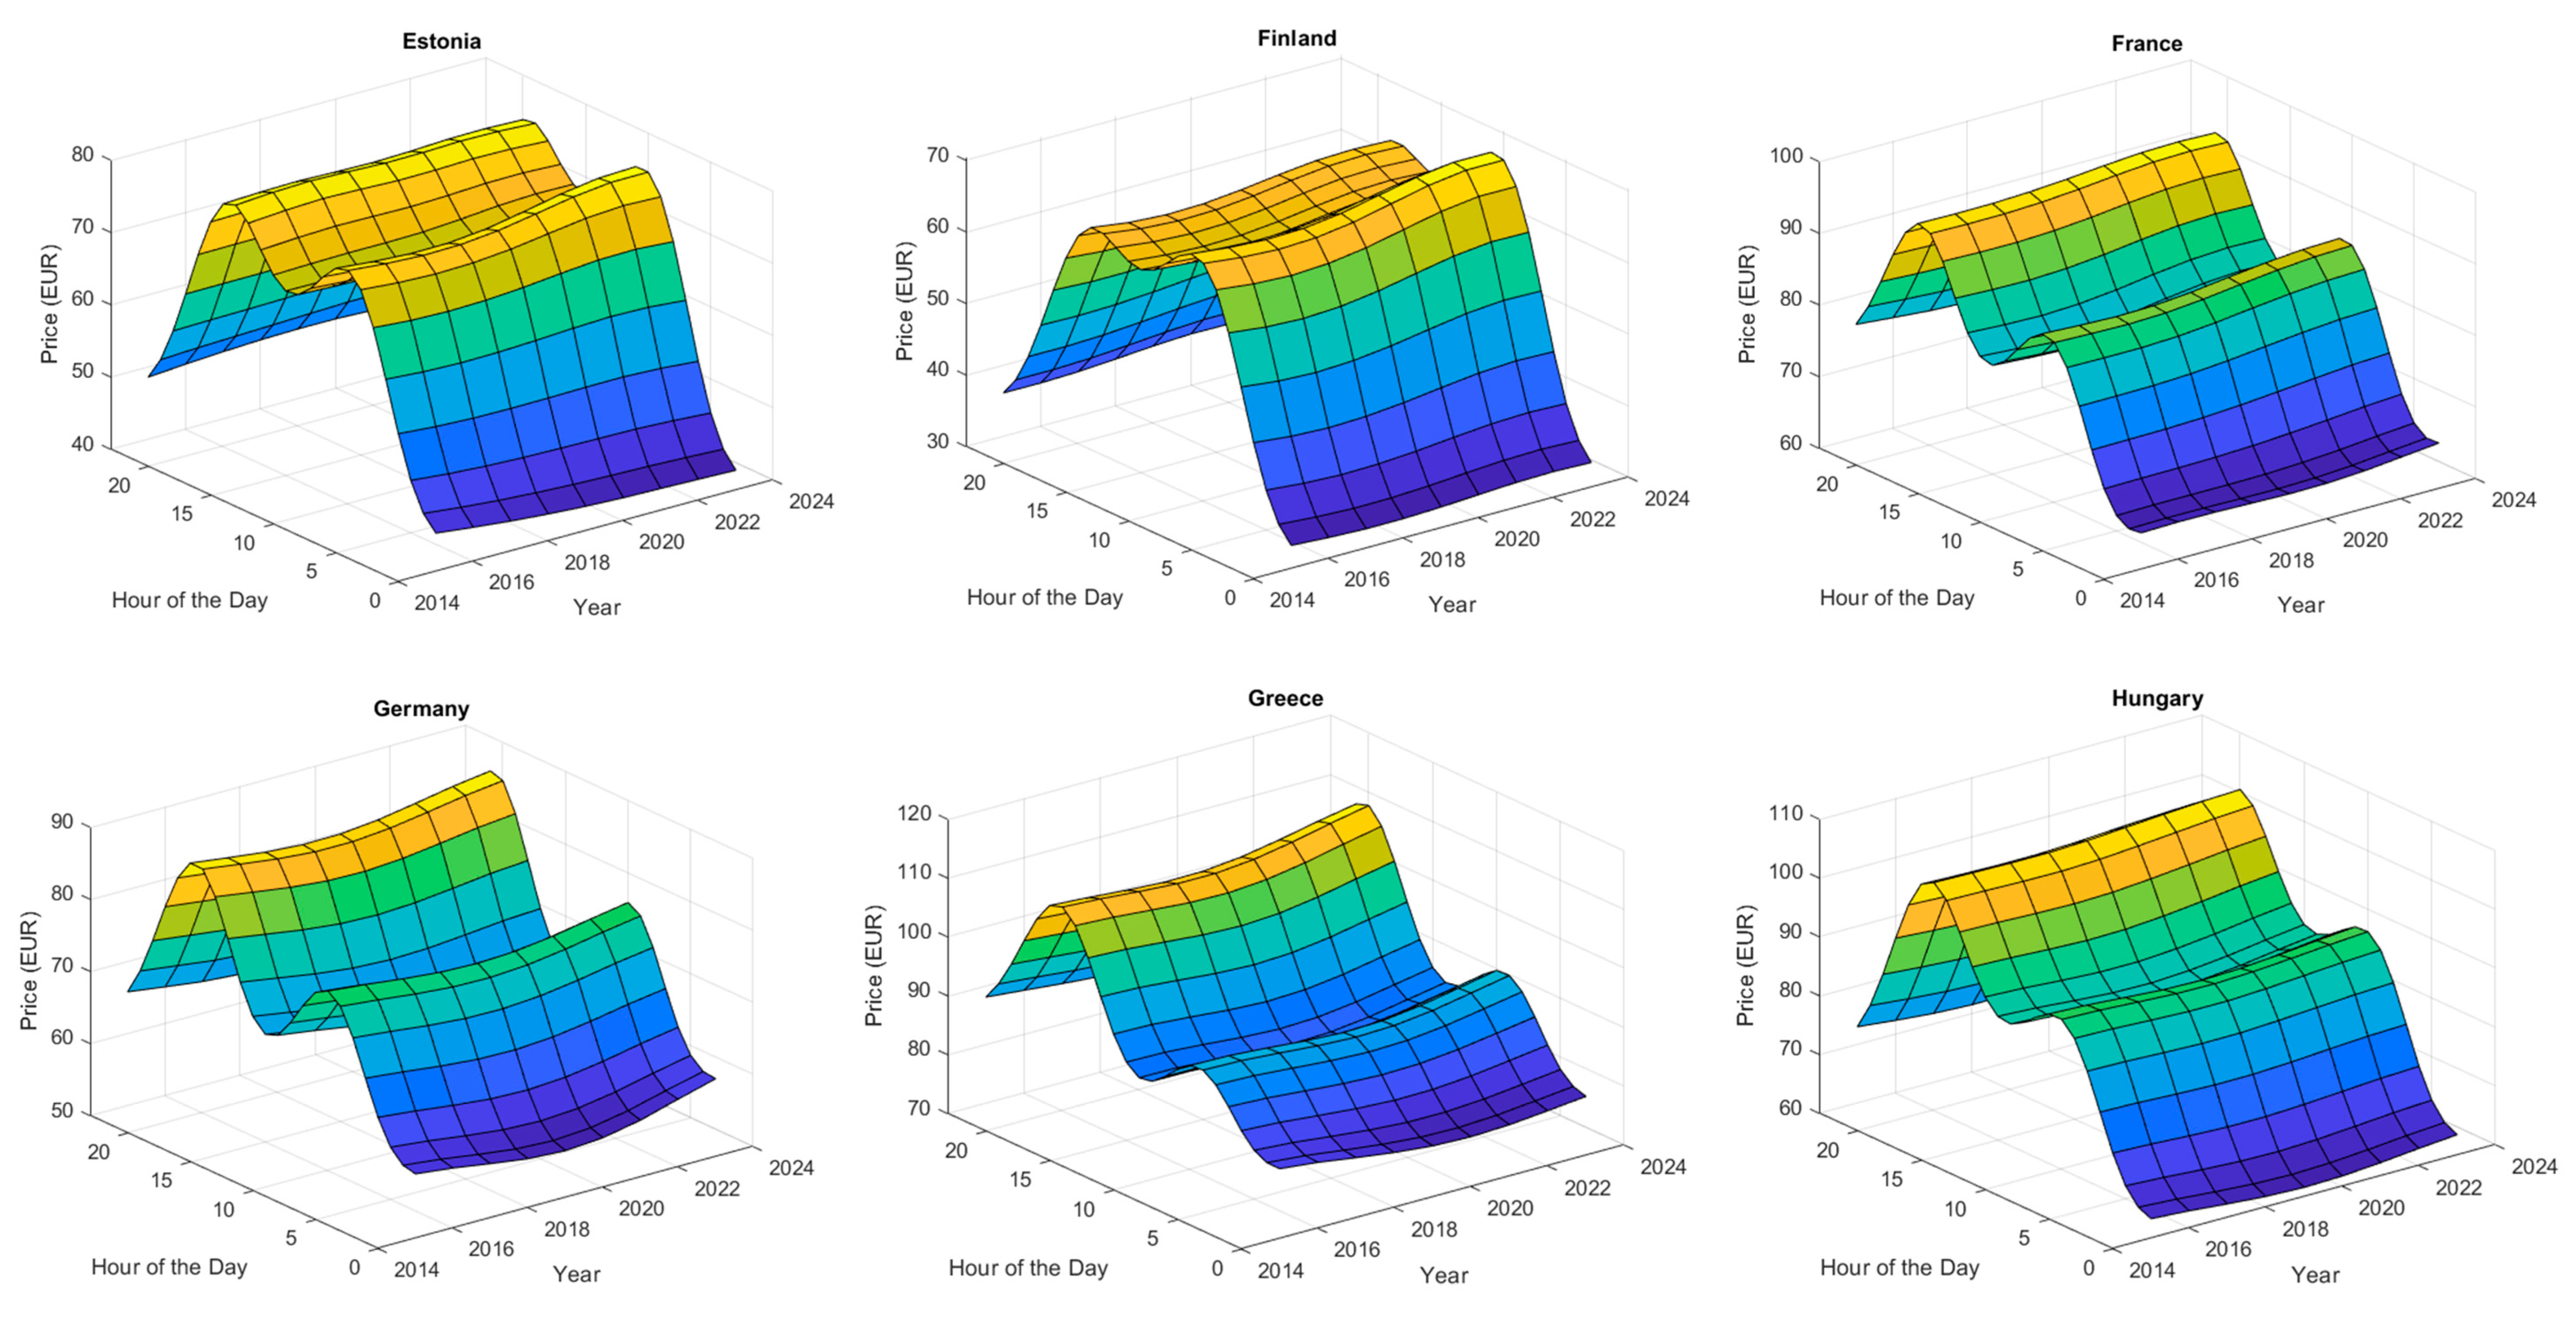
3D surface plots have been used for “price-action” analysis for decades. A 3D surface plot is a type of graph that displays data in three dimensions. It uses three axes with the x and y axes typically representing two independent variables, while the z-axis represents the dependent variable. In this paper, the x and y axes represent the “Year” and “Hour of Day” variables, respectively, while the z-axis represents the Price (Euro) variable. The color of the surface is a function of the z-axis value. For this analysis, electricity price fluctuations can be examined with relative ease due to the visually revealing nature of the surface plots. Pattern recognition is the most useful insight gained from the surface plot. Peaks and troughs in the plot indicate high and low electricity prices, helping to identify the trends followed by the data. If the data exhibit a certain trend, the plot can be employed for forecasting and aiding in the scheduling decisions of when to charge–discharge our BESS for optimal revenue from energy arbitrage operation. The highly visual nature of the surface plot simplifies the interpretation of complex datasets, which is why it has been deployed as a tool for analysis. In this study, we cleaned and pre-processed the hourly electricity price data [37] for each country and then used Algorithm-1 (as in the flowchart below) to generate surface plots for each of the 29 countries in the dataset in MATLAB R2024a.

2.2.2. Measure of Central Tendency: Mean Electricity Price

The mean electricity price is an important metric for consideration by investors when conducting the locational analysis for a BESS-based venture. The mean electricity price reflects the dynamics of the energy market in any country such as demand–supply trends, generation mix, and regulatory regime [42,43]; all these factors significantly impact the financial viability of any BESS-EA venture. The mean electricity price also affects the investment decision around battery-sizing for any BESS-EA venture, since studies have shown that a higher power capacity might be more profitable in markets with high electricity prices [44]. In essence, any cost–benefit analysis for investment in a BESS-EA venture will involve factoring in the mean electricity price offered by the market. Specifically, from Equation (1), the goal is to maximize “α”; which implies minimizing the negative terms in the equation. The variable Ct will have its average equal to the average electricity price faced by the BESS-EA venture since this variable represents the cost at which electricity is bought and stored in the BESS. A lower mean electricity price is better when comparing two countries, since the mean price represents the financial risk associated with each energy–arbitrage cycle. Ct was the hourly electricity price in our dataset since that is the cost of energy bought from the grid at any time over the operation horizon. It was assumed that our BESS-EA venture’s operation horizon was the same as the time duration covered by the dataset. The mean price can be formulated as:
C ¯ = t = 1 N C t N ,
where:
  • C ¯ represents the average electricity price over the time period considered;
  • C t is the electricity price at time step t;
  • N is the total number of time steps over which the averaging is performed;
  • t is the index of the time step, ranging from 1 to N.

2.2.3. Hourly Electricity-Price Distribution Histogram

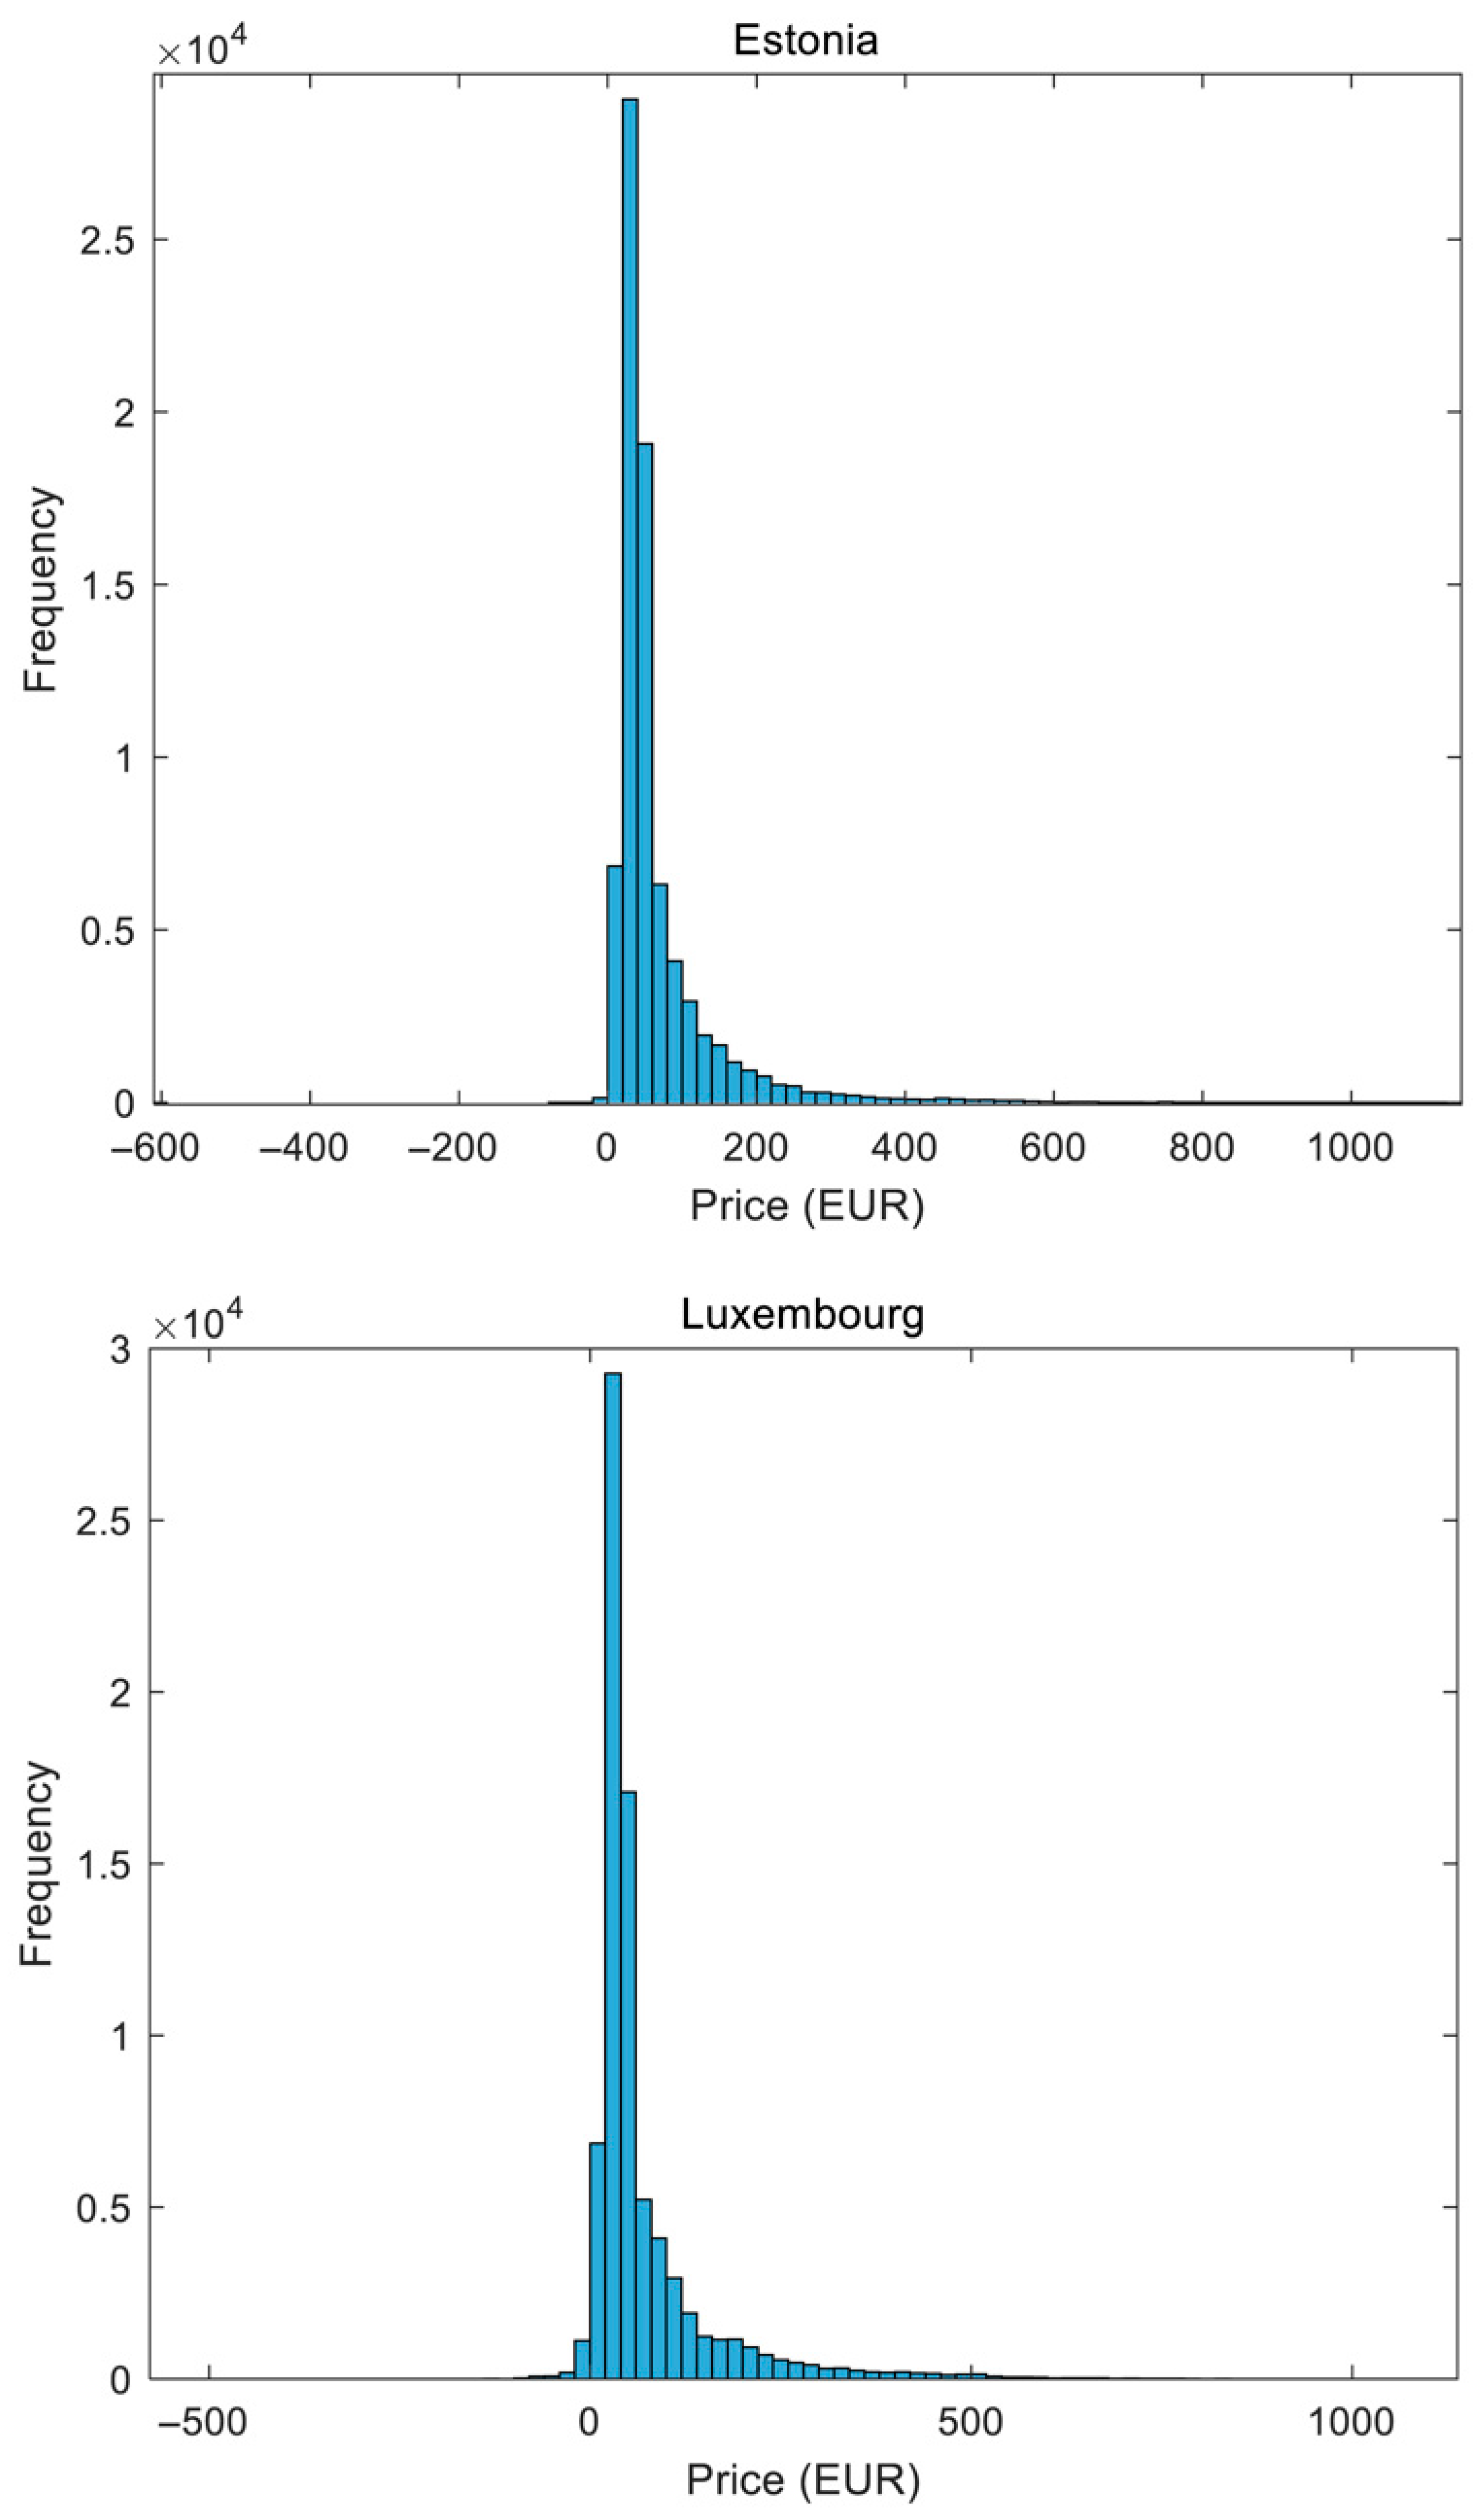
A price distribution histogram is a crucial visual tool for analyzing price distribution. Visual tools are preferred by investors when conducting comparative analysis due to the relative ease with which crucial insights can be gained such as potential profit margins and risk assessment. A histogram visually represents the frequency distribution of a dataset; in this study, the hourly electricity prices. Analyzing such a plot for any country’s dataset will allow a quick first-glance comprehension of the price volatility, mean, skewness, kurtosis, and peak price level. The spread and skewness of the histogram bars reflect the degree of price fluctuations. A wider spread with a long tail toward higher prices suggests a volatile market with the potential for high gains but also significant risks. Conversely, a narrow spread with a concentrated peak around a moderate price range indicates a more stable market with lower potential returns but also reduced risk. The histogram also offers insight into the mode of energy arbitrage operation to be deployed across countries for profitability. In a volatile market (with high spread and fat tails), rapid charging–discharging using high-powered equipment would be essential to capture the desired price spikes. However, in a relatively stable market, longer and low-powered charging modes will be preferred to reduce the cost of operation. Battery-SOH degradation and BESS-CAPEX are a function of the scheduling strategy that will be deployed throughout the operation horizon. The histogram allows insights into the mode of operation that will need to be deployed in a country for revenue maximization.

2.2.4. Measure of Dispersion: Hourly Price Standard Deviation

The statistical measure of standard deviation quantifies the level of dispersion or variation exhibited by any dataset. In this study, the hourly price movement data for each country, when observed under the lens of standard deviation, allows for the measurement of price volatility. A higher standard deviation is desirable since it shows that the hourly price data are spread out, and moves in a wider range around the mean. A relatively higher standard deviation shows that the BESS-EA venture will experience more opportunities to conduct profitable arbitrage decisions, given that the appropriate risk management strategies are in place. A lower standard deviation of any country’s electricity price data shows that the price movement is relatively closer to the mean price. Although a lower standard deviation shows that the prices are more stable, it discourages the profitable BESS-EA operations necessary to justify the high CAPEX of such a venture. With countries exhibiting similar mean electricity prices, for instance, the investor would do well to choose a country whose data has a comparatively higher standard deviation since this ensures that the BESS-EA venture will face relatively more opportunities to buy low and sell high. It was assumed that the countries’ rate of change of volatility over the future was the same over the operation horizon of the BESS-EA venture to simplify the analysis. Mathematically, the standard deviation in this study was formulated as follows.
σ h o u r l y = t = 1 N C t C ¯ 2 N ,
where:
  • σ hourly is the standard deviation of hourly electricity prices;
  • C t is the electricity price at time step t;
  • C ¯ is the mean electricity price over the entire period of dataset;
  • N is the total hours covered in the hourly price dataset of each country.

2.2.5. Measure of Dispersion: Average Daily Price Range

The average daily range of hourly electricity prices is another measure of dispersion deployed for assessing the viability of a BESS-EA venture since most charge–discharge cycles will be completed within 24 h. It is a metric that will allow the investor to measure the best possible outcome associated with each market’s electricity price movements. When comparing countries, a higher value of this metric is desirable, since this implies that there is a larger difference in the daily minimum and daily maximum price, on average, across all days in the dataset (from 1 January 2015 until 1 December 2023). BESS-EA ventures are designed to capitalize on price differences, and the average daily range figure will provide insight into the best outcome offered by each market in terms of revenue potential. This metric will play a crucial role in the potential return on investment (ROI) calculations of any investor and therefore used to justify the high CAPEX associated with this venture at the outset. Similarly, for risk-averse investors, a relatively larger value of this metric will be a signal that the BESS-EA venture will have flexibility in managing risks (e.g., if the prices do not rise as anticipated after purchasing electricity from the grid, the BESS can hold onto it until a better selling opportunity arises). Mathematically, the average daily price range in this paper was formulated as follows.
Δ d = max C t d ,   C t + 1 d , , C t + 23 d m i n C t d ,   C t + 1 d , , C t + 23 d ,
where:
  • Δ d is the daily range of electricity prices on day d, representing the spread between the highest and lowest hourly prices within a 24-h period;
  • C t d ,   C t + 1 d , , C t + 23 d are the hourly electricity prices offered by the grid on day d, starting from hour t through hour t + 23. These are drawn from the dataset where each Ct corresponds to a specific hourly price;
  • max( C t d ,   C t + 1 d , , C t + 23 d ) represents the maximum electricity price observed within the 24-h window of day d;
  • min( C t d ,   C t + 1 d , , C t + 23 d ) represents the minimum electricity price observed within the 24-h window of day d.
Δ ¯ = d = 1 D Δ d D ,
where:
  • Δ ¯ is the average daily range of electricity prices over the full dataset, providing a measure of the typical intra-day price spread across all days;
  • Δ d is the daily range of electricity prices for day d, defined as the difference between the maximum and minimum hourly prices within that day;
  • D is the total number of days covered in the hourly electricity price dataset for a given country;
  • d = 1 D Δ d is the cumulative daily price range summed over all days d = 1 to D.

2.2.6. Measure of Asymmetry: Skewness of Hourly Price Distribution

The skewness of hourly electricity prices in a country’s electricity market is an important factor in considering the suitability of the market for setting up a BESS-EA venture. BESS-EA ventures are designed to capitalize on price differences, with a “buy low and sell high” strategy. The skewness of the price data distribution of each country is a measure of the distribution’s asymmetry. The skewness of a country’s hourly electricity price distribution gives the investor important (and quantified) insights for conducting the cross-country comparative analysis under consideration. High absolute skewness indicates higher price volatility, which effectively implies more opportunities for energy arbitrage. A highly skewed price data distribution indicates that there are significant differences between peak and off-peak prices in a country’s dataset. In this comparative analysis between countries, higher skewness was viewed as favorable for our BESS-EA venture [43]. It is assumed that appropriate risk-management tools have been deployed to mitigate downside risk such as advanced price-forecasting tools, which have progressively been coming closer to perfectly predicting the price at each hour of the day in many markets (according to recent studies using machine learning techniques) [45,46]. An insight to be gained from skewness is that a highly skewed price distribution will make it easier to build the scheduling strategy by the BESS-EA owner. In the case of this paper, regardless of whether the distribution had a positive or negative skew, a higher absolute skewness is favorable because of the insights it provides for the arbitrage-scheduling operation of the BESS-EA venture. Positive skewness indicates that the tail on the right side of the distribution is longer than the left side. In the context of electricity prices, this means that there are occasional periods of very high prices. For energy arbitrage, this could be beneficial as the BESS could discharge during these periods of very high prices, potentially leading to significant profits. In the case of a negatively skewed price distribution, the tail on the left side of the distribution is longer than the right side. This indicates that there are periods of very low, or even negative, electricity prices. These periods could provide opportunities for the BESS to charge at a very low cost. Asset prices tend to return to their long-run mean value across the entire dataset; a phenomenon that is popularly referred to in financial theory as mean-reversion [47]. A highly skewed distribution has tails farther away from the mean value, which is a signal for the BESS-EA operation scheduler to conduct charge–discharge decisions with relative ease whenever the prices tend to stray too far from the mean; in other words, a highly skewed distribution implies that the prices tend to stray farther away from the mean price than a normal distribution, allowing for easier BESS-EA operation scheduling when the prices are in those long tails away from the mean price. Mathematically, skewness in this study was formulated as follows.
Ϩ = t = 1 N C t C ¯ 3 N 1 × ( σ h o u r l y ) 3 ,
where:
  • Ϩ is the skewness of the hourly electricity price distribution for a country, measuring the asymmetry of the price distribution around its mean;
  • C t is the hourly electricity price offered by the grid at time-index t;
  • C ¯ is the mean electricity price over the entire observation horizon;
  • σ hourly is the standard deviation of hourly electricity prices, capturing the spread of the price distribution;
  • N is the total number of hourly observations in the electricity price dataset;
  • t = 1 N C t C ¯ 3 is the third central moment, which evaluates the tendency of the distribution to deviate to the left (negative skew) or right (positive skew) of the mean;
  • N 1 is used as the Bessel correction to ensure an unbiased estimate in sample statistics.

2.2.7. Measure of Asymmetry: Kurtosis of Hourly Price Distribution

Kurtosis of a country’s electricity price distribution is another measure of its asymmetry. While skewness measures the degree of asymmetry in a distribution, kurtosis assesses the thickness of the tails and indicates whether they are heavier or lighter than those of a normal distribution. Positive kurtosis suggests heavier tails, while negative kurtosis suggests lighter tails than normal distribution. In the case of this paper, higher relative kurtosis, when conducting cross-country comparative analysis, is better, since this indicates that a higher frequency of prices is at the extreme end of the distribution. The extreme ends of the distribution are the points along the distribution where most charge–discharge decisions of the BESS-EA venture will be executed, since the tails represent the highs and lows of the price range. If the price distribution kurtosis of one country is higher than that of another country, it indicates that the country with the higher kurtosis will offer more opportunities for scheduling profitable energy arbitrage operations, since its electricity prices exhibit a higher frequency at the tail ends of the distribution where the prices are either extremely lower or extremely higher than the mean price. Mathematically, kurtosis in this study was formulated as follows.
Ж = t = 1 N C t C ¯ 4 N 1 × ( σ h o u r l y ) 4 3 ,
where:
  • Ж is kurtosis of the hourly electricity price distribution, measuring the “tailedness” or extremity of price fluctuations relative to a normal distribution;
  • C t is the hourly electricity price offered by the grid at time-index t;
  • C ¯ is the mean electricity price over the entire observation horizon;
  • σ hourly is the standard deviation of hourly electricity prices;
  • N is the total number of hourly observations in the electricity price dataset;
  • t = 1 N C t C ¯ 4 is the fourth central moment, quantifying the weight of extreme deviations in the price distribution;
  • N 1 is used as the Bessel correction to ensure an unbiased estimate in sample statistics.

2.2.8. Electricity Supply-Origin Risk (ESOR)

The ESOR was designed and included in this study to provide the analysis in this paper with a grounding in sustainability and compliance with the global policy push toward renewable energy integration. This metric uses the percentage of non-renewable electricity generation in a country to assess the risk associated with setting up a BESS-EA venture. A high dependence on non-renewable sources for electricity generation indicates a country’s heavy reliance on fossil fuels. This dependence poses a risk as these resources are finite, and their extraction and use contribute to environmental degradation and climate change. As part of global commitments, such as the Paris Agreement and the UN’s SDGs, countries are transitioning toward renewable sources. A country with a high percentage of non-renewable electricity generation is likely to undergo a significant transition, which could lead to instability in the electricity supply chain. The transition from non-renewable to renewable energy sources can be complex and disruptive, involving major infrastructure changes, policy shifts, and market adjustments. These changes can create uncertainty about the security of the electricity supply itself, which is a major risk to our BESS-EA venture. Furthermore, governments may introduce regulations to accelerate the transition to renewable energy such as carbon pricing or renewable portfolio standards. These regulations can significantly affect the viability of energy arbitrage. In addition, for reputation-sensitive investors, investing in a country with a high percentage of non-renewable electricity generation may be another risk to their source of capital itself. Stakeholders, including investors and customers, are increasingly valuing sustainability and may view such investments negatively, causing significant damage to business partnerships and the potential of the venture’s potential initial public offering (IPO) in the future. This metric will serve as a valuable tool for assessing the potential risks of setting up a BESS-EA venture in a particular country while conducting comparative analysis. For this analysis, we chose electricity generation data as opposed to capacity data to include the dispatch-order policy information captured by the generation data.
Furthermore, the introduction of the Carbon Border Adjustment Mechanism (CBAM) and RePowerEU Plan fundamentally heightens the policy uncertainty for non-renewable-heavy countries such as Poland and Bulgaria. These frameworks subject such economies to intensified regulatory scrutiny and rapidly evolving compliance requirements, increasing both the immediate cost of fossil-based electricity and the unpredictability of future price structures. Under CBAM, carbon-intensive industries face escalating penalties and additional market barriers, making the economics of fossil-based power progressively less certain year-to-year.
Meanwhile, the RePowerEU Plan accelerates the EU-wide adoption of renewables and interconnectivity, favoring regions already aligned with the union’s decarbonization agenda. For markets slow to diversify toward renewables, this means not only higher carbon-related price risks, but also potential isolation from the economic benefits and market harmonization enjoyed by their renewable-heavy neighbors. Policy volatility—manifest in fluctuating carbon costs, shifting incentives, and growing political momentum for stricter emissions controls—further disincentivizes long-term investment in BESS-enabled arbitrage projects in these non-RE intensive countries.
As a result, rational location preference, especially for risk-averse and forward-looking investors, increasingly gravitates toward markets with higher renewable energy adoption. These economies offer more stable, predictable regulatory regimes, lower exposure to abrupt policy shifts, and clearer pathways for sustainable returns, making them more attractive for arbitrage-based energy storage ventures amid ongoing policy evolution in the EU.
Mathematically, the ESOR in this study was formulated as follows.
Π = E . . E + E . . ,
where:
  • Π is the electricity supply-origin risk (ESOR) index, representing the proportion of a country’s electricity generation derived from non-renewable sources;
  • E . . is the non-renewable electricity generation by a country in a year;
  • E is the renewable electricity generation by a country in a year.

2.2.9. Measure of Economic Health: Gross Domestic Product per Capita (Purchasing Power Parity)

A holistic comparative analysis for the investment decision under consideration would require investors to take stock of the economic health of the country to invest in as well, along with the metrics described earlier. A hugely capital intensive such as a BESS-EA venture requires that it provides the ecosystem to flourish. Gross domestic product (GDP) is a metric that quantifies the health of the ecosystem. Among the economic health indicators, GDP is the most commonly used metric for measuring the health of any economy. When considering the multiple variants of the GDP calculation, the purchasing power parity (PPP) variant was chosen as the metric of choice for this study, especially when held in comparison with nominal GDP. This is because the PPP takes into account the relative price of goods and services in different countries, allowing for a more realistic comparison of economic output. Data for GDP per capita (PPP-current international $) were sourced from The World Bank [48] and are tabulated in Table 3.

2.2.10. Ideal Case Revenue (ICR)

This metric takes the range of prices exhibited by the dataset of each country every day and assumes that the BESS-EA perfectly schedules its charge–discharge decision of “buy low and sell high” at the minimum and maximum prices every single day for which data are available. The dataset spanned 1 January 2015 until 1 December 2023 for each of the 29 countries in this study. System design assumptions were made to calculate this metric. It was assumed that we had a battery of 1 MWhr capacity installed at the BESS-EA venture (hypothetically operating in every country in this study) that could fully charge (and discharge) within 1 h with 100% efficiency. We assumed that a BESS-EA venture with the aforementioned design assumptions started operating at the beginning of the hourly electricity price dataset at each country in this study, and closed operations at the end of the dataset. The system design assumptions included executing no more than a single charge–discharge cycle each day during the operation period. The daily range of prices exhibited by each country’s dataset effectively becomes the daily revenue collected by the BESS-EA venture when these system design assumptions are made. This daily revenue was added throughout the dataset to give us the BESS-EA revenue for the ideal case when charge–discharge decisions were made perfectly at the minimum and maximum price levels every day across the dataset. The final sum was our ICR metric, calculated for each country to give the investor a sense of the size of the proverbial cake offered by each country (for every MWhr of capacity installed at the BESS-EA venture). In the realistic scenario, BESS-EA revenue will be a fraction of the ICR metric, and therefore the ICR provides insights into the maximum revenue potential offered by each country’s dataset.

2.2.11. Average Hourly Price Difference (AHPD)

This metric is calculated by taking the difference between every consecutive hour’s electricity price and averaging it across the dataset. A higher metric is better for our comparative analysis decision under consideration. A higher metric shows that there is a higher price difference, on average, between each hour’s price offered by the grid. This means that our BESS-EA venture will have the opportunity to sell the energy bought and stored from the grid at a higher frequency since the hourly prices vary significantly; the average hold-time of energy stored in the BESS (and therefore the risk) will decrease if the dataset for a country exhibits a higher AHPD.

2.2.12. Frequency Chart of “Hour-of-Day Minimum Daily Price” Recorded

This chart will help the BESS-EA venture investor gain a sense of when the electricity price offered by the grid goes to a minimum; electricity prices tend to follow a pattern based on the demand–supply patterns exhibited by each country. These patterns can be captured by using such frequency plots. The key insight to be gained is the predictability of the minimum daily hourly price; the smaller the range of the hours of day during which we see the minimum daily price recorded across the dataset, the higher the predictability of the BESS-EA venture’s charging decision. The charging decision represents the cost associated with the BESS-EA operation, and the more predictable it is, the better it is for our chances of profitability. In our comparative analysis, the country with a smaller window of the day’s hours when the minimum price is recorded most frequently across the dataset, is more desirable. This information is crucial for the BESS-EA operator to schedule the charging decision, which is the major expense and will affect the profitability and financial viability of the venture.

2.2.13. Measure of Legal, Regulatory, Business-Ecosystem, and Institutional Health: Index of Economic Freedom (IEF)

The Index of Economic Freedom (IEF) is an annual index system created in 1995 by The Heritage Foundation and The Wall Street Journal as a measure of the level of economic freedom in countries across the globe. It is a comprehensive measure for conducting a comparative assessment of the health of multiple economies. It focuses on four key aspects of the economic and entrepreneurial environment over which governments typically exercise policy control: rule of law, government size, regulatory efficiency, and market openness. The index measures 12 specific components of economic freedom, each of which is graded on a scale from 0 to 100 [49], where a higher number is better. Scores on these 12 components of economic freedom, which are calculated from several sub-variables, are equally weighted and averaged to produce an overall economic freedom score for each economy. The Index measures components such as property rights, freedom to trade, and freedom from government regulation. For example, the property rights component assesses the extent to which a country’s legal framework allows legal entities to acquire, hold, and utilize private property, secured by clear laws that the government enforces effectively. It provides a quantifiable measure of the degree to which a country’s laws protect private property rights and the extent to which those laws are respected. The Index provides insights into the regulatory efficiency, institutional quality, and overall business environment in different countries. This can help identify the countries that offer the most conducive environments for investing in setting up a BESS-EA venture. Data for the year 2023 were used in this study for conducting the locational analysis, as tabulated in Table 4 [50].

2.2.14. Energy Arbitrage Feasibility (EAF) Score

To create an EAF score, we assigned weights to each of the metrics based on their relative importance. The first step toward the score calculation is the normalization of each metric to a value between 0 and 1. We used min-max normalization, which was calculated as follows for each metric.
V a l u e N o r m = V a l u e V a l u e M i n V a l u e M a x V a l u e M i n .
After each metric’s values had been normalized using Equation (12), we assigned weights to each metric to calculate the EAF score. The weights were defined and constrained as per the formulation below.
0 w i 1 .
Equations (13) and (14) jointly define the constraints on the weights used in the calculation of the energy arbitrage feasibility (EAF) score in the paper. Each weight w i must be greater than or equal to zero.
i = 1 10 w i = 1 .
The weights ( w i ) are also subject to the sum constraint as defined in Equation (14). Weights w 1   t o   w 10 determine the relative influence of each factor (in scenarios as in Section EAF-Score Scenarios) in shaping the energy arbitrage feasibility score. Equations (12)–(14) will result in the EAF score for each country to be constrained and defined, respectively, by Equations (15) and (16) below.
1 E A F c o u n t r y 1 .
Lower values for E A F c o u n t r y signify a less desirable market, while higher values signify a relatively more desirable market for the BESS-EA locational decision under consideration.
E A F c o u n t r y = w 1 C ¯ N o r m + w 2 σ N o r m h o u r l y + w 3 Δ ¯ N o r m + w 4 Ϩ N o r m + w 5 Ж N o r m w 6 Π N o r m + w 7 G D P N o r m P P P + w 8 N o r m + w 9 A H P D N o r m + w 10 I E F N o r m ,
where:
  • Positive weights indicate variables that enhance the BESS-EA potential; negative weights indicate penalizing factors;
  • C ¯ N o r m is the normalized mean electricity price;
  • σ N o r m h o u r l y is the normalized standard deviation of hourly electricity prices;
  • Δ ¯ N o r m is the normalized average daily range of electricity prices;
  • Ϩ N o r m is the normalized skewness of the price distribution;
  • Ж N o r m is the normalized kurtosis of the price distribution;
  • Π N o r m is the normalized ESOR;
  • G D P N o r m P P P is the normalized GDP per capita at purchasing power parity;
  • N o r m is the normalized net-consumption in TWh of each country (2022);
  • A H P D N o r m is the normalized average hourly price difference exhibited by a country’s hourly price data;
  • I E F N o r m is the normalized Index of Economic Freedom of a country.

3. Empirical Results

In this section, the modality employed for generating scenarios for the comparative analysis of the 29 electricity markets is laid out and the results tabulated. The analytical tools described in the previous section ere applied to the datasets of each country, and the results tabulated. Multiple scenarios were considered to assign weights for the EAF score calculation. For instance, risk-averse investors would prefer a higher relative weight to be assigned to the mean electricity price experienced in their chosen market. Electricity origin-sensitive investors would, however, prefer a higher relative weight assigned to the variable quantifying ESOR for each country. Similarly, profit-sensitive investors would prefer a higher relative weight assigned to the volatility metrics. Using the same logic, investors with no prior experience in a country’s business environment would place a higher weight on the IEF and GDP metrics to ensure that the BESS-EA venture obtains the necessary ecosystem support requisite for new entrants to their electricity market; a more favorable regulatory environment will facilitate easier market entry and operation for energy storage ventures.
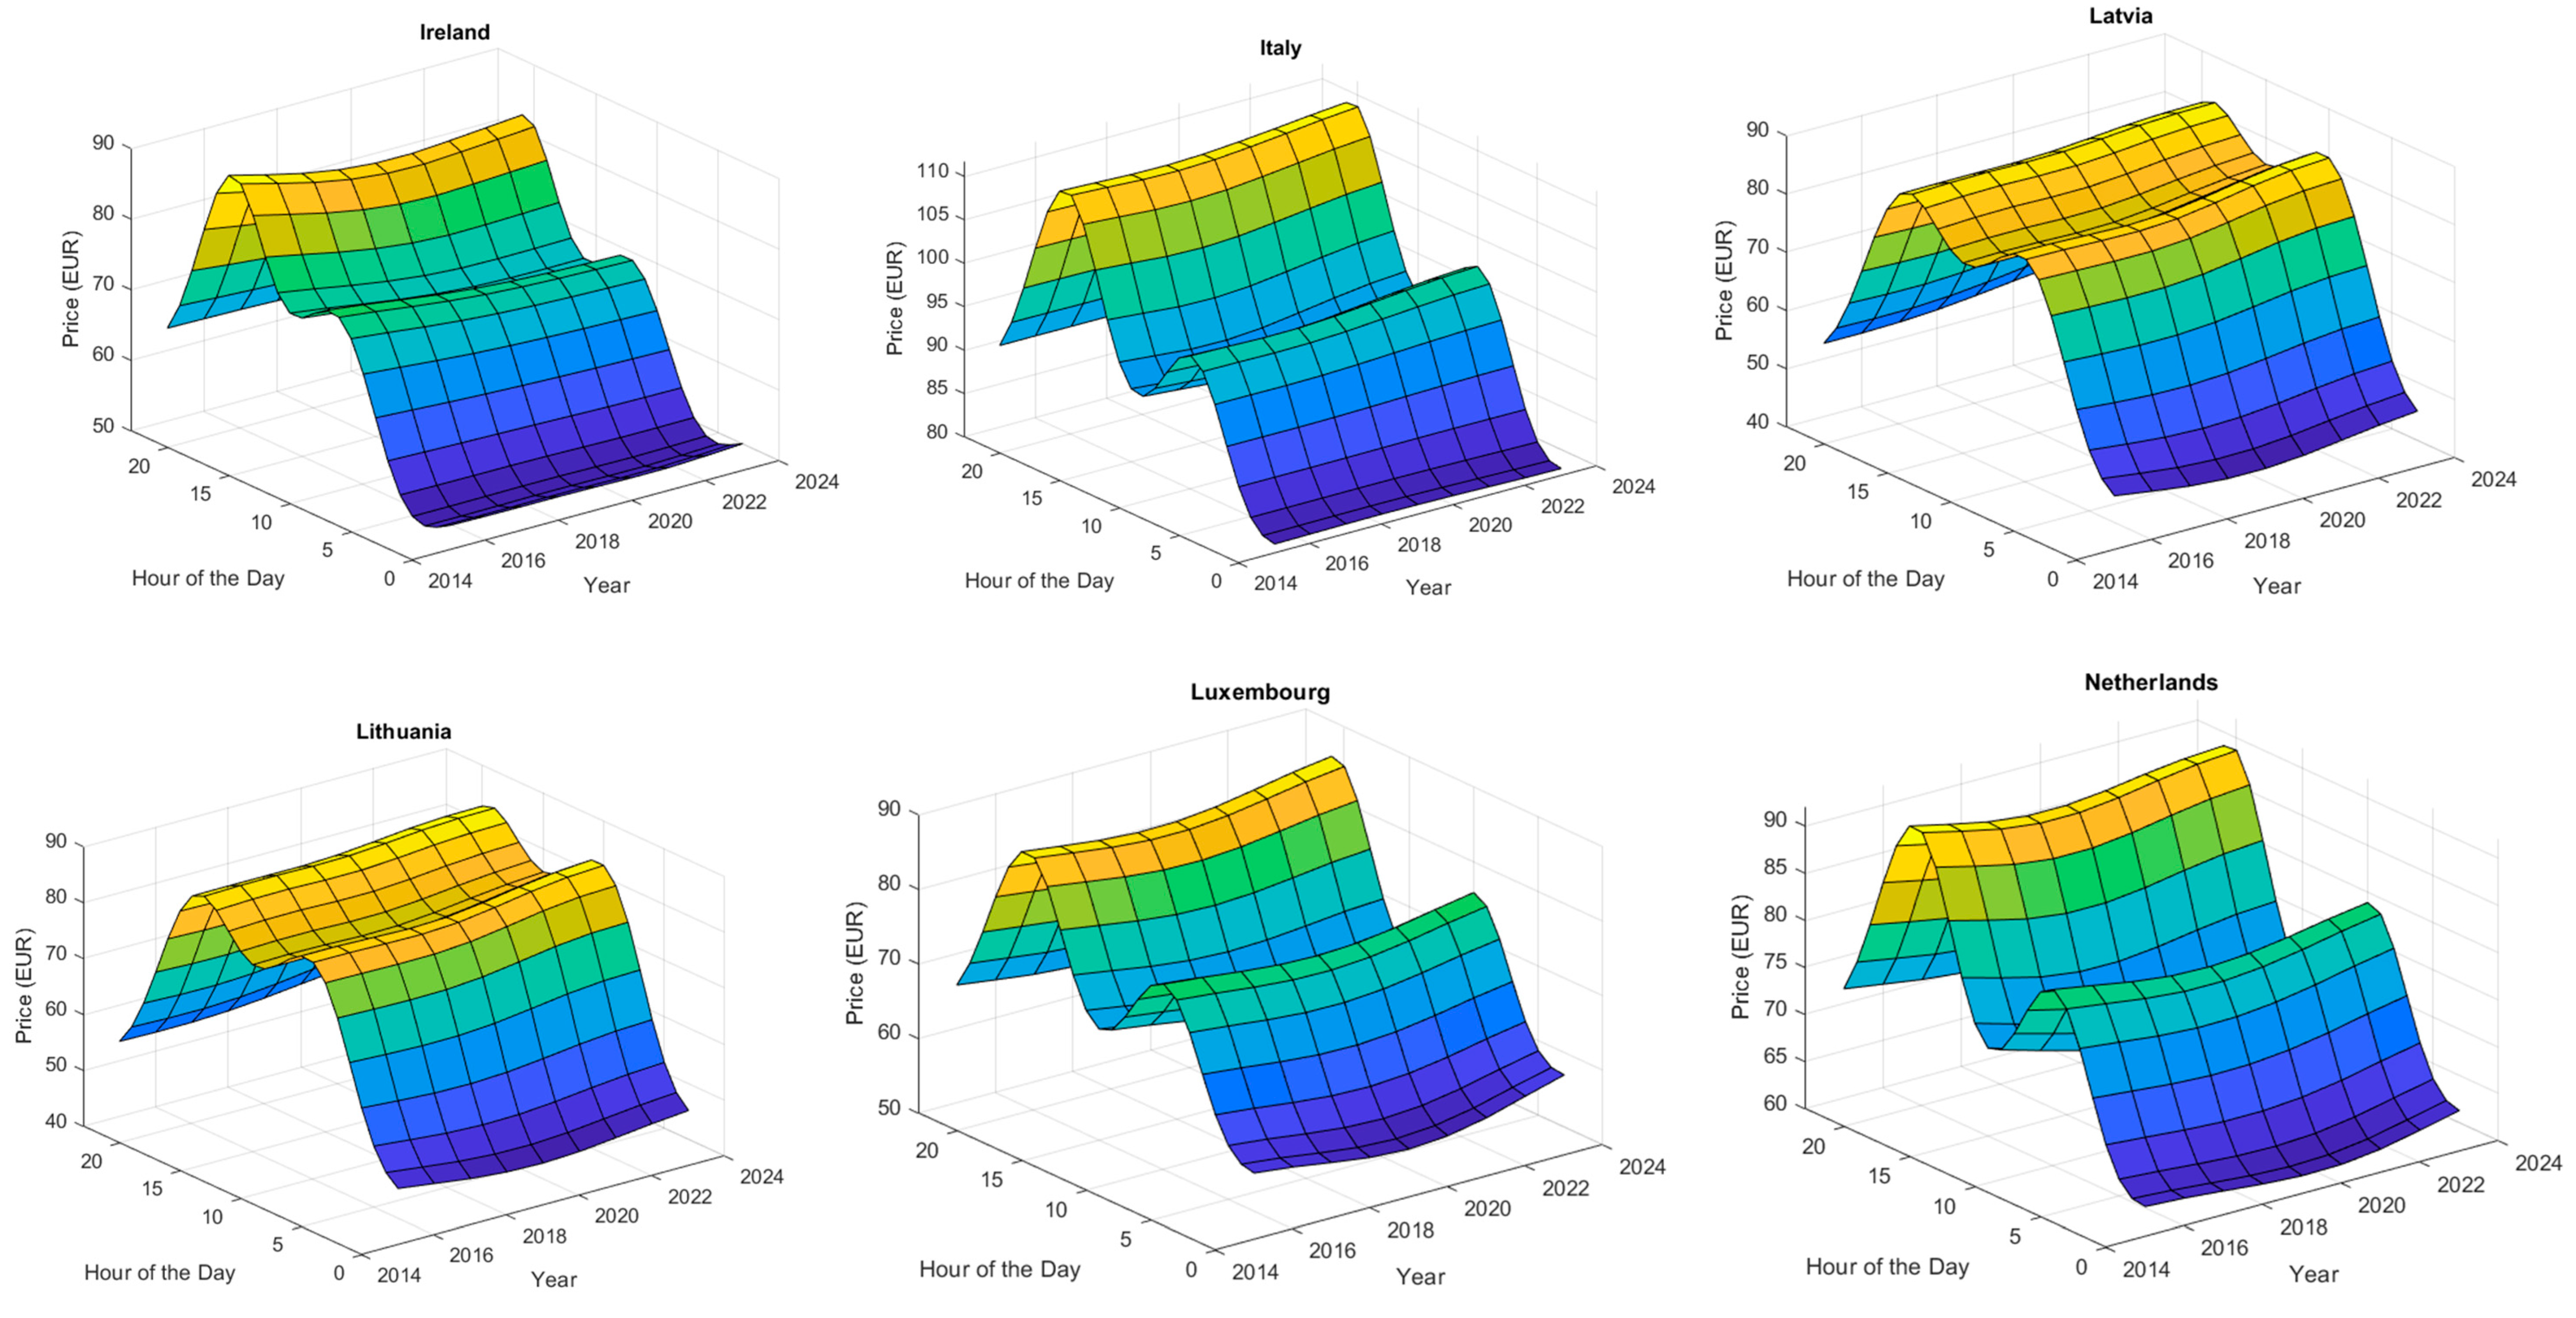
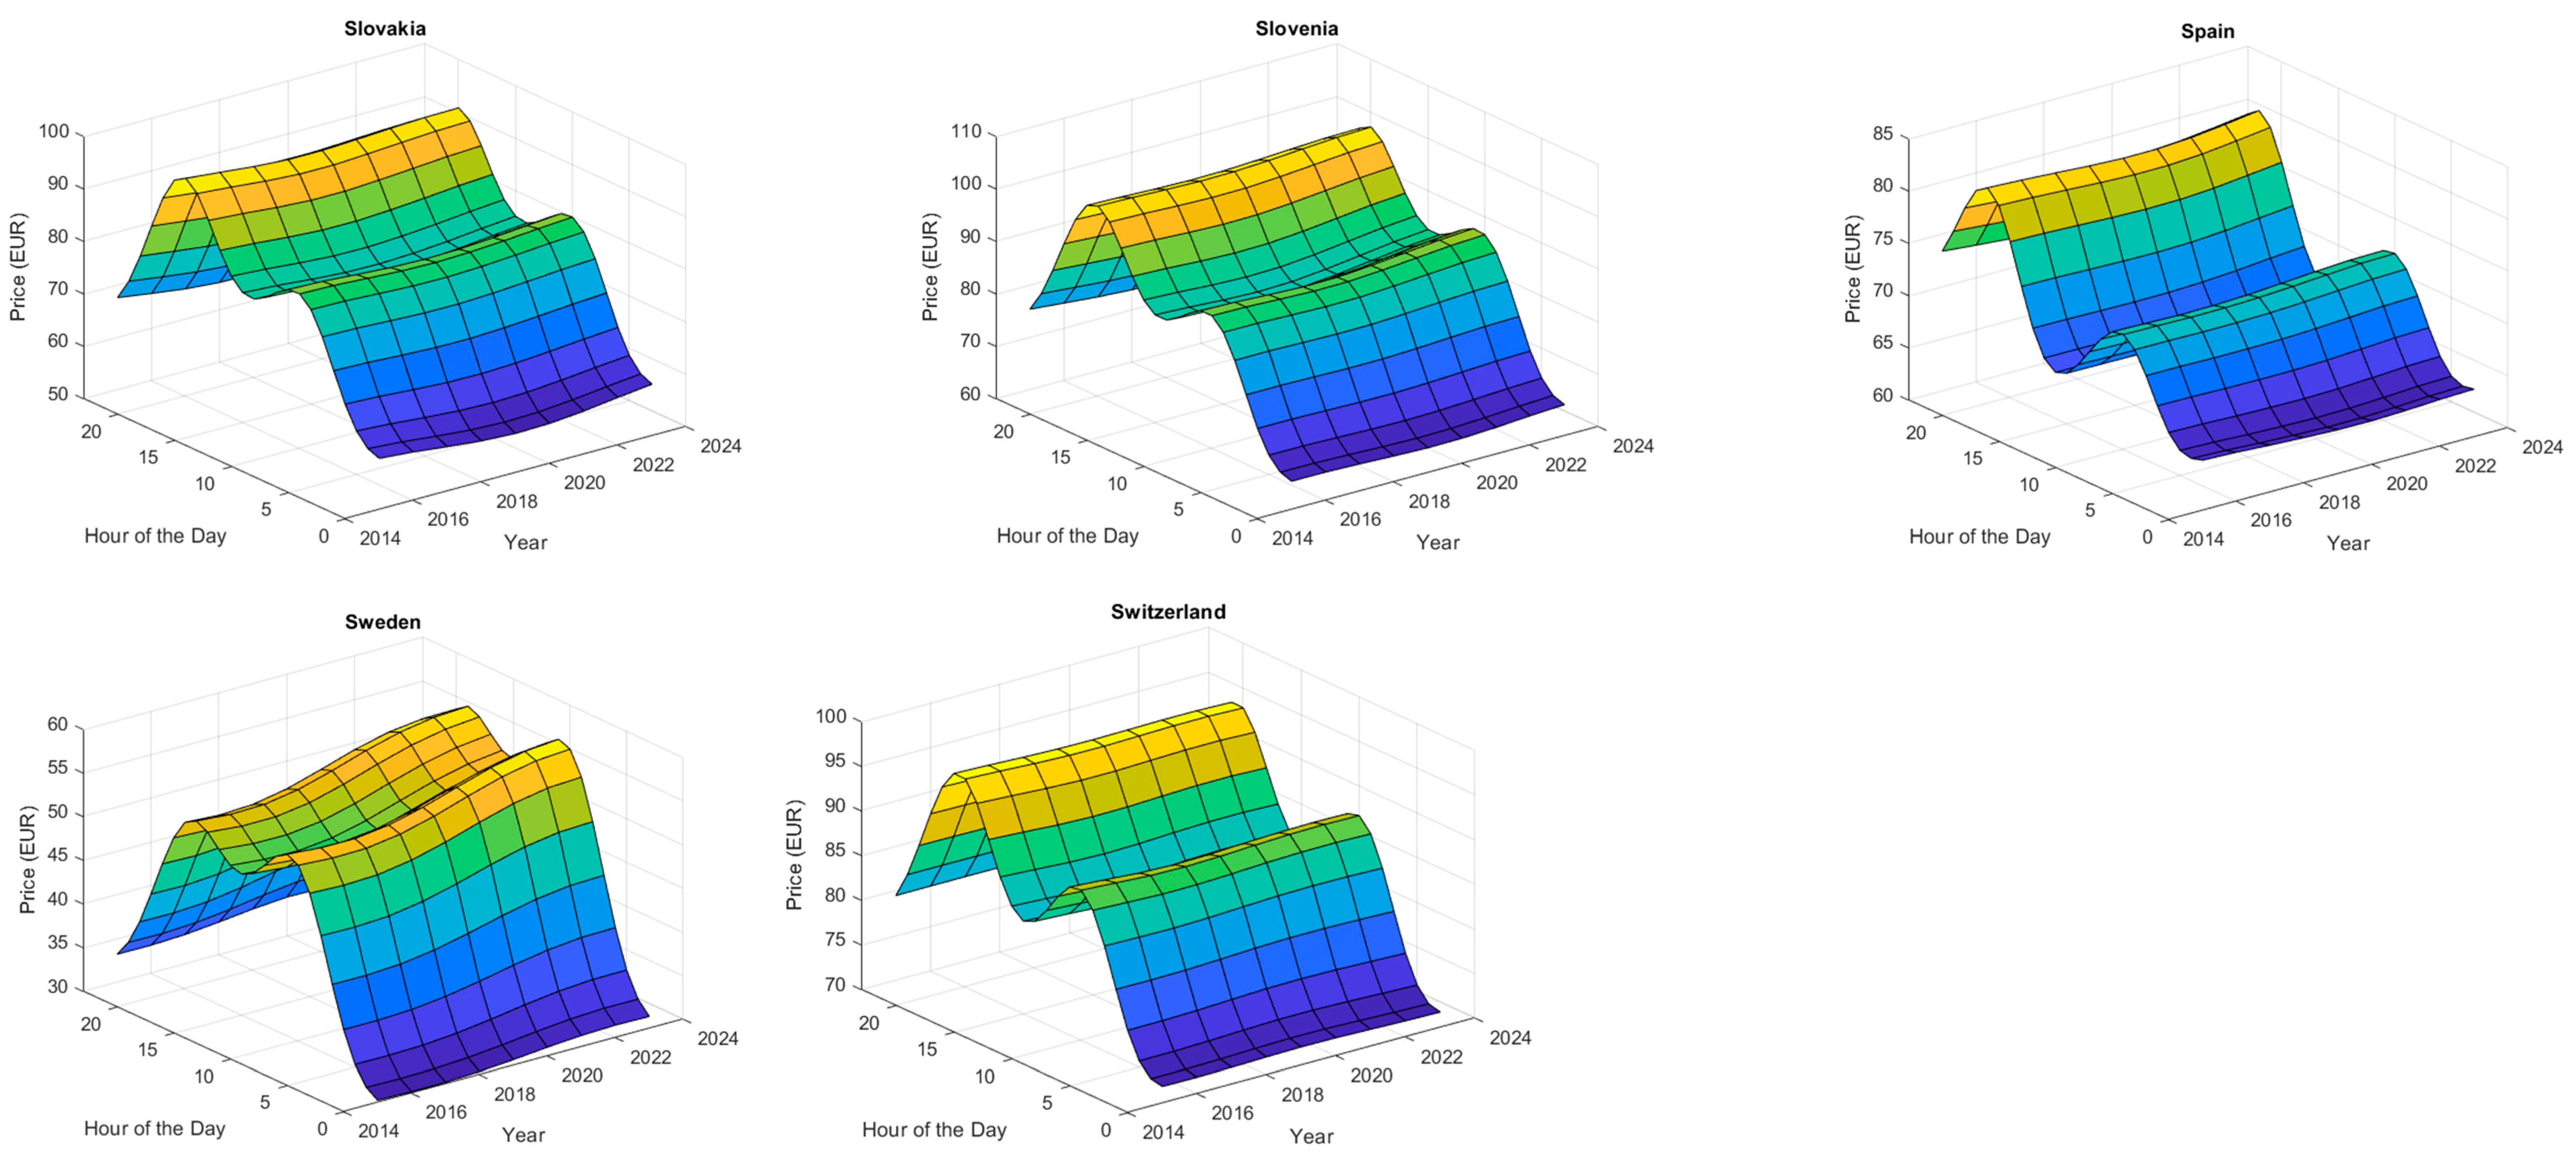
Analysis of the surface plots in Figure 9 helped evaluate the BESS-EA scheduling options offered by each market. This visual representation presents the trends and patterns followed by the electricity markets over the eight years considered in this paper. Volatility and seasonality information across every 24-h cycle were made visually available using this technique. Table 5 tabulates the results achieved by employing the metrics and formulations designed in this paper.
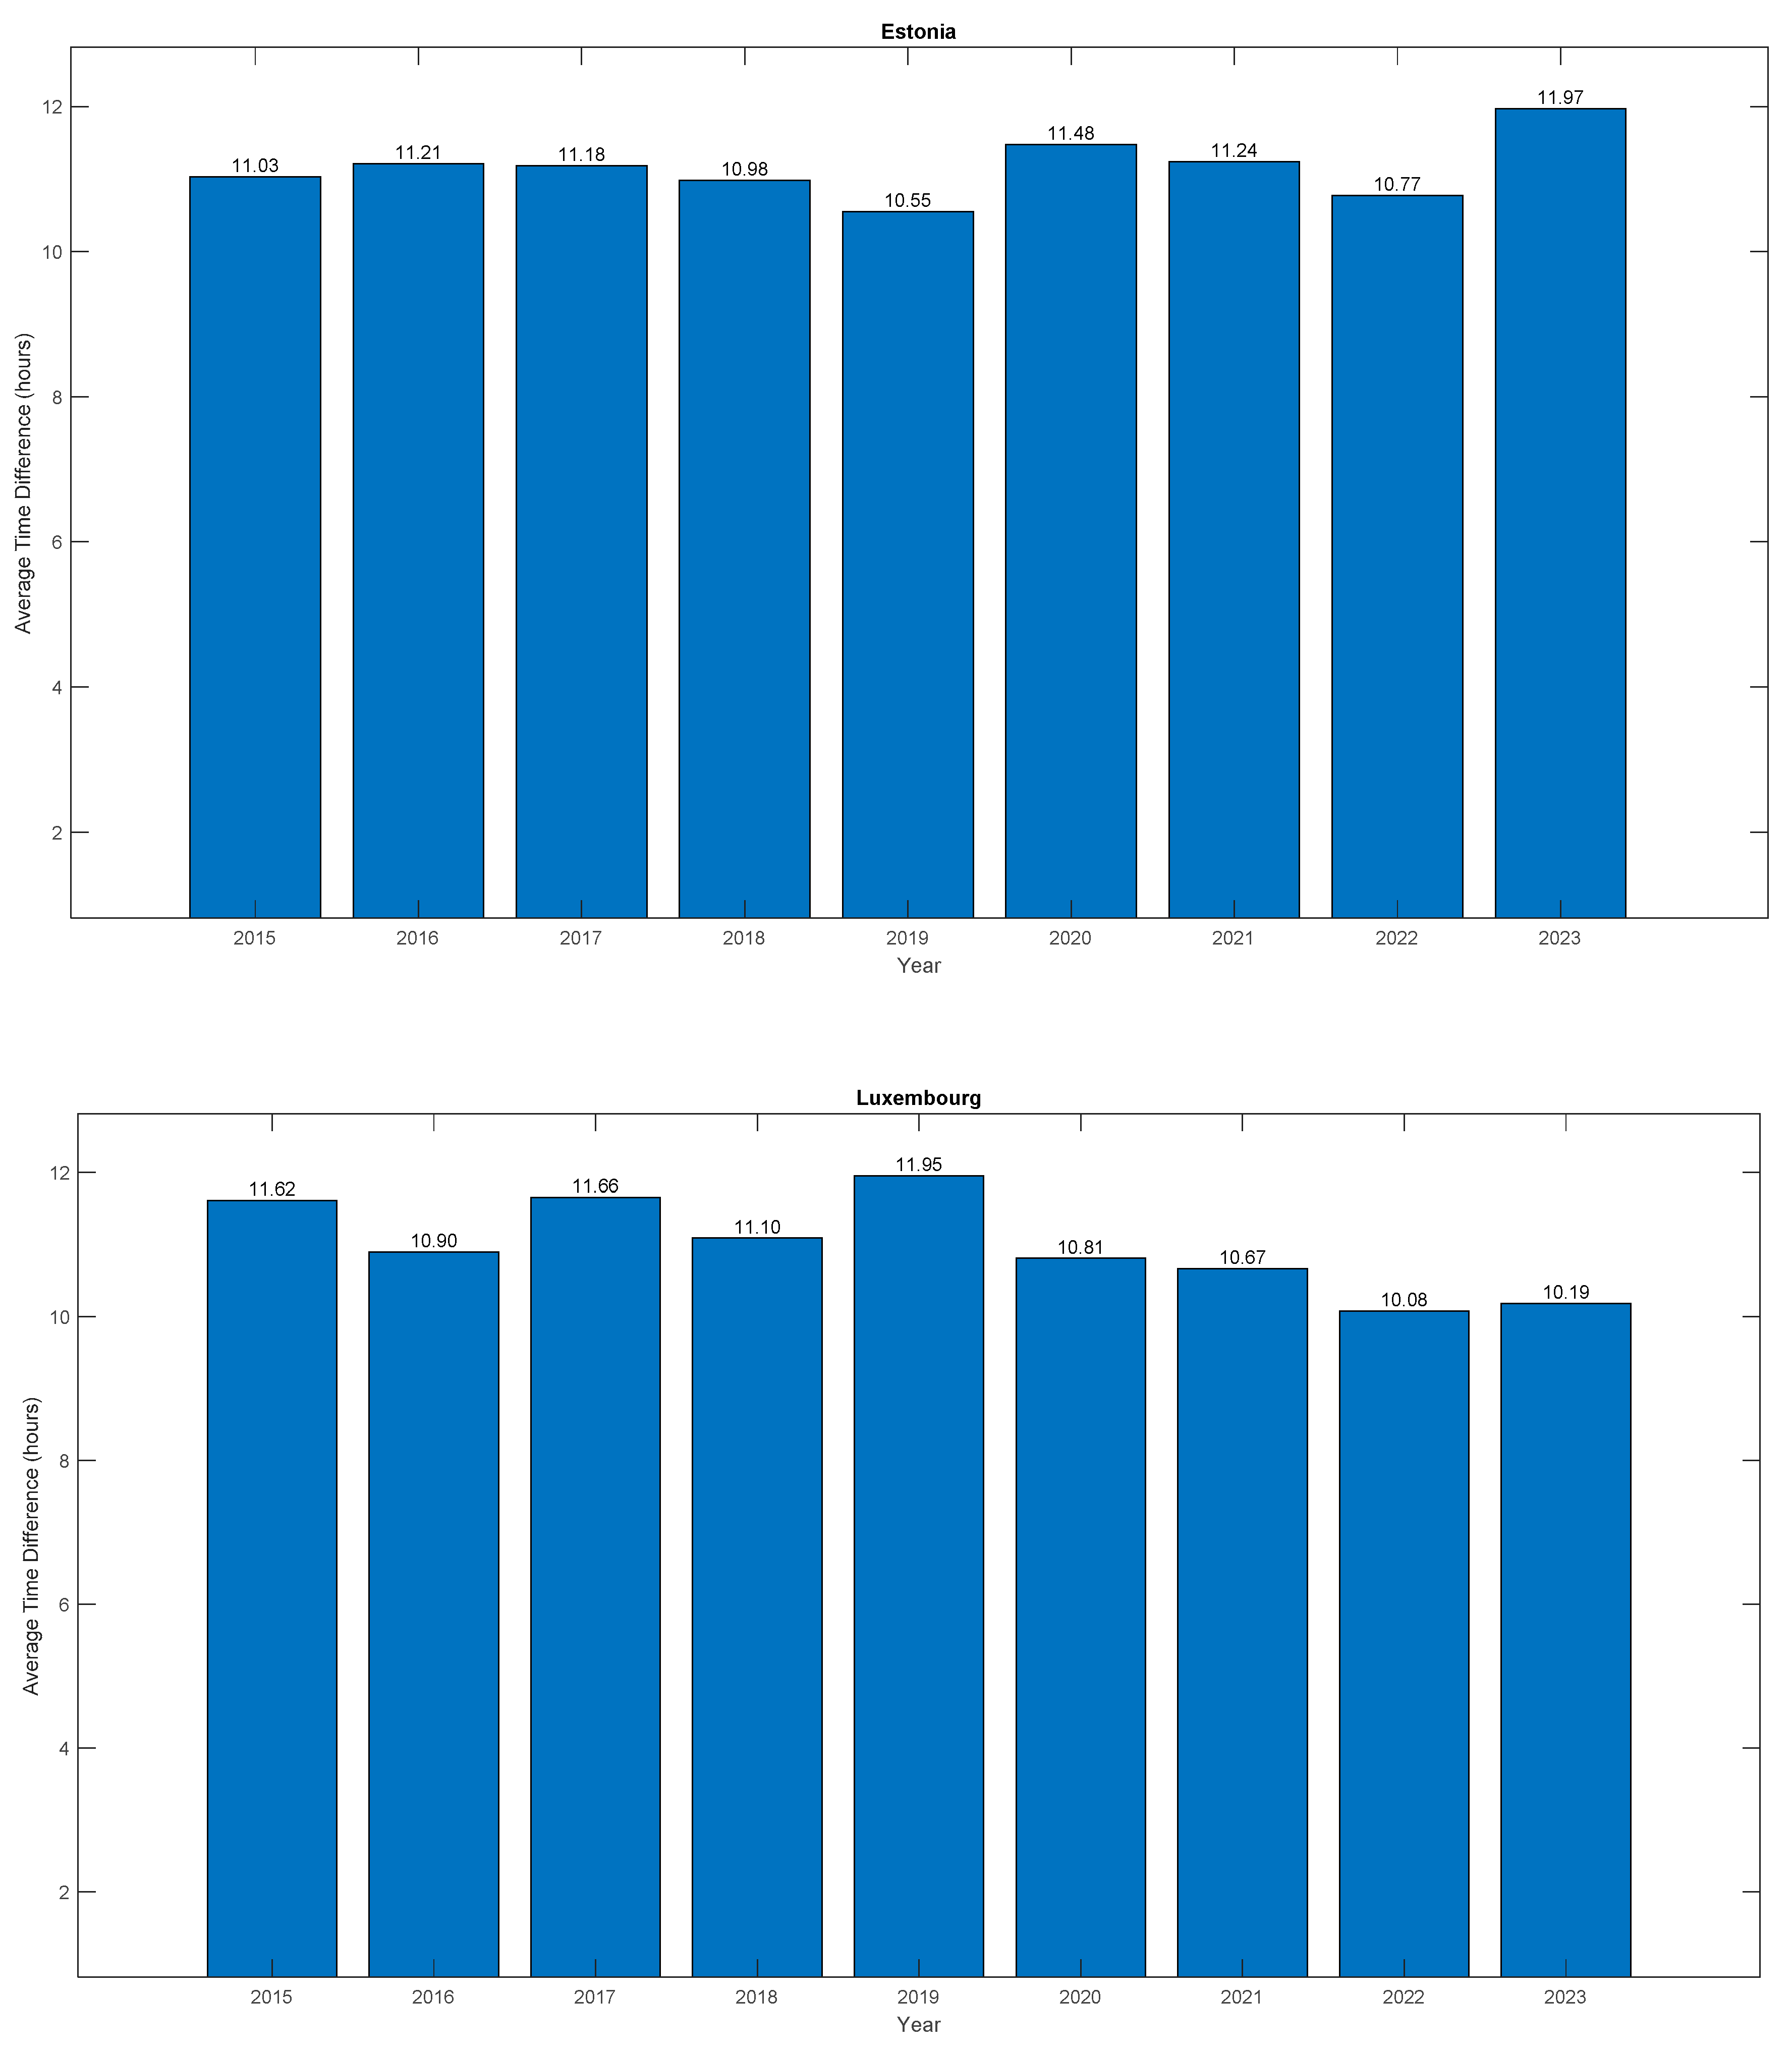
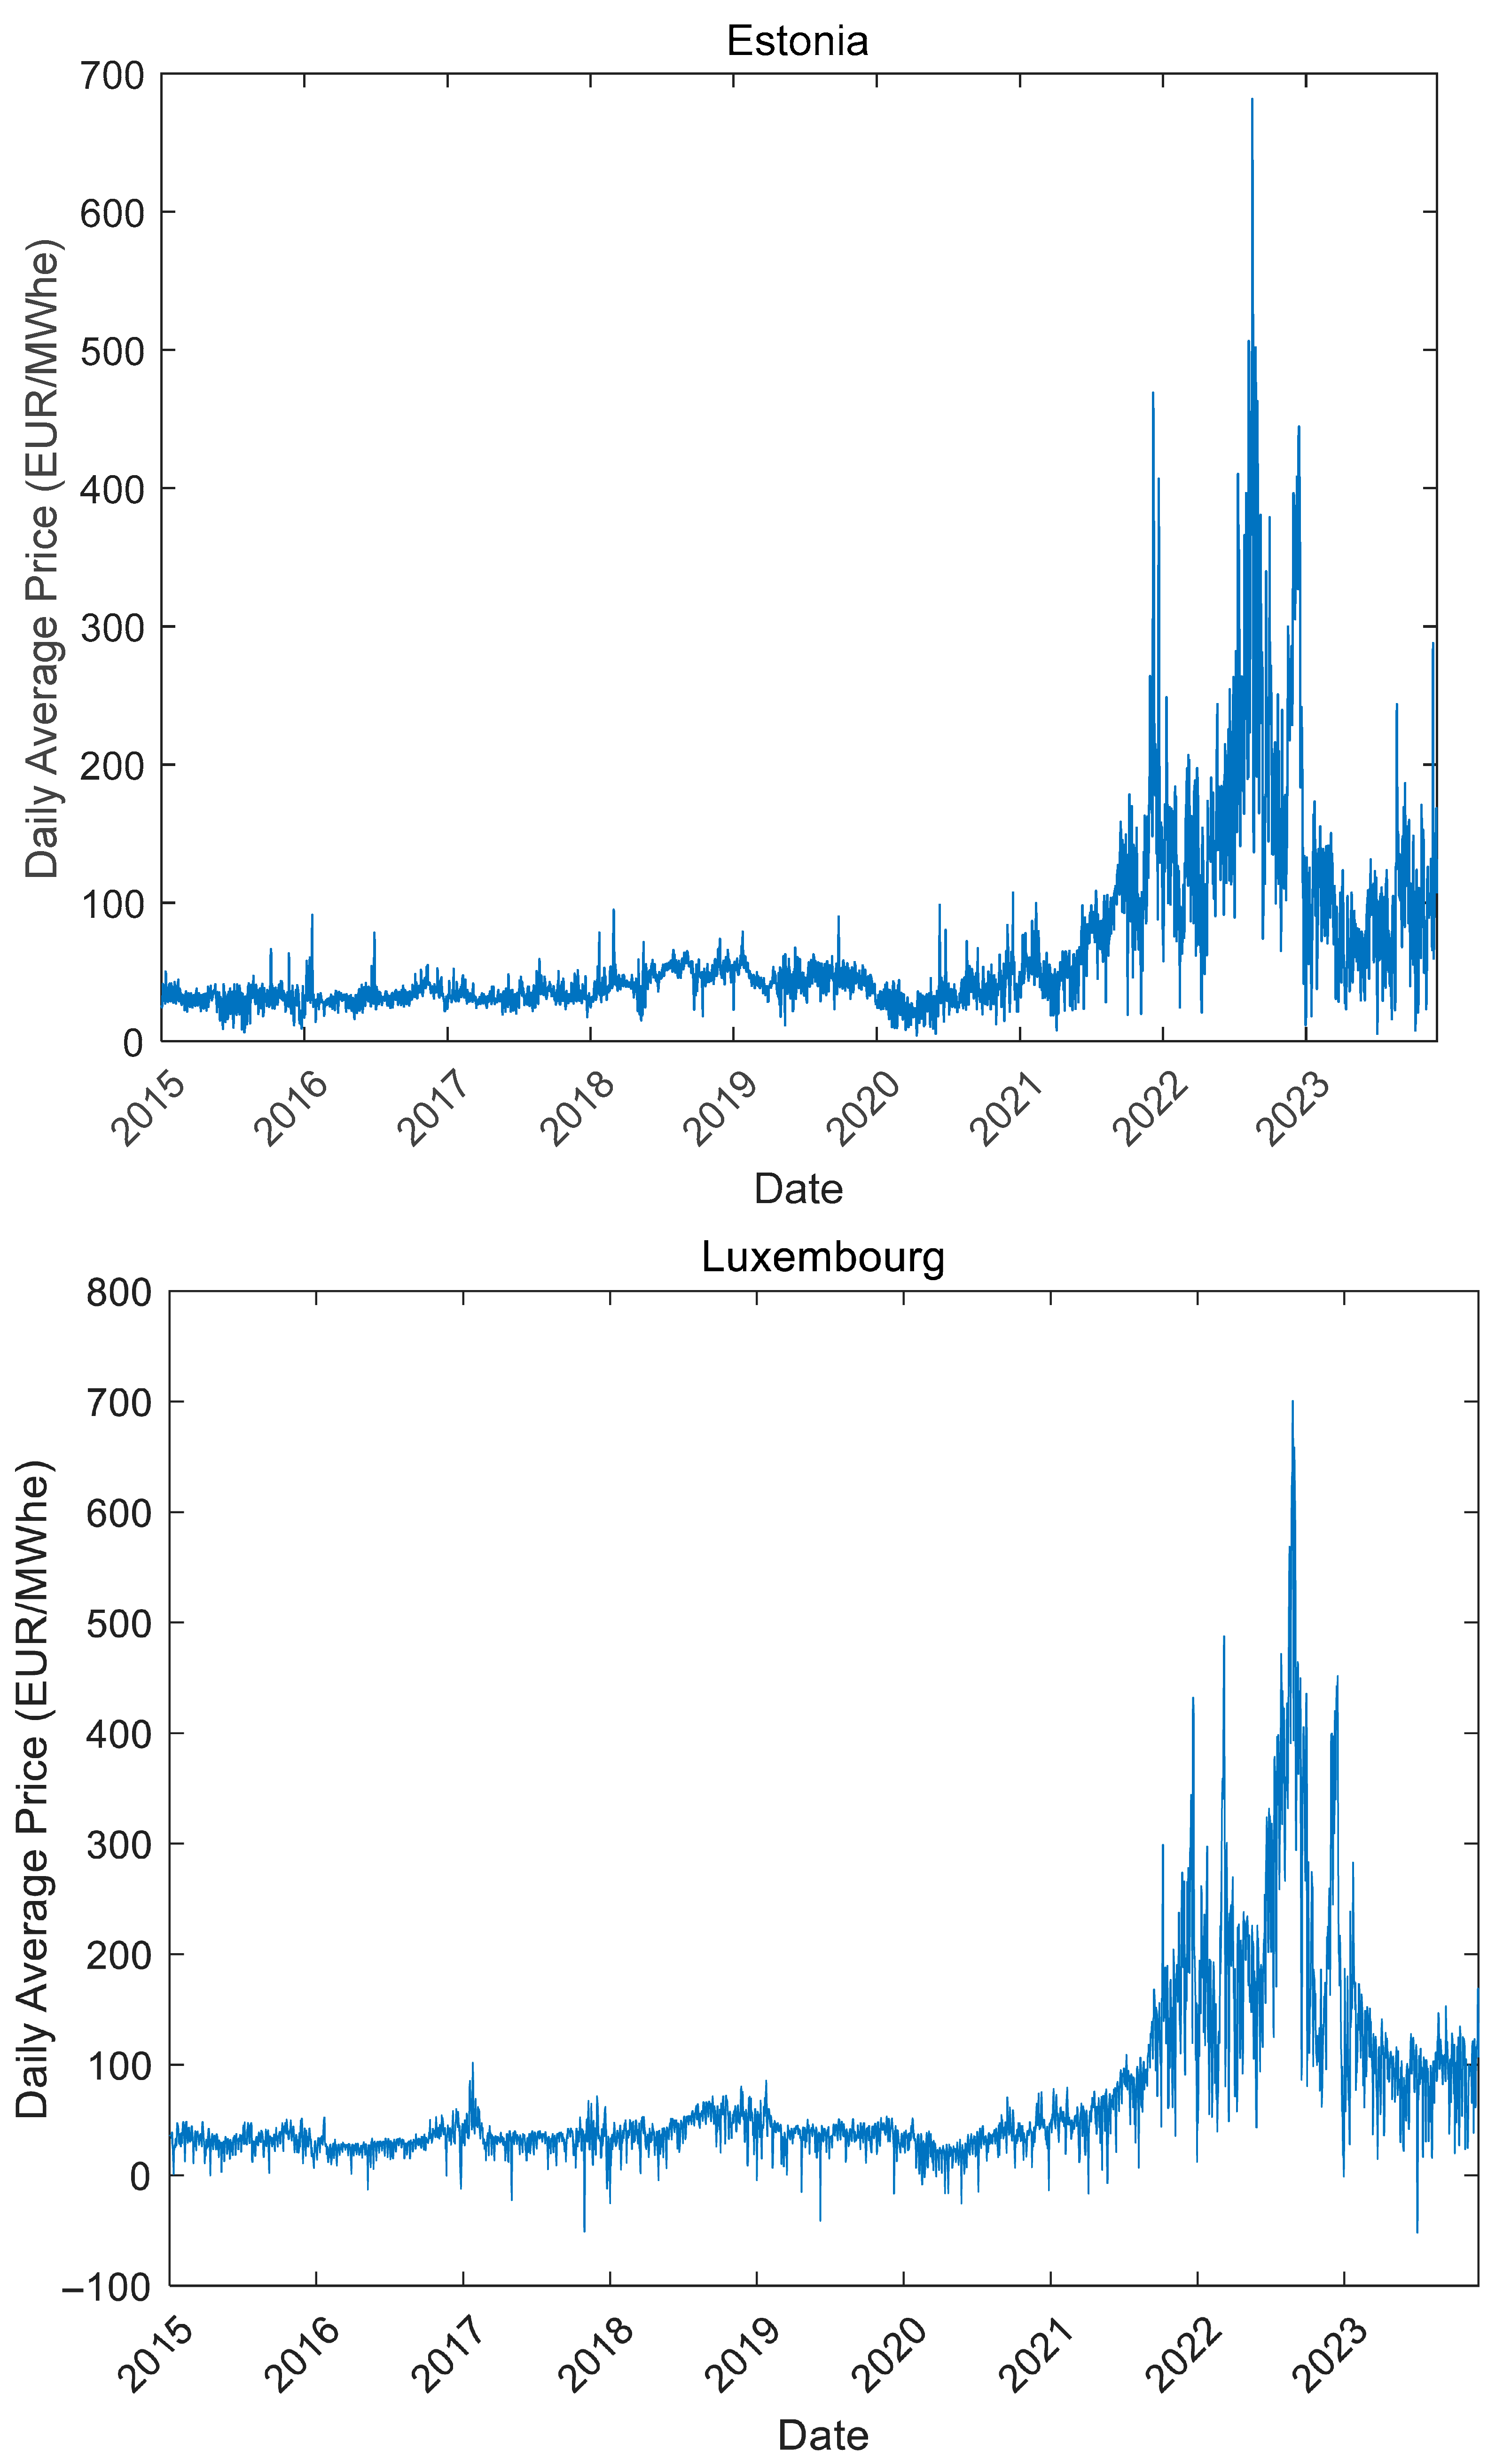
Results demonstrated that Estonia ranked highest in three scenarios, achieving the maximum absolute EAF score of 0.558197 in the volatility-sensitive scenario, while Luxembourg led in the ESOR and economy-sensitive scenarios. Estonia’s market char-acteristics support single daily charge–discharge cycles, whereas Luxembourg enables dual cycles, offering different operational strategies. Analytical plots in Figure 10, Figure 11, Figure 12 and Figure 13 provide added information for extracting distinguishing characteristics from the two candidate markets.

EAF-Score Scenarios

  • Scenario-1 (Risk Averse)
    In this scenario, a 30% weight (“ w i ”) was used for the mean electricity price exhibited by each country for their respective EAF score calculation. The balance of 70% weight quantum was divided equally among all the other metrics.
  • Scenario-2 (ESOR Sensitive)
    In this scenario, a 30% weight was used for the ESOR metric. The other metrics shared the 70% weight quantum equally.
  • Scenario-3 (Economy Sensitive)
    In this scenario, a 20% weight was used for each of the GDP (PPP) and IEF metrics. The balance weight quantum was divided equally among the rest of the metrics.
  • Scenario-4 (Volatility Sensitive)
    In this scenario, a 30% weight was used for the standard deviation metric. A total of 15% each was reserved for the skewness and kurtosis metrics. The remaining 40% weight was divided equally among the rest of the metrics.
  • Scenario-5 (Equally Weighted)
    In this scenario, each metric shared an equal weight quantum.
The weighting approach employed in this section was simple by design, allowing readers to modify the weights according to their preferences, use readily available spreadsheet software, and design additional scenarios as per need. For a more advanced analysis, the following techniques may provide an even robust weighting scheme:
  • Analytic hierarchy process (AHP): A structured technique for organizing and analyzing complex decisions by incorporating expert judgment through pairwise comparisons.
  • Entropy weight method: An objective approach that derives weights based on the information content and variability within the dataset itself.
  • Regression-based weighting: Empirical determination of weights based on historical relationships between indicators and actual investment returns.
  • Risk-adjusted weighting: Customized weights that reflect specific risk preferences and tolerance levels.

4. Discussion

This study opens several promising directions for future research and practical application. First, integrating additional variables—such as detailed transmission congestion data, ancillary services prices, or region-specific regulatory incentives—could enable a more holistic and granular locational decision-making process for BESS investments. Site-selection analysis within a chosen country, following an initial multi-country screening, would allow for the even finer optimization of investment strategies, accounting for subnational differences in grid characteristics, renewable energy penetration, and local market rules. Appendix A provides insights on the types of battery technologies available on the market for added support in making this decision.
Furthermore, expanding the scope to include rigorous cost–benefit analyses of projected investment returns will refine the decision-making framework for investors facing complex capital allocation choices. Such an analysis should encompass not only direct financial returns, but also sensitivity to evolving regulatory policies, price volatility, and the long-term implications of energy transition risk. Finally, the ready adaptability of the presented methodology provides a pathway to application in non-European markets, inviting comparative studies that can benefit from localized calibration of the metrics and scoring methods developed herein.

5. Conclusions

This comprehensive study presented a systematic methodology for evaluating BESS-enabled energy arbitrage opportunities across 29 European electricity markets, providing critical insights for investment decision-making in this rapidly evolving sector. Through the analysis of eight years of hourly wholesale electricity price data (2015–2023) integrated with regulatory, economic, and supply-origin risk variables, this research established a robust framework for cross-country comparative analysis in energy arbitrage ventures. The energy arbitrage feasibility (EAF) scoring methodology developed in this study standardizes the evaluation process across multiple European electricity markets, incorporating ten normalized metrics that collectively assess market volatility, economic stability, and regulatory health. The five investor-preference scenarios examined—risk-averse, ESOR-sensitive, economy-sensitive, volatility-sensitive, and equally weighted—demonstrated the methodology’s robustness in accommodating different investment strategies and risk tolerances.
Estonia emerged as the most favorable investment destination, ranking highest in three of the five scenarios and achieving the maximum absolute EAF score of 0.558197 in the volatility-sensitive scenario. Estonia’s electricity market characteristics, including significant price volatility (standard deviation of 74.55 EUR/MWh) and favorable regulatory environment (IEF score of 78.6%), support single daily charge–discharge cycles that align well with conventional BESS operational strategies.
Luxembourg represents the alternative, leading in ESOR-sensitive and economy-sensitive scenarios with its economic indicators and high renewable energy penetration (81.82%). Notably, Luxembourg’s unique market dynamics enable dual charge–discharge cycles per day, as evidenced by the 3D surface plot analysis. This operational flexibility potentially offers higher revenue generation opportunities, albeit with increased complexity in BESS scheduling and management, along with an increased cyclical aging associated operating expense.
The 3D surface plot visualization technique (Algorithm 1) and frequency analysis of daily price minima provide practical tools for BESS operators to optimize charge–discharge scheduling strategies. These visualizations reveal market-specific patterns crucial for operational planning, with Estonia showing predictable single-cycle patterns and Luxembourg exhibiting more complex dual-cycle opportunities. The electricity supply-origin risk (ESOR) metric introduced in this study addresses the critical sustainability considerations increasingly important to institutional investors. Countries with high fossil fuel dependence, such as Bulgaria (85.97% non-renewable), Poland (80.82%), and the Netherlands (85.61%), face significant transition risks that could impact the long-term BESS venture viability as European energy markets evolve toward carbon neutrality.

Author Contributions

I.U.K.: Conceptualization, methodology, data curation and coding, MATLAB analysis, and draft preparation. M.J.: Supervision, resources, review, and editing. All authors have read and agreed to the published version of the manuscript.

Funding

This research received no external funding.

Data Availability Statement

The raw data supporting the conclusions of this article will be made available by the authors on request.

Acknowledgments

I would like to express my sincere gratitude to my research supervisor, Mohsin Jamil, for his invaluable guidance, support, and mentorship throughout this research project. His expertise, dedication, and encouragement have been instrumental in shaping the direction and quality of this work.

Conflicts of Interest

The authors declare no conflicts of interest.

Abbreviations

α Profit from energy arbitrage operation P t Price at which energy sold by BESS-EA venture to grid
EBattery energy quantum EtBattery energy at time-index t
E t s e l l Battery energy quantum sold to the grid at time-index tCtRepresents hourly electricity price offered by grid in the dataset at each time step
C ¯ Mean of Ct across the operation horizon σ h o u r l y The standard deviation of hourly electricity price data distribution of a country
E t b u y Battery energy quantum bought from the grid at time-index t Ω t a m o r t CAPEX debt-component accumulated and amortized at time-index t
Ψ t OPEX cost component accumulated at time-index t γ t Battery state-of-health cost component accumulated at time-index t
dDay index in the hourly price dataset of each country Δ ¯ Average daily range of price values across the dataset of each country
DTotal days covered in the hourly price dataset of each country Δ d Daily range of price values
E . . Non-renewable electricity generation by a country in a year E Renewable electricity generation by a country in a year
E t c h a r g e Battery energy quantum bought from the grid at time-index t E t d i s c h a r g e Battery energy quantum sold to the grid at time-index t
E m a x Maximum energy storage capacity of BESS S O C m i n Minimum state-of-charge allowed by battery manufacturer for optimum life
S O C t Battery state-of-charge at time-index ttTime-index in hours from the beginning of the operation period
NTotal hours covered in the hourly price dataset of each countryZTotal hours until CAPEX-debt payoff
Ϩ Skewness of hourly price data distribution of a country Ж Kurtosis of hourly price data distribution of a country
TTotal hours of BESS-EA operation Π Electricity supply-origin risk (ESOR)
Net-consumption in TWh of each country (2022)BESSBattery energy storage system
ROIReturn on investmentIPOInitial public offering
BESS-EABESS-enabled energy arbitragePXPower exchange
EUEuropean UnionHVDCHigh voltage direct current
ERGEGEuropean Regulators Group for Electricity and Gas ACERAgency for the Cooperation of Energy Regulators
ENTSO-EEuropean Network of Transmission System Operators for ElectricityNordpoolNordic Power Exchange
EEXEuropean Energy Exchange APXAmsterdam Power Exchange
LPXLeipzig Power Exchange CfDsContracts for difference
GOsGuarantees of OriginVPPVirtual power plant
SEMSingle electricity marketIEMInternal electricity market
EPEX SPOTSpot Market-European Power ExchangeIRENAInternational Renewable Energy Agency
GENCOElectricity Generating CompanyTSOTransmission system operator
ISOIndependent system operatorDISCOElectricity distribution company
RETCOElectricity retail company (last-leg to consumer)DC/DC-FastDirect current EV charger technology
OPEXOperating expenseCAPEXCapital expense
SOHBattery state-of-healthVREVariable renewable energy

Appendix A

Battery TypeKey ManufacturersCycle Efficiency (%)Typical Charge/Discharge Rate (C-Rate)Key Characteristics/Notes
Lithium-ion (Li-ion)Tesla, CATL, BYD, LG Energy Solution, Panasonic, Samsung SDI85–95%0.25–1CMost widely used; mature tech; high round-trip efficiency; safety and lifespan still improving.
LFP (LiFePO4)CATL, BYD, Tesla (Megapack), EVE Energy85–93%0.25–1CSafer, longer life than NMC; slightly lower energy density; used in stationary storage.
NMC (LiNiMnCoO2)LGES, Samsung SDI, SK On90–95%0.5–1CHigher energy density than LFP; more expensive; used in hybrid storage solutions.
Vanadium flow batteryInvinity Energy Systems, Sumitomo Electric, CellCube, Rongke Power65–85%~0.1–0.3CLong life (>10,000 cycles); decoupled power/energy scaling; ideal for long-duration arbitrage.
Zinc-bromine flowRedflow (Australia), Primus Power70–80%~0.2–0.4CTolerant to deep discharge; longer life than Li-ion; moderate efficiencies.
All-iron flowESS Inc. (U.S.)~70–75%~0.25CSafe, non-toxic; long cycle life; lower energy density.
Solid-state (pilot)QuantumScape, Solid Power, Toyota, Samsung SDI (early stages for grid)>90% (projected)>1C (lab scale)High energy density, safety; still experimental at grid scale; long ramp to commercialization.
Sodium-ionCATL, HiNa Battery, Faradion (Reliance), Natron Energy (Blue Solutions)80–90%~0.5–1CCheaper alternative to Li-ion; lower energy density; gaining traction in stationary storage.
Aqueous Zn-basedEos Energy Enterprises, Enerpoly, Urban Electric Power70–80%~0.2–0.5CNon-flammable; long life; safe but less efficient than Li-ion.
Gravity/Energy VaultEnergy VaultN/A (mechanical)Varies (slow ramp-up)Mechanical storage for arbitrage; low efficiency (~75%); long-duration potential.

References

  1. Yu, R.; Yuan, P.; Yang, F.; Jiang, G. Effects of Vertical Unbundling on the Operational and Environmental Efficiency of Chinese Thermal Power Firms. Energies 2023, 16, 7290. [Google Scholar] [CrossRef]
  2. Necoechea-Porras, P.D.; López, A.; Salazar-Elena, J.C. Deregulation in the Energy Sector and Its Economic Effects on the Power Sector: A Literature Review. Sustainability 2021, 13, 3429. [Google Scholar] [CrossRef]
  3. Ryu, H.; Kim, Y.; Jang, P.; Aldana, S. Restructuring and Reliability in the Electricity Industry of OECD Countries: Investigating Causal Relations between Market Reform and Power Supply. Energies 2020, 13, 4746. [Google Scholar] [CrossRef]
  4. Lee, J.; Cho, Y.; Koo, Y.; Park, C. Effects of Market Reform on Facility Investment in Electric Power Industry: Panel Data Analysis of 27 Countries. Sustainability 2018, 10, 3235. [Google Scholar] [CrossRef]
  5. Bojnec, Š. Electricity Markets, Electricity Prices and Green Energy Transition. Energies 2023, 16, 873. [Google Scholar] [CrossRef]
  6. Qazi, A.; Hussain, F.; Rahim, N.A.; Hardaker, G.; Alghazzawi, D.; Shaban, K.; Haruna, K. Towards Sustainable Energy: A Systematic Review of Renewable Energy Sources, Technologies, and Public Opinions. IEEE Access 2019, 7, 63837–63851. [Google Scholar] [CrossRef]
  7. Benton, L. The 1970s in World History: Economic Crisis as Institutional Transition. Hist. Coop. 2024. Available online: https://historycooperative.org/journal/the-1970s-in-world-history-economic-crisis-as-institutional-transition/ (accessed on 2 February 2024).
  8. Horváth, D.; Daly, D.J. Institute for Research on Public Policy. Small Countries in the World Economy: The Case of Sweden; IRPP: Montreal, QC, Canada, 1989. [Google Scholar]
  9. Drach, A.; Cassis, Y. (Eds.) Financial Deregulation: A Historical Perspective; Oxford University Press: Oxford, UK, 2021. [Google Scholar]
  10. Jamasb, T.; Pollitt, M. Electricity Market Reform in the European Union: Review of Progress toward Liberalization & Integration. Energy J. 2005, 26, 11–41. [Google Scholar]
  11. Ofgem. Deregulation of Supply Markets—Slides. 2001. Available online: https://www.ofgem.gov.uk/publications/deregulation-supply-markets-slides (accessed on 2 February 2024).
  12. Bergman, M.A. Competition Law, Competition Policy, and Deregulation. Swed. Econ. Policy Rev. 2002, 9, 93–128. Available online: https://www.government.se/contentassets/e5b8dabba9024522bdc551c9c62c0ee8/mats-a.-bergman-competition-law-competition-policy-and-deregulation (accessed on 7 February 2024).
  13. Gebel, M.; Giesecke, J. Does Deregulation Help? The Impact of Employment Protection Reforms on Youths’ Unemployment and Temporary Employment Risks in Europe. Eur. Sociol. Rev. 2016, 32, 486–500. [Google Scholar] [CrossRef]
  14. Lawton, R.W. Deregulation or Reregulation? Regulatory Reform in Europe and the United States; Majone, G., Ed.; St. Martin’s: New York, NY, USA, 1990; p. 262. [Google Scholar]
  15. Swiss Re Institute. 1990s: Globalisation and Liberalisation. Available online: https://www.swissre.com/institute/search-page.html?searchterm=1990s%3A+Globalisation+and+Liberalisation (accessed on 7 February 2024).
  16. Yergin, D. Energy Security in the 1990s. Foreign Aff. 1988, 67, 110–132. [Google Scholar] [CrossRef]
  17. Witty, S.; Pearce, W.; Sholem, M.; Taylor, J. The New EU Market Abuse Regulation; Harvard Law School Forum on Corporate Governance: Cambridge, MA, USA, 2016. Available online: https://corpgov.law.harvard.edu/2016/06/17/the-new-eu-market-abuse-regulation/ (accessed on 7 February 2024).
  18. ElectricChoice. Energy Deregulation Around the World: A Comprehensive Guide. Available online: https://www.electricchoice.com/blog/energy-deregulation-world/ (accessed on 9 February 2024).
  19. Shikoski, J.; Katic, D.V. Deregulation of the Power Industry in Europe. 2003. Available online: https://www.emo.org.tr/ekler/06bf9581a8f1747_ek.pdf (accessed on 9 February 2024).
  20. Penn, I. Why Are Energy Prices So High? Some Experts Blame Deregulation. The New York Times. 2023. Available online: https://www.nytimes.com/2023/01/04/business/energy-environment/electricity-deregulation-energy-markets.html (accessed on 9 February 2024).
  21. Grubb, M.; Drummond, P.; McDowall, W.; Popp, D. UK Electricity Market Reform and the Energy Transition: Emerging Lessons. MIT CEEPR 2018. Available online: https://ceepr.mit.edu/wp-content/uploads/2021/09/2018-004.pdf (accessed on 19 February 2024).
  22. Šajn, N. Empowering Consumers for the Green Transition; European Parliamentary Research Service (EPRS): Brussels, Belgium, 2022; Available online: https://www.europarl.europa.eu/RegData/etudes/BRIE/2022/733543/EPRS_BRI(2022)733543_EN.pdf (accessed on 19 February 2024).
  23. Department of Commerce, USA. Germany—Country Commercial Guide. 2023. Available online: https://www.trade.gov/country-commercial-guides/germany-energy (accessed on 21 February 2024).
  24. Meeus, L. The Evolution of Electricity Markets in Europe; Edward Elgar Publishing: Cheltenham, UK, 2020. [Google Scholar]
  25. Geman, H. Towards a European Market of Electricity: Spot and Derivatives Trading. OECD-NEA 2002. Available online: https://www.oecd-nea.org/upload/docs/application/pdf/2020-06/workshop_power_generation_investment_4.towards_a_european_market_of_electricity_spot_and_derivatives_trading.pdf (accessed on 21 February 2024).
  26. Downey, L. International Petroleum Exchange (IPE): What It iIs, How It Works. Investopedia 2023. Available online: https://www.investopedia.com/terms/i/international-petroleum-exchange.asp (accessed on 24 February 2024).
  27. European Commission, Directorate-General for Energy. Wholesale Energy Market. 2024. Available online: https://energy.ec.europa.eu/topics/markets-and-consumers/wholesale-energy-market_en (accessed on 24 February 2024).
  28. Gajić, D.B.; Petrović, V.B.; Horvat, N.; Dragan, D.; Stanisavljević, A.; Katić, V.; Popović, J. A Distributed Ledger-Based Automated Marketplace for the Decentralized Trading of Renewable Energy in Smart Grids. Energies 2022, 15, 2121. [Google Scholar] [CrossRef]
  29. European Energy Exchange. Indices. 2023. Available online: https://www.eex.com/en/market-data/power/indices (accessed on 3 March 2024).
  30. Bullinger, V. How the Power Exchange Works. Solar-log.Com 2019. Available online: https://www.solar-log.com/en/news-center/energy-management-blog/solutions/how-the-power-exchange-works (accessed on 5 March 2024).
  31. Association of European Energy Exchanges. EPEX SPOT—European Power Exchange. 2023. Available online: https://tinyurl.com/av2t7jta (accessed on 5 March 2024).
  32. Stecca, M.; Bignucolo, F.; Mattavelli, P.; Costabeber, A. A Comprehensive Review of the Integration of Battery Energy Storage Systems into Distribution Networks. IEEE Open J. Ind. Electron. Soc. 2020, 1, 46–65. [Google Scholar] [CrossRef]
  33. Nezamabadi, H.; Vahidinasab, V. Arbitrage Strategy of Renewable-Based Microgrids via Peer-to-Peer Energy-Trading. IEEE Trans. Sustain. Energy 2021, 12, 1372–1382. [Google Scholar] [CrossRef]
  34. Wu, X.; Zhao, J.; Conejo, A.J. Optimal Battery Sizing for Frequency Regulation and Energy Arbitrage. IEEE Trans. Power Deliv. 2022, 37, 2016–2023. [Google Scholar] [CrossRef]
  35. Kumar, R.R.; Bharatiraja, C.; Udhayakumar, K.; Devakirubakaran, S.; Sekar, K.S.; Mihet-Popa, L. Advances in Batteries, Battery Modeling, Battery Management System, Battery Thermal Management, SOC, SOH, and Charge/Discharge Characteristics in EV Applications. IEEE Access 2023, 11, 105761–105809. [Google Scholar] [CrossRef]
  36. IEA. Evolution of Li-Ion Battery Price, 1995–2019. 2020. Available online: https://www.iea.org/data-and-statistics/charts/evolution-of-li-ion-battery-price-1995-2019 (accessed on 7 March 2024).
  37. Ember-Climate.Org. European Wholesale Electricity Price Data. 2024. Available online: https://ember-climate.org/data-catalogue/european-wholesale-electricity-price-data/ (accessed on 2 January 2024).
  38. Valitov, N.; Nielen, S.; Bönte, W.; Engelmeyer, T. International Association for Energy Economics. 2011. Available online: https://www.iaee.org/en/publications/proceedingsabstractpdf.aspx?id=12561 (accessed on 8 March 2024).
  39. International Renewable Energy Agency. IRENASTAT Online Data Query Tool. 2024. Available online: https://tinyurl.com/26mctmj7 (accessed on 10 March 2024).
  40. ENTSO-E. Power Statistics. 2023. Available online: https://pxweb.irena.org/pxweb/en/IRENASTAT (accessed on 13 March 2024).
  41. United Nations. The 17 Goals. 2023. Available online: https://sdgs.un.org/goals (accessed on 14 March 2024).
  42. IRENA. Increasing Time Granularity in Electricity Markets. 2019. Available online: https://www.irena.org/-/media/Files/IRENA/Agency/Publication/2019/Feb/IRENA_Increasing_time_granularity_2019.pdf (accessed on 14 March 2024).
  43. Kadri, A.; Raahemifar, K. Is Economic Feasibility of BESS Energy Price Arbitrage Jurisdiction Dependent. In Proceedings of the IEEE 61st International Midwest Symposium on Circuits and Systems (MWSCAS), Windsor, ON, Canada, 5–8 August 2018; pp. 1–4. [Google Scholar]
  44. Fan, F.; Zorzi, G.; Campos-Gaona, D.; Burt, G.; Anaya-Lara, O.; Nwobu, J.; Madariaga, A. Sizing and Coordination Strategies of Battery Energy Storage System Co-Located with Wind Farm: The UK Perspective. Energies 2021, 14, 1439. [Google Scholar] [CrossRef]
  45. Jedrzejewski, A.; Lago, J.; Marcjasz, G.; Weron, R. Electricity Price Forecasting: The Dawn of Machine Learning. IEEE Power Energy Mag. 2022, 20, 24–31. [Google Scholar] [CrossRef]
  46. Maciejowska, K.; Uniejewski, B.; Weron, R. Forecasting Electricity Prices. In Oxford Research Encyclopedia of Economics and Finance; Oxford University Press: Oxford, UK, 2023; Available online: https://arxiv.org/abs/2204.11735 (accessed on 14 March 2024).
  47. Bondt, W.F.M.D.; Thaler, R.H. Anomalies: A Mean-Reverting Walk Down Wall Street. J. Econ. Perspect. 1989, 3, 189–202. [Google Scholar] [CrossRef]
  48. The World Bank. GDP Per Capita, PPP (Current International $); The World Bank: Washington, DC, USA, 2022; Available online: https://data.worldbank.org/indicator/NY.GDP.PCAP.PP.CD (accessed on 2 January 2024).
  49. The Heritage Foundation. Index of Economic Freedom; The Heritage Foundation: Washington, DC, USA, 2023; Available online: https://www.heritage.org/index/pages/about (accessed on 2 January 2024).
  50. The Heritage Foundation. Index of Economic Freedom: All Country Scores; The Heritage Foundation: Washington, DC, USA, 2023; Available online: https://www.heritage.org/index/pages/all-country-scores (accessed on 2 January 2024).
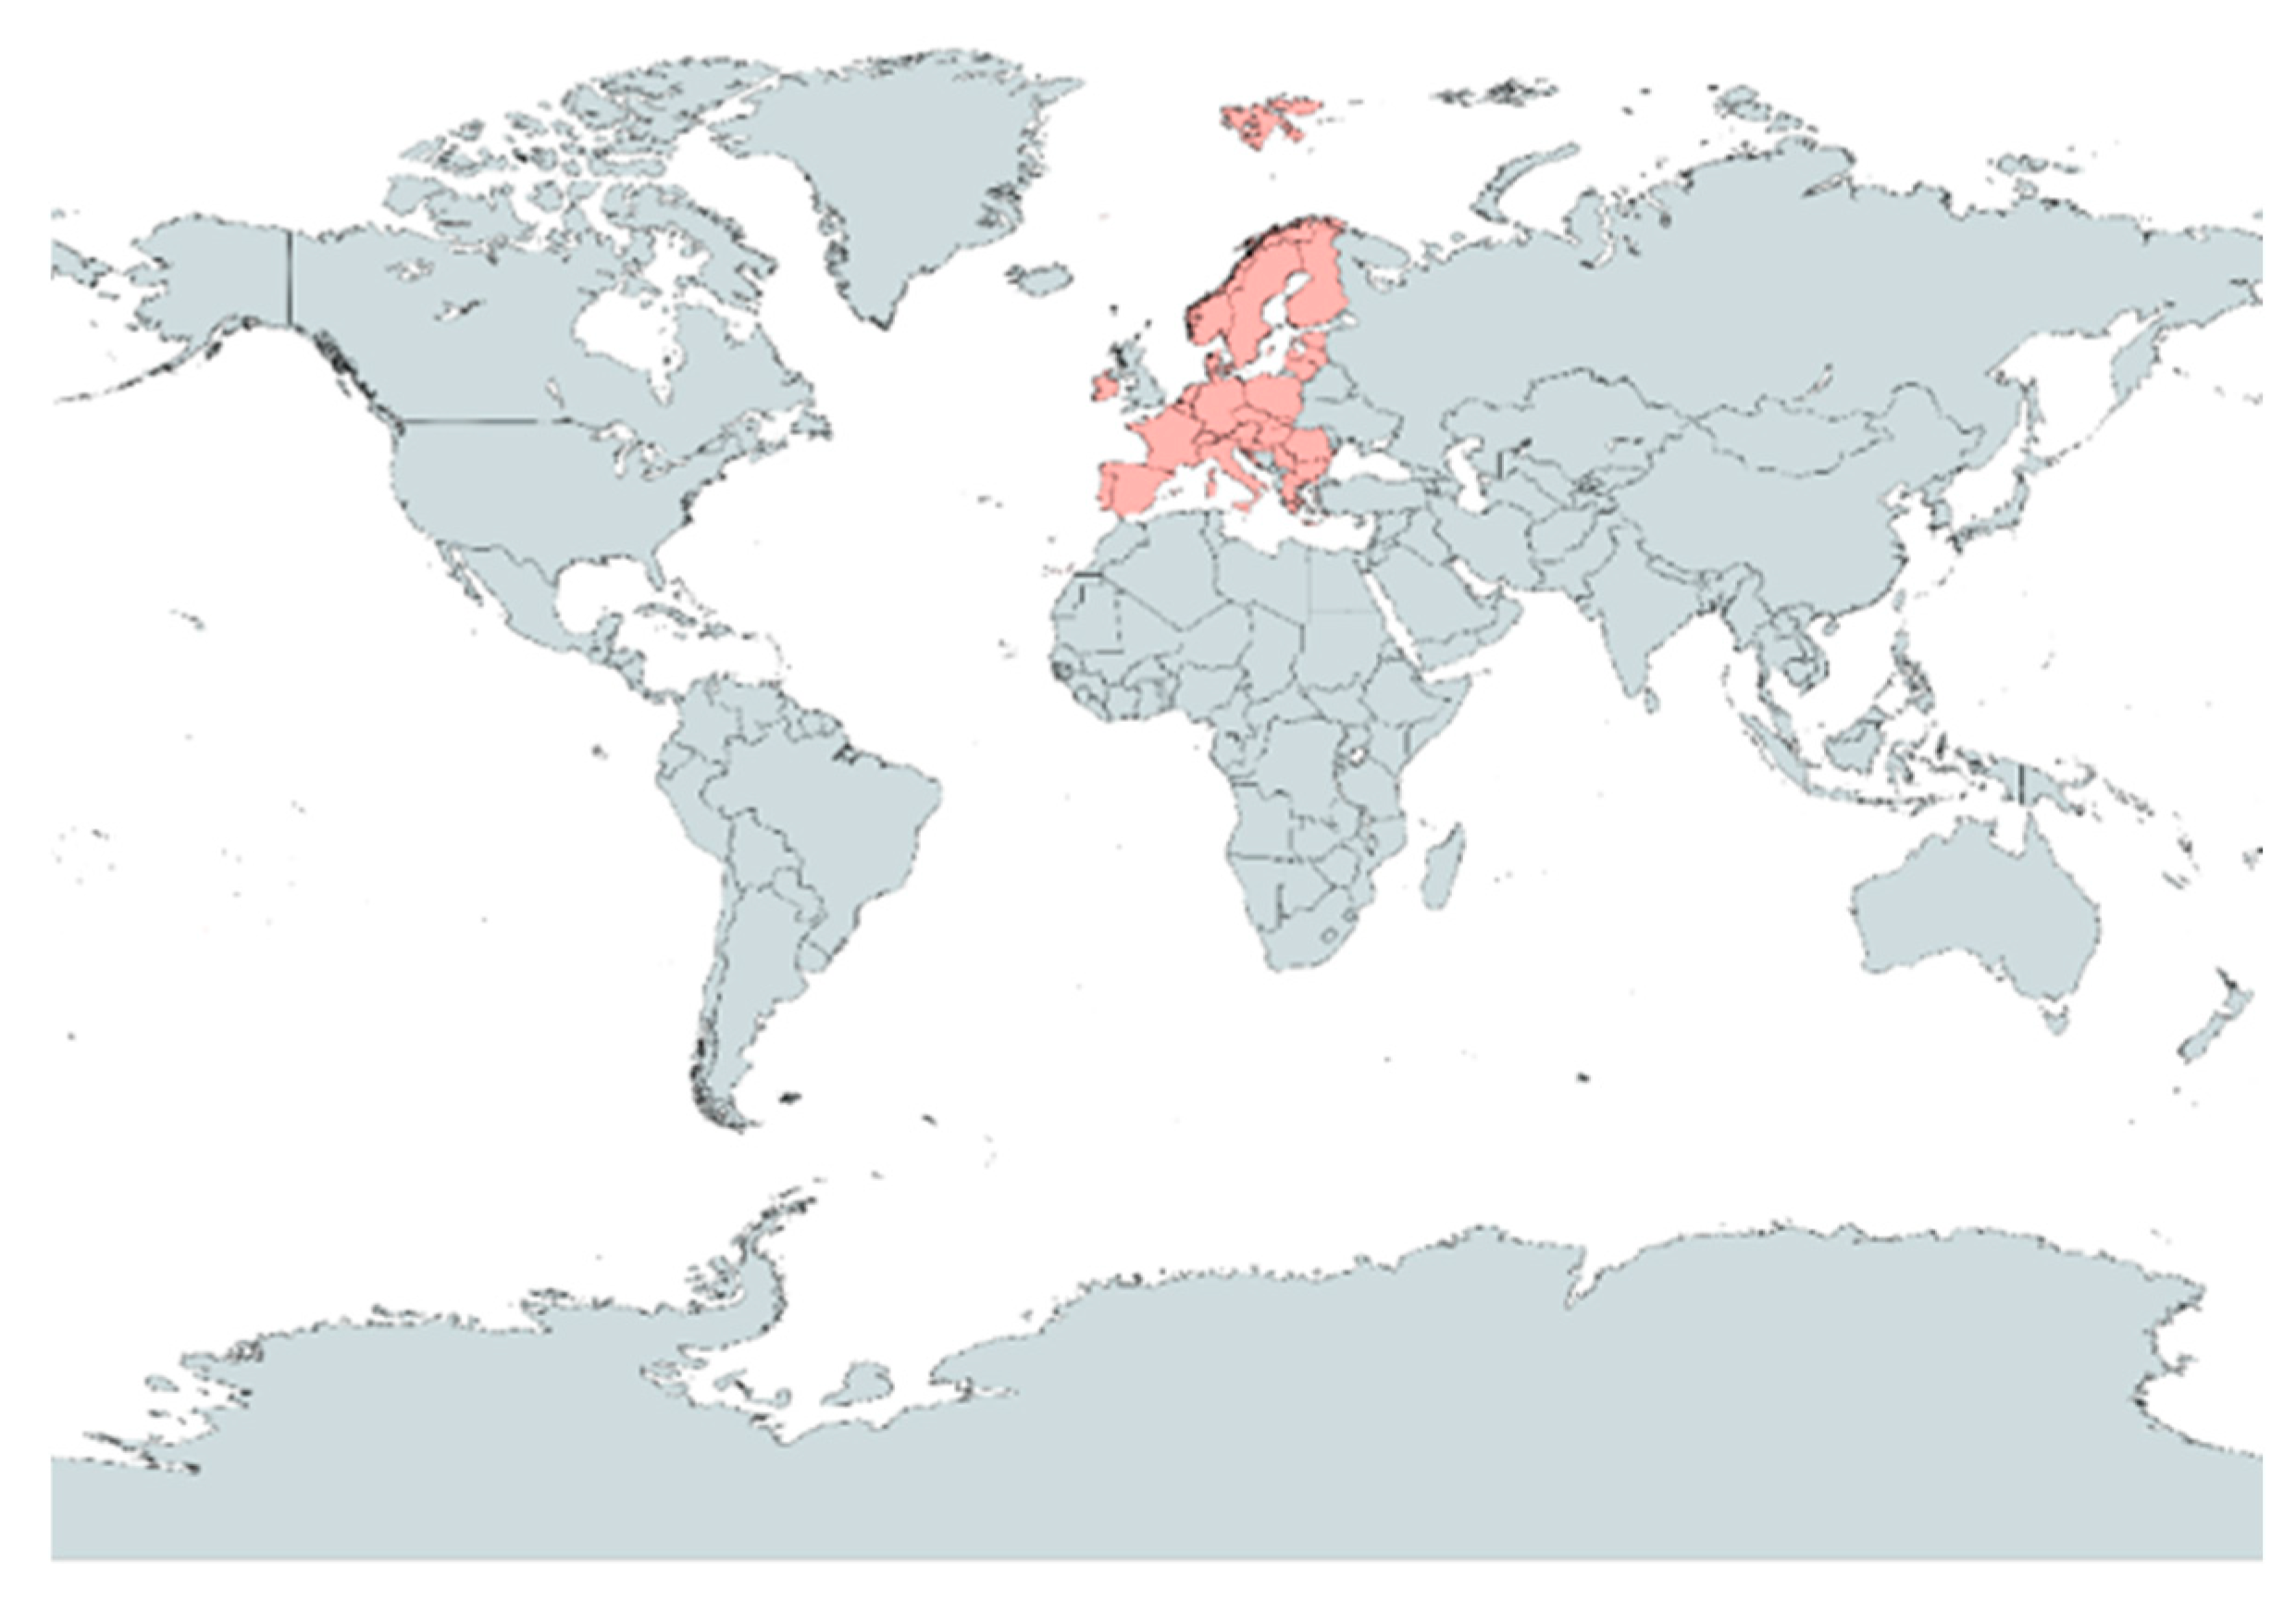
Figure 1. Miller cylindrical map (colored is covered by dataset).
Energies 18 04245 g001
Figure 2. Liberalization.
Energies 18 04245 g002
Figure 3. Increasing time-granularity in electricity markets.
Energies 18 04245 g003
Figure 4. Overview of timeframes of wholesale electricity markets.
Energies 18 04245 g004
Figure 5. Utility-scale BESS project cost—International Energy Agency (2020).
Energies 18 04245 g005
Figure 6. DC fast and ultra-fast EV charger models on the market (28 May 2023).
Energies 18 04245 g006
Figure 7. Energy arbitrage illustrated.
Energies 18 04245 g007
Figure 8. On-grid generation in GWh. Data from IRENA (2021).
Energies 18 04245 g008aEnergies 18 04245 g008bEnergies 18 04245 g008cEnergies 18 04245 g008dEnergies 18 04245 g008eEnergies 18 04245 g008fEnergies 18 04245 g008gEnergies 18 04245 g008h
Figure 9. 3D surface plots of the hourly average electricity price (Changing colour is indicative of contouring information in each plot).
Energies 18 04245 g009aEnergies 18 04245 g009bEnergies 18 04245 g009cEnergies 18 04245 g009dEnergies 18 04245 g009e
Figure 10. Frequency chart of the “hour-of-day minimum daily price” recorded.
Energies 18 04245 g010
Figure 11. Average time difference between the daily max and min hourly prices.
Energies 18 04245 g011
Figure 12. Daily average electricity prices.
Energies 18 04245 g012
Figure 13. Hourly electricity-price distribution.
Energies 18 04245 g013
Table 1. Market participants in Europe.
ParticipantFunction Examples
GENCOProduces energy at a power plant, which can be natural and coal-fired, among others. They sell this energy to grid operators or directly to consumers.EDF (France), Enel (Italy)
ConsumerUses electricity for individual purposes, obtained from grid operators or directly from producers.A household in Paris; a manufacturing plant in Germany
ProsumerUtilizes energy from the grid but also generates their own power through means like solar panels and wind turbines. They can sell excess energy back to the grid.A family home with solar panels in Spain; a small business with wind turbines in Portugal
Transmission system operator (TSO)/independent system operator (ISO)Manages high-voltage transmission lines that transport electricity over long distances to distribution networks or large industrial customers. Ensures balance between supply and demand.National Grid (UK), RTE (France)
Distribution company (DISCO)Manages low-voltage distribution networks that deliver electricity to end consumers including homes and businesses.ENEXIS (Netherlands), E.ON (Germany)
Retail company (RETCO)Purchases wholesale energy and sells it retail to end consumers while managing their accounts.Iberdrola (Spain), E.ON (Germany)
Balancing party (BP)Relying on consumption and production data as well as market mechanisms, they ensure that supply meets the demand at specific points on the grid. Statkraft (Norway), Fortum (Finland)
RegulatorMandated by national governments, they oversee pricing structures, monitor competition among providers, and ensure consumer protection. ACER—Agency for the Cooperation of Energy Regulators (EU), OFGEM—Office of Gas and Electricity Markets (UK)
Power exchange/market operatorEnergy trading platformEPEX Spot, Nord Pool
AggregatorProvides bundled services for decentralized producers and consumers linked to energy marketsNext Kraftwerke (Belgium), Flexitricity (UK)
Table 2. Power market overview (2022).
CountryTSOCapacity (GW)Generation (TWh)Non-Renewable Generation (%)Renewable Generation (%)Net-Consumption
(TWh)
Austria1. APG
2. VUEN
28.50855.129.7670.2461.5
BelgiumElia27.56289.978.4221.5881.7
BulgariaESO11.88249.985.9714.0337.8
CroatiaHOPS4.9621339.2360.7718.1
CzechiaČEPS21.34579.187.4812.5264.4
DenmarkEnerginet17.7513425.8874.1234.3
EstoniaElering AS2.6107.265.2834.728.2
FinlandFingrid20.34663.653.6246.3879.2
FranceRTE146.499433.276.5723.43442.8
Germany1. TransnetBW
2. TenneT DE
3. Amprion
4. 50Hertz
253.140506.953.8846.12482.7
GreeceIPTO23.60439.761.9638.0448.7
HungaryMAVIR ZRt.11.67331.484.0815.9243.4
IrelandEirGrid11.42217.452.3047.7013.1
ItalyTerna121.767248.167.7532.25286.3
LatviaAST3.0774.528.8971.116.8
LithuaniaLitgrid4.1664.136.5963.4112.2
Luxembourg Creos Luxembourg1.9201.118.1881.825.0
NetherlandsTenneT NL52.01495.985.6114.39100.4
North MacedoniaMEPSO1.9264.979.5920.416.3
NorwayStatnett40.371145.12.0797.93131.6
PolandPSE S.A.57.586162.780.8219.18172.4
PortugalREN22.66444.144.9055.1050.3
RomaniaTranselectrica18.47955.258.5141.4956.2
SerbiaEMS8.51132.571.0828.9234.1
SlovakiaSEPS7.49026.179.6920.3127.2
SloveniaELES4.50112.372.3627.3613.4
SpainREE116.593262.155.4844.52236.1
SwedenSvenska Kraftnät49.089161.336.3963.61132.1
SwitzerlandSwissgrid23,978.9242.568.9431.0664.6
Table 3. World Development Indicators Database—The World Bank (2022).
CountryGDP per Capita, PPP (Current International $)CountryGDP per Capita, PPP (Current International $)CountryGDP per Capita, PPP (Current International $)CountryGDP per Capita, PPP (Current International $)CountryGDP per Capita, PPP (Current International $)
Austria67,874.9Estonia46,556.4Ireland126,837.3North Macedonia20,328.9Slovakia37,457.2
Belgium65,478.4Finland59,470.1Italy52,804.0Norway114,929.5Slovenia48,302.5
Bulgaria33,845.6France55,387.5Latvia39,825.3Poland44,134.6Spain46,331.7
Croatia40,240.0Germany63,521.9Lithuania48,860.7Portugal41,862.7Sweden65,157.0
Czechia49,195.0Greece37,075.1Luxembourg 140,616.4Romania41,259.5Switzerland84,649.9
Denmark74,897.0Hungary41,740.9Netherlands70,869.4Serbia23,914.2
Table 4. Index of Economic Freedom (2023).
CountryOverall IEF (%)CountryOverall IEF (%)CountryOverall IEF (%)CountryOverall IEF (%)CountryOverall IEF (%)
Austria71.1Estonia78.6Ireland72.2North Macedonia63.7Slovakia69.0
Belgium67.1Finland77.1Italy62.3Norway76.9Slovenia68.5
Bulgaria69.3France63.6Latvia72.8Poland67.7Spain65.0
Croatia66.4Germany73.7Lithuania72.2Portugal69.5Sweden77.5
Czechia71.9Greece56.9Luxembourg 78.4Romania64.5Switzerland83.8
Denmark77.6Hungary64.1Netherlands78.0Serbia63.5
Table 5. EAF-scenario analysis (maxima in the scenario columns highlighted in green).
CountryAverage Electricity Price ( C ¯ ) in EUR/MWHr C ¯ N o r m Standard   Deviation   ( σ h o u r l y ) σ N o r m h o u r l y Average   Daily   Price   Range   ( Δ ¯ ) Δ ¯ N o r m Skewness (Ϩ)ϨNorm Kurtosis   ( Ж ) Ж N o r m ESOR   ( Π ) Π N o r m GDP (PPP) G D P N o r m P P P Net - consumption   in   TWh   ( ) N o r m AHPD A H P D N o r m IEF I E F N o r m ICR (Euro)Scenario-1
Score
Scenario-2
Score
Scenario-3
Score
Scenario-4
Score
Scenario-5
Score
Austria77.530.53682592.180.82270960.900.5883363.070.57914314.830.09099629.760.32420167,874.90.3952761.50.1182757.520.64803871.10.527881198290.40.1067410.1540080.3336150.4282310.290962
Belgium78.650.55651385.760.7313665.850.6587482.980.56238414.420.08742378.420.89392365,478.40.37534781.70.1605618.170.72532767.10.379182214407.60.04955−0.025460.2615580.3653410.22299
Bulgaria88.890.73650995.120.86454286.100.9467993.090.58286827.950.20535285.970.98232133,845.60.1123737.80.06866210.070.95124969.30.460967280341.60.028502−0.026140.2572150.4244870.247398
Croatia103.881104.64181.890.8869132.460.46554910.530.05351739.230.43507840,240.00.16552918.10.0274239.590.89417466.40.35316266633.8−0.034950.0906310.2456750.42880.241119
Czechia75.070.49358486.830.74658559.620.5701283.190.6014915.840.099887.48149,195.00.23997664.40.1243466.860.5695671.90.557621194122.70.046913−0.065660.2508940.3616040.201592
Denmark65.310.32202581.600.67216856.220.5217643.540.66666719.120.12838825.880.27877374,897.00.45364734.30.0613366.110.4803877.60.769517183052.30.1734070.1830220.3893760.4171710.315307
Estonia65.950.33327574.550.57185571.980.7459465.331119.12165.280.74007746,556.40.218048.20.0066998.910.81331778.60.806691234366.90.2436440.1532110.4347810.5581970.40892
Finland55.490.14941165.750.44664259.380.5667144.150.78026128.420.20944853.620.60355959,470.10.32539779.20.1553286.550.53269977.10.750929193341.30.2010080.1000510.3606240.3725580.301445
France81.010.59799695.550.8706658.000.5470843.600.6778432.380.24396476.570.87226355,387.50.291457442.80.9164756.970.5826463.60.2490711888480.0930890.032120.2857360.4632190.290893
Germany72.970.45667187.880.76152566.730.6712663.310.62383617.280.11235153.880.60660363,521.90.359081482.718.060.71224773.70.624535217272.90.1938640.1605340.408070.4704360.380157
Greece92.580.80137187.780.76010262.880.6165012.820.53258813.030.07530761.960.70120637,075.10.13921848.70.091487.870.68965556.90204737.3−0.06919−0.046920.1225730.3211720.140228
Hungary84.470.65881592.490.8271270.990.7318633.040.57355714.800.09073584.080.96019241,740.90.17800743.40.0803858.010.70630264.10.267658231143.4−0.00375−0.070750.1934550.3674910.183662
Ireland69.580.39708260.660.37421772.270.7500712.840.53631314.190.08541852.300.588104126,837.30.88544913.10.0169568.460.7598172.20.568773235311.10.1441930.1017290.4061640.3194890.299182
Italy95.130.84619497.430.8974154.130.4920342.850.53817512.770.07304167.750.76899752,804.00.269979286.30.5888636.460.52199862.30.200743176247.3−0.03527−0.018110.2063690.3870820.196705
Latvia72.430.44717984.260.71001772.670.7557614.930.92551284.260.69615628.890.31401539,825.30.1620826.80.0037689.160.84304472.80.591078236613.50.205660.2352620.3886120.5473040.392622
Lithuania73.150.45983585.520.72794573.390.7660034.870.91433980.410.66259936.590.40416848,860.70.23719712.20.0150729.130.83947772.20.568773238957.80.1982760.2106510.3908010.5441440.38674
Luxembourg72.970.45667187.880.76152566.730.6712663.310.62383617.280.11235118.180.18862140,616.415.008.060.71224778.40.799257217272.90.2120160.2716040.5275460.4837760.403519
The Netherlands76.150.51256883.810.70361465.000.6466573.050.57541915.160.09387385.610.97810670,869.40.420164100.40.1997078.000.70511378.00.7843872116400.091049−0.012440.3484380.383730.263826
N. Macedonia98.850.91158434.36089.841−0.0404.39079.590.90762220,328.906.30.00272110.48163.70.252788292519−0.16874−0.167860.0643210.0249130.04363
Norway47.210.00386748.430.20019919.5403.450.64990719.940.1355362.070114,929.50.786454131.60.265022.07076.90.74349463622.240.2148930.2157530.3994990.2801480.277674
Poland69.640.39813754.700.28941447.330.3953062.990.56424618.150.11993480.820.92202344,134.60.197907172.40.3504295.350.39001267.70.401487154106.50.019386−0.097070.1790670.2131460.138857
Portugal72.190.4429656.020.30819636.260.2378382.300.43575410.430.05264544.900.50146441,862.70.17901950.30.0948294.260.26040469.50.468401118062.6−0.01357−0.026580.1628770.1826240.109266
Romania81.620.60871992.240.82356378.610.8402563.070.57914315.000.09247858.510.66081341,259.50.17400556.20.107188.890.81093964.50.282528255954.20.0543130.0427330.2401090.4017930.244056
Serbia97.110.88099898.940.91889670.580.7260312.640.49906911.630.06310571.080.80798523,914.20.02980634.10.0609177.840.68608863.50.245353229808.5−0.07617−0.059940.1499160.3633760.154028
Slovakia78.780.55879891.880.81844164.980.6463733.130.59031715.300.09509379.690.90879337,457.20.14239527.20.0464737.510.64684969.00.449814211574.90.028706−0.04910.2216380.3748560.196816
Slovenia84.560.66039792.470.82683664.940.6458042.990.56424614.260.08602872.360.82297248,302.50.23255613.40.0175847.760.67657668.50.431227211444.60.008398−0.027740.2327840.3753050.199749
Spain71.950.43874156.120.30961937.410.2541962.300.43575410.470.05299455.480.62533746,331.70.216172236.10.4837764.360.27229565.00.3011151218070.000513−0.040970.1592990.1926620.126184
Sweden46.99053.160.26750143.550.3415364.350.81750528.710.21197636.390.40182665,157.00.372675132.10.2660674.540.29369877.50.765799141798.80.2280440.1387180.3624290.3281990.293493
Switzerland84.330.65635493.420.84035343.060.3345662.830.53445112.580.07138568.940.78292984,649.90.53472764.60.1247644.850.33055983.81140203.40.0352520.0071140.3667050.3935340.233152
Disclaimer/Publisher’s Note: The statements, opinions and data contained in all publications are solely those of the individual author(s) and contributor(s) and not of MDPI and/or the editor(s). MDPI and/or the editor(s) disclaim responsibility for any injury to people or property resulting from any ideas, methods, instructions or products referred to in the content.