Energy Arbitrage Analysis for Market-Selection of a Battery Energy Storage System-Based Venture
Abstract
1. Introduction
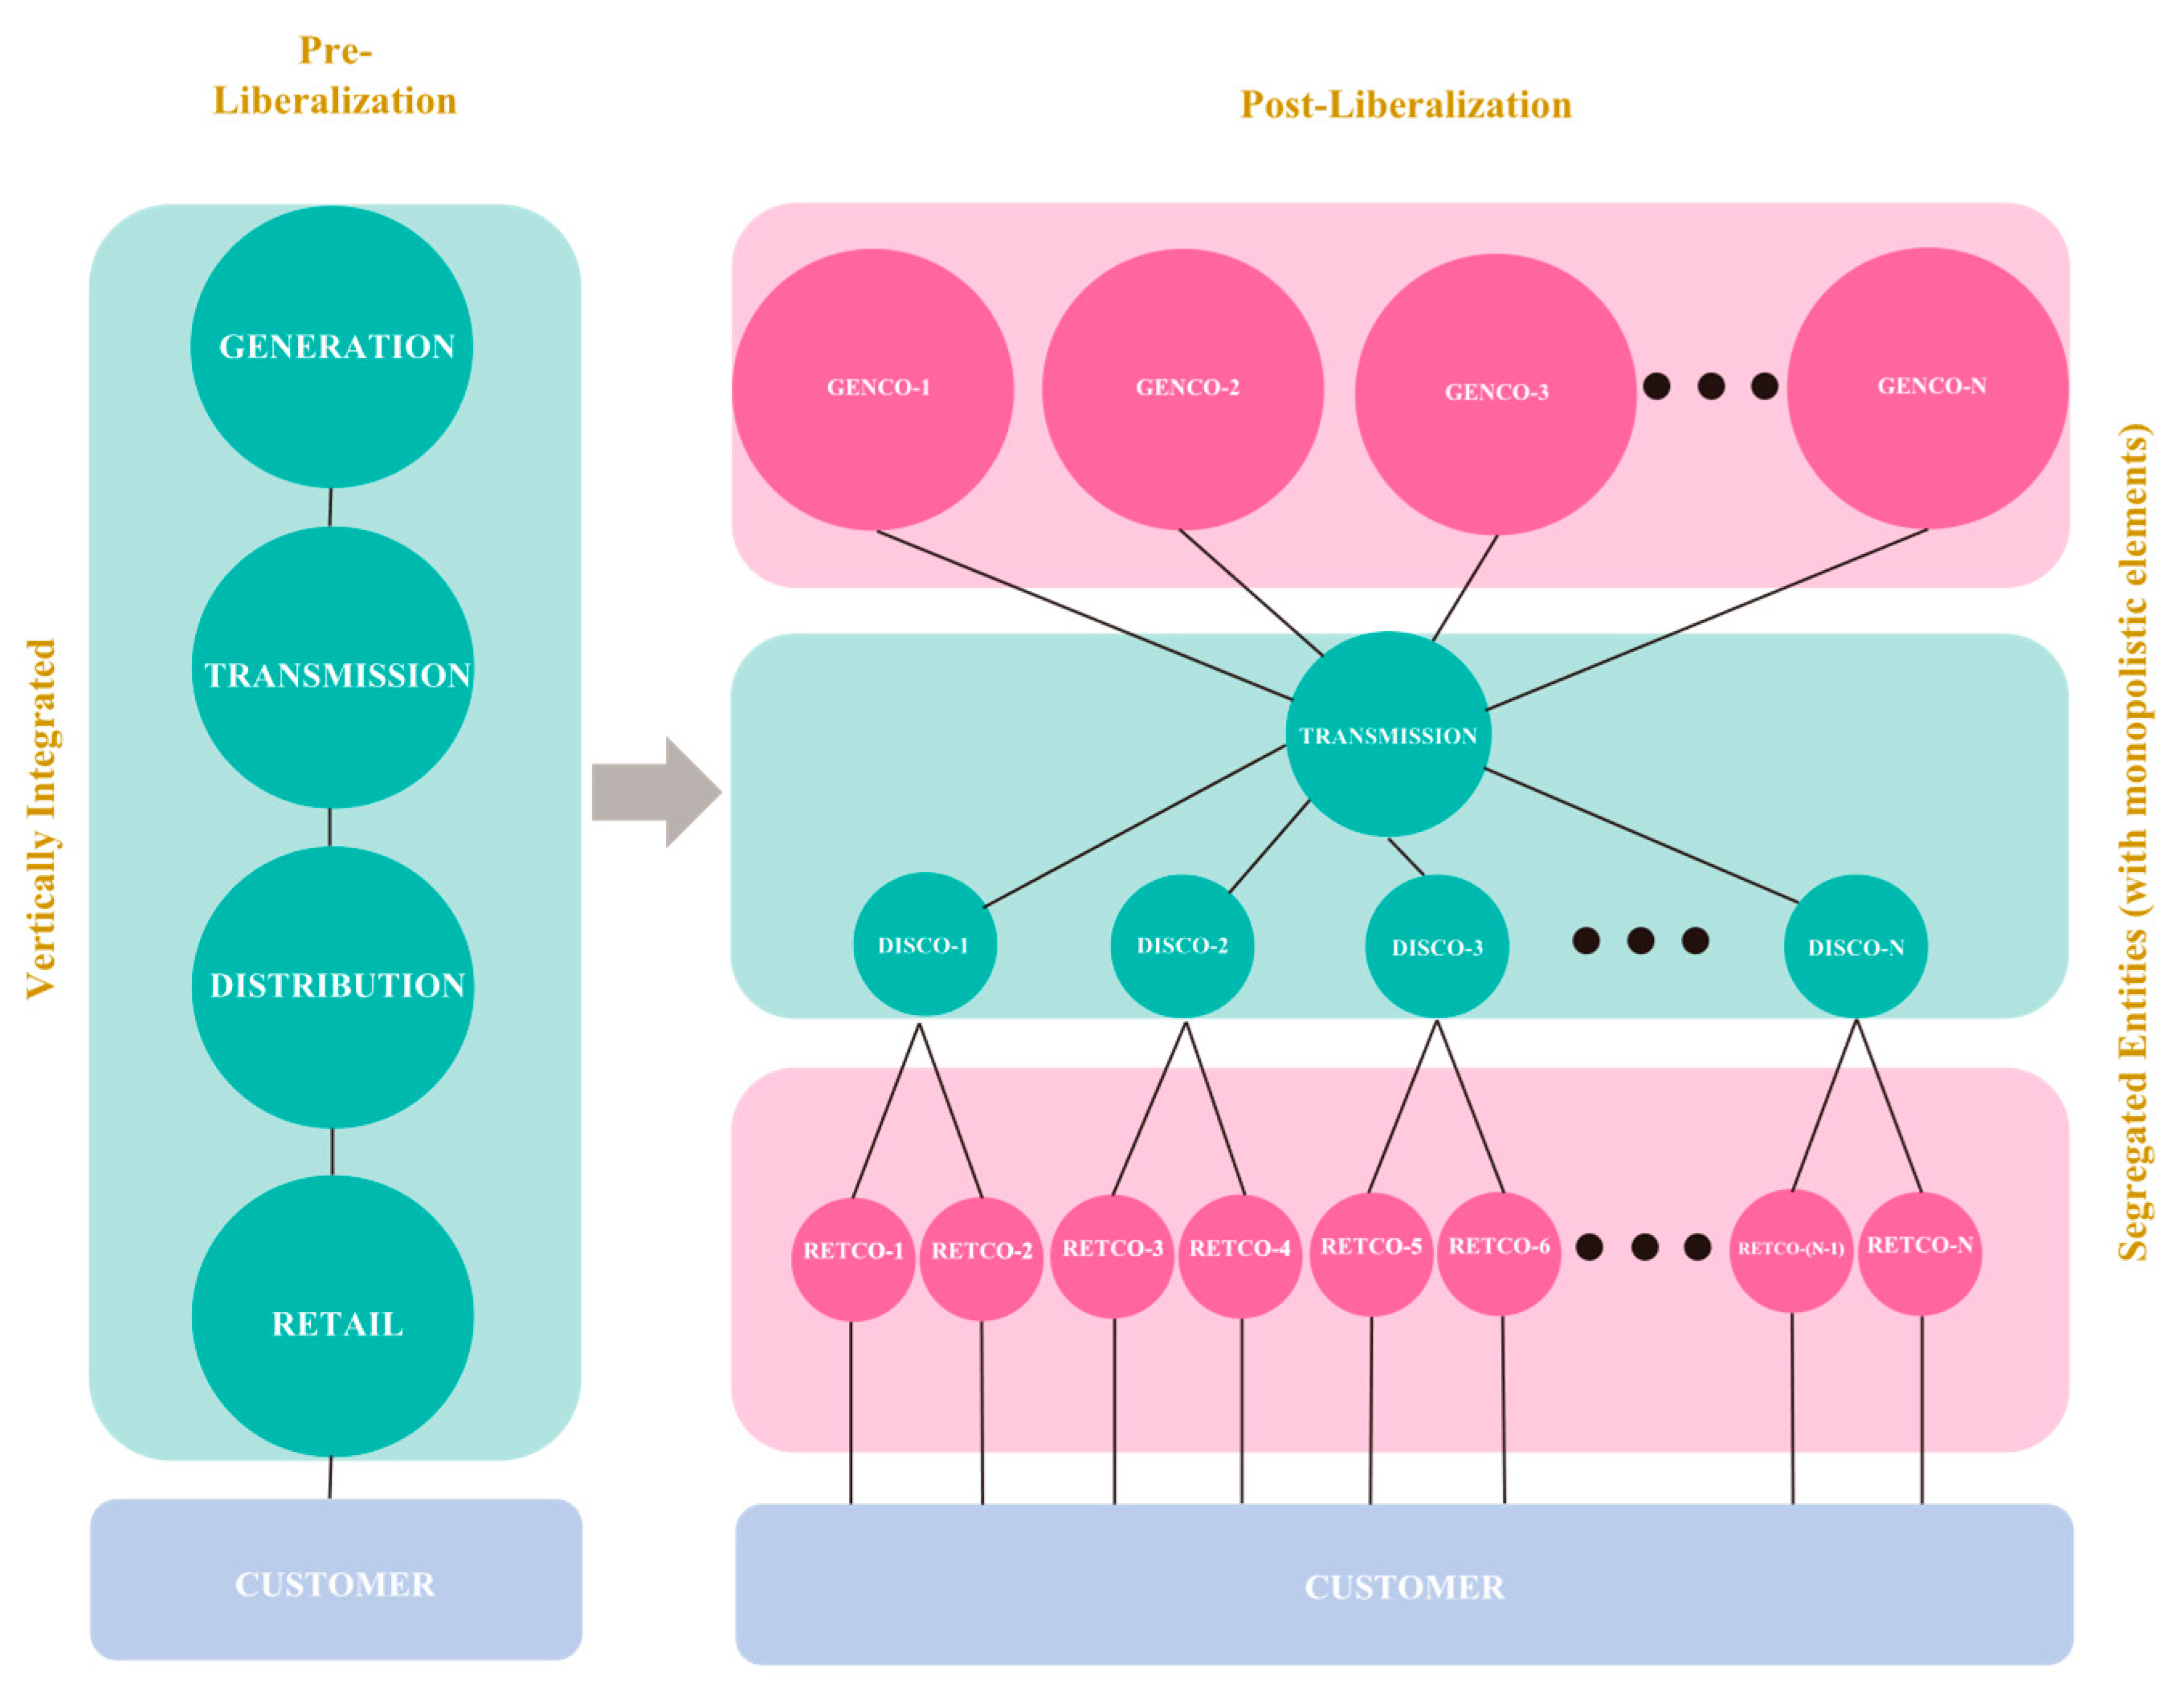
1.1. Post-1970s Electricity Market Development
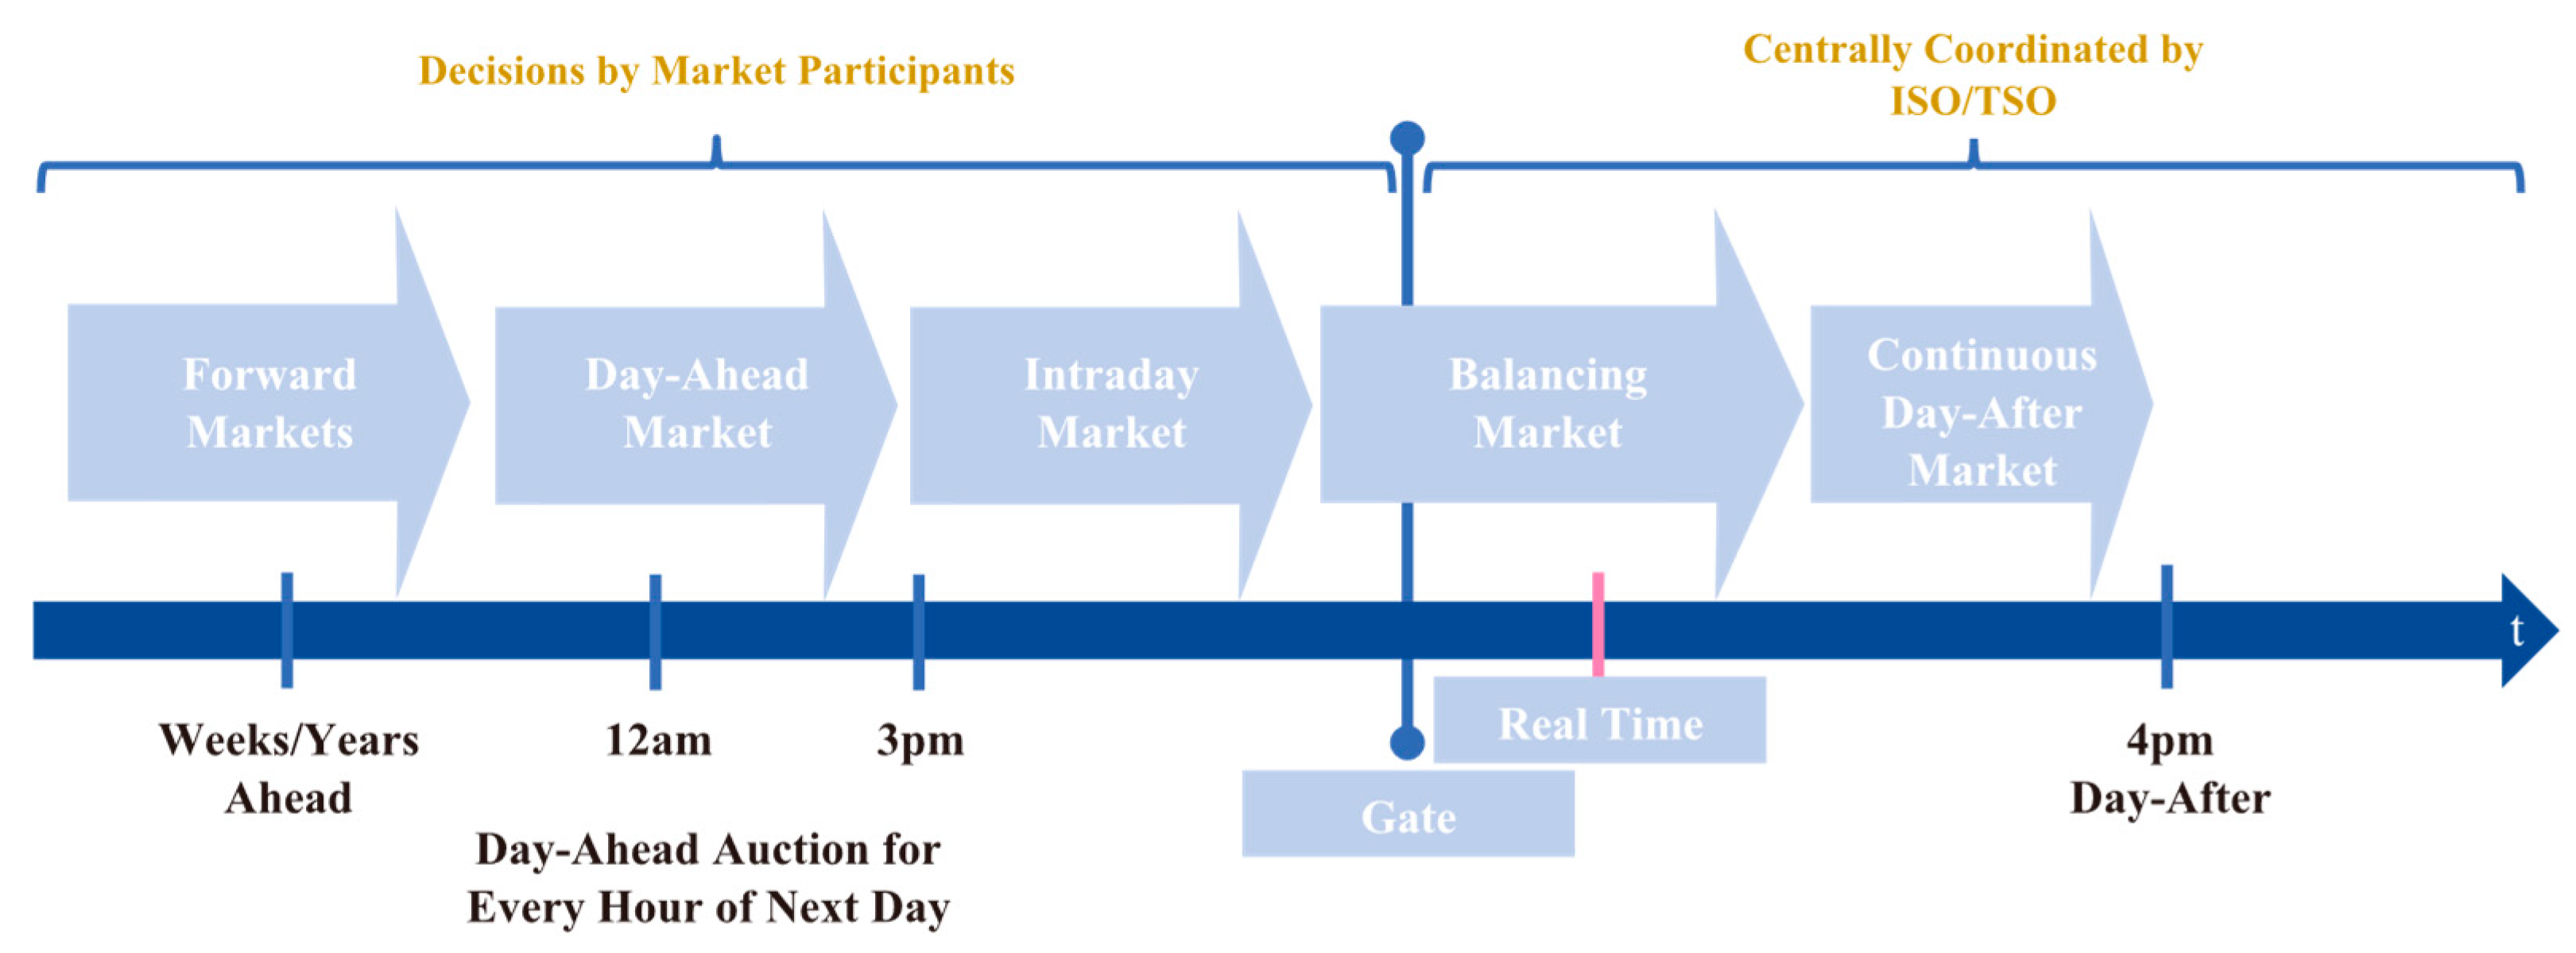
1.2. State of Electricity Trading in Europe Today—Case of the European Power Exchange SE (EPEX SPOT)
1.3. BESS-Enabled Energy Arbitrage—Opportunity and Contribution
- Maximize:
- is the profit from energy arbitrage operation over the entire operation horizon T;
- is the total revenue obtained by selling battery energy to the grid:
- ○
- is the price at which energy is sold by the BESS-EA venture to the grid at time index t;
- ○
- is the battery energy quantum sold to the grid at time index t.
- is the total cost incurred by purchasing energy from the grid to charge the battery:
- ○
- is the hourly electricity price offered by the grid at time index t;
- ○
- is the battery energy quantum bought from the grid at time index t.
- is the accumulated and amortized CAPEX debt component over the debt payoff period Z:
- ○
- is the CAPEX debt amortization cost at time index.
- is the OPEX accumulated over the operation horizon T:
- ○
- is the OPEX cost component at time index t.
- is the battery state-of-health (SOH) degradation costs accumulated during operation:
- ○
- is the battery SOH cost component at time index t.
- Constraints:
- i.
- Energy Balance:
- is the total energy quantum charged (bought from the grid) over the entire operation horizon T:
- ○
- is the battery energy quantum bought (charged) at time index t.
- is the total battery energy quantum discharged (sold to the grid) over the entire operation horizon T:
- ○
- is battery energy quantum sold (discharged) at time index t.
- ii.
- BESS Capacity:
- is the battery energy quantum stored in the battery at time index t;
- is the maximum energy storage capacity of the Battery energy storage system (BESS).
- iii.
- Minimum SOC Requirement:
- is the battery state-of-charge at time index t, representing the current energy level of the battery as a fraction or percentage of its total capacity;
- is the minimum state-of-charge allowed by the battery manufacturer for optimal battery life and performance.
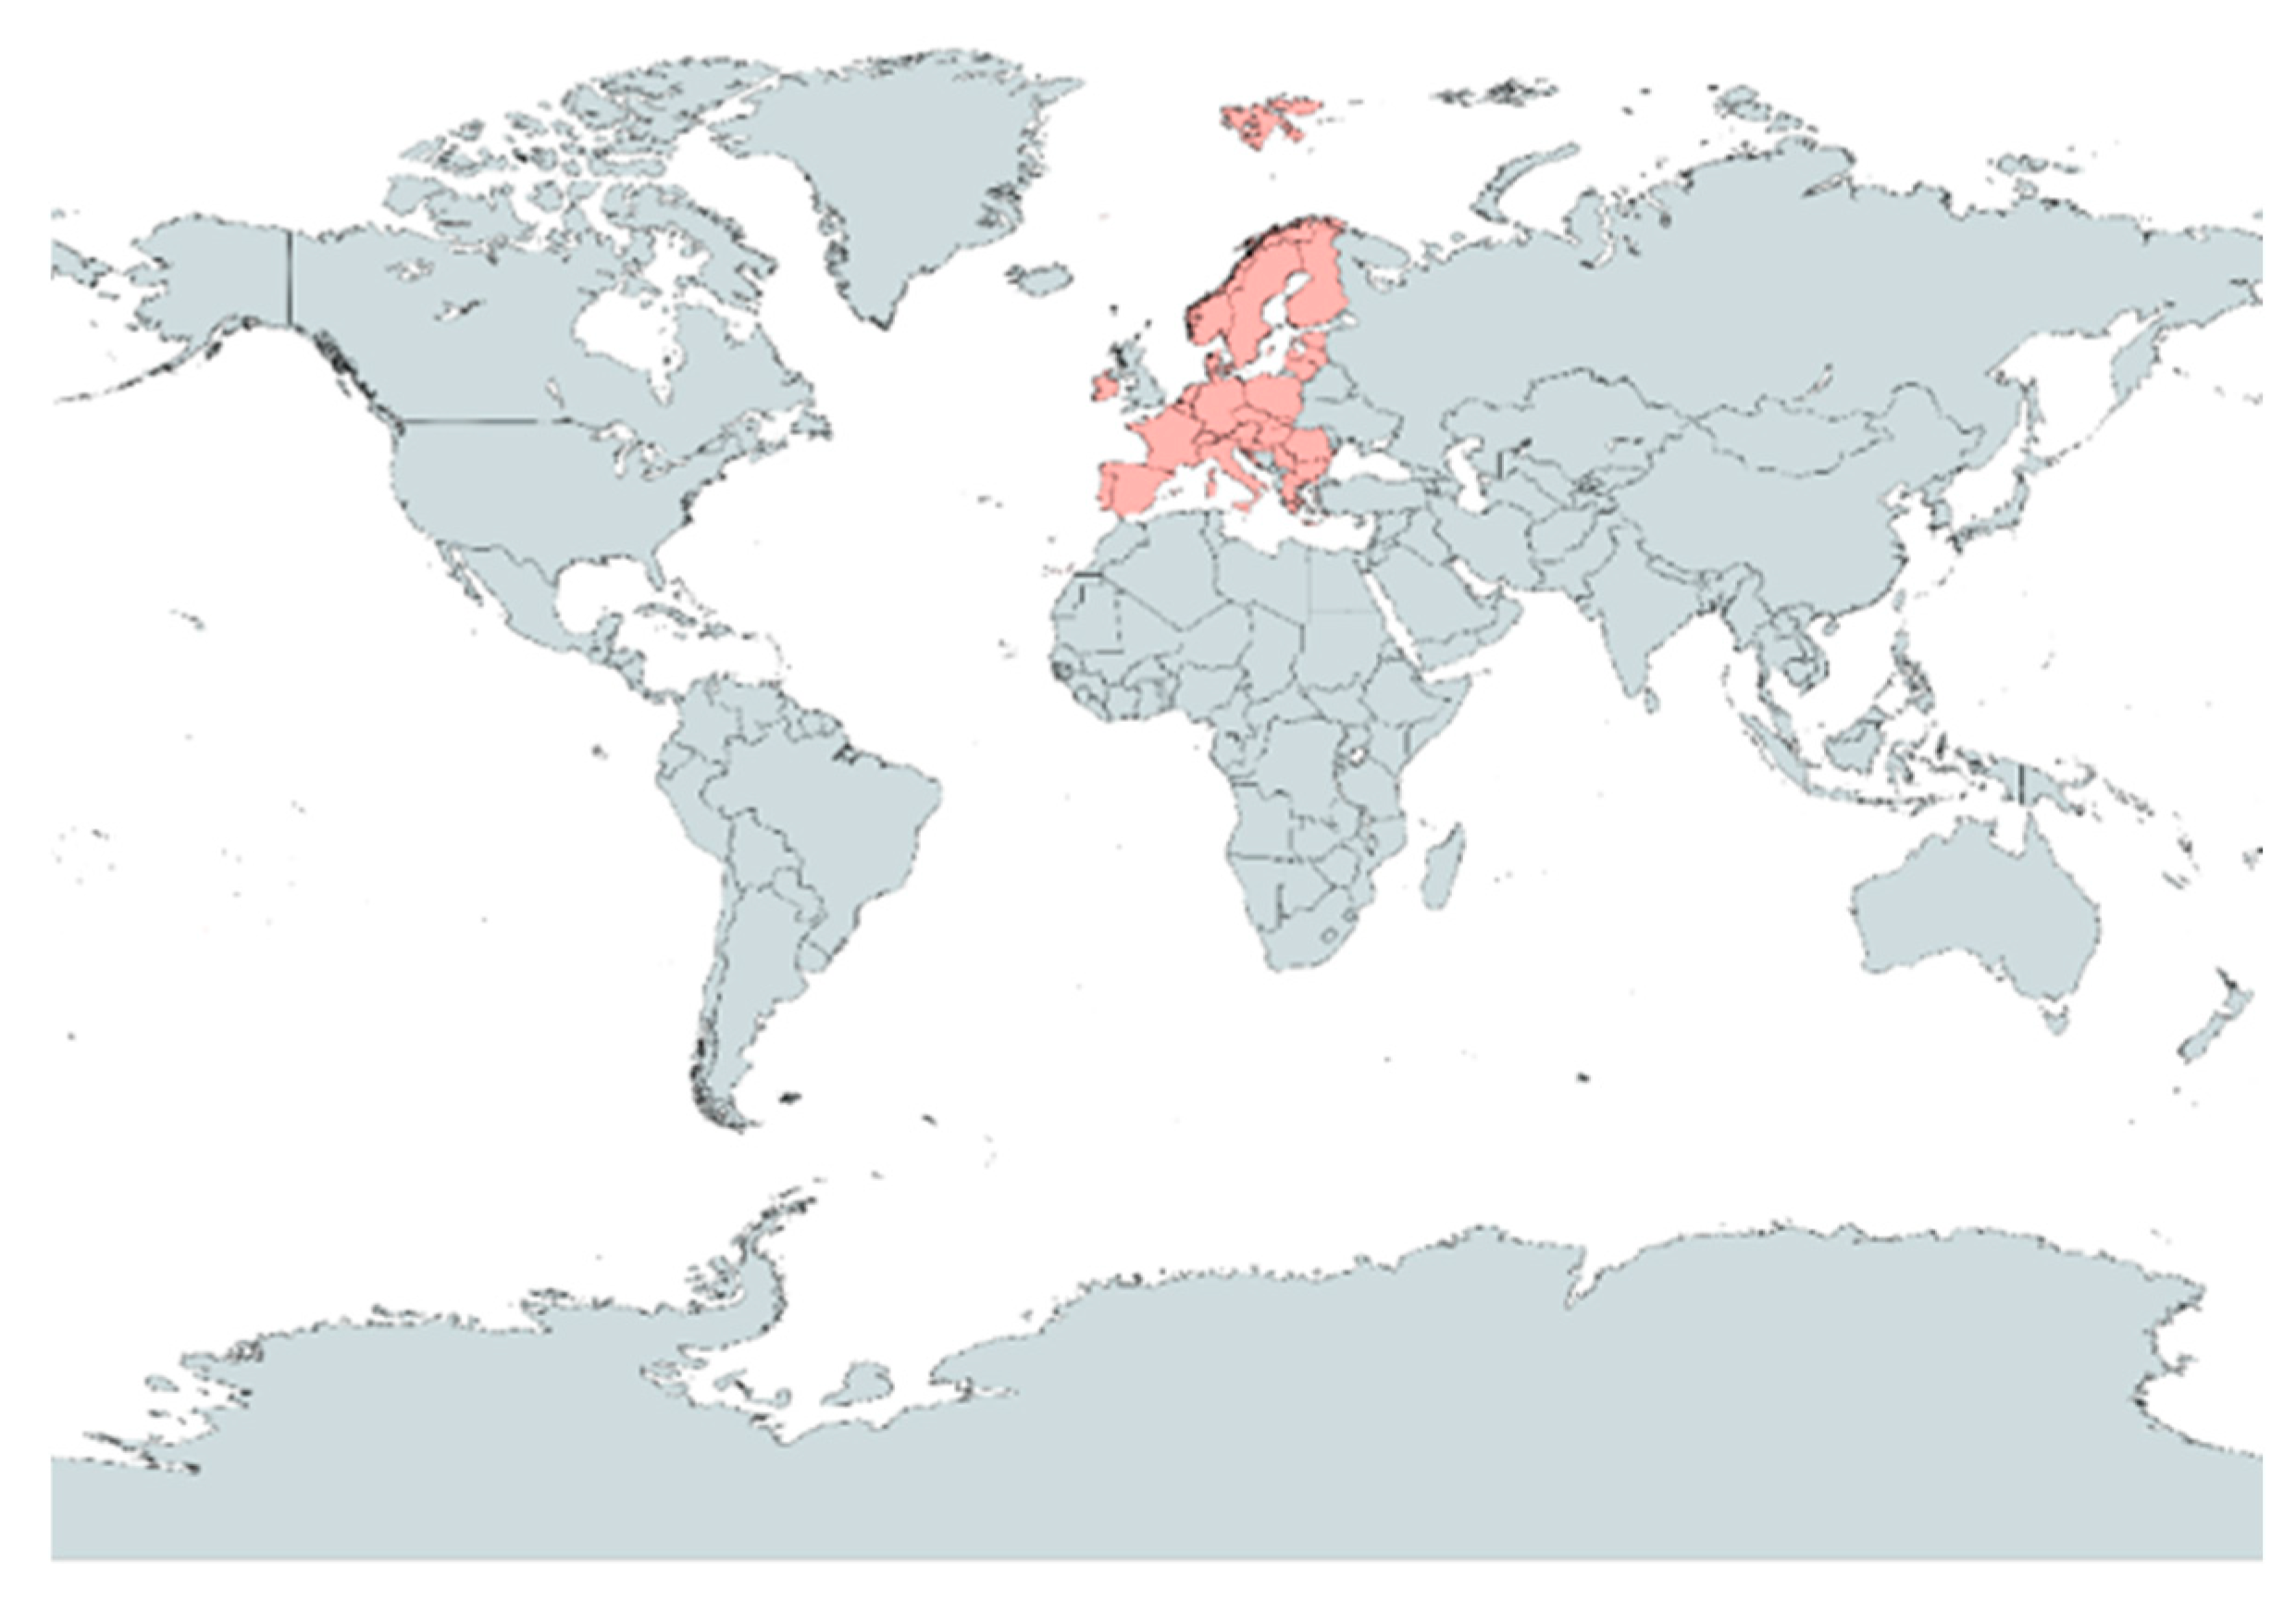
- Developed the first systematic comparative methodology for evaluating BESS-enabled energy arbitrage opportunities across 29 European electricity markets, integrating 8 years of hourly price data (2015–2023) with regulatory, economic, and supply-origin risk variables to create a holistic investment decision framework.
- Introduced and validated a standardized energy arbitrage feasibility (EAF) scoring methodology that combines normalized electricity market volatility metrics with country-specific risk factors, enabling a quantitative comparison of investment opportunities across diverse European markets through five investor-preference scenarios.
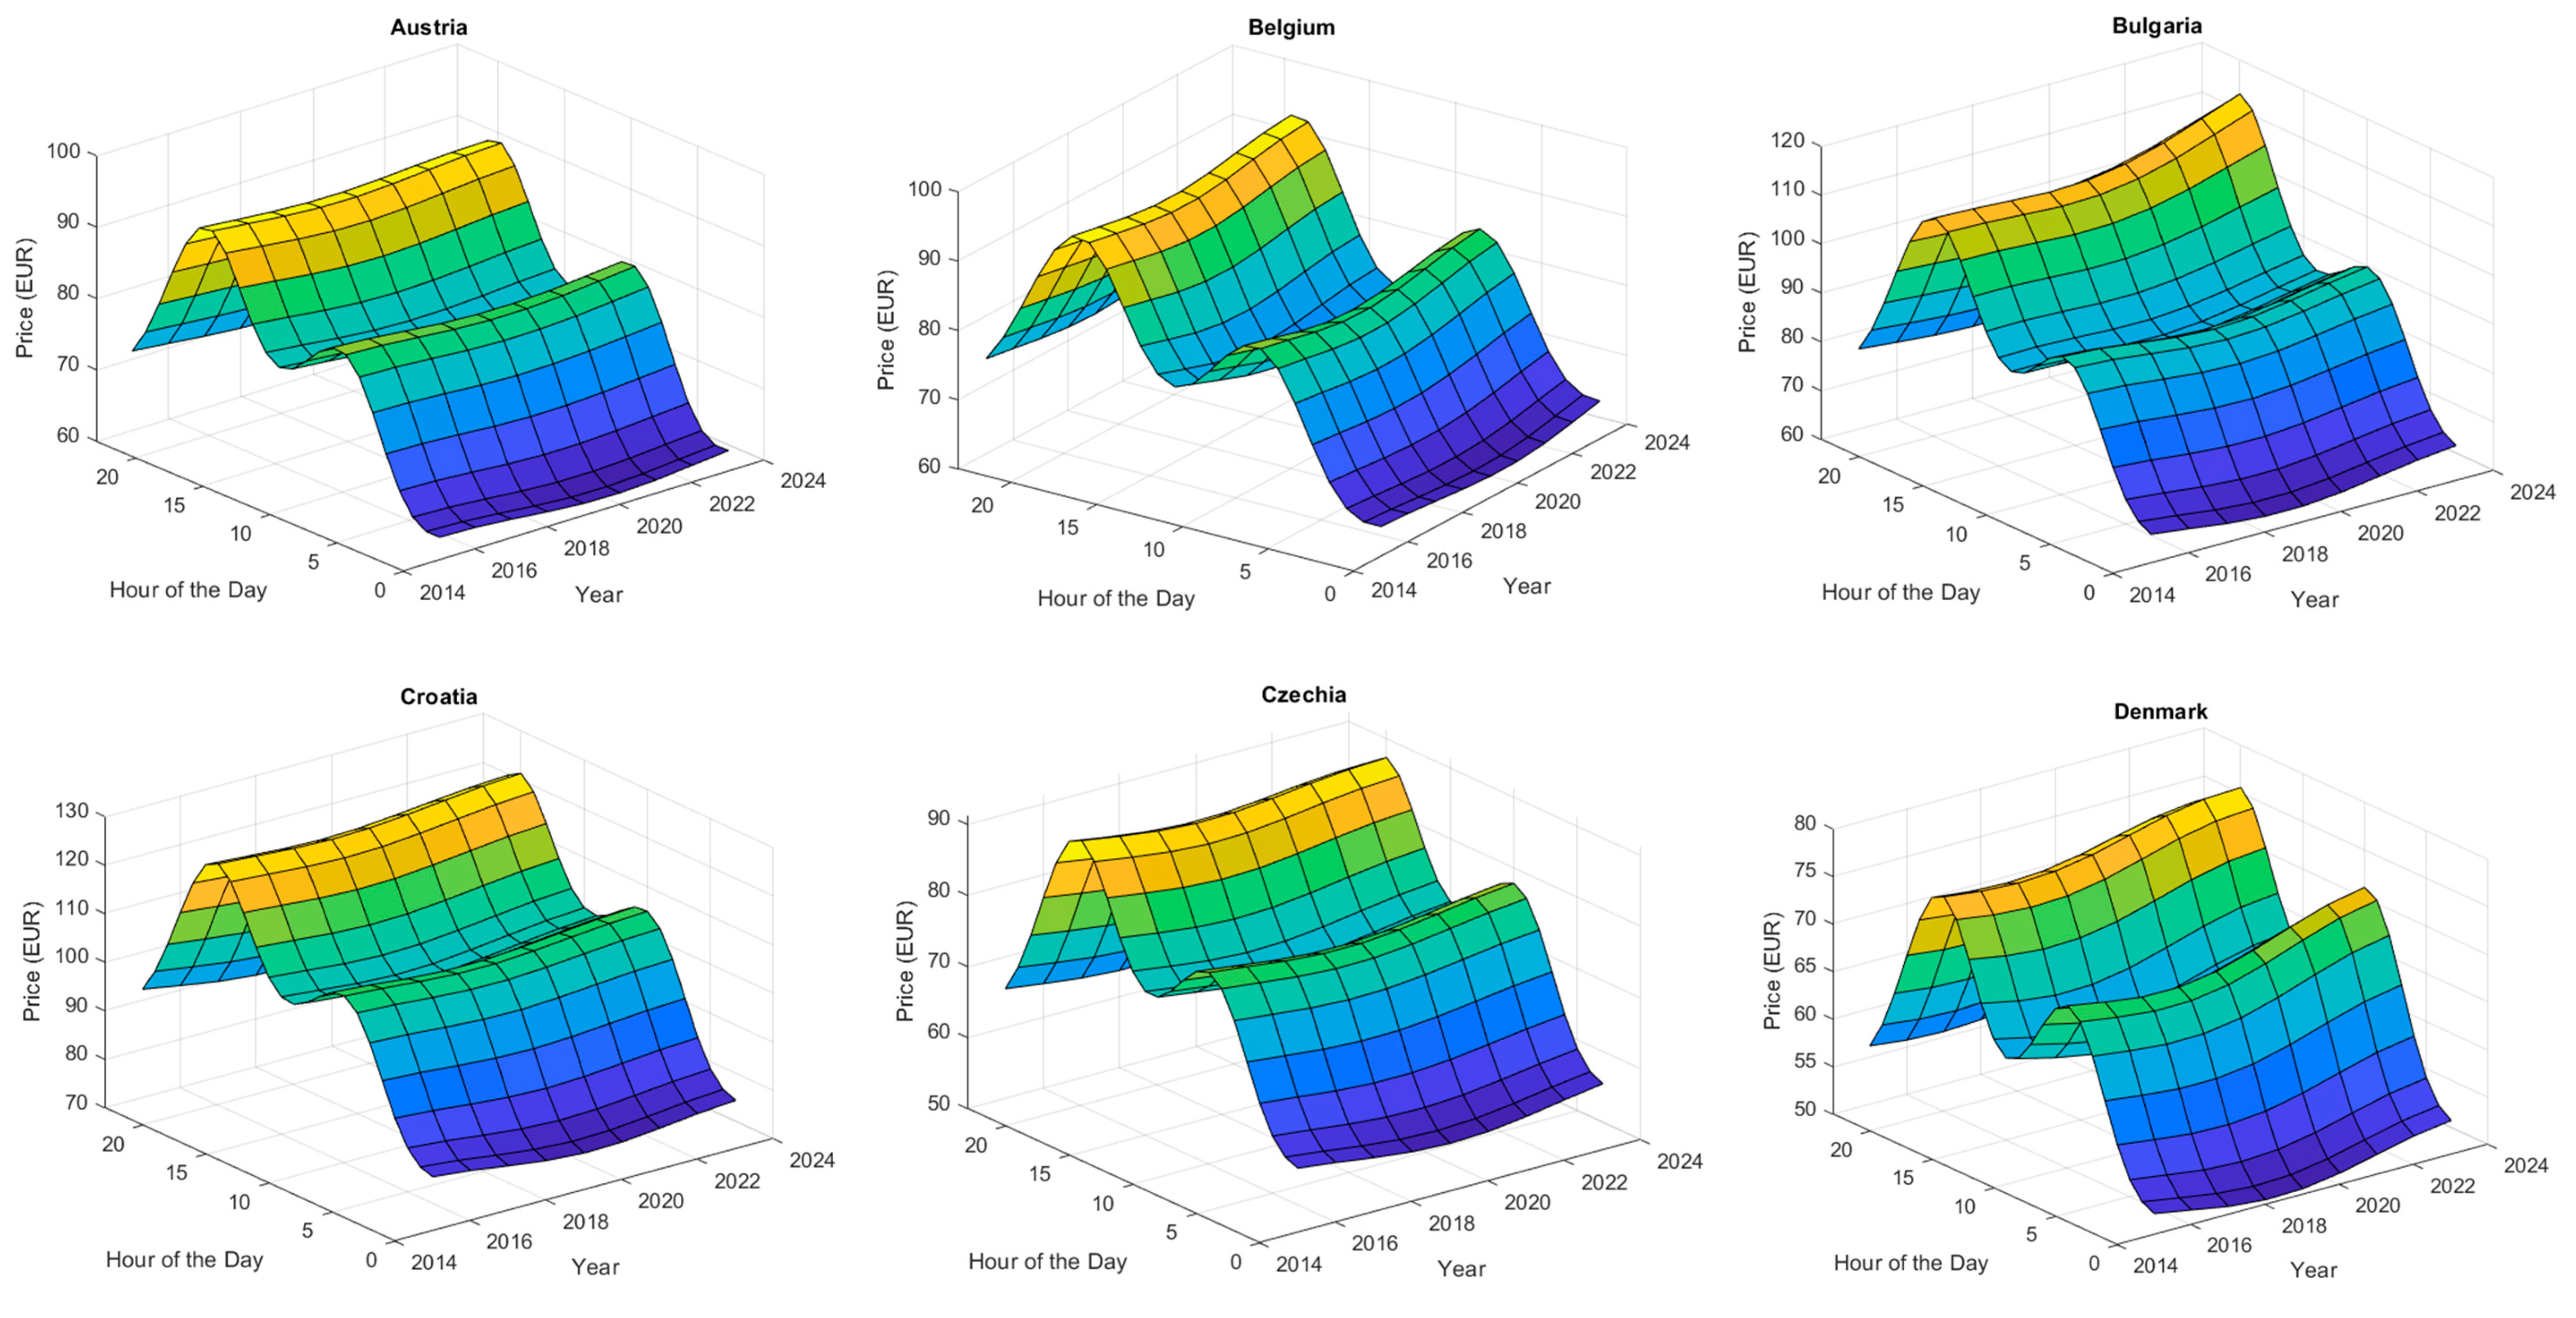
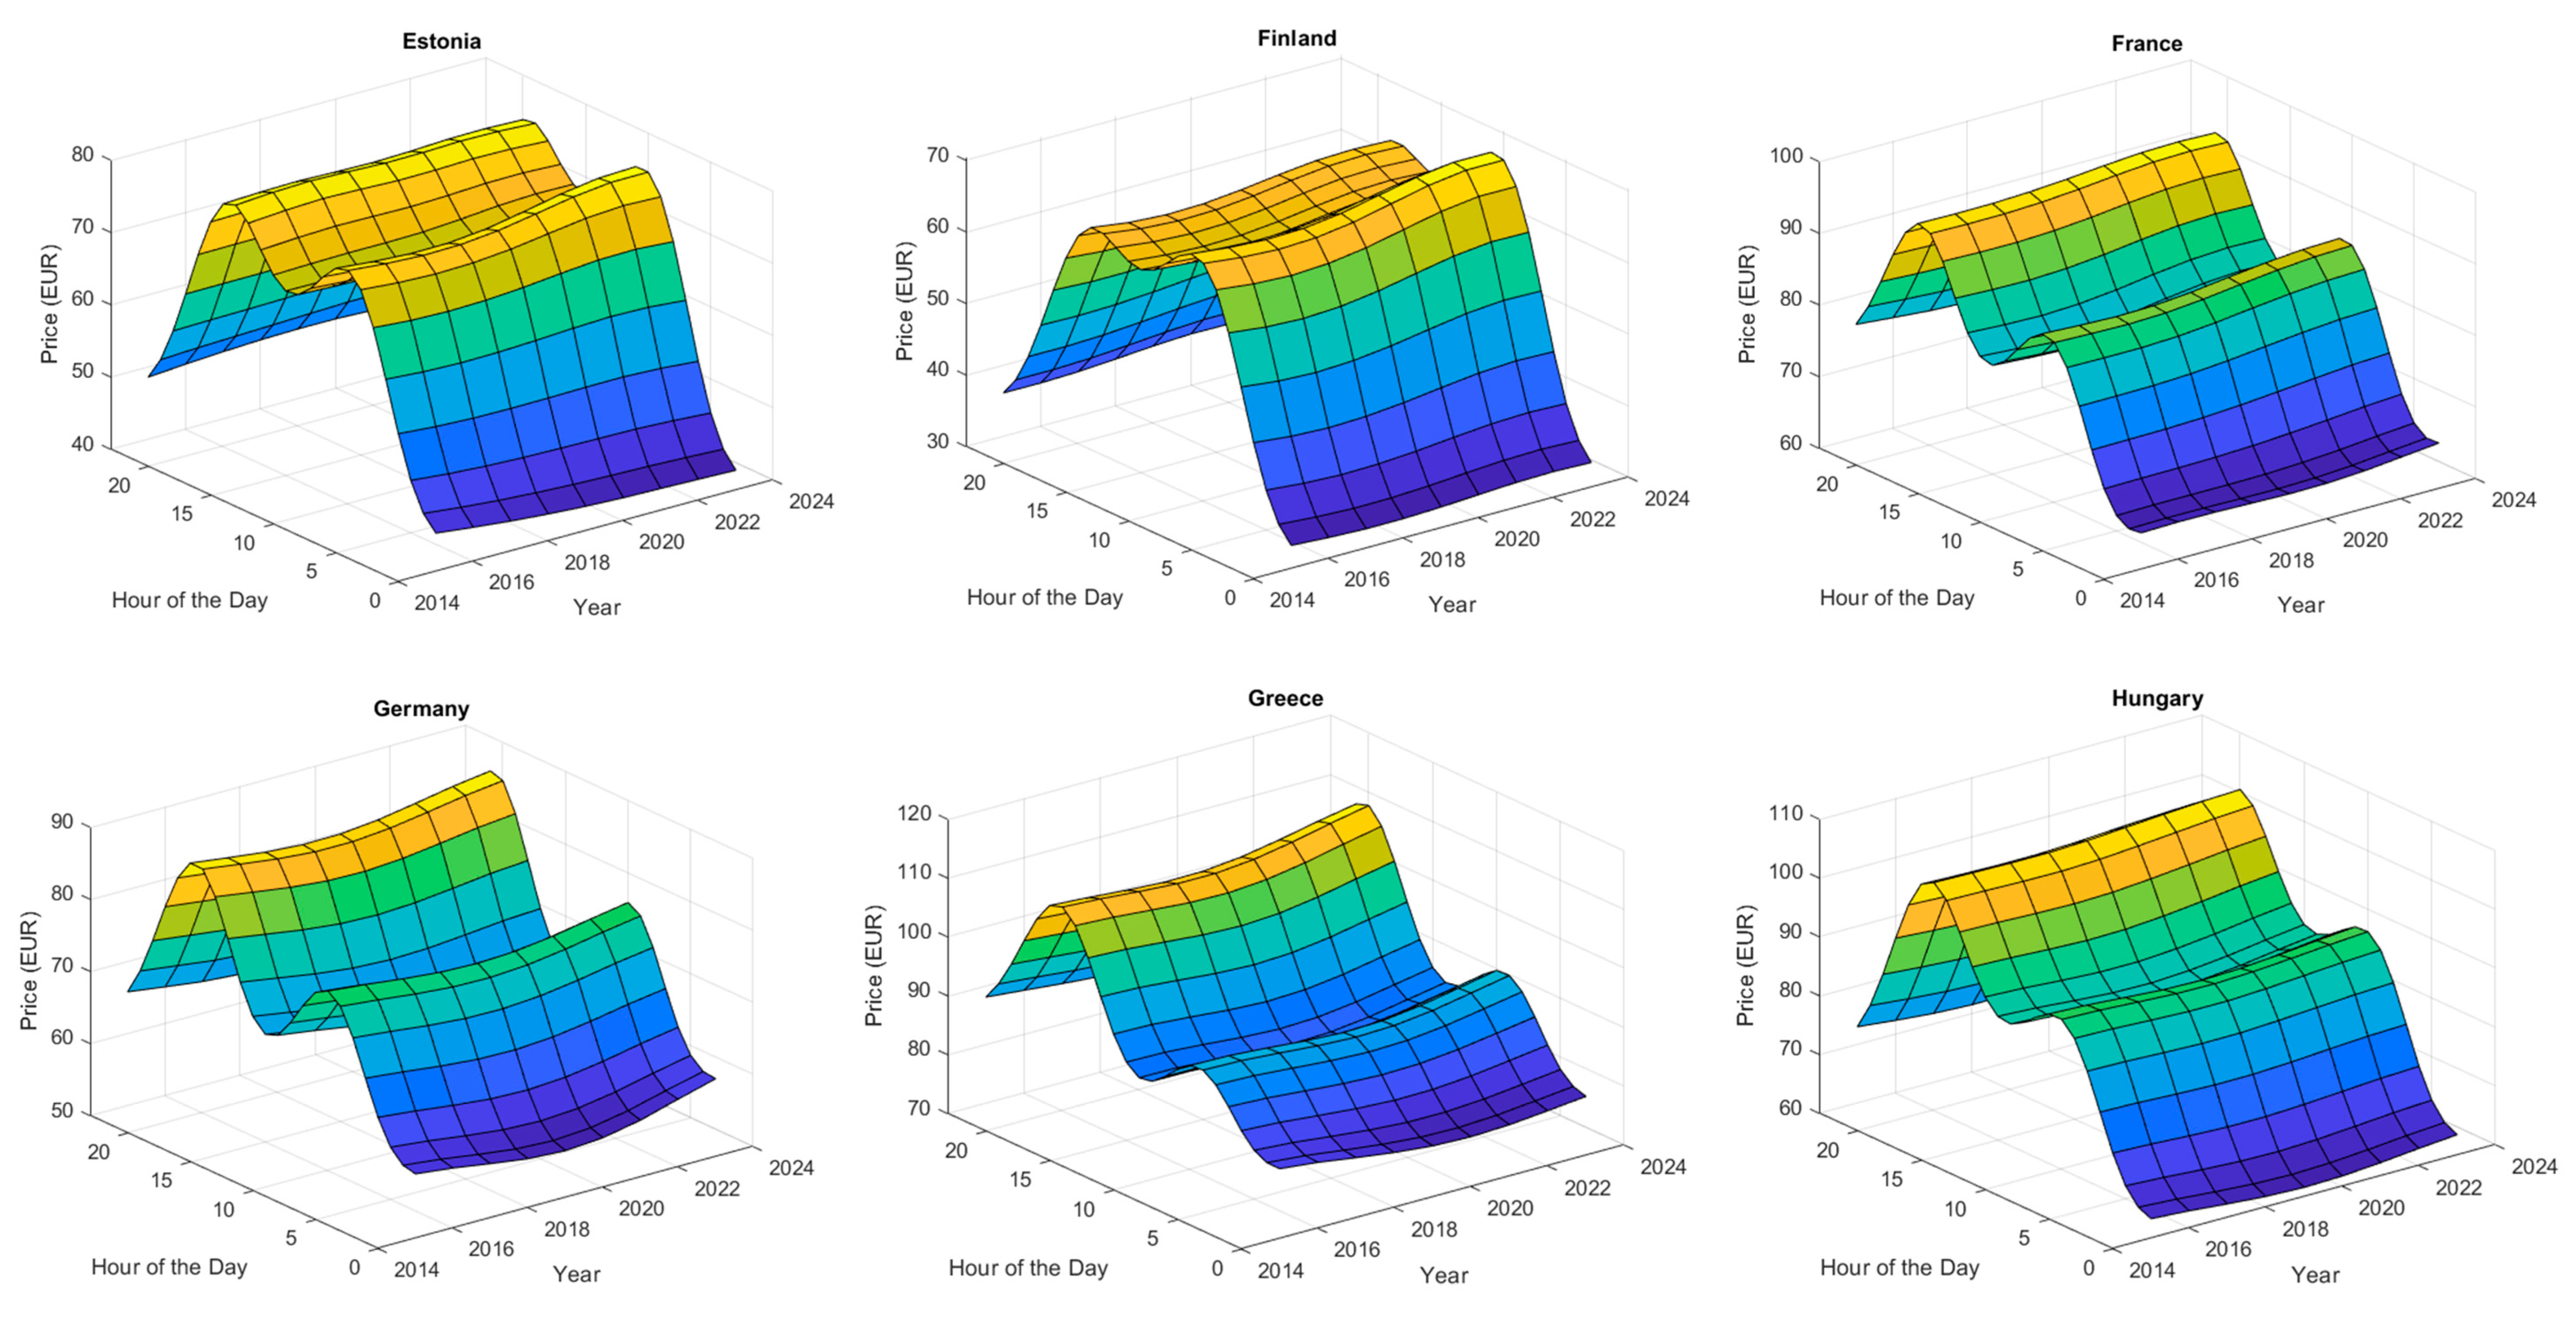
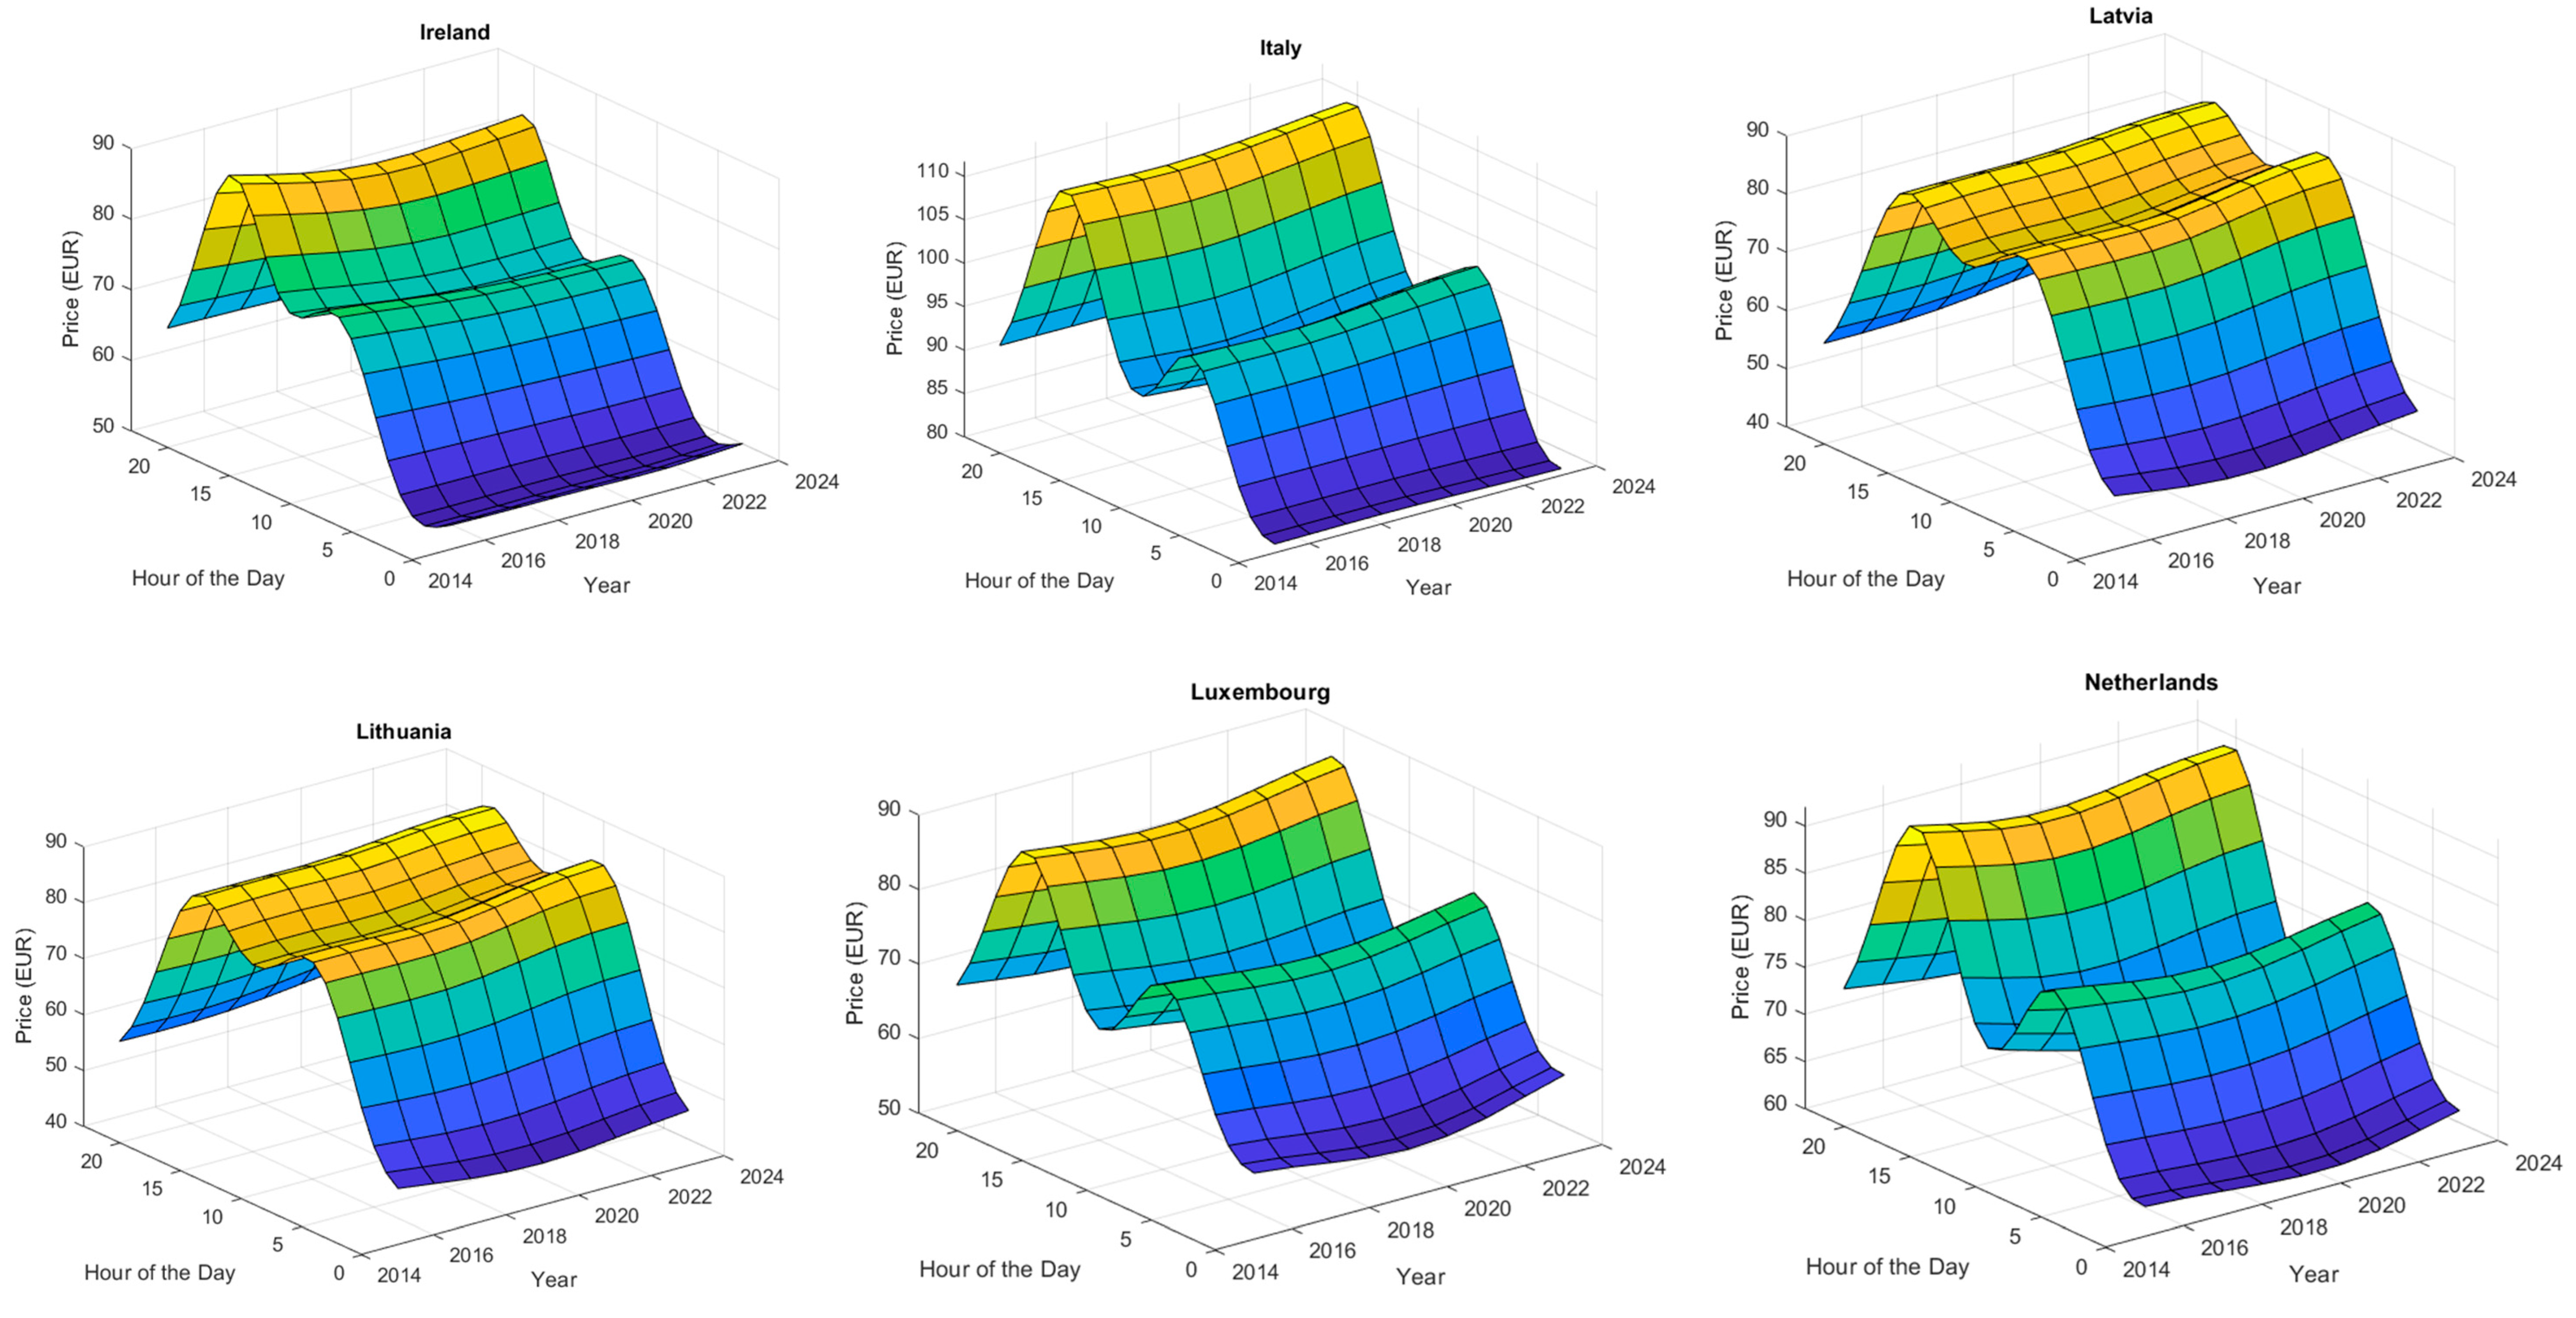
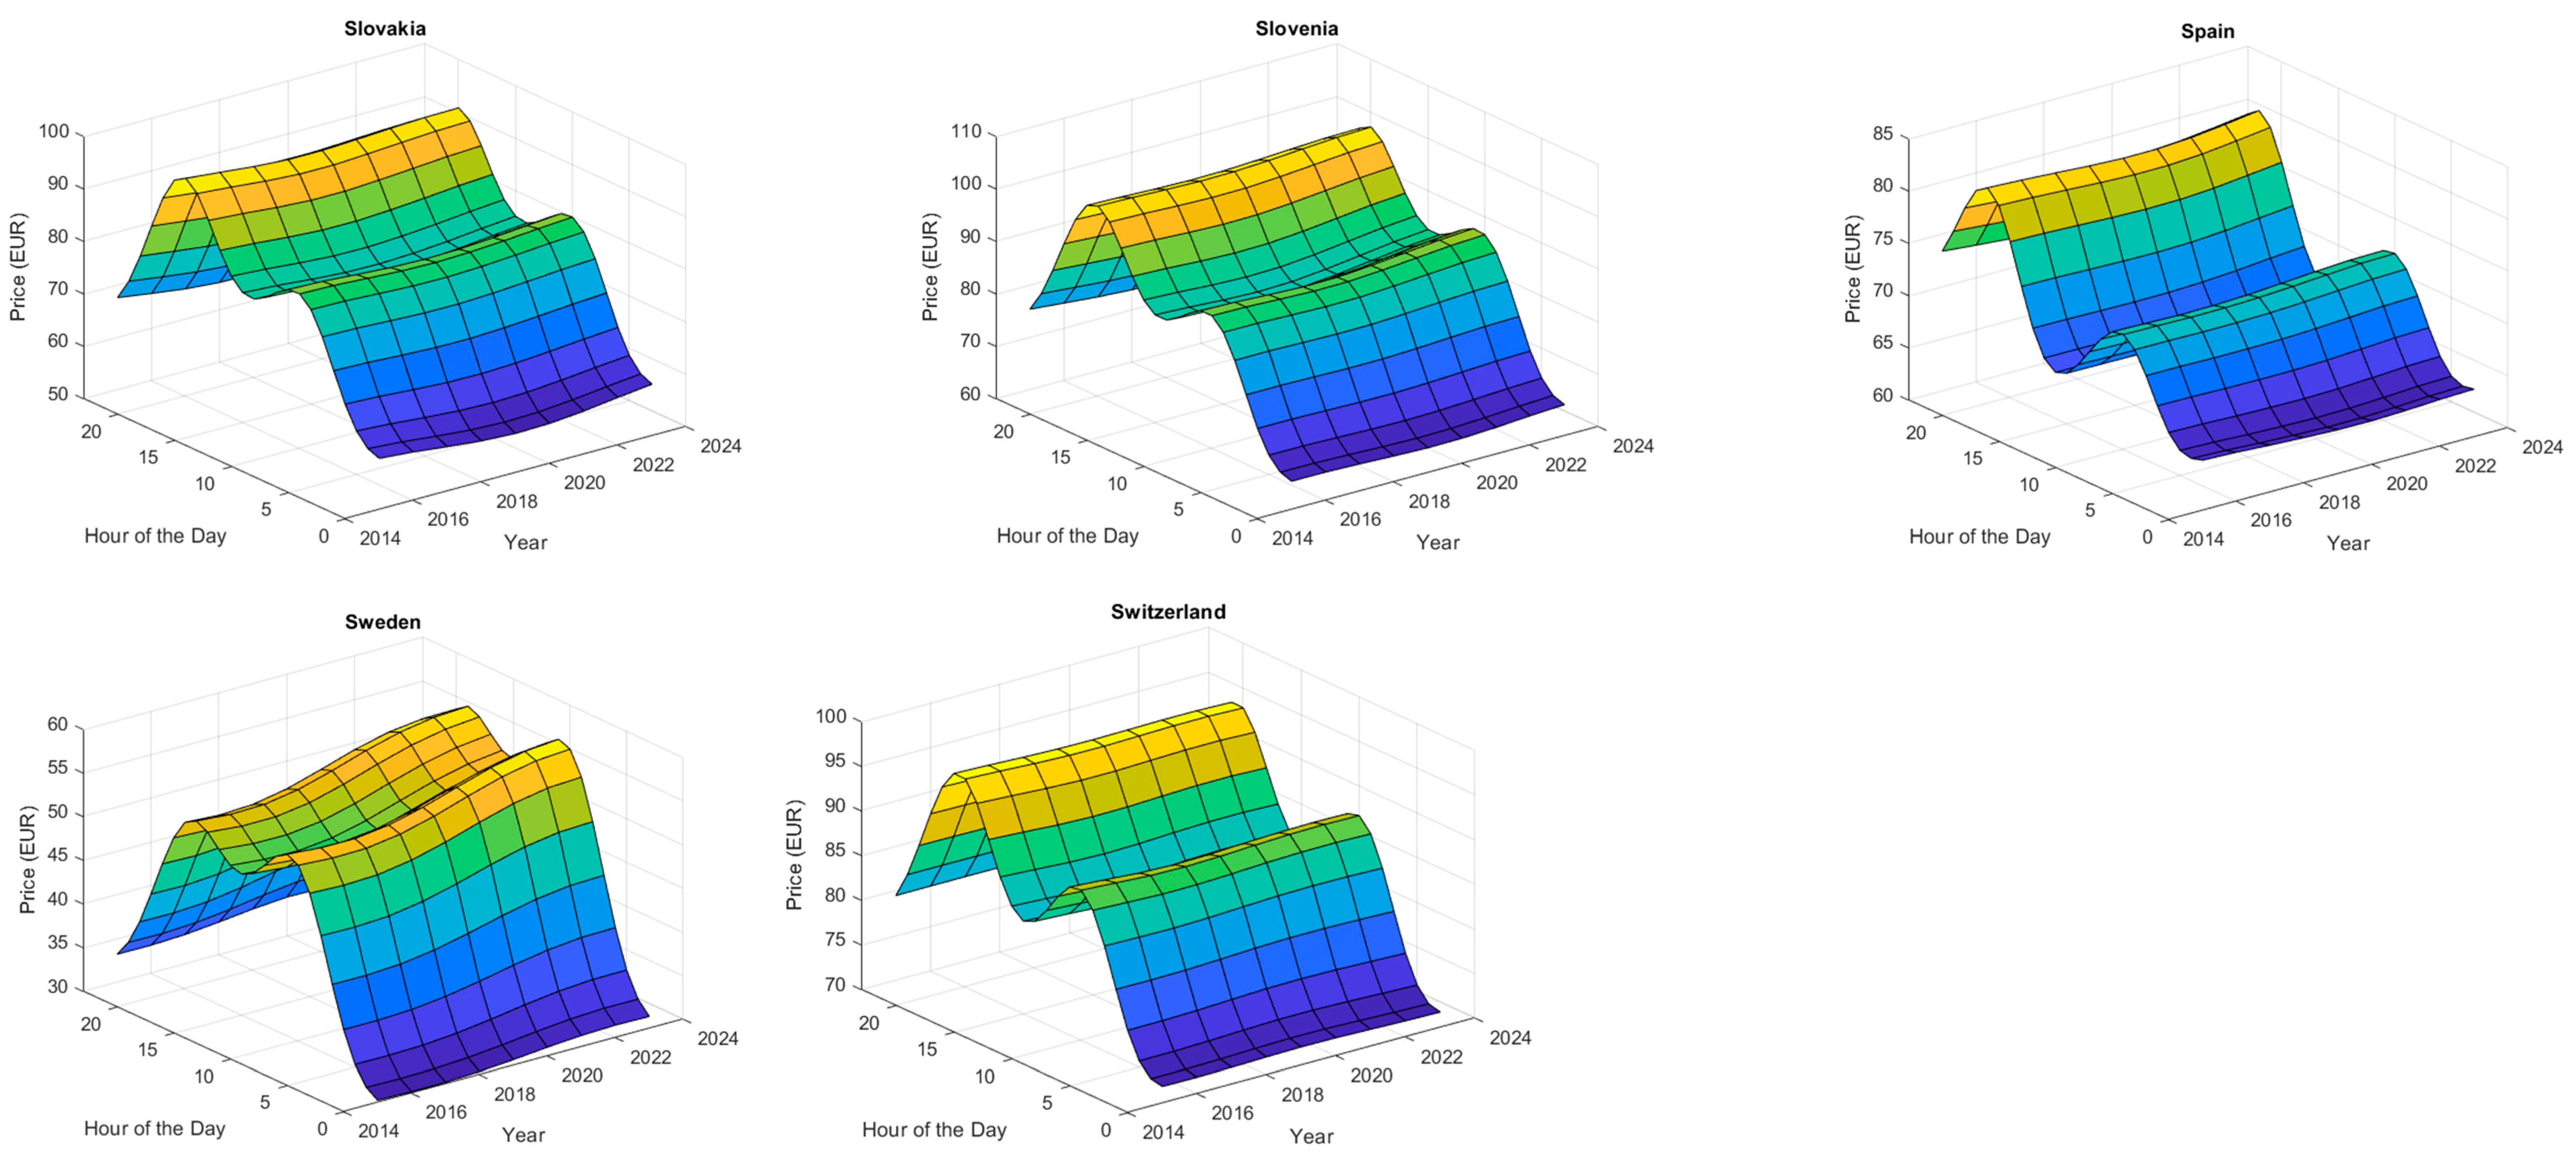
- Designed Algorithm 1 for generating investor-friendly 3D surface plots that visualize complex temporal price patterns, coupled with novel statistical metrics (including ESOR, AHPD, and ICR) specifically tailored for energy arbitrage analysis, providing actionable insights for BESS scheduling and market entry strategies.
| Algorithm 1 Three-Dimensional Surface Plot Generation Method |
|
2. Data and Methodology
2.1. Data
2.2. Methodology
2.2.1. Three-Dimensional (3D) Surface Plot
2.2.2. Measure of Central Tendency: Mean Electricity Price
- represents the average electricity price over the time period considered;
- is the electricity price at time step t;
- N is the total number of time steps over which the averaging is performed;
- t is the index of the time step, ranging from 1 to N.
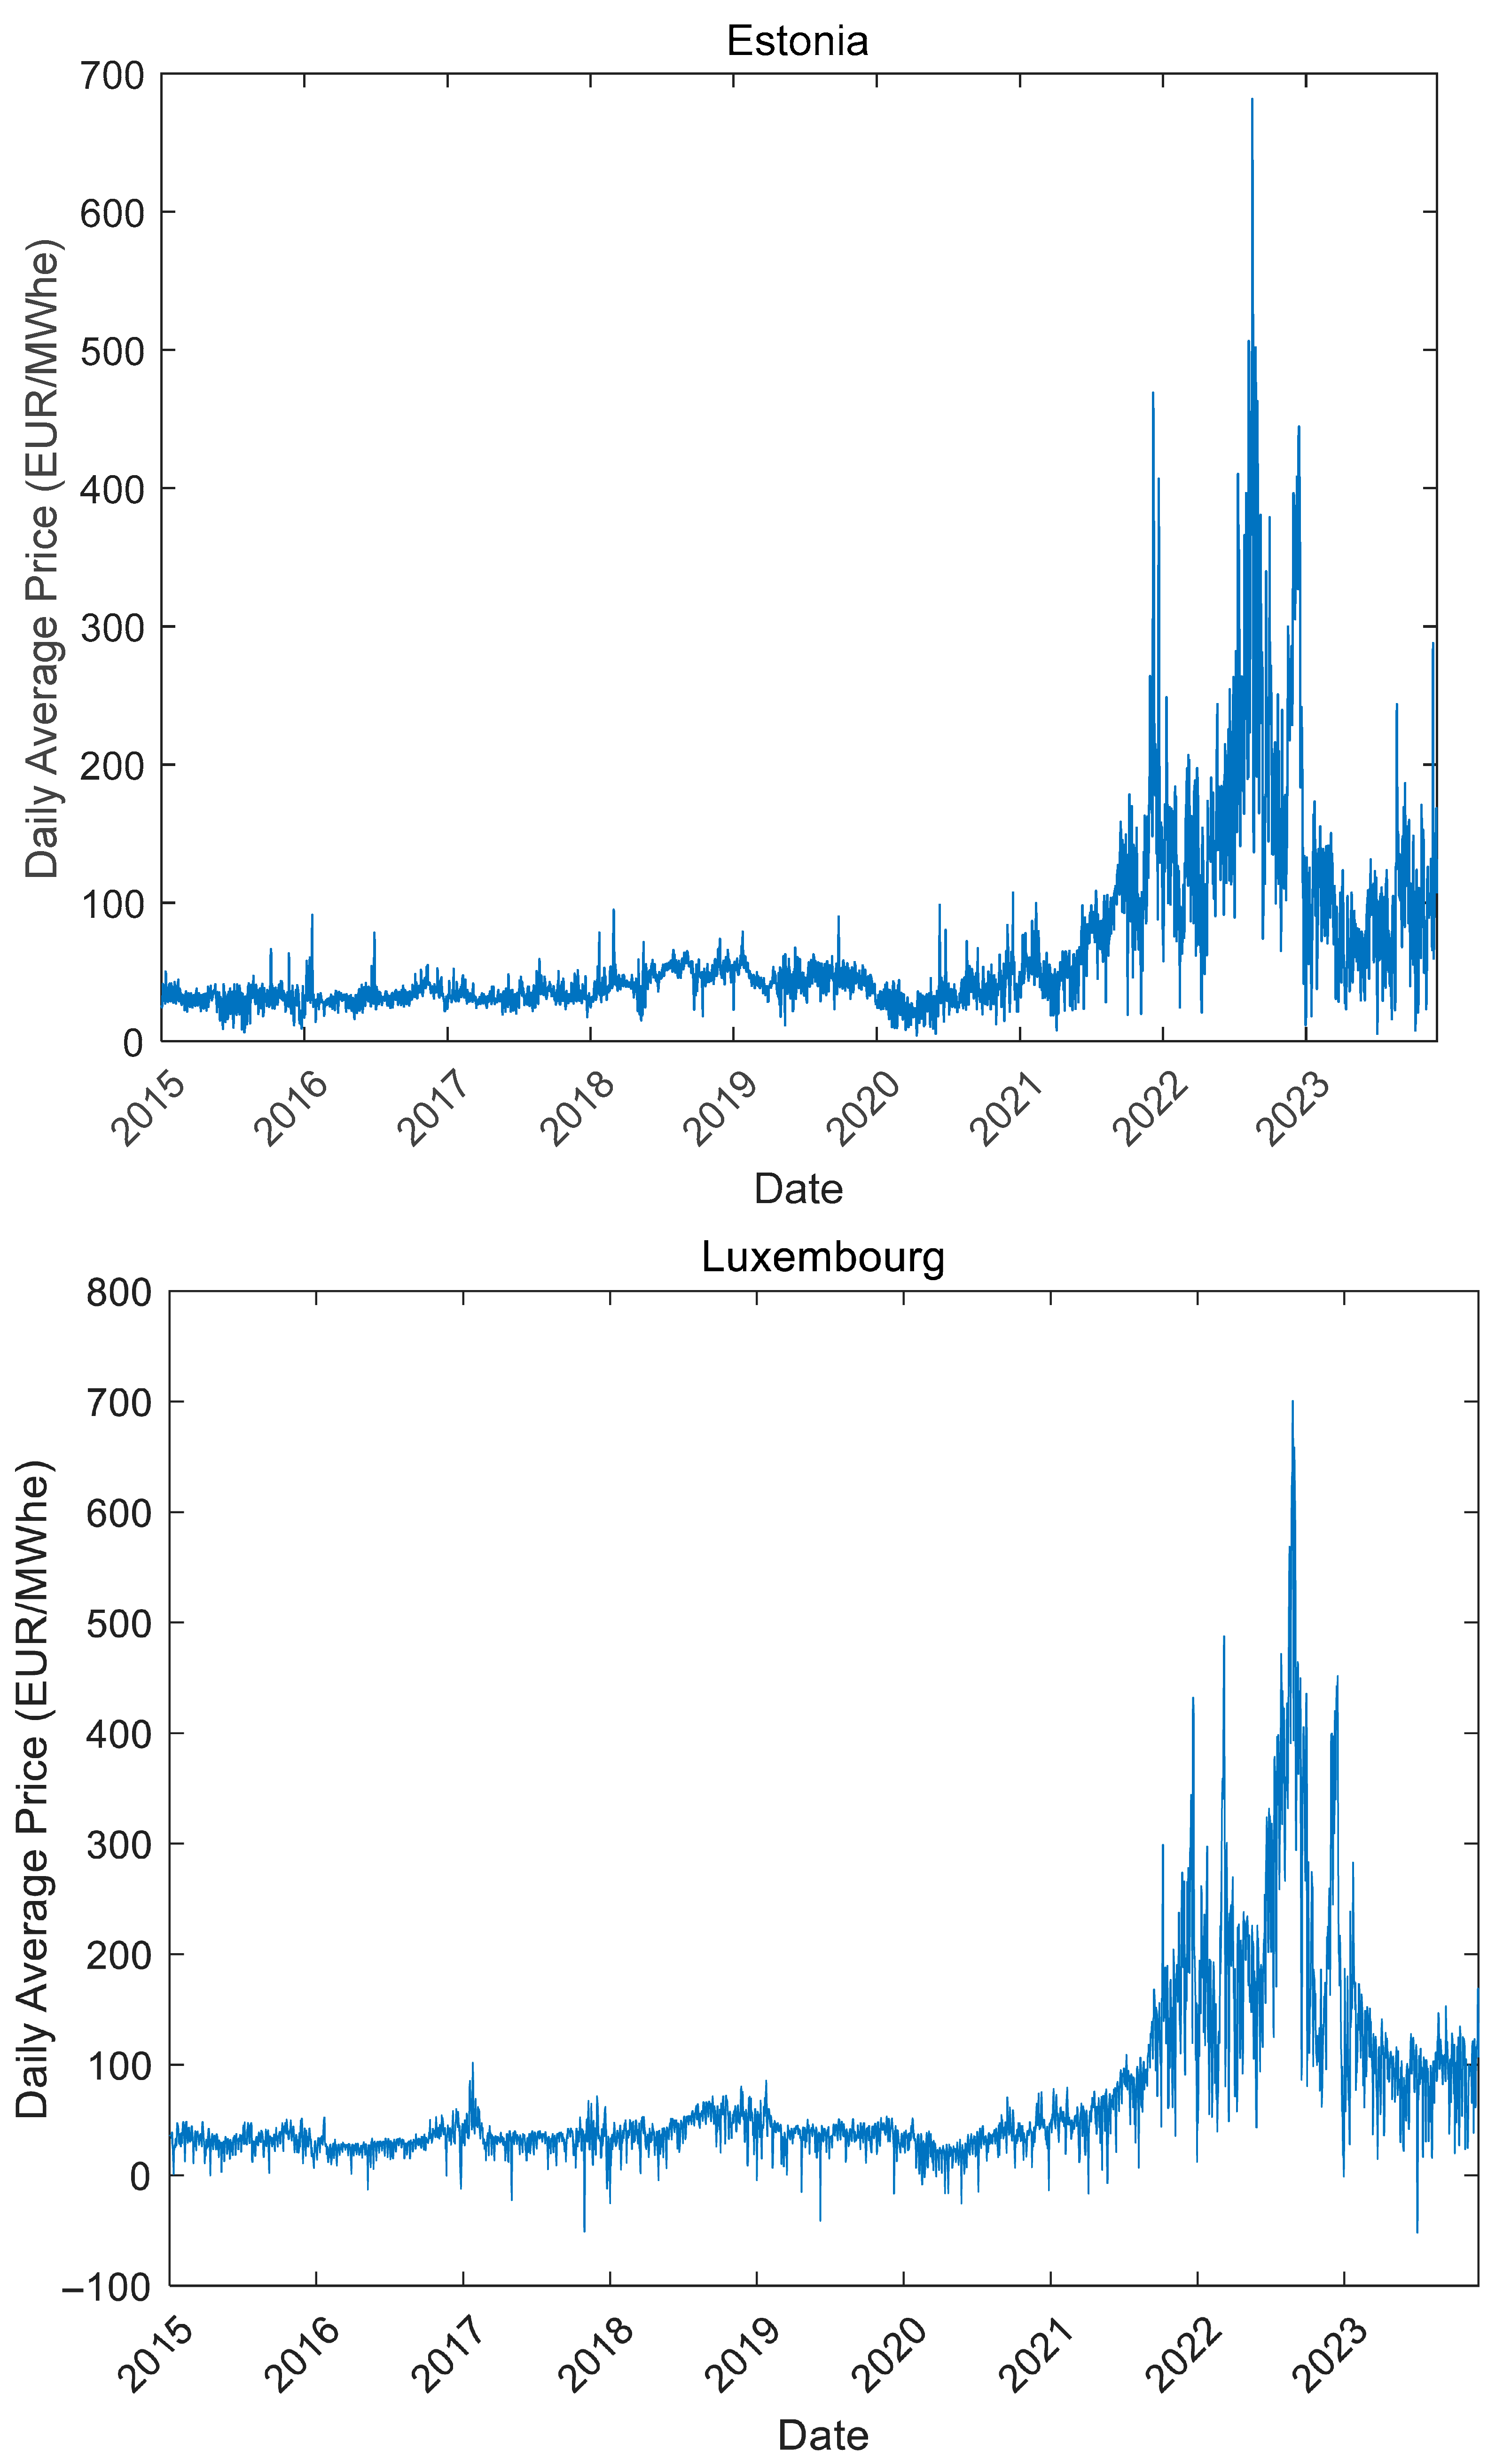
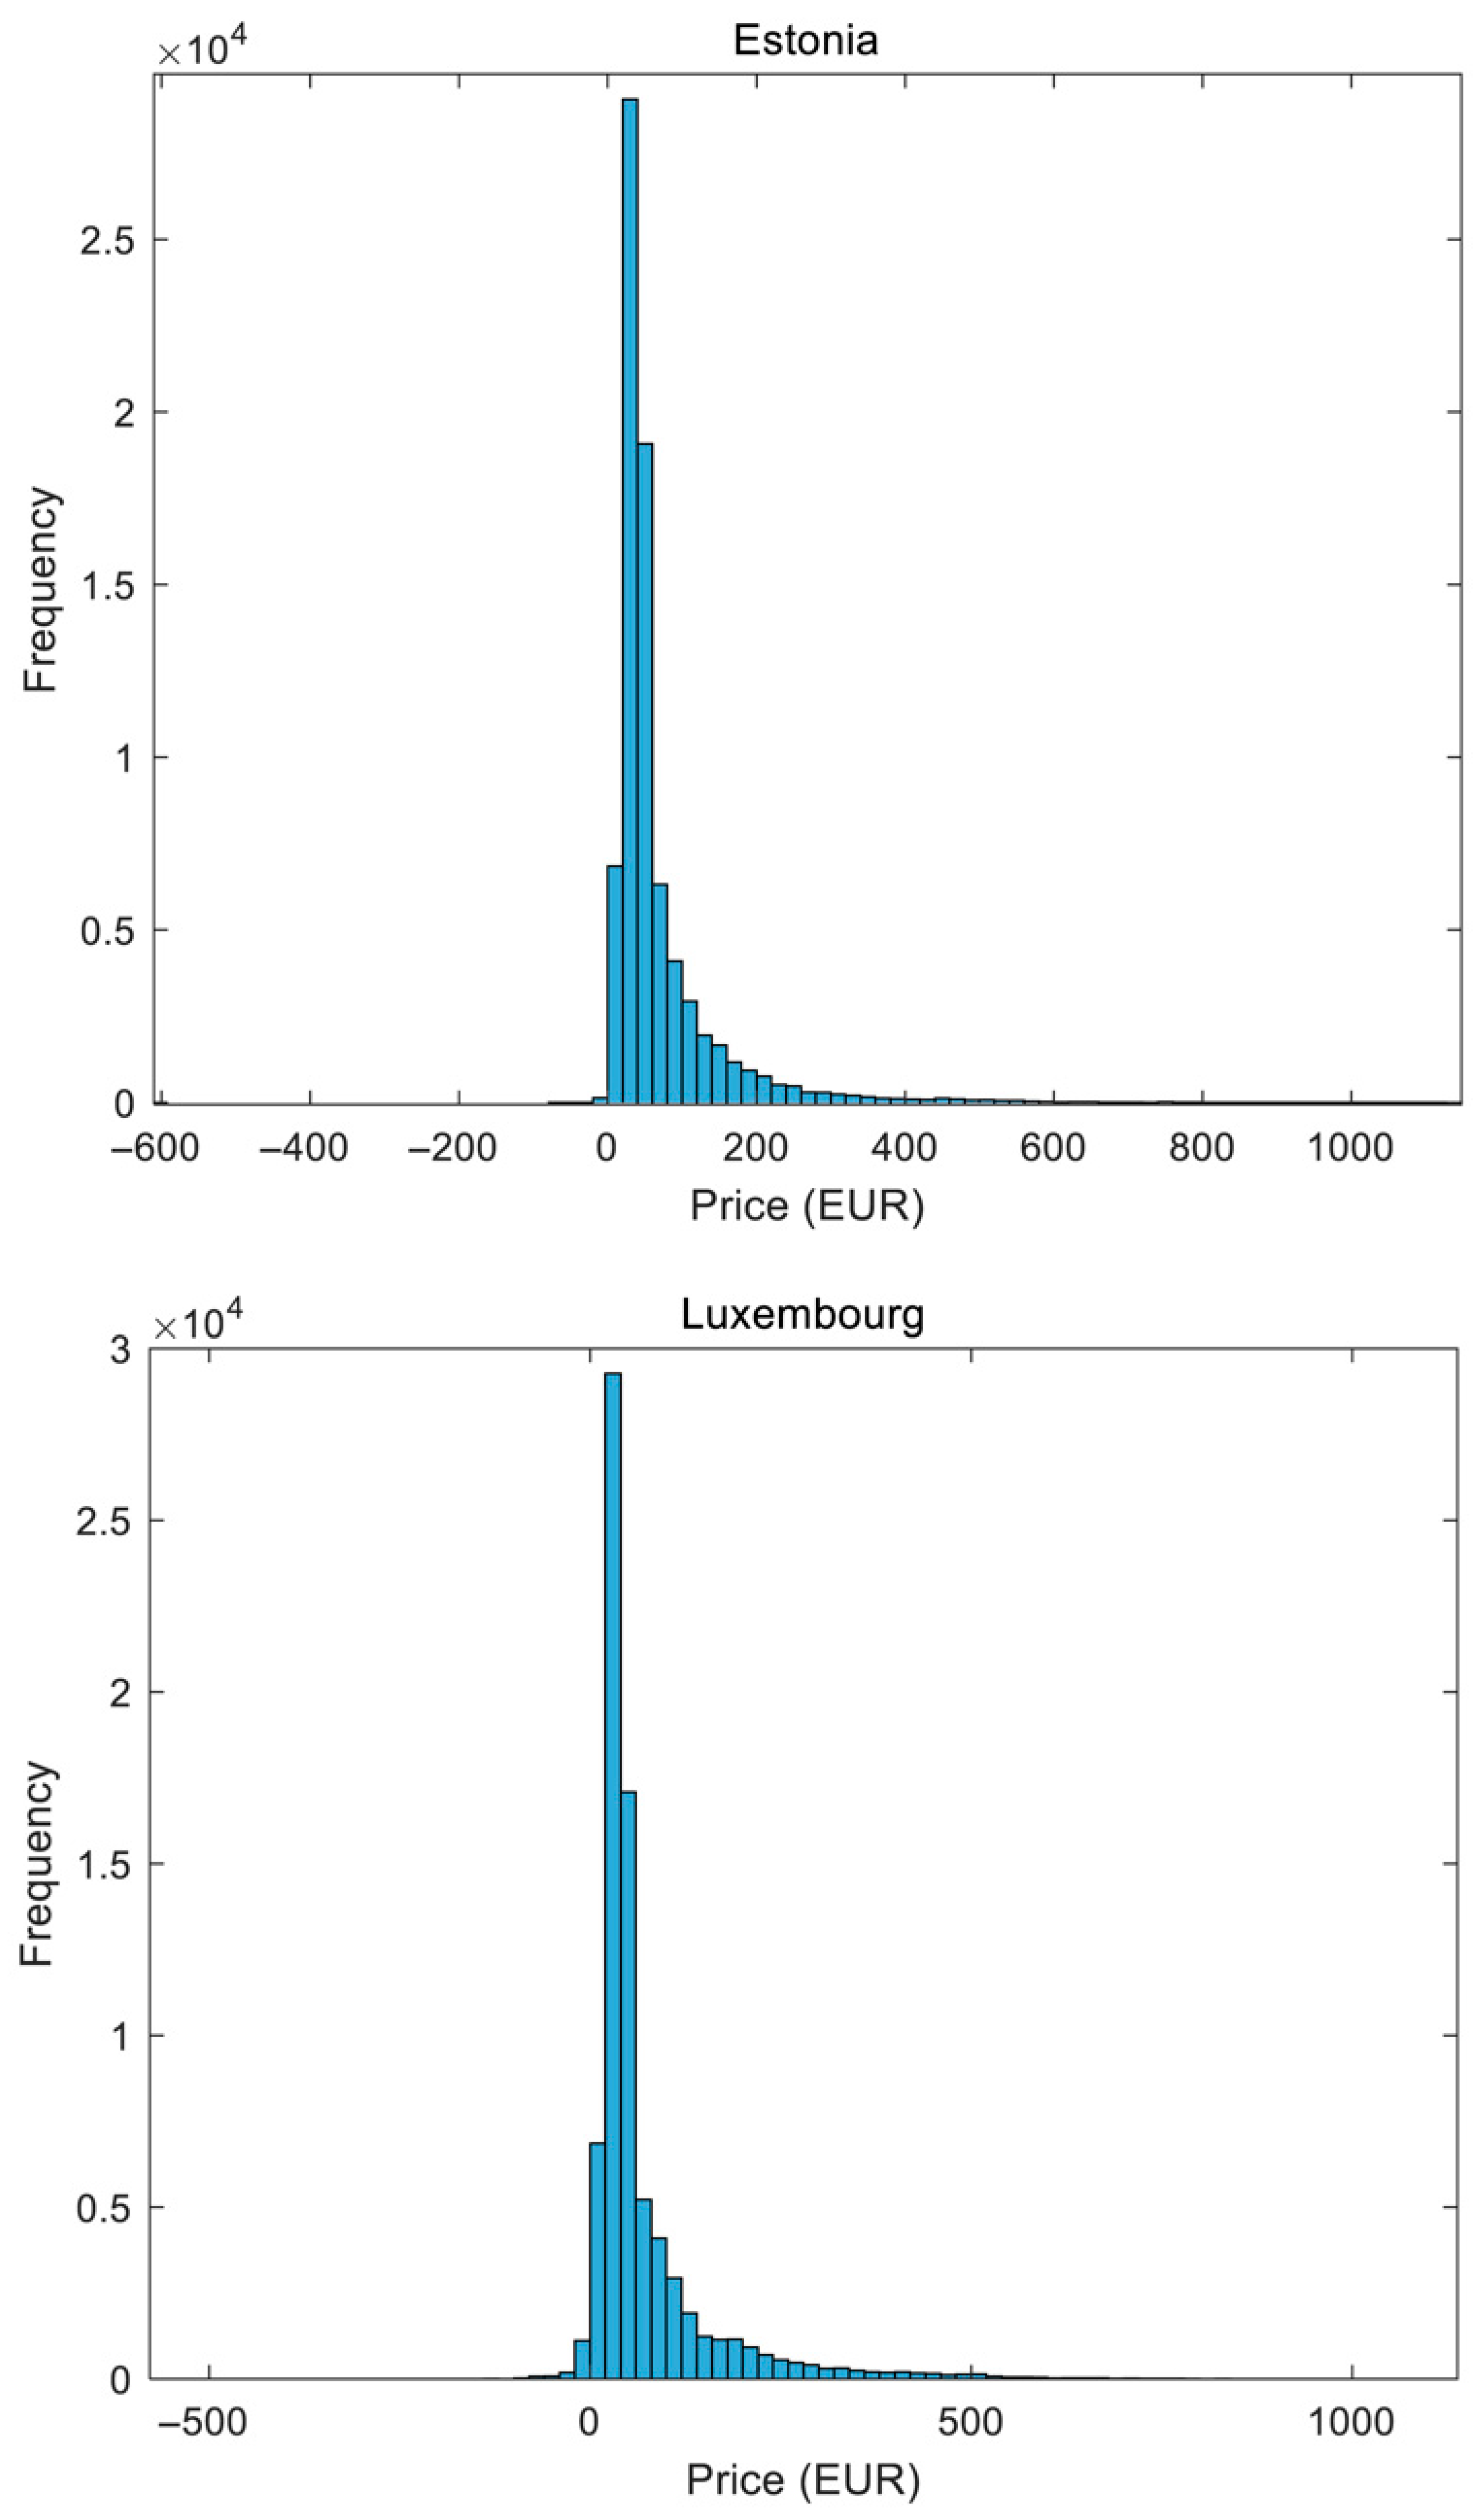
2.2.3. Hourly Electricity-Price Distribution Histogram
2.2.4. Measure of Dispersion: Hourly Price Standard Deviation
- is the standard deviation of hourly electricity prices;
- is the electricity price at time step t;
- is the mean electricity price over the entire period of dataset;
- N is the total hours covered in the hourly price dataset of each country.
2.2.5. Measure of Dispersion: Average Daily Price Range
- is the daily range of electricity prices on day d, representing the spread between the highest and lowest hourly prices within a 24-h period;
- are the hourly electricity prices offered by the grid on day d, starting from hour t through hour t + 23. These are drawn from the dataset where each Ct corresponds to a specific hourly price;
- max() represents the maximum electricity price observed within the 24-h window of day d;
- min() represents the minimum electricity price observed within the 24-h window of day d.
- is the average daily range of electricity prices over the full dataset, providing a measure of the typical intra-day price spread across all days;
- is the daily range of electricity prices for day d, defined as the difference between the maximum and minimum hourly prices within that day;
- D is the total number of days covered in the hourly electricity price dataset for a given country;
- is the cumulative daily price range summed over all days d = 1 to D.
2.2.6. Measure of Asymmetry: Skewness of Hourly Price Distribution
- is the skewness of the hourly electricity price distribution for a country, measuring the asymmetry of the price distribution around its mean;
- is the hourly electricity price offered by the grid at time-index t;
- is the mean electricity price over the entire observation horizon;
- is the standard deviation of hourly electricity prices, capturing the spread of the price distribution;
- N is the total number of hourly observations in the electricity price dataset;
- is the third central moment, which evaluates the tendency of the distribution to deviate to the left (negative skew) or right (positive skew) of the mean;
- is used as the Bessel correction to ensure an unbiased estimate in sample statistics.
2.2.7. Measure of Asymmetry: Kurtosis of Hourly Price Distribution
- is kurtosis of the hourly electricity price distribution, measuring the “tailedness” or extremity of price fluctuations relative to a normal distribution;
- is the hourly electricity price offered by the grid at time-index t;
- is the mean electricity price over the entire observation horizon;
- is the standard deviation of hourly electricity prices;
- N is the total number of hourly observations in the electricity price dataset;
- is the fourth central moment, quantifying the weight of extreme deviations in the price distribution;
- is used as the Bessel correction to ensure an unbiased estimate in sample statistics.
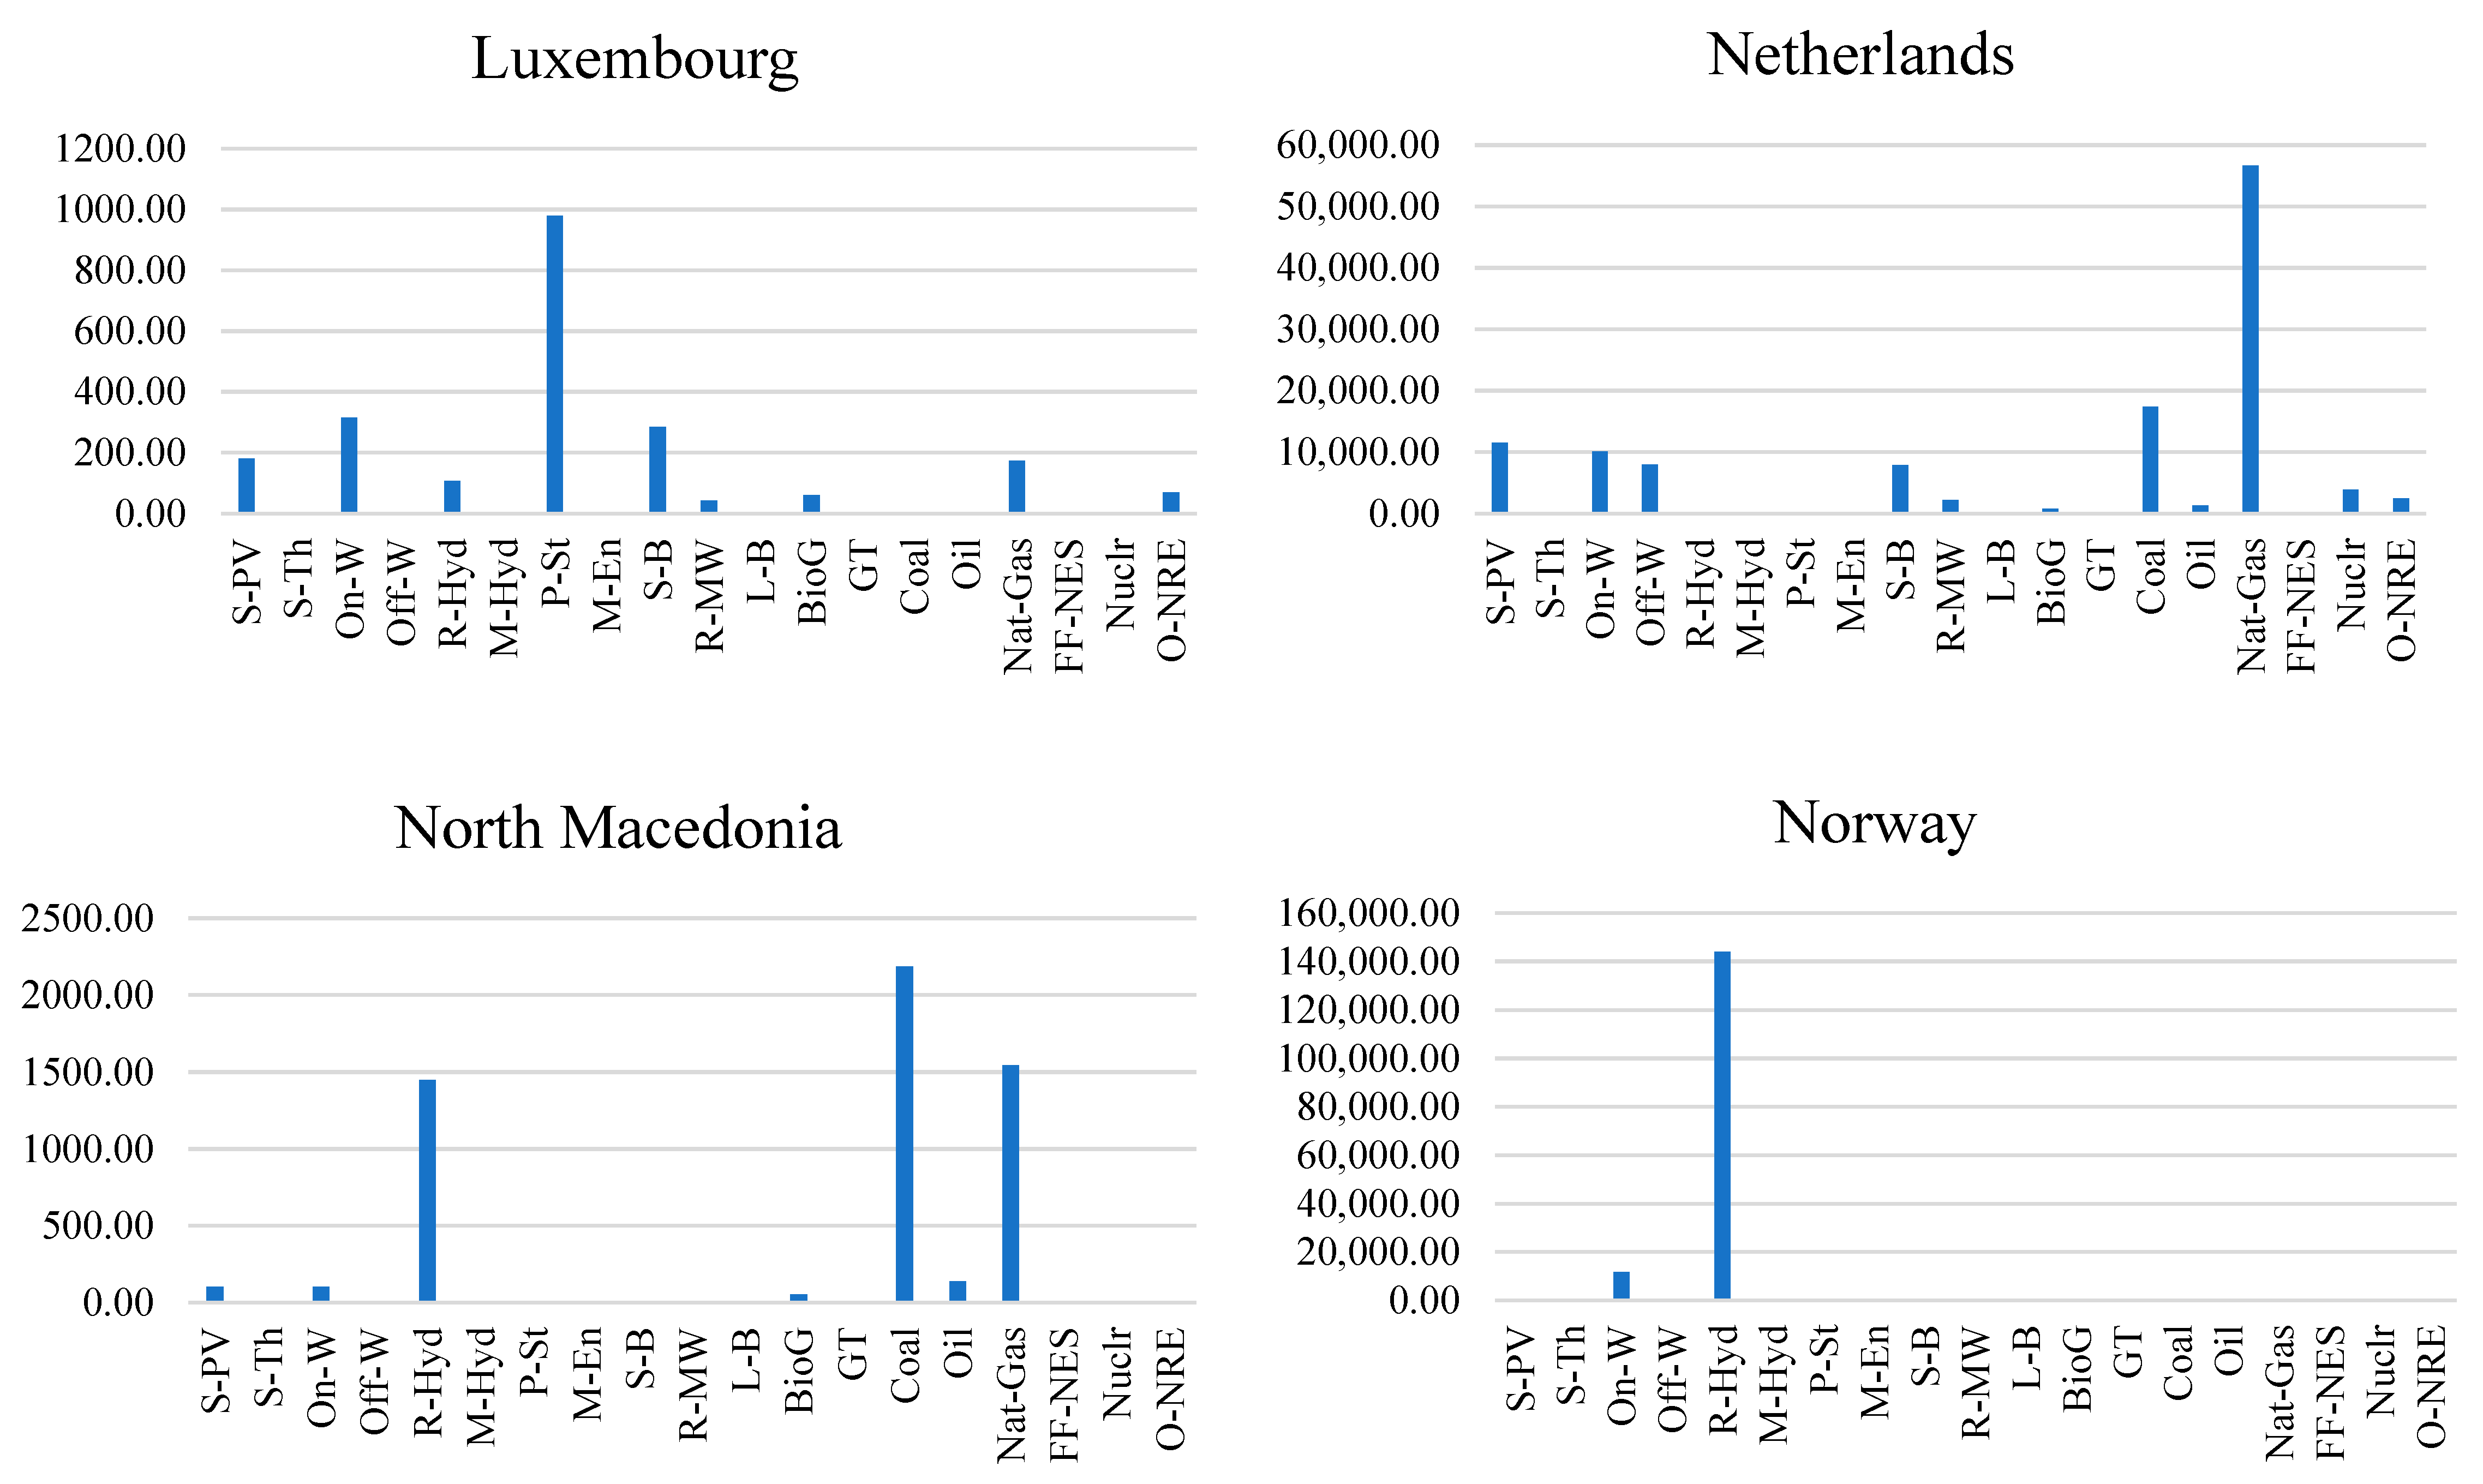
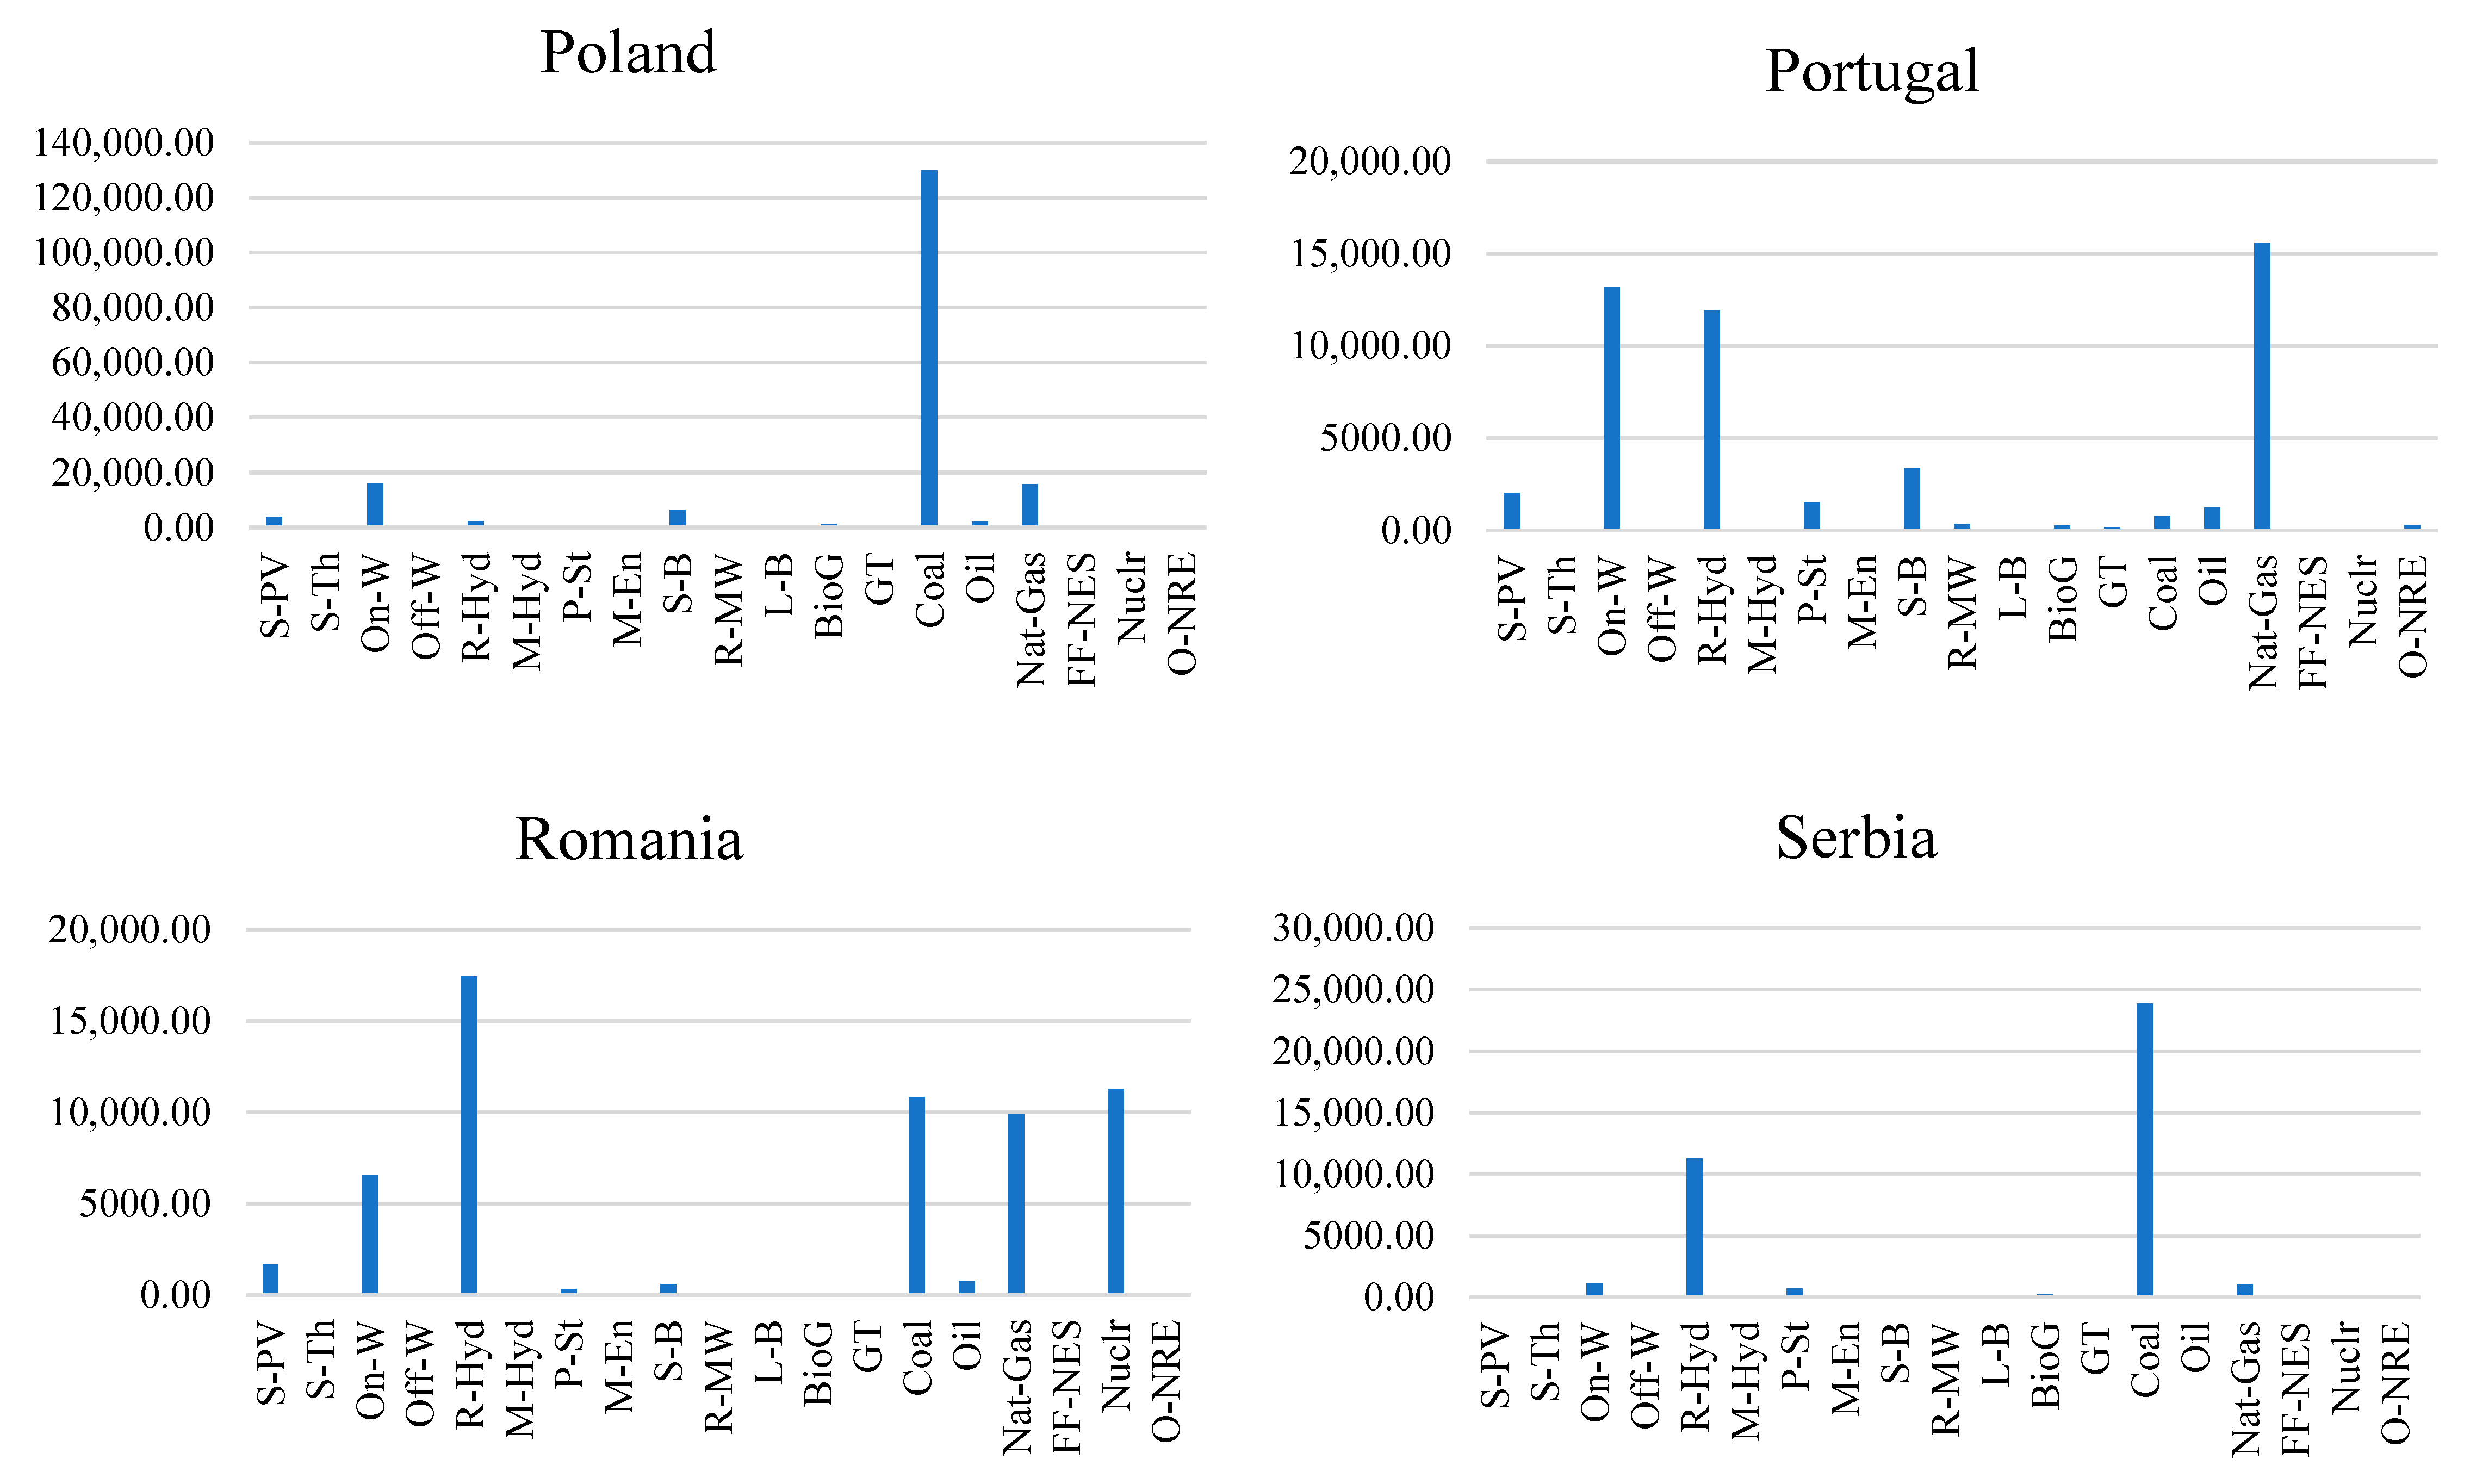
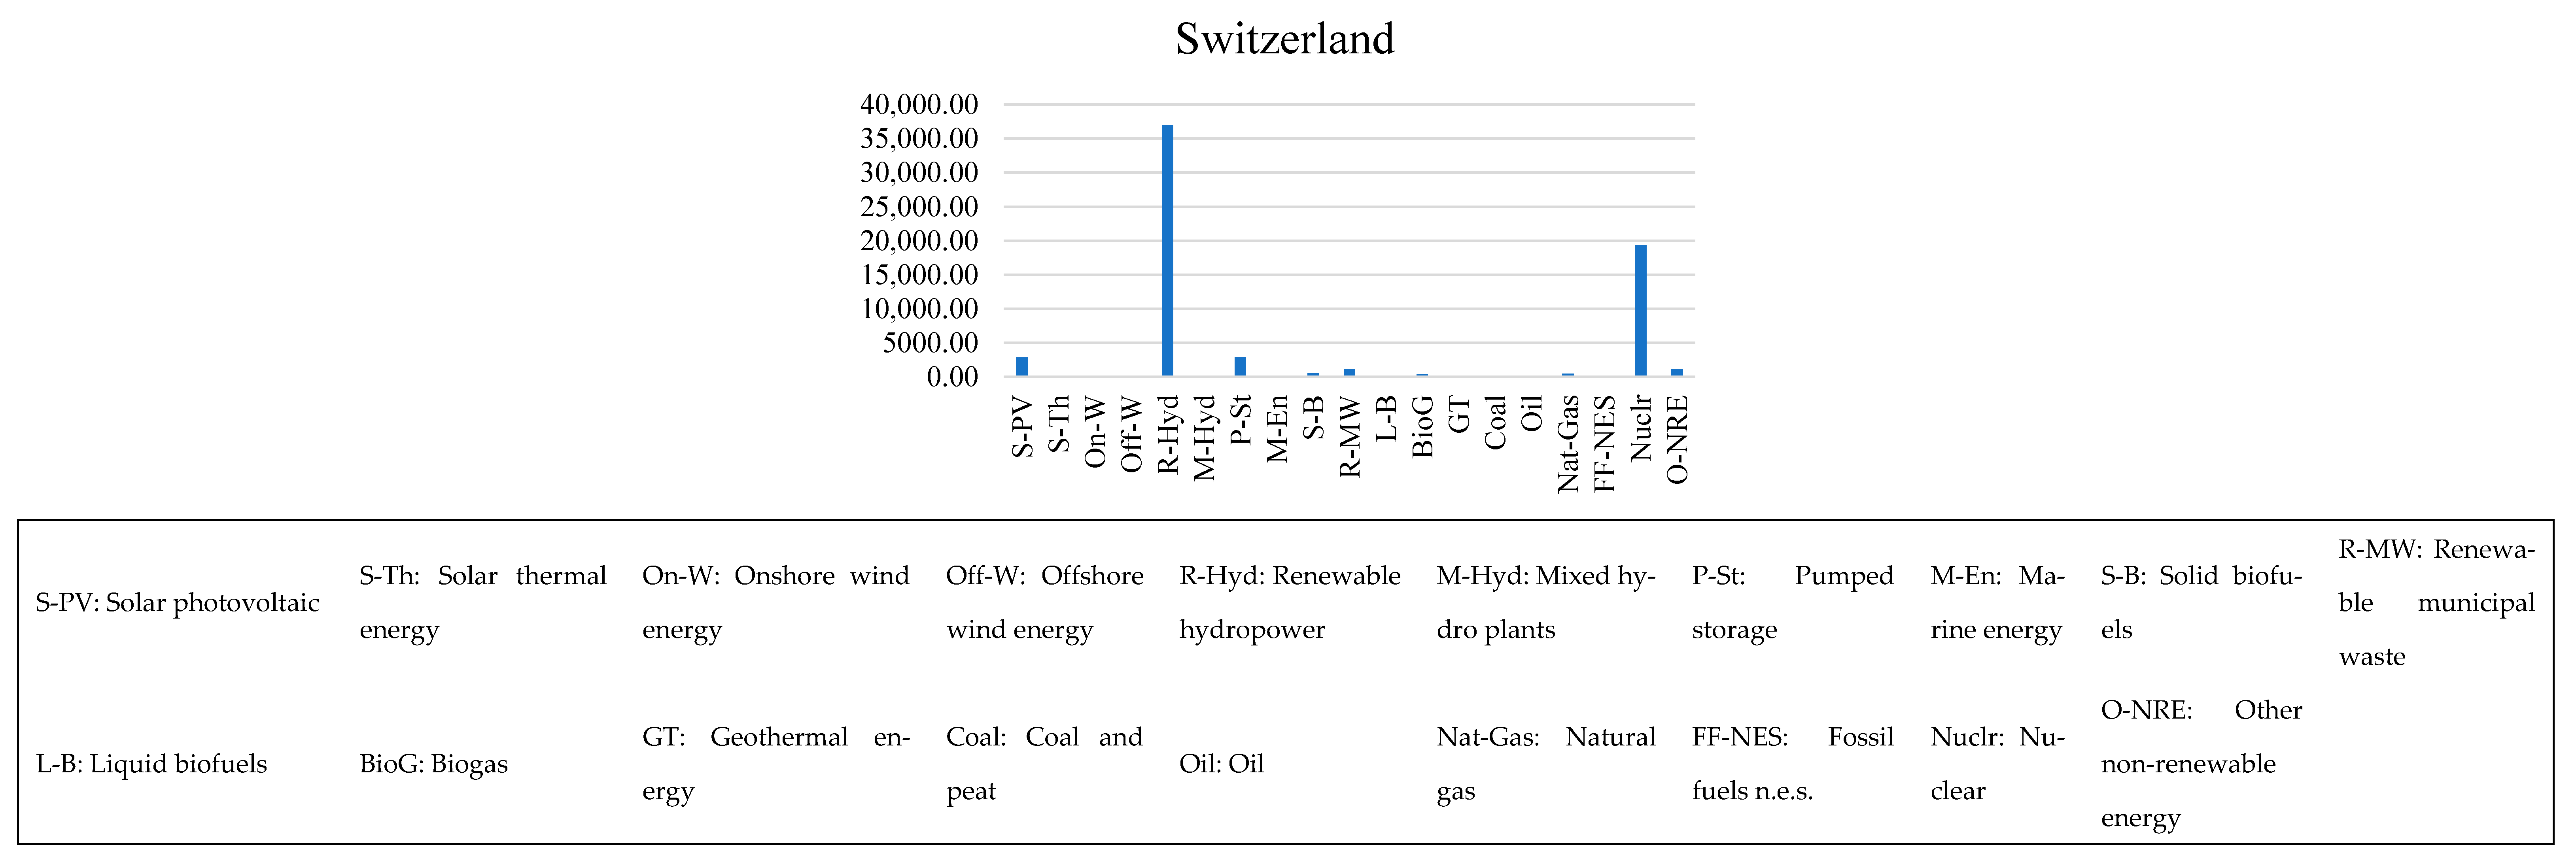
2.2.8. Electricity Supply-Origin Risk (ESOR)
- is the electricity supply-origin risk (ESOR) index, representing the proportion of a country’s electricity generation derived from non-renewable sources;
- is the non-renewable electricity generation by a country in a year;
- E is the renewable electricity generation by a country in a year.
2.2.9. Measure of Economic Health: Gross Domestic Product per Capita (Purchasing Power Parity)
2.2.10. Ideal Case Revenue (ICR)
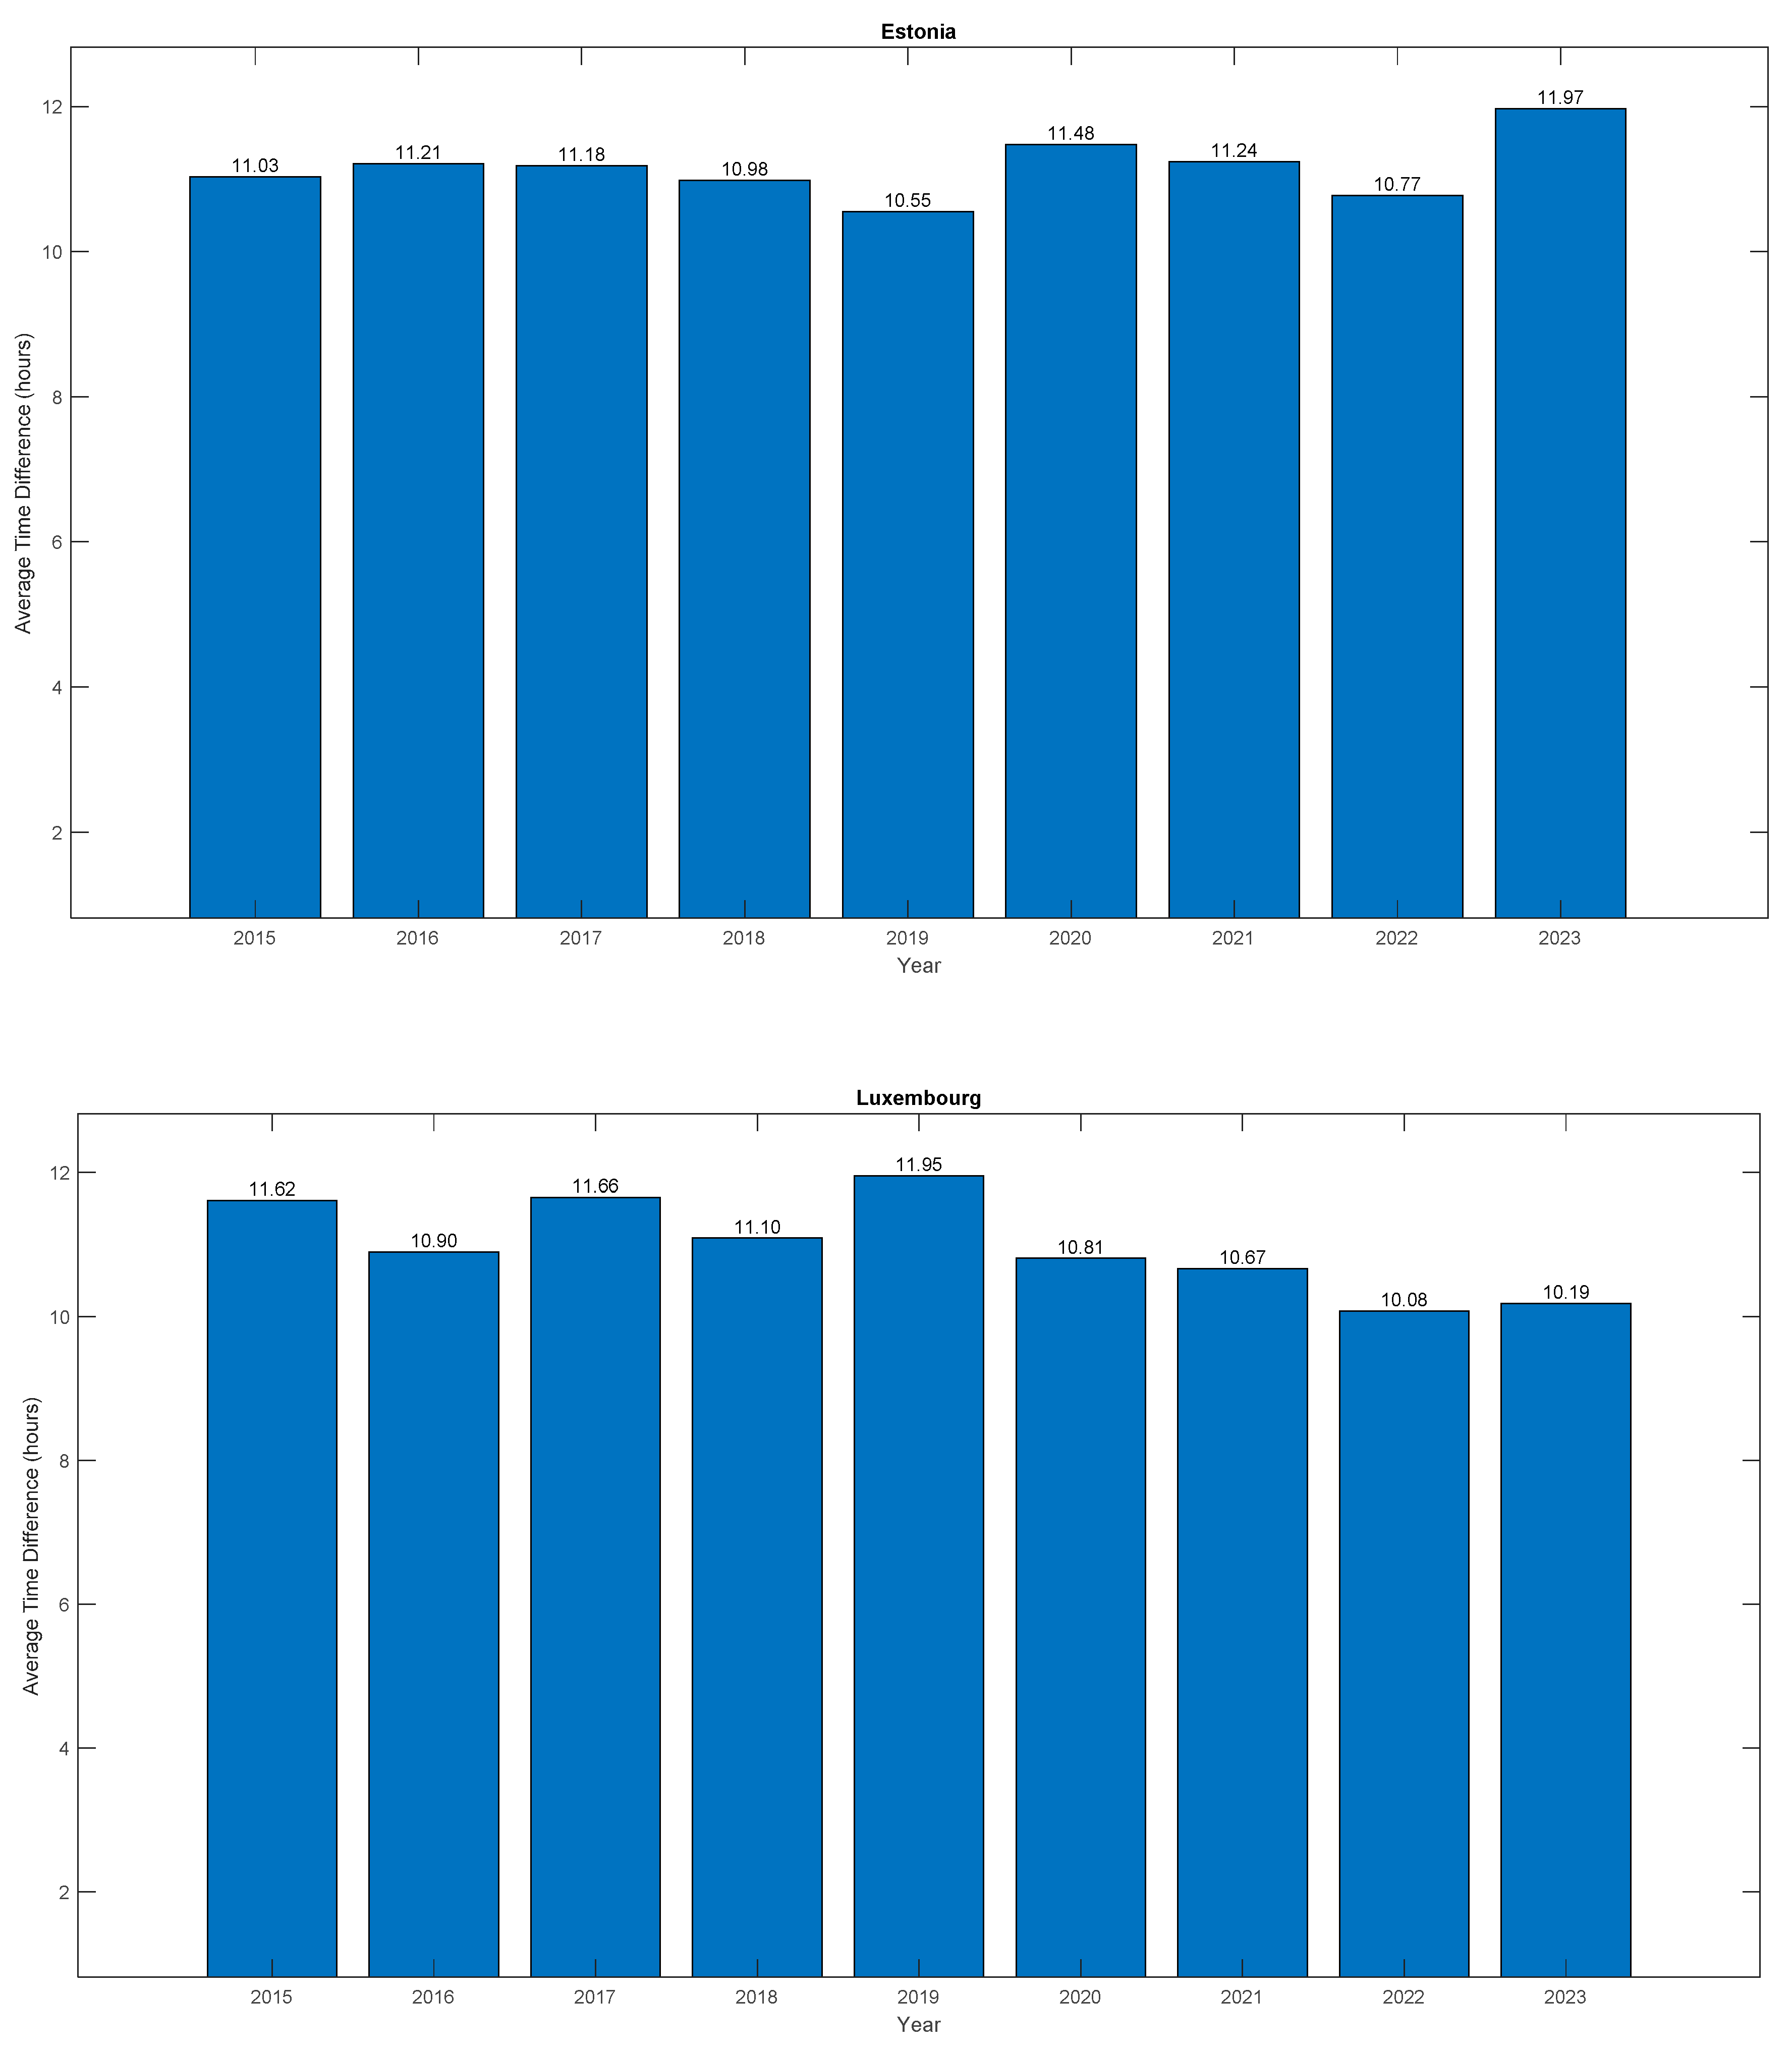
2.2.11. Average Hourly Price Difference (AHPD)
2.2.12. Frequency Chart of “Hour-of-Day Minimum Daily Price” Recorded
2.2.13. Measure of Legal, Regulatory, Business-Ecosystem, and Institutional Health: Index of Economic Freedom (IEF)
2.2.14. Energy Arbitrage Feasibility (EAF) Score
- Positive weights indicate variables that enhance the BESS-EA potential; negative weights indicate penalizing factors;
- is the normalized mean electricity price;
- is the normalized standard deviation of hourly electricity prices;
- is the normalized average daily range of electricity prices;
- is the normalized skewness of the price distribution;
- is the normalized kurtosis of the price distribution;
- is the normalized ESOR;
- is the normalized GDP per capita at purchasing power parity;
- is the normalized net-consumption in TWh of each country (2022);
- is the normalized average hourly price difference exhibited by a country’s hourly price data;
- is the normalized Index of Economic Freedom of a country.
3. Empirical Results
EAF-Score Scenarios
- Scenario-1 (Risk Averse)In this scenario, a 30% weight (“”) was used for the mean electricity price exhibited by each country for their respective EAF score calculation. The balance of 70% weight quantum was divided equally among all the other metrics.
- Scenario-2 (ESOR Sensitive)In this scenario, a 30% weight was used for the ESOR metric. The other metrics shared the 70% weight quantum equally.
- Scenario-3 (Economy Sensitive)In this scenario, a 20% weight was used for each of the GDP (PPP) and IEF metrics. The balance weight quantum was divided equally among the rest of the metrics.
- Scenario-4 (Volatility Sensitive)In this scenario, a 30% weight was used for the standard deviation metric. A total of 15% each was reserved for the skewness and kurtosis metrics. The remaining 40% weight was divided equally among the rest of the metrics.
- Scenario-5 (Equally Weighted)In this scenario, each metric shared an equal weight quantum.
- Analytic hierarchy process (AHP): A structured technique for organizing and analyzing complex decisions by incorporating expert judgment through pairwise comparisons.
- Entropy weight method: An objective approach that derives weights based on the information content and variability within the dataset itself.
- Regression-based weighting: Empirical determination of weights based on historical relationships between indicators and actual investment returns.
- Risk-adjusted weighting: Customized weights that reflect specific risk preferences and tolerance levels.
4. Discussion
5. Conclusions
Author Contributions
Funding
Data Availability Statement
Acknowledgments
Conflicts of Interest
Abbreviations
| Profit from energy arbitrage operation | Price at which energy sold by BESS-EA venture to grid | ||
| E | Battery energy quantum | Et | Battery energy at time-index t |
| Battery energy quantum sold to the grid at time-index t | Ct | Represents hourly electricity price offered by grid in the dataset at each time step | |
| Mean of Ct across the operation horizon | The standard deviation of hourly electricity price data distribution of a country | ||
| Battery energy quantum bought from the grid at time-index t | CAPEX debt-component accumulated and amortized at time-index t | ||
| OPEX cost component accumulated at time-index t | Battery state-of-health cost component accumulated at time-index t | ||
| d | Day index in the hourly price dataset of each country | Average daily range of price values across the dataset of each country | |
| D | Total days covered in the hourly price dataset of each country | Daily range of price values | |
| Non-renewable electricity generation by a country in a year | Renewable electricity generation by a country in a year | ||
| Battery energy quantum bought from the grid at time-index t | Battery energy quantum sold to the grid at time-index t | ||
| Maximum energy storage capacity of BESS | Minimum state-of-charge allowed by battery manufacturer for optimum life | ||
| Battery state-of-charge at time-index t | t | Time-index in hours from the beginning of the operation period | |
| N | Total hours covered in the hourly price dataset of each country | Z | Total hours until CAPEX-debt payoff |
| Skewness of hourly price data distribution of a country | Kurtosis of hourly price data distribution of a country | ||
| T | Total hours of BESS-EA operation | Electricity supply-origin risk (ESOR) | |
| Net-consumption in TWh of each country (2022) | BESS | Battery energy storage system | |
| ROI | Return on investment | IPO | Initial public offering |
| BESS-EA | BESS-enabled energy arbitrage | PX | Power exchange |
| EU | European Union | HVDC | High voltage direct current |
| ERGEG | European Regulators Group for Electricity and Gas | ACER | Agency for the Cooperation of Energy Regulators |
| ENTSO-E | European Network of Transmission System Operators for Electricity | Nordpool | Nordic Power Exchange |
| EEX | European Energy Exchange | APX | Amsterdam Power Exchange |
| LPX | Leipzig Power Exchange | CfDs | Contracts for difference |
| GOs | Guarantees of Origin | VPP | Virtual power plant |
| SEM | Single electricity market | IEM | Internal electricity market |
| EPEX SPOT | Spot Market-European Power Exchange | IRENA | International Renewable Energy Agency |
| GENCO | Electricity Generating Company | TSO | Transmission system operator |
| ISO | Independent system operator | DISCO | Electricity distribution company |
| RETCO | Electricity retail company (last-leg to consumer) | DC/DC-Fast | Direct current EV charger technology |
| OPEX | Operating expense | CAPEX | Capital expense |
| SOH | Battery state-of-health | VRE | Variable renewable energy |
Appendix A
| Battery Type | Key Manufacturers | Cycle Efficiency (%) | Typical Charge/Discharge Rate (C-Rate) | Key Characteristics/Notes |
| Lithium-ion (Li-ion) | Tesla, CATL, BYD, LG Energy Solution, Panasonic, Samsung SDI | 85–95% | 0.25–1C | Most widely used; mature tech; high round-trip efficiency; safety and lifespan still improving. |
| LFP (LiFePO4) | CATL, BYD, Tesla (Megapack), EVE Energy | 85–93% | 0.25–1C | Safer, longer life than NMC; slightly lower energy density; used in stationary storage. |
| NMC (LiNiMnCoO2) | LGES, Samsung SDI, SK On | 90–95% | 0.5–1C | Higher energy density than LFP; more expensive; used in hybrid storage solutions. |
| Vanadium flow battery | Invinity Energy Systems, Sumitomo Electric, CellCube, Rongke Power | 65–85% | ~0.1–0.3C | Long life (>10,000 cycles); decoupled power/energy scaling; ideal for long-duration arbitrage. |
| Zinc-bromine flow | Redflow (Australia), Primus Power | 70–80% | ~0.2–0.4C | Tolerant to deep discharge; longer life than Li-ion; moderate efficiencies. |
| All-iron flow | ESS Inc. (U.S.) | ~70–75% | ~0.25C | Safe, non-toxic; long cycle life; lower energy density. |
| Solid-state (pilot) | QuantumScape, Solid Power, Toyota, Samsung SDI (early stages for grid) | >90% (projected) | >1C (lab scale) | High energy density, safety; still experimental at grid scale; long ramp to commercialization. |
| Sodium-ion | CATL, HiNa Battery, Faradion (Reliance), Natron Energy (Blue Solutions) | 80–90% | ~0.5–1C | Cheaper alternative to Li-ion; lower energy density; gaining traction in stationary storage. |
| Aqueous Zn-based | Eos Energy Enterprises, Enerpoly, Urban Electric Power | 70–80% | ~0.2–0.5C | Non-flammable; long life; safe but less efficient than Li-ion. |
| Gravity/Energy Vault | Energy Vault | N/A (mechanical) | Varies (slow ramp-up) | Mechanical storage for arbitrage; low efficiency (~75%); long-duration potential. |
References
- Yu, R.; Yuan, P.; Yang, F.; Jiang, G. Effects of Vertical Unbundling on the Operational and Environmental Efficiency of Chinese Thermal Power Firms. Energies 2023, 16, 7290. [Google Scholar] [CrossRef]
- Necoechea-Porras, P.D.; López, A.; Salazar-Elena, J.C. Deregulation in the Energy Sector and Its Economic Effects on the Power Sector: A Literature Review. Sustainability 2021, 13, 3429. [Google Scholar] [CrossRef]
- Ryu, H.; Kim, Y.; Jang, P.; Aldana, S. Restructuring and Reliability in the Electricity Industry of OECD Countries: Investigating Causal Relations between Market Reform and Power Supply. Energies 2020, 13, 4746. [Google Scholar] [CrossRef]
- Lee, J.; Cho, Y.; Koo, Y.; Park, C. Effects of Market Reform on Facility Investment in Electric Power Industry: Panel Data Analysis of 27 Countries. Sustainability 2018, 10, 3235. [Google Scholar] [CrossRef]
- Bojnec, Š. Electricity Markets, Electricity Prices and Green Energy Transition. Energies 2023, 16, 873. [Google Scholar] [CrossRef]
- Qazi, A.; Hussain, F.; Rahim, N.A.; Hardaker, G.; Alghazzawi, D.; Shaban, K.; Haruna, K. Towards Sustainable Energy: A Systematic Review of Renewable Energy Sources, Technologies, and Public Opinions. IEEE Access 2019, 7, 63837–63851. [Google Scholar] [CrossRef]
- Benton, L. The 1970s in World History: Economic Crisis as Institutional Transition. Hist. Coop. 2024. Available online: https://historycooperative.org/journal/the-1970s-in-world-history-economic-crisis-as-institutional-transition/ (accessed on 2 February 2024).
- Horváth, D.; Daly, D.J. Institute for Research on Public Policy. Small Countries in the World Economy: The Case of Sweden; IRPP: Montreal, QC, Canada, 1989. [Google Scholar]
- Drach, A.; Cassis, Y. (Eds.) Financial Deregulation: A Historical Perspective; Oxford University Press: Oxford, UK, 2021. [Google Scholar]
- Jamasb, T.; Pollitt, M. Electricity Market Reform in the European Union: Review of Progress toward Liberalization & Integration. Energy J. 2005, 26, 11–41. [Google Scholar]
- Ofgem. Deregulation of Supply Markets—Slides. 2001. Available online: https://www.ofgem.gov.uk/publications/deregulation-supply-markets-slides (accessed on 2 February 2024).
- Bergman, M.A. Competition Law, Competition Policy, and Deregulation. Swed. Econ. Policy Rev. 2002, 9, 93–128. Available online: https://www.government.se/contentassets/e5b8dabba9024522bdc551c9c62c0ee8/mats-a.-bergman-competition-law-competition-policy-and-deregulation (accessed on 7 February 2024).
- Gebel, M.; Giesecke, J. Does Deregulation Help? The Impact of Employment Protection Reforms on Youths’ Unemployment and Temporary Employment Risks in Europe. Eur. Sociol. Rev. 2016, 32, 486–500. [Google Scholar] [CrossRef]
- Lawton, R.W. Deregulation or Reregulation? Regulatory Reform in Europe and the United States; Majone, G., Ed.; St. Martin’s: New York, NY, USA, 1990; p. 262. [Google Scholar]
- Swiss Re Institute. 1990s: Globalisation and Liberalisation. Available online: https://www.swissre.com/institute/search-page.html?searchterm=1990s%3A+Globalisation+and+Liberalisation (accessed on 7 February 2024).
- Yergin, D. Energy Security in the 1990s. Foreign Aff. 1988, 67, 110–132. [Google Scholar] [CrossRef]
- Witty, S.; Pearce, W.; Sholem, M.; Taylor, J. The New EU Market Abuse Regulation; Harvard Law School Forum on Corporate Governance: Cambridge, MA, USA, 2016. Available online: https://corpgov.law.harvard.edu/2016/06/17/the-new-eu-market-abuse-regulation/ (accessed on 7 February 2024).
- ElectricChoice. Energy Deregulation Around the World: A Comprehensive Guide. Available online: https://www.electricchoice.com/blog/energy-deregulation-world/ (accessed on 9 February 2024).
- Shikoski, J.; Katic, D.V. Deregulation of the Power Industry in Europe. 2003. Available online: https://www.emo.org.tr/ekler/06bf9581a8f1747_ek.pdf (accessed on 9 February 2024).
- Penn, I. Why Are Energy Prices So High? Some Experts Blame Deregulation. The New York Times. 2023. Available online: https://www.nytimes.com/2023/01/04/business/energy-environment/electricity-deregulation-energy-markets.html (accessed on 9 February 2024).
- Grubb, M.; Drummond, P.; McDowall, W.; Popp, D. UK Electricity Market Reform and the Energy Transition: Emerging Lessons. MIT CEEPR 2018. Available online: https://ceepr.mit.edu/wp-content/uploads/2021/09/2018-004.pdf (accessed on 19 February 2024).
- Šajn, N. Empowering Consumers for the Green Transition; European Parliamentary Research Service (EPRS): Brussels, Belgium, 2022; Available online: https://www.europarl.europa.eu/RegData/etudes/BRIE/2022/733543/EPRS_BRI(2022)733543_EN.pdf (accessed on 19 February 2024).
- Department of Commerce, USA. Germany—Country Commercial Guide. 2023. Available online: https://www.trade.gov/country-commercial-guides/germany-energy (accessed on 21 February 2024).
- Meeus, L. The Evolution of Electricity Markets in Europe; Edward Elgar Publishing: Cheltenham, UK, 2020. [Google Scholar]
- Geman, H. Towards a European Market of Electricity: Spot and Derivatives Trading. OECD-NEA 2002. Available online: https://www.oecd-nea.org/upload/docs/application/pdf/2020-06/workshop_power_generation_investment_4.towards_a_european_market_of_electricity_spot_and_derivatives_trading.pdf (accessed on 21 February 2024).
- Downey, L. International Petroleum Exchange (IPE): What It iIs, How It Works. Investopedia 2023. Available online: https://www.investopedia.com/terms/i/international-petroleum-exchange.asp (accessed on 24 February 2024).
- European Commission, Directorate-General for Energy. Wholesale Energy Market. 2024. Available online: https://energy.ec.europa.eu/topics/markets-and-consumers/wholesale-energy-market_en (accessed on 24 February 2024).
- Gajić, D.B.; Petrović, V.B.; Horvat, N.; Dragan, D.; Stanisavljević, A.; Katić, V.; Popović, J. A Distributed Ledger-Based Automated Marketplace for the Decentralized Trading of Renewable Energy in Smart Grids. Energies 2022, 15, 2121. [Google Scholar] [CrossRef]
- European Energy Exchange. Indices. 2023. Available online: https://www.eex.com/en/market-data/power/indices (accessed on 3 March 2024).
- Bullinger, V. How the Power Exchange Works. Solar-log.Com 2019. Available online: https://www.solar-log.com/en/news-center/energy-management-blog/solutions/how-the-power-exchange-works (accessed on 5 March 2024).
- Association of European Energy Exchanges. EPEX SPOT—European Power Exchange. 2023. Available online: https://tinyurl.com/av2t7jta (accessed on 5 March 2024).
- Stecca, M.; Bignucolo, F.; Mattavelli, P.; Costabeber, A. A Comprehensive Review of the Integration of Battery Energy Storage Systems into Distribution Networks. IEEE Open J. Ind. Electron. Soc. 2020, 1, 46–65. [Google Scholar] [CrossRef]
- Nezamabadi, H.; Vahidinasab, V. Arbitrage Strategy of Renewable-Based Microgrids via Peer-to-Peer Energy-Trading. IEEE Trans. Sustain. Energy 2021, 12, 1372–1382. [Google Scholar] [CrossRef]
- Wu, X.; Zhao, J.; Conejo, A.J. Optimal Battery Sizing for Frequency Regulation and Energy Arbitrage. IEEE Trans. Power Deliv. 2022, 37, 2016–2023. [Google Scholar] [CrossRef]
- Kumar, R.R.; Bharatiraja, C.; Udhayakumar, K.; Devakirubakaran, S.; Sekar, K.S.; Mihet-Popa, L. Advances in Batteries, Battery Modeling, Battery Management System, Battery Thermal Management, SOC, SOH, and Charge/Discharge Characteristics in EV Applications. IEEE Access 2023, 11, 105761–105809. [Google Scholar] [CrossRef]
- IEA. Evolution of Li-Ion Battery Price, 1995–2019. 2020. Available online: https://www.iea.org/data-and-statistics/charts/evolution-of-li-ion-battery-price-1995-2019 (accessed on 7 March 2024).
- Ember-Climate.Org. European Wholesale Electricity Price Data. 2024. Available online: https://ember-climate.org/data-catalogue/european-wholesale-electricity-price-data/ (accessed on 2 January 2024).
- Valitov, N.; Nielen, S.; Bönte, W.; Engelmeyer, T. International Association for Energy Economics. 2011. Available online: https://www.iaee.org/en/publications/proceedingsabstractpdf.aspx?id=12561 (accessed on 8 March 2024).
- International Renewable Energy Agency. IRENASTAT Online Data Query Tool. 2024. Available online: https://tinyurl.com/26mctmj7 (accessed on 10 March 2024).
- ENTSO-E. Power Statistics. 2023. Available online: https://pxweb.irena.org/pxweb/en/IRENASTAT (accessed on 13 March 2024).
- United Nations. The 17 Goals. 2023. Available online: https://sdgs.un.org/goals (accessed on 14 March 2024).
- IRENA. Increasing Time Granularity in Electricity Markets. 2019. Available online: https://www.irena.org/-/media/Files/IRENA/Agency/Publication/2019/Feb/IRENA_Increasing_time_granularity_2019.pdf (accessed on 14 March 2024).
- Kadri, A.; Raahemifar, K. Is Economic Feasibility of BESS Energy Price Arbitrage Jurisdiction Dependent. In Proceedings of the IEEE 61st International Midwest Symposium on Circuits and Systems (MWSCAS), Windsor, ON, Canada, 5–8 August 2018; pp. 1–4. [Google Scholar]
- Fan, F.; Zorzi, G.; Campos-Gaona, D.; Burt, G.; Anaya-Lara, O.; Nwobu, J.; Madariaga, A. Sizing and Coordination Strategies of Battery Energy Storage System Co-Located with Wind Farm: The UK Perspective. Energies 2021, 14, 1439. [Google Scholar] [CrossRef]
- Jedrzejewski, A.; Lago, J.; Marcjasz, G.; Weron, R. Electricity Price Forecasting: The Dawn of Machine Learning. IEEE Power Energy Mag. 2022, 20, 24–31. [Google Scholar] [CrossRef]
- Maciejowska, K.; Uniejewski, B.; Weron, R. Forecasting Electricity Prices. In Oxford Research Encyclopedia of Economics and Finance; Oxford University Press: Oxford, UK, 2023; Available online: https://arxiv.org/abs/2204.11735 (accessed on 14 March 2024).
- Bondt, W.F.M.D.; Thaler, R.H. Anomalies: A Mean-Reverting Walk Down Wall Street. J. Econ. Perspect. 1989, 3, 189–202. [Google Scholar] [CrossRef]
- The World Bank. GDP Per Capita, PPP (Current International $); The World Bank: Washington, DC, USA, 2022; Available online: https://data.worldbank.org/indicator/NY.GDP.PCAP.PP.CD (accessed on 2 January 2024).
- The Heritage Foundation. Index of Economic Freedom; The Heritage Foundation: Washington, DC, USA, 2023; Available online: https://www.heritage.org/index/pages/about (accessed on 2 January 2024).
- The Heritage Foundation. Index of Economic Freedom: All Country Scores; The Heritage Foundation: Washington, DC, USA, 2023; Available online: https://www.heritage.org/index/pages/all-country-scores (accessed on 2 January 2024).






| Participant | Function | Examples |
|---|---|---|
| GENCO | Produces energy at a power plant, which can be natural and coal-fired, among others. They sell this energy to grid operators or directly to consumers. | EDF (France), Enel (Italy) |
| Consumer | Uses electricity for individual purposes, obtained from grid operators or directly from producers. | A household in Paris; a manufacturing plant in Germany |
| Prosumer | Utilizes energy from the grid but also generates their own power through means like solar panels and wind turbines. They can sell excess energy back to the grid. | A family home with solar panels in Spain; a small business with wind turbines in Portugal |
| Transmission system operator (TSO)/independent system operator (ISO) | Manages high-voltage transmission lines that transport electricity over long distances to distribution networks or large industrial customers. Ensures balance between supply and demand. | National Grid (UK), RTE (France) |
| Distribution company (DISCO) | Manages low-voltage distribution networks that deliver electricity to end consumers including homes and businesses. | ENEXIS (Netherlands), E.ON (Germany) |
| Retail company (RETCO) | Purchases wholesale energy and sells it retail to end consumers while managing their accounts. | Iberdrola (Spain), E.ON (Germany) |
| Balancing party (BP) | Relying on consumption and production data as well as market mechanisms, they ensure that supply meets the demand at specific points on the grid. | Statkraft (Norway), Fortum (Finland) |
| Regulator | Mandated by national governments, they oversee pricing structures, monitor competition among providers, and ensure consumer protection. | ACER—Agency for the Cooperation of Energy Regulators (EU), OFGEM—Office of Gas and Electricity Markets (UK) |
| Power exchange/market operator | Energy trading platform | EPEX Spot, Nord Pool |
| Aggregator | Provides bundled services for decentralized producers and consumers linked to energy markets | Next Kraftwerke (Belgium), Flexitricity (UK) |
| Country | TSO | Capacity (GW) | Generation (TWh) | Non-Renewable Generation (%) | Renewable Generation (%) | Net-Consumption (TWh) |
|---|---|---|---|---|---|---|
| Austria | 1. APG 2. VUEN | 28.508 | 55.1 | 29.76 | 70.24 | 61.5 |
| Belgium | Elia | 27.562 | 89.9 | 78.42 | 21.58 | 81.7 |
| Bulgaria | ESO | 11.882 | 49.9 | 85.97 | 14.03 | 37.8 |
| Croatia | HOPS | 4.962 | 13 | 39.23 | 60.77 | 18.1 |
| Czechia | ČEPS | 21.345 | 79.1 | 87.48 | 12.52 | 64.4 |
| Denmark | Energinet | 17.751 | 34 | 25.88 | 74.12 | 34.3 |
| Estonia | Elering AS | 2.610 | 7.2 | 65.28 | 34.72 | 8.2 |
| Finland | Fingrid | 20.346 | 63.6 | 53.62 | 46.38 | 79.2 |
| France | RTE | 146.499 | 433.2 | 76.57 | 23.43 | 442.8 |
| Germany | 1. TransnetBW 2. TenneT DE 3. Amprion 4. 50Hertz | 253.140 | 506.9 | 53.88 | 46.12 | 482.7 |
| Greece | IPTO | 23.604 | 39.7 | 61.96 | 38.04 | 48.7 |
| Hungary | MAVIR ZRt. | 11.673 | 31.4 | 84.08 | 15.92 | 43.4 |
| Ireland | EirGrid | 11.422 | 17.4 | 52.30 | 47.70 | 13.1 |
| Italy | Terna | 121.767 | 248.1 | 67.75 | 32.25 | 286.3 |
| Latvia | AST | 3.077 | 4.5 | 28.89 | 71.11 | 6.8 |
| Lithuania | Litgrid | 4.166 | 4.1 | 36.59 | 63.41 | 12.2 |
| Luxembourg | Creos Luxembourg | 1.920 | 1.1 | 18.18 | 81.82 | 5.0 |
| Netherlands | TenneT NL | 52.014 | 95.9 | 85.61 | 14.39 | 100.4 |
| North Macedonia | MEPSO | 1.926 | 4.9 | 79.59 | 20.41 | 6.3 |
| Norway | Statnett | 40.371 | 145.1 | 2.07 | 97.93 | 131.6 |
| Poland | PSE S.A. | 57.586 | 162.7 | 80.82 | 19.18 | 172.4 |
| Portugal | REN | 22.664 | 44.1 | 44.90 | 55.10 | 50.3 |
| Romania | Transelectrica | 18.479 | 55.2 | 58.51 | 41.49 | 56.2 |
| Serbia | EMS | 8.511 | 32.5 | 71.08 | 28.92 | 34.1 |
| Slovakia | SEPS | 7.490 | 26.1 | 79.69 | 20.31 | 27.2 |
| Slovenia | ELES | 4.501 | 12.3 | 72.36 | 27.36 | 13.4 |
| Spain | REE | 116.593 | 262.1 | 55.48 | 44.52 | 236.1 |
| Sweden | Svenska Kraftnät | 49.089 | 161.3 | 36.39 | 63.61 | 132.1 |
| Switzerland | Swissgrid | 23,978.92 | 42.5 | 68.94 | 31.06 | 64.6 |
| Country | GDP per Capita, PPP (Current International $) | Country | GDP per Capita, PPP (Current International $) | Country | GDP per Capita, PPP (Current International $) | Country | GDP per Capita, PPP (Current International $) | Country | GDP per Capita, PPP (Current International $) |
|---|---|---|---|---|---|---|---|---|---|
| Austria | 67,874.9 | Estonia | 46,556.4 | Ireland | 126,837.3 | North Macedonia | 20,328.9 | Slovakia | 37,457.2 |
| Belgium | 65,478.4 | Finland | 59,470.1 | Italy | 52,804.0 | Norway | 114,929.5 | Slovenia | 48,302.5 |
| Bulgaria | 33,845.6 | France | 55,387.5 | Latvia | 39,825.3 | Poland | 44,134.6 | Spain | 46,331.7 |
| Croatia | 40,240.0 | Germany | 63,521.9 | Lithuania | 48,860.7 | Portugal | 41,862.7 | Sweden | 65,157.0 |
| Czechia | 49,195.0 | Greece | 37,075.1 | Luxembourg | 140,616.4 | Romania | 41,259.5 | Switzerland | 84,649.9 |
| Denmark | 74,897.0 | Hungary | 41,740.9 | Netherlands | 70,869.4 | Serbia | 23,914.2 |
| Country | Overall IEF (%) | Country | Overall IEF (%) | Country | Overall IEF (%) | Country | Overall IEF (%) | Country | Overall IEF (%) |
|---|---|---|---|---|---|---|---|---|---|
| Austria | 71.1 | Estonia | 78.6 | Ireland | 72.2 | North Macedonia | 63.7 | Slovakia | 69.0 |
| Belgium | 67.1 | Finland | 77.1 | Italy | 62.3 | Norway | 76.9 | Slovenia | 68.5 |
| Bulgaria | 69.3 | France | 63.6 | Latvia | 72.8 | Poland | 67.7 | Spain | 65.0 |
| Croatia | 66.4 | Germany | 73.7 | Lithuania | 72.2 | Portugal | 69.5 | Sweden | 77.5 |
| Czechia | 71.9 | Greece | 56.9 | Luxembourg | 78.4 | Romania | 64.5 | Switzerland | 83.8 |
| Denmark | 77.6 | Hungary | 64.1 | Netherlands | 78.0 | Serbia | 63.5 |
| Country | Average Electricity Price () in EUR/MWHr | ) | ) | Skewness (Ϩ) | ϨNorm | ) | ) | GDP (PPP) | ) | AHPD | IEF | ICR (Euro) | Scenario-1 Score | Scenario-2 Score | Scenario-3 Score | Scenario-4 Score | Scenario-5 Score | |||||||||
|---|---|---|---|---|---|---|---|---|---|---|---|---|---|---|---|---|---|---|---|---|---|---|---|---|---|---|
| Austria | 77.53 | 0.536825 | 92.18 | 0.822709 | 60.90 | 0.588336 | 3.07 | 0.579143 | 14.83 | 0.090996 | 29.76 | 0.324201 | 67,874.9 | 0.39527 | 61.5 | 0.118275 | 7.52 | 0.648038 | 71.1 | 0.527881 | 198290.4 | 0.106741 | 0.154008 | 0.333615 | 0.428231 | 0.290962 |
| Belgium | 78.65 | 0.556513 | 85.76 | 0.73136 | 65.85 | 0.658748 | 2.98 | 0.562384 | 14.42 | 0.087423 | 78.42 | 0.893923 | 65,478.4 | 0.375347 | 81.7 | 0.160561 | 8.17 | 0.725327 | 67.1 | 0.379182 | 214407.6 | 0.04955 | −0.02546 | 0.261558 | 0.365341 | 0.22299 |
| Bulgaria | 88.89 | 0.736509 | 95.12 | 0.864542 | 86.10 | 0.946799 | 3.09 | 0.582868 | 27.95 | 0.205352 | 85.97 | 0.982321 | 33,845.6 | 0.11237 | 37.8 | 0.068662 | 10.07 | 0.951249 | 69.3 | 0.460967 | 280341.6 | 0.028502 | −0.02614 | 0.257215 | 0.424487 | 0.247398 |
| Croatia | 103.88 | 1 | 104.64 | 1 | 81.89 | 0.886913 | 2.46 | 0.465549 | 10.53 | 0.053517 | 39.23 | 0.435078 | 40,240.0 | 0.165529 | 18.1 | 0.027423 | 9.59 | 0.894174 | 66.4 | 0.35316 | 266633.8 | −0.03495 | 0.090631 | 0.245675 | 0.4288 | 0.241119 |
| Czechia | 75.07 | 0.493584 | 86.83 | 0.746585 | 59.62 | 0.570128 | 3.19 | 0.60149 | 15.84 | 0.0998 | 87.48 | 1 | 49,195.0 | 0.239976 | 64.4 | 0.124346 | 6.86 | 0.56956 | 71.9 | 0.557621 | 194122.7 | 0.046913 | −0.06566 | 0.250894 | 0.361604 | 0.201592 |
| Denmark | 65.31 | 0.322025 | 81.60 | 0.672168 | 56.22 | 0.521764 | 3.54 | 0.666667 | 19.12 | 0.128388 | 25.88 | 0.278773 | 74,897.0 | 0.453647 | 34.3 | 0.061336 | 6.11 | 0.48038 | 77.6 | 0.769517 | 183052.3 | 0.173407 | 0.183022 | 0.389376 | 0.417171 | 0.315307 |
| Estonia | 65.95 | 0.333275 | 74.55 | 0.571855 | 71.98 | 0.745946 | 5.33 | 1 | 119.12 | 1 | 65.28 | 0.740077 | 46,556.4 | 0.21804 | 8.2 | 0.006699 | 8.91 | 0.813317 | 78.6 | 0.806691 | 234366.9 | 0.243644 | 0.153211 | 0.434781 | 0.558197 | 0.40892 |
| Finland | 55.49 | 0.149411 | 65.75 | 0.446642 | 59.38 | 0.566714 | 4.15 | 0.780261 | 28.42 | 0.209448 | 53.62 | 0.603559 | 59,470.1 | 0.325397 | 79.2 | 0.155328 | 6.55 | 0.532699 | 77.1 | 0.750929 | 193341.3 | 0.201008 | 0.100051 | 0.360624 | 0.372558 | 0.301445 |
| France | 81.01 | 0.597996 | 95.55 | 0.87066 | 58.00 | 0.547084 | 3.60 | 0.67784 | 32.38 | 0.243964 | 76.57 | 0.872263 | 55,387.5 | 0.291457 | 442.8 | 0.916475 | 6.97 | 0.58264 | 63.6 | 0.249071 | 188848 | 0.093089 | 0.03212 | 0.285736 | 0.463219 | 0.290893 |
| Germany | 72.97 | 0.456671 | 87.88 | 0.761525 | 66.73 | 0.671266 | 3.31 | 0.623836 | 17.28 | 0.112351 | 53.88 | 0.606603 | 63,521.9 | 0.359081 | 482.7 | 1 | 8.06 | 0.712247 | 73.7 | 0.624535 | 217272.9 | 0.193864 | 0.160534 | 0.40807 | 0.470436 | 0.380157 |
| Greece | 92.58 | 0.801371 | 87.78 | 0.760102 | 62.88 | 0.616501 | 2.82 | 0.532588 | 13.03 | 0.075307 | 61.96 | 0.701206 | 37,075.1 | 0.139218 | 48.7 | 0.09148 | 7.87 | 0.689655 | 56.9 | 0 | 204737.3 | −0.06919 | −0.04692 | 0.122573 | 0.321172 | 0.140228 |
| Hungary | 84.47 | 0.658815 | 92.49 | 0.82712 | 70.99 | 0.731863 | 3.04 | 0.573557 | 14.80 | 0.090735 | 84.08 | 0.960192 | 41,740.9 | 0.178007 | 43.4 | 0.080385 | 8.01 | 0.706302 | 64.1 | 0.267658 | 231143.4 | −0.00375 | −0.07075 | 0.193455 | 0.367491 | 0.183662 |
| Ireland | 69.58 | 0.397082 | 60.66 | 0.374217 | 72.27 | 0.750071 | 2.84 | 0.536313 | 14.19 | 0.085418 | 52.30 | 0.588104 | 126,837.3 | 0.885449 | 13.1 | 0.016956 | 8.46 | 0.75981 | 72.2 | 0.568773 | 235311.1 | 0.144193 | 0.101729 | 0.406164 | 0.319489 | 0.299182 |
| Italy | 95.13 | 0.846194 | 97.43 | 0.89741 | 54.13 | 0.492034 | 2.85 | 0.538175 | 12.77 | 0.073041 | 67.75 | 0.768997 | 52,804.0 | 0.269979 | 286.3 | 0.588863 | 6.46 | 0.521998 | 62.3 | 0.200743 | 176247.3 | −0.03527 | −0.01811 | 0.206369 | 0.387082 | 0.196705 |
| Latvia | 72.43 | 0.447179 | 84.26 | 0.710017 | 72.67 | 0.755761 | 4.93 | 0.925512 | 84.26 | 0.696156 | 28.89 | 0.314015 | 39,825.3 | 0.162082 | 6.8 | 0.003768 | 9.16 | 0.843044 | 72.8 | 0.591078 | 236613.5 | 0.20566 | 0.235262 | 0.388612 | 0.547304 | 0.392622 |
| Lithuania | 73.15 | 0.459835 | 85.52 | 0.727945 | 73.39 | 0.766003 | 4.87 | 0.914339 | 80.41 | 0.662599 | 36.59 | 0.404168 | 48,860.7 | 0.237197 | 12.2 | 0.015072 | 9.13 | 0.839477 | 72.2 | 0.568773 | 238957.8 | 0.198276 | 0.210651 | 0.390801 | 0.544144 | 0.38674 |
| Luxembourg | 72.97 | 0.456671 | 87.88 | 0.761525 | 66.73 | 0.671266 | 3.31 | 0.623836 | 17.28 | 0.112351 | 18.18 | 0.18862 | 140,616.4 | 1 | 5.0 | 0 | 8.06 | 0.712247 | 78.4 | 0.799257 | 217272.9 | 0.212016 | 0.271604 | 0.527546 | 0.483776 | 0.403519 |
| The Netherlands | 76.15 | 0.512568 | 83.81 | 0.703614 | 65.00 | 0.646657 | 3.05 | 0.575419 | 15.16 | 0.093873 | 85.61 | 0.978106 | 70,869.4 | 0.420164 | 100.4 | 0.199707 | 8.00 | 0.705113 | 78.0 | 0.784387 | 211640 | 0.091049 | −0.01244 | 0.348438 | 0.38373 | 0.263826 |
| N. Macedonia | 98.85 | 0.911584 | 34.36 | 0 | 89.84 | 1 | −0.04 | 0 | 4.39 | 0 | 79.59 | 0.907622 | 20,328.9 | 0 | 6.3 | 0.002721 | 10.48 | 1 | 63.7 | 0.252788 | 292519 | −0.16874 | −0.16786 | 0.064321 | 0.024913 | 0.04363 |
| Norway | 47.21 | 0.003867 | 48.43 | 0.200199 | 19.54 | 0 | 3.45 | 0.649907 | 19.94 | 0.135536 | 2.07 | 0 | 114,929.5 | 0.786454 | 131.6 | 0.26502 | 2.07 | 0 | 76.9 | 0.743494 | 63622.24 | 0.214893 | 0.215753 | 0.399499 | 0.280148 | 0.277674 |
| Poland | 69.64 | 0.398137 | 54.70 | 0.289414 | 47.33 | 0.395306 | 2.99 | 0.564246 | 18.15 | 0.119934 | 80.82 | 0.922023 | 44,134.6 | 0.197907 | 172.4 | 0.350429 | 5.35 | 0.390012 | 67.7 | 0.401487 | 154106.5 | 0.019386 | −0.09707 | 0.179067 | 0.213146 | 0.138857 |
| Portugal | 72.19 | 0.44296 | 56.02 | 0.308196 | 36.26 | 0.237838 | 2.30 | 0.435754 | 10.43 | 0.052645 | 44.90 | 0.501464 | 41,862.7 | 0.179019 | 50.3 | 0.094829 | 4.26 | 0.260404 | 69.5 | 0.468401 | 118062.6 | −0.01357 | −0.02658 | 0.162877 | 0.182624 | 0.109266 |
| Romania | 81.62 | 0.608719 | 92.24 | 0.823563 | 78.61 | 0.840256 | 3.07 | 0.579143 | 15.00 | 0.092478 | 58.51 | 0.660813 | 41,259.5 | 0.174005 | 56.2 | 0.10718 | 8.89 | 0.810939 | 64.5 | 0.282528 | 255954.2 | 0.054313 | 0.042733 | 0.240109 | 0.401793 | 0.244056 |
| Serbia | 97.11 | 0.880998 | 98.94 | 0.918896 | 70.58 | 0.726031 | 2.64 | 0.499069 | 11.63 | 0.063105 | 71.08 | 0.807985 | 23,914.2 | 0.029806 | 34.1 | 0.060917 | 7.84 | 0.686088 | 63.5 | 0.245353 | 229808.5 | −0.07617 | −0.05994 | 0.149916 | 0.363376 | 0.154028 |
| Slovakia | 78.78 | 0.558798 | 91.88 | 0.818441 | 64.98 | 0.646373 | 3.13 | 0.590317 | 15.30 | 0.095093 | 79.69 | 0.908793 | 37,457.2 | 0.142395 | 27.2 | 0.046473 | 7.51 | 0.646849 | 69.0 | 0.449814 | 211574.9 | 0.028706 | −0.0491 | 0.221638 | 0.374856 | 0.196816 |
| Slovenia | 84.56 | 0.660397 | 92.47 | 0.826836 | 64.94 | 0.645804 | 2.99 | 0.564246 | 14.26 | 0.086028 | 72.36 | 0.822972 | 48,302.5 | 0.232556 | 13.4 | 0.017584 | 7.76 | 0.676576 | 68.5 | 0.431227 | 211444.6 | 0.008398 | −0.02774 | 0.232784 | 0.375305 | 0.199749 |
| Spain | 71.95 | 0.438741 | 56.12 | 0.309619 | 37.41 | 0.254196 | 2.30 | 0.435754 | 10.47 | 0.052994 | 55.48 | 0.625337 | 46,331.7 | 0.216172 | 236.1 | 0.483776 | 4.36 | 0.272295 | 65.0 | 0.301115 | 121807 | 0.000513 | −0.04097 | 0.159299 | 0.192662 | 0.126184 |
| Sweden | 46.99 | 0 | 53.16 | 0.267501 | 43.55 | 0.341536 | 4.35 | 0.817505 | 28.71 | 0.211976 | 36.39 | 0.401826 | 65,157.0 | 0.372675 | 132.1 | 0.266067 | 4.54 | 0.293698 | 77.5 | 0.765799 | 141798.8 | 0.228044 | 0.138718 | 0.362429 | 0.328199 | 0.293493 |
| Switzerland | 84.33 | 0.656354 | 93.42 | 0.840353 | 43.06 | 0.334566 | 2.83 | 0.534451 | 12.58 | 0.071385 | 68.94 | 0.782929 | 84,649.9 | 0.534727 | 64.6 | 0.124764 | 4.85 | 0.330559 | 83.8 | 1 | 140203.4 | 0.035252 | 0.007114 | 0.366705 | 0.393534 | 0.233152 |
Disclaimer/Publisher’s Note: The statements, opinions and data contained in all publications are solely those of the individual author(s) and contributor(s) and not of MDPI and/or the editor(s). MDPI and/or the editor(s) disclaim responsibility for any injury to people or property resulting from any ideas, methods, instructions or products referred to in the content. |
© 2025 by the authors. Licensee MDPI, Basel, Switzerland. This article is an open access article distributed under the terms and conditions of the Creative Commons Attribution (CC BY) license (https://creativecommons.org/licenses/by/4.0/).
Share and Cite
Khan, I.U.; Jamil, M. Energy Arbitrage Analysis for Market-Selection of a Battery Energy Storage System-Based Venture. Energies 2025, 18, 4245. https://doi.org/10.3390/en18164245
Khan IU, Jamil M. Energy Arbitrage Analysis for Market-Selection of a Battery Energy Storage System-Based Venture. Energies. 2025; 18(16):4245. https://doi.org/10.3390/en18164245
Chicago/Turabian StyleKhan, Inam Ullah, and Mohsin Jamil. 2025. "Energy Arbitrage Analysis for Market-Selection of a Battery Energy Storage System-Based Venture" Energies 18, no. 16: 4245. https://doi.org/10.3390/en18164245
APA StyleKhan, I. U., & Jamil, M. (2025). Energy Arbitrage Analysis for Market-Selection of a Battery Energy Storage System-Based Venture. Energies, 18(16), 4245. https://doi.org/10.3390/en18164245


