Article

Taxonomical Analysis of Alternative Energy Sources Application in Road Transport in the European Union Countries

1
Department of Quantitative Methods, Rzeszow University of Technology, 35-959 Rzeszow, Poland
2
Department of Investment, Grupa Azoty S.A., 33-100 Tarnów, Poland
3
Department of Mechanical Engineering, Rzeszow University of Technology, 35-959 Rzeszow, Poland
*
Author to whom correspondence should be addressed.
Energies 2025, 18(16), 4228; https://doi.org/10.3390/en18164228
Submission received: 1 July 2025 / Revised: 28 July 2025 / Accepted: 5 August 2025 / Published: 8 August 2025
(This article belongs to the Special Issue Forecasting and Optimization in Transport Energy Management Systems)

Abstract

Currently, the market for cars based on alternative fuels is developing very dynamically, which is caused by the growing needs in the field of environmental protection and the desire to reduce dependence on fossil fuels. Many countries have introduced various forms of support for people who decide to buy an electric or a hybrid car. The European Union has also introduced increasingly restrictive CO2 emission standards, which accelerates the transition to alternative drives. The main research question in the paper was how the market for alternative energy sources in transport is developing in individual countries of the community, what the infrastructure looks like, and whether there is a large diversity in this field in the countries under study. The taxonomic methods (the TOPSIS method and the cluster analysis) have been applied for the research. The data were taken from Eurostat and the European Alternative Fuels Observatory statistical data. The analysis allowed an identification of key regularities that characterize the process of transformation of road transport in the European Union. Firstly, there is a clear division in countries with a high level of electrification (clusters I, IV, and VI) and countries that prefer gas drives (cluster V) or that are at an early stage of transformation (clusters II and III). Secondly, a strong relationship between the development of charging infrastructure, especially ultra-fast stations, and the level of adoption of electric vehicles was confirmed.

1. Introduction

The market for cars based on alternative fuels has developed very dynamically in the last ten years [1]. This is the result of growing needs in the field of environmental protection, the reduction of CO2 emissions, and the desire to reduce dependence on fossil fuels. In October 2014, the Directive of the European Parliament and of the Council 2014/94/EU on the deployment of alternative fuels infrastructure was adopted. Its main task was to support the use of alternative fuels in the entire transport of the European Union. Within the meaning of this directive, alternative sources of power for cars include fuels and energy sources that are to serve as a substitute for energy sources from crude oil in transport [2]. The proposal to repeal the above directive was adopted on 14 July 2021 in order to replace it with the Alternative Fuels Infrastructure Regulation (AFIR). In 2023, the Regulation of the European Parliament and of the Council on the deployment of alternative fuels infrastructure was issued, which replaced the previous Directive 2014/94/EU and established new, binding targets for Member States in the development of infrastructure for road vehicles, trains, ships, and aircraft using alternative fuels. The key assumptions of the regulation [3] include the following:
  • Mandatory national targets: Member States are required to provide an appropriate number of publicly accessible charging and refueling points for alternative fuels, distributed proportionally to the number of vehicles using these fuels.
  • Common technical specifications: Uniform technical standards for alternative fuels infrastructure have been established to ensure interoperability and ease of use throughout the European Union.
  • Information requirements and payments: Infrastructure operators are required to provide users with transparent information on availability, prices, and payment options in an easy and non-discriminatory way.
  • National policy frameworks: Each Member State must develop and submit to the European Commission a national policy framework for the development of the alternative fuels market and plans for the deployment of the relevant infrastructure.
  • Reporting mechanism: A system for regular reporting on progress towards the targets has been introduced to monitor and support the coherent development of infrastructure across the Union.
The aim of the regulation was to create a coherent and accessible network of alternative fuel infrastructure that would enable the free movement of low- and zero-emission vehicles throughout the European Union, which will contribute to reducing greenhouse gas emissions and achieving climate neutrality by 2050.
Thanks to these actions, users of vehicles powered by alternative fuels can expect a gradual improvement in the availability of charging and refueling infrastructure, which will facilitate the daily use of such means of transport.
In connection with favorable formal actions improving the infrastructure, electric, hybrid, hydrogen, and biofuel-powered vehicles are becoming increasingly popular among consumers and companies. They are also supported by governments through tax relief, subsidies, and investments in charging and refueling infrastructure [4]. Thanks to these initiatives, the market for alternative energy sources has become more accessible, and the development of technology allows for the production of cars with a longer range and better performance, which attracts more people willing to buy this type of vehicle. Subsidies for production and infrastructure construction policies can promote the adoption of electric vehicles by up to 70% [5].
Many countries, including Poland, have introduced subsidies, tax breaks, and other forms of financial support for people who decide to buy an electric or hybrid car. The European Union has also introduced increasingly restrictive CO2 emission standards, which accelerates the transition to alternative drives.
Alternative energy vehicles include the following:
  • Electric vehicles (BEV)—they use energy stored in lithium-ion or other batteries and are charged using electricity from the power grid and plug-in hybrid PHEV cars, combining an electric drive with an internal combustion engine in a configuration that allows charging from the grid and driving in purely electric or hybrid modes.
  • Hybrid cars (HEV, MHEV)—these cars combine an internal combustion engine with an electric engine, which allows fuel savings and CO2 reduction. They are chosen as an alternative to combustion vehicles, especially in cities.
  • Hydrogen cars (FCEV)—they use fuel cells that convert hydrogen into electricity, and the exhaust gases are only water vapor.
  • Biofuel cars—fuels are produced in liquid or gaseous forms from biomass (agricultural waste, algae, or oil plants).
  • Gas cars (CNG, LNG, LPG)—CNG is compressed natural gas used in passenger cars, buses, and trucks, and LNG is liquefied gas used mainly in sea and truck transport.
  • Solar cars—they use photovoltaic panels to generate electricity; solar energy can be a supplement to electric cars.
Different solutions used in vehicles have different advantages and disadvantages. Table 1 lists the most frequently mentioned advantages and disadvantages of individual solutions.
Despite the fact that the percentage of cars using alternative energy sources increases year by year, the means of transport based on fossil sources (diesel and petrol) still play an important role in road transport. The figure (Figure 1) presents the mutual dependence of the fleet of electric passenger cars (BEV) per 1000 inhabitants and the fleet of passenger cars using traditional energy sources per 1000 inhabitants in individual European Union countries in 2023. Based on the analysis of the data presented in the figure, four groups of countries marked with different colors can be distinguished. It can be seen that, in all countries, cars that use fossil fuels as an energy source are still the dominant means of passenger transport. Among them, there are countries where the indicator of cars based on alternative energy sources per 1000 inhabitants is small, below 15, but there are also countries characterized by even twice as high values (Denmark and Luxembourg).
By taking into account the introduced regulations and changes taking place in the automotive market, which are presented in Figure 1, an attempt was made to answer the following research questions:
  • How is the market for alternative energy sources in transport developing in individual EU countries?
  • What is the infrastructure and what types of fuels are the countries being studied investing in?
  • Is there any differentiation between countries in terms of introducing new technologies?
  • Which countries are best positioned on the new path of automotive development, and which have the greatest difficulties?

2. Literature Review

The issues related to the development of the transport sector using alternative, and thus ecological (zero or lower emission), power sources, such as electricity, natural gas and industrial gas (LNG, CNG, LPG), hydrogen cells (Hydrogen—H2), etc., have been widely discussed and analyzed in the scientific literature for the last 5–7 years. There are many review publications that provide a broad overview of the literature in this research field. Among many such publications, several review items should be mentioned in particular. The paper [6] presents a bibliographic and systemic review of the literature on supply chain management in the production of electric cars in the world. A systematic review of publications in this field was carried out using the PRISMA method. The results show that most works focus on the aspects of purchasing raw materials for production, environmental impact, and cost analysis. Risk management in the supply chain was relatively poorly analyzed in the studies examined. The most frequently analyzed components of electric cars were batteries, but also their other components in the context of research on the assessment of greater competitiveness in relation to conventional vehicles. The paper [7] presents a bibliographic analysis of over 17,000 articles published in the years 2011–2022, which are located in the SCOPUS database. The analysis shows that China, the United States, and the United Kingdom are leaders in research on electric vehicles and their large-scale applications. China is also a leading country in terms of research institutions and authors dealing with electric vehicles in their research. The research showed that the authors most often published their research results in the journal Energies. On the other hand, the analysis of keywords showed that their research mainly concerned electric vehicles and, in particular, battery management systems, energy storage, charging infrastructure, environmental problems, etc. The review paper [8] analyzed the literature on the impact of e-mobility on the sustainable development of cities in the context of the circular economy, distinguishing a number of important collective research areas. Then, the paper [9] contains a systematic review of bibliographic entries concerning the main factors (motivators and barriers) that influence consumers’ choice of electric vehicles as passenger cars. The main conclusion from the study conducted is that the latest literature draws attention to a wide range of determinants, without examining which of them have the greatest impact on the purchase of electric vehicles by consumers. Another conclusion is that environmental aspects are less important for consumers than it might seem (the impact of unfavorable factors related to climate change and the need to switch to renewable energy). Finally, in the work [10], scientific publications from 2015–2019 were analyzed in the context of addressing social aspects of electric vehicles, taking into account aspects such as acceptance, perception, impact, social cost, welfare, user experience, readiness, and their relationships with the sustainable development goals proposed by the UN.
Many detailed publications concern various aspects of the development of the transport sector and the market for the sale of cars powered by alternative energy sources (mainly electric cars) in individual countries of the world. Various aspects of the possibilities of development of this transport sector are discussed, and the challenges that this sector faces are analyzed, as well as its opportunities and threats.
In Poland, and in the whole of Europe, the electric car sector has also begun to develop very rapidly in recent years. Among the numerous works discussing this subject, the publication [11] should be mentioned, as it analyzes the prospects for the development of electro-mobility in Poland in areas such as the electric car market and charging station infrastructure. It indicates what necessary actions should be taken to stimulate the development of the sales market and the entire infrastructure influencing the development of electric passenger transport (BEV category M1) in Poland. It is also indicated that the entire system of legislative actions and subsidies for the purchase of electric vehicles significantly intensifies the development of electro-mobility. Similar issues were raised in the works [12,13], where environmental and economic factors that influence the development of the electro-mobility sector in Poland were examined, and attention was paid to the factors that determine the purchase of electric passenger cars, taking into account personal preferences and economic factors. The publication [14] focuses on the prospects for the development of electromobility in Poland in the context of the implemented development program (Industry 4.0). The level of development of the examined sector in Poland was compared with other selected EU countries. The works [15,16] examined the impact of infrastructure on the development of the electric car sales market in Poland in comparison to other European Union countries. The work [17] dealt with a very important problem concerning the analysis of costs related to the possession and maintenance of electric cars in Poland. The works [18,19,20] concerned important issues of implementing electromobility in urban public transport in Poland in the context of the EU goal set for the member states, i.e., a gradual transition to ecological electric transport. The results included in the work [20] are of particular importance, where the factors and mechanisms that influence the spatial sustainable development of cities in Poland were analyzed in the context of the impact of the second generation of electromobility introduced in Polish urban transport, based primarily on electric means of transport.
Numerous publications analyze the development prospects of the electric vehicle sector (an analysis of its opportunities and examination of its threats) both in personal passenger transport and urban public transport. These works also concern the analysis of supporting infrastructure, e.g., charging stations, examination of factors influencing the purchase of electric vehicles, or a review of the strategies used and incentives introduced in given countries stimulating the demand for electric cars in selected countries of the world. Such analyses were carried out for Croatia [21,22], ASEAN countries [23], Portugal [24,25], China, Europe and the USA [26], Malaysia [27], Germany [28,29], Greece [30], selected European countries and only the EU [31,32], India [33], selected European regions [34,35], or Lithuania [36].
Of particular importance, there are the analyses of strategies implemented by various countries of the world aimed at stimulating the development of the electric transport sector and the electric vehicle sales market, as well as analyses of purchasing preferences or sales market forecasts and broadly understood innovativeness of the electric vehicle sector and new technologies used there. Such issues are discussed in many works, e.g., works [37,38,39,40,41,42,43,44] are worth noting. Another important research problem is the study of the development of supporting infrastructure, e.g., concerning electric car charging stations, their capacity, efficiency, and effectiveness of network coverage of the entire country. Works [45,46,47,48,49] are devoted to this research.
Significant issues discussed in the literature include problems related to greenhouse gas emissions, e.g., CO2 in the transport sector, the life cycle of electric batteries, problems related to the ecological disposal of electric cars and their cells, etc. Such issues were discussed in [50,51,52,53,54,55,56]. The impact of the COVID19 pandemic on the electric transport sector was also analyzed in scientific papers; such studies were conducted, among others, in publications [57,58]. The studies [59,60,61] were devoted to the study of the development of electromobility in cities in the context of sustainable development of cities of the future and zero-emission transport (the so-called Smart City concept). Electric transport is not the only zero-emission type of transport that has been developing dynamically in recent years. In the last few years, the expansion of transport based on hydrogen cells has become increasingly visible. These issues were also discussed in the literature on the subject, e.g., in [62,63,64].
The above review of the current literature shows that there are relatively few publications that comprehensively address the use of statistical and taxonomic methods in examining the development of road transport using alternative energy sources from a multi-faceted perspective. This is in terms of the development of the transport fleet (passenger cars, public transport vehicles, freight vehicles), the infrastructure supporting the vehicle fleet (charging stations, refueling of alternative fuels), and its efficiency and availability, as well as the effectiveness of implementing the policy of phasing out fossil fuels and the green transformation in various countries around the world, including the European Union.
The following section of the literature analysis provides a detailed analysis of works that specifically address very similar issues discussed in this publication and employ similar research methods (TOPSIS analysis, the Ward cluster analysis), with particular emphasis on identifying potential research gaps, expanding research to include possible new research areas, and applying new analytical methods.
In the work [54], already mentioned in this section, an analysis of the ecological efficiency of electric cars in European countries was conducted. However, the analysis was limited to the following three areas: energy consumption, greenhouse gas emissions, and water consumption. The PCA (principal component analysis) method was used to determine the so-called EES (eco-efficiency scores) in the three areas of electric car use in EU countries. Cluster analysis (k-means) was used to determine three homogeneous groups of EU countries similar in terms of the ecological efficiency of electric vehicles measured by EES indicators. The analysis of the optimal number of clusters was performed using the following known validation measures: Dunn, Connectivity, and Silhouette. The results were not compared using other research methods, such as the Ward method. In the publication [49], also mentioned earlier in this section, a taxonomic analysis was conducted to compare the use of innovative energy technologies, mainly electricity and renewable energy in transport in selected EU countries. The study was conducted only for 2019. Only seven diagnostic variables were used, describing the share of renewable energy used in transport, the fleet of electric and hybrid passenger and freight vehicles, and their CO2 emissions. Four groups of similar countries were identified using taxonomic analysis using the Ward’s method, and these clusters were characterized. However, no comparative analyses were conducted to identify which variables dominated within the clusters. There were also no validation analyses performed to determine the optimal number of clusters, to compare results with other methods (e.g., k-means), or to compare results to several previous years. The selection of diagnostic variables could also be expanded to include variables describing the development of charging and refueling infrastructure for vehicles powered by ecological energy sources, or indicators of the implementation of the AFIR targets. Our approach presented in this paper significantly expands on these analyses and the results obtained in this regard. In the next paper, mentioned above [16], the results of previous analyses were expanded by developing an econometric model (however, without taking into account changes over time) that describes the relationship between the new electric car registration rate and the following six factors: the share of renewable energy in electricity production, national income per capita, electricity prices, the number of fast and basic charging stations, and battery electric vehicle benefits. A thorough verification of the estimated model was performed, but because the variables in the model are not time series, the model cannot be used for forecasting. Using Ward’s method, two groups of countries similar in terms of the indicators used were identified. No validation analyses were conducted to determine the optimal number of clusters, compare results with other methods, or investigate which variables had the greatest impact on the clusters. In [65] (which addresses the general issue of the effectiveness of implementing alternative energy sources and the Green Deal, not necessarily in transport), the TOPSIS method was used to determine a synthetic measure describing the effectiveness of implementing the green transformation strategy (GG—green growth strategy) in EU countries using a large number of factors, as many as 51. These factors were divided into the following five main groups: environmental and resource productivity, natural asset base, environmental dimensions of quality of life, economic opportunities and policy responses, and socio-economic context. A novelty compared to previous work is the use of the TOPSIS measure to determine four clusters of similar countries. The rankings determined using all variables and within each group of analyzed factors allowed for the examination of changes in the rankings from year to year, which is also an interesting result. Although our study does not include studies conducted over several years, such supplementary studies are planned for the future. Importantly, a correlation coefficient analysis (Kendall and Pearson) was also carried out to examine the stability of the determined rankings. However, the authors did not compare the obtained results with other methods. In [66], the use of alternative renewable energy sources in transport was examined using the TOPSIS methodology. However, only a very narrow set of diagnostic variables was considered, including only three indicators describing the use of renewable energy sources in transport (percentage, per capita, and per unit of national income GPD). No other important factors related to infrastructure or the implementation of green energy transition goals were considered. It should be emphasized that the CCSD method was used to select the variable importance weights. Our approach uses a similar CRITIC method and considers rankings without weights and with weights also determined using the percentage coefficient of variation method. The final average ranking in our approach, which is a novelty, takes into account the results obtained in all variants. Based on the results of the TOPSIS analysis in [66], five clusters of countries were determined, ranging from very low to very high levels of renewable energy use. Therefore, the results were not compared with other methods and were not validated.
Other multi-criteria decision support (MCDA) methods, such as AHP, ELECTRE, and PROMETHEE, are also applied in analyses of the use of alternative energy sources in transport in various aspects and in the planning processes for sustainable energy development in countries. The analyses in various research areas using these methods can be found in [67,68,69]. However, these publications are not strictly related to the research area similar to ours. Rather, they are reviews of current research results loosely related to the topic of the research presented in this work.
When summarizing the literature review, it should be noted that the research results presented in this work constitute a clear and significant contribution to expanding existing research that analyzes the level of development of alternative fuels in transport in European countries. The research methods used in the work are known and were applied before, but it uses and compares the results obtained using different variants and approaches, applying different research methods, adopting a wide spectrum of diagnostic variables, and providing numerous conclusions and practical recommendations for the studied countries aimed at stimulating their transition to green energy sources.

3. Materials and Methods

To determine the ranking of European Union countries according to the level of development of the transport sector based on alternative, ecological energy sources, a commonly used method of linear ordering of objects was applied, using the TOPSIS methodology (Technique for Order Preference by Similarity to Ideal Solution) [70] with the Euclidean measure of distance between research objects. A matrix characterizing the researched objects according to several evaluation criteria (quantitative features) is given as follows: X = X i j , i = 1 , , m ; j = 1 , , n , where n is the number of diagnostic variables, and m is the number of studied objects (EU countries).
The calculation procedure used to determine the ranking for European Union countries was as follows:
  • It is expected that all diagnostic variables X j will be treated as stimulants or de-stimulants. The features characterized as nominants will be converted to corresponding stimulant values by the following transformation:
X i j = m i n n o m j ; X i j N m a x n o m j ; X i j N ,
where: X i j N is the value of the j-th nominant observed for the j-th object, and n o m j is the nominal value of the j-th variable.
2.
The matrix of normalized values for diagnostic variables is determined using the Unitarization procedure (aimed at transforming the values of all diagnostic variables to their comparable values in the interval [0,1]):
Z i j = X i j min i X i j max i X i j min i X i j ,
where min i X i j is the minimum value of the j-th diagnostic variable before normalization, and max i X i j is the maximum value of the j-th diagnostic variable before normalization.
3.
Three variants of the ranking were applied. In the first variant, the same weights were assumed for all diagnostic variables, taking into account their equal contribution to the rankings, while in the second variant, an individual weight system was adopted for each diagnostic variable w j 0,1 ; j = 1 n w j = 1 . The weights were determined according to the formula w j = V s j j = 1 n V s j , where V s j is the percentage coefficient of variation for the j-th diagnostic variable. Therefore, the variable made a greater contribution to the ranking; the greater its variability, the more it differentiated the studied objects [71]. The third variant of determining the contribution of diagnostic variables to the final value of the aggregated TOPSIS measure consisted of determining weights using the CRiteria Importance Through Intercriteria Correlation (CRITIC) method. The normalized values for the ranking variant with different weights were, therefore, multiplied by their corresponding weights Z i j = w j · Z i j , while, for the ranking version with equal weights, it was assumed Z i j = Z i j .
4.
Coordinates for pattern vector a + (ideal solution) for optimum values of diagnostic variables and anti-pattern vector a (anti-ideal solution) for the worst values of diagnostic variables are determined according to the following formulas:
a + = a 1 + , a 2 + , , a n + max i = 1 , , m Z i j | j J S , min i = 1 , , m Z ij | j J D ,
a = a 1 , a 2 , , a n min i = 1 , , m Z i j | j J S , max i = 1 , , m Z i j | j J D ,
where J S is the set of stimulants, while J D is the set of de-stimulants.
5.
The distances of the i-th object from the E D M i + formula and E D M i anti-formula were determined. The calculations used the EDM (Euclidean distance measure) as follows:
E D M i + = j = 1 n Z i j a j + 2 ,
E D M i = j = 1 n Z i j a j 2 ,
6.
An aggregate measure (ranking index) corresponding to the degree of similarity of the investigated objects to the ideal solution is determined according to the following formula:
T O P S I S   E D M R i = E D M i E D M i + E D M i + ,
for i = 1,…,m; where 0 R i 1 .
7.
The objects are placed in a decreasing order depending on the value of measure R i , and the final ranking is generated for the objects (European Union countries). The greater the values of the calculated synthetic index for the country, the higher the country’s position in the ranking.
Ward’s method and the k-mean’s method were applied to determine clusters of similar European Union countries in terms of the degree of use of alternative energy sources in road transport and the level of development of infrastructure for servicing and charging vehicles powered by alternative fuels.
The agglomeration cluster analysis method proposed by Ward [72] uses the variance analysis approach to estimate the distance between clusters. In this method, the sum of squared deviations of any two clusters that can be formed at each stage is minimized. It is considered a very effective method, although it tends to create clusters of small size; it also provides full control over the resulting number of groups and presents the most natural clusters of grouped elements.
The clustering algorithm in Ward’s method consists of several steps and is performed as follows:
  • A matrix of taxonomic distances is determined (the Euclidean distance is assumed in the calculations, as in the TOPSIS method) with dimensions n × n , which represents the distance of each pair of objects from each other. This matrix is a symmetric matrix with respect to the main diagonal, which contains zeros.
  • A pair of object indices (“p” and “q”, p < q) is found, and in further iterations of the algorithm, the components of the clusters for which the mutual distance is minimal.
  • The objects (or clusters) “p” and “q” are combined into one new cluster, which occupies the position with the number “p”. At the same time, the object (cluster) with the number “q” is removed, and the numbers of the clusters with a number higher than it are reduced by one. In this way, the dimension of the distance matrix is reduced by 1.
  • The distance of the newly created cluster from each remaining cluster “r” is determined (r takes values different from p and q) according to the following formula:
D p r = a 1 · d p r + a 2 · d q r + b · d p q ,
where D p r is the distance of new cluster “p” from any cluster “r”, d p r is the distance of the original cluster “p” from any cluster “r”, d q r is the distance of the original cluster “q” from any cluster “r”, and d p q is the mutual distance for primary clusters “p”.
The values of parameters a 1 , a 2 , b are determined according to the following formula:
a 1 = n p + n r n p + n q + n r , a 2 = n q + n r n p + n q + n r , b = n r n p + n q + n r ,
In Formula (9), n P , n q , n r denote the numbers of individual objects in individual clusters.
The iterative steps are repeated until all individual objects are combined into one large n-element cluster.
In the paper, statistical data sources were used regarding the fleet of vehicles powered by alternative fuel sources in the European Union countries and their supporting infrastructure [73] and also Eurostat data regarding motor vehicles powered by traditional fuel sources (petrol, diesel) [74], as well as data on the population in EU countries [75].
The k-means method belongs to the group of cluster analysis algorithms, i.e., the analysis involving the search for and separation of groups of objects similar in terms of the analyzed characteristics. It is a non-hierarchical method. The main difference between non-hierarchical and hierarchical algorithms is the need to pre-specify the number of clusters. Using the k-means method, k different, possibly distinct, clusters are created. The algorithm involves moving objects from cluster to cluster until the variability within and between clusters is optimized. The similarity within a cluster should be as high as possible, while individual clusters should be as different from each other as possible. The principle of the algorithm is as follows: the number of clusters is determined. One method used to determine the number of clusters is to arbitrarily select it and then modify it to obtain better results. The choice of the number of clusters can also be based on the results of other analyses. In the next step, the initial cluster centers are determined. Cluster centers, also known as centroids, can be selected in the following several ways: randomly selecting k observations, selecting the first k observations, or selecting them to maximize cluster distances. One of the most commonly used methods is to run the algorithm several times and select the best model after initially selecting random cluster centers. The distances of objects from the cluster centers are then calculated. The choice of metric is a crucial step in the algorithm. It influences which observations will be considered similar and which will be too different. The most commonly used distance metric is the Euclidean distance. The objects are assigned to clusters. For a given observation, the distances from all clusters are compared and assigned to the cluster with the closest center. New cluster centers are established. Most often, the new cluster center is a point whose coordinates are the arithmetic mean of the coordinates of the points belonging to a given cluster. The previous operations are repeated until the stopping condition is met. The most commonly used stopping condition is the number of iterations specified at the beginning or no shifting of objects between clusters [76].

4. Results

Characteristics of Diagnostic Variables Used in the Research

Among many available indicators that characterize the developing market of cars based on alternative fuels, fifteen variables were selected that describe the percentage share of individual types of cars with different drives in the total fleet, new registrations of these cars, features responsible for the infrastructure, charging and fast charging possibilities, and other characteristics of the market of cars powered by alternative fuels. In Table 2, some selected indicators are characterized using descriptive statistics.
Firstly, it should be pointed out that all the features adopted for the study are characterized by high variability, and in each case, the coefficient of variation is higher than 10%, which is considered the limit of homogeneity of the community. The greatest variability occurs for the variable X10 and amounts to 336%, and the most homogeneous in the countries studied is the indicator X13, which amounts to only 33%, which means that the countries studied are at a similar level in terms of this feature.
X1Fleet (passenger cars) as [%] of total fleet (BEV + PHEV). On average, around 6% of electric or hybrid cars are registered in the countries. The smallest number occurs in Poland and amounts to 0.51%, while the largest number of such cars is registered in Luxembourg (15.67%). The distribution shows right-side asymmetry, which means that, in most of the countries studied, the percentage of electric and hybrid cars is lower than the average.
X2Fleet (passenger cars) as [%] of total fleet (LPG, CNG, LNG). The average percentage share of passenger cars powered by LPG, CNG, and LNG is 2.04%, and the median is 0.31%; thus, in most countries, the percentage share of cars powered by this fuel is lower than average. It is the smallest in France and amounts to 0.003%, while the highest is in Poland and reaches as much as 16.26%.
X3New registrations (passenger cars) as [%] of total registrations (BEV + PHEV). This variable represents new registrations of electric and hybrid passenger cars. The average is almost 44%, which is a high share of these cars in the total number of registrations, and the median is 46.3%, which means that there is a left-side asymmetry, meaning that, in most countries, the percentage of newly registered electric and hybrid cars is higher than average. The fewest vehicles of this type are registered in Bulgaria (0.72%), and the most are in Finland (77.58%).
X4New registrations (passenger cars) as [%] of total registrations (LPG, CNG, LNG). The average share of newly registered LPG, CNG, and LNG passenger cars is 1.82%, so the percentage is not large. There are countries where no such registrations were recorded at all. These were Denmark, Ireland, and Cyprus, while the largest number of new registrations of this type of passenger car was recorded in Romania (12.22%). The median was 0.54%, which indicates that, in most countries, the percentage of newly registered passenger cars powered by LPG, CNG, and LNG is below the average.
X5New registrations (passenger cars) as [%] of total registrations (H2). This is an indicator that most countries have a value of 0%, meaning that there are no such cars in registration. This is the case in Ireland, Greece, Croatia, Cyprus, Lithuania, Latvia, Luxembourg, Hungary, and Malta, as well as in Romania, Slovenia, and Finland. The average share is small and amounts to 0.0028% of all newly registered passenger cars. The median is lower than the average; thus, in most countries, the percentage of newly registered hydrogen-powered cars is lower than the average. The largest number of newly registered hydrogen-powered passenger cars is in Poland and France (0.02%).
X6New registrations (vans and buses) as [%] of total new registrations (BEV + PHEV). Another indicator is the share of newly registered vans and buses powered by electricity and hybrids. The average level of this type of car in new registrations is around 24%. The median is 16%, which means a large right-hand asymmetry; thus, there are many more countries whose level of the indicator is lower than the global average. The fewest such cars were registered in The Czech Republic (3.14%) and the most in Romania (62.01%).
X7New registrations (vans and buses) as [%] of total new registrations (LPG, CNG, LNG). The average number of registered new vans and buses powered by LPG, CNG, and LNG is around 4.5%, and the median is slightly lower at the level of 1.25%, which means that, in most countries, there were fewer of these registrations than the average for all EU countries. In several countries, no such new registrations were recorded at all; these were Bulgaria, Cyprus, and Malta. The largest percentage of new cars of this type is in Italy (21.7%).
X8New registrations (trucks) as [%] of total registrations (BEV + PHEV). The average percentage of newly registered trucks with electric and hybrid drive was at the level of 1.17% and the median was even lower, which means that, in most countries, the percentage of cars with such drive was lower than the global average. In Bulgaria and Malta, there were none at all, and the highest share of cars with such drive was in The Netherlands (7.22%).
X9New registrations (trucks) as [%] of total registrations (LPG, CNG, LNG). The average percentage of registrations of new LPG-, CNG-, and LNG-powered trucks is around 3%; the median of 0.33% indicates that, in most countries, this share is lower than average. No such registrations were recorded at all in Bulgaria, Croatia, Cyprus, and Malta, while Latvia had the largest share (39.61%).
X10Year-over-year growth [%] in recharging points AC (charging with alternating current). One of the indicators characterizing the level of use of alternative sources for powering vehicles is the increase in charging points (year-on-year increase). The average increase in charging points is 12.21%, while, in most countries, the increase was below the average. The smallest was in Croatia, where a very large decrease of −26.07% was recorded. On the other hand, the largest increase took place in Estonia by 211.01%.
X11AC recharging points (Fast Speed) as [%] of total AC recharging points. The average share of fast charging stations in total charging points is around 7.85%. The median is lower than the average of 1.98; thus, in most countries, this share is lower than the average for the entire group of countries. The smallest share of fast charging stations is characterized by Estonia at 0%, and the highest percentage share is recorded in Malta at 100%.
X12DC recharging points (ultra-fast level 1 and level 2) as [%] of total DC recharging points. The average share of ultra-fast charging stations using direct current in the total number of charging stations using direct current is about 42%. The median was lower than the average; thus, in most countries, this share is lower than the average for the entire group of countries. The smallest share of ultra-fast charging stations is characterized by Malta at 0%, and the highest percentage share is recorded in Luxembourg at 87.15%.
X13Unrestricted accessibility (24/7) recharging points as [%] of total recharging points. The average share of charging points with unlimited accessibility is 66.33%. The median is 70.36%, which indicates that, in most countries, there are more such points than the average for all countries. The smallest share of unrestricted charging points is in Sweden at 22.33%, and the highest is in Malta at 96.04%.
X14Number of LPG vehicles per LPG refueling point. The next indicator analyzed was the number of LPG-powered cars per refueling point. On average, in the countries studied, there are 129.76 cars per charging point. The median is 111.78 cars, which means that, in most countries, the number of cars per refueling point is lower than average. The smallest is in Sweden, at 0.28 cars per station, and the largest is in Poland, at 651 cars per station.
X15AFIR (output/target) [%]. According to Article 3.1 of the Alternative Fuels Infrastructure Regulation (AFIR) [3], Member States are required to facilitate the deployment of publicly accessible charging stations for light-duty vehicles, in proportion to the adoption rates of electric vehicles in their territories. In particular, the AFIR dictates the following annual cumulative power output targets for charging infrastructure:
  • Battery Electric Light-Duty Vehicles (BEV): Each BEV registered in a Member State must be served by a minimum total power output of 1.3 kW from publicly accessible charging stations.
  • Plug-in Hybrid Electric Vehicles (PHEV): Each registered PHEV must have a minimum total power output of 0.8 kW from publicly accessible charging stations.
These objectives ensure that infrastructure deployment is consistent with vehicle use, thus supporting broader EU environmental and mobility objectives. The achievement of these aims is assessed by comparing the actual power output available through public infrastructure to the calculated target power output, facilitating transparent and objective monitoring of progress towards AFIR compliance. The average target achievement in the countries studied was 295.39%, and the median was slightly higher, which indicates that most countries achieved the target above average. The lowest indicator value was in Malta with 12.12%, and the highest was in Lithuania with 619.53%. The next step in the research was to conduct a correlation analysis to check whether there is a strong correlation between the indicators. The variables taken into account in the study should not be too closely related because, in this case, they convey the same information. The relationships are given in the correlation matrix in Table 3.
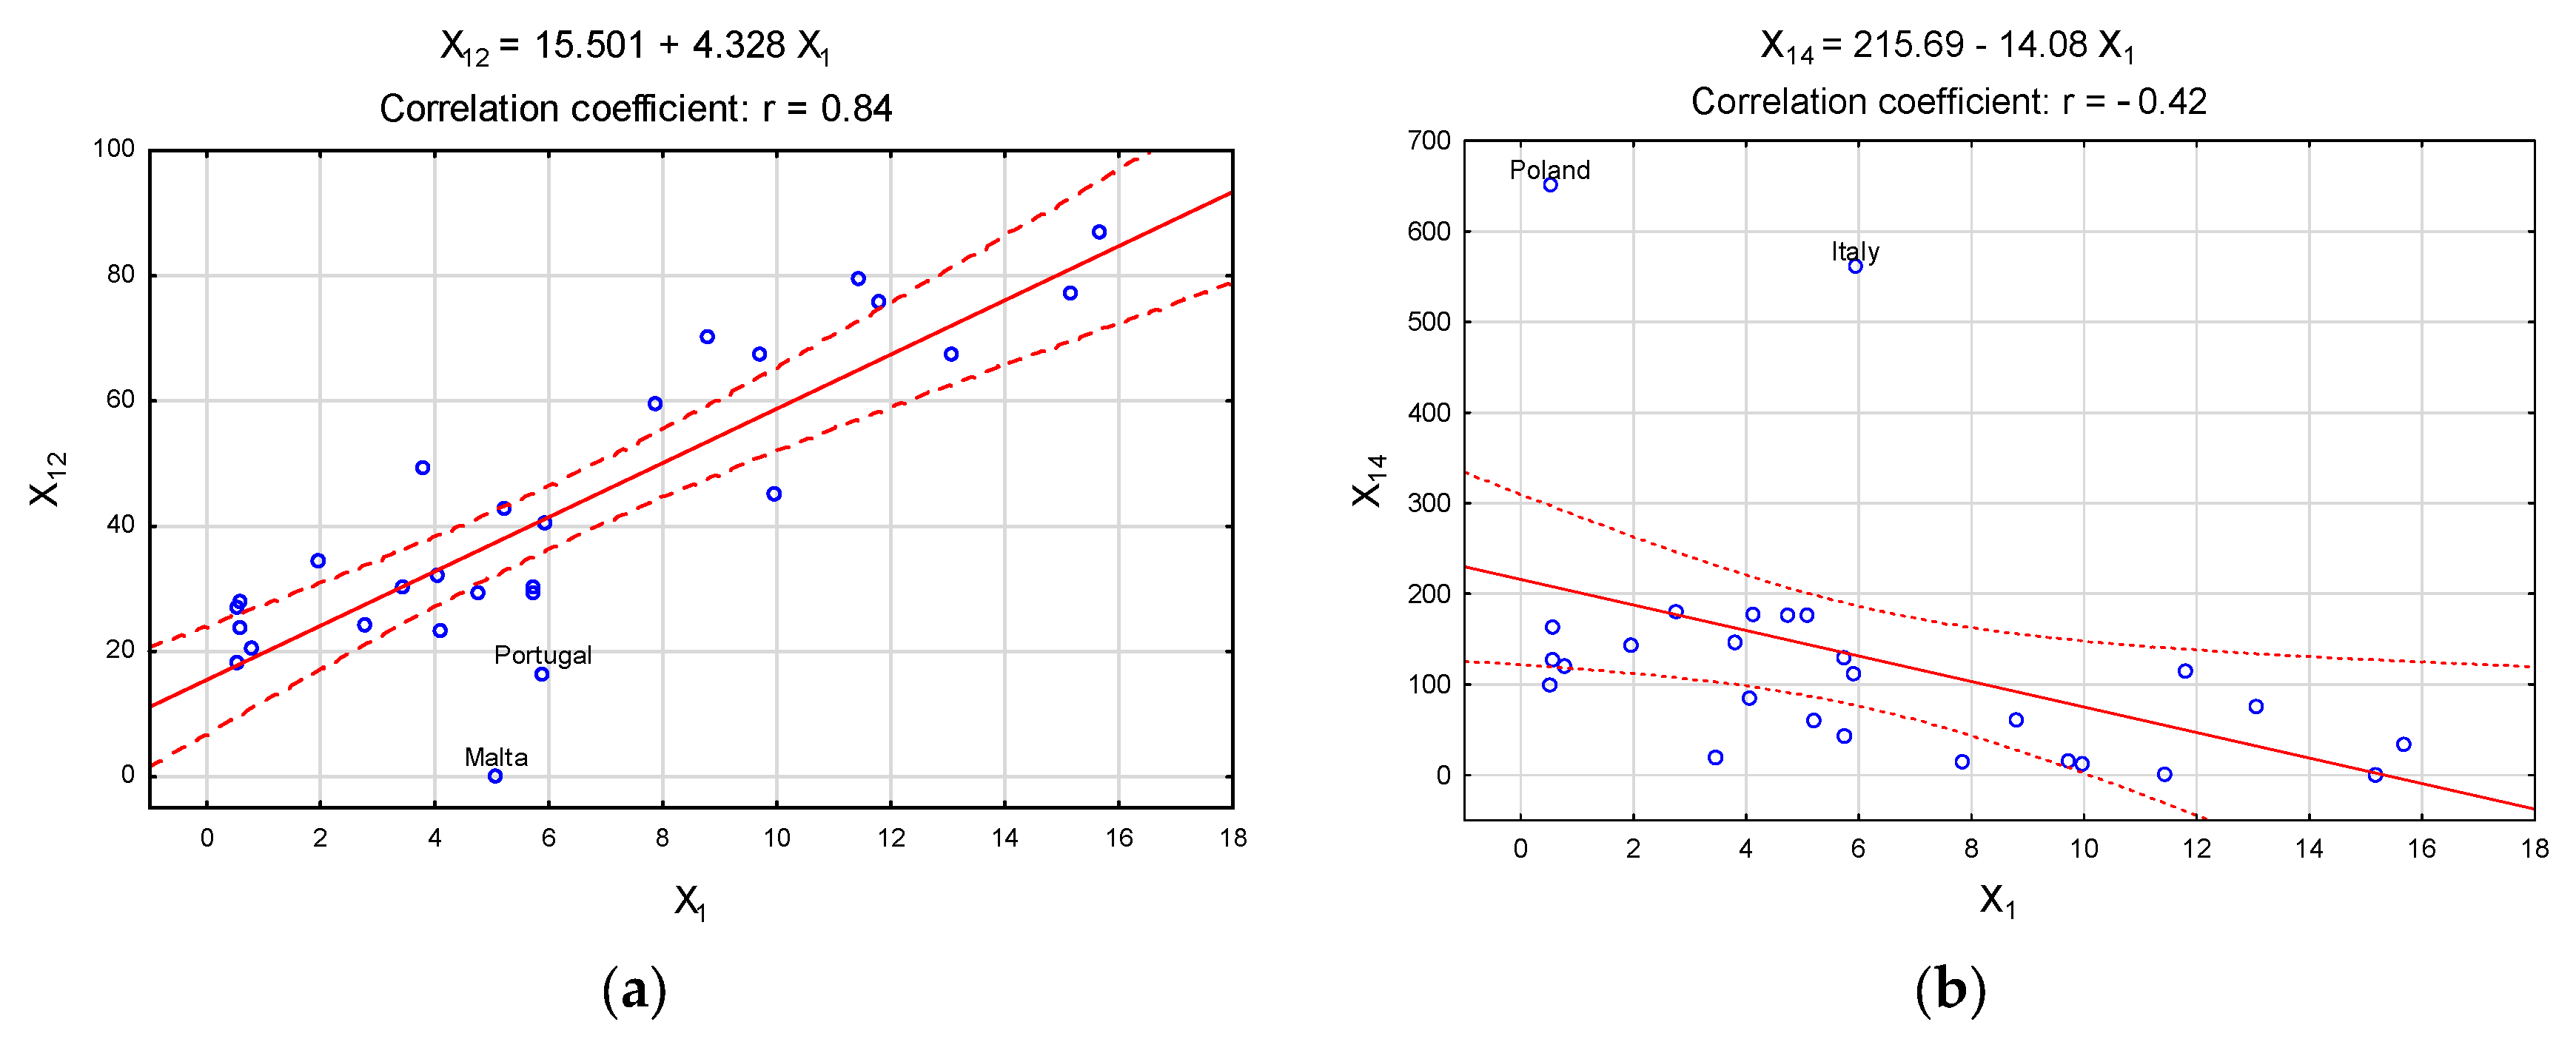
It is worth noting that there are no large collinear dependencies in the correlation matrix. The highest correlation coefficient is between X1 and X12 and amounts to 0.84, so it does not exceed 90%. This is a high positive dependency and is directly proportional to the increase in X1 fleet (passenger cars) as [%] of total fleet [BEV + PHEV], the value of X12 increases, i.e., the number of DC recharging points (ultra-fast level 1 and level 2) as [%] of total DC recharging points. On the other hand, the largest negative dependency is between X1 and X14, and it amounted to −0.42, which means that, with the increase in X1 fleet (passenger cars) as [%] of total fleet [BEV + PHEV], the value of X14 decreases, which is the number of LPG vehicles per LPG refueling point. The dependencies are presented in scatterplots (Figure 2a,b).
In the figures (Figure 2a,b), some outliers can be seen. In the first one, there are two countries located under the regression line, namely Malta and Portugal, where very low X12 indices were recorded. On the other hand, in the graph (b), there are also two countries that have very high values of the indicator in this case, X14, and these are Poland and Italy, respectively.
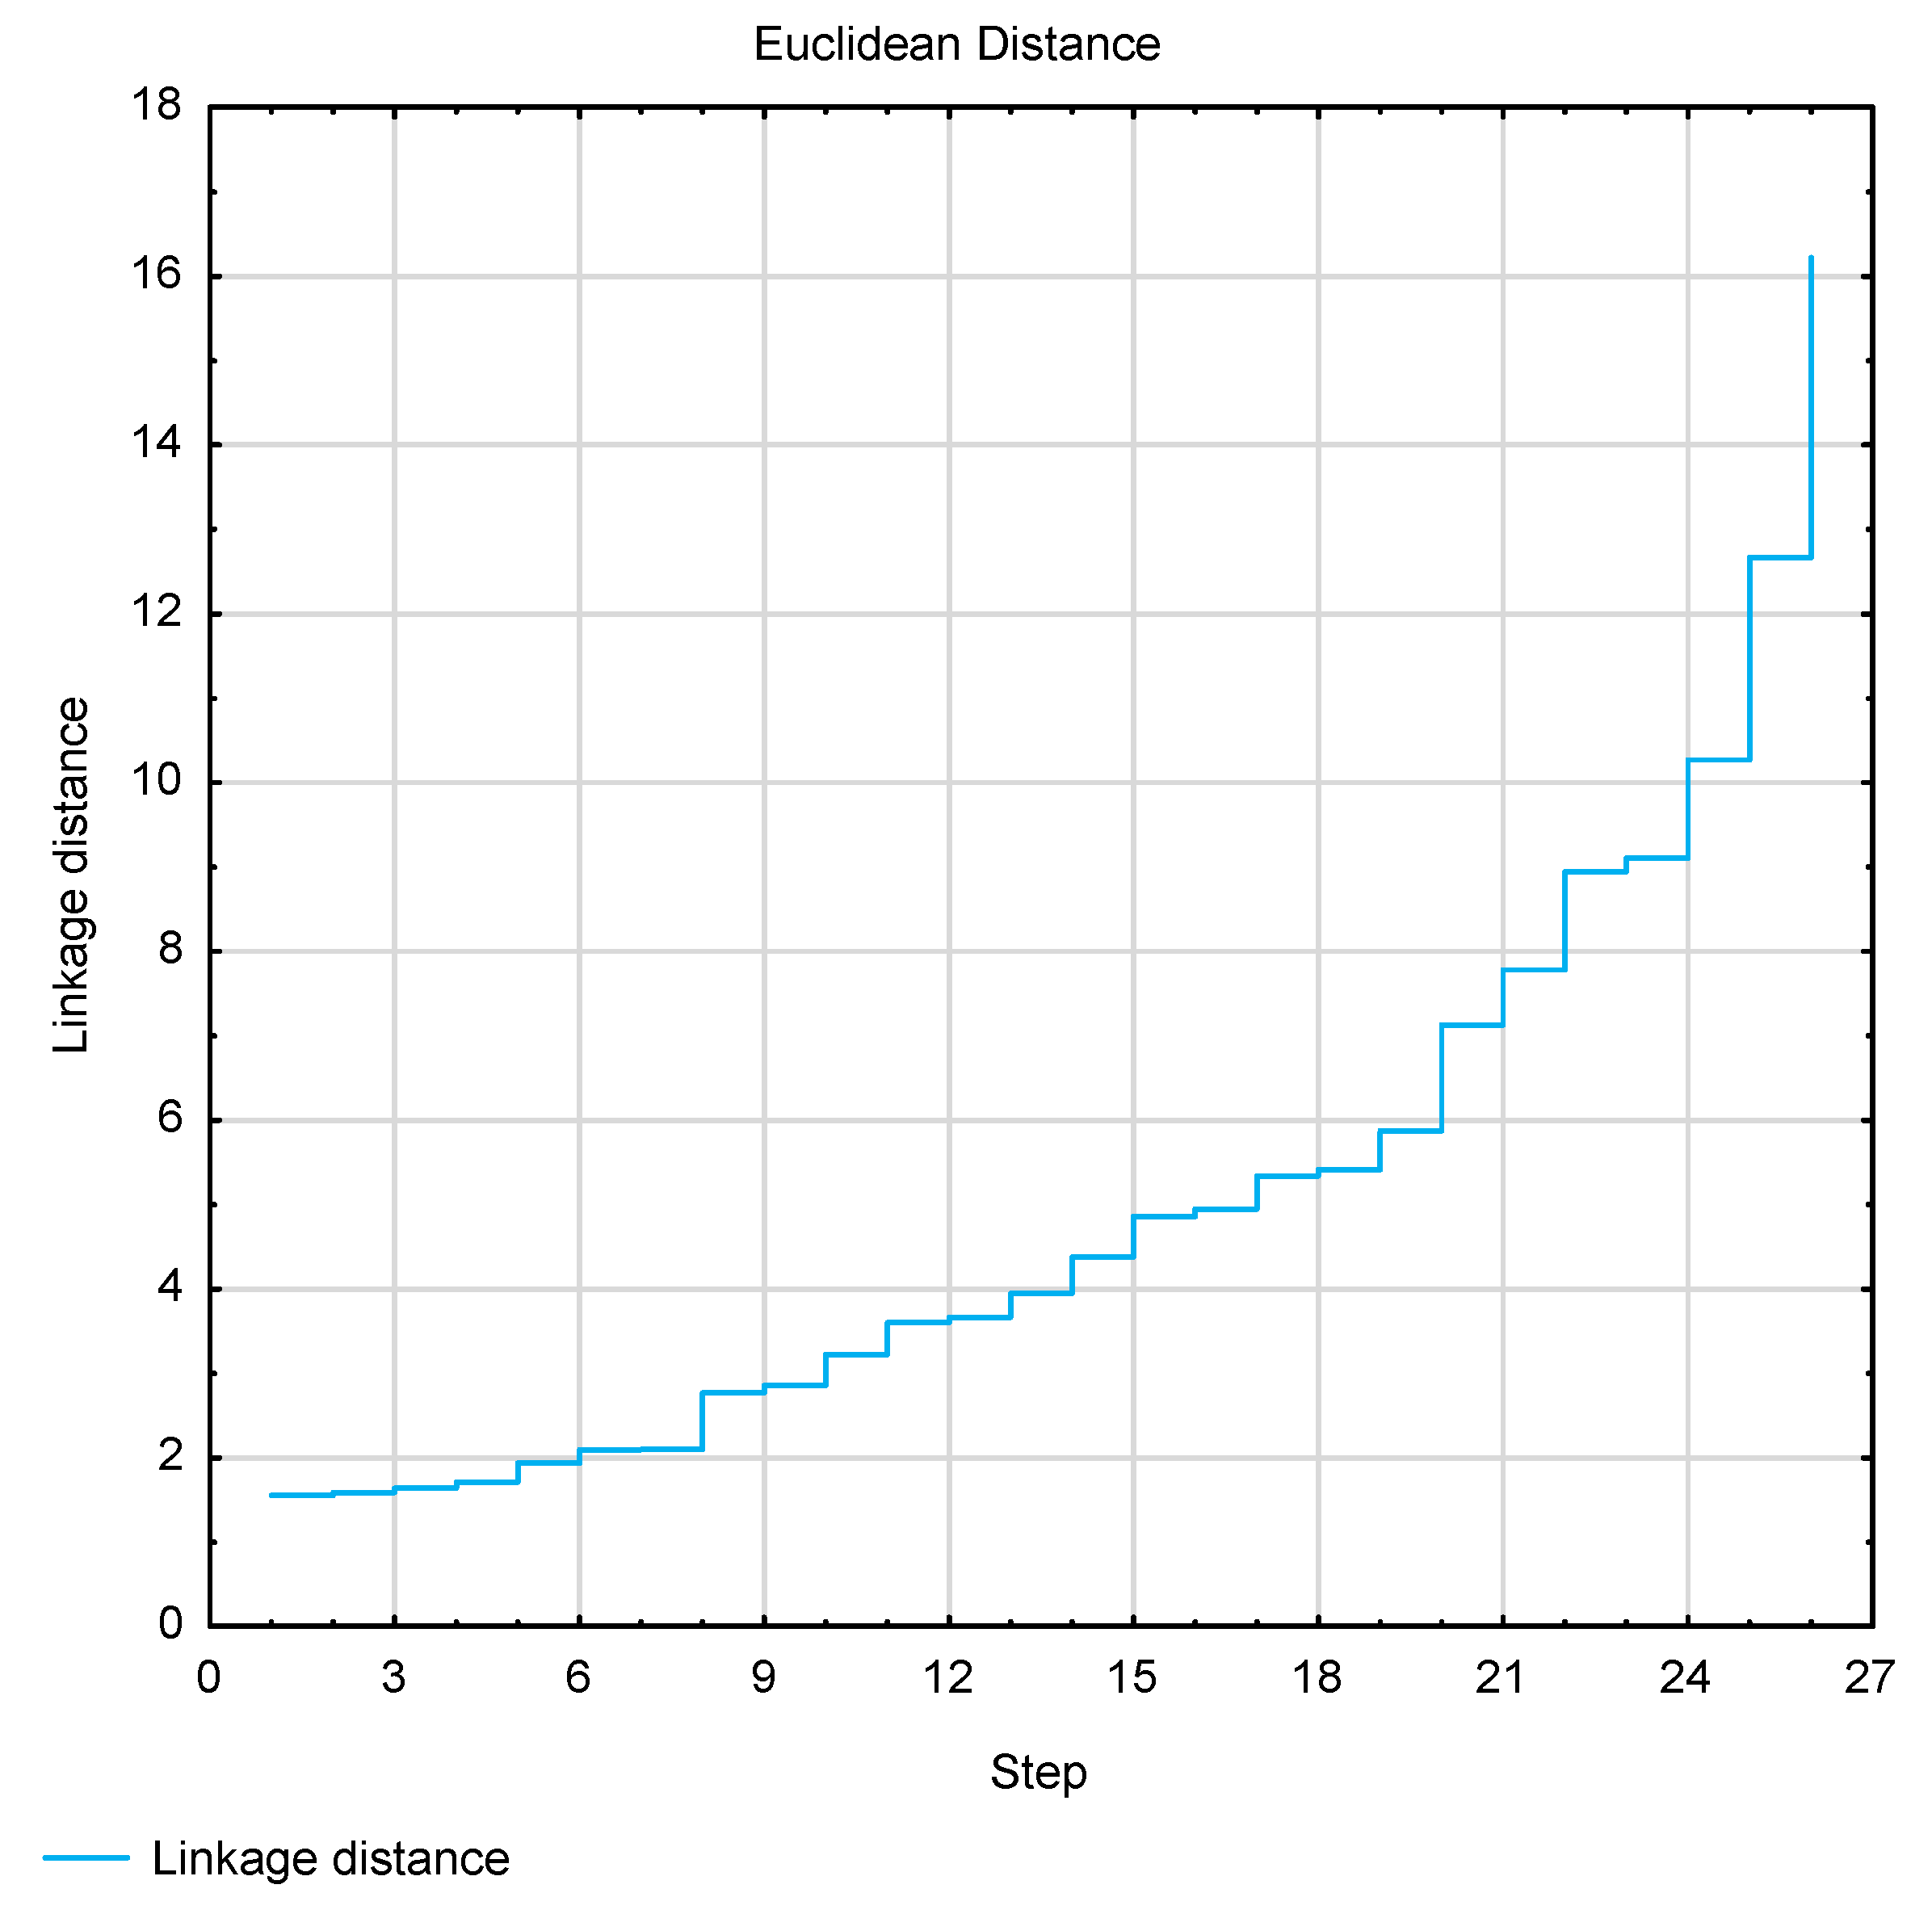
For the selected indicators, a cluster analysis was carried out, which aimed to distinguish European Union countries similar to each other in terms of the development of new technologies concerning the implementation of alternative energy sources powering vehicles. The Ward agglomeration method based on minimizing variance in the created clusters was selected for the research. Euclidean distance was adopted for the research. In the first stage, an analysis of the course of cluster agglomeration was carried out. Four indices were used to determine the number of clusters, and the results are presented in Table 4.
The analyses conducted indicate that there are the following two optimal divisions: one into six clusters, as indicated by the Hubert-Levin and Tibshirani, Walther, and Hastie methods, and one into eight clusters, as indicated by the Davies–Bouldin and Baker-Hubert methods. This is also clearly illustrated in the scree plot in Figure 3.
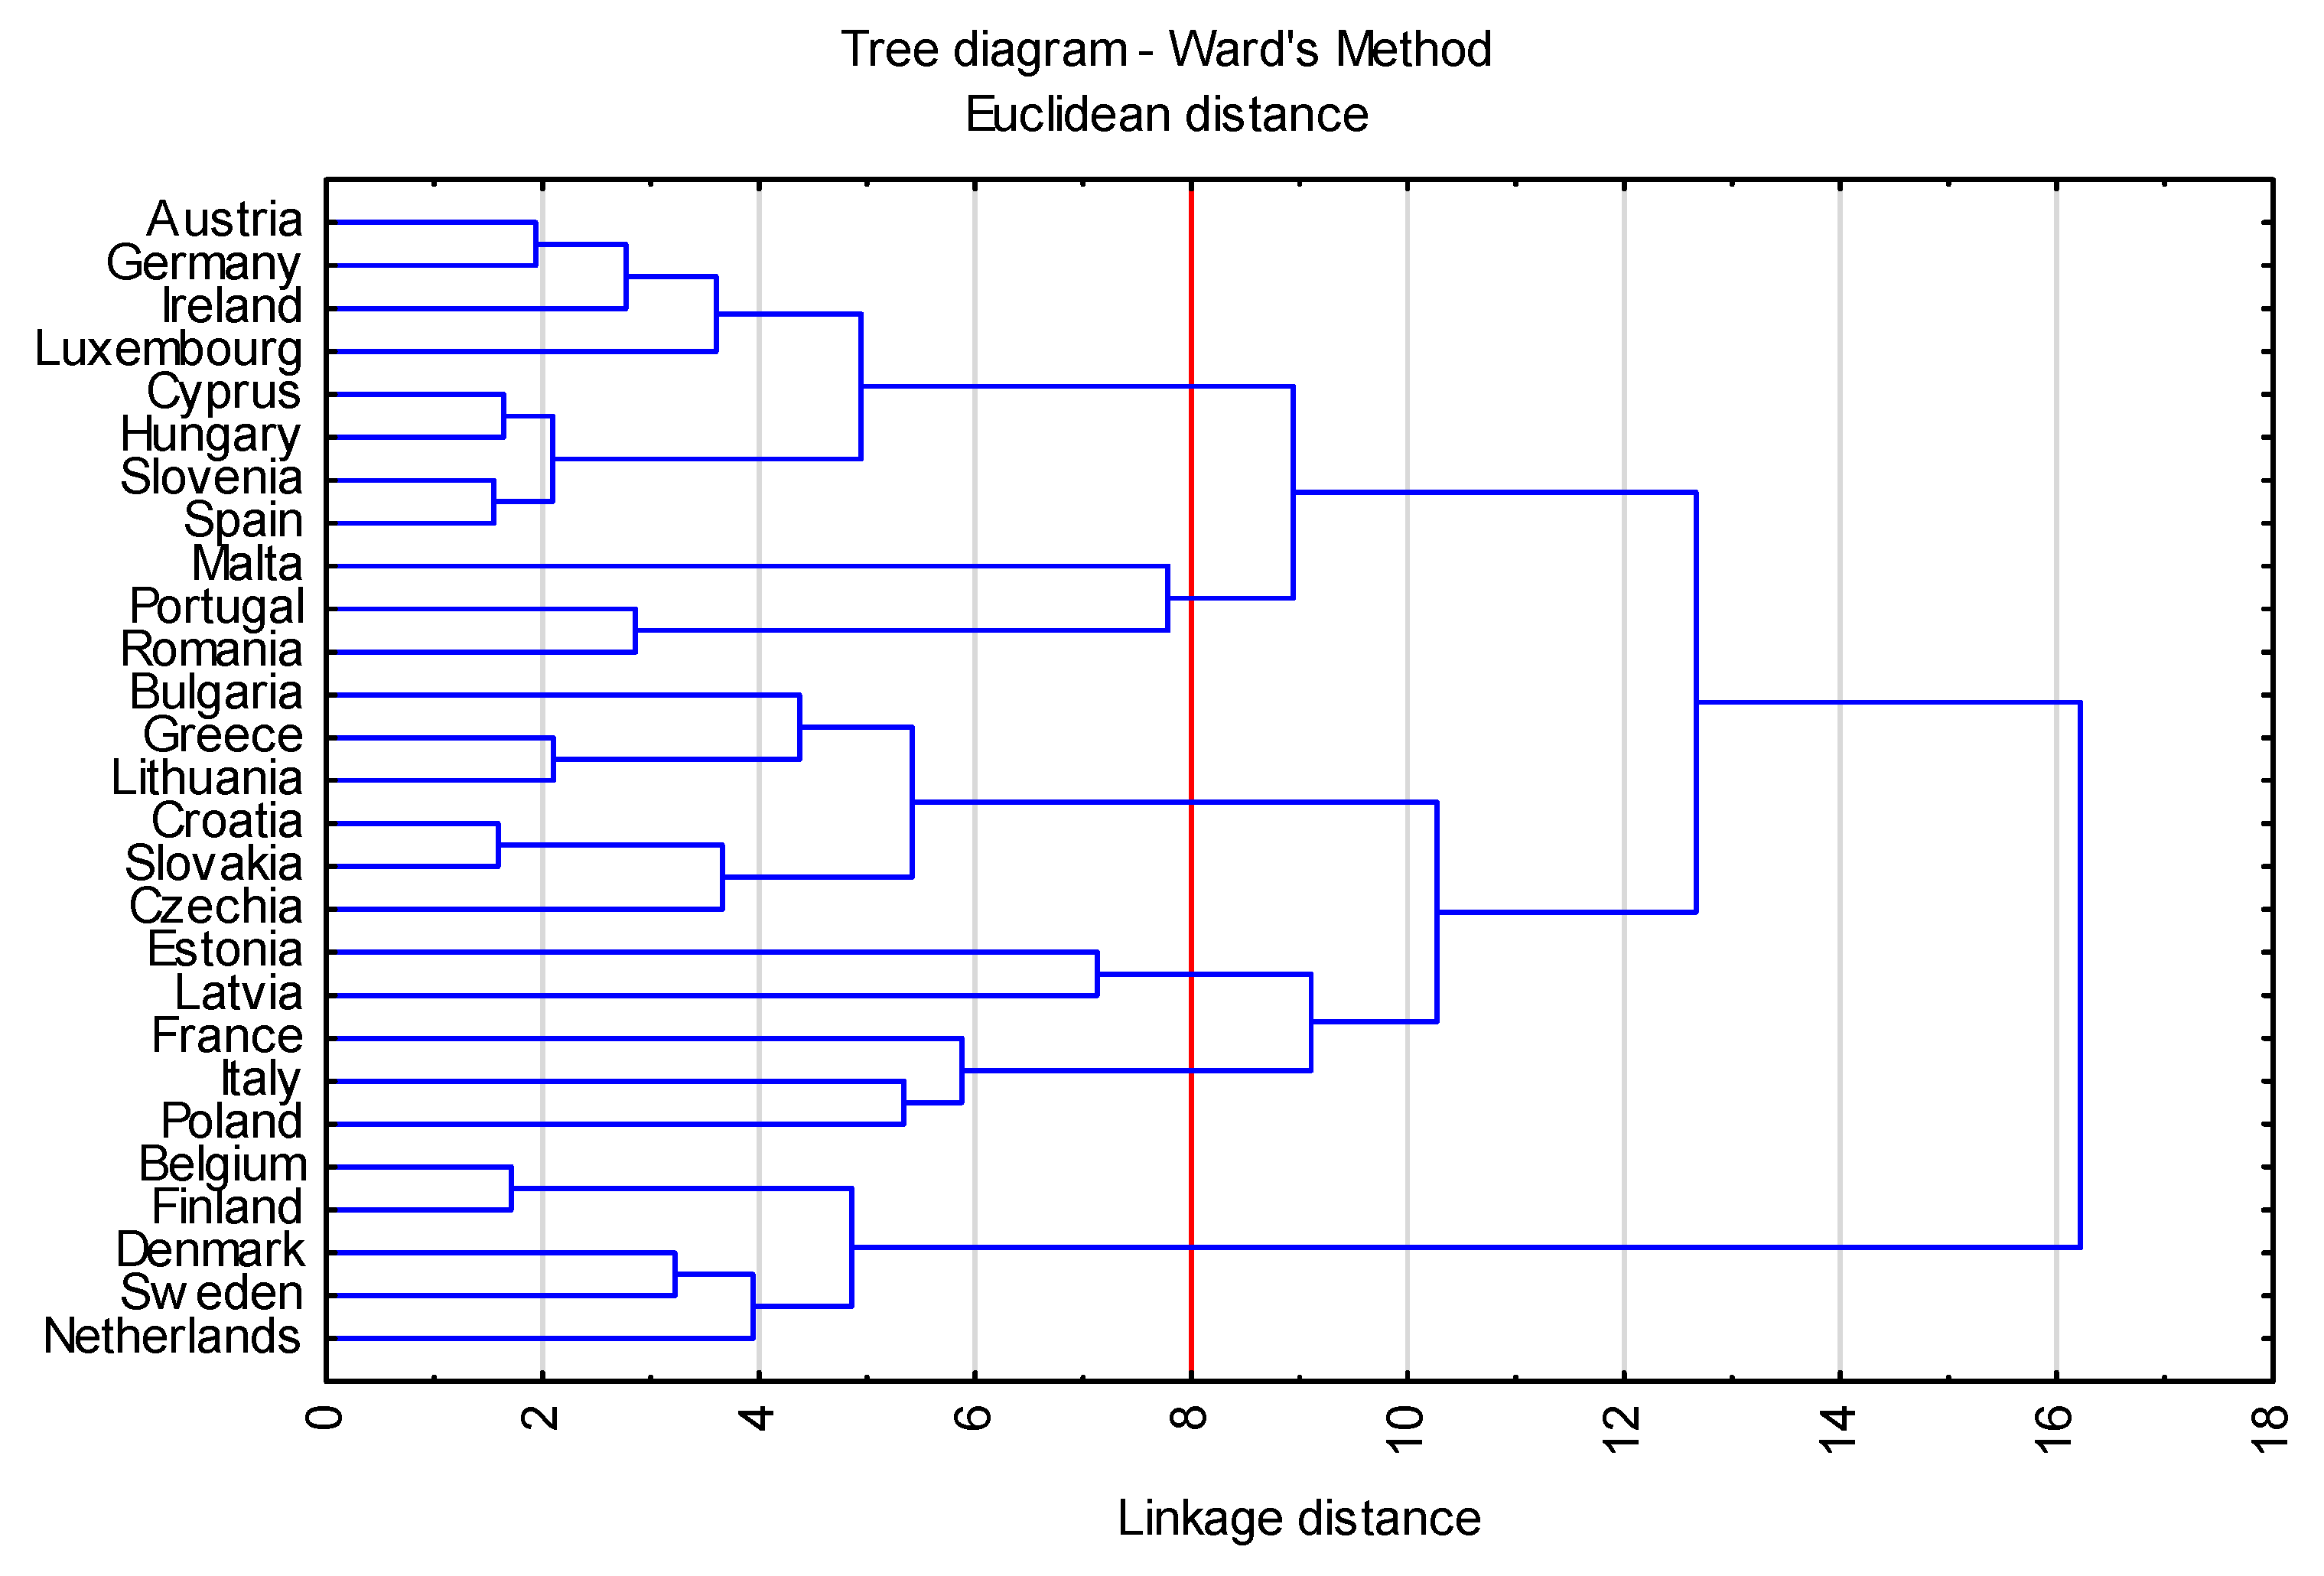
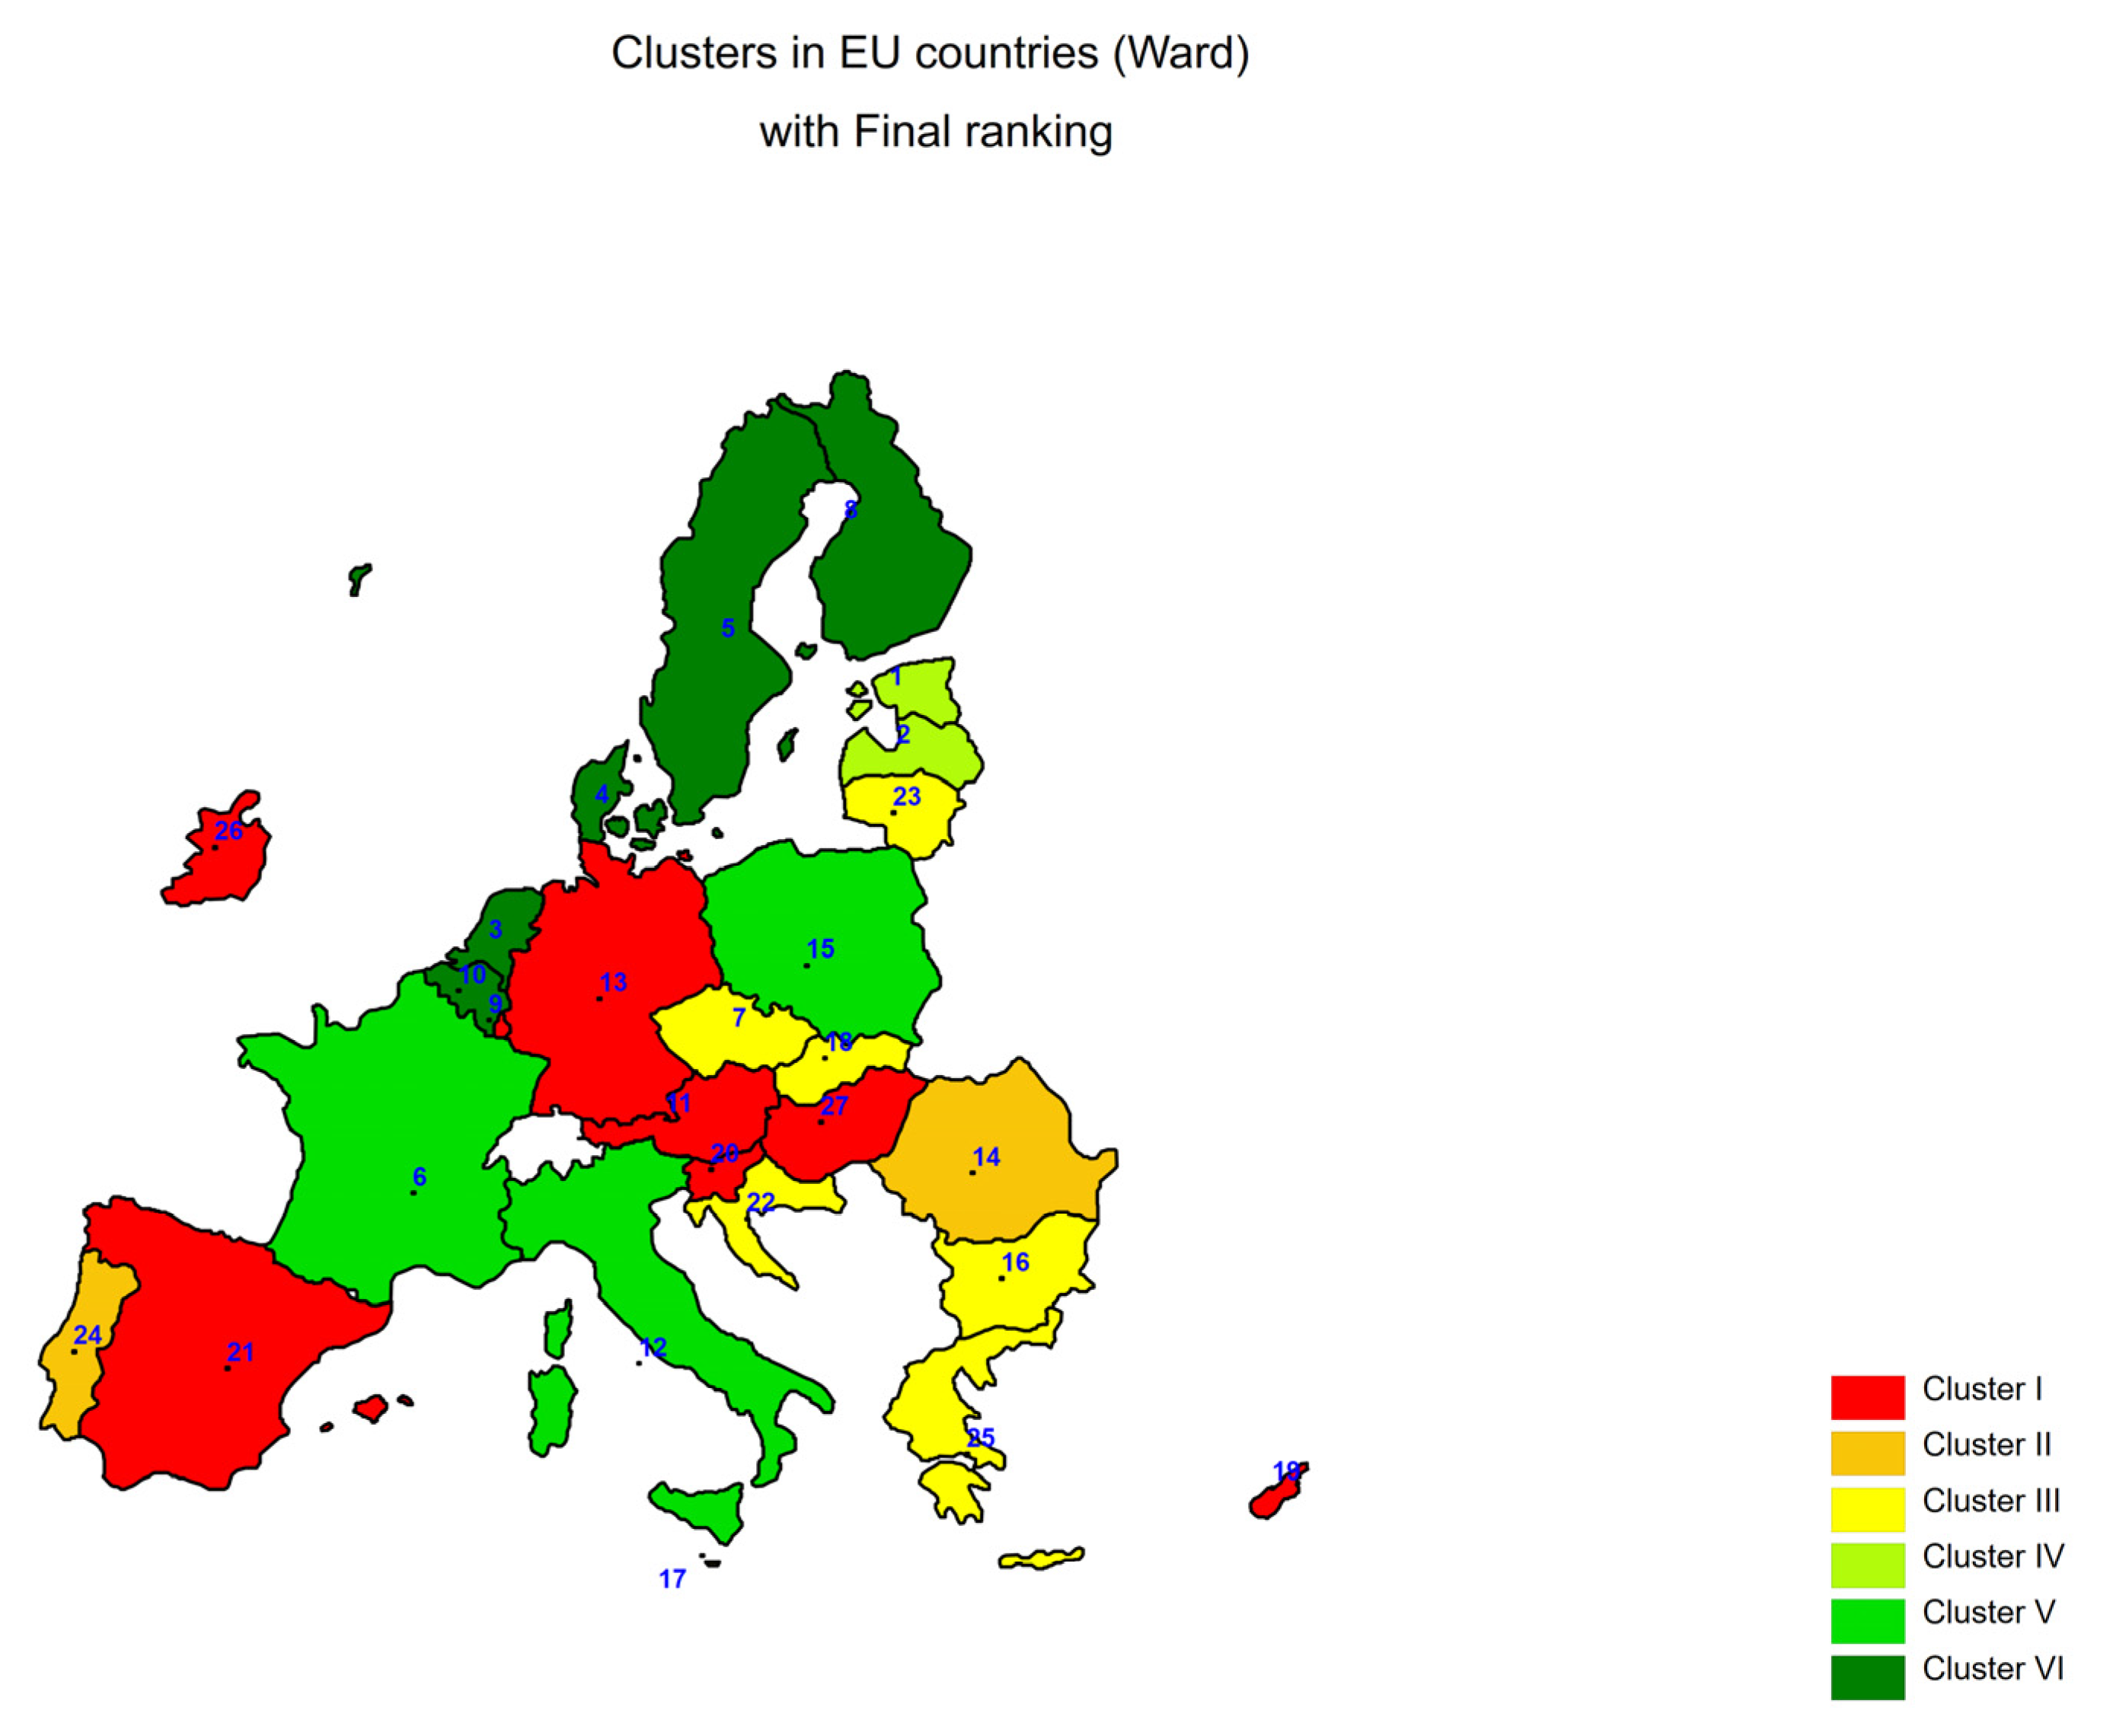
Due to the fact that three single-element clusters appear in the division into eight clusters, it was decided to divide the data into six groups. This is also the approach adopted in the analysis, shown in Figure 4.
Clustering was also performed using the k-means method, assuming six predetermined clusters as input, as required by the procedure of this method.
The results of the comparison of clustering using both methods are presented in Table 5.
Based on the results, it can be concluded that two clusters, II and V, share the same elements. In the remaining clusters, there are slight shifts in countries between groups, while Group IV is completely different, with completely different countries within it. The results obtained using Ward’s method were chosen as the basis for further analysis because, in previous analyses, two countries—Estonia and Latvia—were identified as outliers in certain characteristics, and Group IV, in Ward’s method, contains these two countries in one group, indicating a better division into groups using this method.
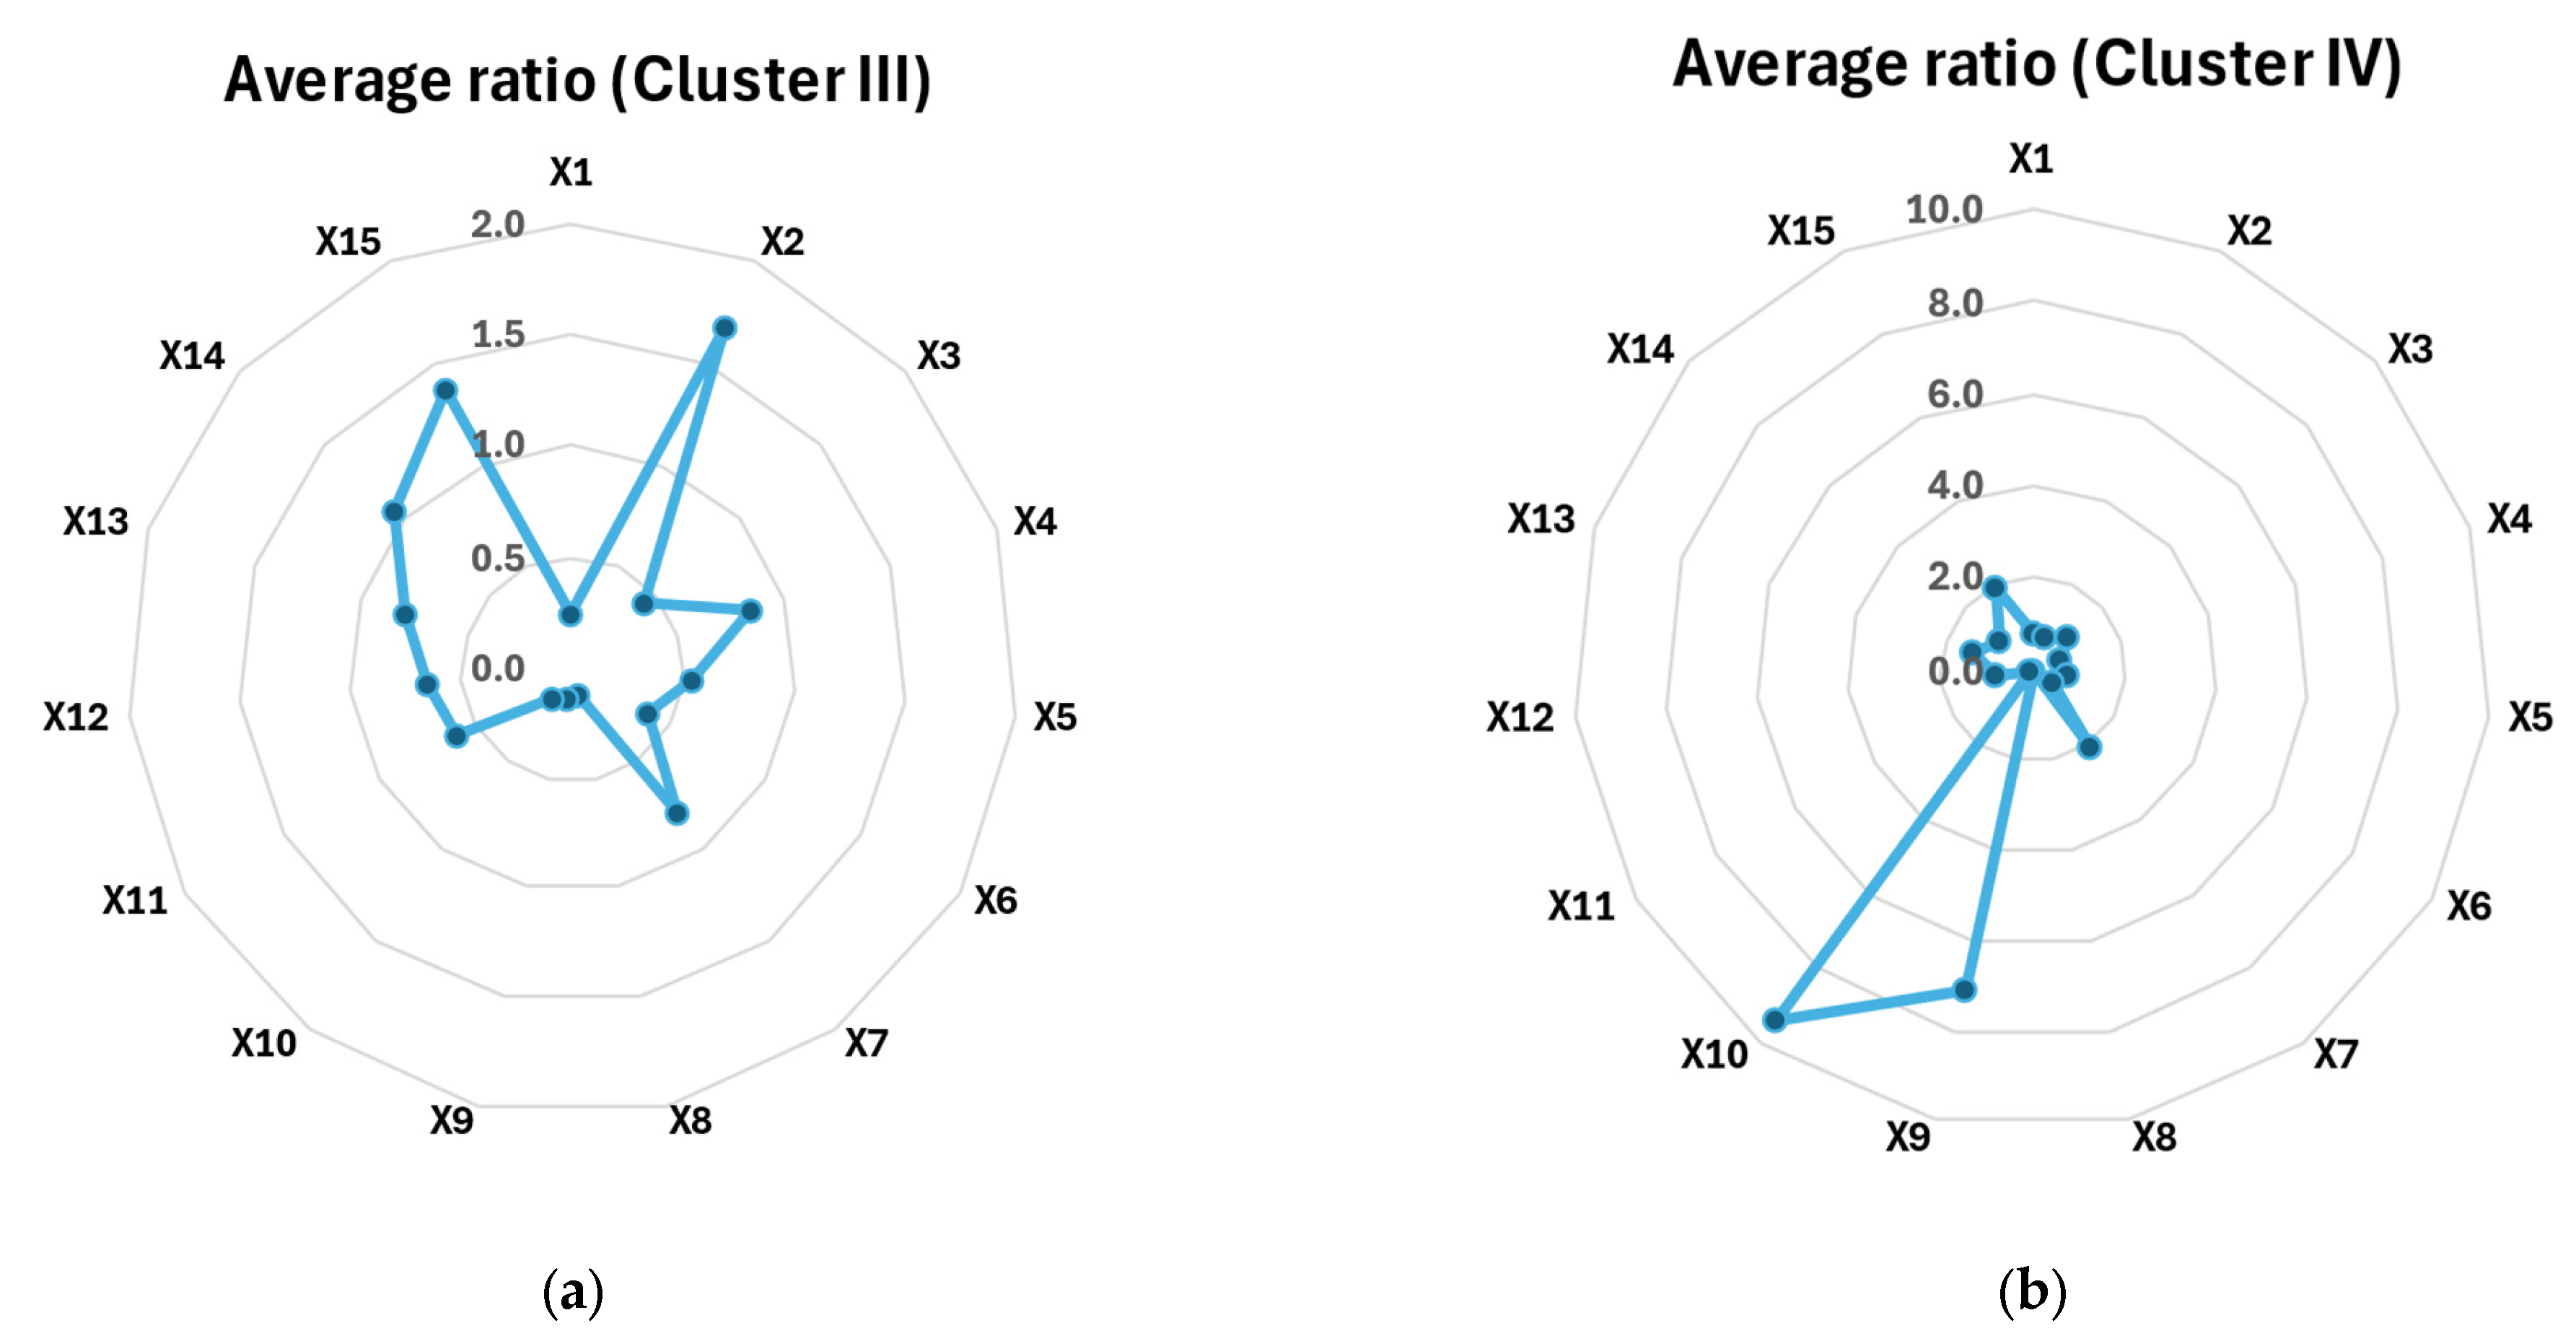
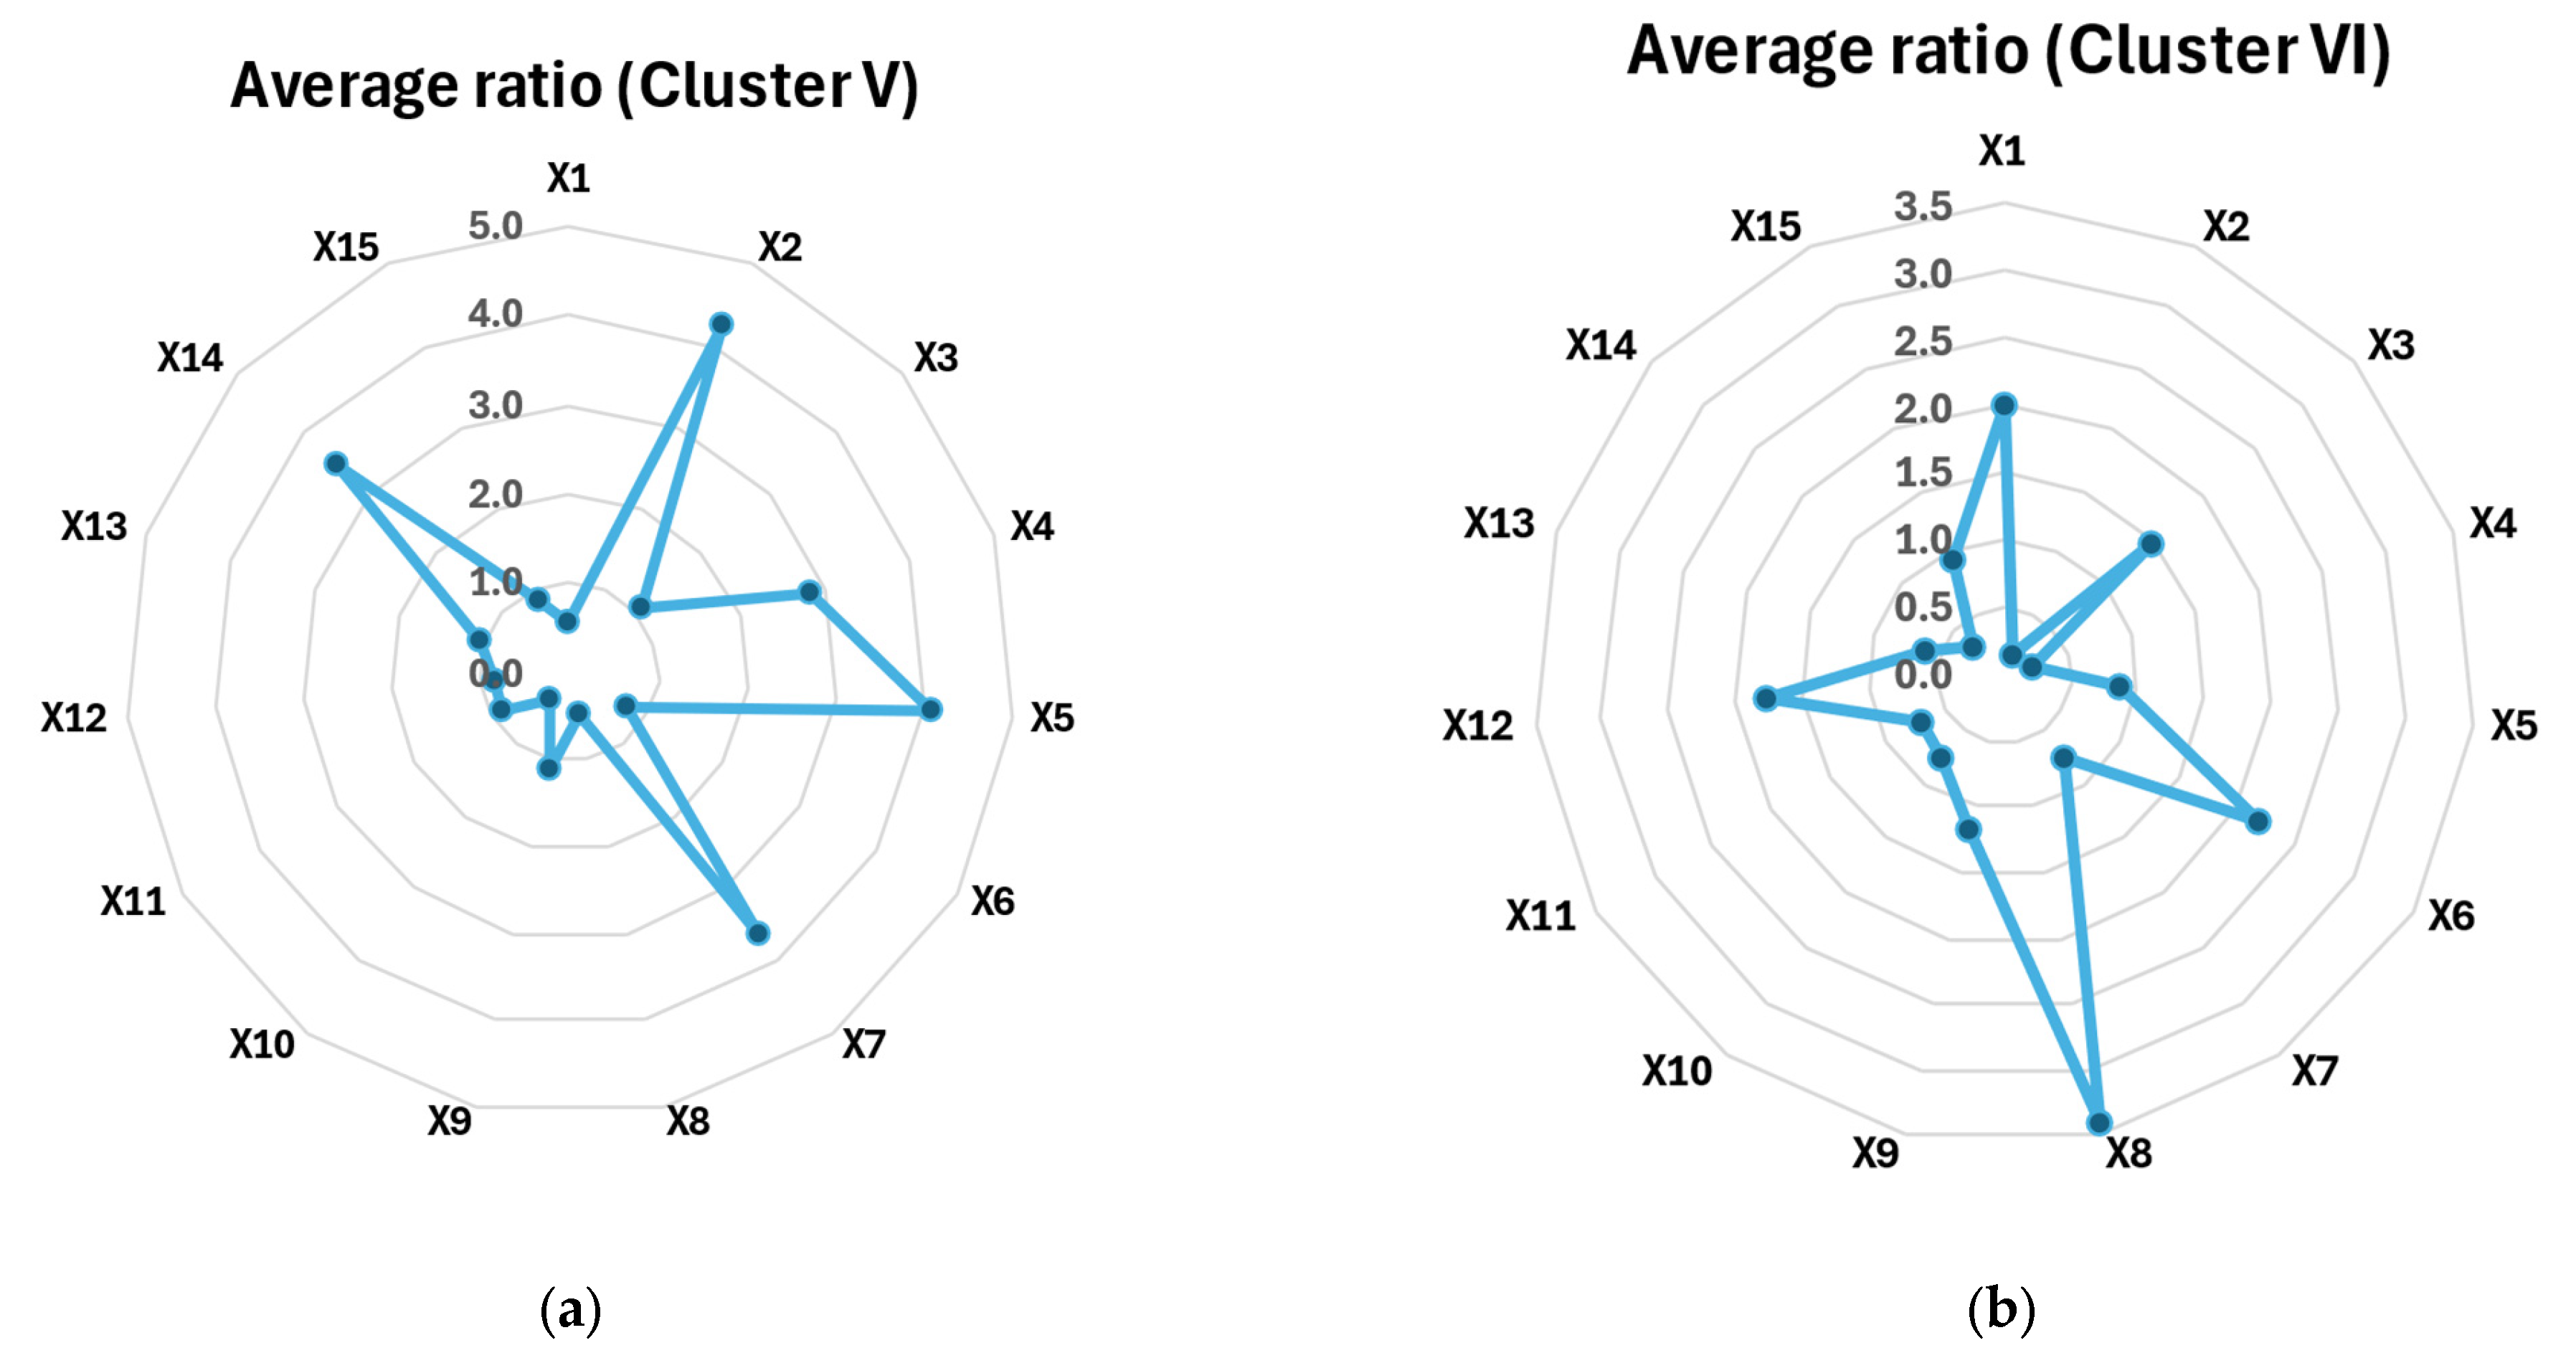
Based on group averages, the clusters of the studied countries were characterized, and the variables that had the greatest contribution to the formation of these clusters were given (Figure 5, Figure 6 and Figure 7).
The first cluster is the most numerous and includes the following eight countries: Austria, Germany, Ireland, Luxembourg, Cyprus, Hungary, Slovenia, and Spain. This group is characterized by a high level of share of electric and hybrid passenger cars, as well as a high level of access to unlimited charging stations and a high share of ultra-fast charging stations (level 1 and 2). The share of newly registered electric and hybrid cars in total cars is also high. (Figure 5a).
The second cluster includes Malta, Portugal, and Romania. These countries are characterized primarily by a high share of AC recharging points (Fast Speed) and the percentage of newly registered passenger cars powered by LPG, CNG, and LNG. The percentage of newly registered electric and hybrid passenger cars is also high. The percentage of unlimited charging points is also above average. The remaining indicators are below the global average (Figure 5b).
The third cluster includes countries such as Bulgaria, Greece, Lithuania, Croatia, Slovakia, and The Czech Republic. This is a group of countries with the lowest values of indicators responsible for the use of cars powered by alternative energy sources. These countries also occupy the last places in the average ranking conducted (Figure 6a). Two indicators, whose average values are above the average level for all 27 EU countries, are the percentage of cars powered by LPG, CNG, and LNG gas and a fairly high AFIR (output/target) [%] indicator in these countries. All other indicators have averages below the global average value calculated for the EU countries.
The fourth cluster includes Estonia and Latvia. This is the smallest group, which has been distinguished from the other countries due to the very high value of the indicator responsible for the increase in charging points (year-on-year increase). The increase is very large. This group also has a very large percentage of newly registered trucks, buses, and vans powered by LPG, CNG, and LNG. The largest of the clusters is the AFIR (output/target) [%] level. These countries have one of the highest indicators of unlimited access to charging points. These countries occupy the top two places in the average ranking regarding the use of alternative energy sources in road transport, which is first and second place (Figure 6b).
The fifth cluster is France, Italy, and Poland. These are also countries with a high use of alternative energy sources in powering cars. Most of the analyzed indicators have their average values in these countries above the general average. These are definitely the countries where the most LPG-, CNG-, and LNG-powered vehicles are used. They also have the highest percentage of gas-powered passenger cars and newly registered gas-powered cars, as well as newly registered buses and vans running on gas fuel. Unfortunately, the infrastructure is somewhat outdated and poorly developed because the indicators of the number of cars with gas installations per one charging station are very high. These indicators have the highest value in these countries among all the analyzed clusters. It is also worth noting that this group of countries has the highest percentage of newly registered hydrogen-powered passenger cars (Figure 7a).
The sixth and last cluster is definitely a group of countries at a high level in terms of the use of alternative fuel sources. It includes the following five countries: Denmark, Sweden, the Netherlands, Finland, and Belgium. The highest in this group is the indicator for the share of newly registered electric and hybrid trucks, as well as buses and vans. There is also good infrastructure there, as the percentage of ultra-fast stations is high. The highest is also the indicator for the share of electric and hybrid cars in total cars and the indicator for newly registered electric and hybrid passenger cars. Thus, this is a group of countries investing very heavily in both infrastructure and the fleet of cars based on electric and hybrid drives. This group also has the fewest LPG-powered cars at charging stations. Thus, the infrastructure for LPG-powered cars is also prepared (Figure 7b).
Based on the diagnostic variables adopted for the study, a ranking of countries was also established in terms of the use of alternative sources of car power and their supporting infrastructure. All variables were treated as stimulants except for the variable X 14 , the number of LPG vehicles per LPG refueling point, which was considered a de-stimulant since the more cars there are per charging station, the worse the situation in the country under the study is. The ranking was constructed using the TOPSIS method discussed in the Materials and Methods section. The results of the ranking in two variants, TOPSIS 1 (without weights, where each variable had an equal contribution to the ranking) and TOPSIS 2 (with weights depending on the variability of these indicators, the greater the variability of the indicator, the greater the weight and, therefore, the contribution of the variable to the creation of the ranking), are presented in Table 6. The weight system used for individual diagnostic variables X1-X15 for variant 3 (with methodology CRITIC) was as follows: ω 1 = 0.95 % ,   ω 2 = 0.92 % ,   ω 3 = 3.81 % ,   ω 4 = 0.7 % , ω 5 = 0.002 % , ω 6 = 4.04 % , ω 7 = 1.3 %   , ω 8 = 0.4 % , ω 9 = 1.66 % , ω 10 = 8.9 % ,   ω 11 = 4.618 % , ω 12 = 4.9 %   , ω 13 = 5.1 %   , ω 14 = 31.3 %   , ω 15 = 31.4 % .
The best in the average ranking were the following countries: Estonia (ranking without weights 5), Latvia (ranking without weights 6), The Netherlands (ranking without weights 1), Denmark (ranking without weights 3), and Sweden (ranking without weights 2). The worst were the following countries: Hungary, Ireland, Greece, and Portugal, which also occupied the last positions in the variant of the ranking without taking into account the contribution of variables. Poland was in 15th place in the average ranking (i.e., quite high), while in the ranking without weights, it was in 13th place (in the middle of the ranking of all 27 EU countries).
The map (Figure 8) shows the clusters of countries that are similar in terms of the level of development of road transport based on alternative energy sources (natural and industrial gas, electric cells, hydrogen cells) and the development of supporting infrastructure (charging stations, refueling stations) along with the average ranking of these countries.

5. Discussion

The analysis clearly indicates significant differences between EU countries in terms of the adoption of vehicles that use alternative energy sources. The coefficient of variation at the level of 73% for the share of electric and plug-in hybrid cars (BEV + PHEV) in the total vehicle fleet highlights significant disparities in the pace of transformation of the transport sector. The differences between countries with the highest (Luxembourg—15.67%) and the lowest (Poland—0.51%) share of electric vehicles reflect the multidimensional nature of the process of electrification of transport in Europe.
The heterogeneity of electric vehicle adoption may result from several factors. The Nordic countries, Luxembourg, and The Netherlands are characterized by better developed charging infrastructure and higher BEV + PHEV adoption rates, which are confirmed by the results of Xue et al. [40], who observed a clear division in countries with high adoption (Nordic countries and The Netherlands) and the rest. This is confirmed by the high position of the TOPSIS 1 ranking. The results of the correlation analysis confirm these trends, indicating a strong relationship (r = 0.84) between the share of electric and hybrid vehicles in the total fleet and the percentage of ultra-fast DC charging stations. This relationship confirms the key role of the availability of advanced charging infrastructure [46] in the process of transport electrification. Countries with a well-developed network of ultra-fast charging stations show a higher level of electric vehicle adoption, which suggests the existence of a positive feedback loop between these variables.
Cluster analysis allowed the identification of six clearly differentiated groups of countries, representing different models of adoption of vehicles powered by alternative energy sources. Cluster six is particularly noteworthy, comprising Belgium, Finland, Denmark, Sweden, and The Netherlands. These countries present the most advanced model of transport electrification, characterized by the highest share of electric and hybrid cars in both the existing fleet and in new registrations. The high share of electric trucks, buses, and vans is also distinctive, which indicates a holistic approach to transport transformation that covers not only the passenger car segment. The key success factor is extensive ultra-fast charging infrastructure, supported by comprehensive fiscal incentives for businesses and individuals.
An interesting characteristic is presented by cluster five (France, Italy, Poland), where the use of gas fuels (LPG, CNG, LNG, H2) dominates. These countries show the highest percentage of gas-powered passenger cars and newly registered vehicles of this type. The indicator of the number of LPG vehicles per one refueling point is the highest in this group (especially in Poland at 651 cars per station), which should be interpreted with caution. The high value of this parameter results primarily from the very large number of vehicles equipped with gas installations and not necessarily from insufficient refueling infrastructure. It is worth noting that the structure of gas fuel use was diversified even within a single cluster. In the case of LPG-, CNG-, and LNG-powered vehicles, we observed a different adoption pattern with the leading position of Poland (16.26%), Bulgaria (12.6%), Italy (9.7%), and a low share of France (0.003%). In the case of hydrogen (H2) power, the share of newly registered hydrogen vehicles was the highest in Poland and France (0.02%). The high share of gas-powered vehicles indicates a preference for transitional technologies, which may hinder a rapid transition to full electrification. Paradoxically, these countries also show interest in hydrogen technologies (especially France and Poland), suggesting potential for diversification of alternative energy sources.
The third cluster, including Bulgaria, Greece, Lithuania, Croatia, Slovakia, and The Czech Republic, represents a group of countries with the lowest rates of adoption of alternative energy sources. The only parameters exceeding the European average are the share of gas-powered vehicles and the AFIR output/target indicator. This characteristic may indicate an initial stage of transformation, focused on transitional solutions (LPG/CNG) while building the foundations of infrastructure in accordance with AFIR requirements, but without a dynamic increase in the adoption of electric vehicles. These countries need comprehensive strategies for accelerated electrification, taking into account economic constraints.
The case of Estonia and Latvia (cluster IV) presents an alternative model of transport transformation, characterized by one of the lowest levels of passenger fleet electrification in Europe, while intensive development of charging infrastructure is taking place. Despite a very low number of electric cars per 1000 inhabitants, these countries achieve the highest AFIR target implementation rates and unlimited availability of charging points and the highest dynamics, focusing on the electrification of commercial transport through a high share of trucks, buses, and vans powered by alternative fuels, where the extensive charging network significantly outpaces the adoption of electric vehicles by individual users. This approach, with a persistently low rate of electrification of passenger transport, may be a rational alternative for countries with limited financial resources or lower purchasing power of consumers. In contrast to the comprehensive cluster six model, Estonia and Latvia demonstrate that sequential transport transformation with prioritization of infrastructure and commercial fleets, even with a small share of electric cars in passenger transport, can be an alternative path for countries starting the process of transport electrification. This strategy is reflected in weighted rankings (TOPSIS 2 and TOPSIS (mean)). This “infrastructure first” model may be particularly attractive for countries with limited financial resources, enabling the creation of foundations for future growth in electric vehicle adoption.
Cluster II (Malta, Portugal, Romania) combines relatively high dynamics of electric vehicle adoption with insufficiently developed infrastructure, especially in terms of fast charging stations.
Cluster I (Austria, Germany, Ireland, Luxembourg, Cyprus, Hungary, Slovenia, and Spain) is characterized by a high share of electric and hybrid vehicles and well-developed charging infrastructure, with less emphasis on the electrification of commercial transport compared to cluster VI.
It is worth noting the significant variation in the AFIR output/target indicator between Member States (from 12.12% in Malta to 619.53% in Lithuania). This disproportion indicates an uneven pace of infrastructure implementation in relation to the number of registered electric vehicles.
The analysis of trends in new vehicle registrations indicates the dominant position of BEV + PHEV technology, with an average share of 43.86% in passenger car registrations, while gas-powered vehicles account for an average of 1.82%, and hydrogen vehicles for only 0.0028%. This distribution suggests that electrification may be the main direction of transformation of European road transport, with a marginal role of hydrogen propulsion in the short term.
The dynamics of the development of AC charging infrastructure are particularly interesting, showing an average year-on-year increase of 12.21%, with significant differences between countries (from −26.07% in Croatia to 211.01% in Estonia). This variability indicates an uneven pace of infrastructure investment, which may lead to widening disparities between Member States in terms of the availability of charging infrastructure.

6. Conclusions

6.1. Main Conclusions from the Research

The conducted analysis allowed for the identification of key regularities that characterize the process of transformation of road transport in the European Union. Firstly, there is a clear division in countries with a high level of electrification (clusters I and VI) and high dynamics (cluster IV), and countries preferring gas drives (cluster V) or being at an early stage of transformation (clusters II and III). Secondly, a strong positive correlation was confirmed between the development of charging infrastructure, especially ultra-fast stations, and the level of adoption of electric vehicles.
The identification of six clusters of countries with different profiles of transport electrification indicates the existence of different transformation paths, conditioned by economic, geographical, and political factors. The TOPSIS ranking of countries confirmed the dominant position of the Nordic countries and Western Europe, while the transformation delay of the countries of Central, Eastern, and Southern Europe was simultaneous. TOPSIS rankings, taking into account weights, indicate Estonia and Latvia as the leaders, due to their high dynamics and highly developed infrastructure. The key factor differentiating EU countries in terms of the use of alternative energy sources in transport is not only the level of vehicle adoption but also the structure and quality of the charging/refueling infrastructure. Countries with the highest share of electric vehicles are also characterized by the best-developed ultra-fast charging infrastructure, which confirms the hypothesis of mutual reinforcement of these elements in the process of transport electrification.

6.2. Implications for Transport Policy

Countries in cluster VI (Denmark, Sweden, the Netherlands, Finland, and Belgium) have achieved a leading position in EV adoption within the EU. It is important to emphasize that, while direct subsidies were a key instrument that significantly contributed to this success, these nations are now moving beyond this initial support phase. As the market matures, broad purchase grants have been phased out (Finland, Sweden) or replaced with targeted incentive. The current fiscal focus is on durable, CO2-based tax systems and powerful corporate incentives. Fiscal instruments include CO2-based registration and ownership taxes, reduced rates for battery electric vehicles (BEVs), and favorable corporate tax deductions. Belgium offers 100% deductibility for BEV-related business expenses until 2026, alongside full exemption from registration and road taxes in Flanders. Denmark applies a reduced registration tax rate of 40% for BEVs through 2025, which will gradually increase thereafter. The Netherlands imposed a flat BPM of EUR 667 in 2025 for BEVs and provides road tax discounts through 2030. Sweden maintains very low annual road taxes and favorable benefit-in-kind taxation, despite having phased out its bonus–malus scheme in 2022. Finland, although no longer offering purchase subsidies, keeps BEVs effectively tax-exempt. Regulatory tools with high transferability include mandated charging infrastructure in new or renovated buildings, low-emission zones in urban areas, and fleet procurement rules such as Belgium’s 100% zero-emission vehicle mandate for public authorities starting in 2025. Implementation strategies should align with national fiscal capacity, with lower-income countries prioritizing low-cost regulatory instruments and simple tax exemptions, gradually scaling up incentives over time [73].
The research results indicate the need for differentiated strategies to support transport transformation in individual EU Member States. For cluster III countries (Bulgaria, Greece, Lithuania, Croatia, Slovakia, and The Czech Republic), the priority should be given to accelerate the development of basic charging infrastructure and introduce financial instruments to stimulate the adoption of electric vehicles.
The experience of cluster VI countries (Belgium, Finland, Denmark, Sweden, and The Netherlands) indicates the effectiveness of a comprehensive approach, combining the development of ultra-fast charging infrastructure with fiscal instruments supporting the purchase of electric vehicles and initiatives and promoting the electrification of commercial fleets, including trucks and buses.
For cluster V countries (France, Italy, and Poland), characterized by a high share of gas-powered vehicles, it seems recommended to adopt a strategy that assumes a gradual transformation towards electromobility while optimizing the existing gas infrastructure as a transitional solution.
Countries belonging to cluster II should be supported primarily by stimulating investments in fast and ultra-fast charging stations.
In the case of countries in the first cluster, the optimal strategy seems to be stimulating the electrification of commercial transport through tax incentives targeted at businesses investing in electric transport fleets.

6.3. Research Limitations and Directions for a Further Analysis

The study conducted, despite its comprehensive approach to the issue of alternative energy sources in transport, has certain limitations. Firstly, the analysis is based on cross-sectional data, which makes it impossible to capture changes over time. Further research will take into account the dynamics, allowing for the analysis of the development strategies of individual countries.
Secondly, the analysis does not take into account variables that may affect the level of adoption of alternative energy sources, such as macroeconomic factors, electricity prices, the level of subsidies for the purchase of electric vehicles, the socio-economic structure of society, or the degree of urbanization. These variables could provide a fuller understanding of the conditions for the electrification of transport. An interesting research area would also be the analysis of the effectiveness of various public policy instruments in stimulating the development of electromobility at the national and local levels.

6.4. Challenges and the Future

Although the alternative car market is growing, it still faces some challenges. These include the following:
Price: Electric and hybrid vehicles are often more expensive than traditional combustion cars.
Range and charging time: Although the range of electric vehicles is growing, it is still one of the main limitations for consumers.
Battery efficiency and availability: Battery production, as well as their recycling, remains one of the key challenges for the industry.

Author Contributions

Conceptualization, K.C.-L., M.C., J.P. and T.P.; methodology, K.C.-L. and T.P.; validation, K.C.-L., M.C., J.P. and T.P.; investigation, K.C.-L., M.C., J.P. and T.P.; resources, K.C.-L. and T.P.; data curation, K.C.-L. and T.P.; writing—original draft preparation, K.C.-L., M.C., J.P. and T.P.; writing—review and editing, K.C.-L., M.C., J.P. and T.P.; visualization, K.C.-L. and T.P.; supervision, K.C.-L. and T.P. All authors have read and agreed to the published version of the manuscript.

Funding

The research leading to these results has received funding from the project “Cluster for innovative energy” in the frame of the program “HORIZON-MSCA-2022-SE-01” under the Grant agreement number 101129820.

Data Availability Statement

Publicly available data.

Conflicts of Interest

Author Maciej Chudy was employed by the company Department of Investment, Grupa Azoty S.A.. The remaining authors declare that the research was conducted in the absence of any commercial or financial relationships that could be construed as a potential conflict of interest.

References

  1. Razmjoo, A.; Ghazanfari, A.; Jahangiri, M.; Franklin, E.; Denai, M.; Marzband, M.; Astiaso Garcia, D.; Maheri, A. A comprehensive study on the expansion of electric vehicles in Europe. Appl. Sci. 2022, 12, 11656. [Google Scholar] [CrossRef]
  2. Regulation (EU) 2023/1804 of the European Parliament and of the Council of 13 September 2023, On the Deployment of Alternative Fuels Infrastructure, and Repealing Directive 2014/94/EU, (Text with EEA Relevance), Official Journal of the European Union, EUR-LEX. Available online: https://eur-lex.europa.eu/legal-content/EN/TXT/PDF/?uri=CELEX:32023R1804 (accessed on 21 February 2025).
  3. Proposal for a Regulation of the European Parliament and of the Council on the Deployment of Alternative Fuels Infrastructure, and Repealing Directive 2014/94/EU of the European Parliament and of the Council COM/2021/559 Final. EUR-LEX. Available online: https://eur-lex.europa.eu/legal-content/EN/TXT/?uri=celex:52021PC0559 (accessed on 21 February 2025).
  4. Muratori, M.; Alexander, M.; Arent, D.; Bazilian, M.; Cazzola, P.; Dede, E.M.; Farrell, J.; Gearhart, C.; Greene, D.; Jenn, A.; et al. The rise of electric vehicles—2020 Status and future expectations. Prog. Energy 2021, 3, 022002. [Google Scholar] [CrossRef]
  5. Hu, Y.; Wang, Z.; Li, X. Impact of policies on electric vehicle diffusion: An evolutionary game of small world network analysis. J. Clean. Prod. 2020, 265, 121703. [Google Scholar] [CrossRef]
  6. Soares, L.O.; da Cunha Reis, A.; Vieira, P.S.; Hernández-Callejo, L.; Boloy, R.A.M. Electric vehicle supply chain management: A bibliometric and systematic review. Energies 2023, 16, 1563. [Google Scholar] [CrossRef]
  7. Ullah, I.; Safdar, M.; Zheng, J.; Severino, A.; Jamal, A. Employing bibliometric analysis to identify the current state of the art and future prospects of electric vehicles. Energies 2023, 16, 2344. [Google Scholar] [CrossRef]
  8. Filho, W.L.; Abubakar, I.R.; Kotter, R.; Grindsted, T.S.; Balogun, A.-L.; Salvia, A.L.; Aina, Y.A.; Wolf, F. Framing electric mobility for urban sustainability in a circular economy context: An overview of the Literature. Sustainability 2021, 13, 7786. [Google Scholar] [CrossRef]
  9. Anastasiadou, K.; Gavanas, N. State-of-the-Art review of the key factors affecting electric vehicle adoption by consumers. Energies 2022, 15, 9409. [Google Scholar] [CrossRef]
  10. Omahne, V.; Knez, M.; Obrecht, M. Social aspects of electric vehicles research—Trends and relations to sustainable development goals. World Electr. Veh. J. 2021, 12, 15. [Google Scholar] [CrossRef]
  11. Sendek-Matysiak, E.; Łosiewicz, Z. Analysis of the development of the electromobility market in Poland in the context of the Implemented subsidies. Energies 2021, 14, 222. [Google Scholar] [CrossRef]
  12. Adamczyk, J.; Dzikuć, M.; Dylewski, R.; Varese, E. Assessment of selected environmental and economic factors for the development of electro-mobility in Poland. Transportation 2024, 51, 2199–2223. [Google Scholar] [CrossRef]
  13. Sobiech-Grabka, K.; Stankowska, A.; Jerzak, K. Determinants of electric cars purchase intention in Poland: Personal attitudes v. economic arguments. Energies 2022, 15, 3078. [Google Scholar] [CrossRef]
  14. Lewicki, W.; Drożdż, W. Electromobility and its development prospects in the context of Industry 4.0: A comparative study of Poland and the European Union. Eur. Res. Stud. J. 2021, 24, 135–144. [Google Scholar] [CrossRef]
  15. Tucki, K.; Orynycz, O.; Dudziak, A. The impact of the available infrastructure on the electric vehicle market in Poland and in EU countries. Int. J. Environ. Res. Public Health 2022, 19, 16783. [Google Scholar] [CrossRef] [PubMed]
  16. Łuszczyk, M.; Sulich, A.; Siuta-Tokarska, B.; Zema, T.; Their, A. The development of electromobility in the European Union: Evidence from Poland and cross-country comparisons. Energies 2021, 14, 8247. [Google Scholar] [CrossRef]
  17. Sendek-Matysiak, E.; Grysa, K. Assessment of the total cost of ownership of electric vehicles in Poland. Energies 2021, 14, 4806. [Google Scholar] [CrossRef]
  18. Brodowicz, D.P.; Stankowska, A. European Union’s goals towards electromobility: An assessment of plans’ implementation in Polish cities. Eur. Res. Stud. J. 2021, 24, 645–665. [Google Scholar] [CrossRef]
  19. Połom, M.; Wiśniewski, P. Implementing electromobility in public transport in Poland in 1990–2020. A review of experiences and evaluation of the current development directions. Sustainability 2021, 13, 4009. [Google Scholar] [CrossRef]
  20. Guzik, R.; Kołoś, A.; Taczanowski, J.; Fiedeń, Ł.; Gwosdz, K.; Hetmańczyk, K.; Łodziński, J. The second generation electromobility in Polish urban public transport: The factors and mechanisms of spatial development. Energies 2021, 14, 7751. [Google Scholar] [CrossRef]
  21. Emanović, M.; Jakara, M.; Barić, D. Challenges and opportunities for future BEVs adoption in Croatia. Sustainability 2022, 14, 8080. [Google Scholar] [CrossRef]
  22. Mutavdžija, M.; Kovačić, M.; Buntak, K. Assessment of selected factors influencing the purchase of electric vehicles—A case study of the Republic of Croatia. Energies 2022, 15, 5987. [Google Scholar] [CrossRef]
  23. Gomółka, K.; Kasprzak, P. Directions and prospects for the development of the electric car market in selected ASEAN countries. Energies 2021, 14, 7509. [Google Scholar] [CrossRef]
  24. Ala, G.; Colak, I.; Di Filippo, G.; Miceli, R.; Romano, P.; Silva, C.; Valtchev, S.; Viola, F. Electric mobility in Portugal: Current situation and forecasts for fuel cell vehicles. Energies 2021, 14, 7945. [Google Scholar] [CrossRef]
  25. Ribeiro, P.J.G.; Mendes, J.F.G. Public transport decarbonization via urban bus fleet replacement in Portugal. Energies 2022, 15, 4286. [Google Scholar] [CrossRef]
  26. Khaleel, M.; Nassar, Y.; El-Khozondar, H.; Elmnif, M.; Rajab, Z.; Yaghoubi, E.; Yaghoubi, E. Electric vehicles in China, Europe, and the United States: Current trend and market comparison. Int. J. Electr. Eng. Sustain. (IJEES) 2024, 2, 1–20. [Google Scholar]
  27. Veza, I.; Abas, M.A.; Djamari, D.W.; Tamaldin, N.; Endrasari, F.; Budiman, B.A.; Idris, M.; Opia, A.C.; Juangsa, F.B.; Aziz, M. Electric vehicles in Malaysia and Indonesia: Opportunities and challenges. Energies 2022, 15, 2564. [Google Scholar] [CrossRef]
  28. Burkert, A.; Fechtner, H.; Schmuelling, B. Interdisciplinary analysis of social acceptance regarding electric vehicles with a focus on charging infrastructure and driving range in Germany. World Electr. Veh. J. 2021, 12, 25. [Google Scholar] [CrossRef]
  29. Taefi, T.T.; Kreutzfeldt, J.; Held, T.; Fink, A. Supporting the adoption of electric vehicles in urban road freight transport–A multi criteria analysis of policy measures in Germany. Transp. Res. Part. A 2016, 91, 61–79. [Google Scholar] [CrossRef]
  30. Statharas, S.; Moysoglou, Y.; Siskos, P.; Capros, P. Simulating the evolution of business models for electricity recharging infrastructure development by 2030: A case study for Greece. Energies 2021, 14, 2345. [Google Scholar] [CrossRef]
  31. Novotny, A.; Szeberin, I.; Kovács, S.; Máté, D. National culture and the market development of battery electric vehicles in 21 countries. Energies 2022, 15, 1539. [Google Scholar] [CrossRef]
  32. Koengkan, M.; Fuinhas, J.A.; Belucio, M.; Alavijeh, N.K.; Salehnia, N.; Machado, D.; Silva, V.; Dehdar, F. The impact of battery-electric vehicles on energy consumption: A macroeconomic evidence from 29 European countries. World Electr. Veh. J. 2022, 13, 36. [Google Scholar] [CrossRef]
  33. Ashok, B.; Kannan, C.; Usman, K.M.; Vignesh, R.; Deepak, C.; Ramesh, R.; Narendhra, T.M.V.; Kavitha, C. Transition to electric mobility in India: Barriers exploration and pathways to powertrain shift through MCDM approach. J. Inst. Eng. Ser. C 2022, 103, 1251–1277. [Google Scholar] [CrossRef]
  34. Petrauskiene, K.; Dvarioniene, J.; Kaveckis, G.; Kliaugaite, D.; Chenadec, J.; Hehn, L.; Pérez, B.; Bordi, C.; Scavino, G.; Vignoli, A.; et al. Situation analysis of policies for electric mobility development: Experience from five European regions. Sustainability 2020, 12, 2935. [Google Scholar] [CrossRef]
  35. Pollák, F.; Vodák, J.; Soviar, J.; Markovič, P.; Lentini, G.; Mazzeschi, V.; Luè, A. Promotion of electric mobility in the European Union—Overview of project PROMETEUS from the perspective of cohesion through synergistic cooperation on the example of the Catching-Up region. Sustainability 2021, 13, 1545. [Google Scholar] [CrossRef]
  36. Petrauskiene, K.; Galinis, A.; Kliaugaite, D.; Dvarioniene, J. Comparative environmental life cycle and cost assessment of electric, hybrid, and conventional vehicles in Lithuania. Sustainability 2021, 13, 957. [Google Scholar] [CrossRef]
  37. Martins, H.; Henriques, C.O.; Figueira, J.R.; Silva, C.S.; Costa, A.S. Assessing policy interventions to stimulate the transition of electric vehicle technology in the European Union. Socio-Econ. Plan. Sci. 2023, 87, 101505. [Google Scholar] [CrossRef]
  38. Siebenhofer, M.; Ajanovic, A.; Haas, R. How policies affect the dissemination of electric passenger cars Worldwide. Energies 2021, 14, 2093. [Google Scholar] [CrossRef]
  39. Lis, A.; Szymanowski, R. Greening Polish transportation ? Untangling the nexus between electric mobility and a carbon-based regime. Energy Res. Soc. Sci. 2022, 83, 102336. [Google Scholar] [CrossRef]
  40. Xue, C.; Zhou, H.; Wu, Q.; Wu, X.; Xu, X. Impact of incentive policies and other socio-economic factors on electric vehicle market share: A panel data analysis from the 20 countries. Sustainability 2021, 13, 2928. [Google Scholar] [CrossRef]
  41. Ajanovic, A.; Haas, R.; Schrödl, M. On the historical development and future prospects of various types of electric mobility. Energies 2021, 14, 1070. [Google Scholar] [CrossRef]
  42. Rovňák, M.; Kalistová, A.; Štofejová, L.; Benko, M.; Salabura, D. Management of sustainable mobility and the perception of the concept of electric vehicle deployment. Pol. J. Manag. Stud. 2022, 25, 266–281. [Google Scholar] [CrossRef]
  43. Sousa, C.; Costa, E. Types of policies for the joint diffusion of electric vehicles with renewable energies and their use worldwide. Energies 2022, 15, 7585. [Google Scholar] [CrossRef]
  44. Pelegov, D.V.; Chanaron, J.-J. Electric car market analysis using open data: Sales, volatility assessment, and forecasting. Sustainability 2023, 15, 399. [Google Scholar] [CrossRef]
  45. Sæther, S.R. Mobility at the crossroads–Electric mobility policy and charging infrastructure lessons from across Europe. Transp. Res. Part. A 2022, 157, 144–159. [Google Scholar] [CrossRef]
  46. Dimitriadou, K.; Rigogiannis, N.; Fountoukidis, S.; Kotarela, F.; Kyritsis, A.; Papanikolaou, N. Current trends in electric vehicle charging infrastructure. Opportunities and challenges in wireless charging integration. Energies 2023, 16, 2057. [Google Scholar] [CrossRef]
  47. Szumska, E.M. Electric vehicle charging infrastructure along highways in the EU. Energies 2023, 16, 895. [Google Scholar] [CrossRef]
  48. Skrabulakova, E.F.; Ivanova, M.; Rosova, A.; Gresova, E.; Sofranko, M.; Ferencz, F. On electromobility development and the calculation of the infrastructural country electromobility coefficient. Processes 2021, 9, 222. [Google Scholar] [CrossRef]
  49. Kraciuk, J.; Kacperska, E.; Łukasiewicz, K.; Pietrzak, P. Innovative energy technologies in road transport in selected EU countries. Energies 2022, 15, 6030. [Google Scholar] [CrossRef]
  50. Koengkan, M.; Fuinhas, J.A.; Teixeira, M.; Kazemzadeh, E.; Auza, A.; Dehdar, F.; Osmani, F. The capacity of battery-electric and plug-in hybrid electric vehicles to mitigate CO2 emissions: Macroeconomic evidence from European Union countries. World Electr. Veh. J. 2022, 13, 58. [Google Scholar] [CrossRef]
  51. Fuinhas, J.A.; Koengkan, M.; Leitão, N.C.; Nwani, C.; Uzuner, G.; Dehdar, F.; Relva, S.; Peyerl, D. Effect of battery electric vehicles on greenhouse gas emissions in 29 European Union countries. Sustainability 2021, 13, 13611. [Google Scholar] [CrossRef]
  52. Szymański, P.; Ciuffo, B.; Fontaras, G.; Martini, G.; Pekar, F. The future of road transport in Europe. Environmental implications of automated, connected and low-carbon mobility. Combust. Engines 2021, 186, 3–10. [Google Scholar] [CrossRef]
  53. Skrúcaný, T.; Kendra, M.; Stopka, O.; Milojević, S.; Figlus, T.; Csiszár, C. Impact of the electric mobility implementation on the greenhouse gases production in Central European Countries. Sustainability 2019, 11, 4948. [Google Scholar] [CrossRef]
  54. Onat, N.C.; Abdella, G.M.; Kucukvar, M.; Kutty, A.A.; Al-Nuaimi, M.; Kumbaroğlu, G.; Bulu, M. How eco-efficient are electric vehicles across Europe ? A regionalized life cycle assessment-based eco-efficiency analysis. Sustain. Dev. 2021, 29, 941–956. [Google Scholar] [CrossRef]
  55. Dik, A.; Omer, S.; Boukhanouf, R. Electric vehicles: V2G for rapid, safe, and green EV penetration. Energies 2022, 15, 803. [Google Scholar] [CrossRef]
  56. Vrabie, C. Electric Vehicles Optimism versus the Energy Market Reality. Sustainability 2022, 14, 5388. [Google Scholar] [CrossRef]
  57. Ajanovic, A. The impact of COVID-19 on the market prospects of electric passenger cars. WIREs Energy Environ. 2022, 11, e451. [Google Scholar] [CrossRef] [PubMed]
  58. Rokicki, T.; Bórawski, P.; Bełdycka-Bórawska, A.; Żak, A.; Koszela, G. Development of electromobility in European Union countries under COVID-19 conditions. Energies 2022, 15, 9. [Google Scholar] [CrossRef]
  59. Ruggieri, R.; Ruggieri, M.; Vinci, G.; Poponi, S. Electric mobility in a smart city: European overview. Energies 2021, 14, 315. [Google Scholar] [CrossRef]
  60. Acri, R.A.; Barone, S.; Cambula, P.; Cecchini, V.; Falvo, M.C.; Lepore, J.; Manganelli, M.; Santi, F. Forecast of the demand for electric mobility for Rome–Fiumicino International Airport. Energies 2021, 14, 5251. [Google Scholar] [CrossRef]
  61. Tundys, B.; Wiśniewski, T. Smart mobility for smart cities—Electromobility solution analysis and development directions. Energies 2023, 16, 1958. [Google Scholar] [CrossRef]
  62. Chakraborty, S.; Santanu, K.D.; Elavarasan, R.M.; Kaur, A.; Elangovan, D.; Meraj, S.T.; Kasinathan, P.; Said, Z. Hydrogen energy as future of sustainable mobility. Front. Energy Res. 2022, 10, 893475. [Google Scholar] [CrossRef]
  63. Dash, S.K.; Chakraborty, S.; Roccotelli, M.; Sahu, U.K. Hydrogen Fuel for Future Mobility: Challenges and Future Aspects. Sustainability 2022, 14, 8285. [Google Scholar] [CrossRef]
  64. Cader, J.; Koneczna, R.; Olczak, P. The impact of economic, energy, and environmental factors on the development of the hydrogen economy. Energies 2021, 14, 4811. [Google Scholar] [CrossRef]
  65. Cheba, K.; Bąk, I.; Szopik-Depczyńska, K.; Ioppolo, G. Directions of green transformation of the European Union countries. Ecol. Indic. 2022, 136, 108601. [Google Scholar] [CrossRef]
  66. Kisielińska, J.; Roman, M.; Pietrzak, P.; Roman, M.; Łukasiewicz, K.; Kacperska, E. Utilization of renewable energy sources in road transport in EU countries-TOPSIS results. Energies 2021, 14, 7457. [Google Scholar] [CrossRef]
  67. Pohekar, S.D.; Ramachandran, M. Application of multi-criteria decision making to sustainable Energy planning-A review. Renew. Sustain. Energy Rev. 2004, 8, 365–381. [Google Scholar] [CrossRef]
  68. Mardani, A.; Zavadskas, E.K.; Khalifah, Z.; Jusoh, A.; Nor, K.M. Multiple criteria decision-making techniques in transportation systems: A systematic review of the state of the art literature. Transport 2016, 31, 359–385. [Google Scholar] [CrossRef]
  69. Wang, J.-J.; Jing, Y.-Y.; Zhang, C.-F.; Zhao, J.-H. Review on multi-criteria decision analysis aid in sustainable energy decision-making. Renew. Sustain. Energy Rev. 2009, 13, 2263–2278. [Google Scholar] [CrossRef]
  70. Hwang, C.-L.; Yoon, K. Multiple Attribute Decision Making, 1st ed.; Springer: Berlin, Germany, 1981; pp. 128–132. [Google Scholar]
  71. Diakoulaki, D.; Mavrotas, G.; Papayannakis, L. Determining objective weights in multiple criteria problems: The CRITIC method. Comput. Oper. Res. 1995, 22, 763–770. [Google Scholar] [CrossRef]
  72. Grabiński, T. Metody Taksonometrii; Wydawnictwo Akademii Ekonomicznej w Krakowie: Kraków, Poland, 1992; pp. 101–111. [Google Scholar]
  73. European Alternative Fuels Observatory Database. Available online: https://alternative-fuels-observatory.ec.europa.eu/transport-mode/road (accessed on 10 May 2024).
  74. Eurostat Transport Database. Available online: https://ec.europa.eu/eurostat/databrowser/explore/all/transp?lang=en&subtheme=road.road_eqs&display=list&sort=category&extractionId=tran_r_vehst (accessed on 10 May 2024).
  75. Eurostat Population Database. Available online: https://ec.europa.eu/eurostat/databrowser/view/demo_pjan/default/table?lang=en&category=demo.demo_pop (accessed on 10 May 2024).
  76. Hartigan, J.A.; Wong, M.A. A K-Means Clustering Algorithm. Appl. Stat. 1979, 28, 51. [Google Scholar] [CrossRef]
  77. Davies, D.L.; Bouldin, D.W. A cluster separation measure. IEEE Trans. Pattern Anal. Mach. Intell. 1979, PAMI-1, 224–227. [Google Scholar] [CrossRef]
  78. Hubert, L. Approximate evaluation technique for the single-link and complete-link hierarchical clustering procedures. J. Am. Stat. Assoc. 1974, 69, 698–704. [Google Scholar] [CrossRef]
  79. Hubert, L.J.; Levin, J.R. A General Statistical Framework for Assessing Categorical Clustering in Free Recall. Psychol. Bull. 1976, 83, 1072–1080. [Google Scholar] [CrossRef]
  80. Tibshirani, R.; Walther, G.; Hastie, T. Estimating the number of clusters in a data set via the gap statistic. J. R. Stat. Soc. Ser. B Stat. Methodol. 2001, 63, 411–423. [Google Scholar] [CrossRef]
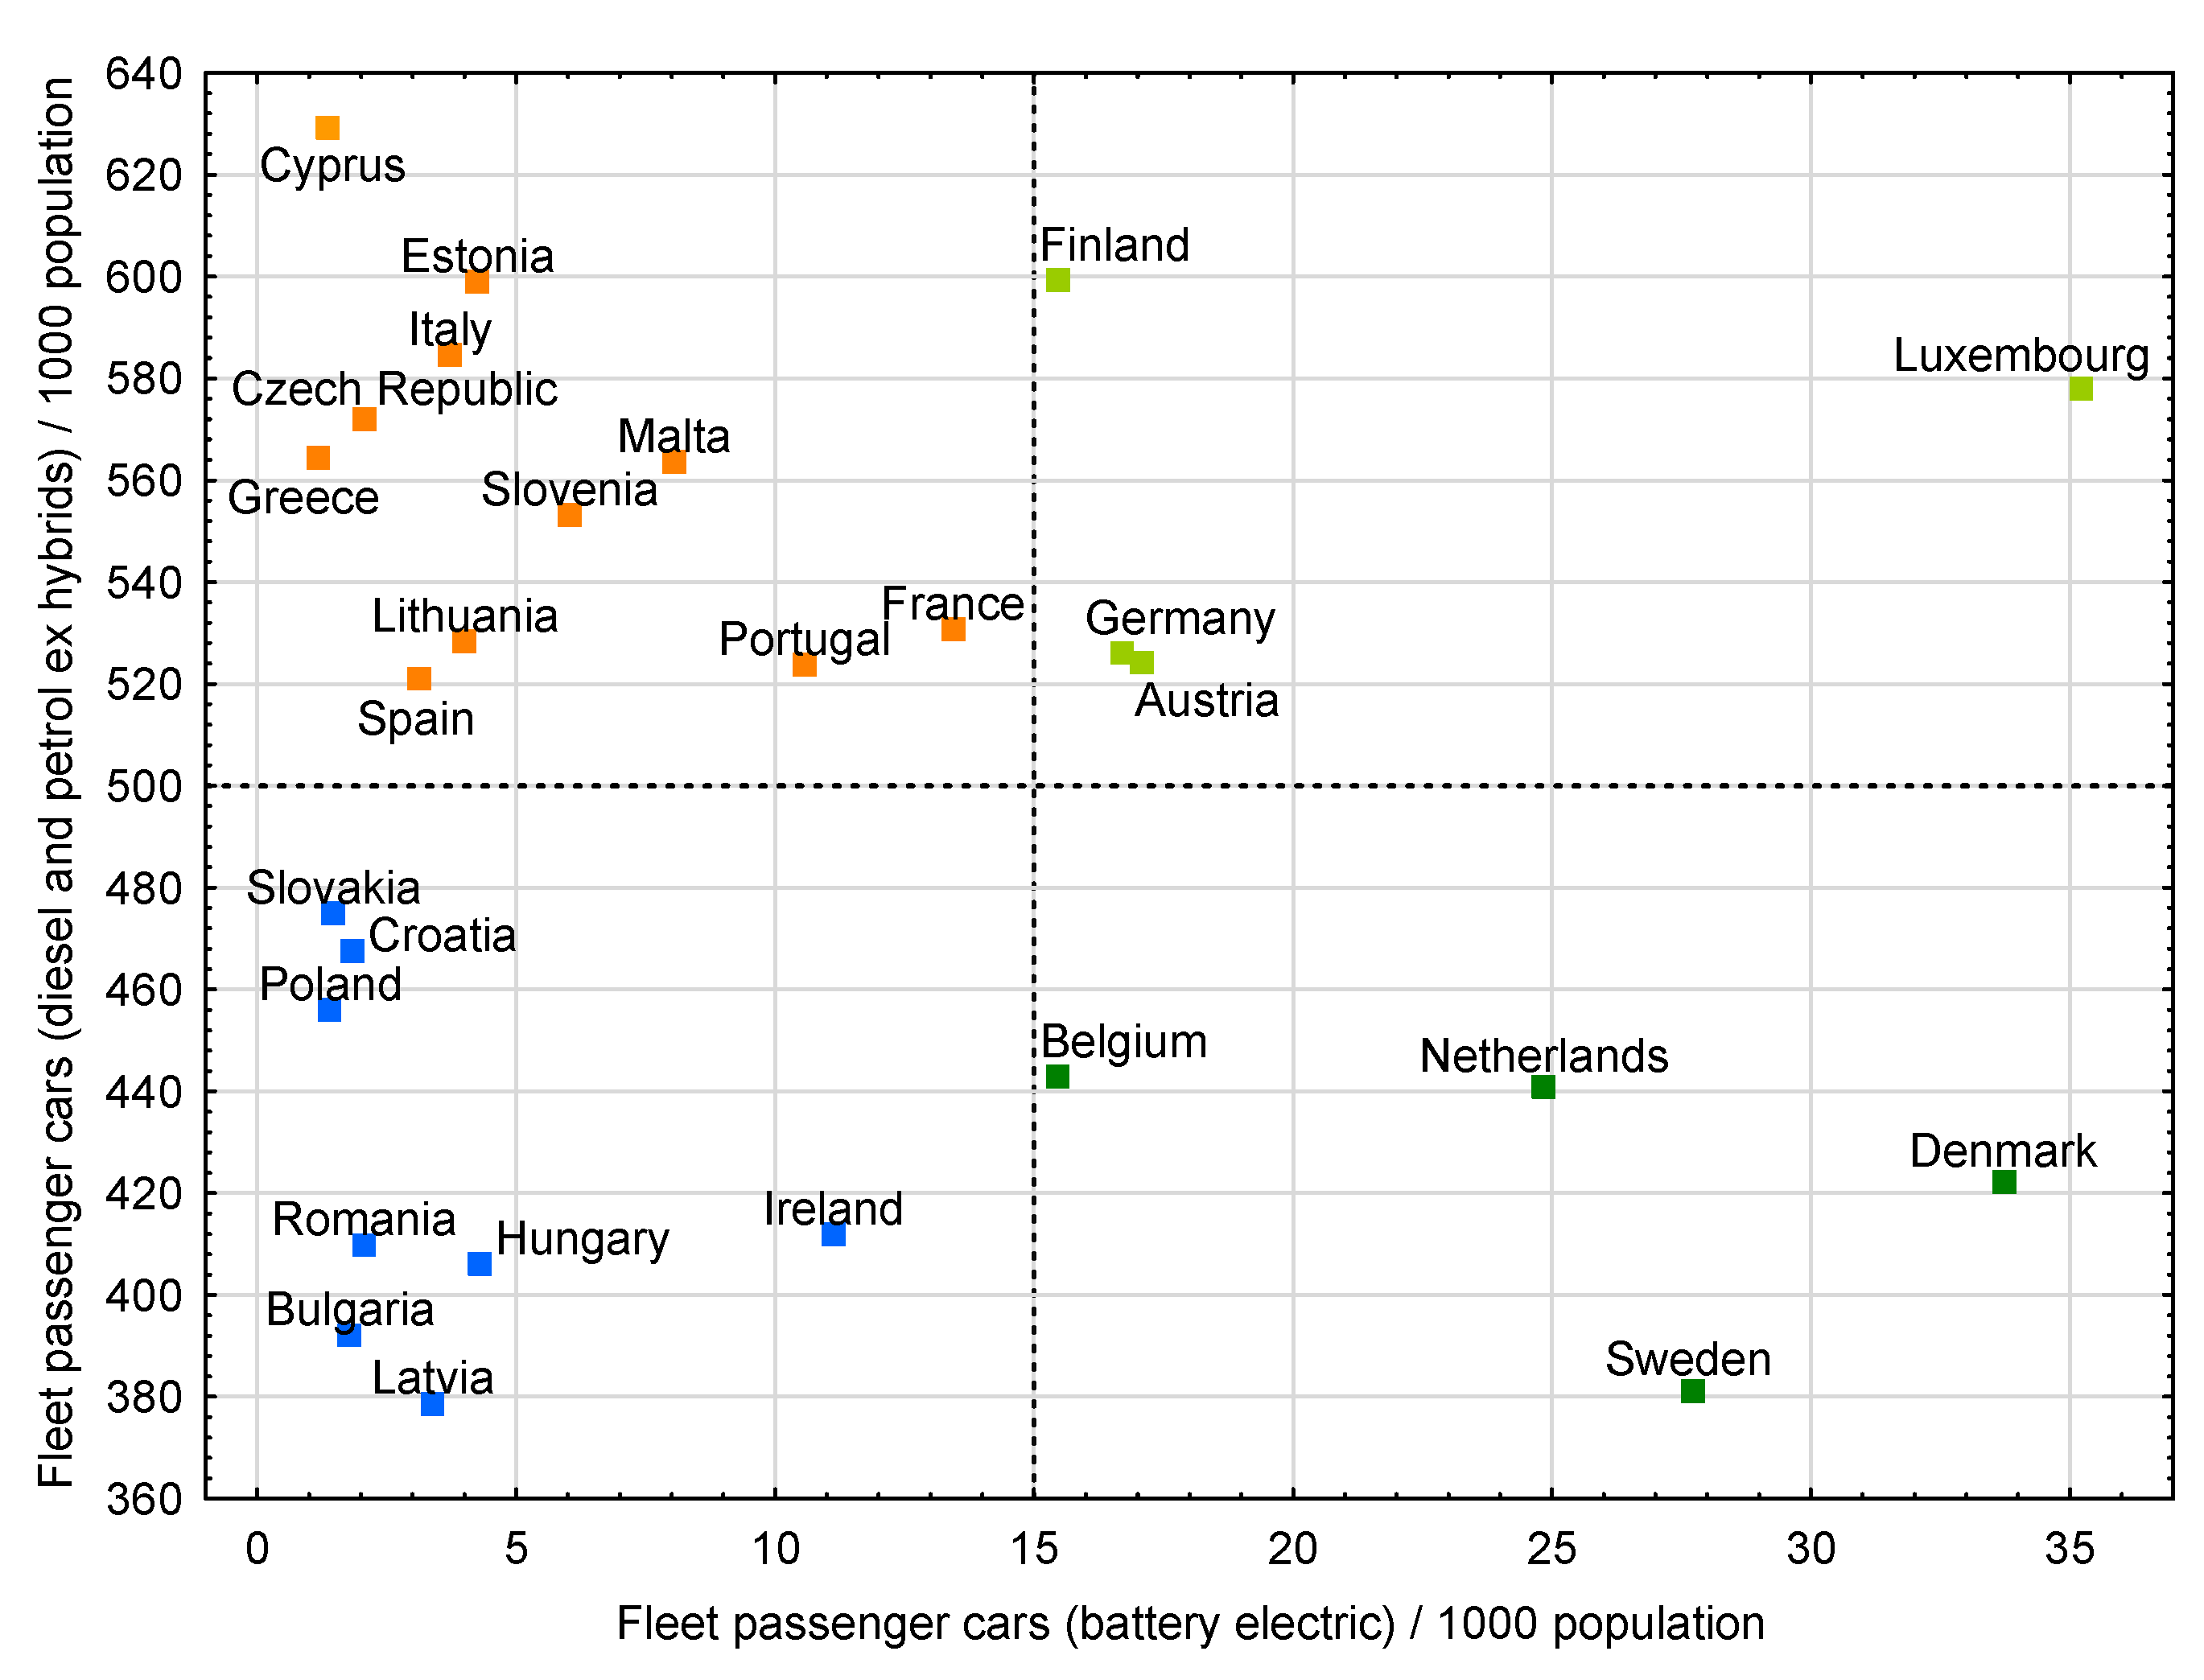
Figure 1. Scatter graph between the fleet of electric cars (BEV) per 1000 inhabitants and the fleet of passenger cars based on traditional fuels (diesel, petrol) per 1000 inhabitants in EU countries in 2023. Source: own study based on statistical data from the European Alternative Fuels Observatory and transport data from the Eurostat database.
Energies 18 04228 g001
Figure 2. (a) Correlation between X1 and X12; (b) correlation between X1 and X14 (the solid line indicates the regression line, the dashed line indicates the 0.95 confidence interval). Source: own study using the Statistica 13 program.
Energies 18 04228 g002
Figure 3. The course of cluster agglomeration. Source: own study using the Statistica 13 program.
Energies 18 04228 g003
Figure 4. The results of cluster analysis and the division of countries into six clusters. Source: own study using the Statistica 13 program.
Energies 18 04228 g004
Figure 5. (a) Radar plot of the ratios of group means to the global mean in cluster I; (b) radar plot of the ratios of group means to the global mean in cluster II. Source: own study.
Energies 18 04228 g005
Figure 6. (a) Radar plot of the ratios of group means to the global mean in cluster III; (b) radar plot of the ratios of group means to the global mean in cluster IV. Source: own study.
Energies 18 04228 g006
Figure 7. (a) Radar plot of the ratios of group means to the global mean in cluster V; (b) radar plot of the ratios of group means to the global mean in cluster VI. Source: own study.
Energies 18 04228 g007
Figure 8. Ranking of EU countries in terms of the average value of the TOPSIS measure (mean) along with the affiliation of the surveyed countries to the obtained clusters. Source: own study with the use of the Statistica 13 (Maps) program.
Energies 18 04228 g008
Table 1. Advantages and disadvantages of individual drives used in vehicles.
Type of VehicleAdvantagesDisadvantages
Electricno exhaust emissions, high energy efficiency, low operating costslimited range and long charging time, problems with battery disposal, high CO2 emissions in battery production
Hybridlower fuel consumption, lower CO2 emissions, quiet operation, no need for charging, longer range than electric carshigher production costs and higher price, lower fuel economy on fast routes, high servicing costs (battery, electrical systems)
Hydrogenfast refueling (about 5 min), long range, no exhaust emissionshigh hydrogen production costs, poorly developed refueling infrastructure, energy losses in hydrogen production
Biofuelsrenewable energy source, reduction of CO2 emissions, can be used in traditional enginesexhaust emissions (lower than in fossil fuels), need to modify engines
Gas
(CNG, LNG, LPG)
lower CO2 emissions, cheaper fuel than classic fossil fuels, cleaner combustionstill fossil fuel (lower emissions)
limited number of refueling stations
large fuel tanks required in vehicles
Solarfree renewable energy, no exhaust emissionslow efficiency (small panel area), dependence on weather conditions, high costs
Source: own study based on the analysis of the subject literature.
Table 2. Basic descriptive statistics of variables selected for research.
Diagnostic VariableAB X ¯ M e X m i n X m a x σ V z
Fleet (passenger cars) as percentage of total fleet
(BEV + PHEV) [%]
X16.115.200.5115.674.5073%
Fleet (passenger cars) as percentage of total fleet
(LPG, CNG, LNG) [%]
X22.040.310.00316.254.12201%
New registrations (passenger cars) as percentage
of total registrations (BEV + PHEV) [%]
X343.8646.300.7277.5819.0043%
New registrations (passenger cars) as percentage
of total registrations (LPG, CNG, LNG) [%]
X41.820.540.0012.223.01165%
New registrations (passenger cars) as percentage
of total registrations (H2) [%]
X50.00280.00020.000.020.01182%
New registrations (vans and buses) as percentage
of total new registrations (BEV + PHEV) [%]
X623.9115.983.1462.0119.5881%
New registrations (vans and buses) as percentage of
total new registrations (LPG, CNG, LNG) [%]
X74.391.250.0021.696.54149%
New registrations (trucks) as percentage
of total registrations (BEV + PHEV) [%]
X81.170.300.007.221.87160%
New registrations (trucks) as percentage
of total registrations (LPG, CNG, LNG) [%]
X92.790.330.0039.617.77278%
Year-over-year growth in recharging
points (AC) [%]
X1012.216.75−26.07211.0141.03336%
AC recharging points (fast speed) as percentage
of total (AC) recharging points [%]
X117.851.980.00100.0019.27245%
DC recharging points (ultra-fast level 1 and level 2)
as percentage of total (DC) recharging points [%]
X1241.9332.440.0087.1523.1355%
Unrestricted accessibility (24/7) recharging points
as percentage of total recharging points [%]
X1366.3370.3622.3396.0421.9433%
Number of LPG vehicles per LPG refueling pointX14129.76111.780.28651.38150.28115%
AFIR (output/target) [%]X15295.39302.8712.12619.53134.3145%
Meaning of symbols: AB—variable symbol (abbreviation), x ¯ —mean, M e —median, X m i n —minimum, X m a x —maximum, σ—standard deviation, Vz—coefficient of variation. Source: own study based on statistical data from the European Alternative Fuels Observatory [73].
Table 3. Correlation matrix between indicators used in the research.
X1X2X3X4X5X6X7X8X9X10X11X12X13X14X15
X11−0.380.66−0.31−0.140.61−0.050.570.020.03−0.040.84−0.18−0.42−0.38
X2−0.381−0.30.170.32−0.230.23−0.220−0.06−0.05−0.27−0.10.80.13
X30.66−0.31−0.180.060.58−0.020.40.140.120.110.44−0.03−0.11−0.39
X4−0.310.17−0.1810.020.180.34−0.240.01−0.18−0.05−0.30.180.470
X5−0.140.320.060.021−0.010.360.19−0.050.06−0.170.090.040.38−0.05
X60.61−0.230.580.18−0.011−0.130.51−0.08−0.03−0.090.55−0.32−0.16−0.26
X7−0.050.23−0.020.340.36−0.131−0.060.340.14−0.10.020.070.410.23
X80.57−0.220.4−0.240.190.51−0.061−0.02−0.05−0.050.65−0.32−0.28−0.16
X90.0200.140.01−0.05−0.080.34−0.0210.03−0.11−0.050.020.040.42
X100.03−0.060.12−0.180.06−0.030.14−0.050.031−0.060.050.16−0.090.38
X11−0.04−0.050.11−0.05−0.17−0.09−0.1−0.05−0.11−0.061−0.350.230.12−0.42
X120.84−0.270.44−0.30.090.550.020.65−0.050.05−0.351−0.33−0.41−0.11
X13−0.18−0.1−0.030.180.04−0.320.07−0.320.020.160.23−0.3310.16−0.07
X14−0.420.8−0.110.470.38−0.160.41−0.280.04−0.090.12−0.410.1610.08
X15−0.380.13−0.390−0.05−0.260.23−0.160.420.38−0.42−0.11−0.070.081
Source: own study based on correlation coefficients determined in the Statistica 13 program.
Table 4. Results of estimating the optimal number of clusters using selected indicators.
Clusters
(k)
Davies–Bouldin [77]
(min)
Baker-Hubert [78]
(max)
Hubert-Levine [79]
(min)
Tibshirani, Walther,
and Hastie (GAP) [80]
min (k) where G A P 0
21.420.260.47−0.0124
31.940.320.43−0.0277
41.730.520.36−0.0453
51.450.620.38−0.0087
61.320.750.290.0197
71.090.790.360.0008
80.930.820.440.0664
Source: own study.
Table 5. Comparison of cluster composition using Ward’s and k-means methods.
Ward’s MethodK-Means Method
Group IAustria, Germany, Ireland, Luxembourg, Cyprus, Hungary, Slovenia, and SpainAustria, Cyprus, Estonia, Hungary, Ireland, Lithuania, Slovenia, and Spain
Group IIMalta, Portugal, and RomaniaMalta, Portugal, and Romania
Group IIIBulgaria, Greece, Lithuania, Croatia, Slovakia, and The Czech RepublicBulgaria, Croatia, The Czech Republic, Greece, Latvia, and Slovakia
Group IVEstonia and LatviaBelgium, Finland, Germany,
and Luxembourg
Group VFrance, Italy and PolandFrance, Italy, and Poland
Group VIDenmark, Sweden, the Netherlands, Finland, and BelgiumDenmark, the Netherlands, and Sweden
Source: own study.
Table 6. The results of EU country rankings based on the following measures: TOPSIS1 (without taking into account variable weights), TOPSIS 2 (with weights), and their average value TOPSIS mean.
CountryTS1R1CountryTS2R2CountryTS3R3CountryTSMRMRF
Netherlands0.4831Estonia0.4171Estonia0.8341Estonia0.5632.331
Sweden0.4622Latvia0.3852Latvia0.7472Latvia0.5193.332
Denmark0.4413Poland0.3473Slovakia0.6943Netherlands0.4687.003
Luxembourg0.4394France0.3304Czech Republic0.6804Denmark0.4488.674
Estonia0.4375Malta0.3205Croatia0.6455Sweden0.4538.675
Latvia0.4246Italy0.3146Austria0.6446France0.42710.676
France0.4227Netherlands0.3067Slovenia0.6367Czech Republic0.42411.007
Finland0.4198Sweden0.3008Greece0.6308Finland0.42211.338
Italy0.4189Denmark0.2949Bulgaria0.6299Luxembourg0.40712.009
Germany0.40110Romania0.26210Lithuania0.62810Belgium0.41113.0010
Belgium0.39511Bulgaria0.24811Finland0.62811Austria0.39913.3311
Romania0.38812Czech Republic0.24712Belgium0.62612Italy0.35913.6712
Poland0.38213Germany0.24413Netherlands0.61613Germany0.40014.0013
Austria0.36714Luxembourg0.22114Denmark0.61014Romania0.39614.0014
Portugal0.36115Finland0.21915Cyprus0.60715Poland0.32514.3315
Malta0.36016Belgium0.21316Sweden0.59916Bulgaria0.38915.0016
Czech Republic0.34617Portugal0.20817Spain0.59517Malta0.36515.3317
Spain0.34018Cyprus0.19618Luxembourg0.56218Slovakia0.38716.6718
Cyprus0.33819Spain0.19019Germany0.55619Cyprus0.38017.3319
Hungary0.32820Austria0.18820Romania0.53720Slovenia0.37218.0020
Slovenia0.32121Ireland0.18121France0.52921Spain0.37518.0021
Ireland0.31822Lithuania0.17722Hungary0.52622Croatia0.36618.3322
Lithuania0.31323Slovakia0.17023Ireland0.52123Lithuania0.37318.3323
Slovakia0.29624Croatia0.16824Portugal0.49324Portugal0.35418.6724
Bulgaria0.28925Hungary0.16825Malta0.41425Greece0.35220.6725
Croatia0.28626Slovenia0.16026Italy0.34626Ireland0.34022.0026
Greece0.26927Greece0.15827Poland0.24627Hungary0.34122.3327
TS1—TOPSIS1 measure (without weights), TS2—TOPSIS2 measure (with weights estimated on the basis coefficient of variation Vz), TS3—TOPSIS3 (with weights estimated according to the CRITIC method), TSM—mean TOPSIS measure, R1—ranking according to TS1, R2—ranking according to TS2, R3—ranking according to TS3, RM—mean of R1, R2, R3 rankings, RF—ranking final. Source: own study.
Disclaimer/Publisher’s Note: The statements, opinions and data contained in all publications are solely those of the individual author(s) and contributor(s) and not of MDPI and/or the editor(s). MDPI and/or the editor(s) disclaim responsibility for any injury to people or property resulting from any ideas, methods, instructions or products referred to in the content.