Article

Distributed Energy Management for Ship-Integrated Energy System Under Marine Environmental Risk Field

1
Navigation College, Dalian Maritime University, Dalian 116026, China
2
Department of Computer Science, The University of Alabama, Tuscaloosa, AL 35487-0290, USA
3
School of Automation Engineering, University of Electronic Science and Technology of China, Chengdu 611731, China
*
Author to whom correspondence should be addressed.
Energies 2025, 18(15), 4163; https://doi.org/10.3390/en18154163
Submission received: 10 July 2025 / Revised: 27 July 2025 / Accepted: 1 August 2025 / Published: 6 August 2025

Abstract

To reduce carbon emissions in the shipping industry, the energy management problem of the ship-integrated energy system (S-IES) is analyzed in this paper. Firstly, a marine environmental risk field model is constructed to quantify the degree of hazard when designing the sailing route. Meanwhile, an energy management model that considers both economic and environmental benefits is developed to enhance the penetration rate of renewable resources. Subsequently, a distributed energy management algorithm based on finite-time consensus theory is proposed to ensure a rapid and accurate response to load demand. Moreover, a mathematical analysis is provided to demonstrate the algorithm’s effectiveness. Finally, the sea area between Singapore Port (Singapore) and Penang Port (Malaysia) is chosen as the simulation environment. The experimental results demonstrate the effectiveness of energy management for the S-IES.

1. Introduction

With the vigorous development of the shipping industry, its demand for fossil fuels has become increasingly strong, leading to a large amount of carbon emissions, which is contrary to the sustainable development of the marine ecological environment [1]. To overcome these disadvantages, the ship-integrated energy system (S-IES), a promising energy structure that combines renewable energy resources with traditional fossil resources, can effectively improve energy utilization efficiency and has been widely studied in recent years [2,3].
The S-IES, with the energy conversion center as its hub, closely couples the marine power and heating networks, the shipboard communication network, and the ship’s propulsion system, enabling a sustained and high-quality energy supply. The energy management problem of the S-IES can be regarded as an optimization problem that provides appropriate energy output solutions for energy devices while satisfying all navigational requirements of the ship. It aims to ensure the safe and reliable operation of S-IES by seeking optimal energy output solutions. Meanwhile, energy management for S-IES, which ensures the high efficiency of diverse energy sources, has garnered significant research attention in recent years. Additionally, as a major factor in measuring the profitability of shipowner companies, the economic benefit is widely regarded as a critical optimization objective for energy management in S-IES [4]. An all-electric ship concept with main and auxiliary generators is proposed in [5], where the energy management problem aims to balance energy storage and power generation. To minimize battery-swapping operational costs, the authors in [6] developed an energy management model for all-electric ships with constraints on velocity and battery utilization. To enhance secure operation, the authors in [7] integrated supply–demand requirements into the energy management analysis. Meanwhile, with the advancements in intelligent technologies and shipboard building technologies, the ship’s energy systems exhibit distinct regional and autonomous features [8]. To this end, the “energy body” concept is developed to embody the structural characteristics, enabling bidirectional energy exchange between independent energy blocks. However, existing research has focused on economic benefits and ship structural characteristics while neglecting the hazards posed by significant carbon emissions. Furthermore, to mitigate the massive carbon emissions of the shipping industry, the International Maritime Organization (IMO), a specialized agency responsible for ensuring the safety and security of the shipping industry, has drafted numerous rules and regulations to reduce carbon emissions. Among these, the most notable is the carbon intensity indicator rating policy. According to the ship’s CII value, ships can be classified into five grades, ranging from A to E, based on their type. In this regard, Grade A presents the highest performance, indicating the lowest carbon emission intensity and the most environmentally friendly option. The IMO encourages official institutions to introduce market trading mechanisms into the CII rating system [9], that is, to impose fines on ships with lower ratings. Therefore, in the analysis of ship energy management issues, it is crucial to optimize both the economic and environmental benefits for ships synergistically.
On the other hand, the approaches to tackle the energy management problem of the S-IES can be categorized into two primary types: centralized and distributed strategies [10]. Specifically, the centralized algorithms for addressing the energy management problem of the S-IES exhibit high accuracy in deriving optimal solutions. However, such manners are susceptible to single-point failures due to their reliance on a central controller [11]. Additionally, centralized algorithms require high-bandwidth communication infrastructure, which the shipboard energy systems may not support. Meanwhile, with the advancement of renewable energy and information technologies, an increasing number of non-professional energy participants have been installed on ships, driving the S-IES toward a flatter, more distributed architecture. Due to the plug-and-play nature of S-IES, both the physical transmission and communication networks of S-IES are prone to variability, which can significantly undermine the effectiveness of centralized strategies. On the contrary, distributed methods characterized by faster computation and lower communication requirements have emerged as a promising option for addressing the energy management problem of the S-IES in recent years. To address the economic scheduling problem, the authors in [12] propose a fully distributed consensus algorithm for the smart grid. To ensure operational security, a distributed energy management strategy is developed in [13] based on the alternating direction method of multipliers to solve the energy management problem with the voltage security constraints.
As we know, the secure operation of S-IES’s energy management not only depends on the coordination between energy participants but is also closely linked to complex marine conditions [14]. The complex marine conditions and variable weather have posed significant challenges to the construction of marine risk field models [15]. Meanwhile, traditional route planning methods rely excessively on the mariners’ subjective experience, with a fundamental flaw in the lack of effective assessment of marine environmental risks. The existing methods fail to fully consider the impact of hydrological and meteorological factors on ship navigation security [16]. To overcome this disadvantage, risk assessment, as a systematic method capable of identifying, analyzing, and responding to massive hazards, has been widely applied in natural risk assessment and management research. Moreover, with the advancement of research, risk assessment methods have been gradually extended to various fields. Additionally, to quantify risk values, assessment methods are usually combined with technologies such as remote sensing [17], numerical simulation [18], and multi-criteria decision analysis [19] to construct comprehensive evaluation systems. The authors in [20], aiming to assess the Arctic navigation environment and accident risk, use environmental impact factors to construct a typical accident risk assessment model for the Arctic sea area. The authors in [21] identify fog and ice accretion as the main risks of extreme weather, objectively demonstrate the distribution changes of navigation risks, and provide a reliable basis for route planning. The authors in [22] propose a ship navigation risk assessment method in marine wind farm waters based on a multi-factor fuzzy analytic hierarchy process, which significantly reduces navigation risks. As noted, a single-factor risk can only reflect the independent impact of a single variable on navigation security. However, in the actual marine environment, risk factors can interact with one another. For example, strong winds may lead to larger waves, which in turn affect the stability and maneuverability of ships. The direction and speed of ocean currents may cause ships to deviate from their planned routes, increasing the risk of colliding with islands or reefs. Therefore, it is crucial to consider the synergy of multiple risk factors and develop a marine environmental risk field model to ensure secure sailing.
Additionally, numerous distributed algorithms, such as Newton’s descent algorithms [7] and gradient descent algorithms [23], have been widely employed to address the energy management problem for the S-IES. Unlike traditional energy systems, the load demand of a ship’s propulsion system requires a rapid and accurate response, depending on the navigation environment. Therefore, it is essential to prioritize their computational efficiency when designing energy management algorithms.
With these motivations, the energy management problem of the S-IES is analyzed under the marine environmental risk field. The major contributions are as follows: (1) To address the negative impacts of multiple risk hazards on ship navigational safety in complex marine environments, a marine environmental risk field model is constructed that integrates geographical environment and hydrological data. (2) To decrease the carbon emissions generated by S-IES, an energy management model aiming at maximal economic and environmental benefits is developed. Furthermore, a distributed algorithm is designed with the concept of finite-time consensus, ensuring a rapid and accurate response to load demands.
The remainder of this paper is organized as follows. Section 2 constructs a marine environmental risk field model. An energy management model and a distributed algorithm based on the finite-time consensus theory are proposed in Section 3. Meanwhile, the mathematical analysis is illustrated in Section 3. Section 4 concludes the paper, demonstrating its effectiveness through simulation experiments. For clarity, key symbol annotations are provided in Table 1.

2. Sailing Route Design Under Marine Environmental Risk Field Model

This section presents the ship route design procedure, which involves constructing a marine environmental risk field model and optimizing velocity planning.

2.1. Marine Environmental Risk Field Model

Ship navigation is highly susceptible to complex marine conditions. To enhance the reliability of ship energy management systems, a marine environmental risk field model is constructed, and the operational framework is depicted in Figure 1.
Step 1: Data Collection and Preprocessing
Geographic features and oceanographic parameters of the target maritime area are collected and preprocessed. Ship navigation operations are highly susceptible to disturbances from complex marine conditions, particularly wind, waves, currents, and submerged rocks. Currently, meteorological data (e.g., wind, waves, and currents) are predominantly stored in NetCDF (Network Common Data Form) format, while features such as submerged rocks use Shapefile formats. To meet geospatial analysis requirements, heterogeneous marine condition data must be unified into a single vector data format. Precisely for this purpose, ArcGIS 10.7 software is utilized to convert NetCDF datasets into Shapefile format. This standardization enables subsequent spatial analysis and cartographic operations.
Furthermore, marine remote sensing data predominantly consists of time-series dynamic datasets that require periodic updates. To extract valid information, temporal averaging is applied to data collected over a specific time interval, with the results ultimately rendered in raster format. However, disparities in data sources may lead to adverse outcomes, such as inconsistent spatial resolutions in raster data. To mitigate errors induced by resampling heterogeneous data to a unified resolution, the Kriging interpolation method is employed.
Step 2: Hazard Factor Analysis and Evaluation Criteria Construction
The main hazard factors can be attributed to sea breezes, ocean waves and currents, and terrain environments.
  • Sea breeze: The wind–wave coupling effect readily induces violent ship motions, including roll, pitch, and heave. Specifically, roll motion may cause excessive hull heeling beyond safety limits and stability loss; pitch motion amplifies vertical slamming loads on bow and stern structures; heave motion triggers propeller ventilation (cavitation) or deck immersion by waves.
  • Ocean wave: Drastic variations in parameters such as wave height and period compromise hull stability. Heavy wave conditions not only force a ship’s velocity reduction but also significantly increase the collision probabilities with floating debris, leading to exponentially escalating risks of equipment damage.
  • Ocean current: To ensure ships maintain their intended sailing route with changing ocean currents, continuous heading adjustments are required to preserve the target course. Simultaneously, currents significantly impact the ship’s velocity relative to the ground.
  • Terrain environment: Navigational risks in shallow waters exhibit nonlinear characteristics. The wave-making resistance increases as the ratio of actual water depth to the ship’s draft falls below the safety threshold. Concurrently, the ship sinkage increases exponentially with velocity, directly triggering a nonlinear surge in grounding probability.
Specifically, sea breeze risk degree quantifies wind impact intensity on ships, measured by wind speed, with higher velocities proportionally increasing risk levels. Wave risk degree reflects the intensity of wave impact, gauged by wave height, where higher heights correspond to greater risk. The degree of ocean current risk indicates operational challenges induced by currents as higher flow velocities degrade maneuverability and amplify risk. The risk degrees D i for these factors are mathematically formulated as (1).
D i = W i 2 / ( W i min ) 2 , i Ω F ,
where W represents the actual value of the corresponding hazard factor within each grid cell. W min denotes the minimal value of the corresponding hazard factor. i denotes the index of a hazard factor within the set Ω F , where Ω F = Ω B Ω W Ω C . Ω B , Ω W , and Ω C denote the sets of sea breeze parameters, wave parameters, and ocean current parameters respectively, each containing all values from their corresponding datasets. (1) is designed to achieve dimensionless normalization of the risk factors. Meanwhile, it ensures the nonlinear amplification effect in high-risk areas (for example, when wind speed or wave height exceeds the threshold, the risk increases exponentially). This form is common in engineering risk assessments (such as wind disaster and tsunami models).
Additionally, the water depth risk level is derived from navigable depth, where shallower depths increase navigational hazards, as defined in (2).
D i = H ˜ i + H i + 1 2 H i , i Ω E ,
where H ˜ denotes draft, H represents under keel clearance, and H signifies wave height. Ω E presents the set of terrain environment parameters.
Step 3: Risk Field Model Design
Single-factor risk spatial visualization requires integrating risk assessment models with Geographic Information System (GIS) technology. It is based on single-element risk quantification models and combines spatial interpolation algorithms and raster operation modules within GIS platforms. These components collectively accomplish the construction of multidimensional marine risk assessment thematic maps. Specifically, utilizing heat map visualization, risk maps for four hazard factors (sea breeze, ocean wave, ocean current, and terrain environment) can be generated based on their respective data and methods as listed in Table 2. Then, the heat map visualization of each hazard factor is presented in Figure 2.
As depicted in Figure 2, red high-value zones indicate hazardous areas unsuitable for operations, while blue low-value zones represent safe navigation corridors. The risk index is normalized to a continuous scale of 0 to 1, where zero corresponds to optimal navigation conditions, and 1 signifies a hazardous navigational state. This achieves visualized hierarchical warnings for risks in complex marine environments.
However, marine environmental risk factors exhibit significant spatiotemporal coupling characteristics. Consequently, single-factor analysis can only provide partial insight into risk perception, necessitating the development of a multi-factor, synergistic assessment model to reveal the interaction mechanisms among elements. To address this, this study adopts a multi-factor superposition analysis method, achieving synergistic risk assessment through a normalized quantification model.
However, marine environmental risk factors exhibit significant spatiotemporal coupling characteristics. To overcome the disadvantage of single-factor analysis, a multi-factor synergistic assessment model is constructed. The assessment model relies on the weighted summation of risk factor indicators, which can be expressed as (3).
R k = w k · D k , k Ω K ,
where Ω K and k are the grid set and its index. w k = [ w B T , w W T , w C T , w E T ] presents the weighted parameter vector at the kth grad. The weighted parameters are acquired by the combination of the Analytic Hierarchy Process method and the entropy weight method. The selecting mechanism improves the objectivity and accuracy of evaluation results. D k = [ D B T , D W T , D C T , D E T ] T presents the risk degree vector describing hazard factors at the kth grad. Therein, w B , D B R | Ω B | , w W , D W R | Ω W | , w C , D C R | Ω C | , and w E , D E R | Ω E | . | · | is the cardinality of the corresponding set.
Subsequently, marine environmental risk values calculated via (3) are classified into four risk levels, as definitively tabulated in Table 3.
This developed marine environmental risk field model enables a multidimensional assessment of risks as the ship sails through, utilizing quantitative computation and visual representation of spatial data to provide geospatial decision support for route planning.

2.2. Velocity Plan

Optimized sailing routes can be efficiently generated using A algorithms, genetic algorithms, or ant colony optimization algorithms. Security can be enhanced by leveraging the spatial assessment results of the marine environmental risk field model. However, a complete navigational mission plan comprises not only route information but also requires velocity planning. Subsequently, accounting for the ship’s navigation characteristics, the primary objective in designing the velocity profile is to
T = i Ω s | t i | ,
where T denotes the total sailing duration. The sailing stage set is defined as Ω s = Ω berth Ω dep Ω cru Ω app , where Ω berth , Ω dep , Ω cru , and Ω app represent the ship’s berthing, departure, cruising, and approach stages, respectively.
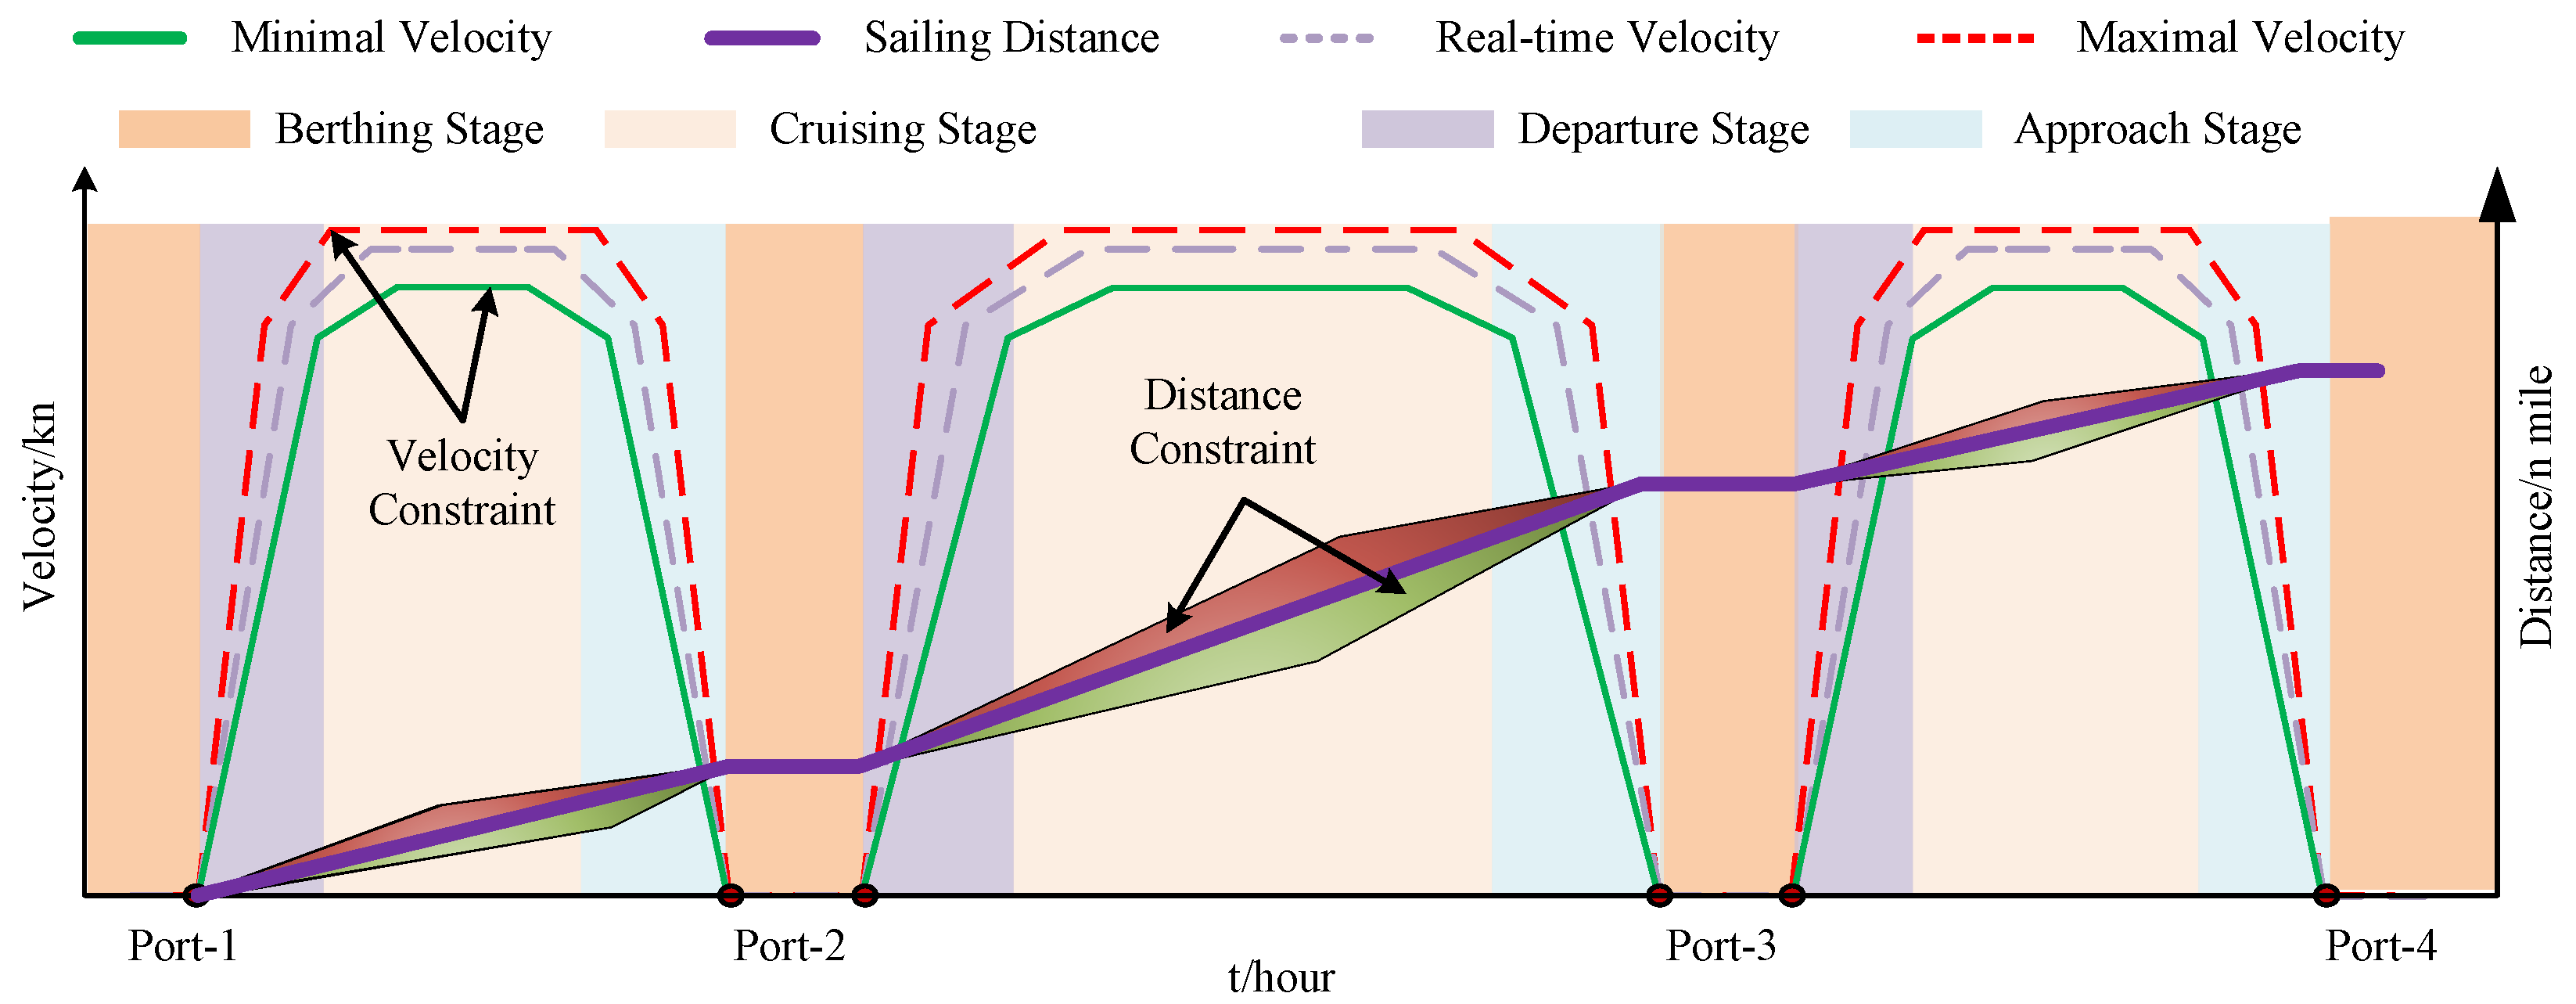
Furthermore, ensuring safe navigation requires adherence to a set of operational constraints. The ship’s voyage profile is depicted in Figure 3. As shown in Figure 3, it indicates that the ships have different velocity limitations during different sailing stages while executing navigational missions. In other words, it reminds us that when optimizing a sailing route, not only the complex marine environment should be taken into account, but also the ship’s operating characteristics need to be considered. Moreover, timely or early arrival at the port according to the scheduled timeframe should be guaranteed.
Then, the requirements for the ship’s sailing can be presented as
v i min v i = η 1 pr · p i , ld pr η 2 pr v i max , i Ω s ,
i Ω s Ψ i · v i · Δ t Dis t p q ,
where (5) and (6) represent the velocity and sailing distance constraints, respectively. Specifically, v min and v max denote the minimum and maximum velocities for each sailing stage, respectively. Ψ denotes the state variable, defined as Ψ i τ berth , τ dep , τ cru , τ app , where τ berth , τ dep , τ cru , and τ app { 0 , 1 } represent the state variables of each sailing stage. Meanwhile, τ berth = 1 during the berthing stage ( τ dep = τ cru = τ app = 0 ), and similar operational principles apply to other sailing stages. Δ t is a constant time slot. Dis t p q denotes the distance between Port p and Port q, where p q .
Remark 1.
The load demand of the ship’s propulsion system will rise sharply in case of dangerous situations to maintain the ship’s normal sailing velocity. Thus, the developed marine environmental risk field model facilitates the implementation of energy management analyses for ships.
Then, the state variable Ψ i should obey
τ dep t 1 τ cru t , t Ω dep , τ dep t 1 τ cru t τ cru t + 1 , t Ω cru , τ cru t 1 τ app t τ app t + 1 , t Ω app , τ app t 1 τ ber t τ ber t + 1 , t Ω ber , τ dep t 1 τ dep t , t Ω dep .
Therefore, the velocity optimization problem can be formulated as
min ( 4 ) , s . t . ( 5 ) , ( 6 ) , ( 7 ) .
Through the above analysis, an optimal velocity profile can be generated for the sailing route under the marine environmental risk field model. Meanwhile, a load demand curve can be derived using the mathematical relationship between the ship’s velocity and its propulsion system load requirement. This optimized velocity scheme ensures that ships complete the navigation mission both safely and efficiently.

3. Energy Management Model and Distributed Algorithm

This section develops an energy management framework for the S-IES, encompassing the formulation of the optimization model and the design of its distributed algorithm.

3.1. Energy Management Model

The S-IES, with an energy management center at its core, enables the conversion of power and heating networks. Its components are classified into supply-side and demand-side based on the operational characteristics of energy participants. Specifically, the energy participants on the supply side contain renewable-based devices (RBDs), fuel-based devices (FBDs), combined heating and power devices (CHPDs), and energy storage devices (ESDs). The operational cost functions of the above devices obey
C i x i = a i · x i 2 + c i , i Ω FBD ,
C i x i = a i · x i 2 + b i · x i + c i , i Ω RBD ,
C i p i , h i = a i · p i 2 + a i · h i 2 + b i · p i + b i · h i + c i · p i · h i + d i , i Ω CHPD ,
C i x i = a i · x i + b i 2 , i Ω ESD ,
where (9a), (9b), (9c), and (9d) are the operational cost functions of FBD, RBD, CHPD, and ESD, respectively. Ω FBD , Ω RBD , Ω CHPD , and Ω ESD are the sets of FBD, RBD, CHPD, and ESD, respectively. x i { p i , h i } denotes the energy output; therein, p i , h i are the power and heating outputs of the ith device, respectively. The constant parameters a, a b, b , c, and d are determined by the devices themselves.
Consequently, the total operational cost E 1 of the S-IES is summarized as
E 1 x = i Ω FBD Ω RBD Ω ESD x i p i , h i C i x i + i Ω FBD Ω RBD Ω ESD C i p i , h i ,
where x = [ p T , h T ] T is the energy output vector, regarded as the decision variable; therein, p = { p i | i Ω N } , h = { h i | i Ω N } are power and heating output vectors, respectively. Ω N denotes the complete node set of the S-IES.
Furthermore, the objectives of S-IES energy management must extend beyond economic benefits to encompass carbon reduction from FBDs and CHPDs. As a key technical measure designed and promoted by the IMO, the Energy-Efficiency Operational Index (EEOI) intuitively reflects the carbon emission intensity per unit distance traveled by ships. Under the EEOI concept, an additional optimization objective beyond economic benefits can be defined as
E 2 x = x i p i , h i α i · x i 2 + β i · x i + γ i / Dist p q · Load p q ,
where α , β , and γ are carbon conversion parameters. i Ω CHPD Ω FBD . Similar to Dist p q , the ship’s actual carrying capacity between Port p and Port q is defined as Capacity p q .
Additionally, the ship’s secure and stable sailing relies on many requirements, namely,
i Ω RBD p i + i Ω FBD p i + i Ω CHPD p i ± i Ω ESD p i = i Ω LD p i ,
i Ω RBD h i + i Ω FBD h i + i Ω CHPD h i ± i Ω ESD h i = i Ω LD h i ,
p i min p i p i max , i Ω RBD Ω FBD Ω CHPD Ω ESD ,
h i min h i p i max , i Ω RBD Ω FBD Ω CHPD Ω ESD ,
where (12a) and (12b) are the supply–demand balance constraints of power and heating networks, respectively. (12c) and (12d) are power and heating output limitations, respectively. p min and h min are minimal power and heating outputs, and p max and h max are maximal power and heating outputs.
Consequently, the energy management problem can be formulated as an energy optimization model, namely,
min E 1 x , E 2 x , s . t . H 1 x 0 , H 2 x = 0 .
where H 1 ( x ) and H 2 ( x ) denote the set of inequality constraints and the set of equality constraints, respectively. Note that the optimization problem (13) does not seek the optimal solution when minimizing E 1 or E 2 individually but rather optimizes through achieving a trade-off between E 1 and E 2 . Meanwhile, to eliminate the negative influence caused by the differences between the units of E 1 and E 2 , normalization is necessary for (13). Then, the energy management model can be constructed as
min E 1 x E 1 min E 1 max E 1 min f 1 x , E 2 x E 2 min E 2 max E 2 min f 2 x , s . t . H 1 x 0 , H 2 x = 0 .
Then, based on the weighting concept (14), it can be converted into a single-objective optimization problem, namely,
min F x = ω 1 · f 1 x + ω 2 · f 2 x , s . t . H 1 x = x min x T x max x 0 , H 2 x = 0 ,
where ω 1 and ω 2 are the weighted parameters satisfying ω 1 + ω 2 = 1 . Note that the inequality constraint H 1 increases the solving difficulty of the optimization problem (15). To this end, a ϵ -exact penalty function is developed as
Ψ ϵ , i 1 , i x i = 0 , H 1 , i x i 0 , H 1 , i x i H 1 , i x i 2 , 0 H 1 , i x i < 2 ϵ , 0 H 1 , i x i < ϵ , H 1 , i x i ϵ 2 2 , 1 , i x i ϵ ,
where ϵ is a positive parameter. Then, the energy management problem (15) can be rewritten as
min F ˜ x , s . t . H 2 x = 0 ,
where F ˜ x = F x + λ Ψ ϵ , i ; therein, λ is a positive weighted parameter.

3.2. Distributed Energy Management Algorithm

Define the communication topology of S-IES as G = { V , B } . Therein, V = { v i | i , Ω } represents the S-IES’s node set; B = { a i , j | i Ω , j Ω } represents the boundary set. Specifically, a i , j = 1 if nodes v i and v j are adjacent and i j ; otherwise, a i , j = 0 . Then, the Laplacian matrix L = { l i , j | i Ω , j Ω } can be acquired by B . Therein, l i , i = | N i | , where N i represents the neighboring node set of node v i , and | N i | is its cardinality; l i , j = a i , j , when i j .
Then, inspired by the finite-time consensus theory, a distributed energy management algorithm is designed to search for the optimization solutions of (17), namely,
x ˙ i = j N i a i , j F ˜ j x j F ˜ i x i p + j N i a i , j F ˜ j x j F ˜ i x i q ,
where p = 2 q , q = m 1 / m 2 ; therein, m 1 and m 2 are positive odd integers meeting m 1 < m 2 . It finds that node v j only receives information from and sends information to its adjacent nodes, demonstrating the algorithm’s distributed characteristic. The detailed procedure of the energy management scheme for S-IES is presented in Figure 4.
Theorem 1.
For the energy management problem (17), the feasible set is time-invariant, enabling the results obtained by the distributed algorithm (18) to converge to the optimal solution in finite time.
Proof. 
Define an auxiliary function V as
V = i Ω F ˜ i x i i Ω F ˜ i x i ,
where x i is noted as the optimal result of the node v i in S-IES. Hence, the minimum values of F ˜ can be ensured and V = 0 when x i = x i ; otherwise, V > 0 . Additionally, define τ i F ˜ i x i . Then, we have
V ˙ = i Ω τ i x ˙ i , = i Ω τ i x ˙ i j Ω a i , j τ j τ i p + j Ω a i , j τ j τ i q .
Then, through mathematical transformation, (20) can be transformed into
V ˙ = 1 2 i , j Ω a i , j 2 m 2 3 m 2 m 1 τ j τ i 2 3 m 2 m 1 2 m 2 + i , j Ω a i , j 2 m 2 m 1 + m 2 τ j τ i 2 m 1 + m 2 2 m 2 .
Inspired by [24], V ˙
V ˙ 1 2 Ω m 1 m 2 m 2 2 τ T L 1 τ 3 m 2 m 1 2 m 2 + 2 τ T L 2 τ m 1 + m 2 2 m 2 ,
where τ = { τ i | i Ω } . | Ω | is the cardinality of the node set Ω . L 1 R | Ω | and L 2 R | Ω | are Laplacian matrices of the weighted matrices 𝔾 1 and 𝔾 2 , respectively. Then, denote auxiliary variables Υ 1 and Υ 2 as
Υ 1 = 2 τ T L 1 τ 2 λ 2 L 1 τ 1 Ω 1 T τ 1 T ,
Υ 2 = 2 τ T L 2 τ 2 λ 2 L 2 τ 1 Ω 1 T τ 1 T ,
where λ 2 ( · ) represents the second smallest eigenvalue of the corresponding matrix. Then, it holds that
F ˜ x ^ F ˜ x τ 1 Ω 1 T τ 1 T x ^ x + k 2 x ^ x 2 ,
where k is a positive constant. x ^ is a random vector satisfying the requirements of the energy management problem (17). Subsequently, it can be deduced that V 1 2 k τ 1 Ω 1 T τ 1 T . Then, combined (23a), (23b), and (24), we have
V ˙ 1 2 Ω m 1 m 2 m 2 4 k λ 2 L 1 3 m 2 m 1 2 m 2 1 2 4 k λ 2 L 2 m 1 + m 2 2 m 2 , 1 2 Ω m 1 m 2 m 2 4 k λ min V m 2 m 1 m 2 + 1 4 k λ min V m 1 + m 2 2 m 2 ,
where λ min represents the minimum of λ 2 ( L 1 ) and λ 2 ( L 2 ) . Then, with mathematical transformation, (25) can be simplified to
Λ ˙ = Ω m 1 m 2 m 2 λ min Λ 2 m 2 m 1 m 2 λ min Λ m 1 m 2 ,
where Λ = ( 4 k λ min V ) 1 / 2 . Then, it holds that
lim t t 1 V = 0 , t 1 π m 2 Ω m 2 m 1 2 m 2 2 λ min m 2 m 1 .
Therefore, i Ω F ˜ i x i i Ω F ˜ i x i = 0 can be deduced. Theorem 1 is proved. □

4. Simulation Results

4.1. Experimental Environment

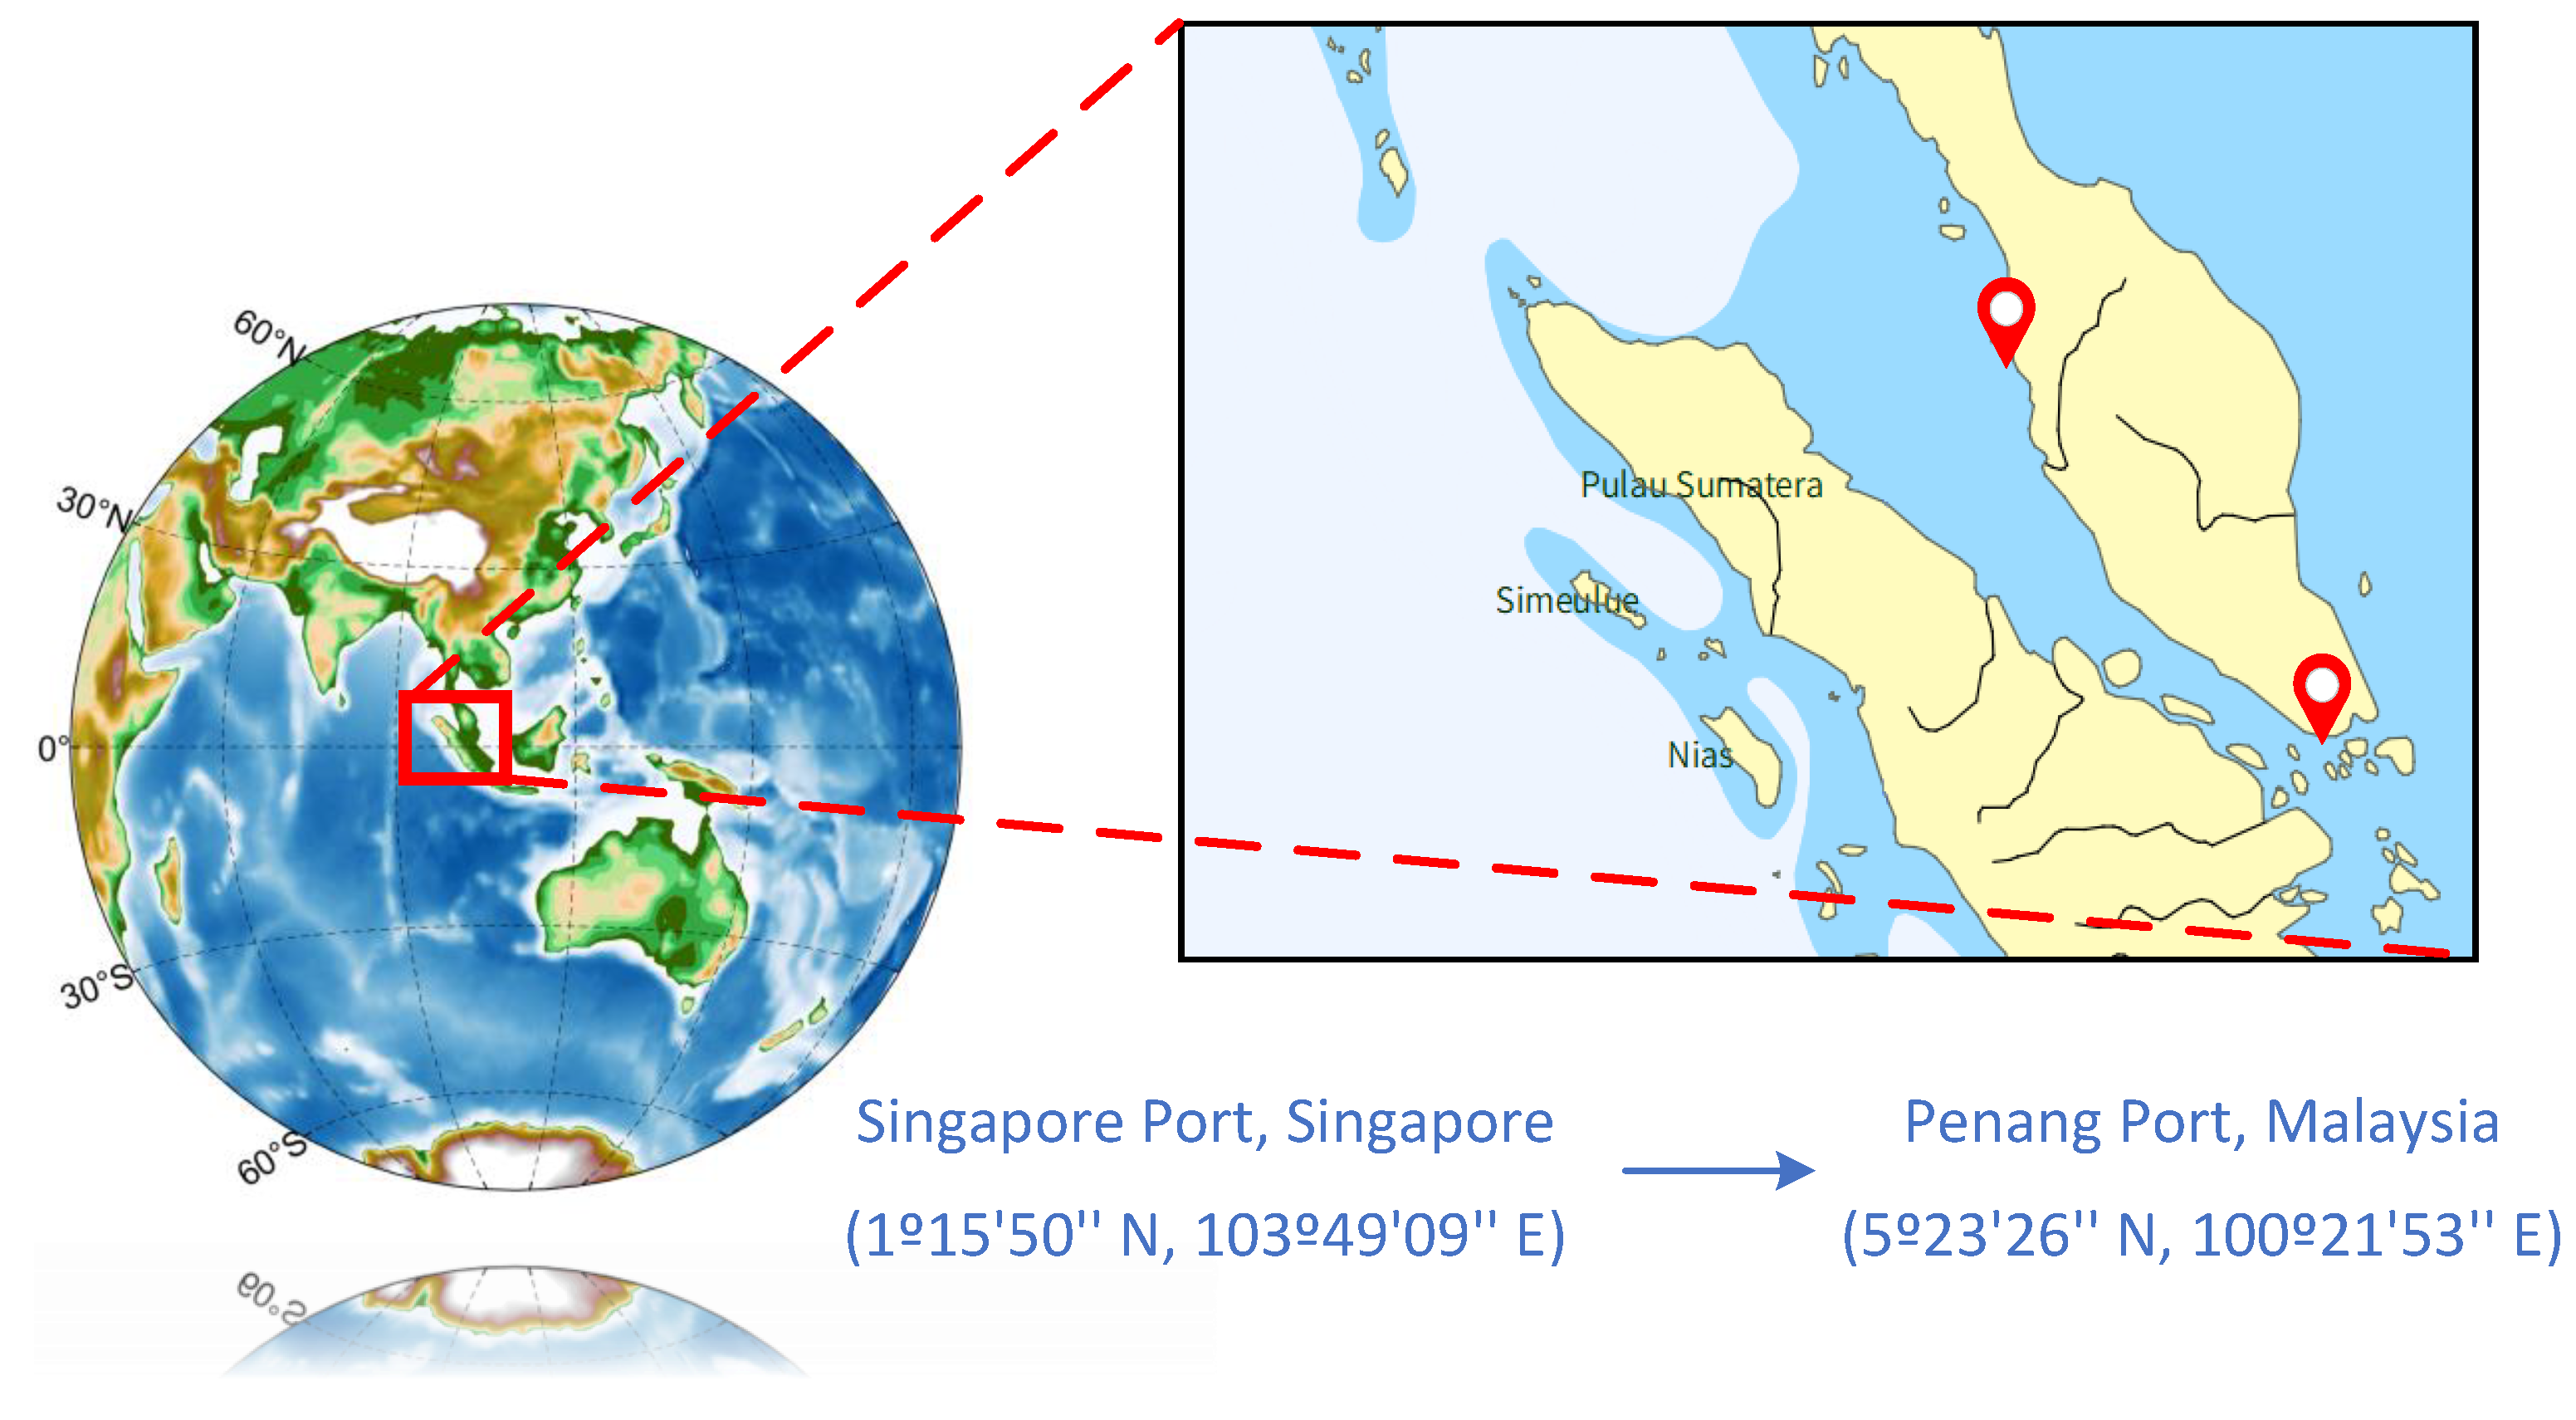
In this section, we design the simulation experiments based on the training vessel YUKUN from Dalian Maritime University (DMU). Related parameters of “YUKUN” are recorded in Table 4. Assume that the S-IES power network comprises two FBDs, one CHPD, three RBDs, and one ESD, while its heating network contains one FBD, one CHPD, two RBDs, and one ESD. The operational cost and carbon conversion parameters of the energy devices are listed in Table 4. Meanwhile, the velocity conversion parameters are set to σ pr 1 = 333.3 and σ pr 2 = 3.0 . The initial values for the energy devices are set as the sum of 0.7 times the maximum values and 0.3 times the minimum values. Additionally, an actual voyage from Singapore Port to Penang Port is applied to enhance the effectiveness of the developed framework, as shown in Figure 5. Specifically, the starting point and the endpoint are 1 15 50 N, 103 49 09 E and 5 23 26 N, 100 21 53 E. Moreover, based on the actual navigation characteristics, the voyage can be divided into 38 segments with a constant time slot.
Moreover, this study utilizes the Bedrock Elevation NetCDF dataset from the latest ETOPO2022 release, which provides 15-arc-second resolution data that integrates regional and global topography, bathymetry, and coastline information to deliver a high-resolution, comprehensive characterization of surface geophysical features. Land elevation and coastline data are sourced from the National Geophysical Data Center (NGDC), while bathymetric data are obtained from the S-57 hydrographic standard.

4.2. Sailing Route Design Analysis

In this section, the hazard factors (such as ocean waves, ocean currents, sea breezes, and terrain environments) are considered when developing the risk field model. Based on the technical method configurations and spatial analysis parameters specified in Table 2, the map visualization for each hazard factor is generated and displayed in Figure 6.
As shown in Figure 6a–d, heterogeneous data dimensions lead to variations in pixel values across thermodynamic charts. This further confirms that the preprocessing of individual hazard data is necessary before constructing the risk field model. At this point, four different sailing routes can be plotted based on the map visualizations of four individual risk factors, which are presented in Figure 7. According to Figure 7a–d, different routes are formulated when considering different risk factors. Calculation and measurement show that routes depicted in Figure 7a–d pass through 68.84, 73.22, 69.79, and 75.29 grid cells, with each cell representing 4.95 n miles. Then, the sailing distances of the mentioned four routes are 339.27, 362.44, 345.46, and 345.58 n miles, respectively.
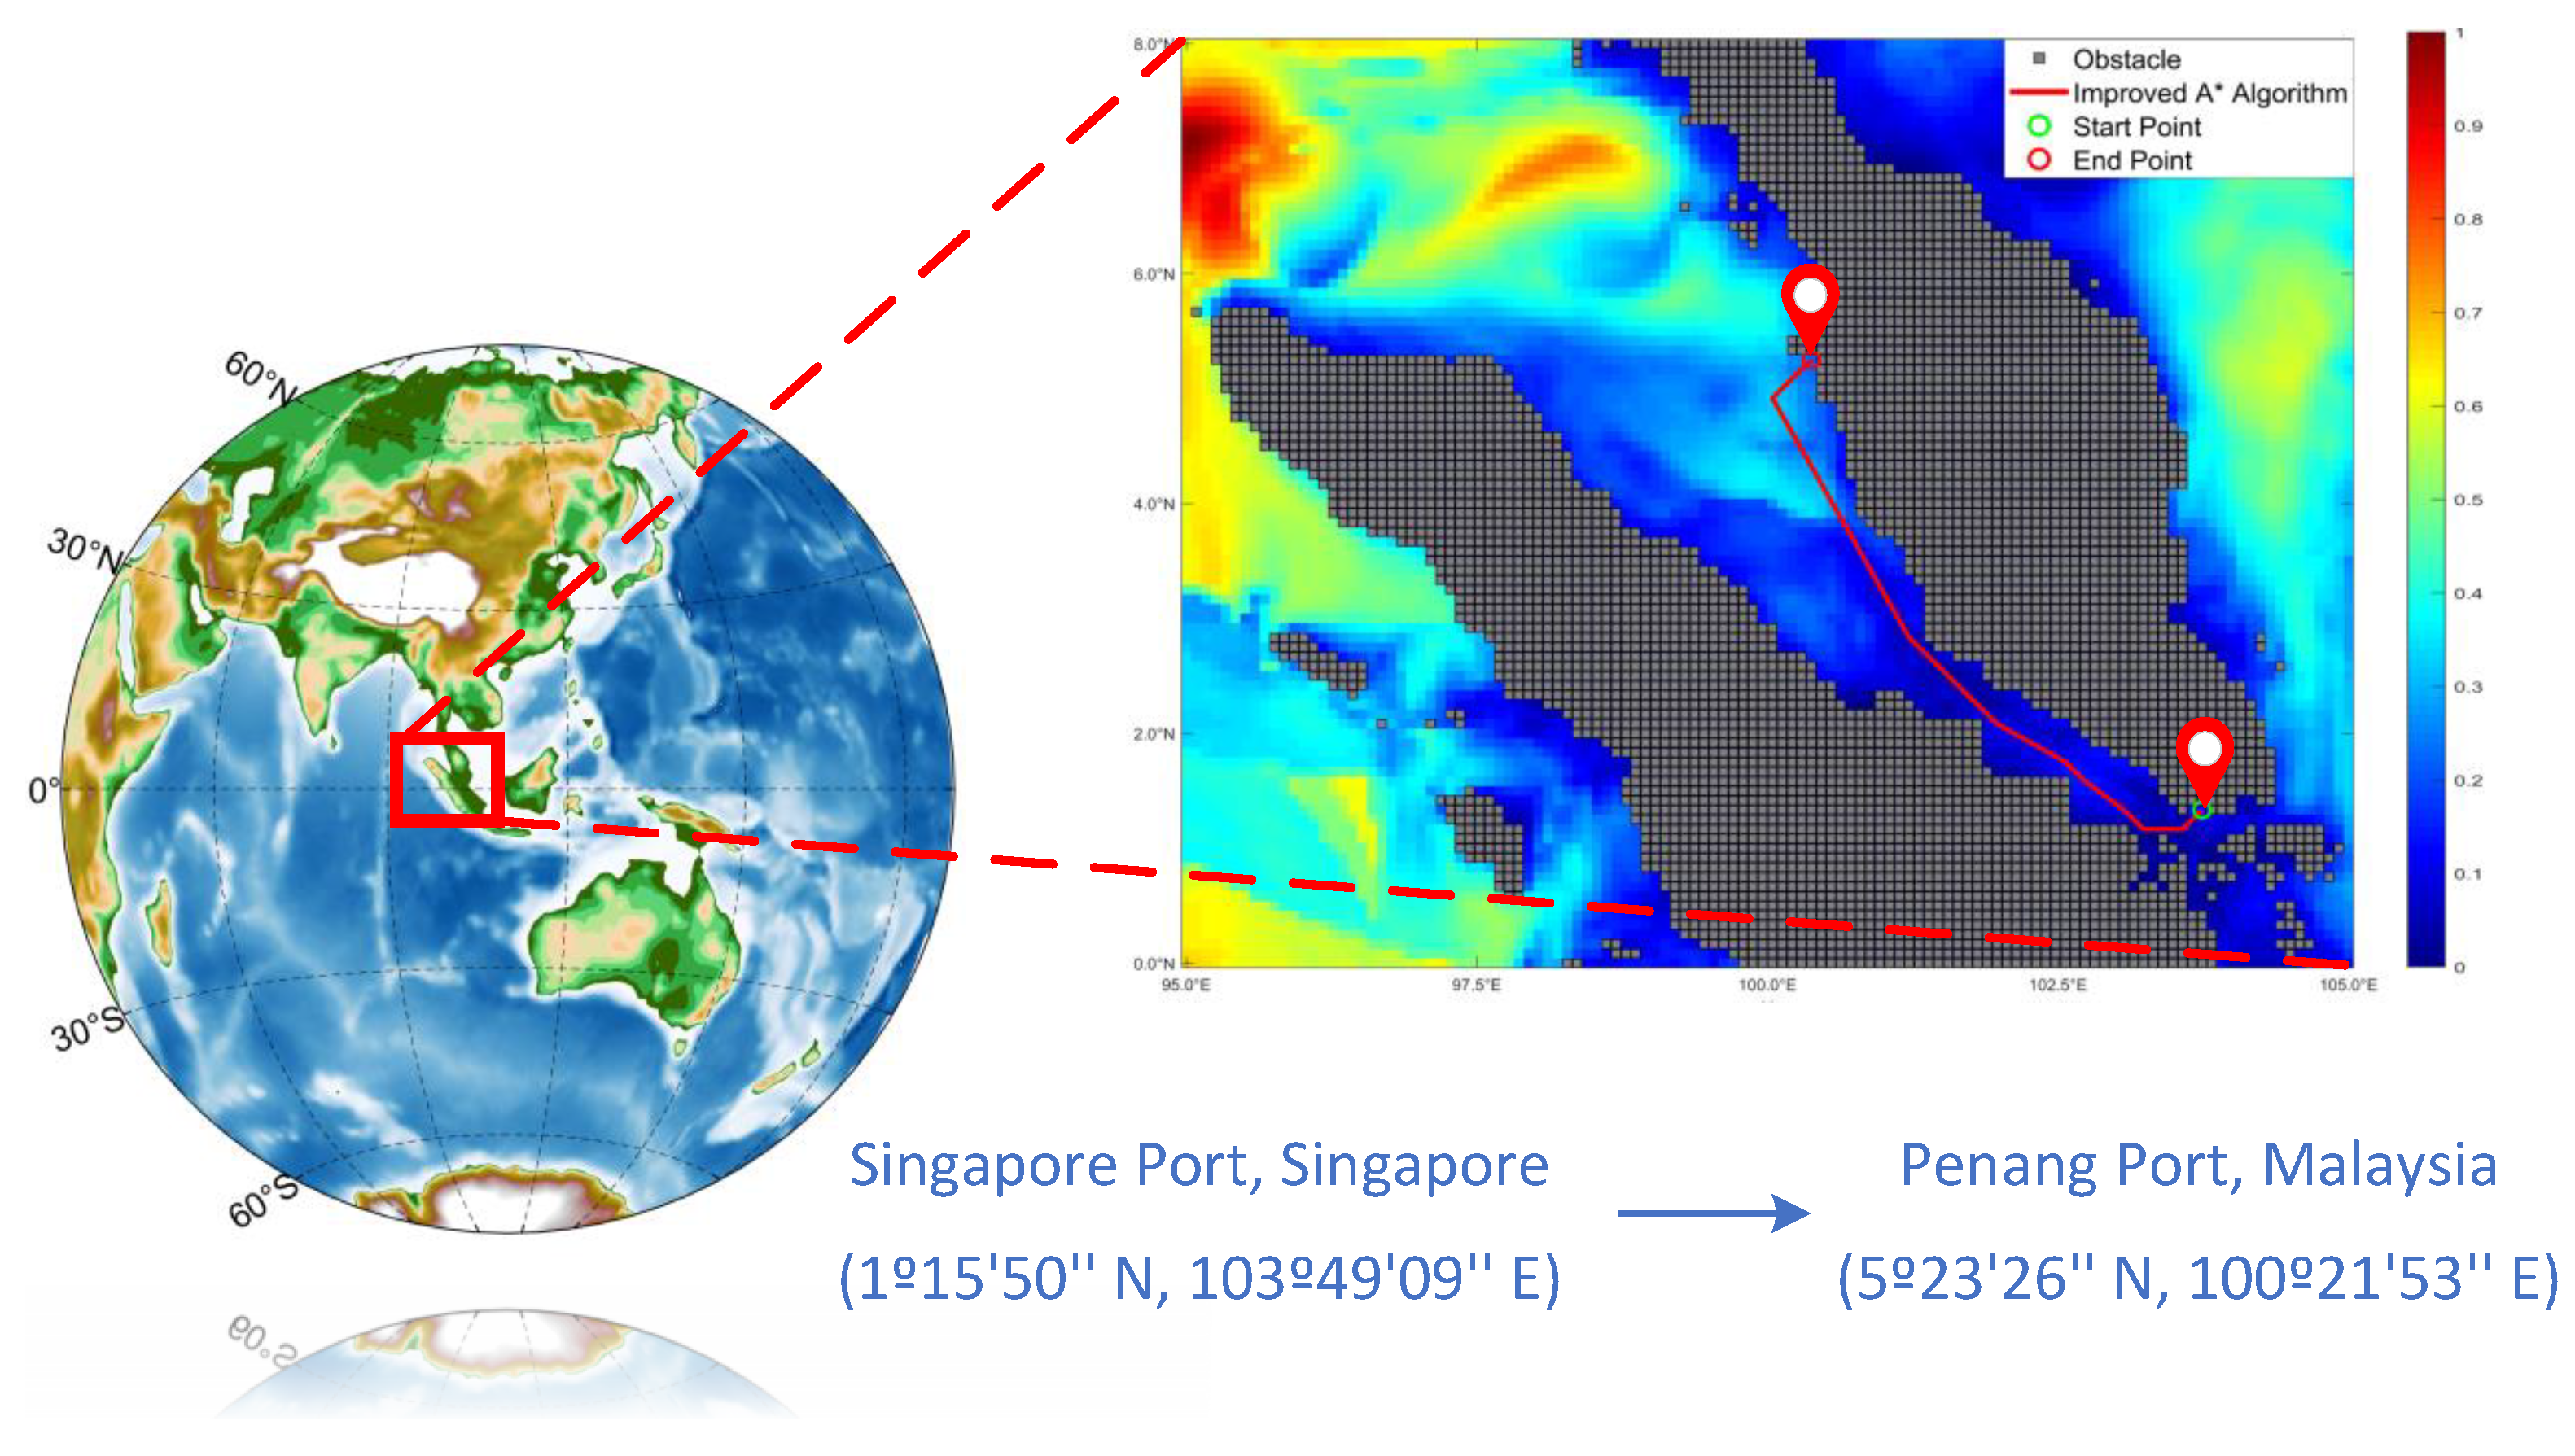
To quantify the comprehensive risk factors, a multi-factor synergistic assessment model is developed with the designed procedure and illustrated in Figure 8. Then, a sailing route considering hazard factors can be computed through an A algorithm and is presented in Figure 9. As described in Figure 9, the designed route passes through 69.86 grid cells. Thus, the total distance of the designed route under the marine environmental risk field mode is 345.81 n miles. Findings indicate that the navigation distance under the constructed risk field model is significantly shorter than when only ocean currents are considered, with a reduction of over 16.63 n miles. Additionally, the result under the constructed risk field model is marginally higher than that derived from considering only sea breeze and terrain. Specifically, the disparity between the former and the latter two scenarios is within 0.35 n miles, representing an increase of merely 1.93%.
On the other hand, according to the grid color depicted in Figure 7b,c, the risk factors of the formulated ship’s sailing routes are around 0.5 throughout the entire navigational mission when considering only ocean current or sea breeze. They have seriously reduced the safety of ship navigation. Regarding Figure 7a,d, the first half of the voyage proceeded smoothly, with the risk factor kept at approximately 0.2. However, the risk factors soared to 0.8 in the second half of the two sailing routes. Therein, the local risk factors of the route displayed in Figure 7d almost approach 0.9. By contrast, for the route designed under the constructed marine environmental risk field model in Figure 9, the risk factors are mostly below 0.2, and even in local areas with complex sea conditions, it does not exceed 0.5.
Therefore, the navigational route designed based on the proposed marine environmental risk field model can effectively enhance the safety of the ship’s navigation. Although the sailing distance has increased slightly, the increment is within an acceptable range.

4.3. Energy Management Analysis

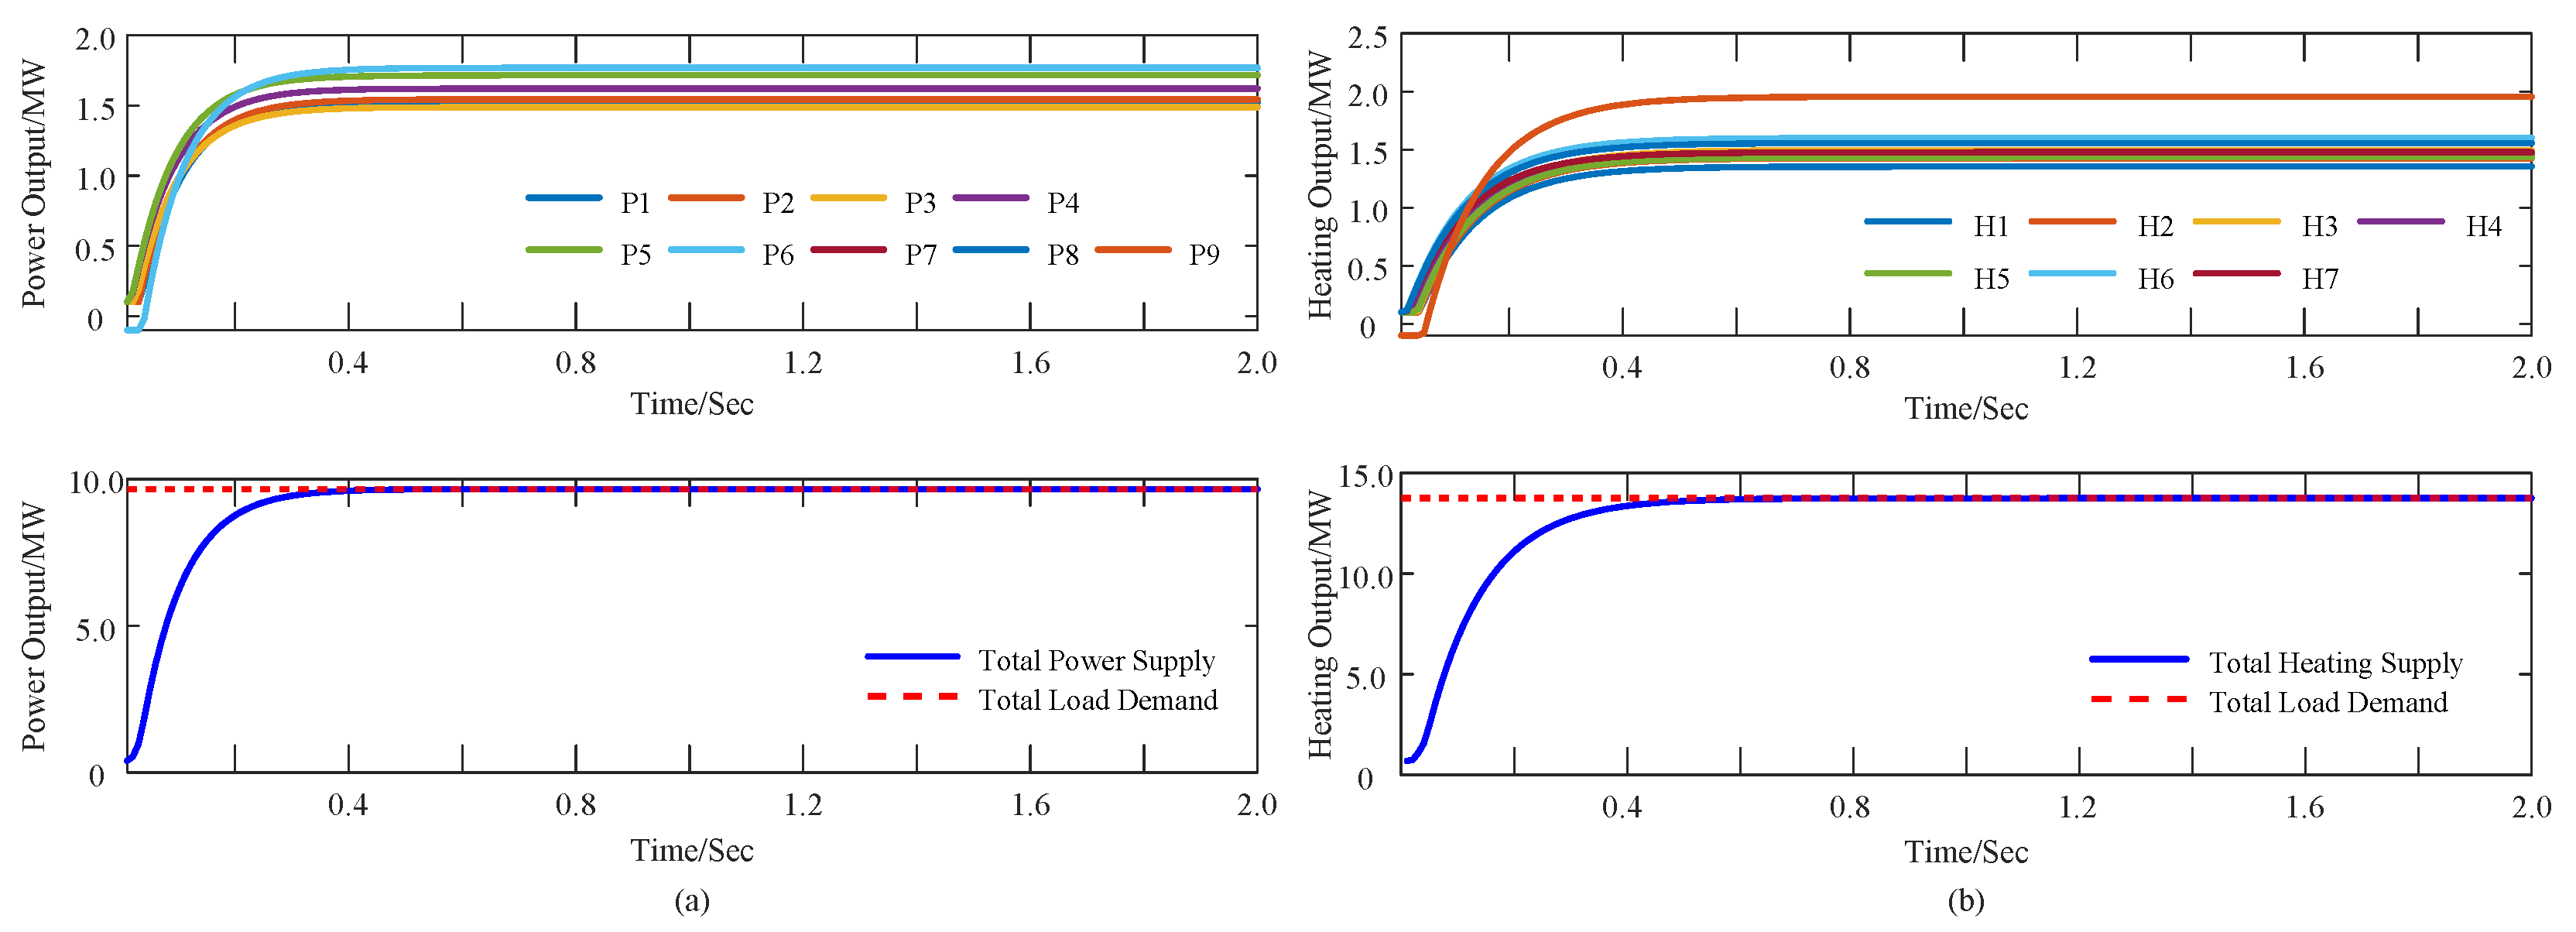
This section aims to demonstrate the effectiveness of energy management for S-IES from two perspectives: the model and the algorithm. Specifically, we aim to validate the model’s environmental performance, as well as the algorithm’s accuracy and computational efficiency, through comparative experiments. Moreover, following the sailing route design in Section 4.2, the load demand curves can be obtained through the mathematical relationship between the ship’s velocity and load demands, as depicted in Figure 10.

4.3.1. Environmental Performance on Energy Management Model

To better verify the effectiveness of the energy management model designed in this paper, two scenarios are set up, namely, the following:
Scenario-1: Considering the economic benefits only.
Scenario-2: Considering the economic and environmental benefits.
The energy management results obtained by the designed distributed algorithm under the Specified Scenario are displayed in Figure 11 and Figure 12, respectively. As depicted in Figure 11 and Figure 12, the power and heating load demands can be satisfied. However, it finds that the energy outputs of RBDs under Scenario-2 are significantly higher than those under Scenario-1. Specifically, the specific operation costs and carbon emissions at each time slot are listed in Table 5.
According to Table 5, the total operation costs of Scenario-1 and Scenario-2 are [72,989.90, 74,826.27] (USD), respectively, and the carbon emissions are [4759.15, 4105.78] (t), respectively. Compared with Scenario-2, Scenario-1 has better economic benefits. The operating cost of Scenario-1 is 1836.37 (USD) lower than that of Scenario-2, representing an approximate reduction of 2.52%. However, Scenario-1 results in significantly higher carbon emissions compared to Scenario-2. Therein, Scenario-1 emits 653.37 (t) more carbon dioxide than Scenario-2. Meanwhile, compared to Scenario-2, the carbon emissions of Scenario-1 are 15.91% higher. Based on the engineering project of the shipping industry, a slight increase in operational costs has a minimal impact on shipowner companies, and the 2.52% increase remains within their acceptable range. However, with the significant enhancement of environmental awareness, the regulatory and penalty measures of the IMO regarding greenhouse gas emissions have notably intensified. Reducing carbon emissions by more than 12% will effectively reduce the carbon emission intensity during ship navigation, facilitating the low-carbon transformation of shipowner companies.

4.3.2. Accuracy and Computation Efficiency of the Distributed Algorithm

Without loss of generality, take the power and heating load demands at the 23rd and 24th time slots as examples. Specifically, the power load demands are [6.61, 7.24] (MW), and the heating load demands are [9.66, 9.35] (MW), respectively. To evaluate the accuracy and computational efficiency of the proposed algorithm, two benchmark algorithms are developed, namely, the following:
  • Distributed Alternating Direction Method of Multipliers (D-ADMM).
  • Centralized Dynamic Programming Method (C-DPM).
Specifically, the D-ADMM algorithm is characterized by high computational speed and excellent accuracy and is widely used in solving optimization problems. Therefore, by comparing the computational convergence process of the D-ADMM with that of the algorithm proposed in this paper, the computational efficiency of the proposed algorithm can be verified. The energy output trajectories under designed algorithm at the 23rd and the 24th time slots are presented in Figure 13 and Figure 14, respectively. As illustrated in Figure 13, the energy output of each energy participant in the power network can converge to stable values within 0.7 s. Meanwhile, the energy output solutions for the heating network can be calculated within 0.6 s. Meanwhile, the trajectories of the power and heating incremental costs under D-ADMM are presented in Figure 15 and Figure 16, respectively. Therein, the convergence time of the power network is approximately [3.07, 2.43] (s) at the 23rd and 24th time slots, respectively. Meanwhile, the incremental cost of the heating network will converge within 3 s.
On the other hand, as a conventional centralized method, the C-DPM algorithm is characterized by computational accuracy. Therefore, by comparing the optimization results of C-DPM with those of the proposed algorithm, the accuracy of the computational results of the proposed algorithm can be determined. The detailed power/heating outputs of the designed algorithm, D-ADMM, and C-DPM are listed in Table 6 and Table 7, respectively. As presented in Table 6, both the results of D-ADMM and the proposed algorithm are comparable to those of C-DPM. Specifically, the mean absolute errors (MAEs) are 0.04886 and 0.00040 for the power network at the 23rd and 24th time slots, respectively. Similar situations occur in the heating network.
Based on the computational efficiency results of the designed distributed algorithm, D-ADMM, and C-DPM, it is found that the designed algorithm saves approximately 2 s in calculation time compared to the D-ADMM algorithm, and the computational efficiency has increased by over 70%. Meanwhile, the computation accuracy is also ensured. Hence, the proposed algorithm based on finite-time consensus theory demonstrates superior computational efficiency.

4.4. Complex Marine Environment Analysis

This section will conduct simulation analysis based on possible unexpected situations during the ship’s navigation and verify the effectiveness of the proposed energy management model and the distributed algorithm.

4.4.1. Communication Topology Interruption

The interrupted energy device in the S-IES is not regulated due to damage that occurred in the communication topology, resulting in its output power/heating remaining zero due to the lack of control signals. Take the 23rd load demands as an example, namely, 6.61 MW for the power network and 9.66 MW for the heating network. The operational parameters of the energy devices are consistent with those presented in the manuscript.
As shown in Figure 17 and Figure 18, communication interruption occurred in the power and heating networks at time = 2.0 (s). At this moment, the affected energy devices will be reset to zero and remain unchanged. Meanwhile, the designed distributed algorithm can quickly adjust the power/heating output solutions to respond to fluctuating load demands rapidly and accurately. The comparisons of the energy management solutions before and after the communication interruption are listed in Table 8 and Table 9.

4.4.2. Sudden Surge in Load Demand

This paper focuses on all-electric ships; thus, the reliable operation of their propulsion systems is closely related to the power network in the S-IES. As introduced, the load demands of the ship’s propulsion system are related to the sailing velocity. Thus, the load demands of the power network in S-IES will rise sharply when the ships sail into dangerous marine conditions to maintain a normal sailing velocity. Similarly, take the power load demand in the 23rd time slot as an example, namely, the power load is 6.61 MW.
Specifically, compared with the power load demand at the 23rd time slot, it has increased significantly in the 24th time slot since the ship wants to maintain the original sailing velocity to execute the navigational mission under dangerous marine environments. The power output trajectories under the negative navigation conditions are depicted in Figure 19. Meanwhile, the detailed results of the energy management are listed in Table 10. With the results recorded in Figure 19 and Table 10, the designed distributed algorithm can eliminate the negative impacts caused by fluctuating load demands.

4.4.3. Large-Scale Energy System

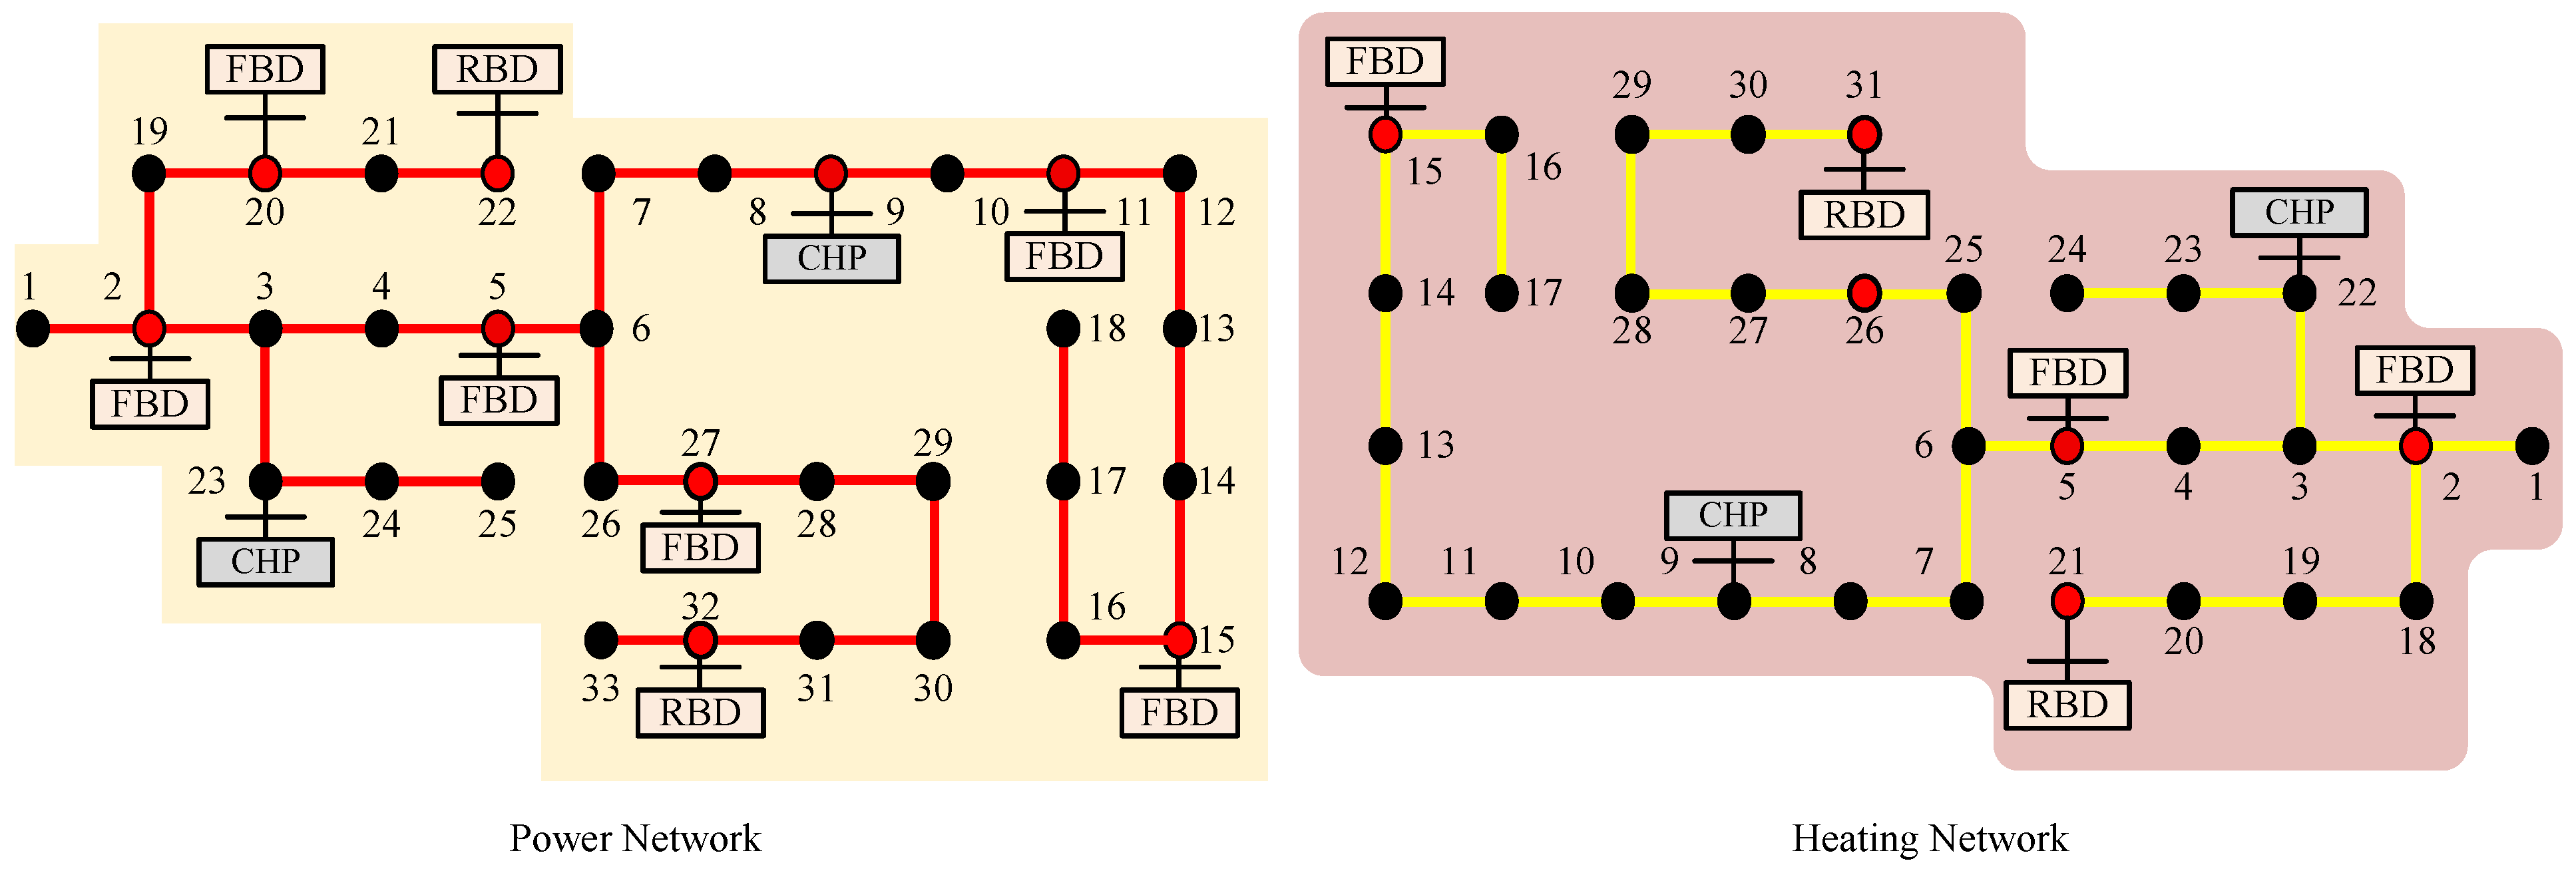
For demonstrating the reliability and effectiveness, a large-scale energy system based on the 134-nodes (69 nodes for the power network and 65 nodes for the heating network) is utilized. The basic structure of the 134-bus energy system is depicted in Figure 20. Therein, there are eight FBDs, five RBDs, and two ESDs in the power network and six FBDs and four RBDs in the heating network. The operational parameters of the energy participants are the same as those in the manuscript. Moreover, the power and heating load demands are set as [13.75, 9.66] (MW), respectively.
The power and heating output trajectories are recorded in Figure 21a and Figure 21b, respectively. As shown in Figure 21a, the optimal output solutions of the power network have been acquired by around 0.6 (s), and the calculation duration of the heating outputs is around 0.7 (s) depicted in Figure 21b. As noted in the trajectories, the load demands can be quickly and accurately satisfied. The calculation efficiency under a large-scale S-IES is similar to that of a normal-sized energy system.

5. Conclusions

This paper explores the energy management problem of the S-IES from a secure and sustainable perspective. First, to mitigate the adverse impacts induced by risk hazards in complex marine environments, a marine environmental risk field model is constructed. Furthermore, a secure sailing route can be developed. Meanwhile, leveraging the correlation between ship velocity and load demand, a comprehensive load demand curve is derived. Secondly, to enhance environmental consciousness, we develop an energy management model that incorporates both operational costs and carbon emissions. Additionally, a distributed energy management algorithm is proposed, informed by the finite-time consensus theory, which enables the ship’s propulsion system to respond rapidly and accurately. Finally, simulation results validate the effectiveness of the constructed energy management framework. Specifically, although the obtained energy management solutions increase the operation cost by 2.52%, they reduce carbon emissions by more than 15%. Meanwhile, the designed distributed algorithm saves 70% of the calculation time compared to the same period, effectively improving calculation efficiency while ensuring the accuracy of the optimal solutions for the S-IES. In the future, we will focus on researching the nonlinear relationships between risk factors and the selection of weight coefficients for the objective function. By studying the interactions between heterogeneous factors, we aim to enhance the application potential of the proposed method in the shipping industry.

Author Contributions

Conceptualization, Validation, and Writing—Original Draft: Y.Z.; Methodology, Formal Analysis, and Writing—Review: Y.X.; Funding Acquisition and Editing: T.L. All authors have read and agreed to the published version of the manuscript.

Funding

The work of Yuxin Zhang and Tieshan Li was supported by the National Natural Science Foundation of China under Grant 51939001 and the Young Elite Scientists Sponsorship Program by the China Association for Science and Technology (CAST) Doctoral Student Special Plan.

Data Availability Statement

The original contributions presented in the study are included in the article.

Acknowledgments

We would like to express our gratitude to the Maritime Knowledge Centre of the International Maritime Organization in London, UK, for offering Yuxin Zhang the opportunity to participate in the 2024 internship project.

Conflicts of Interest

The authors declare no conflicts of interest.

References

  1. International Maritime Organization. 2023 IMO Strategy on Reduction of GHG Emissions from Ships; International Maritime Organization: London, UK, 2023; Available online: https://wwwcdn.imo.org/localresources/en/OurWork/Environment/Documents/annex/MEPC%2080/Annex%2015.pdf (accessed on 9 July 2025).
  2. Zhang, Y.; Xiao, Y.; Teng, F.; Li, T. Distributed Energy Management for Ship-Integrated Energy System: Secure and Green Sailing. IEEE Trans. Transp. Electrif. 2025, 11, 8189–8201. [Google Scholar] [CrossRef]
  3. Zafrane, M.; Houalef, A.; Benchehima, M. Optimising power management in wireless sensor networks using machine learning: An experimental study on energy efficiency. Int. J. Sens. Netw. 2025, 47, 127–147. [Google Scholar] [CrossRef]
  4. Kanellos, F.D.; Tsekouras, G.J.; Hatziargyriou, N.D. Optimal Demand-Side Management and Power Generation Scheduling in an All-Electric Ship. IEEE Trans. Sustain. Energy 2014, 5, 1166–1175. [Google Scholar] [CrossRef]
  5. Vu, T.V.; Gonsoulin, D.; Diaz, F.; Edrington, C.S.; El-Mezyani, T. Predictive Control for Energy Management in Ship Power Systems under High-Power Ramp Rate Loads. IEEE Trans. Energy Convers. 2017, 32, 788–797. [Google Scholar] [CrossRef]
  6. Zhang, Y.; Sun, L.; Fan, T.; Ma, F.; Xiong, Y. Speed and Energy Optimization Method for The Inland All-Electric Ship in Battery-Swapping Mode. Ocean Eng. 2023, 284, 115234. [Google Scholar] [CrossRef]
  7. Li, Y.; Gao, D.W.; Gao, W.; Zhang, H.; Zhou, J. A Distributed Double-Newton Descent Algorithm for Cooperative Energy Management of Multiple Energy Bodies in Energy Internet. IEEE Trans. Ind. Inform. 2021, 17, 225–235. [Google Scholar] [CrossRef]
  8. Yang, T.; Cao, B.; Wang, C. Joint Generation and Voyage Scheduling of All-Electric Ships Considering Power Supply Capacity Constraints. IEEE Trans. Appl. Supercond. 2024, 34, 5403204. [Google Scholar] [CrossRef]
  9. Qiu, J.; Tao, Y.; Lai, S.; Zhao, J. Pricing Strategy of Cold Ironing Services for All-Electric Ships Based on Carbon Integrated Electricity Price. IEEE Trans. Sustain. Energy 2022, 13, 1553–1565. [Google Scholar] [CrossRef]
  10. Wang, R.; Sun, Q.; Han, J.; Zhou, J.; Hu, W.; Zhang, H. Energy-Management Strategy of Battery Energy Storage Systems in DC Microgrids: A Distributed Dynamic Event-Triggered H∞ Consensus Control. IEEE Trans. Syst. Man Cybern. Syst. 2022, 52, 5692–5701. [Google Scholar] [CrossRef]
  11. Huang, B.; Li, Y.; Zhan, F.; Sun, Q.; Zhang, H. A Distributed Robust Economic Dispatch Strategy For Integrated Energy System Considering Cyber-Attacks. IEEE Trans. Ind. Inform. 2021, 18, 880–890. [Google Scholar] [CrossRef]
  12. Yang, S.; Tan, S.; Xu, J. Consensus Based Approach for Economic Dispatch Problem in A Smart Grid. IEEE Trans. Power Syst. 2013, 28, 4416–4426. [Google Scholar] [CrossRef]
  13. Teng, F.; Zhang, Y.; Yang, T.; Li, T.; Xiao, Y.; Li, Y. Distributed Optimal Energy Management for We-Energy Considering Operation Security. IEEE Trans. Netw. Sci. Eng. 2024, 11, 225–235. [Google Scholar] [CrossRef]
  14. Hua, C.; Zheng, H.; Bao, Y. A reinforcement learning algorithm for mobile robot path planning with dynamic Q-value adjustment. Int. J. Sens. Netw. 2025, 47, 113–125. [Google Scholar] [CrossRef]
  15. Singh, Y.; Sharma, S.; Sutton, R.; Hatton, D.; Khan, A. A Constrained a* Approach Towards Optimal Path Planning for An Unmanned Surface Vehicle in A Maritime Environment Containing Dynamic Obstacles And Ocean Currents. Ocean. Eng. 2018, 169, 187–201. [Google Scholar] [CrossRef]
  16. Zhang, Y.; Shi, G.; Liu, J. Dynamic Energy-Efficient Path Planning of Unmanned Surface Vehicle Under Time-Varying Current and Wind. J. Mar. Sci. Eng. 2022, 6, 759. [Google Scholar] [CrossRef]
  17. Shahabi, H.; Hashim, M. Landslide Susceptibility Mapping Using GIS-based Statistical Models and Remote Sensing Data in Tropical Environment. Sci. Rep. 2015, 5, 9899. [Google Scholar] [CrossRef]
  18. Matin, N.; Hasan, G.M.J. A Quantitative Analysis of Shoreline Changes Along The Coast of Bangladesh Using Remote Sensing and GIS Techniques. Catena 2021, 201, 10518. [Google Scholar] [CrossRef]
  19. Sivrikaya, F.; Küçük, O. Modeling Forest Fire Risk Based on GIS-Based Analytical Hierarchy Process and Statistical Analysis in Mediterranean Region. Ecol. Inform. 2022, 68, 101537. [Google Scholar] [CrossRef]
  20. Chen, J.-L.; Kang, S.-C.; Wu, A.-D.; Hu, D.-D. Impacts of 1.5 °C Global Warming on Hydrological Conditions of Navigation Along The Northern Sea Route and Northwest Passage. Adv. Clim. Chang. Res. 2023, 14, 904–912. [Google Scholar] [CrossRef]
  21. Chen, J.-L.; Kang, S.-C.; Wu, A.-D.; Chen, L.-H.; Li, Y.-W. Accessibility in Key Areas of The Arctic in The 21st Mid-Century. Adv. Clim. Chang. Res. 2023, 14, 896–903. [Google Scholar] [CrossRef]
  22. Zhen, R.; Lv, P.; Shi, Z.; Chen, G. A Novel Fuzzy Multi-Factor Navigational Risk Assessment Method for Ship Route Optimization in Costal Offshore Wind Farm Waters. Ocean. Coast. Manag. 2023, 232, 106428. [Google Scholar] [CrossRef]
  23. Guo, F.; Li, G.; Wen, C.; Wang, L.; Meng, Z. An Accelerated Distributed Gradient-Based Algorithm for Constrained Optimization with Application to Economic Dispatch in A Large-Scale Power System. IEEE Trans. Syst. Man Cybern. Syst. 2021, 51, 2041–2053. [Google Scholar] [CrossRef]
  24. Zhao, T.; Ding, Z. Distributed Finite-Time Optimal Resource Management for Microgrids Based on Multi-Agent Framework. IEEE Trans. Ind. Electron. 2018, 65, 6571–6580. [Google Scholar] [CrossRef]
Figure 1. Operational framework of the marine environmental risk field model.
Energies 18 04163 g001
Figure 2. Heat map visualizations: (a) ocean wave, (b) ocean current, (c) sea breeze, and (d) terrain environment.
Energies 18 04163 g002
Figure 3. A ship’s voyage profile.
Energies 18 04163 g003
Figure 4. Procedure of the energy management mechanism.
Energies 18 04163 g004
Figure 5. Marine environment between Singapore Port and Penang Port.
Energies 18 04163 g005
Figure 6. Map visualizations between Singapore Port and Penang Port: (a) ocean wave, (b) ocean current, (c) sea breeze, and (d) terrain environment.
Energies 18 04163 g006
Figure 7. Sailing route between Singapore Port and Penang Port considering (a) ocean wave, (b) ocean current, (c) sea breeze, and (d) terrain environment.
Energies 18 04163 g007
Figure 8. Marine environmental risk field model between Singapore Port and Penang Port.
Energies 18 04163 g008
Figure 9. Designed sailing route between Singapore Port and Penang Port.
Energies 18 04163 g009
Figure 10. Load demands of the designed sailing route between Singapore Port and Penang Port: (a) power network and (b) heating network.
Energies 18 04163 g010
Figure 11. Energy output results of the designed sailing route between Singapore Port and Penang Port under Scenario-1: (a) power network and (b) heating network.
Energies 18 04163 g011
Figure 12. Energy output results of the designed sailing route between Singapore Port and Penang Port under Scenario-2: (a) power network and (b) heating network.
Energies 18 04163 g012
Figure 13. Power output trajectories under the designed algorithm at the 23rd and the 24th time slots.
Energies 18 04163 g013
Figure 14. Heating output trajectories under the designed algorithm at the 23rd and the 24th time slots.
Energies 18 04163 g014
Figure 15. Power output trajectories under ADMM at the 23rd and the 24th time slots.
Energies 18 04163 g015
Figure 16. Heating output trajectories under ADMM at the 23rd and the 24th time slots.
Energies 18 04163 g016
Figure 17. Power output trajectories under communication interruption at the 23rd time slot.
Energies 18 04163 g017
Figure 18. Heating output trajectories under communication interruption at the 23rd time slot.
Energies 18 04163 g018
Figure 19. Power output trajectories with increasing load demands at the 23rd time slot.
Energies 18 04163 g019
Figure 20. Large-scale tested energy system.
Energies 18 04163 g020
Figure 21. Energy output trajectories of the large-scale tested energy system, (a) power network, (b) heating network.
Energies 18 04163 g021
Table 1. Definition of major symbols.
SymbolDefinitionSymbolDefinition
p , h power, heating outputsvship’s sailing velocity
Drisk degreeRrisk score
Tsailing duration i , k , t index sequence indicators
D B , D W , D C , D E risk degree parameters Ω B parameter sets of sea breeze
w B , w W , w C , w E weighted parameters Ω W parameter set of wave
Ω C parameter set of ocean current Ω K grid set
Ω FBD , Ω RBD device sets of FBD, RBD τ state variable of sailing stage
Ω CHPD , Ω ESD device sets of CHPD, ESDWhazard factor parameter
Dist p q sailing distance from p to qCoperational cost function
Load p q carrying capacity from p to qEeeoi function
a , b , c operation parameters of FBD, RBD H ˜ ship’s draft
a , b , c operation parameters of CHPD H ship’s underkeel clearance
α , β , γ carbon emission parameters H wave height
Ω berth , Ω dep ship’s berthing, departure stages min , max minimum, maximum values
Ω cru , Ω app ship’s cruising, approach stages | · | cardinality of the set
Table 2. Analysis methods for the risk factors.
TypeHazard FactorParameterSpatial Interpolation Algorithm
OceanWave W i min = 4.00 m/sResampling, Raster Calculation
OceanCurrent W i min = 0.25 m/sKriging Interpolation, Raster Calculation
WeatherBreeze W i min = 10.80 m/sKriging Interpolation, Raster Calculation
EnvironmentTerrain W i min = 5.60 mResampling, Raster Calculation
Table 3. Details on risk evaluation criteria.
Risk Score (R)DegreeDescriptions
0 R 0.25 LowMinimal navigational hazards
0.25 < R 0.50 ModerateModerate navigational hazards
0.50 < R 0.75 ElevatedElevated navigational hazards
0.75 < R 1.00 HighHigh navigational hazards
Table 4. Operation and carbon emission parameters of “YUKUN”.
Typeabc α β γ minmax
PowerFBD-10.54271400.3230470.010.5
FBD-20.6113740.3425500.010.5
RBD-10.7201250.010.5
RBD-20.7801340.010.5
RBD-30.7401300.010.5
ESD-10.407495−0.010.5
HeatingFBD-30.54271400.3230470.010.5
RBD-40.7301250.010.5
RBD-50.6901340.010.5
ESD-20.467499−0.010.5
Table 5. Operation costs and carbon emissions at each time slot under Scenario-1 and Scenario-2.
Scenario-1TypeTime Slot 1–Time Slot 10
P-Cost787.66881.73997.111110.711217.211323.701431.981504.751520.731428.43
H-Cost293.67366.35433.45531.29602.58658.49696.23735.37771.71819.23
P-Carbon64.5969.9676.5483.0289.1095.17101.35105.50106.41101.15
H-Carbon20.8723.8626.6330.6633.5935.9037.4539.0640.5642.52
TypeTime Slot 11–Time Slot 20
P-Cost1316.601206.561098.281009.53959.83897.71768.13718.43711.33714.88
H-Cost837.40870.95922.67984.171047.071093.201147.711205.021220.391225.98
P-Carbon94.7788.4982.3177.2574.4170.8763.4860.6460.2460.44
H-Carbon43.2644.6546.7849.3151.9053.8056.0458.4159.0459.27
TypeTime Slot 21–Time Slot 30
P-Cost723.76757.48874.63986.461092.961199.461305.951421.331540.251554.45
H-Cost1235.771205.021177.061133.731063.841014.92956.21893.31826.22745.15
P-Carbon60.9462.8769.5575.9382.0188.0894.16100.74107.52108.33
H-Carbon59.6758.4157.2555.4752.5950.5848.1645.5742.8039.46
TypeTime Slot 31–Time Slot 38
P-Cost1517.181439.081334.351224.311112.481007.76903.03807.18
H-Cost685.05612.36545.27496.35444.63390.12355.17338.40
P-Carbon106.21101.7595.7889.5083.1277.1571.1765.70
H-Carbon36.9934.0031.2329.2227.9024.8423.4022.71
Scenario-2TypeTime Slot 1–Time Slot 10
P-Cost811.54906.901023.851139.001246.951354.911464.661538.431554.621461.06
H-Cost304.15377.84445.83544.95617.16673.79712.01751.65788.46836.58
P-Carbon54.8159.6465.5771.4176.8882.3687.9291.6692.4887.74
H-Carbon17.4320.1122.5826.1928.8130.8732.2633.7125.0436.79
TypeTime Slot 11–Time Slot 20
P-Cost1347.711236.161126.411036.44986.06923.09791.75741.37734.17737.77
H-Cost854.99888.96941.331003.611067.301114.011169.211227.241242.811256.05
P-Carbon81.9976.3470.7766.2163.6660.4753.8151.2550.8951.07
H-Carbon37.4638.7040.6042.8745.1846.8848.8951.0051.5752.05
TypeTime Slot 21–Time Slot 30
P-Cost746.77780.95899.701013.051121.011228.961336.921453.871574.421588.81
H-Cost1266.011234.731206.291162.211091.121041.36981.64917.66849.41766.94
P-Carbon51.5353.2659.2865.0370.5075.9781.4587.3793.4994.22
H-Carbon52.4151.2750.2448.6446.0544.2442.0739.7437.2634.26
TypeTime Slot 31–Time Slot 38
P-Cost1517.181439.081334.351224.311112.481007.76903.03807.18
H-Cost685.05612.36545.27496.35444.63390.12355.17338.40
P-Carbon705.80631.87563.63513.86461.25405.80370.25353.19
H-Carbon1551.031471.861365.701254.151140.801034.64928.49831.33
Table 6. Optimization results of the power network ( × 10 2 MW).
FBD-1FBD-2CHP-pRBD-1RBD-2RBD-3ESD
23rdD-ADMM87.844289.362285.1539104.590596.5449101.763795.7406
C-DPM87.840189.359485.1505104.587996.5427101.761195.7582
Proposed87.840189.359485.1504104.587996.5427101.761295.7582
24thD-ADMM96.777497.348493.5665112.6136103.9508109.5699110.1734
C-DPM96.771997.344493.5619112.6099103.9477109.5663110.1978
Proposed96.771897.344493.5618112.6099103.9476109.5664110.1978
Table 7. Optimization results of the heating network ( × 10 2 MW).
FBD-3CHP-hRBD-4RBD-5ESD
23rdD-ADMM184.1289175.4412188.4506199.3754218.6039
C-DPM184.1229175.4371188.4468199.3712218.6220
Proposed184.1229175.4371188.4468199.3712218.6220
24thD-ADMM178.0773170.0310183.0898193.7039210.0981
C-DPM178.0716170.0271183.0862193.6999210.1151
Proposed178.0716170.0271183.0862193.6999210.1151
Table 8. Optimal power outputs before and after communication interruption ( × 10 2 MW).
FBD-1FBD-2CHP-pRBD-1RBD-2RBD-3ESD
Before87.8489.3685.15104.5996.54101.7695.76
After101.77101.81117.10108.09113.94118.28
Table 9. Optimal heating outputs before and after communication interruption ( × 10 2 MW).
FBD-1CHP-hRBD-1RBD-2ESD
Before184.12175.44188.45199.37218.62
After225.61225.20238.25276.94
Table 10. Optimal power outputs before and after sudden surge in load demand ( × 10 2 MW).
FBD-1FBD-2CHP-pRBD-1RBD-2RBD-3ESD
Before87.8489.3685.15104.5996.54101.7695.76
After89.07179.86180.48195.50180.47190.22259.41
Disclaimer/Publisher’s Note: The statements, opinions and data contained in all publications are solely those of the individual author(s) and contributor(s) and not of MDPI and/or the editor(s). MDPI and/or the editor(s) disclaim responsibility for any injury to people or property resulting from any ideas, methods, instructions or products referred to in the content.