Article

Hydroprocessed Ester and Fatty Acids to Jet: Are We Heading in the Right Direction for Sustainable Aviation Fuel Production?

by
Mathieu Pominville-Racette
1,
Ralph Overend
2,
Inès Esma Achouri
1,* and
Nicolas Abatzoglou
1,*
1
Department of Chemical & Biotechnological Engineering, University de Sherbrooke, 2500 Boul. de l’Université, Sherbrooke, QC J1K2R1, Canada
2
Nextfuels LCC, Los Altos, CA 94022, USA
*
Authors to whom correspondence should be addressed.
Energies 2025, 18(15), 4156; https://doi.org/10.3390/en18154156
Submission received: 26 May 2025 / Revised: 23 July 2025 / Accepted: 30 July 2025 / Published: 5 August 2025
(This article belongs to the Special Issue Sustainable Approaches to Energy and Environment Economics)

Abstract

Hydrotreated ester and fatty acids to jet (HEFA-tJ) is presently the most developed and economically attractive pathway to produce sustainable aviation fuel (SAF). An ongoing systematic study of the critical variables of different pathways to SAF has revealed significantly lower greenhouse gas (GHG) reduction potential for the HEFA-tJ pathway compared to competing markets using the same resources for road diesel production. Moderate yield variations between air and road pathways lead to several hundred thousand tons less GHG reduction per project, which is generally not evaluated thoroughly in standard environmental assessments. This work demonstrates that, although the HEFA-tJ market seems to have more attractive features than biodiesel/renewable diesel, considerable viability risks might manifest as HEFA-tJ fuel market integration rises. The need for more transparent data and effort in this regard, before envisaging making decisions regarding the volume of HEFA-tJ production, is emphasized. Overall, reducing the carbon intensity of road diesel appears to be less capital-intensive, less risky, and several times more efficient in reducing GHG emissions.

1. Introduction

The production of sustainable aviation fuels (SAFs) from vegetable oil, waste cooking oil, and animal fat has attracted significant interest from industrial players like Neste, Total, and Shell. Hydrotreated ester and fatty acids to jet (HEFA-tJ) is currently the most developed and cost-effective conversion pathway available [1,2]. Policy is driving the incorporation of SAF to 5 or 10% in the near future [3]. This will result in the construction of many new HEFA-tJ plants, or the conversion of existing plants dedicated to renewable diesel or biodiesel production (RD) to meet the required volume of SAF. In the United States (U.S.), the Department of Energy (DOE) announced the SAF Grand Challenge, targeting SAF production of at least 9 Mt/yr by 2030, which would require a 50% carbon intensity reduction from these fuels [4]. In Europe, the ReFuelEU initiative from the European Commission has adopted new legislation to force the integration of 6% SAF fuels by 2030 and 20% by 2035 [5], which represents around a 2.8 Mt SAF target for 2030 and a 9.2 Mt target for 2035 [6]. The International Air Transport Association [7] estimates that 24 Mt of SAF could be produced worldwide by 2030.
This report provides critical data to enhance understanding of the opportunities and challenges associated with the HEFA-tJ pathway. Scaling the production of SAFs to meet actual demand would require several billion dollars. For instance, Neste and World Energy Paramount announced around USD 2B in investments to expand their HEFA-tJ production to 500–700 kt/y of SAF in Rotterdam and California [8,9]. Even when considering a more optimistic range of investment costs at USD 2–4 k/t, the required investments and timeframe are, at the least, very ambitious: around USD 18–36 B to reach the 2030 SAF Grand Challenge Roadmap in the U.S., with similar investments being required in Europe to reach the 2035 ReFuelEU target [4,10]. The construction times for a new HEFA plant range from 2 to 5 years after budget approval [11]. Ensuring that investments and efforts are directed appropriately is of primary importance. Since most feedstocks for the HEFA-tJ process are used for road production [12], key considerations are how fuel producers, aviation companies, legislators, and customers could be impacted by the market shift from road to air fuel, and how it would help to efficiently achieve GHG reduction goals. The scientific literature has merely compared road and air fuel production’s economic risks and environmental benefits. The market response to raising SAF production is rarely discussed.
In the first case, most recent SAF reviews do not discuss biodiesel or renewable diesel in much detail [1,13,14]. For instance, Wei et al. [15] only assumed that other technologies (electrification) could be adopted in place of heavy-duty road fuels. Bardon et al. [12] briefly discuss the upcoming rivalries in the utilization of used cooking oil (UCO) as road and air fuels. Evaluations and analysis from the International Council of Clean Transportation (2019) and the International Energy Agency (IEA), underline that, for economic reasons, road fuel will potentially still utilize UCO and other feedstocks for the BD and RD pathways by 2050 and question if some degree of priority on feedstock should be given to aviation. Ng et al. [16] briefly discuss the same competition between road and air fuels, and suggest that SAF production should avoid utilizing feedstock used by road markets. How market fluctuations and legislation uncertainties affect SAF plant viability has not been discussed yet, but it is a well-known issue for ethanol, BD, and RD, leading to dozens of plants turning idle, reducing their production, or closing during unfavorable economic periods [17].
For potential comparison between HEFA-tJ, BD, and RD in terms of GHG reduction, only the National Renewable Energy Laboratory State of Industry (NREL SOI) has made some comparisons to our knowledge [11]. As sustainable road fuel carbon intensity (CI) has been evaluated for a long time by various institutions, HEFA-tJ evaluations are compared with BD and RD in Section 3.4.1, which showcases undiscussed variations in carbon intensity estimation related to yield variations, feedstock transport hypotheses, and GHG reduction potential. From this perspective, the Carbon Offsetting and Reduction Scheme for International Aviation (CORSIA) and the official International Civil Aviation Organization (ICAO) framework to evaluate the CI of aviation fuels employ a jet selectivity ratio of 25 wt% over other products [18], while the NREL SOI and other references discussed in Section 3.1.2 use a selectivity of over 45 wt% [19,20]. The smaller selectivity for SAF in the CORSIA framework minimizes yield variations between HEFA-tJ and RD, but is not representative of most discussions on HEFA-tJ that involves the rapid supply of large quantities of SAF.
Regarding the response to higher market penetration of SAF, Bardon et al. [21] reviewed 67 SAF decarbonization scenarios and emphasized that only six considered how higher SAF prices would affect demand and passenger reaction. As the perspective of these studies is identifying net zero pathways, lower demand associated with a higher price is often considered desirable. Only Gössling et al. [22,23] evaluated that these higher costs compared to the fossil alternatives could strongly keep airline companies from adopting decarbonization measures. They also underlined that the aviation profit margins between 1978 and 2022 have been USD 88 B, including 18 years with a deficit margin, while an investment of USD 500–2000 B is an estimated requirement to reach net zero by 2050 [24]. Thus, they argue that net zero ambition for aviation is highly challenging and that limitation measures, such as CO2 taxes, carbon budget, and alternative fuel obligations, are mandatory for efficient aviation decarbonization.
From an economic and rapid deployment perspective, HEFA-tJ seems to be the safest and most logical pathway to decarbonize aviation. However, when we consider broader factors such as markets competing for resources, resource availability, investment efficiency towards GHG emissions reduction, and potential future technological optimizations to achieve competitive SAF production costs, the HEFA-tJ pathway reveals potential adverse environmental impacts and economic risks that must be carefully evaluated. A global view of the technical, logistical, and operational issues, as well as economic challenges, market competition, and sustainability indicators, is essential to facilitate informed decisions by investors, industrialists, and researchers.
Our primary objective is to develop data management and visualization tools that can enhance project selection and thus lead to higher GHG reduction efficiency and reduced sustainable project failure risks. These tools will collect and compare data on resource availability, economics, and sustainability. Before deploying tools that can apply defined methodologies simultaneously to various processes at a larger scale, our primary goal is to initiate a discussion and solicit feedback from the scientific community on certain economic and environmental issues. The HEFA-tJ pathway is taken as a representative example to deploy new methodological models to assess critical variables for technology evaluation, such as the following:
  • The effects of biofuel market integration rate on customers’ prices and market barriers for sustainable solution adoption;
  • The impacts of feedstock conversion yield variation on GHG reduction and process viability for different processes;
  • The influence of regional land-use changes and local initiatives on the carbon intensity of biofuel and co-products;
  • The impacts of feedstock mix, availability, and usage on competitiveness, sustainability, and new technology evaluation;
  • Combined economic and sustainability evaluation based on a unique metric (USD/t avoided).

2. Methodology

We are conducting systematic studies on various biomass conversion projects based on critical variables that can influence their viability and environmental impact. These include, but are not limited to, the project size, cost, resource availability, logistics, yield, carbon intensity, selectivity, maturity, and impact on the electric grid. Our methodology distinguishes itself from other technology reviews, like the State of Technologies review from the Bioenergy Technology Office (USA) [25], by considering more variables and applying them specifically to SAF production. The production size, effect on the electrical grid, market entry challenges, optimization potential, speed of implementation, and operational risks are examples of variables that are often not discussed in a concerted way. Open resources from the literature were used to discuss each criterion. By doing this, some knowledge gaps can be identified, and company/institution claims can be challenged more easily. Our approach is inspired by a sustainable project analysis framework published by the consulting group Deloitte [26], but more in-depth technical, economic, and environmental analyses are applied.
Gathering and synthesizing with clarity the most relevant data from multiple fields, such as life-cycle analysis, technical-economic analysis, and recent technological advances, is of the utmost importance for decision-makers. We thus attempted to showcase methodologies—often original—that can facilitate the concise and synthetic presentation of key facts or issues. This work utilizes HEFA-tJ and RD production as a specific case study for these methodologies, and also explores how such a study can be deepened to extract interesting insights. However, the ultimate goal is to later apply these methodologies to various processes using much larger datasets.
From this perspective, our intention is not to provide a comprehensive overview of a region’s challenges or to conduct a complete life-cycle analysis. The scope of this work encompasses various geographic regions, such as Indonesia or the United States, in order to provide relevant examples of economic and sustainability issues. The intention is also not to give a fully transparent analysis. Such aims require large quantities of data and flexible visualization tools, which are part of our future work. We focus here on the type of operation and research that can be applied to generate insights when using or comparing various datasets and data sources.
The first part, Section 3.1, focuses on rapid technology screening methodologies. The goal is to generate a comparative competitive overview of the potential and issues of different technologies based on a limited number of datasets. These datasets include the historical prices of fossil commodities and of the feedstocks used as a green alternative, the production price of the green alternative as estimated by recognized organizations, the market integration rates of a fossil commodity compared to its fossil alternative, and the green process feedstock conversion yield. By combining these datasets, estimations of some market barriers related to the market integration rate (Section 3.1.1) and process competitiveness (Section 3.1.3) can be made. Competitiveness is primarily assessed by comparing fossil fuel prices with green alternative feedstock costs based on their biofuel conversion yield. Although this approach generates very partial analyses, the insights that were obtained have reduced uncertainties, as they are based on a limited number of datasets. From this perspective, Section 3.1.2 attempts to validate one critical variable, often used with these datasets, yields. A brief review of the values for yields and claimed industrial practices affecting yields observed in the literature is given for HEFA. If the systematic evaluation of yields in industry is generally not possible, Section 3.1.2 provides a transparent and straightforward review of yield variation factors compared to most life-cycle analysis frameworks, where often only one value is given for the yield, without much detail. The importance of such precision is discussed in-depth in the later parts of this study.
Section 3.2 and Section 3.3 deal with feedstock availability, sustainability, and market/regional potential. Sustainable analysts, SAF lobbyists, industrials, economists, and Indonesian deforestation analysts may not share common frameworks. Thus, Section 3.2 presents basic insights and data from different perspectives as an introduction to the further analysis in Section 3.3. General data from established frameworks on feedstock availability and carbon intensity are presented, and a further brief literature survey is conducted for each feedstock. What these values imply for jet and road lipid-based fuel, environmentally, is underlined.
Section 3.3 goes into a more detailed analysis on how regional and market data may impact sustainability evaluation. Indirect land use change issues, their state in Indonesia, and feedstock mix usage in the US are studied to evaluate the implications of these factors on sustainability. For land use changes, CORSIA’s evaluation of Indonesia and Malaysia HEFA production, based on production projections at a country level, is compared to the TRASE evaluation of historical land use changes for palm production at a regional level for Indonesia (kabupaten level). Minimal manipulation is done on the TRASE data, except for converting emissions that are attributable to palm oil to HEFA production. For the United States, we evaluated the carbon intensity of the feedstock mixes used for BD and RD based on the CORSIA evaluation of each feedstock’s carbon intensity. In both cases, our goal is to compare or combine, in a new way, multiple datasets from recognized institutions and observe if issues, important differences, or insights arise. A complete evaluation of every hypothesis used to generate these datasets is out of the scope of this preliminary work, as more datasets (soil, different feedstocks) are potentially required for a complete and standardized evaluation of land use change issues, for instance, to be carried out.
Section 3.4 presents some simple models to evaluate the impacts of yield on carbon intensity and GHG reduction. The results for carbon intensity are compared with several past carbon intensity estimations using recognized frameworks for lipid-based fuels (road and air) to evaluate how they consider the yield and other factors.
Section 3.5 explores technical alternatives to raising the GHG efficiency of lipid-based conversion to SAF and other commodities. It focuses on market barriers and opportunities regarding different technical options to raise the competitiveness related to project size, R&D costs, the R&D level, scale-up challenges, the potential to enlarge the feedstock mix, and operational issues. The aim is to give some examples of how these variables can affect sustainable technology adoption and development.
Finally, Section 3.6 aims to integrate economic and sustainability metrics. Key references for each section, along with mathematical models that illustrate relevant perspectives, are provided where necessary. Technical and detailed descriptions of operational units are included only when essential for understanding a critical issue. To facilitate easy exploration by decision-makers, some insights and issues discussed herein are labeled as subsection titles. The discussion summarizes and explores how additional datasets could be used with the presented methodologies, and also offers some key takeaways for various stakeholders.

3. Results

3.1. Rapid Technology Screening Methodologies

3.1.1. The HEFA-tJ Fuel Market Is Attractive Despite Prohibitive Production Costs

SAF production costs are at least two or three times higher than conventional jet fuels [5,27]. Production costs are, however, not the only variable that influences market attractivity. Market penetration and utilization rates have a profound impact on both road and air fuels. From this perspective, SAF production is attractive, as its current market penetration is very low compared to BD and RD, at an estimated 0.5% or around 0.5–1 Mt/y. The aviation industry, being international, employs book and claims systems that allow for the division of the SAF over-costs between multiple flights, which reduces the impact of SAF adoption on customers’ costs at the onset of market integration.
To illustrate the impact of market integration rates on customers’ costs, a simplified model was developed (Figure 1). Customers’ fuel costs are estimated based on different fuel market integration rates and cost premiums (based on IEA data [28]). The cost premium is the difference in cost compared to standard jet fuels (Equation (1)). Equation (2), where P is the SAF overcosts (%) and I is the SAF integration rate (%), serves as a model for the customer’s cost.
P r e m i u m = S A F $ G J S t a n d a r d   j e t $ G J 1
C u s t o m e r s p r i c e   % = P I + 1
Figure 1 schematically illustrates variations in premium values for different fuels and their integration in different regions (Europe, U.S., and Canada) according to Equation (2). This is necessarily a simplification, as the actual sustainable fuel costs of emerging and mature pathways are challenging to obtain and compare due to low commercialization for emerging pathways, subsidies, and tax exemptions received in mature pathways. Figure 1 illustrates how higher integration rates of sustainable fuels generate an increasing impact on fuel prices and risks. Below 2–3% integration, premium variations from 100–400% have an impact of less than 12% on the fuel price. Reaching such integration, however, represents substantial world SAF production at around 10 Mt/y and the attractive perspective of many new plants for technology suppliers.
Conversely, the current integration of BD/RD at around 8% in Europe is much more susceptible to premium variations. Customers’ costs vary from 2 to 14% even if the premium range is narrower (at 25–175%) than SAF’s premium (100–400%) in the model. The market will also become more challenging if higher BD/RD integration rates are warranted. Reducing the SAF premium from 300% to 100% with technology development at 5–10% integration, which represents an impressive optimization, still leads to higher customer costs than a process with 400–500% premium at 1% integration. Market risks are low when adoption begins. Consumers only pay premiums for a negligible fraction of their supplies. Consequently, SAF is advantageous compared to road fuels in regions where the BD and RD integration rates are high. In North America, however, BD/RD road fuel usage is concentrated in a few states, such as California, Texas, Illinois, and Minnesota. Most states have less than 1–3% market integration for BD/RD [29] and could integrate more sustainable road fuels without significantly impacting customers’ costs.
From a broader perspective related to BD/RD road alternatives, it is worth noting that long-range electric and hydrogen heavy-duty vehicles are also strongly affected by market integration rates, but often in a reverse fashion. Mauler et al. [30] evaluated the premium of these solutions at around 50–75% for long-distance trips (750 km) and several technical-economic analyses estimate similar or more competitive costs due to technology advancement [31,32,33,34]. The levelized total usage cost premium for electric and fuel-cell hydrogen heavy-duty vehicles is thus expected to be lower than that of SAF. Market penetration rates, however, have drastic implications related to these sectors. For instance, the Argonne Laboratory developed several technical-economic models of hydrogen and electric refueling stations, illustrating that the fleet size had a profound effect on customers’ costs [35]. For example, the delivery costs of steam methane reforming hydrogen at low deployment volumes are expected to reach USD 11–28/kg, and the cost for delivery stations is USD 6–8/kg. At high volume rates, these costs are expected to be significantly lower, at less than USD 5/kg and USD 2/kg, respectively [36,37]. These high volumes imply around 50–100 heavy-duty vehicles for each station a day and, in the case of liquefied hydrogen delivery, production of around 27 tonnes daily for 10 to 30 stations [38].
Thus, compared to the aviation sector, the risks and market barriers are different. If both require high capital investments from stakeholders, overruns and risks can be absorbed by aviation customers without a significant impact at low integration rates. Inversely, low utilization rates necessarily lead to drastic premiums in the hydrogen market for heavy-duty transport (~USD 17–36/kg), as the levelized cost parity with diesel vehicles is estimated to be USD 5–6/kg for hydrogen to be delivered to vehicles [39,40]. At high integration rates, Argonne evaluation is much closer to competitiveness with diesel fuel, at less than USD 7/kg. In the case of hydrogen for heavy-duty vehicles, to reduce the number of stakeholders involved—and the associated risks that some may abandon or reduce their commitment to move to hydrogen vehicles—fast integration rates by companies would likely be favorable in quickly reaching considerable fleet volumes and reducing the impact on customers’ prices.
Electric heavy-duty vehicles for long transport deliveries may face less drastic premiums at low integration rates but are expected to be deployed progressively, starting with regions with lower electricity prices and high fleet volumes [39]. The market penetration of BD and RD is still low in many world regions. Shifting the feedstock usage of these productions to SAF should be based on economic and environmental reasons, as hydrogen and electrification face considerable market barriers. In some net zero scenarios [41], this prevents them from competing with the road biofuel market share before 2035–2040, but less optimistic scenarios involve no competition before 2050 [12,41].

3.1.2. HEFA-Road Has Higher Yield and Selectivity than HEFA-tJ

The HEFA refinery pathway can be configured to predominantly generate renewable diesel or jet fuels, which strongly affects the overall yield and the types of products that are generated. The yields will have significant economic and environmental impacts on a given process, as they occur in the denominator of all calculations. They allow us to estimate and discuss resource cost values from the literature, their impact on production costs, and environmental assessments of a given pathway in the literature. Table 1 presents selectivity data from various sources from the literature and related yield estimates for the HEFA-tJ and RD pathways. As production costs represent the sum of operational costs divided by the production, it helps to understand why the HEFA-road pathway leads to at least 30% lower production costs than the HEFA-tJ pathway in the Zeck et al. technical-economic analyses (TEAs) study, for instance [20]. The latter needs a hydrocracker that generates higher rates of naphtha and refinery gas [42]. Consequently, higher-value production (jet and diesel) reaches much higher selectivity in the HEFA-road pathways, at 81 vs. 73 wt% in the Pearlson et al. [19] study and 78 vs. 53 wt% in the Zech et al. study [20].
One important aspect is the fate of naphtha and refinery gas and whether they should be considered when estimating yields. The composition of refinery gas is difficult to predict and it may be rich in CO2 and CO [43]. We expect it to be more likely to be used internally for heating, which will reduce the yield and offsetting CO2 emissions. This usage was, for example, described by Shell in a conference on HEFA-tJ production [44]. Naphtha is also likely to be used for chemicals and converted to olefines with a steam cracker. Neste’s naphtha is envisaged to be used for chemical production by Mitsui and SK Geo Centric [45,46,47]. The TotalEnergies HEFA-tJ plant in Grandpuits (France) was announced [48] and UOP Ecofining® technology, a key feedstock for bioplastic production, is sold by specifying its naphtha production [49]. In our assessment, the conversion of naphtha to plastics is expected to lead to a 30% yield loss, but data from the literature indicate up to around a 38% loss [50]. To achieve high SAF selectivity, the extraction of the jet fraction by distillation may also result in a diesel fraction that is too heavy for the diesel market but suitable for marine fuels [11]. However, market incentives differ for marine fuels and may not be well defined. As incentives are mandatory for SAF production profitability, this generates sales revenue uncertainties.
The official carbon intensity evaluation for SAF, the CORSIA framework, does not consider these additional losses and uses a scenario similar to the RD pathway described above [18]. No explanation is given for this choice, and we deduced that their jet selectivity is 25% based on the value they used to estimate indirect land use change, as it is not stipulated otherwise. The separation of propane from refinery gas and the valorization of refinery gas are also potentially done by Neste in their Rotterdam plant, which limits refinery gas yield losses [51,52]. The National Renewable Energy Laboratory’s TEA on HEFA-tJ uses naphtha as a fuel additive [42]. These cases lead to values that are similar to those in Table 1 for ‘yield without conversion losses’. However, as can be observed in the ‘yield with naphtha conversion losses and inner usage of refinery gas’ table, there are significant 7% and 11% yield differences between HEFA-tJ and RD when considering these losses. The environmental impact of these yield differences is discussed in detail in Section 3.4.1. Economically, naphtha yield losses do not impact naphtha’s market price. Still, renewable naphtha complexifies selling, and uncertainty exists regarding whether its market demand is as attractive as that of jet and road fuels. The market value of fossil naphtha is usually considered lower [20,42]. Selling refinery gas and bio-propane also necessitates additional operational units and logistics.
Thus, it must be noted that the global market is currently more attractive for HEFA-tJ production than RD, as the integration rate of SAF is much lower than that of road fuels (Figure 1). An additional factor is the environmentally sustainable image of the airlines utilizing HEFA-tJ. However, we expect that this attractiveness of HEFA-tJ over the BD/RD pathway will likely fade with higher SAF integration rates, as the price difference is an important market disadvantage for HEFA-tJ compared to RD.

3.1.3. Resource Costs for HEFA-tJ Are Much Higher than Conventional Jet and Diesel Fuel Costs, Implying Low Production Cost Reduction Potential

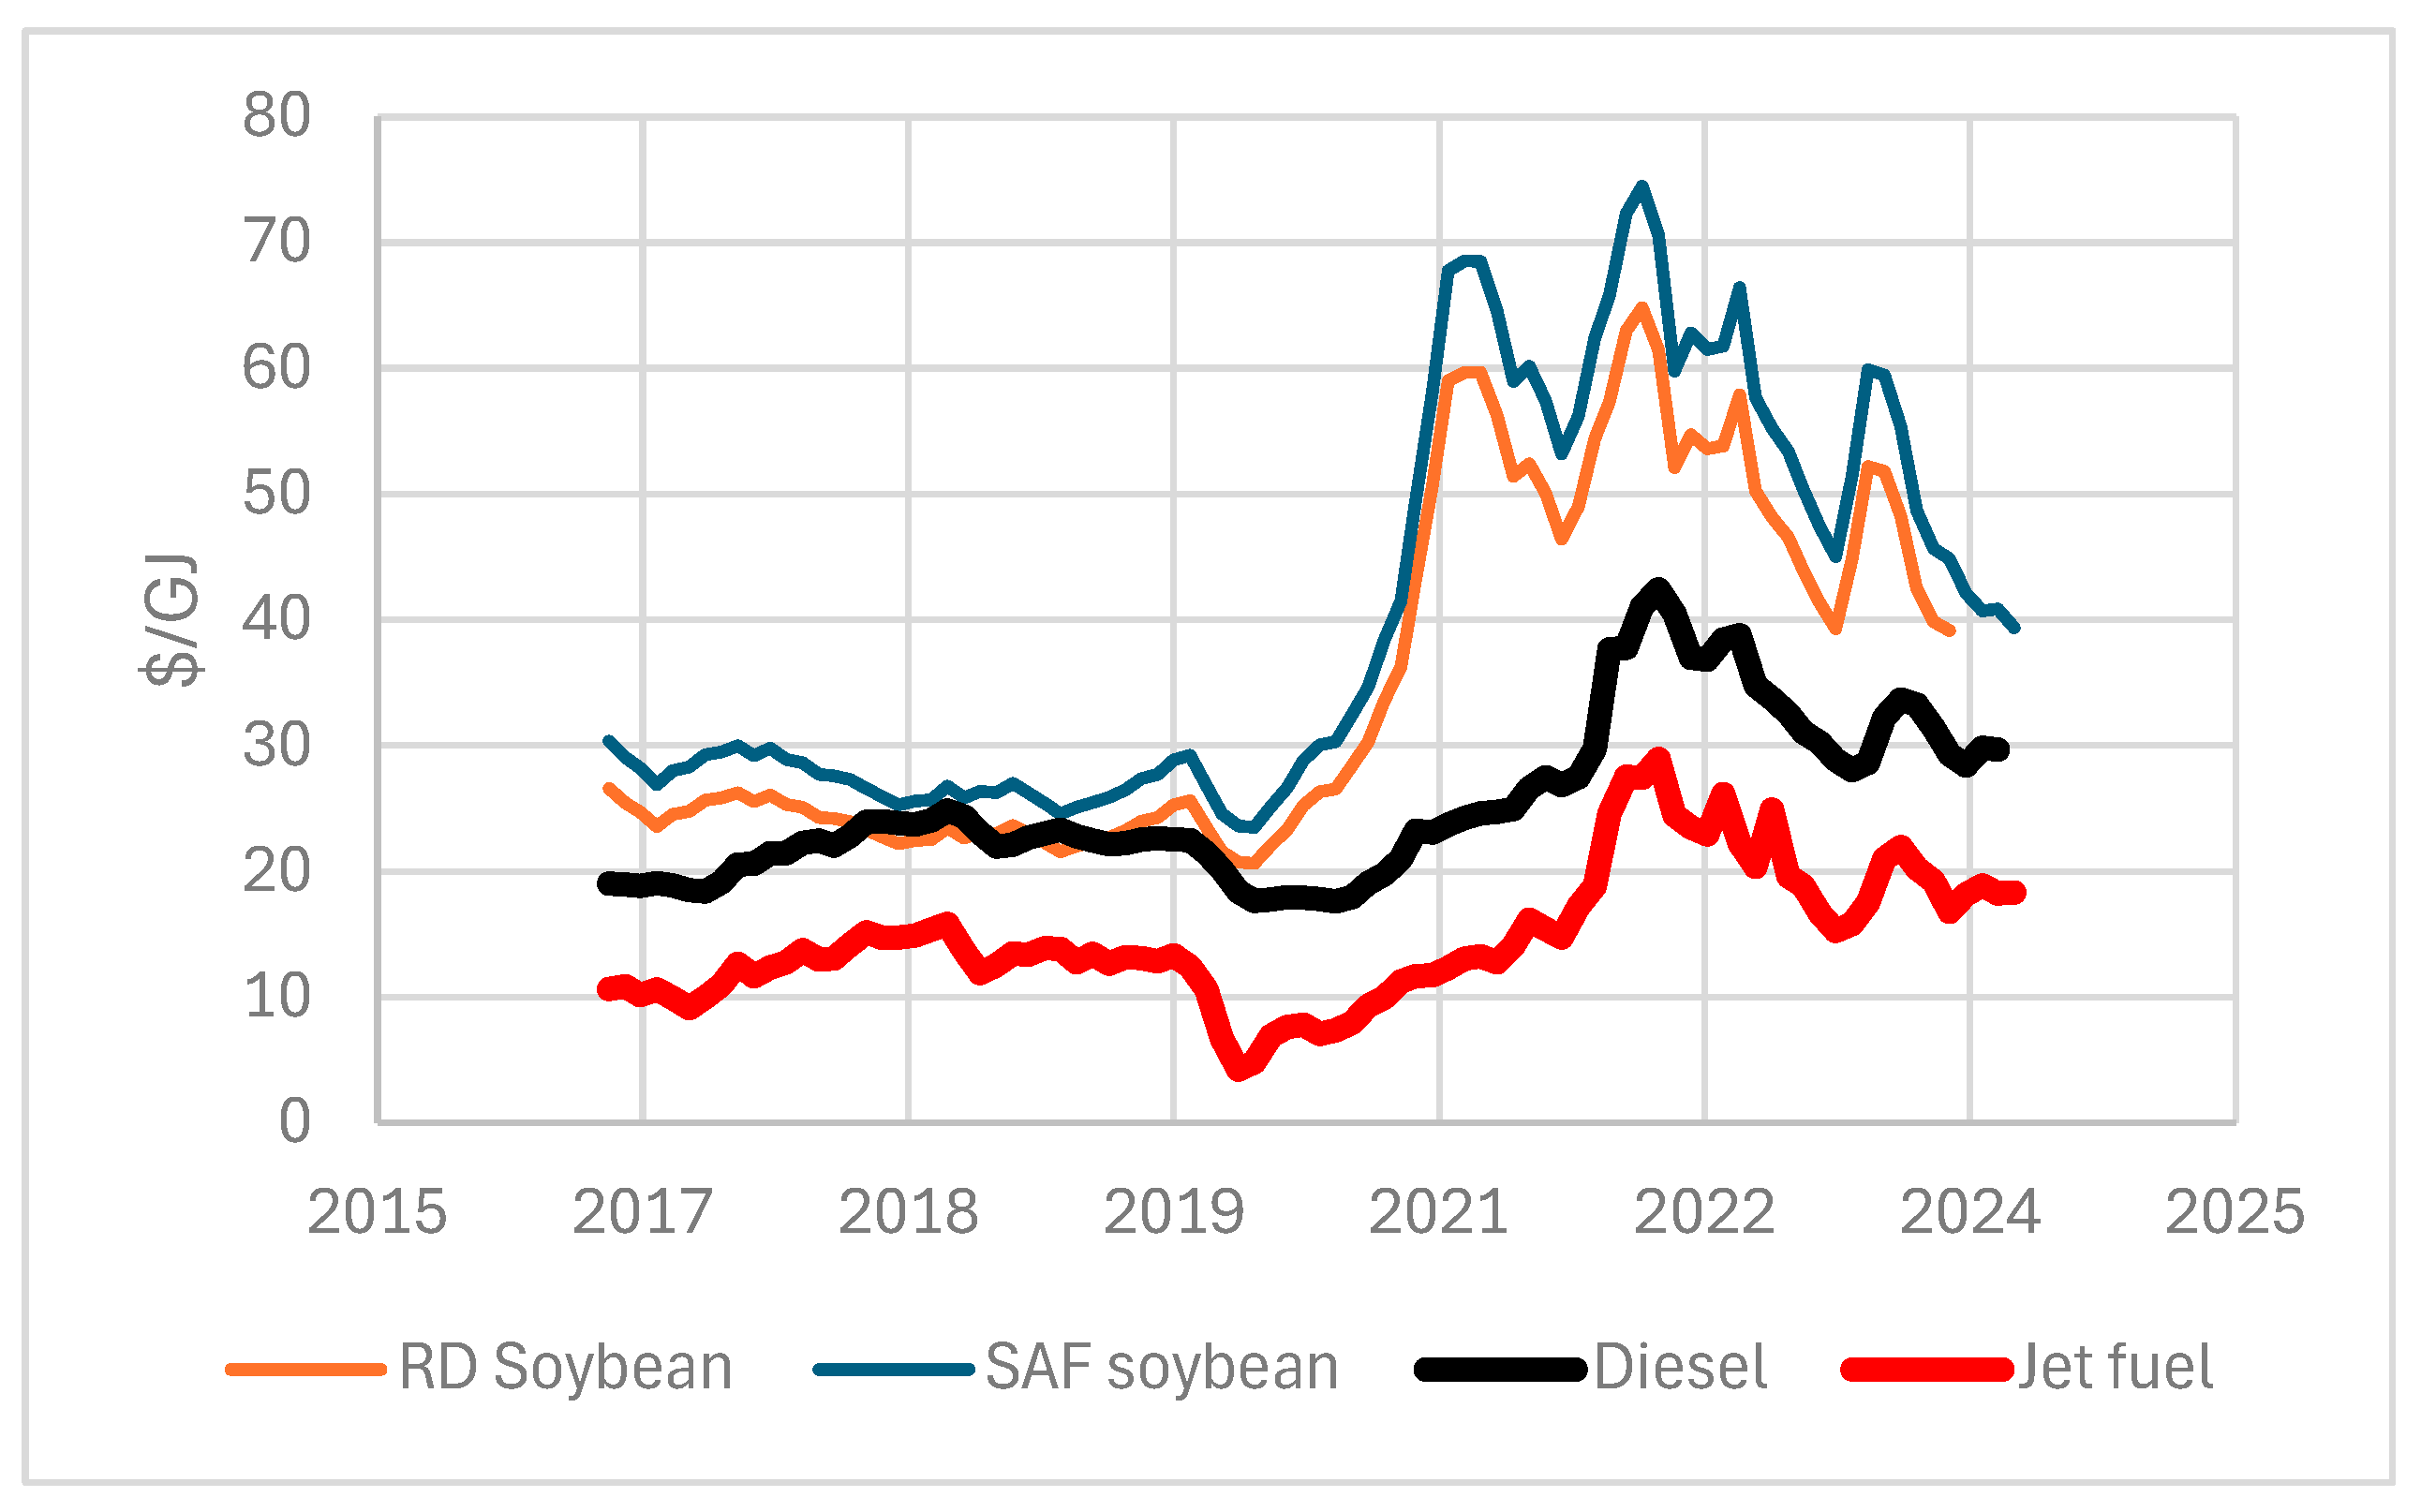
Watson et al. [1] published a review of various TEA studies and estimated that the HEFA-tJ premium reaches 120%. However, it is important to note that, as the HEFA pathway is relatively mature, the current premium market prices for HEFA-tJ for different resources are available and reached 220% (three times that of conventional fuel cost) in January 2024 [53]. Higher premiums were also considered elsewhere [5,27].
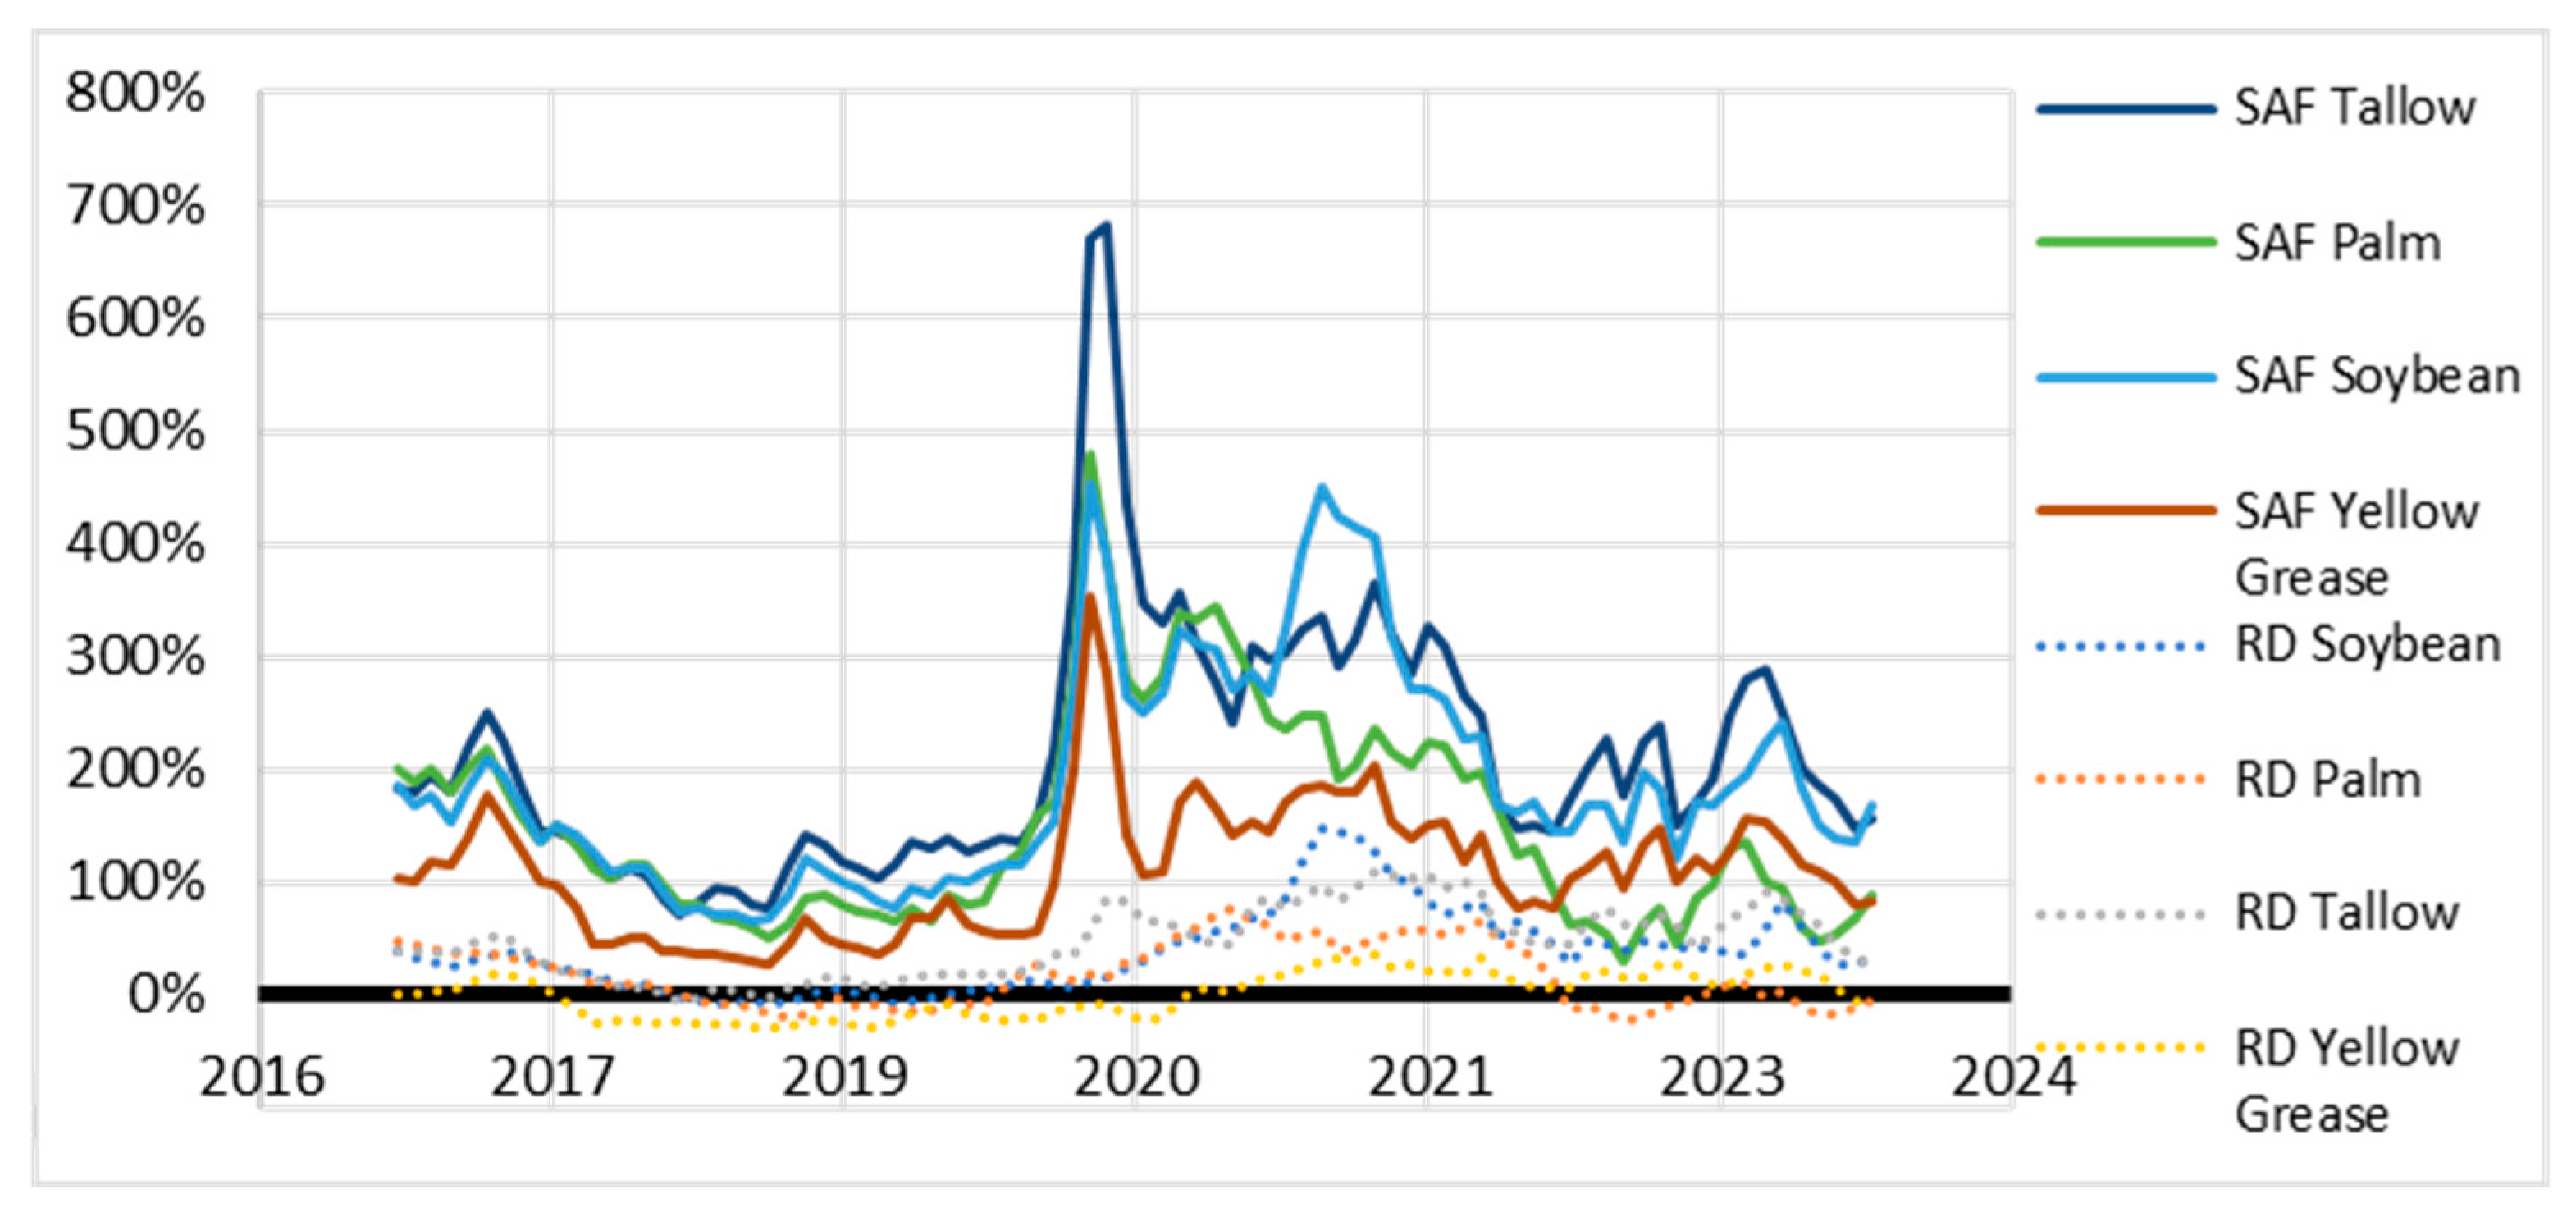
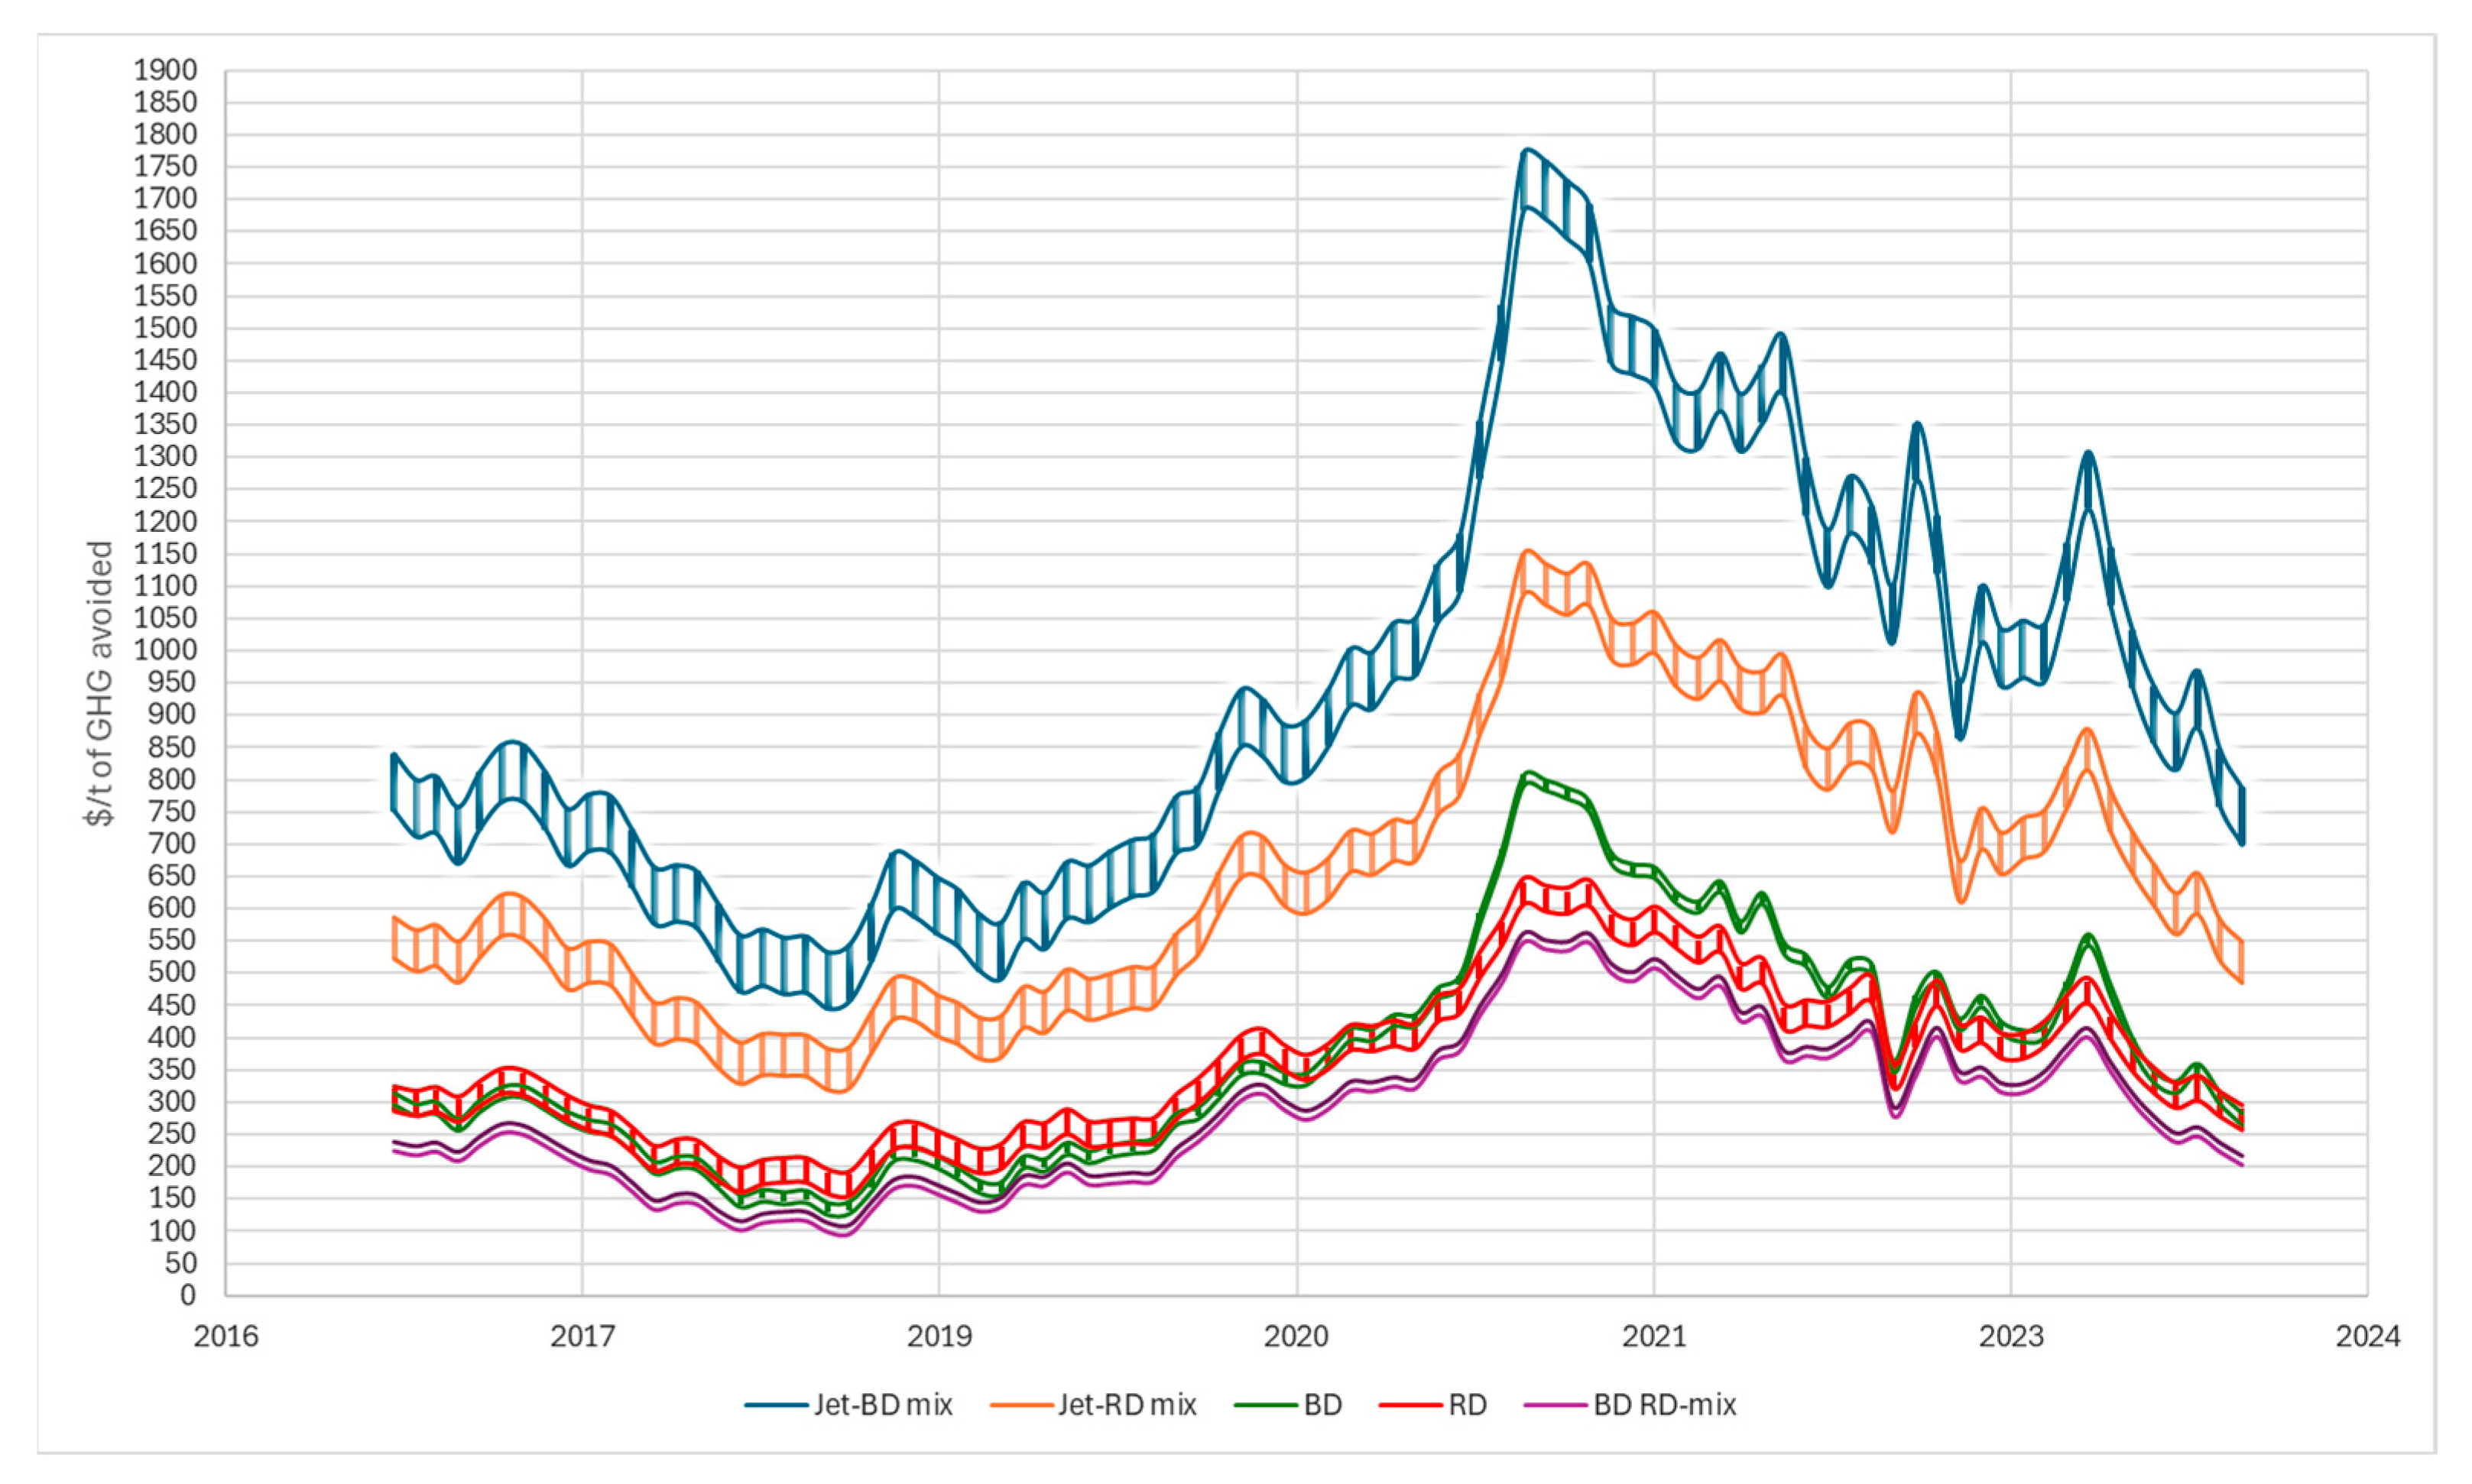
Market prices do not always represent production costs, as suppliers may sell for short periods at a loss. Resource costs are the most significant contributor to the fuel costs of HEFA-tJ [11]. To achieve fast estimations of the HEFA pathways’ competitiveness for air and road fuels compared to that for standard fuels, we compared historical prices for primary resources and standard fuels from various sources (USDA, EIA, IndexMundi) [54,55], considering RD, SAF yields, and energy density. The study period is from 2017 to 2024. The model is inspired by Don Hofstrand’s model for biodiesel production cost estimation [56]. A generic cost of USD 150/t was added to the primary resource cost for electricity, other chemicals, and hydrogen production. The SAF yields were estimated at 79% (optimistic value, Table 1) with an energy density (low heating value) of 40.5 MJ/kg [57]. The RD yields were estimated at 85% with an energy density of 43 MJ/kg [58]. Figure 2 illustrates the diesel and jet fuel prices (EIA, 2024) compared to the estimated resource costs for soybean RD and SAF (other resources not shown for clarity). As different product distribution and selling prices are expected, Figure 2 should not be used as a reference for actual product costs. It illustrates, however, that the resource costs, without considering the process cost, are more expensive than jet or diesel fuels.
Compared to RD production, the lower prices of conventional jet fuels and diesel also significantly drive the SAF premium to values higher than 100%, while RD is, on average, below 100% (Figure 3). Yellow grease and palm oil even periodically decrease to reach competitive prices for RD (without considering capital expenses).
Because primary resources have a critical impact on production costs, the potential of reducing the costs of the HEFA-tJ pathways is low and relies primarily on economies of scale [42]. From this perspective, while many TEA studies often imply plants with 250–500 kt of resource supplies [20,42], announced and actual projects are much bigger and usually involve more than 900 kt of resources.
For instance, Neste announced a USD 1.91 B expansion of its Rotterdam plant in order to produce 700 kt/y of HEFA-tJ. Shell’s SAF plant in Rotterdam was expected to produce 800 kt/y of fuels (the project is now on pause). World Energy Paramount, in California, is expected to raise its production by seven-fold, up to approximately 1.1 Mt/y. One of the smallest HEFA-tJ plants (Grandpuits), announced by TotalEnergy, is still at around 500 kt of resources (estimated from the 285 kt/y of SAF announced). The first plants will likely mobilize the sustainable resources with the lowest costs as a result. Higher costs for resources are thus expected in the future—and indeed have already been observed—which makes HEFA-tJ less amenable to production cost reduction [11].

3.2. General Data on Feedstock Sustainability and Availability with Related Insights

3.2.1. Used Cooking Oil (UCO) and Animal Fats (Tallow) Are the Only Resources with a Significant Commercial Deployment That Can Lead to More than 65% Reduction in Carbon Intensity Compared to Conventional Fuel

The main reason for producing SAF is to reduce aviation GHG emissions. Fuel norms are based on carbon intensity (CI), which measures the GHG CO2-equivalent emissions for a defined quantity of energy. The International Civil Aviation Organization (ICAO) set the conventional jet fuel CI at 89 g/MJ [59]. This value is further used to evaluate carbon intensity reductions.
C I     r e d u c t i o n   ( % ) = 1 C I S A F C I
The standard methodology, still in development, used to evaluate the CIs of different SAF pathways is called the Carbon Offsetting and Reduction Scheme for International Aviation (CORSIA) and was agreed on in 2018 by the 192 members of ICAO. Two working groups have developed life-cycle assessments (LCAs) for the CORSIA: the “Core LCA group” and the “iLUC group” [59,60]. The Core LCA group concentrates on the different SAF processes and uses data from the databases of E3db and the GREET® models. Issues associated with indirect land use changes (iLUCs) are studied separately using the GTAP-BIO and the GLOBIOM models [59]. The land use change (LUC) is the estimated environmental effects of replacing agrifood production with energy application and the consequent cropland expansion (iLUC).
Table 2 illustrates the CORSIA evaluation for different SAF fuels, including core and iLUC values. Only four resources reach more than a 65% CI reduction for HEFA-tJ (or 31.2 g/MJ). UCO (22.5 g/MJ) and tallow (13.9 g/MJ) are the only resources currently reaching significant commercialization (see Section 3.2.2).

3.2.2. UCO and Tallow World Availability Cannot Cover Actual HEFA Road Usage

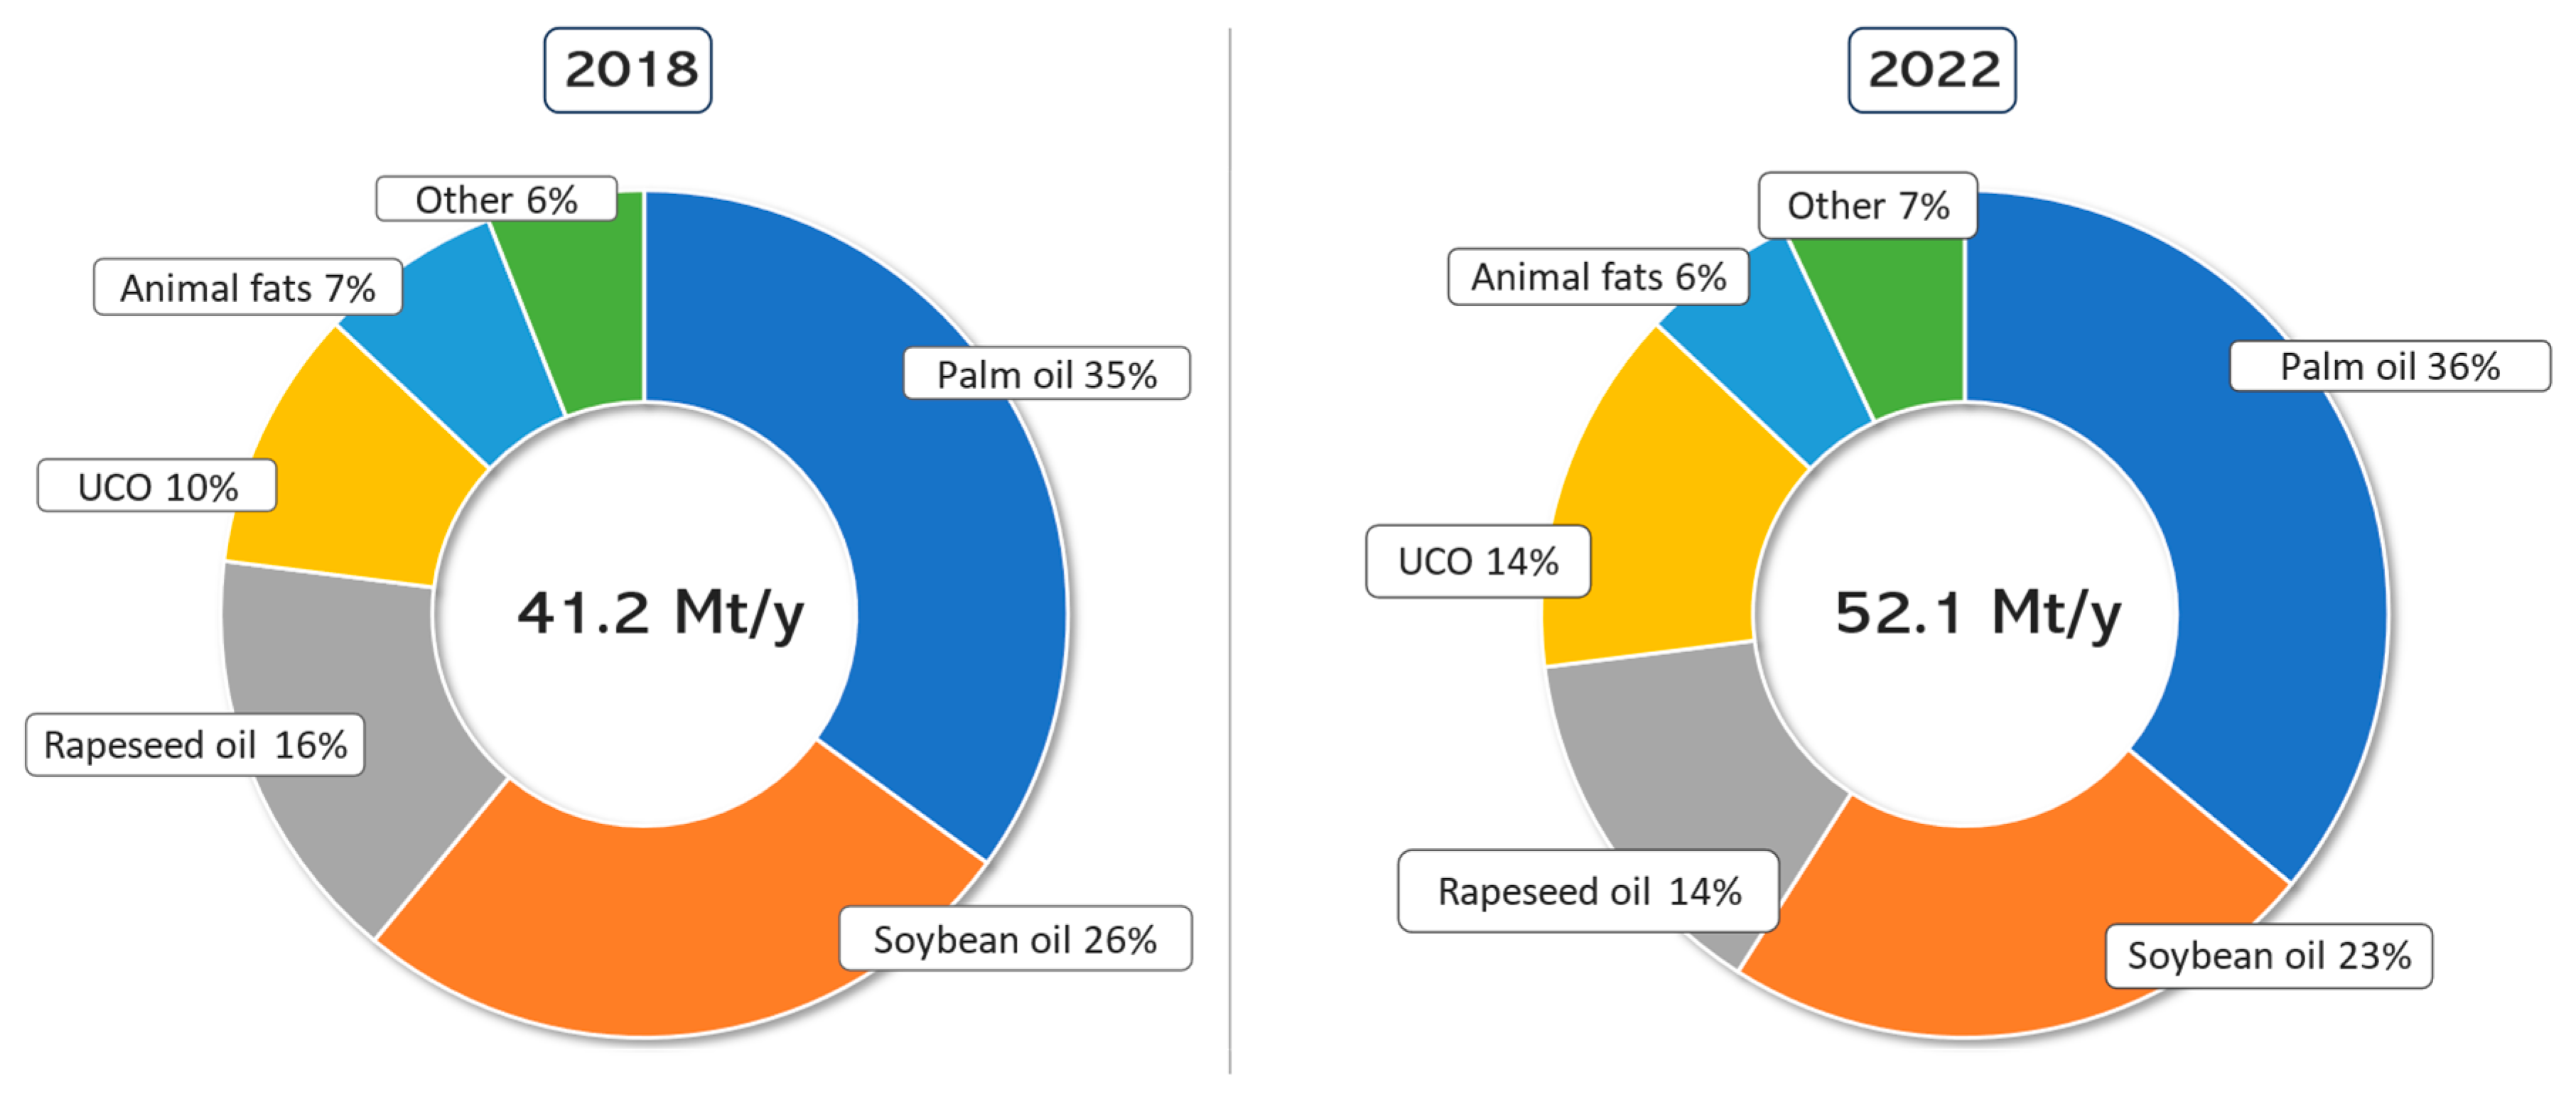
UCO and tallow are among the lowest carbon-intensive resources. They represent 20% of the resources used for RD and BD production (10.4 Mt), and their usage has risen by 48% since 2018 [61,62] (Figure 4). As their availability is estimated at 40 Mt [63,64], around 25% of the available UCO and tallow is thus potentially already in use. Meanwhile, it is not apparent from the available data whether these resources include RD utilization (the assumption has been made that it does). However, the availability of these resources is hardly enough for road fuels that use 52 Mt of oil equivalent. Expanding their usage for future SAF fuel production is, therefore, seen by the industry as one of the most challenging issues [11]. As described in Section 3.1.2, it must also be noted that the yield losses in the HEFA-tJ pathway compared to those in the RD pathway can lead to 8–13% of these low-carbon intensive resources being potentially wasted in further conversion steps.
Some uncertainties about low-CI feedstocks concern their availability and regional distribution, as well as the technical feasibility of their valorization. In the United States, the Bioenergy Knowledge Framework provides information on the available animal fats and UCO at a county level, which is currently at around 4 million tons across the country, but it excludes current usage [65]. In a market where strong competition exists for these feedstocks and subsidies are generally offered both for collection and biofuel production, more granular data would allow the development of models to better estimate the feedstock transportation costs and sustainability of new and existing plants according to their size and location. Accordingly, it could provide valuable insights into the best usages for local feedstocks and inform the development of appropriate projects. The available data are also mostly aggregated at the national or regional level, but cities play a critical role in the development of collection infrastructures. More complete data on available and used feedstocks would help identify cities where collection volumes are important, which is critical in assessing collection infrastructure costs, efficiency, and best practices.
In Europe, Bio4A produced a report on the market for waste feedstocks for aviation [66]. They estimated that only 130 kt of UCO was still available in Europe from the professional sector, and that 82% was already collected in Italy, for instance. Inversely, domestic collection in Europe is low, at around 47.7 kt, compared to an estimated availability of 850 kt/y. The maturity of the collection and uncertainties related to feedstock gathering prices pose challenges to expanding the local UCO usage for biofuels, particularly in countries that lack household collections, which includes 14 European nations [66].
Estimations of the total potential of UCO also often rely on population extrapolation. Bio4A’s report discusses the European Biomass Industry Association’s theoretical estimation of a potential 4 Mt of UCO in Europe based on such methodology, and Canada’s Biojet Supply Chain Initiative also uses this method [67]. In the latter case, and without even considering the methodology’s limitations, the availability of UCO was estimated at below 75 kt per province in Canada. Similar values are expected for European countries, based on the distribution between regions of the estimated 800 kt of domestic UCO. If large HEFA-tJ plants may offer a stable demand for UCO, favoring the development of UCO collection systems, the transport distance and construction delays may be considerable and hinder their deployment due to higher costs and risks. UCO collection systems to supply existing plants or conversion processes that can be commercialized at a lower scale potentially offer a simpler development. Such plants can also be less dependent on imports and high-carbon-intensity feedstocks to achieve and secure their supply chain.
Animal fat market applications are categorized based on the risk of bacterial contamination. High-risk feedstocks, representing around 6 million tons of the 18 million tons of animal fat produced in Europe, are not suitable for feed and food uses, which makes biofuel production a well-established and logical application of these feedstocks [66]. However, the rising demand for biofuels has increased the use of edible fats (low risk) for road fuel applications, which became the largest market for these feedstocks in 2019, with an estimated 30% share. Expanding the use of animal fat for air or road fuels will likely create more competition for edible fats. In this scenario, other less subsidized markets could offer interesting and sustainable benefits that would be lost at the expense of biofuels. These include replacing soymeal, palm oil, fish feed, and fertilizers.

3.2.3. Other Resources Used in Commercial Deployments for the HEFA Pathway Have Mitigated Environmental Impacts

Figure 4 and Table 2 provide key data to understand the potential environmental impact of expanding SAF production using the HEFA-tJ pathway. First, rapeseed and soybean oils, representing 46% of the oil used for BD and RD productions (Figure 4), allow a 14–28% reduction in carbon intensity if used for SAF according to the CORSIA (Table 2).
Second, palm oil, the most used resource at 36%, has a variable carbon intensity depending on whether the methane generated by the palm mill oil effluent treatment (POME) is captured (14% carbon intensity reduction) or simply released into the atmosphere (11% more emissions than standard jet fuel) (Table 2). However, there is a lack of transparent and credible data demonstrating how many palm oil plants capture methane. The actual number of plants that have adopted such technologies, at 5–6% from the available literature data [18,68,69], is potentially underestimated, as significant efforts have been deployed to target this objective (see Section 3.2.5). We evaluate, however, that higher rates cannot be considered before more standardized data are available. Consequently, we consider that 34% of HEFA fuel production from palm oil is worse than that of conventional fuels if used for SAF, at 99.1 g/MJ. The CORSIA framework also acknowledges this low adoption of methane capture technology [18]. However, it does not provide updated data on the issue.
Prioritizing better data and reducing the carbon emissions of actual road pathway production appear to be essential, as shifting these resources to SAF would lead to 73–80% of fuels having low to no carbon emission reduction despite their high premium. Globally, the potential cumulative carbon intensity reduction, considering the actual usage of palm, rapeseed, and soybean oil (73% of resources) for SAF, reaches only around 7.3%. Some important precision on how valid these evaluations are, and how they vary regionally, is given in Section 3.3, using palm oil as an example.

3.2.4. Reducing HEFA-tJ Pathway Carbon Intensity with Other Resources Has Limited Impact

Other resources with low carbon intensity are also often discussed for use in the HEFA-tJ pathway, such as POME conversion to jet, palm fatty acid distillate (PFAD) oil extraction, and growing dedicated oil crops on degraded land (e.g., carinata, camelina, and pennycress) [1,59]. However, from our perspective, these resources are not expected to gain significant market share in the future.
POME, the liquid waste stream of palm oil mills, is currently an environmental burden that could be valorized for biofuel production with some environmental and economic benefits [70]. Quantum Biofuels estimates the price competitiveness of POME to be similar to that of UCO and other HEFA-tJ resources [53]. However, the total theoretical biofuel production is expected to be 400 kt/y and 900 kt/y for Malaysia and Indonesia, the most prevalent producers, respectively [70]. Some volumes are also already sold in China for biofuel production. Neste’s evaluation of POME resource availability is likely higher but is included alongside UCO and tallow availability estimations [63]. It, thus, cannot be regarded as an important low-carbon resource for HEFA-tJ.
PFAD is a side product of palm oil production (3–5% mass) and another low-carbon resource used for HEFA production [71]. Its market price is lower than that of palm oil, but it is considered to be 100% utilized primarily in markets other than biofuels. However, some uncertainties exist concerning the market share of PFAD in different applications (e.g., soap, feed, oleochemicals) and how PFAD can be substituted in these products if it is used for biofuel production [71]. Its global production can be estimated as moderate (around 3–4 Mt/yr), but shifting its usage to biofuel production could favor rising palm oil production and associated environmental problems. Although it could be a valuable resource for HEFA production, the market side effects must be well considered. The CORSIA should also clarify ethical and methodological issues regarding these resources. For instance, Neste only uses PFAD from sustainably certified palm plants [72]. The Roundtable on Sustainable Biomaterials also requires certification for the palm plantation and GREET has studied the issue [71]. In the CORSIA framework, as no mention of such an issue is discussed [18], we assumed that a palm oil plant involved in peatland degradation—causing considerable land use changes and related GHG emissions—could still sell its PFAD as a low-carbon intensity resource (20.7 g/MJ). If this is the case, such norms hardly promote the adoption of better practices by palm oil producers. It is also difficult to understand why standard PFAD carbon intensity evaluation considers palm oil plants where methane emissions from POME are captured [11]. This practice should be considered marginal, as explained earlier.
The estimated availability of oil trees on degraded land and oil cover crops is around 155 Mt/yr [63,64,73]. As the yields are less attractive on these lands, and the envisaged crops are less efficient at producing oil, using such resources would likely negatively affect the SAF prices. For example, the agricultural yield of palm oil is about 3.72–3.92 t/ha, while oil yield of cover crops such as carinata, camelina, and pennycress, respectively, is 0.42, 0.39, and 0.32 t/ha [73,74]. It is worth noting that other services are derived from these feedstocks, and that higher yields have been reported. For example, Camelina sativa was studied in pilot trials in Spain and Italy as part of the BIO4A project. Eight experimental field studies provided yield data to model the potential benefits of using nearly 500,000 km2 in the Mediterranean, which would cover almost the entire area suitable for camelina cultivation in southern Europe [75]. One goal of this €50 million project, besides producing SAF from residual lipids at a commercial scale with BIO4A’s industrial partner ENI (1000 tons), was to develop and demonstrate agricultural practices that would allow for SAF production on dry, desertification-prone lands. Their model projected average yields of 1.87 ± 0.7 and 2.47 ± 0.7 tons per hectare per year with continuous cultivation and crop rotation with barley on degraded land, respectively. With an expected seed oil yield of around 37%, much higher yields (0.69–0.91 tons per hectare) were estimated compared to the GTAP-BIO simulation model, which predicted 0.39 tons per hectare of oil [73]. The soil organic carbon changes averaged 31 and 43 kg/ha per year but could exceed 200 kg/ha in some simulated regions of Spain, which indicates a potential for SAF production that could have a negative carbon footprint. The expected production volumes from Camelina were studied in a previous, related €16 million project, ITAKA (2012–2016). Countries such as Spain, France, Finland, Poland, and Sweden were estimated to be able to produce more than 150 kt/y of camelina oil (total potential) each [75,76]. The impacts on European SAF and aviation emissions would thus likely be limited. Considering a rotation with barley, the annual production volumes would also be reduced by about half.
In the United States, more than 25 million hectares with potential for cover crops were estimated to exist in the Corn Belt [73]. To a lesser but still significant extent, it was evaluated that the Southern States could deploy up to 0.81–1.16 million hectares for Carinata in Georgia, Alabama, and Florida [77]. The production potential thus appears to be high and, as an example, the Southern Partnership for Advanced Renewables from Carinata has set an ambitious goal of planting 325,000 hectares of Carinata for SAF. However, the implementation of such a culture is emerging in the United States, with no statistics from the USDA being available yet on the size of commercial production. The production is likely very low. Adoption by farmers of this winter crop is also risky, considering the limited experience of farmers in using it, the learning curve, and the unpredictable yields and prices. Subsidies and policy support to make it attractive for farmers are thus expected to be required [78]. Envisaging a large-scale deployment for SAF requires, first, the demonstration of commercial activities related to an attractive business model.

3.2.5. Considerable Efforts Are Being Deployed to Reduce Palm Oil’s Carbon Intensity

Deforestation and peatland degradation in palm oil-producing countries have been a significant international community focus, ranking second after cattle in the agriculture commodities that are generating deforestation [79]. Around 10.5 million hectares of forest were converted to palm oil plantations between 2001 and 2015, including 7 and 2.7 million hectares in Indonesia and Malaysia, respectively [80]. In 2011, palm oil producers in Indonesia made “No Deforestation” commitments, and considerable reductions in deforestation were acknowledged as a result [79,80]. From an intensive period that caused 200–310 thousand hectares of deforestation per year (2005–2012), Indonesian palm oil deforestation has decreased substantially, reaching only 21 thousand hectares in 2020, for instance [79].
Twenty percent of the palm oil mills in Indonesia are now certified as sustainable, and the primary producer countries, Indonesia and Malaysia, are interested in substantially increasing the number of palm plants that are capturing methane from the effluent treatment of their production [81].
The Malaysian Palm Oil Board published biogas capture plant number data in 2019, which showed that Malaysian palm oil production is at 28% and encompasses 125 plants [82]. Regulations in Malaysia have forced palm oil mills to install methane capture systems since 2014, with a required 75–85% POME rate treatment, but exemptions were given in 2021 for plants processing less than 216 kt/y of fresh fruit bunches [83]. No similar data are available for Indonesia, and it is unknown if Malaysian biogas capture projects are still active. The adoption of biogas capture technologies by palm oil mills is critical in determining whether palm oil fuels are better or worse than conventional jet fuel. Detailed, updated, and transparent data on this subject are required.

3.3. Regional and Market Data Importance for Land Use Change and Sustainability Analysis

3.3.1. iLUC Heated Debates

iLUC evaluations have been heavily criticized, and many issues have been acknowledged by the developers of the iLUC’s methodologies (see Taheripour et al. [84]). iLUC evaluation requires complex datasets and several assumptions to estimate the economic projection of land use changes. Additional hypotheses on land use emission factors must be further used to convert land use changes to GHG emissions. The various assumptions and modelling approaches generate variable iLUC estimations. For instance, the GREET iLUC estimation for U.S. corn ethanol was historically below 9.5 g/MJ, while the CORSIA value is at 24.5 g/MJ [18,85]. For soybean HEFA, the CORSIA’s iLUC values are also estimated at 24.5 g/MJ, while the GREET value is 9.7 g/MJ [11]. Such wide variations could result in the specific feedstock pathway not being eligible for subsidies such as the Grand Challenge Roadmap, which requires a 50% CI reduction. This is the case for U.S. soya and canola oils. As a result, countries and industries with a strong economic interest in biofuels have severely judged the validity of iLUC methodologies [86,87,88]. A recent IEA Bioenergy webinar also involved many speakers criticizing the value of these methodologies [89], while the NREL State of Industries on HEFA did not consider them, judging them to be too complex [11].
From a green financing perspective, however, methodology uncertainties and complexities are invalid arguments for neglecting a phenomenon or selecting the most optimistic values that describe it. The investments involved, the high premium, and the uncertainty regarding the environmental benefits of some SAF pathways lead to tangible financial risks and potentially inefficient public investment. For instance, Indonesia’s palm oil production for biofuel increased by 4.3 Mt between 2018 and 2022, while European fuel legislation has been put in place that bans progressively bans palm oil importation, reducing its consumption for biofuels in Europe by 0.5 Mt in that period [61,62]. The additional palm oil production (approximately 4.9 Mt) consequently had to be sold on the Indonesian domestic market, potentially at a much lower economic value than it would have been on the European market. This example illustrates that constructing multi-million-dollar plants before clarifying sustainability issues can lead to significant economic problems.
From this perspective, it is also worth noting that lower GREET values for iLUC might increase towards the CORSIA value soon, as a recent study on land emission uncertainty factors by the System Assessment Center (related to the GREET model) involved iLUC values between 13 and 24.9 g/MJ for the corn ethanol to jet pathway [84]. These uncertainties led the authors to claim that new critical studies were required to assess the validity of the different models and to validate emission factors, for example using advanced satellite and remote sensing. Without these, “public policy may have unintended consequences of supporting fuel options that may have high-iLUC GHG emissions”.

3.3.2. iLUC Model Potential Enhancement with Regional and Up-to-Date Values

Countries are entities with conflicting regional interests, regulations, and powers. A model that evaluates the sustainability of a country’s biofuel production as a whole may underestimate efforts that have led to significant positive impacts in some regions. In contrast, negative impacts may be underestimated in others. If the CORSIA model compares the GTAP-BIO and the GLOBIUM models to ensure its validity, no discussion is given about countries’ concrete regional variations, how these evaluations compare with regional data, and to what extent a country’s iLUC hypotheses should be considered valid when significant variations are observed at a regional level.
To preliminarily evaluate these aspects, we compared some of CORSIA’s hypotheses for the Indonesia HEFA-tJ pathway [18] and its iLUC evaluation with TRASE’s regional data on palm oil production and land use change emissions. The TRASE model for Indonesia is a collaboration between experts from the Stockholm Environmental Institute, Global Canopy, Auriga, The TreeMap/Nusantara Atlas, and the Conversion Economics Lab at University of California (Santa Barbara). The model utilizes relatively recent regional satellite data to evaluate the extent of palm oil expansion at the regional and palm oil plant levels, such as those provided by Gaveau et al. (2022) [79]. Our future studies will explore additional regions and feedstock, compare more methodologies, and present the tools we are developing to analyze and visualize such data.
The main hypotheses that we analyzed were the shock size, the percentage of palm oil production on peatlands, and the global carbon intensity estimate for the iLUC and LUC (Table 3). The shock size represents the CORSIA-expected HEFA-tJ production growth from 2010 to 2035 as 207.7 PJ for Indonesia and Malaysia, with 25% being considered jet fuel and 75% being considered road fuel. We compared this value to the actual biofuel growth from 2008 to 2024, which was ~12.3 Mt (or around 460 PJ) for Indonesia. Only biodiesel production (37.3 MJ/kg) is accounted for in this estimation, as the HEFA plants’ production volumes are more uncertain. The palm oil expansion for HEFA production is expected to be 0.47 and 1.57 million hectares by 2035, according to the GTAP-BIO and GLOBIUM models [18]. Palm oil expansion from 2008 to 2022 reached 7.1 million ha, from which around 2.7 million ha were used for biofuel production (37%).
The percentage of palm oil expansion on peatland is based on TRASE data for the total hectares of peatland converted to palm plantations from 2003 to 2022. Estimations of the palm plant extension on peatlands were made for each kabupaten by dividing the hectares of converted peatlands attributed to palm plants by the total palm-planted area. The emissions for peatland conversion were based on the CORSIA’s value, 38.1 t/ha.y, which is lower than that of the TRASE and GLOBIUM models, 90 t/ha. However, this aligns with the Intergovernmental Panel on Climate Change guideline [18]. As peatland conversions occurred before 2003 for some kabupaten, we also evaluated peatland emissions while considering only hectares converted after 2003. The emissions generated by peatland oxidation are expected to last 25–30 years. Uncertainties exist regarding the exact occurrence of peatland conversion for older data and how these land conversions should be attributed to biofuel production, which began after 2008 in Indonesia.
The LUC estimates for each kabupaten were calculated similarly to those for TRASE, but considering an 85% yield from oil to fuel (HEFA-road yield) and an energy density of 43 MJ/kg for biofuel production. These values include emissions from land conversion/deforestation, peatland subsidence, and peatland fire emissions. The latter may not be considered in the CORSIA framework or could be included in the LUC values. It is not discussed in the CORSIA supplementary documentation. Land conversion and peatland fire emissions are evaluated for a given year, as well as for the average value of the past five years. Determining the time period for a fair evaluation is beyond the scope of this preliminary evaluation. As there are numerous kapubaten (over 400), we further studied the performance of 30 of the biggest producers (more than 430 kt/y of palm oil), as well as the highest (more than 200 g/MJ and between 100–200 g/MJ) and lowest (<20 g/MJ) carbon intensity kabupaten, which have a production of over 80 kt/y of palm oil. We also included peatland conversion values from before 2003. In both GTAP-BIO and GLOBIOM, peat oxidation is the main source of iLUC emissions, representing 76% and 92% of the total iLUC emissions.
The scope of the analysis is slightly larger than that of CORSIA. We considered the emissions of the entire palm oil industry for each kabupaten and then evaluated how much emissions should be attributed to this production if the palm oil were converted to fuel. The alternative would be to only evaluate the emissions related to biofuel production since the beginning of its production in Indonesia. As palm oil growth expansion is primarily driven by non-fuel applications (~63 wt% since 2009), and since we are interested in direct land use change emissions, it does not appear justified to make such a distinction. LUC is considered, first and foremost, a palm oil industry issue beyond biofuel production.

3.3.3. CORSIA iLUC Comparison with TRASE LUC

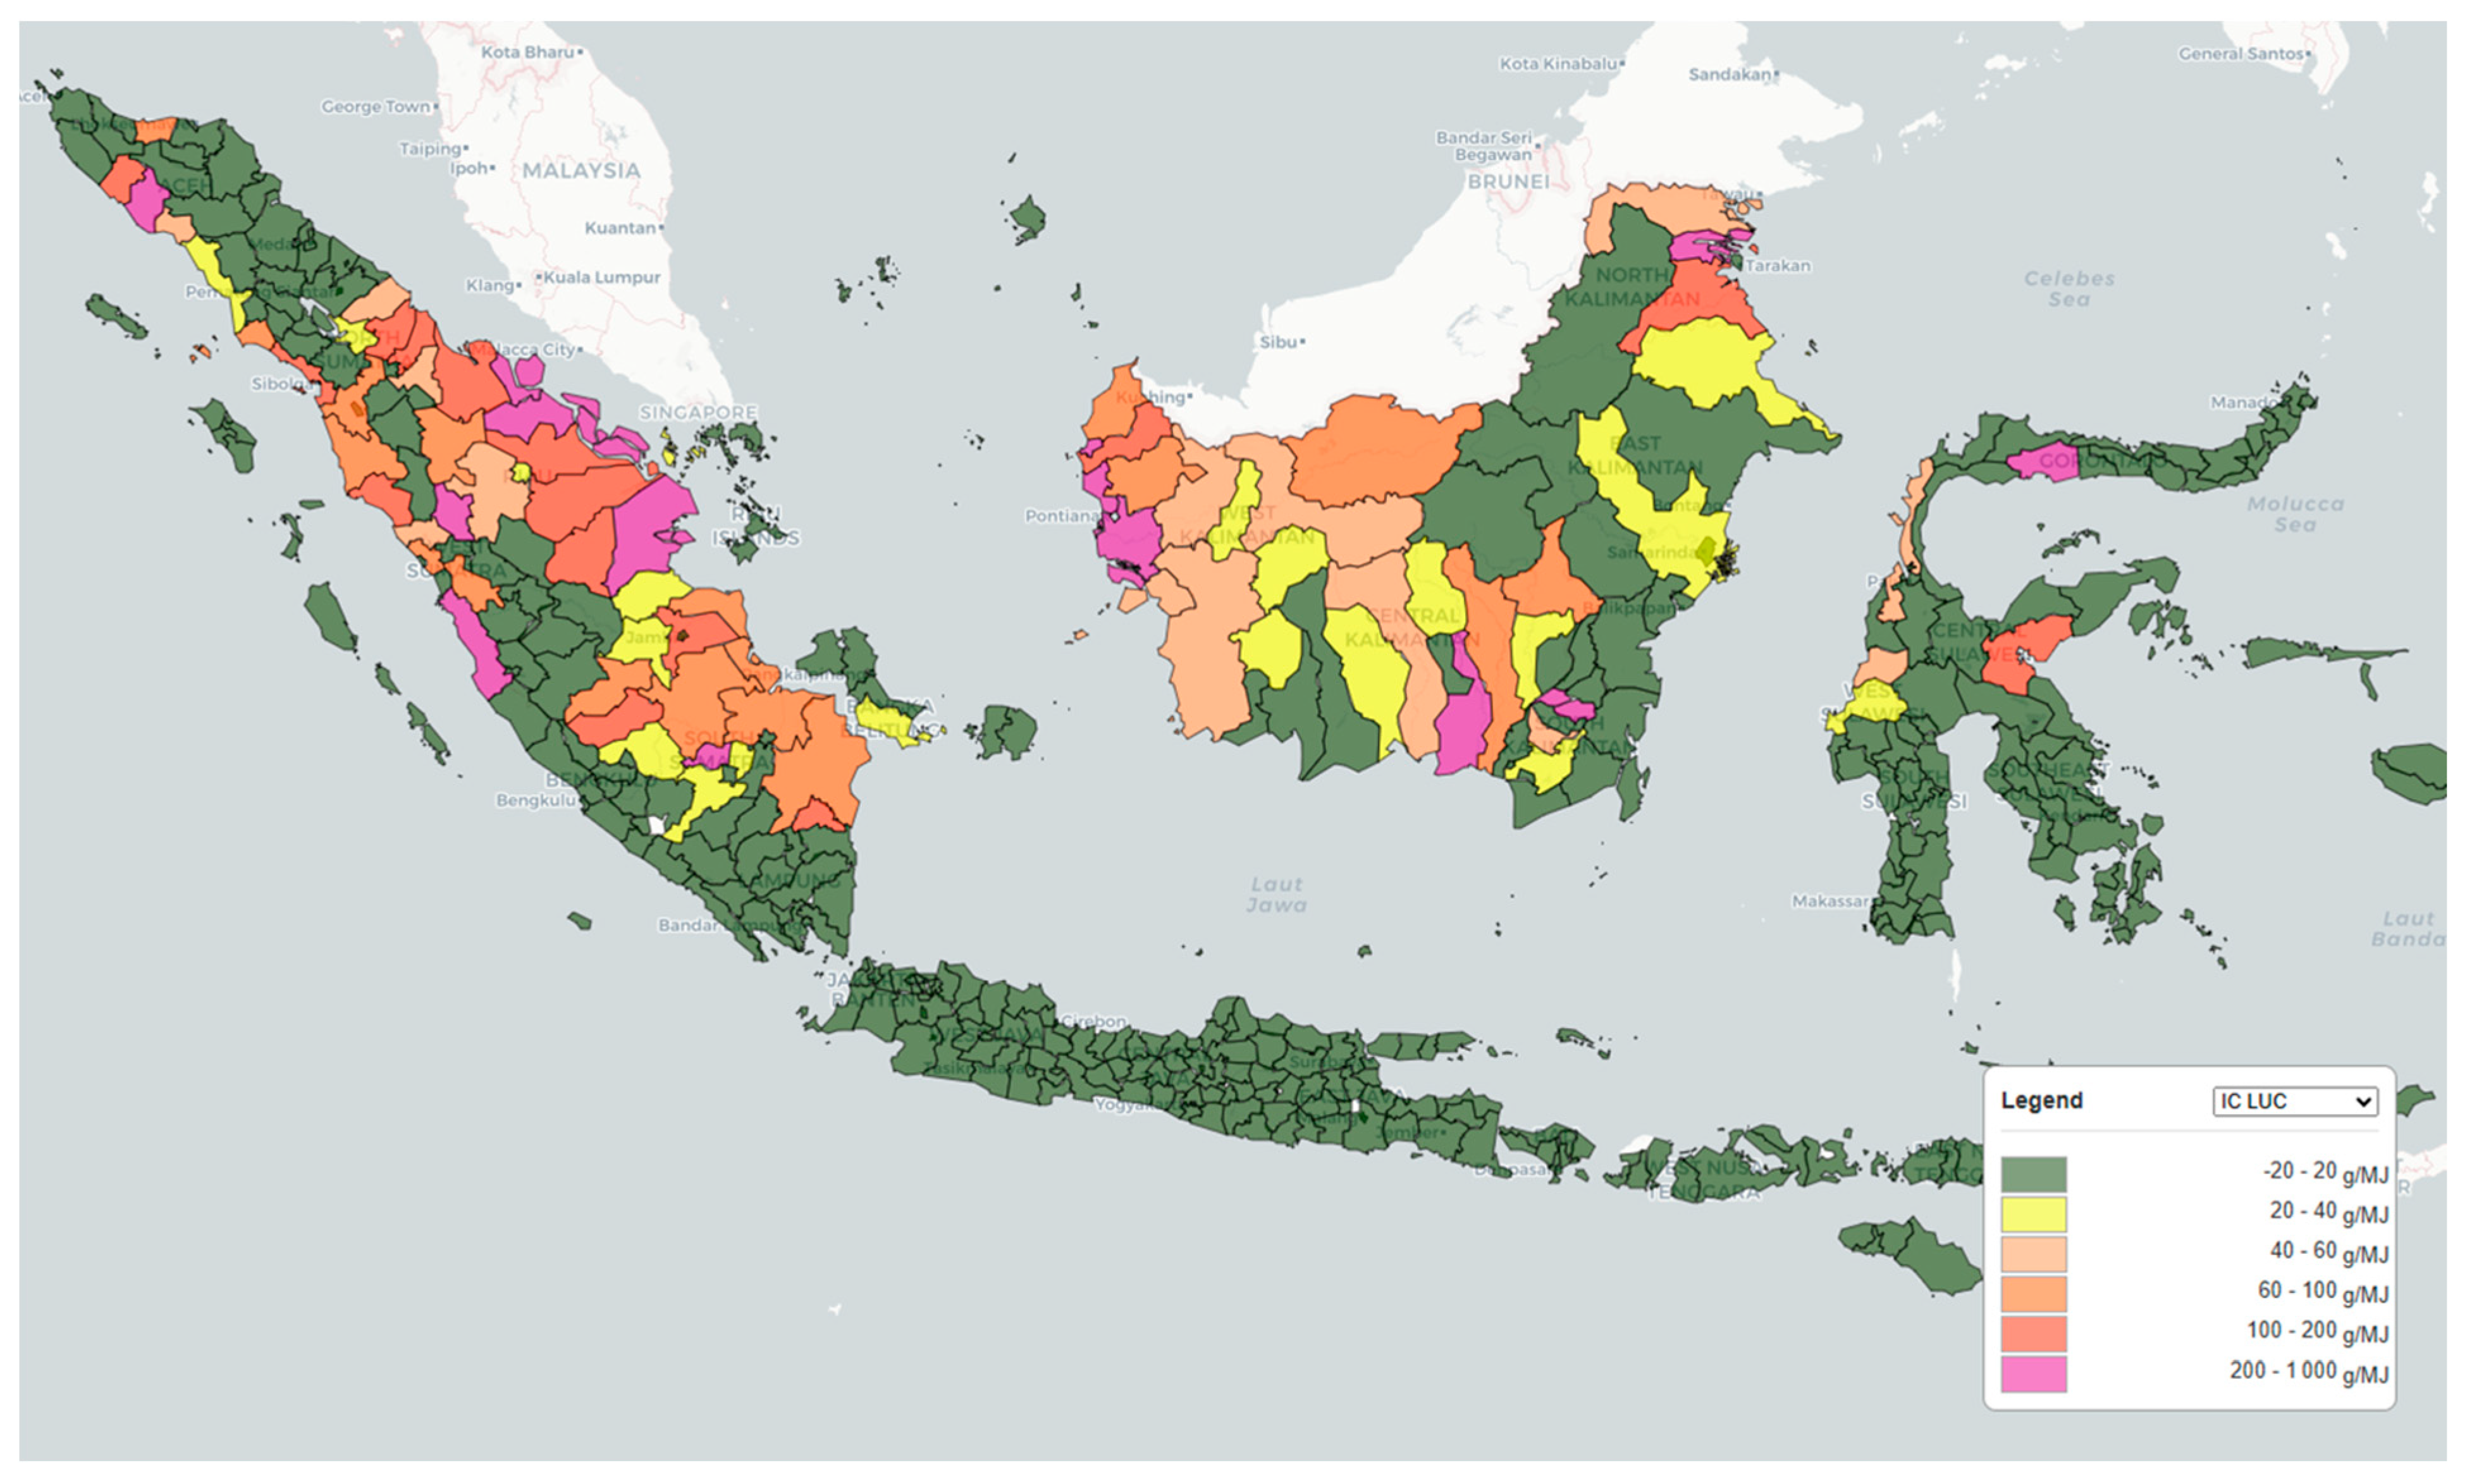
The main results of this preliminary study are presented in Figure 5 and Table 4. Table 5 further describes the CI distribution between peatland fires, LUCs, and subsidence emissions.
Figure 5 illustrates the estimated CI for every kabupaten, considering peatland conversion before and after 2003. In this Figure, only the 2022 value is considered for land use and peatland fire emissions. Very high- and high-CI kapubaten are in purple (>200 g/MJ) and darker peach (100–200 g/MJ), while green kabupaten have less than 20 g/MJ.
Not considering peatland conversion values before 2003 reduces the number of regions in purple compared to Figure 5, with the average CI for the 30 selected high-producing kabupaten decreasing from 59.8 to 44.5 g/MJ (Table 4). Inversely, when considering the five-year average values, the CI rises to 74.2 g/MJ (excluding values prior to 2003). This is attributed to a significantly lower rate of peatland fires in recent years (2 vs. 29 g/MJ) that drives up the CI when considering a longer 5-year timeframe (Table 5). Ensuring that sustainable measures are respected for long periods and encouraged thus appears critical both for the validity of the emission factor used and for achieving emission reductions in palm oil production. These regions accounted for approximately 63.4% of Indonesia’s palm oil production in 2021.
The average 44.5 g/MJ CI factor in 2022 for the 30 high production kabupaten is slightly higher than the CORSIA iLUC value for Indonesia at 39.1 g/MJ, but it is close. This appears to be mostly a coincidence, as the CORSIA’s shock size for 2035 is more than two times smaller (207.7 PJ vs. 460 PJ) than the current biofuel growth in Indonesia, even though Malaysia’s production is included. In the CORSIA model, an arbitrary value of 4.45 g/MJ was also added to compensate for the difference in carbon intensity between the GTAP-BIO and the GLOBIUM models [59]. From this perspective, many questions remain regarding the significance and validity of the CORSIA shock size value. For instance, the shock is described as additional HEFA production, but it is not clear what it implies for road fuel production, how to evaluate whether new HEFA plants replace BD production facilities, and if the BD iLUC factor should be higher, as shock size is much larger.
One reason why the CI of CORSIA’s iLUC is similar to our LUC estimation, despite a much lower shock size, is that peatland conversion by palm producers in these regions is, on average, 10.4%. This is significantly lower than the values obtained by the GTAP-BIO (33%) and GLOBIUM (20%) models. The impacts of deforestation may also be smaller in reality than those modeled by GTAP-BIO and GLOBIOM, due to efforts to limit this issue. For instance, only 5 kabupaten among the 30 biggest producers that were studied had a land use emission ratio (% of CI) in the range of these models (between 8 and 24%), while 4 had higher ratios (29–100%), 15 had ratios lower than 5%, and 4 were neglected because their global CIs were below 4 g/MJ. These ratios hold both when considering emissions for 2022 and when considering the average emissions from 2017 to 2022. More precision should be sought from this perspective, as this preliminary study did not include a detailed evaluation of the emission factors used for the various land use changes that were estimated. Nevertheless, the GTAP-BIO ratio for LUC (24%) is potentially a more appropriate value to compare with our evaluation, as the peat oxidation factor is the same (38.1 t/ha.y) and only three kabupaten in our sample have a LUC ratio that is “relatively” close to the GTAP-BIO value of 24% in 2022: 20, 29, and 30%.
The very high-CI kabupaten (>200 g/MJ) have a much higher peatland conversion rate than CORSIA value, with an average of 50.5%. Pulang Pisau, Kubu Raya, and Tana Tidung reached 84%, 79%, and 81%, respectively, in 2022, when not considering values before 2003. None of these kabupaten produces more than 500 kt/y of palm oil, and they represent less than 5% of the country’s total production. Still, combined with the high-CI kabupaten (100–200 g/MJ), they generate 4.9 Mt/y of palm oil, which leads to an estimated 24.1 Mt/y of GHG emissions (without considering biofuel or agricultural emissions). Peatland fires remain a significant issue in these kabupaten, with an average of 32.5 and 6.5 g/MJ for very high- and high-CI regions, respectively. These values are much higher when considering the last five-year average (2017–2022), 48.2 and 39 g/MJ. Peatland fire emissions, although not detailed by CORSIA, can have significant impacts in certain regions, surpassing CORSIA’s standard iLUC value, according to this evaluation based on TRASE data.
Low-CI kabupaten (<20 g/MJ) produce 7.4 Mt/y of palm oil and include seven regions that produce more than 500 kt/y. Peat subsidence, deforestation, and peat fires are limited there. When considering the average five-year values, the average CI rises sharply from 7 to 20.2 g/MJ. These results are still much lower than CORSIA’s iLUC factor, but showcase how local practices affect CI evaluation. For instance, this rise is driven primarily by three kabutaten that have much higher CI values with a 5-year average evaluation: Kotawaringin Barat (from 12.2 to 69.8 g/MJ), Kuantan Singingi (from 7.9 in 2021 to 42.7 g/MJ) and Paser (from 3 to 35 g/MJ). Five kabupaten are still below 8 g/MJ.
Although this evaluation is preliminary, the regional disparities and production volume are significant for both low- and high-/very high-LUC CIs (Table 4). The volumes are comparable or exceed those of feedstocks used worldwide for biofuels, such as animal fats, UCO, and rapeseed oil (Figure 4). Regional disparities indicate CI values that are several times higher or lower than CORSIA’s iLUC factors. Therefore, since regional data are available, using country-level data to assess the palm oil CI for biofuels does not seem justified in this case. Regional data should be prioritized.
From another perspective, the comparison between the LUC and iLUC was initially considered a simple benchmarking exercise because it did not include projections for production growth. However, as CORSIA’s iLUC emissions for Indonesia are mainly due to peatland oxidation (76%), indirect emissions do not appear to significantly impact our results when comparing them to CORSIA’s.

3.3.4. Uncertainties About the Positive Environmental Impact of Animal Fat and Low LUC/iLUC Feedstocks

If the valorization of low-iLUC feedstocks, such as tallow, yellow grease, and even forest residues, for other SAF pathways is prioritized, biofuel mandates that favor these resources may also generate economic advantages for industries that are susceptible to causing deforestation and direct land usage changes, for instance beef and some forestry industries.
Cattle are by far the biggest generator of deforestation for agriculture-linked commodities globally, being responsible for 451 thousand square kilometers from 2001 to 2015 [80,90]. Even though negative land use change associated with beef production has been acknowledged for a long time [91], cattle farming expansion and land speculation led to a further 60% increase in deforestation in Brazil from 2016 to 2020 [90]. As a result of an increased biofuel demand, beef tallow imports to the U.S. from Brazil have increased dramatically by 377% between January and April 2024 (from 23 kt to 110 kt), compared to 2023 [92]. To our knowledge, the evaluation of the impact of the direct land use change of cattle deforestation and its related attribution to tallow has not been discussed in the CORSIA framework, and no published study from GREET has rigorously estimated the extent of the issue. A similar evaluation for PFAD iLUC related to palm oil production has, however, been done by GREET [71]. Through the work of organizations such as Trase, World Resources Institute, and Global Forest Watch, the traceability of companies with activities that lead to direct land use changes is rising. Efforts to quantify the market share of tallow feedstock from cattle that causes direct land use changes should thus be sought.

3.3.5. Market Share Importance in Carbon Intensity Evaluation

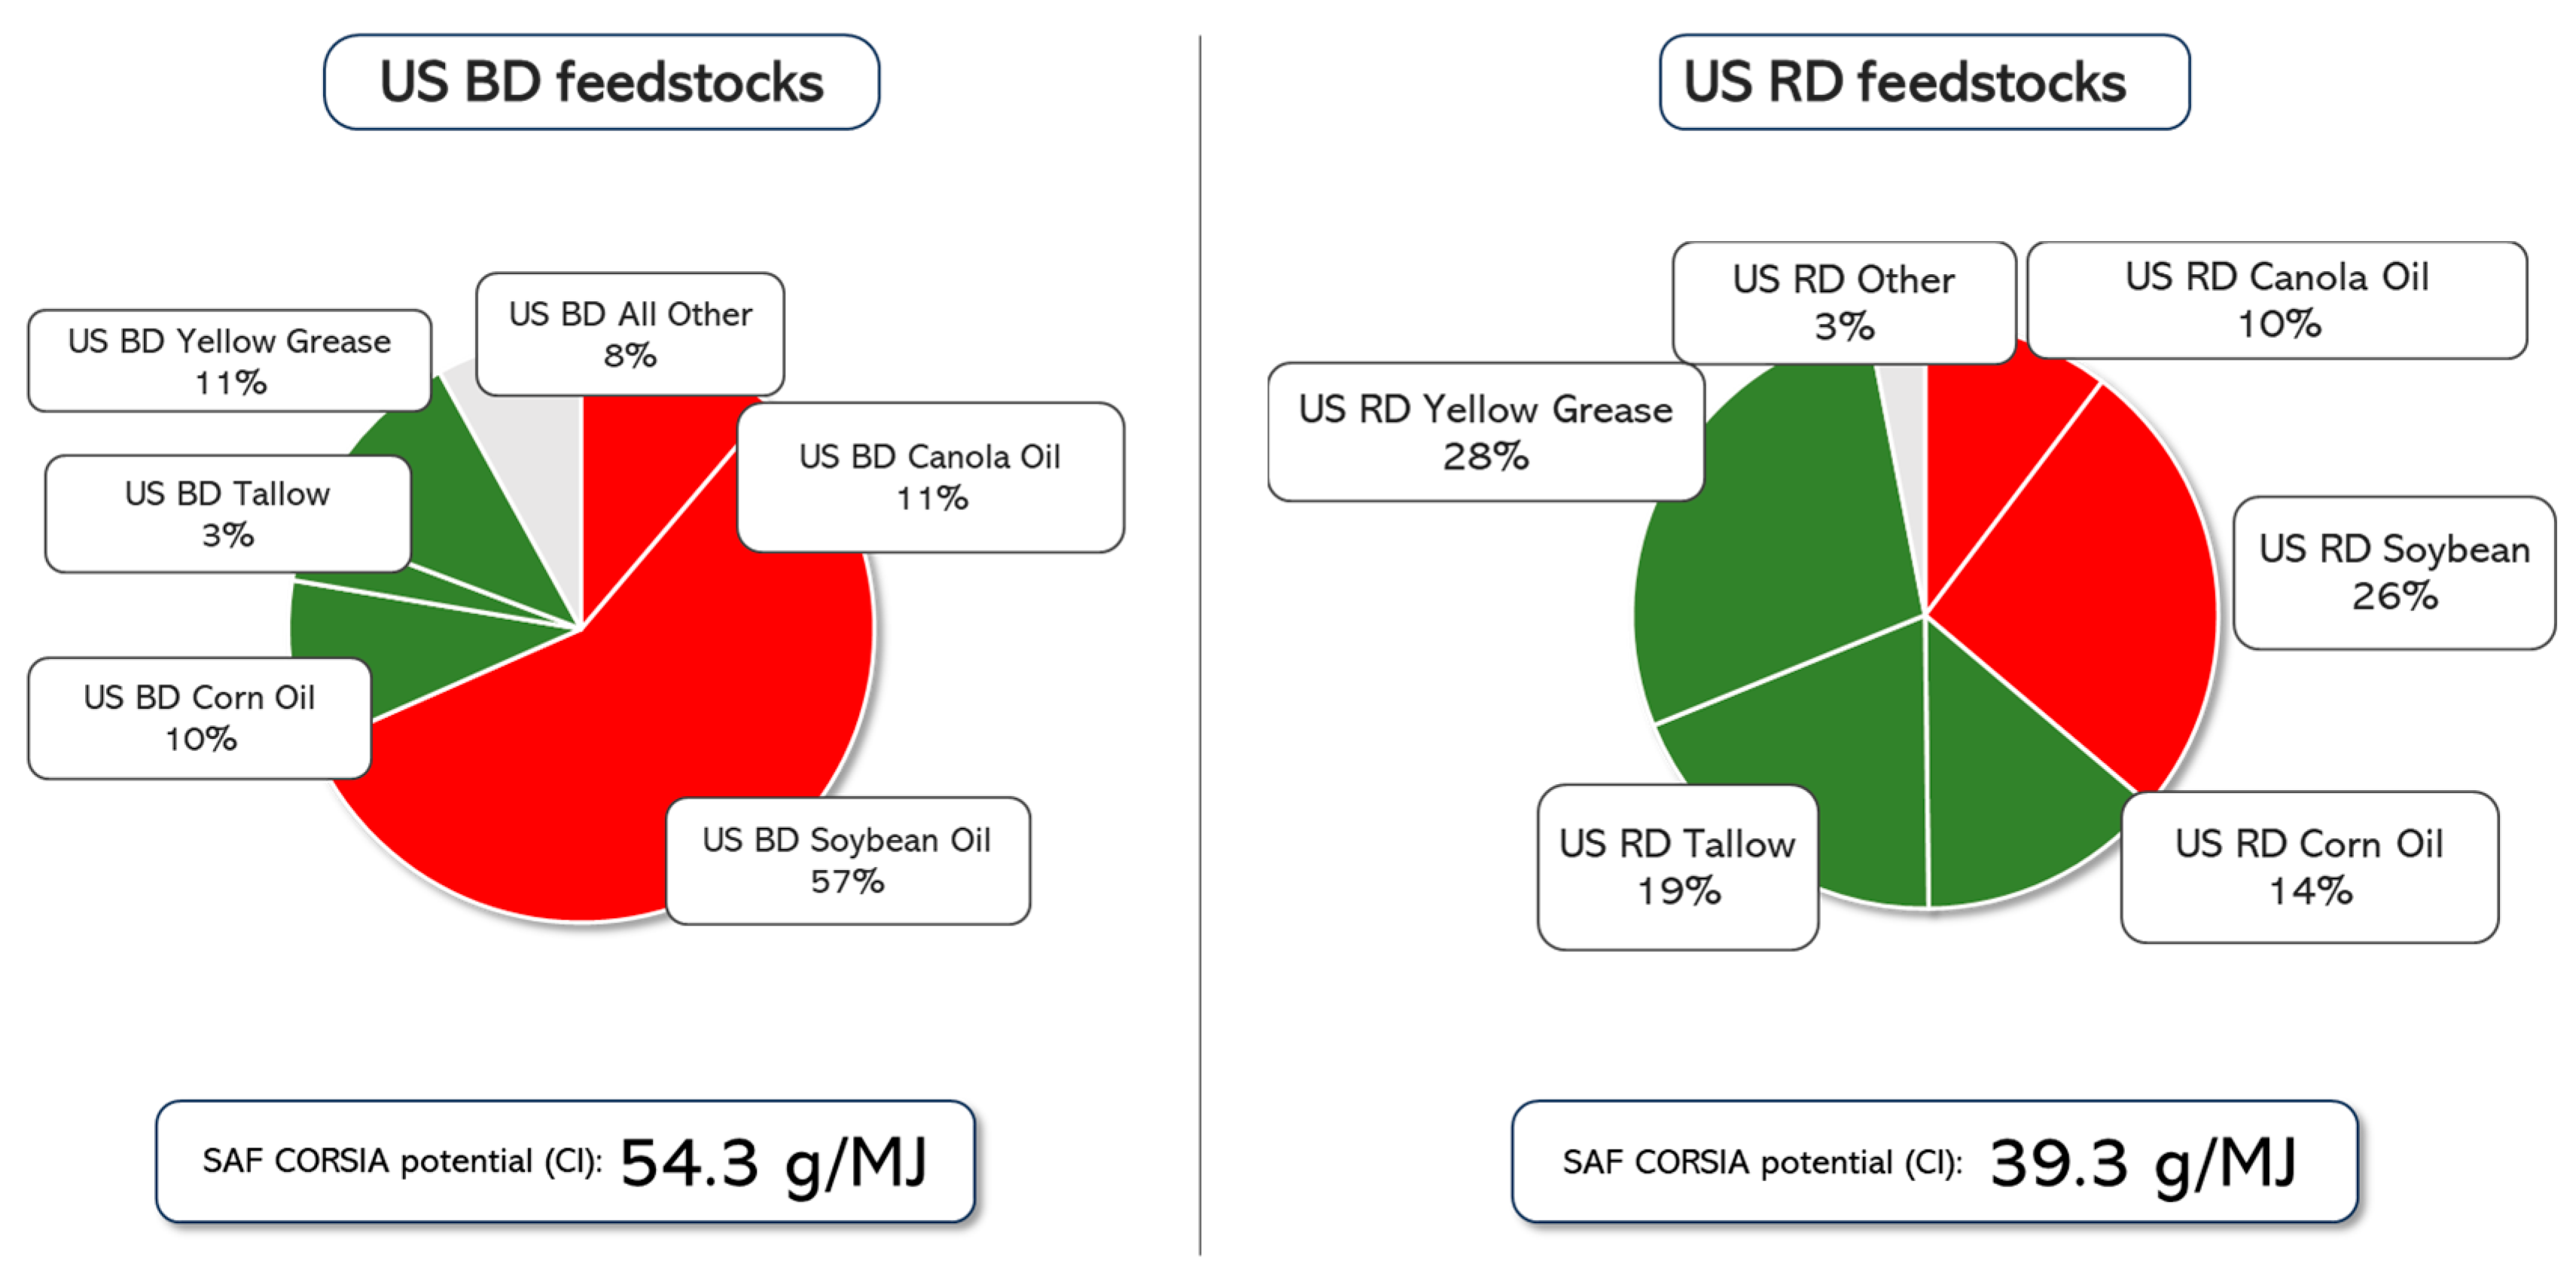
One under-discussed critical factor in understanding carbon intensity evaluation is the related process market and resource shares. This factor is particularly relevant for the HEFA-tJ/BD/RD pathways, as many primary resources are usually used simultaneously in a plant, and the ratio of the different resources involved significantly affects a plant’s carbon intensity. In 2021, the National Biodiesel Board (NBB) surveyed 60% of the U.S. BD plants (27 plants) and five RD plants [93]. It was revealed that 13 BD plants used only vegetable oil, while the others used a mixture of vegetable oil, tallow, and yellow grease, amongst other resources. Less data on resource usage distribution were discussed for RD to maintain company confidentiality. Nevertheless, Gerveni et al. [94] published estimations of resource usage for BD and RD according to USDA values for between 2011 and 2023 (Figure 6 relates to resource shares in 2023). From these values and the carbon intensity associated with different resources (Table 2), the average carbon intensity of allocating the current feed from a BD/RD process plant to SAF production can be estimated.
Converting a BD plant to an SAF plant, compared to converting it to an RD plant, is not straightforward, but it is discussed here as the NREL State of Industries for HEFA claimed that 57% of renewable diesel was produced from soybean oil [11]. However, according to the data presented in Figure 6, this value belongs to biodiesel production. It is, thus, not representative of RD and illustrates the dire need for adequate resource share evaluation when estimating processes’ carbon intensity. Soybean oil represents a much smaller share of RD production at 26%. Considering a higher ratio of soybean and canola oil means that significant additional and expensive efforts are necessary to lower the CI by, for example, reducing hydrogen production emissions (around 11 g/MJ) to achieve at least 50% carbon intensity reduction.
Thus, the U.S. BD and RD resource share carbon intensities were estimated according to CORSIA standard values if used for SAF (core + iLUC). The carbon intensity of other resources (in grey) is disregarded, as their nature is unknown. With mitigated emission reduction potential, soybean oil and canola oil are in red, and high-GHG-reduction-potential resources are in green. An average carbon intensity of 54.3 g/MJ for the biodiesel resource shares was calculated for potential SAF production. This represents a 39% reduction in carbon intensity, which is insufficient to reach a 50% GHG reduction.
Using RD resource shares, an average carbon intensity of 39.3 g/MJ was estimated. This represents a 56% reduction in carbon intensity. Compared to BD plants, RD plants are more amenable to transition to SAF plants. According to the SAF Grand Challenge’s carbon reduction goals and today’s standards (CORSIA), an RD plant using the average resource share in the U.S. would thus be adequate for SAF production. Greening hydrogen production can further reduce the carbon intensity. It is, however, not mandatory at present for the average plant. Inversely, a plant using 57% soybean oil would not be adequate for SAF production (BD case example). The latter could incorporate more sustainable resources, or delay until better scientific consensus on iLUC leads to a lower iLUC estimation, which may not occur.

3.4. Shifting Production from HEFA-Road to HEFA-tJ Can Potentially Reduce the Environmental Benefits of Fuel Production from Vegetable Oils

3.4.1. Yield Impacts on Carbon Intensity

Yield is an essential component of carbon intensity, as this indicator considers a process’s global life-cycle emissions divided by the production that is generated. It is, for example, well known that the carbon intensity of ethanol production in the U.S. has dropped significantly, partly due to agricultural yield improvement and partly due to a higher rate of plants selling dry distiller grains—both of which are increasing global yields [60,84,95].
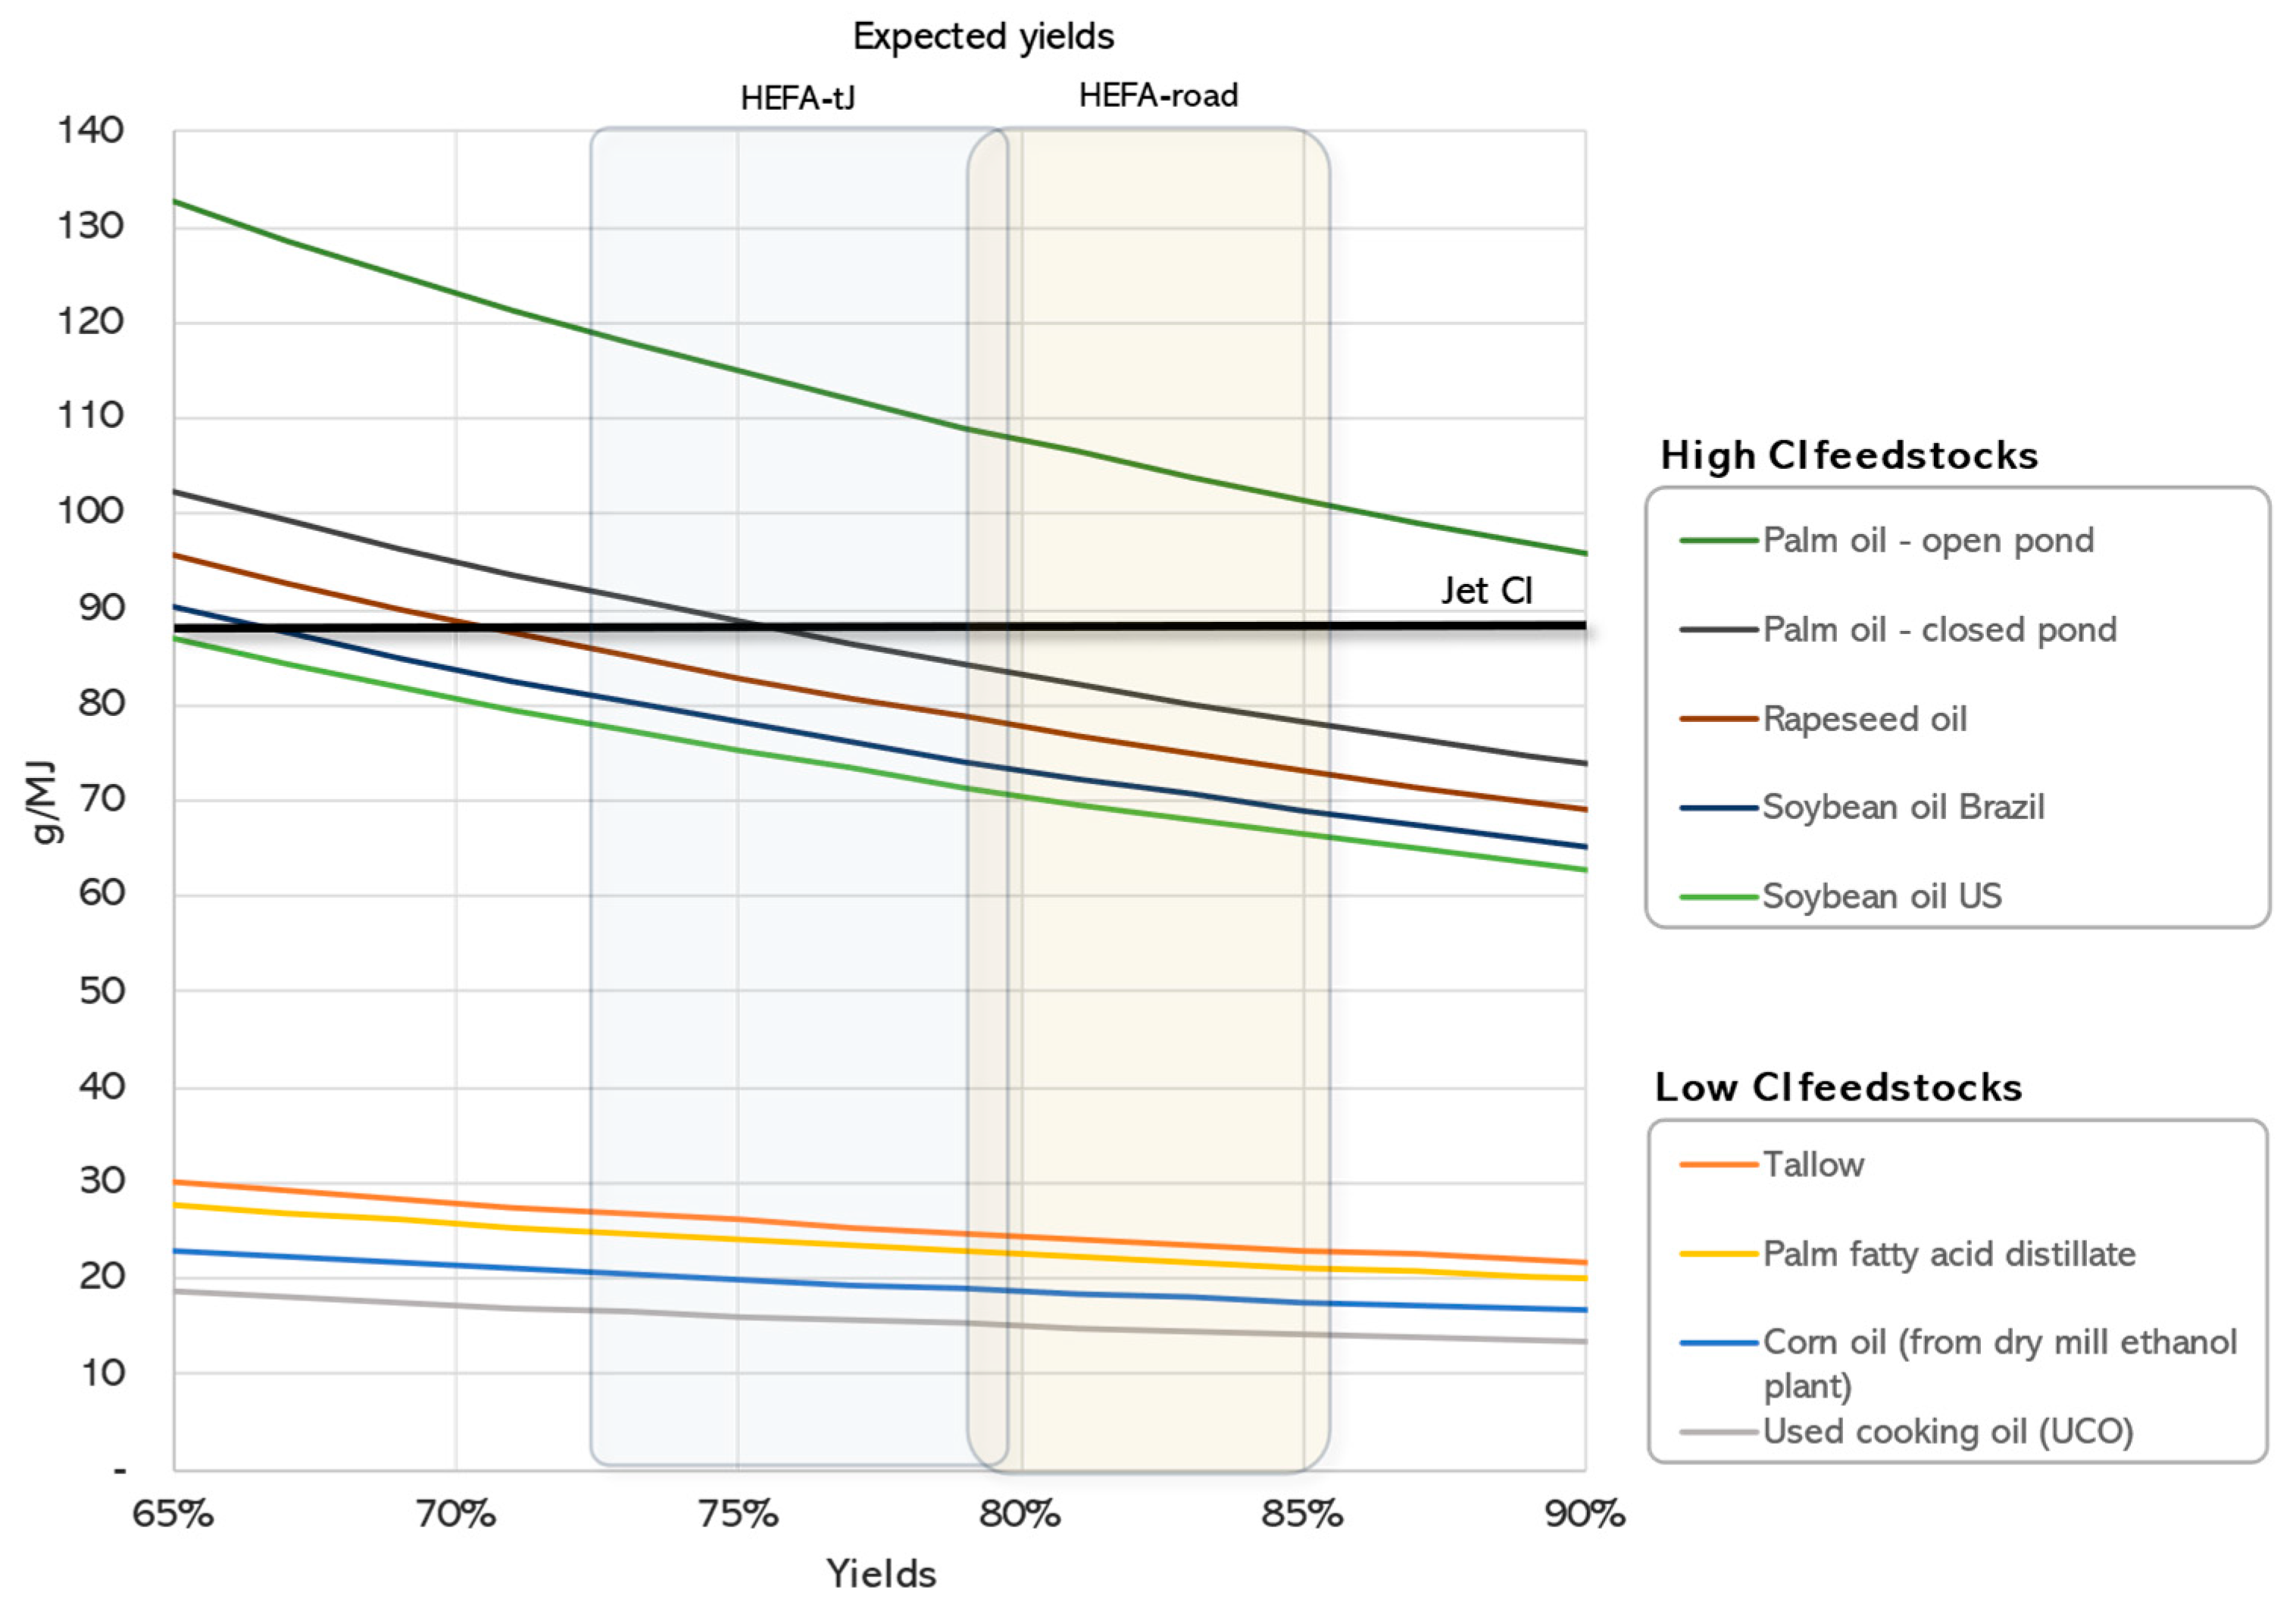
Inversely, HEFA-tJ yield losses from naphtha conversion and inner refinery gas usage can increase the pathway’s carbon intensity. Significant uncertainties in our yield estimates exist, as our data cover a wide range of values for byproduct naphtha and refinery gas (Table 1). The exact chemical composition and real market potential can profoundly affect yield values. As these data are often kept confidential regarding commercial or emerging HEFA-tJ technologies, evaluating how yield variations affect carbon intensity is challenging but necessary. Figure 7 illustrates how yield variations for HEFA-tJ affect the carbon intensity of the HEFA-tJ pathway when it is undertaken with various resources. Carbon intensity calculations for different yields can be evaluated simply, by a rule of three, based on the CORSIA data. The results of these yield variations—from 87 to 73%, for instance—show few effects for those resources that already have a low carbon intensity. For example, HEFA-tJ from tallow varies by 4.32 g/MJ, and UCO by 2.67 g/MJ. However, much more significant effects are observed for palm oil, with and without open ponds, which vary by 14–19 g/MJ. Reliable and transparent data on the yield variation effect and influencing factors are thus mandatory for rigorous carbon intensity evaluation, as these variations have high impacts on sustainability estimations. CORSIA is a valuable tool for SAF carbon intensity evaluation, with transparent data for the overall carbon emission sources of the different pathways [18]. However, only one value for yield is given for each path, and no detail is given on the assumptions made and their uncertainties. The NREL State of Industries (SOI) for HEFA acknowledges that yield variations lead to a variable carbon intensity between the RD and the HEFA-tJ pathways [11]. Not many details on the factors that influence those yields are given, and the impact of yield variation on the iLUC factor is neglected, which significantly reduces the influence of the yield on the carbon intensity.
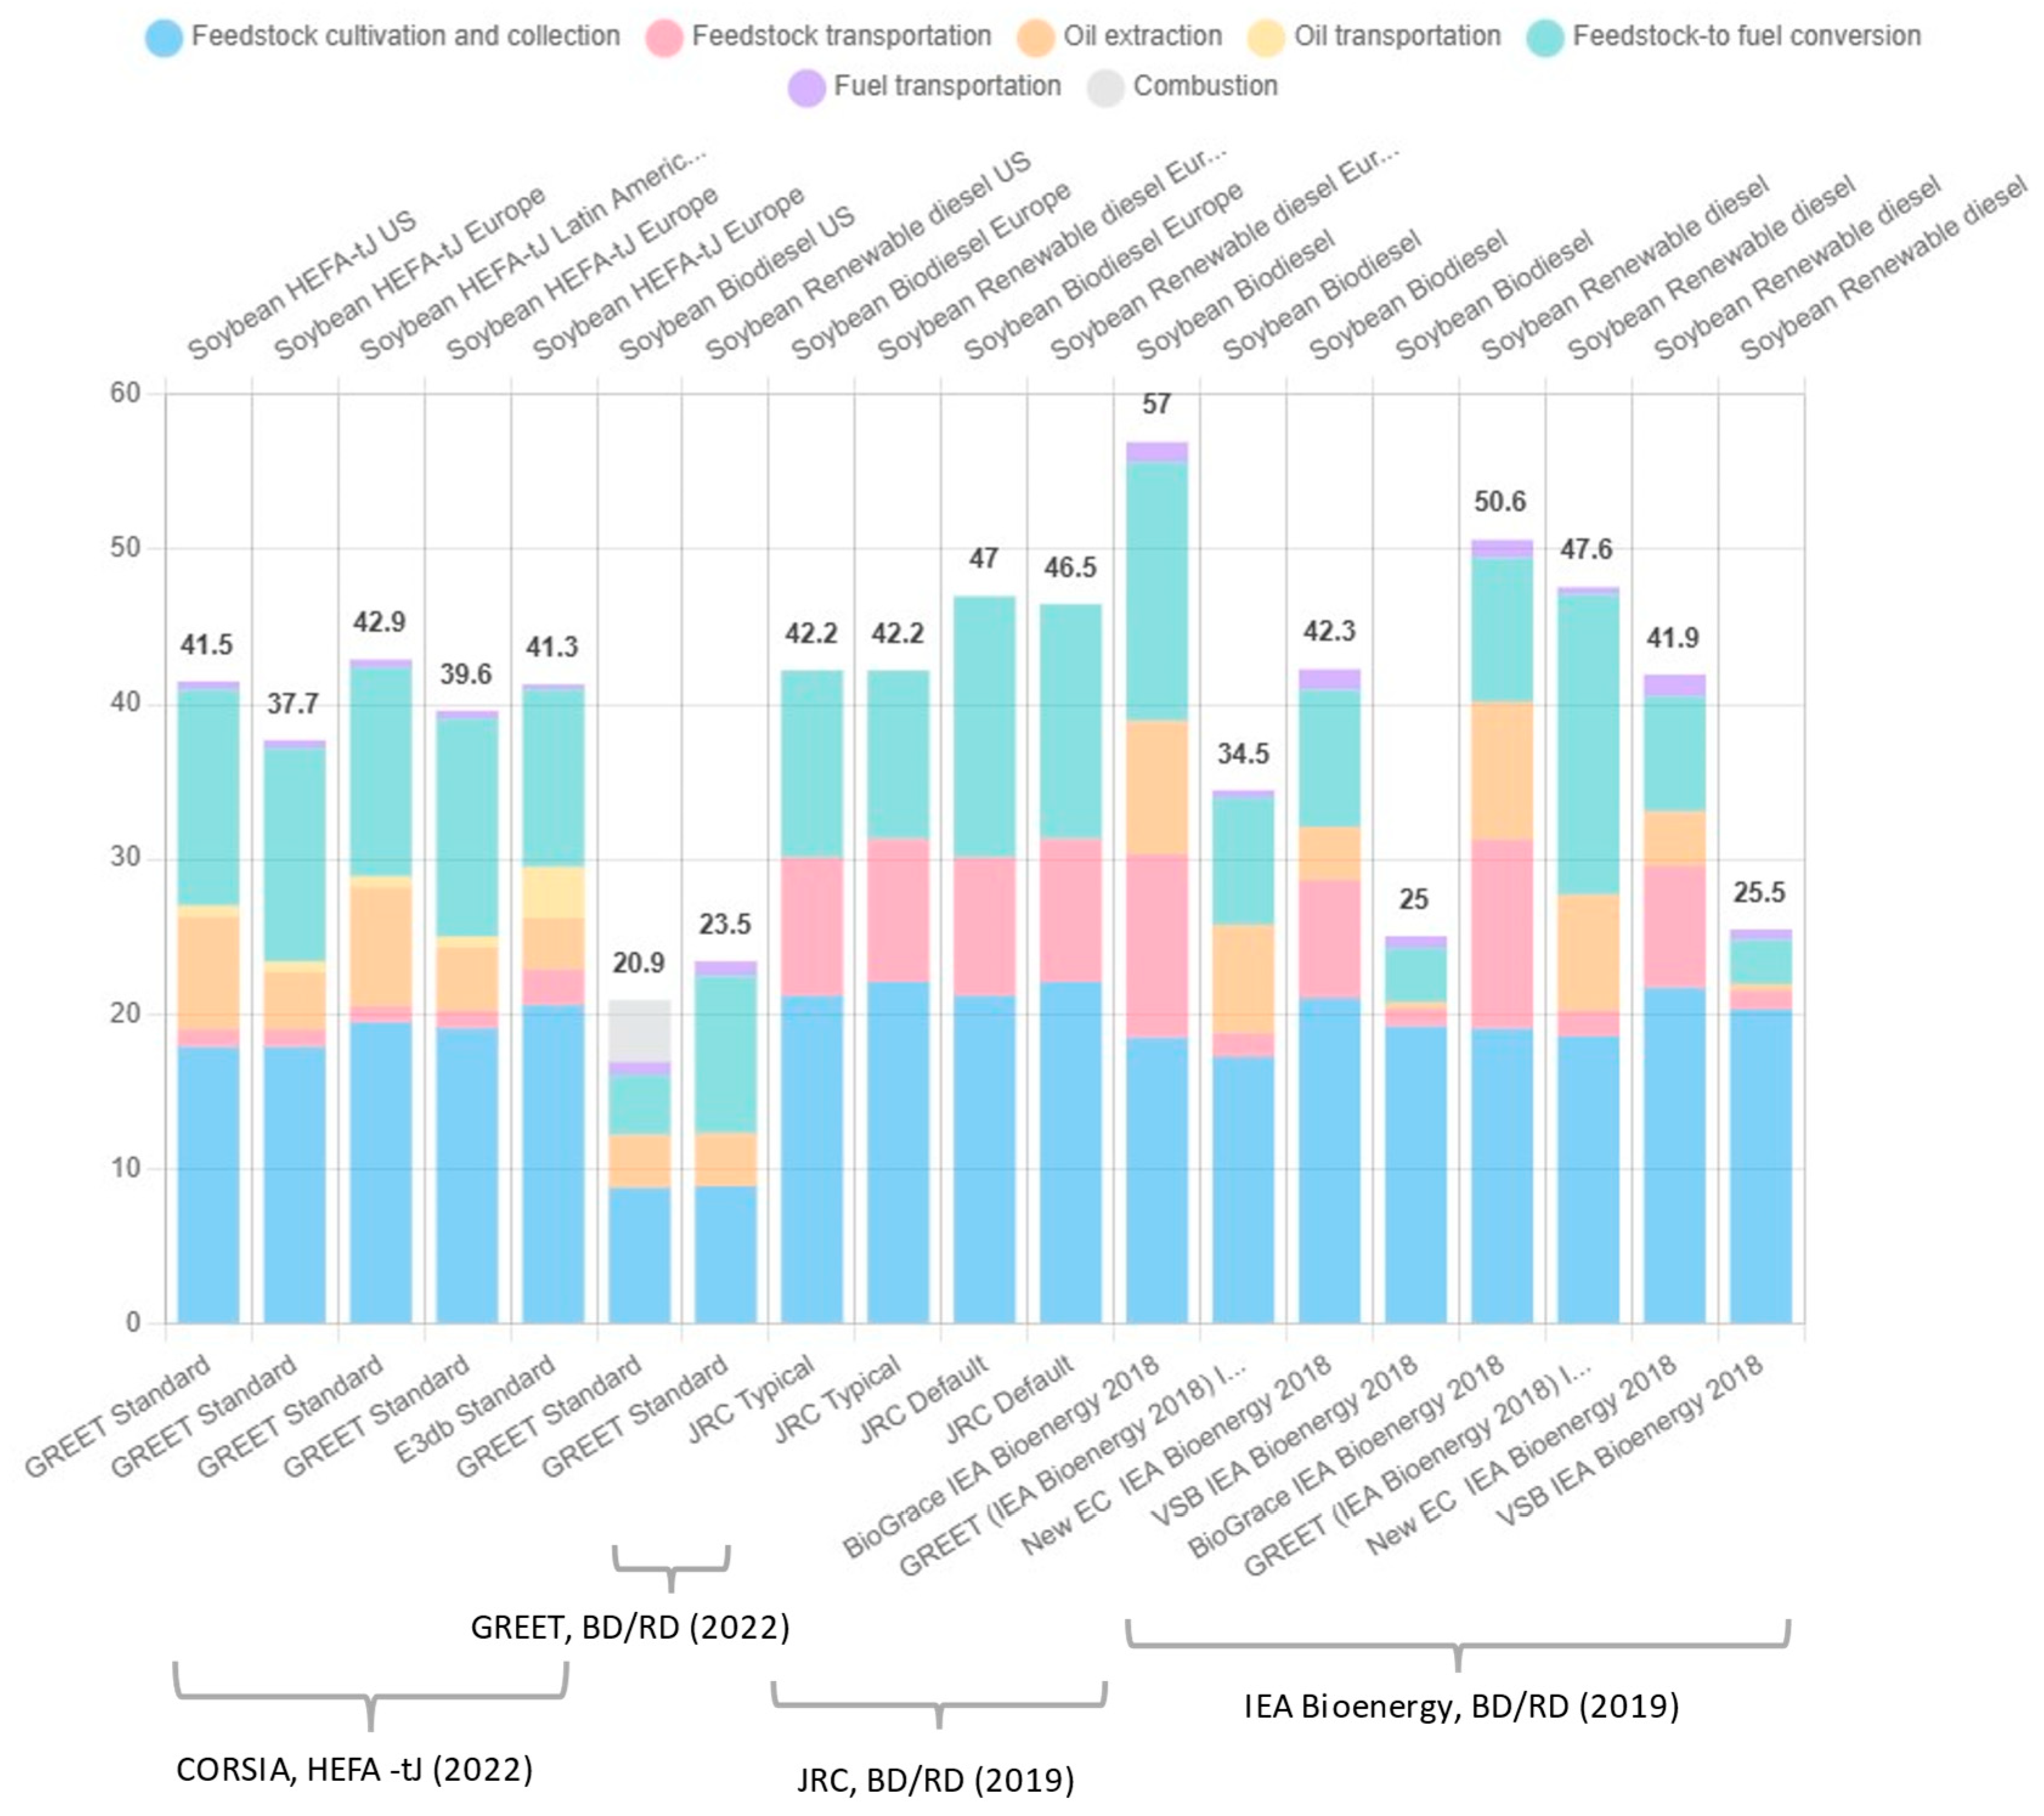
In the literature, only the Renewable National Laboratory’s State of Industry (NREL SOI) [11] has attempted any comparative evaluation of the carbon intensity between BD/RD and HEFA-tJ fuels. Several past carbon intensity evaluations for road fuels are, however, available (Figure 8), such as those from GREET and the Joint Research Center (JRC) and an IEA Bioenergy review of data from several past assessments [93,96,97]. Comparing and discussing carbon intensity evaluations of HEFA-tJ conducted with road fuels is necessary as, otherwise, the impression may be given that evaluators have a biased perspective towards air fuels.
For instance, with the exception of evaluations by the GREET model and the Brazilian Virtual Sugarcane Biorefineries (VSB) [97], all BD/RD carbon intensities are estimated to be slightly higher than those of the CORSIA evaluations (without iLUC). For example, JRC (Europe) and GREET (US) considered values of 22.1 g/MJ and 18.6 g/MJ for feedstock cultivation-gathering for RD, while the HEFA-tJ CORSIA values are lower at 20.6 g/MJ (Europe) and 17.9 g/MJ (U.S.). The yield variation impacts on the carbon intensity of oil extraction or feedstock conversion are also unclear for. Globally, the inverse tendency should be observed, with a slightly higher carbon intensity for SAF, as its yield and hydrogen usage disfavor HEFA-tJ [11]. The standardization of carbon intensity evaluations, and the clarification of differences across processes that use the same operational units, would give more transparency to such evaluations.
The primary factor that leads to a higher carbon intensity evaluation for road fuels, however, is the consideration of oil transportation emissions, for which the value is around 9–12 g/MJ for BD/RD compared to approximately 2 g/MJ for CORSIA (in pink). From this perspective, it is worth noting that American producers expect future HEFA-tJ and road fuel production to come mostly from international importation [11]. This would raise transport emissions, as the evaluations from GREET considered only local feedstocks, for instance [97].

3.4.2. Yield Effects on GHG Reduction

The impacts of yield on environmental sustainability go far beyond the carbon intensity. If SAF fuel norms concern carbon intensity (g/MJ), countries’ climate goals and sustainable investments aim to reduce GHG emissions (t/y). Comparing only the carbon intensity of products gives a limited perspective on the best resource usage, as it does not consider how efficient different processes are at converting feedstocks. To our knowledge, Staples et al. are the only ones to have compared the GHG reduction potential of various feedstocks [98,99]. These studies offered a global perspective on the efficiency of converting biomass to heat and power or fuels and the efficiency of jet fuel production from various feedstocks (wood, corn, and vegetable oil). However, they did not compare how different processes using the same feedstock for biofuels affect the GHG reduction potential, nor did they evaluate the impact of varying parameters within a single process.
The GHG emission reduction for a project (Equation (4)) can be estimated from the carbon intensity (CI) of the sustainable fuel (sust.) versus the conventional fuel (conv.) and the total production (P). The latter varies with the yield (Equation (5)), and a comparison of the GHG emission reduction of different technologies can be made by considering the same quantity of process input.
G H G   e m i s s i o n   r e d u c t i o n = P c o n v . M J C I c o n v . P s u s t . M J C I s u s t .
P r o d u c t i o n P = I n p u t M J y i e l d
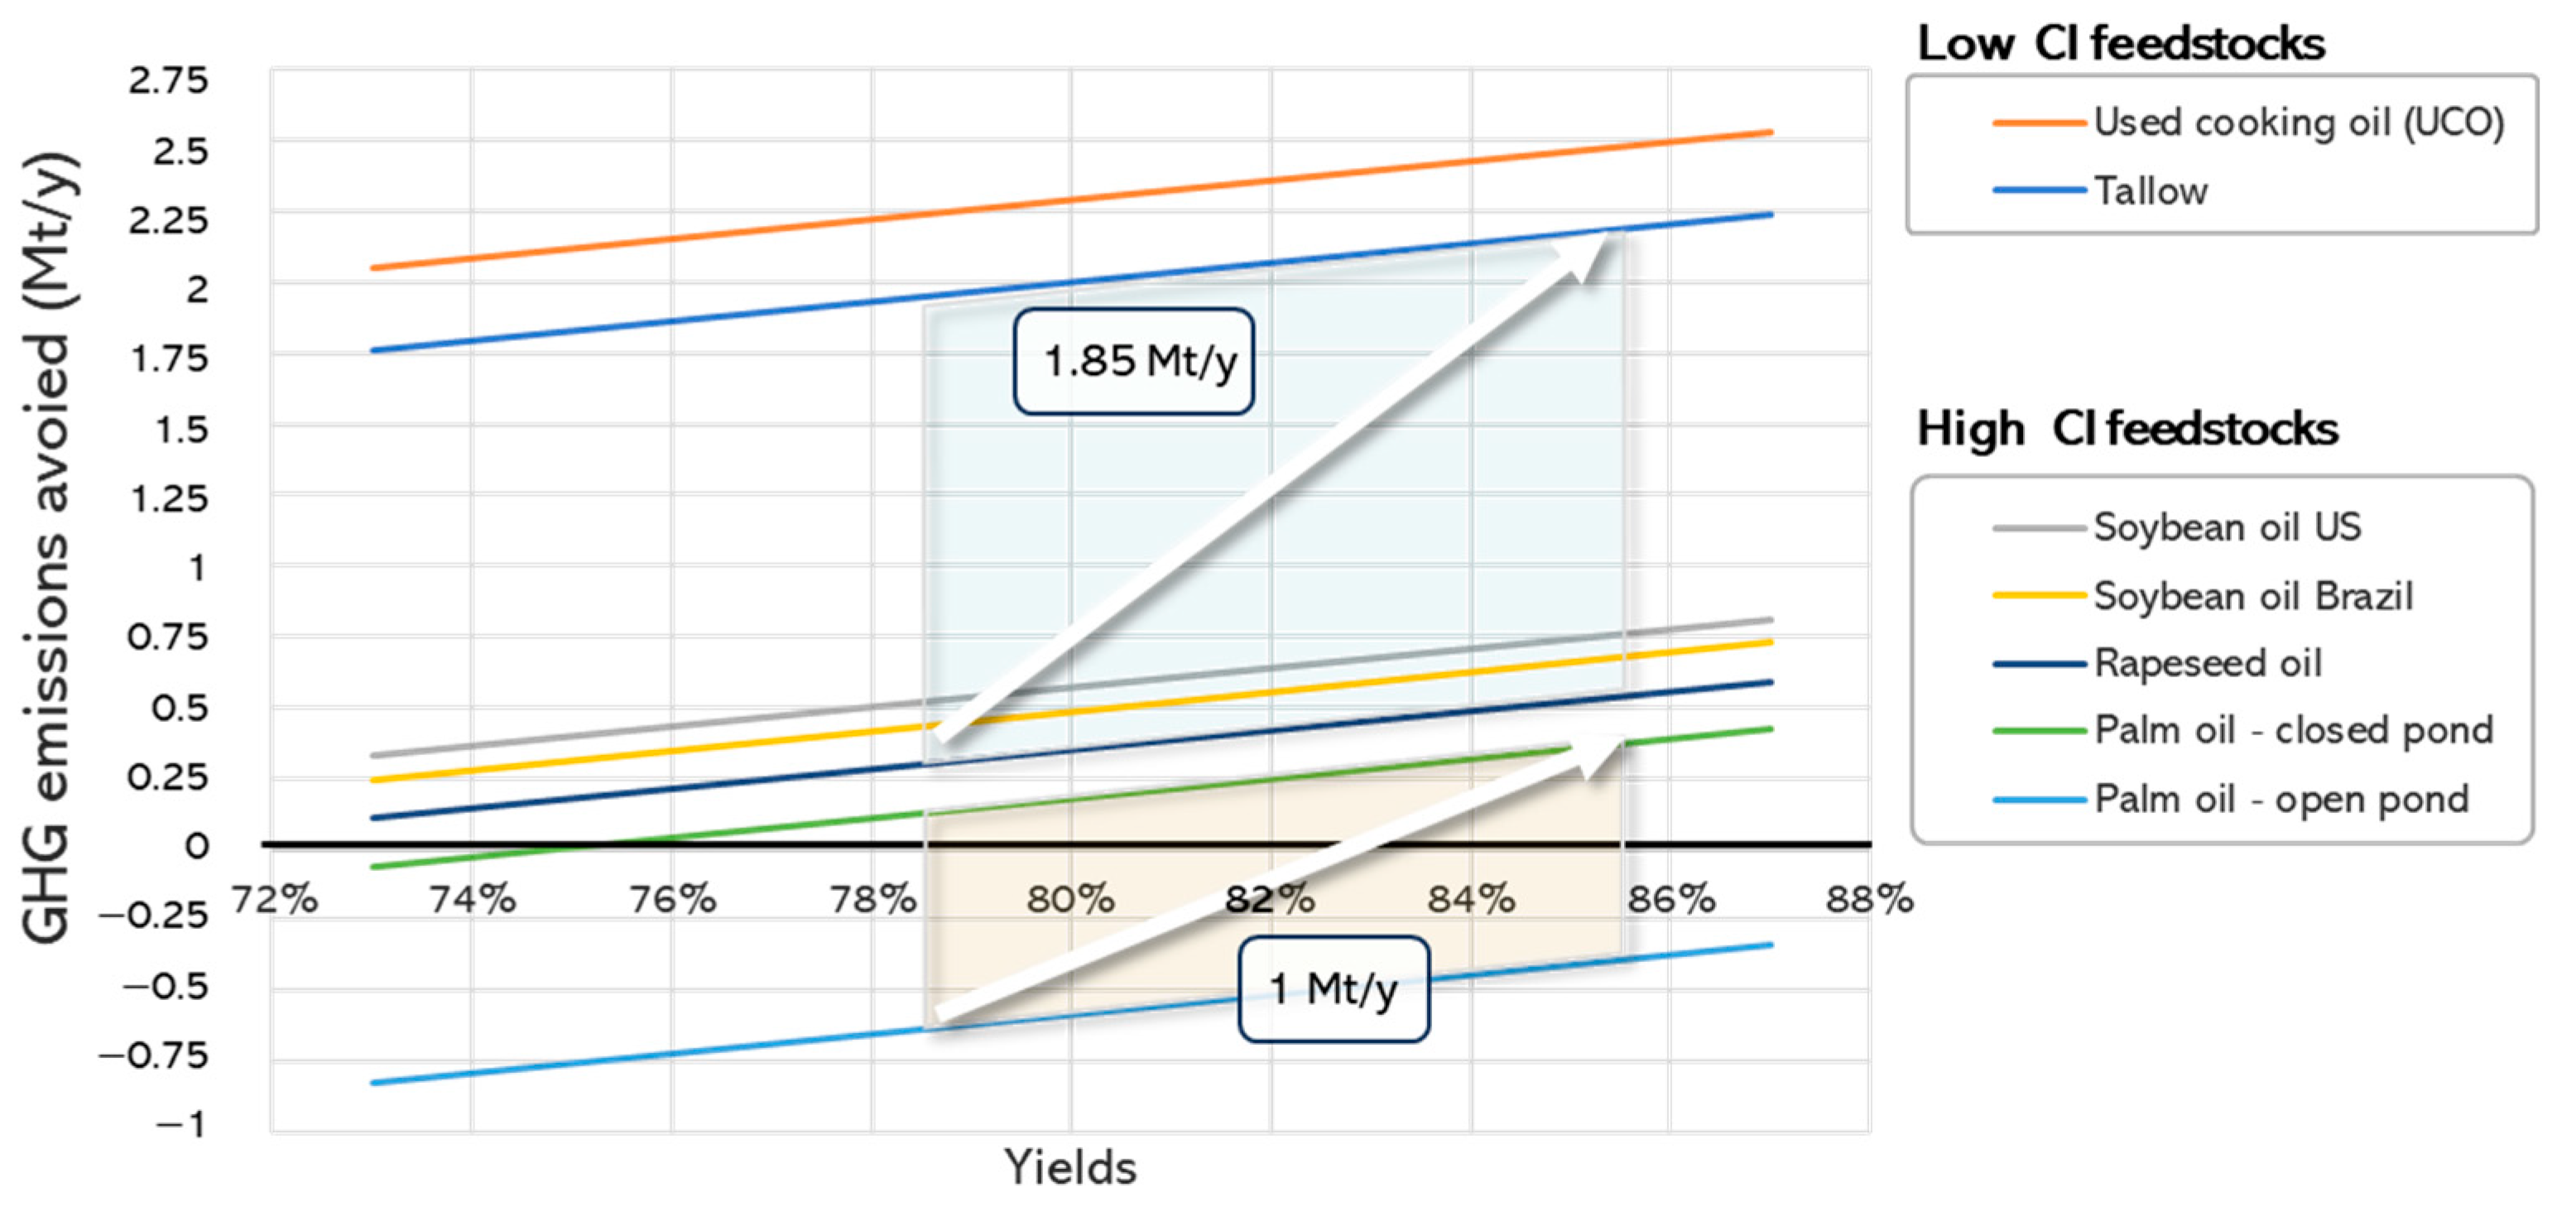
Modelling the GHG reduction associated with various resources and yield variations is straightforward, as illustrated in Figure 9 for a standard 900 kt/y plant. The 73% and 81% yields correspond to our estimate for HEFA-tJ and HEFA-road yields, while the 87% yield is our estimate for CORSIA. As a relevant example, we considered a scenario between our estimation and CORSIA: an 85% yield for RD and a 79% yield for SAF. The model is necessarily a simplification to illustrate the critical importance of the yield, the fate of byproduct streams, and the feedstock choice.
In Figure 9, hydrogen usage is neglected. It is expected to be higher for HEFA-tJ than RD, which leads to more GHG emissions (steam methane reforming is the expected method with emissions of CO2 of 10 t/t of hydrogen). From the study by Zeck et al. [20], it can be observed that around 5.4 kt of additional hydrogen would be needed for the HEFA-tJ pathway compared to the HEFA-road pathway, which would result in approximately 54 kt less CO2-equivalent emission reductions. Conversely, as the refinery gas production is higher in the HEFA-tJ pathway, it is expected to be reformed internally to lower hydrogen production emissions [44], which makes preliminary estimations more complex. The conversion of naphtha to chemicals also necessitates high thermal energies, but leads to carbon sequestration if the plastic is not incinerated or used for energy at its end of life [100,101]. The fossil emissions associated with conventional diesel are higher than those of jet and, from Equation (4), it is evident that replacing diesel generates a slightly higher GHG reduction than replacing jet fuels. Globally, however, the results presented in Figure 9 are significant enough to neglect those considerations.
First, as both carbon intensity and GHG reduction calculations depend on yield, the slope related to every resource feedstock is the same. Shifting from RD (85% yield) to HEFA-tJ (79% yield) leads the model to predict more than 200 kt/y in avoided differences for a standard HEFA plant using 900 kt of oil. Scenarios in which naphtha is valorized as a fuel additive or refinery gas is sold would be closer to the CORSIA’s scenario. Higher, i.e., more pessimistic, values for the yield difference between the two pathways lead to higher avoided GHG emission differences.
Figure 9 also shows that investments to increase the feedstock shares for the use of UCO and tallow for BD and RD production have a higher GHG reduction potential than building new HEFA-tJ plants using low-GHG reduction resources. A new rapeseed oil HEFA-tJ plant would lead to a GHG reduction of approximately 300 kt/y, while replacing an equivalent quantity of rapeseed oil by tallow leads to a reduction of more than 1.85 Mt/y GHG. Even with CORSIA’s data that indicate a 87% yield, replacing a plant-size quantity of rapeseed oil with tallow for RD, for instance, generates an avoided difference of 1.65 Mt/y, which is several times more efficient than building a new SAF plant with soybean, rapeseed, or palm oils. Economically, changing a plant’s feedstock necessitates much lower investment and market risk than building a new plant. Substituting high-CI feedstocks with tallow or UCO, however, poses important availability challenges. Exploring new technologies might enlarge the usage of other low-CI feedstocks.

3.5. Technology Adoption and Development to Increase Lipid-Based Fuel GHG Reduction Efficiency and Competitiveness

Several means to reduce production costs and lower the GHG emissions of commercially available pathways for air and road lipid-based biofuels have been discussed in the literature or can be envisioned. These relate generally to the adoption of new lipid conversion and hydrogen generation processes for biofuel production. Methane capture for palm oil plants is another alternative. A brief review of the expected advantages of these technologies is given. The focus is not on systematically evaluating every potential option and whether the claimed economic benefits are justified, but rather on illustrating some common challenges related to the adoption and development of more efficient technologies.

3.5.1. Reducing Palm Oil Production’s Environmental Impact by Capturing Methane from Effluent Treatment Is a Less Capital-Intensive and More Efficient Way to Reduce Global GHG Emissions than Producing HEFA-tJ

Methane capture for palm oil could be an effective way to reduce GHG emissions. Indonesia and Malaysia produce around 68 Mt of palm oil annually, and the GHG emissions associated with palm oil production are estimated to be more than 1.75 t/t; these emissions are higher without methane capture [69]. As illustrated in Figure 9, more than 1 Mt/y can be avoided if all palm oil used by a plant were to involve palm oil plants with closed ponds. The positive effect is several times higher than that of a new HEFA-tJ plant with a low GHG emission reduction potential (350–550 kt/y avoided). As discussed in Section 3.3.3, we also estimate that at least 4 million tons of palm oil generate a LUC lower than 8 g/MJ, and sustained efforts could bring several kabupaten to reach less than 20 g/MJ in the coming years. Analyses must go deeper both for palm oil and other feedstocks. Still, significant quantities of palm oil could be used at lower (around 47 g/MJ) or equal (65–70 g/MJ) CIs than soybean or rapeseed oils if methane capture technologies and low-LUC palm oil are involved. Mixing palm oil with other low-CI feedstocks could then lead to even more significant CI reductions in the generated biofuels.
Beyond biofuel production, plants that capture methane are potentially an order of magnitude less investment-intensive than SAF plants and play a crucial role in reducing GHG emissions worldwide. The economic risks of these plants are potentially less prohibitive. The economy of numbers can also favor more straightforward production cost reduction with more efficient technology adoption as methane capture integration increases. As the market entry barriers are lower, more suppliers and economic competition are also expected.

3.5.2. Pyrolysis, Co-Pyrolysis of Lipids and Similar Technologies Scaling-Up Challenges

High-Pressure Liquid Phase Pyrolysis and Catalytic Hydrothermolysis of Lipids
Pr. Bressler has been developing a moderate-to-high-pressure (3–140 bar) liquid-phase pyrolysis reactor for lipid conversion in Canada since approximately 2007, which represents one of the most advanced projects in the field. It involves a 20 kg/h pilot reactor and has received at least CAD 7 million in funding. The competitive advantages expected to come from this project include a process that requires no catalysts (optional usage) or hydrogen to generate deoxygenated hydrocarbons and leads to a similar yield to HEFA [102,103]. Reaction pathways for the high-pressure liquid pyrolysis of lipids have been studied since before the 1950s [104], when several plants were reportedly built at high and atmospheric pressures in China from 1937 onwards due to an international blockade on tung oil exports [105,106]. A higher pressure enables the use of higher temperatures (400–500 °C) for cracking oil without catalysts, while maintaining a liquid phase that prevents gas formation [104]. A small commercial project was announced in Ontario (Canada), with construction planned to begin in 2022 [107], but no additional information about the project has been available since.
Historically, high-pressure operations have been less popular compared to the use of low-pressure liquid phase or saponified lipid pyrolysis, potentially due to more complex operational conditions [104]. The low-pressure pyrolysis of saponified castor oil has been used commercially for the production of bio-polyamide since the 1950s, with an actual global production of around 355 kt/y [108,109].
Applied Research Associates and Chevron have also developed a method for the high-pressure conversion of lipids to SAF through a catalytic hydrothermolysis process, which ASTM approved for a 50–50% blending with jet fuel in 2020 [110]. The competitive advantages expected from this method include a reduced demand for hydrogen, higher selectivity for jet fuel before hydrocracking (22.45% vs. 12.8%, considering global yields), and the potential for use without blending with fossil fuels in the future. Despite these, considerable barriers are expected. Hydrocarbon yields (61–69%) [110] are estimated to be significantly lower than those of HEFA, being 72.7–80% (Table 1), which will likely impact the production costs and GHG reduction. The high pressure involved in supercritical conditions (15–250 bar) and the limited capacity to diversify used feedstocks beyond lipids also imply significant challenges in deploying the process at a moderate commercially viable scale (e.g., <100–150 kt of feedstocks) with feedstocks having reduced costs or CI.
Co-Pyrolysis of Lipids with Cheap and/or Low-CI Feedstocks
Co-pyrolysis of cheaper and/or lower-CI feedstocks at low pressure is, at first sight, an obvious pathway to raise competitiveness and to lower the CI of biofuel if high yields can be obtained in a robust manner. Cellulosic materials (80–350 USD/t), waste plastics (30–300 USD/t), and wastewater biosolids have significantly lower and more stable costs than lipids, for which prices have oscillated from 350 to 2000 USD/t since 2017. The costs were 780 and 1130 USD/t for yellow grease and tallow in November 2023, for instance [29]. Compared to lipid-based biofuel commercial technologies, pyrolysis is more amenable to a wide range of feedstocks. Research on lipid co-pyrolysis is, however, not so advanced despite some promising results.
Lam et al. (2019) [111] achieved an 84 wt% oil yield using microwave pyrolysis on an activated carbon reaction bed for waste plastics and used cooking oil at an equal mass ratio. Their economic analysis suggested that a biofuel with a price lower than diesel could be achieved in Malaysia. Omidghane et al. (2020) [112] reached around a 75–78 wt% pyrolysis oil yield with biosolids at a 1:1 ratio with brown grease (in a pressurized laboratory setup). Chen et al. (2014) [113] obtained 68.6 wt% oil from a 1:1 ratio of corn cobs and waste cooking oil in a fixed bed at 550 °C for 30 min. In this study, pyrolysis of corn cobs without waste cooking oil yielded 44.6% and 29.7% for oil and char, respectively, while pyrolysis of waste cooking oil without corn cobs yielded around 68 wt% oil. The results were thus considered better for the co-pyrolysis than for individual pyrolysis of corn cobs and waste cooking oil. Synergistic reactions between feedstocks, such as higher yields and better oil quality than expected from individual samples under the same conditions have been frequently observed for co-pyrolysis [111,114,115]. For example, hydrogen from plastics may stabilize oxygen radicals from biomass, and oxygen radicals from biomass might assist in cracking plastics [116].
Research on the co-pyrolysis of lipid feedstocks involves many potential operational conditions, reactor and process designs, prior potential lipid pretreatments, and the potential use of catalysts, which makes the comparison of past research results challenging. Scaling up such technologies to a commercial-scale process is likely to be restrained by the high R&D costs of experimenting at representative scales (kg/h) and the risks that the chosen pilot design may be inadequate for commercial activities or a first-of-a-kind project. For instance, some reactor designs, the catalyst stability, or lipid/feedstock pretreatments may involve risks and additional costs at the commercial scale that are less apparent at the laboratory scale. In the case of Bressler’s announced first commercial lipid pyrolysis plant, after its 7 million pilot, for example, the required investments were 30 million [107], but important overruns are the norm in Canada.
Recognizing if a technology offers significant advantages and compensating for the heavy investment required for its development and deployment is difficult. Bressler’s technology was tested for co-pyrolysis with wastewater biosolids [112], but uncertainties remain regarding the readiness of using such feedstocks. The first plant was thus expected to use UCO [117], but its limited availability might restrain the plant’s capacity to achieve a very low-CI biofuel at the optimal size for viability. Inversely, funding such technology, if higher-CI feedstock is used, may not interest stakeholders even if it could be more favorable from a technology development perspective. The initial choice of using a pressurized reactor may also strongly limit the choice of feedstock for co-pyrolysis. Alternative process conceptions might have solved these issues or led to unbearable viability challenges. These include using catalysts [118], lime and lower temperatures during pyrolysis [119], alcohol as a hydrogen donor [120], a microwave reactor [111], standard pyrolysis versus autothermal, etc. In each case, some uncertainties exist, and the expected investments for scaling up are likely similar to those for Bressler’s concept.
In fact, more advanced and competitive technologies may never reach the market due to a variety of factors that go beyond good technical performance, including the extensive learning curve required to address first-plant operational challenges, the infrastructure required to build and deliver equipment at low costs, geopolitical considerations that favor national over potentially superior foreign technologies, and, occasionally, the suboptimal selection of project leadership. A low awareness among decision-makers of the potential to significantly improve the economic and environmental performance of lipid-feedstock conversion to biofuels, or a low desire to do so, might be another explanation.
Several issues must also be considered regarding co-pyrolysis. Waste plastic combustion and conversion losses to CO2 imply a high carbon intensity feedstock, as emitted CO2 is not biogenic [18]. Melted and softened plastics also often have high viscosity, which can clog systems and feedlines, leading to wax and coke buildup and potentially impairing overall process performance [116]. Biomass solid materials (sawdust, logging residues, lignin, corn cobs…), with their higher oxygen content, will lower yields. External ashes from logging residues and agricultural waste are also known challenges [121,122].
However, at low integration rates of these feedstocks—such as 10–30% for plastic and sawdust at a 20–60% total integration of cheaper feedstocks—and if bio-chemicals are produced as co-products (without combustion), these issues can be considerably reduced. Since pyrolysis operating conditions are less harsh than those of HEFA, smaller commercial plants with simpler logistics are anticipated (e.g., 80–130 kt of feedstocks, similar to current pyrolysis facilities). Smaller plant sizes could also enable higher integration rates of tallow and UCO compared to vegetable oil in HEFA and biodiesel plants. More experiments, economic assessments, and sustainability studies are necessary to determine the potential of co-pyrolysis.

3.5.3. Hydrogen Generation and the Importance of Small-Scale Commercial Demonstrations

Various means could reduce the CI of hydrogen production for SAF at a potentially interesting cost, but face several market barriers that prevent their adoption and development.
Hydrogen from electrolysis is the most discussed option. Economic competitiveness and good sustainability performances are achieved when very cheap and low-CI/otherwise wasted electricity are involved [123], as the electricity demand for the chemical reaction is high and the conversion is not very efficient at 39–60 kWh, which is much higher than the theoretical ~32.7 kWh/kg (from the enthalpy of the reaction). Intermittent energy usage involves either using electrolysers at a flexible and under-optimal capacity factor or storing hydrogen. However, the first option leads to rising costs for equipment with a low utilization rate [123] and higher operational challenges than expected have been documented [124]. Finding means to reduce these issues and demonstrating a reproducible and more competitive model at a small commercial scale are potentially a priority, as the HEFA industry in the U.S., for example, has not shown high interest in this technology [11].
Aqueous phase reforming of glycerol, a by-product of the biodiesel industry that can also be generated by the hydrolysis of lipid-feedstocks before HEFA-tJ production, was proposed recently [125]. The hydrogen generated from the feedstock’s glycerol was insufficient to cover the entire hydrogen requirement but was estimated to reduce the carbon intensity of the process by 54% when steam methane reforming was used to produce the balanced hydrogen required. Despite slightly higher capital costs and labor requirements, the SAF fuel generated was estimated to have a 17% lower minimum selling price than that generated with standard hydrogen generation. Lower compression requirements, as compressing liquids is easier compared to gases, and lower hydrogen demand explained the cost reduction.
The low process maturity makes it challenging to assess if such cost reduction is realistic. Deploying this process on a small commercial scale through a simplified process would consequently greatly help demonstrate that it can meet critical viability criteria, such as the catalyst’s stability and the process’s overall potential. For instance, stationary fuel cells that use reformers (autothermal or with steam) for electricity generation are widely commercialized at various scales, and achieve power generation values as low as 1–5 kW for domestic applications. They also do not require extensive gas cleaning, such as pressure swing adsorption, which makes their adoption simpler and less capital-intensive and which is more favorable for the deployment of new technologies, such as aqueous phase reforming.

3.6. Social Costs of Reducing GHG Emissions with Vegetable Oil and Animal Fat Products Are Important

Assessing how much society must pay to reduce GHG emissions with different technologies is challenging, as it relies on many hypotheses. The total capital investments (TCIs) for a project are particularly subject to significant underestimation and overrun. Environmental assessments, as discussed earlier for iLUC and deforestation issues, also face methodological challenges and political pressure that may undermine their value. Despite these considerations, metrics that combine both economic and environmental impacts remain critical. They can help determine whether new technologies need to be developed, for instance. The cost per ton of GHG avoided is thus calculated based on the premium cost (USD/MJ) and the carbon intensity reduction (CI, g/MJ) of each feedstock (soybean oil, canola oil, tallow, corn oil, and yellow grease), according to their utilization ratio, r. All HEFA-tJ, RD, and BD calculations are estimated based on the American resource usage distribution discussed in Section 3.3.5.
$ G H G a v o i d e d = i = 1 n r i $ M J g r e e n i $ M J f o s s i l C I f o s s i l C I g r e e n i

3.6.1. Economic Model for Social Cost Estimation

A simplified economic model compares HEFA-tJ, RD, and BD production. The analysis in Section 3.1.3 is extended by adding the TCI costs, return on investments (RI), taxes, maintenance costs, and more specific hypotheses on hydrogen, methanol, electricity, and natural gas usage and costs. For the TCIs, Table 6 presents various assessments based on values found in the literature and announced by companies for HEFA-tJ and BD. The base unit of all analyses is calculated by ton of feedstock.
Wide variations are observed for the HEFA-tJ TCIs, which range from USD 550 to 1869/t of feedstock (in 2024). The lowest values (<USD 1000/t) are considered an underestimation, as they are below project announcements at USD 1168–1337/t (Neste, World Energy Paramount, and TotalEnergy). These projects are also considerably smaller, at less than 400 kt/y of feedstock, and do not benefit from the economy of scale of the latter (more than 1400 kt/y for Neste and World Energy Paramount).
Hofstrand [56] and Air Liquide [126] describe BD projects as having a considerably lower TCI than HEFA-tJ and RD, ranging from USD 315 to 500/t. As overruns and underestimation are expected, we considered both HEFA-tJ and BD to have a higher TCI in our model, from USD 1200 to 1600/t for HEFA-tJ and USD 500 to 650/t for BD (Table 6). A gross estimation of 92% of the HEFA-tJ TCI was used for the RD process. Hydrogen costs are not included in the TCI for RD or HEFA-tJ, and are estimated independently at USD 2000/t of hydrogen (Table 7).
To evaluate the effects of TCI and resource usage variation, annual capital and operational costs are estimated in a lightweight model based on general hypotheses related to depreciation, RI, taxes, maintenance, and primary resource usage and cost (Table 7 and Table 8). These rules of thumb were estimated based on NREL TEA studies [127,128]. The validity of such hypotheses appears acceptable in a preliminary comparative study where feedstock costs dominate. From 2017 to 2023, the primary resources (oil and fat) represented in our model represent between 61% and 81% of the total annual cost for HEFA-tJ and RD, while they account for 78–91% of the total BD. The depreciation cost calculation for our model is similar to that of Hofstrand’s [56] and NREL’s models.

3.6.2. Carbon Intensity Model for GHG Reduction and Social Cost Estimation

The carbon intensity values are based on CORSIA and GREET assessments [59,71] and compared in Table 9 to the GHG emissions avoided per kg of feedstock (Equation (4)). The yields of HEFA-tJ and RD were considered to be 79% and 85%. The yields of BD were considered to be 95% for animal-derived fat (tallow and yellow grease) and 97% for vegetable oils, and the related carbon intensities are based on GREET evaluation [71]. Because the GREET evaluations for feedstock cultivation and collection are significantly lower than CORSIA’s evaluations for soybean and canola oil (Figure 8), we added 10 g/MJ for these feedstocks to avoid disparities in the comparison and to illustrate the yield impacts on the GHG reduction and social costs. The CORSIA’s value for soybean feedstock collection with the GREET methodology is 17.8 g/MJ, while Xu, H. et al.’s [71] value is 8.9 g/MJ. Further clarifications regarding this large gap should be sought. Multiple iLUC values were given for canola oil and soybean oil for the BD and RD pathways (ibid), so a generic value of 20 g/MJ was considered for these resources.
The RD mix (using US resource distribution for RD) offers the highest GHG emission reduction, at 2236 g/kg of feedstock, followed by the BD mix, at 1725 g/kg. RD offers a 29% improvement in GHG reduction over BD, a 38% reduction over the HEFA-tJ with RD mix, and a 101% reduction over the HEFA-tJ with BD mix. Despite having a lower energy density and a higher rate of high-carbon-intensity resources (soybean and canola oil), BD offers 6% and 55% better GHG reductions than HEFA-tJ with RD and BD resource usage.

3.6.3. Social Costs of the Different Pathways

Figure 10 presents the social cost of GHG reduction, combining the economic and environmental models. Two lines are shown for each scenario, illustrating the variable TCIs studied (min/max values).
The HEFA-tJ pathways lead to considerably higher social costs caused by much lower associated GHG reductions and higher costs related to yield losses. Lower jet fuel costs compared to diesel fuel are another important factor that impacts the social cost of HEFA-tJ. Uncertainties exist regarding the selected data for these costs. Statista presents similar diesel retail prices to EIA, while IndexMundi considers costs closer to conventional jet fuel but which are still 7–10% more expensive. Thus, we selected the IndexMundi diesel prices shown in Figure 10, as they reduced the advantage of road fuels by about USD 100/t. Still, HEFA-tJ has a significantly higher social cost than the latter. There is also a notable social cost difference of more than USD 200/t in HEFA-tJ between the U.S. BD and RD mixes.
Concerning road fuels, RD’s advantage over BD (red vs. green lines) is less clear despite its 29% higher GHG reduction potential (Table 9). The much higher TCI for RD mainly explains this situation (Table 6). More favorable RD conditions are observed only from 2020 to 2022. Our model may, however, underestimate RD’s advantage in adapting to market fluctuations compared to BD.
As for BD, it is important to note that implementing new technologies to expand feedstock possibilities holds the promise of being the most efficient solution from a social cost perspective (purple lines). For instance, Air Liquide’s commercialization of supercritical pretreatment in 2017, allowing higher utilization rates of tallow and yellow grease, is a significant step in this direction [126]. Even if BD’s TCI were to reach the upper-bound cost of our model, potentially reaching higher with pretreatment (>USD 650/t), the TCI remains considerably lower than that of RD and leads to significantly lower social costs, at around a USD 30–70/t difference (purple upper-bound line vs. red lines). Many BD facilities are also already operating (59 in the U.S.), which implies that new plants do not need to be built in most cases. Incentives that favor the adoption of technologies that allow more feedstock flexibility for BD appear to be a sound orientation that favors both actual plant economic activities and GHG reduction.
Globally, despite being more favorable from a social cost perspective, the price for road diesel remains important, at over USD 150–200/t. Incentives for GHG reduction can hardly cover higher costs. Periods of economic instability, where feedstock costs rise drastically, have also proven difficult. Many BD plants have faced significant challenges recently [126,129]. Chevron closed two plants in 2024, and primary resource price fluctuations since 2020 have deeply affected BD plants’ profitability [129]. This can also be observed in Figure 10, where social prices oscillate from USD 250 to 650/t (2020–2023). HEFA-tJ fuels, with social costs rising well above USD 900/t for several months in the same period, would have faced even more dire challenges.

4. Discussion

4.1. Fostering Sustainable Development with Data

Various methodologies have been presented and will be further developed in relation to data management and visualization tools.

4.1.1. Fast Technology Screening Methodologies

Fast technology screening methodologies (Section 3.1) would benefit from better datasets and visualisation tools. For instance, sustainable product integration rates and their expected impacts on consumer price, presented in Section 3.1.1, can be easily integrated into geomatic maps for various regions and products, such as SAF, ethanol, or biogas production. Analysis of the prices of regional fossil fuels and green alternatives in regions with a high biofuel integration rate, like Brazil, India, or California, could give indications that shifting road production to SAF may be helpful in some regions in reducing the consumer price impact of biofuel integration. As taxes are imposed on fossil fuel in many regions of the world, the rising integration rate of biofuel also acts as a double tax for road or air fuels. With more precise datasets on the selling prices, the integration rate, the taxation, or even the social cost of biofuel and fossil fuel, models can be developed to evaluate preliminarily, for example, the impact of biofuel integration regulation compared to fossil fuel taxation, or even to compare the market barrier associated with the development of hydrogen for heavy transport versus biofuels.
Yield analysis combined with information from industrial practice and the literature, as shown in Section 3.1.2, should be developed more systematically for different processes because different processes have significant effects on GHG reduction (Section 3.4) and social costs (Section 3.6). Multiple processes use the same feedstocks but produce different yields, similar to HEFA for road and air fuels. For example, wood feedstocks can be used to produce low-CI biofuel, biochar, or combined heat and power. The yield and GHG reduction per ton of feedstock vary greatly depending on the energy density of the product and practices like heat sales or biomass drying. These differences are often overlooked when only considering carbon intensity or zero-emission goals. Additionally, the capital costs and logistical complexity of increasing yields at an existing plant may be lower than building a new one. More precise information on variations in process performance across industrial practices is required for this. This information can be very sensitive and difficult to access, as it can give a key indication that a supplier performs better than the competition or that public money could have been invested better in another project/field. Still, it would also help define what optimization can be applied to actual biofuel production and how policies can support it.
More datasets on resource availability and their historical price (for different countries and regions), combined with yield estimation, can also allow a preliminary evaluation of the competitiveness of different processes with reduced uncertainties, as the number of variables is low (Section 3.1.3). With additional data on past projects’ costs and size, a simplified economic model, such as that presented in Section 3.6, can sometimes challenge the claimed costs of green alternatives. For HEFA-tJ, for example, our model expects a higher capital costs impact on production costs than the values in the literature, with our value being 61–81% of costs for feedstocks compared to the often more than 80% seen in the literature [130]. Datasets on past projects that publicly claimed their costs and sizes are relatively easy to build for various processes, but tedious to develop and hard to keep up to date. Web scraping strategies with artificial intelligence might help standardize data acquisition and even further explore past projects’ operational challenges.

4.1.2. Geomatic Tools for LUC and Other Applications

Regional information on feedstock availability, sustainability, and the market (Section 3.2 and Section 3.3) is key to assessing how industrial practices can be optimized. The tracking of historical deforestation or peatland conversion for different feedstocks using satellite imaging now allows the evaluation of sustainability at a regional and company level, while many frameworks are still evaluating at a country level based on expected land conversion. However, the data quality varies for different regions, and we doubt that evaluations based on a plant-level analysis are available for many countries and feedstocks. When possible, they should, however, be used.
TRASE’s preliminary LUC evaluation, when compared to the CORSIA for Indonesia, as carried out in Section 3.3.3, showcases alarming regional variations that are several times higher or lower than the CORSIA’s value, and this must be confirmed more rigorously. Transparency and confidence in iLUC evaluations might also be increased if the distinction between LUC and iLUC emissions were more clearly established. Comparing historical versus projected land use changes appears to be another means to achieving more transparency. From this perspective, visualizing land use changes and related emissions is challenging, as information is often contained in very large datasets and many hypotheses/assumptions are involved, such as emission factors, uniform or various types of peatland types [18], initial soil carbon stocks, etc. Efforts to build tools to allow easy manipulation of involved variables at a country and regional level, are relatively important worthy. As datasets usually contain multiple countries’ data, multiple feedstocks and processes can be studied simultaneously. The development of such a tool could also help to more transparently visualize the potential of drought-resistant plants for degraded-land bioenergy production (Section 3.2.2) or the biochar potential in different regions.

4.2. The Role of Different Actors in Maximizing the Climate Offsets of the SAF Production

4.2.1. Lawmakers and Aviation Industries

Rising SAF production using the HEFA-tJ pathway is, at first sight, the most attractive path to lower aviation GHG emissions because of its maturity and the market’s low integration rates. However, yield losses (Figure 2) when trying to produce jet fuels at high selectivity make the pathway much less competitive than renewable diesel production. In fact, the industry currently favors renewable diesel production [11]. Additional incentives could change this tendency, but it would come at a higher societal cost and with lower GHG emission reductions. In our opinion, book and claim systems for investments outside of SAF and aviation—such as in road-diesel production or methane capture systems for palm oil effluent (POME)—should be considered/studied seriously by the aviation industry, as these investments appear significantly more efficient. Some technologies that would benefit GHG reductions in SAF production may also be developed much more efficiently in fields other than SAF. For example, aqueous reforming for electricity generation with stationary fuel cells can be deployed as a pilot and even commercial scale much more simply in terms of capital costs and production size than it can for HEFA. To develop efficient UCO collection systems, fight desertification of degraded land with resistant crops, or develop co-pyrolysis of lipids for biofuel and chemical production, markets other than SAF may be more appropriate from a technology development perspective and for a first commercial activity.
Another key message is that raising the market integration rates of SAF or RD should not be considered a primary goal for legislation, as reducing GHG emissions should be considered as well. Shifting actual BD and RD feedstock to SAF would lead to 70–80% of biofuels having a mitigated environmental impact (slightly positive or negative). Restraining biofuel production primarily to low-carbon intensity/low-iLUC feedstock has also been historically challenging for BD and RD. Incentives toward this aim for HEFA-tJ might be less efficient, as the social cost of using high-carbon intensity feedstock for SAF production is several times higher than that for road diesel. From another perspective, if considerable efforts to lower the environmental impacts of palm oil production must be acknowledged, more transparent and rigorous data are required. Efforts must be pursued to capture/valorize methane from POME treatment or to favor more sustainable plant accreditation.
Consequently, raising production to a new market (SAF) is potentially not a sound orientation. Considering the short time frame required to achieve significant world GHG emission reductions, and the relatively slow deployment time for constructing HEFA-tJ plants (more than 2–5 years), reducing the carbon intensity of biofuel production from vegetable oil is a far more realistic option. It is less capital-intensive than building new SAF plants and considerably faster.
Finally, low-carbon-intensity resources such as tallow and yellow grease are limited. The industry acknowledges that the HEFA-tJ produced using these resources is insufficient to achieve the claimed SAF objectives for 2030 [11]. Other technologies and primary feedstocks are needed. Investing now in the HEFA-tJ pathway, or other low-risk strategies, will saturate the SAF market and make adopting more efficient emerging pathways to reduce GHG emissions challenging (Figure 1). Developing risky technologies that can lower the premium cost should thus be done sooner rather than later.

4.2.2. Takeaway for R&D and R&D Investors

From a commercialization perspective, road diesel fuels from biomass feedstock are some of the most successful sustainable alternatives to fossil fuels. However, their market integration worldwide remains well below 5–10%, and their social price is high according to our model, ranging from approximately USD 100 to 650/t between 2020 and 2023. Aiming to achieve higher market integration will be very challenging with other technologies where the cost of feedstock, high capital investments, or high energy demand lead to social costs that are several times higher than those of actual BD or RD (i.e., HEFA-tJ). Industrial plants’ survival ability may also be significantly diminished during challenging economic times like COVID-19 and war, as illustrated in Figure 10.
Achieving higher market integration rates of sustainable solutions in various fields (more than 15%) requires new technologies with lower social costs, ideally much less than USD 100/t. In our opinion, relying solely on electrification and intermittent energies’ expected cost drop is insufficient, as the world’s electric grid has a very high carbon intensity and already faces considerable challenges in its reduction [131,132]. New ideas are needed. A focus on technologies that can achieve low GHG emissions and which also demonstrate a clear pathway to cost and economic risk reduction is of utmost importance. From that perspective, using fossil feedstock wisely to reach a higher yield or generate the required hydrogen for a process may appear to be an unpopular idea, but it should not be ignored. Both BD and RD road fuel pathways use substantial amounts of fossil-based methanol and hydrogen while reaching low carbon intensity if supplied with low-iLUC resources, exhibiting more than a 60–70% CI reduction. Many of the most promising technologies presented in the BETO’s State of Technologies [25], which tries to summarize the main economic results from thousands of past projects that they founded on biomass conversion, also require significant quantities of fossil fuels. This is the case for the catalytic fast pyrolysis pathway, the dry feedstock bioconversion pathway, upgrading via 2,3-butanediol and mixed-acid intermediates, and the processing of combined algae via 2,3-butanediol intermediates [25]. According to their LCA and economic analyses, these processes have the potential to reach competitive prices and low carbon intensity (more than a 70% CI reduction).
Flexible commercial size is another key aspect and is discussed in Section 3.5. Co-pyrolysis of lipids appears to face considerable market barriers due to high R&D costs for kg/h pilot plants and high investment for first commercial plants, USD ~5–15 M and less than USD 100 M, respectively, and many biomass conversion technologies often involve several hundred million to billions in investments for first commercial plants. This is the case for the BETO’s State of Technologies proposed technologies [25] and many biomass-to-liquid processes. Developing technologies that can be deployed faster and at a lower scale may facilitate their implementation. We also suspect that interesting and maybe less risky business models related to yield and green process optimization exist, such as implementing methane capture in palm oil plants.

4.2.3. Takeaway for LCA Developers

Market distribution/resource share usage is critical to evaluating whether low-carbon intensity solutions are competitive and applicable. For instance, it should be clear to an unspecialized LCA expert that a palm oil plant with methane capture is a marginal practice, and that rigorous data on the practice’s usage are missing. Such a marginal practice should also not be considered as a reference scenario for PFAD without justification. The share of side-products from feedstocks that lead to considerable direct land use changes should be studied more rigorously. Whether it be as a result of palm plantation or cattle farming causing deforestation, data on these issues and their market importance are progressively becoming more available. Knowing the proportion of plants that are adopting a new technology, using only soybean oil, or using a mixture of primary resources is also critical to determine if action must be taken. The origin of the feedstock and the related transport distance proportional to the market share should also be considered, as feedstock importation in the U.S. is gaining importance. Better resource share usage data will be relevant for policymakers and industrialists.
Yield is susceptible in some processes to important variations according to the plant’s conception or the process’s performance. Precision in evaluating these variations is mandatory for rigorous environmental evaluation. Methodologically, we also showed that global GHG emission reduction must be considered when comparing projects, not just carbon intensity.

4.3. Takeaway for the Industry

The evaluation of iLUC should be considered seriously, even if the associated methodology is complex and leads to uncertainty and, therefore, risk. According to Figure 6, many renewable diesel plants in the U.S. should also not be worried about iLUC or greening their hydrogen production if they shift to SAF, but the transport distance from imported feedstocks could be problematic in the future (Figure 8).

5. Conclusions

The aviation industry faces considerable pressure to reduce the GHG emissions from its different activities while society pushes for the fast adoption of strongly related legal constraints in different sectors. These objectives are laudable. However, the capacity of the involved measures to efficiently reduce GHG emissions must be rigorously considered. If the HEFA-tJ pathway is the most readily available for SAF production, its cost comes with a substantial premium and will require considerable investments from society. Consequently, society should expect a significant reduction in GHG emissions. We particularly emphasize the need for more transparent data on the environmental impacts of rising HEFA-tJ production compared to the impacts of investing in the GHG reduction of alternative markets using similar primary resources, such as biodiesel (BD) and RD. This will enable stakeholders to make more informed decisions and contribute to the sustainable development of the aviation industry. More generally, it appears that the market competing for primary resources, and the impact of yield in evaluating the environmental benefits of investing in HEFA-tJ, are significant issues that require immediate consideration and discussion.

Author Contributions

Conceptualization, M.P.-R. and I.E.A., N.A. and R.O.; Methodology, M.P.-R.; Software, M.P.-R.; Formal analysis, M.P.-R.; Investigation, M.P.-R.; Resources, I.E.A. and N.A.; Data curation, M.P.-R.; Writing—original draft, M.P.-R.; Writing—review & editing, R.O., I.E.A. and N.A.; Supervision, I.E.A. and N.A.; Funding acquisition, I.E.A. and N.A. All authors have read and agreed to the published version of the manuscript.

Funding

This research was funded by NSERC Canada.

Data Availability Statement

The original contributions presented in this study are included in the article. Further inquiries can be directed to the corresponding authors.

Acknowledgments

This work has been funded by the following projects: NFRFG-2022-00197, NFRFG-2020-00117 and ALLRP585949. The authors are indebted to the funding organisms New Frontiers of Research of Canada and National Science & Engineering Research Council of Canada’s Alliance Program. Special thanks addressed to the personnel of the GRTP (Group of Research on Technologies and Processes) of the Department of Chemical & Biotechnological Engineering of the Université de Sherbrooke.

Conflicts of Interest

Author Ralph Overend was employed by the company Nextfuels LCC. The remaining authors declare that the research was conducted in the absence of any commercial or financial relationships that could be construed as a potential conflict of interest.

Abbreviations

The following abbreviations are used in this manuscript:
BDBiodiesel (fatty acid methyl ester, FAME)
BETOUSDOE, Bioenergy Technology Office
CICarbon intensity
CORSIACarbon Offsetting and Reduction Scheme for International Aviation
EIAU.S. Energy Information Administration
HEFA-tJHydrotreated ester and fatty acid pathway to jet
HEFA-roadHydrotreated ester and fatty acid pathway to renewable diesel (RD)
FOGsFats, oils, and greases
IATAInternational Air Transport Association
iLUCIndirect land use changes
JRCJoint Research Center
MtMillion tonnes
NREL SOINational Renewable Energy Laboratory State of Industry
PFADPalm fatty acid distillate
RDRenewable diesel, also called HVO (hydrogenated vegetable oil)
SAFSustainable aviation fuels
TCITotal capital investment
UCOUsed cooking oil
USDAUnited States Department of Agriculture
USDOEUnited States Department of Energy

References

  1. Watson, M.J.; Machado, P.G.; da Silva, A.V.; Saltar, Y.; Ribeiro, C.O.; Nascimento, C.A.O.; Dowling, A.W. Sustainable Aviation Fuel Technologies, Costs, Emissions, Policies, and Markets: A Critical Review. J. Clean. Prod. 2024, 449, 141472. [Google Scholar] [CrossRef]
  2. Calderon, R.O.; Tao, L.; Abdullah, Z. Sustainable Aviation Fuel (SAF) State-of-Industry Report: State of SAF Production Process; NREL: Golden, Colorado, 2024. Available online: https://www.nrel.gov/docs/fy24osti/87802.pdf (accessed on 1 July 2025).
  3. Nigam, S.; Singer, D. Pathway to SAF—Europe Edition; Sustainable Aviation Futures: Singapore, 2024. [Google Scholar]
  4. BETO. SAF Grand Challenge Roadmap Flight Plan for Sustainable Aviation Fuel. 2022. Available online: https://www.energy.gov/sites/default/files/2022-09/beto-saf-gc-roadmap-report-sept-2022.pdf (accessed on 29 July 2025).
  5. European Commission. Regulation of the European Parliament and of the Council on Ensuring a Level Playing Field for Sustainable Air Transport; European Union: Brussels, Belgium, 2021. [Google Scholar]
  6. European Union Aviation Safety Agency. Current Landscape and Future of SAF Industry EASA Eco. Available online: https://www.easa.europa.eu/eco/eaer/topics/sustainable-aviation-fuels/current-landscape-future-saf-industry (accessed on 9 June 2024).
  7. IATA. Developing Sustainable Aviation Fuel (SAF). Available online: https://www.iata.org/en/programs/sustainability/sustainable-aviation-fuels/ (accessed on 13 August 2024).
  8. Neste. Rotterdam refinery Neste. Available online: https://www.neste.com/about-neste/how-we-operate/production/rotterdam-refinery (accessed on 13 August 2024).
  9. World Energy Paramount. Advanced Alternatives: World Energy Paramount Renewable Fuels Project. 2022. Available online: https://laedc.org/wpcms/wp-content/uploads/2022/06/LAEDC_AlpineReport_FINAL_rvs-06.20.2022.pdf (accessed on 29 July 2025).
  10. ReFuelEU. “Ajustement à l’objectif 55”: Accroître l’utilisation de carburants plus écologiques dans les secteurs aérien et maritime. Available online: https://www.consilium.europa.eu/fr/infographics/fit-for-55-refueleu-and-fueleu/ (accessed on 9 June 2024).
  11. Calderon, R.O.; Tao, L.; Abdullah, Z.; Talmadge, M.; Milbrandt, A.; Smolinski, S.; Moriarty, K.; Bhatt, A.; Zhang, Y.; Ravi, V.; et al. Sustainable Aviation Fuel State-of-Industry Report: Hydroprocessed Esters and Fatty Acids Pathway; NREL: Golden, CO, USA, 2024. [Google Scholar]
  12. Bardon, P.; Massol, O. Decarbonizing Aviation with Sustainable Aviation Fuels: Myths and Realities of the Roadmaps to Net Zero by 2050. Renew. Sustain. Energy Rev. 2025, 211, 115279. [Google Scholar] [CrossRef]
  13. Braun, M.; Grimme, W.; Oesingmann, K. Pathway to Net Zero: Reviewing Sustainable Aviation Fuels, Environmental Impacts and Pricing. J. Air Transp. Manag. 2024, 117, 102580. [Google Scholar] [CrossRef]
  14. Doliente, S.S.; Narayan, A.; Tapia, J.F.D.; Samsatli, N.J.; Zhao, Y.; Samsatli, S. Bio-Aviation Fuel: A Comprehensive Review and Analysis of the Supply Chain Components. Front. Energy Res. 2020, 8, 110. [Google Scholar] [CrossRef]
  15. Wei, H.; Liu, W.; Chen, X.; Yang, Q.; Li, J.; Chen, H. Renewable Bio-Jet Fuel Production for Aviation: A Review. Fuel 2019, 254, 115599. [Google Scholar] [CrossRef]
  16. Ng, K.S.; Farooq, D.; Yang, A. Global Biorenewable Development Strategies for Sustainable Aviation Fuel Production. Renew. Sustain. Energy Rev. 2021, 150, 111502. [Google Scholar] [CrossRef]
  17. Perkins, J. Dozens of Ethanol Plants Remain Idle in Early 2021. Successful Farming. 14 January 2021. Available online: https://www.agriculture.com/news/business/dozens-of-ethanol-plants-idle-production-in-early-2021 (accessed on 2 December 2024).
  18. CORSIA. CORSIA Supporting Document v5, CORSIA Eligible Fuels—Life Cycle Assessment Methodology; v5; International Civil Aviation Organization: Montreal, QC, Canada, 2022; p. 203. [Google Scholar]
  19. Pearlson, M.; Wollersheim, C.; Hileman, J. A Techno-Economic Review of Hydroprocessed Renewable Esters and Fatty Acids for Jet Fuel Production. Biofuels Bioprod. Biorefining 2013, 7, 89–96. [Google Scholar] [CrossRef]
  20. Zech, K.M.; Dietrich, S.; Reichmuth, M.; Weindorf, W.; Müller-Langer, F. Techno-Economic Assessment of a Renewable Bio-Jet-Fuel Production Using Power-to-Gas. Appl. Energy 2018, 231, 997–1006. [Google Scholar] [CrossRef]
  21. Bardon, P.; Massol, O.; Thomas, A. Greening Aviation with Sustainable Aviation Fuels: Insights from Decarbonization Scenarios. J. Environ. Manag. 2025, 374, 123943. [Google Scholar] [CrossRef]
  22. Gössling, S.; Humpe, A. Net-Zero Aviation: Time for a New Business Model? J. Air Transp. Manag. 2023, 107, 102353. [Google Scholar] [CrossRef]
  23. Gössling, S.; Humpe, A. Net-Zero Aviation: Transition Barriers and Radical Climate Policy Design Implications. Sci. Total Environ. 2024, 912, 169107. [Google Scholar] [CrossRef]
  24. Dray, L.; Schäfer, A.W. Cost and Emissions Pathways towards Net-Zero Climate Impacts in Aviation. Nat. Clim. Change 2022, 12, 956–962. [Google Scholar] [CrossRef]
  25. Bioenergy Technology Office. State of Technology, 2020; DOE: Washington, DC, USA, 2021; p. 168. [Google Scholar]
  26. Hamberg, K.; Leslie, M.; Walter, C.; Stratton, T.; Markham, D.; Tang, M.; Weatherbed, L. Scaling Solutions, Accelerating the Commercialization of Made-in-Canada Clean Technology; Deloitte: Calgary, BA, Canada, 2023. [Google Scholar]
  27. Dyk, S.V.; Saddler, J. Progress in the Commercialization of Biojet/Sustainable Aviation Fuels: Technologies, Potential and Challenges Bioenergy; IEA Bioenergy Task 39. 2021. Available online: https://www.ieabioenergy.com/blog/publications/progress-in-the-commercialization-of-biojet-sustainable-aviation-fuels-technologies-potential-and-challenges/ (accessed on 25 April 2024).
  28. IEA. Ethanol and Gasoline Prices 2019 to April 2022—Charts—Data & Statistics; IEA: Paris, France, 2022; Available online: https://www.iea.org/data-and-statistics/charts/ethanol-and-gasoline-prices-2019-to-april-2022 (accessed on 27 April 2024).
  29. EIA. U.S. Energy Information Administration—EIA—Independent Statistics and Analysis. Available online: https://www.eia.gov/state/search/?sid=AL#?1=682&2=182&r=false (accessed on 1 February 2025).
  30. Mauler, L.; Dahrendorf, L.; Duffner, F.; Winter, M.; Leker, J. Cost-Effective Technology Choice in a Decarbonized and Diversified Long-Haul Truck Transportation Sector: A U.S. Case Study. J. Energy Storage 2022, 46, 103891. [Google Scholar] [CrossRef]
  31. Jadun, P.; McMillan, C.; Steinberg, D.; Muratori, M.; Vimmerstedt, L.; Mai, T. Electrification Futures Study: End-Use Electric Technology Cost and Performance Projections Through 2050; NREL/TP-6A20-70485; National Renewable Energy Laboratory: Golden, CO, USA, 2017. Available online: https://www.nrel.gov/docs/fy18osti/70485.pdf (accessed on 29 July 2025).
  32. Ledna, C.; Muratori, M.; Yip, A.; Jadun, P.; Hoehne, C.; Podkaminer, K. Assessing Total Cost of Driving Competitiveness of Zero-Emission Trucks. iScience 2024, 27, 109385. [Google Scholar] [CrossRef]
  33. Link, S.; Stephan, A.; Speth, D.; Plötz, P. Rapidly Declining Costs of Truck Batteries and Fuel Cells Enable Large-Scale Road Freight Electrification. Nat. Energy 2024, 9, 1032–1039. [Google Scholar] [CrossRef]
  34. Noll, B.; del Val, S.; Schmidt, T.S.; Steffen, B. Analyzing the Competitiveness of Low-Carbon Drive-Technologies in Road-Freight: A Total Cost of Ownership Analysis in Europe. Appl. Energy 2022, 306, 118079. [Google Scholar] [CrossRef]
  35. Argonne National Laboratory. Hydrogen Delivery Infrastructure Analysis. Available online: https://hdsam.es.anl.gov/index.php (accessed on 17 February 2025).
  36. Elgowainy, A. Economic and Environmental Perspectives of Hydrogen Infrastructure Deployment Options. Argonne. Presentation to Nasem Committee. 2019. Available online: https://sites.nationalacademies.org/cs/groups/depssite/documents/webpage/deps_195262.pdf (accessed on 29 July 2025).
  37. HDSAM. Hydrogen Delivery Scenario Analysis Model. Available online: https://hdsam.es.anl.gov/index.php?content=hdsam (accessed on 19 February 2025).
  38. Connelly, E.; Penev, M.; Elgowainy, A.; Hunter, C. Current Status of Hydrogen Liquefaction Costs. In DOE Hydrogen and Fuel Cells Program Record 19001; Department of Energy: Washington, DC, USA, 2019. Available online: https://www.hydrogen.energy.gov/docs/hydrogenprogramlibraries/pdfs/19001_hydrogen_liquefaction_costs.pdf?sfvrsn=378c2204_1 (accessed on 29 July 2025).
  39. Ragon, P.-L.; Kelly, S.; Egerstrom, N.; Brito, J.; Sharpe, B.; Allcock, C.; Minjares, R.; Rodriguez, F. Near-Term Infrastructure Deployment to Support Zero-Emission Medium- and Heavy-Duty Vehicles in the United States; International Council on Clean Transportation: Washington, DC, USA, 2023; Available online: https://theicct.org/publication/infrastructure-deployment-mhdv-may23/ (accessed on 19 February 2025).
  40. Burnham, A.; Gohlke, D.; Rush, L.; Stephens, T.; Zhou, Y.; Delucchi, M.A.; Birky, A.; Hunter, C.; Lin, Z.; Ou, S.; et al. Comprehensive Total Cost of Ownership Quantification for Vehicles with Different Size Classes and Powertrains; ANL/ESD-21/4; Argonne National Lab (ANL): Argonne, IL, USA, 2021. [Google Scholar] [CrossRef]
  41. Aryanpur, V.; Rogan, F. Decarbonising Road Freight Transport: The Role of Zero-Emission Trucks and Intangible Costs. Sci. Rep. 2024, 14, 2113. [Google Scholar] [CrossRef] [PubMed]
  42. Tao, L.; Milbrandt, A.; Zhang, Y.; Wang, W.-C. Techno-Economic and Resource Analysis of Hydroprocessed Renewable Jet Fuel. Biotechnol. Biofuels 2017, 10, 261. [Google Scholar] [CrossRef]
  43. Marker, T.L. Opportunities for Biorenewables in Oil Refineries; UOP. Available on the DOE librairy. 2005. Available online: https://www.osti.gov/servlets/purl/861458-Wv5uum/ (accessed on 29 July 2025).
  44. Cross, D. Shell’s Powering Progress Strategy. 2022. Available online: https://www.gti.energy/wp-content/uploads/2022/05/01-tcbiomass2022-Keynote-Presentation-Darren-Cross.pdf (accessed on 29 July 2025).
  45. Digital Refining. Neste Oil Adds NExBTL Renewable Naphtha Suitable for Producing Bioplastics. Available online: https://www.digitalrefining.com/news/1001438/neste-oil-adds-nexbtl-renewable-naphtha-suitable-for-producing-bioplastics (accessed on 9 April 2024).
  46. Oki, N. Japan’s Mitsui Chemicals Adds New Bio-Petchem Products Latest Market News. Available online: https://www.argusmedia.com/en/news-and-insights/latest-market-news/2508701-japan-s-mitsui-chemicals-adds-new-bio-petchem-products (accessed on 9 April 2024).
  47. Lim, C.-W. SK Geo Centric Delivers First Shipment of Renewable Benzene to Covestro; Aju Press: Seoul, Republic of Korea, 2022; Available online: https://www.ajupress.com/view/20220620135800806 (accessed on 9 April 2024).
  48. Kotrba, R. Total Converting Grandpuits Refinery to Produce Renewable Diesel, SAF, Bioplastics, Solar Power; Biobased Diesel Daily: Warren, MN, USA, 2020; Available online: https://www.biobased-diesel.com/post/total-investing-500-million-euros-converting-grandpuits-refinery-to-produce-hvo-saf-bioplastics (accessed on 9 April 2024).
  49. Honeywell. Honeywell Introduces New Technology to Produce Key Feedstock for Plastics. Available online: https://www.honeywell.com/us/en/press/2022/02/honeywell-introduces-new-technology-to-produce-key-feedstock-for-plastics (accessed on 9 April 2024).
  50. Zhao, Z.; Jiang, J.; Wang, F. An economic analysis of twenty light olefin production pathways. J. Energy Chem. 2021, 56, 193–202. [Google Scholar] [CrossRef]
  51. Neste. Borealis Producing Certified Renewable Polypropylene from Neste’s Renewable Propane at Own Facilities in Belgium. Available online: https://www.neste.com/news/borealis-producing-certified-renewable-polypropylene-from-neste-s-renewable-propane-at-own-facilities-in-belgium (accessed on 9 April 2024).
  52. Neste. Neste Delivers First Batch of 100% Renewable Propane to European Market. Available online: https://www.neste.com/news/neste-delivers-first-batch-of-100-renewable-propane-to-european-market (accessed on 9 April 2024).
  53. Quantum Commodity Intelligence. Available online: https://www.qcintel.com/ (accessed on 25 April 2024).
  54. EIA. U.S. Gulf Coast Kerosene-Type Jet Fuel Spot Price FOB (Dollars per Gallon). Available online: https://www.eia.gov/dnav/pet/hist/LeafHandler.ashx?n=PET&s=EER_EPJK_PF4_RGC_DPG&f=M (accessed on 12 August 2024).
  55. USDA. US Bioenergy Statistics. 2024. Available online: https://www.ers.usda.gov/data-products/u-s-bioenergy-statistics/ (accessed on 29 July 2025).
  56. Hofstrand, D. Tracking Biodiesel Profitability Ag Decision Maker. 2024. Available online: https://www.extension.iastate.edu/agdm/energy/html/d1-15.html (accessed on 5 August 2024).
  57. Carlson, N.A.; Talmadge, M.S.; Singh, A.; Tao, L.; Davis, R. Economic Impact and Risk Analysis of Integrating Sustainable Aviation Fuels into Refineries. Front. Energy Res. 2023, 11, 1223874. [Google Scholar] [CrossRef]
  58. DOE Alternative Fuels Data Center. Alternative Fuels Data Center: Fuel Properties Comparison. Available online: https://afdc.energy.gov/fuels/properties (accessed on 12 August 2024).
  59. Prussi, M.; Lee, U.; Wang, M.; Malina, R.; Valin, H.; Taheripour, F.; Velarde, C.; Staples, M.D.; Lonza, L.; Hileman, J.I. CORSIA: The First Internationally Adopted Approach to Calculate Life-Cycle GHG Emissions for Aviation Fuels. Renew. Sustain. Energy Rev. 2021, 150, 111398. [Google Scholar] [CrossRef]
  60. Unnasch, S. Review of EPA Workshop on Biofuel Greenhouse Gas Modeling; Growth Energy: Washington, DC, USA, 2022. [Google Scholar]
  61. UFOP. UFOP Report on Global Market Supply 2019–2020. 2020. Available online: https://www.ufop.de/files/1115/7953/1340/WEB_UFOP_Global_Supply_Report_A5_EN_19_20.pdf (accessed on 29 July 2025).
  62. UFOP. UFOP Report on Global Market Supply 2023–2024. 2024. Available online: https://www.ufop.de/files/8217/0548/9837/UFOP-2116_Report_Global_Market_Supply_A5_EN_23_24_160124.pdf (accessed on 29 July 2025).
  63. Lange, T. Presentation_Thorsten-Lange_2021-04-14_Neste-SAF.Pdf. 2021. Available online: https://www.europarl.europa.eu/cmsdata/232175/Presentation_Thorsten-Lange_2021-04-14_Neste-SAF.pdf (accessed on 3 November 2022).
  64. World Economic Forum. Clean Skies for Tomorrow: Sustainable Aviation Fuels as a Pathway to Net-Zero Aviation. 2020. Available online: https://www.weforum.org/publications/clean-skies-for-tomorrow-sustainable-aviation-fuels-as-a-pathway-to-net-zero-aviation/ (accessed on 26 April 2024).
  65. BioEnergy KDF. Billion-Ton 2023 Data Portal BioEnergy KDF. 2025. Available online: https://bioenergykdf.ornl.gov/bt23-data-portal (accessed on 29 July 2025).
  66. Stefanucci, D.; Barsali, T. Waste Feedstock Market Analysis. 2022. Available online: https://www.bio4a.eu/wp-content/uploads/2023/08/D-5.3-Waste-Feedstok-Market-Analysis.pdf (accessed on 29 July 2025).
  67. Canada’s Biojet Supply Chain Initiative. HEFA Production and Feedstock Selection. 2019. Available online: https://cbsci.ca/wp-content/uploads/CBSCI-HEFA-Production-and-Freedstock-Selection-single-page.pdf (accessed on 29 July 2025).
  68. Schmidt, J.; De Rosa, M. Certified Palm Oil Reduces Greenhouse Gas Emissions Compared to Non-Certified. J. Clean. Prod. 2020, 277, 124045. [Google Scholar] [CrossRef]
  69. Alcock, T.D.; Salt, D.E.; Wilson, P.; Ramsden, S.J. More Sustainable Vegetable Oil: Balancing Productivity with Carbon Storage Opportunities. Sci. Total Environ. 2022, 829, 154539. [Google Scholar] [CrossRef]
  70. Yeoh, M.L.; Goh, C.S. Hydrotreated Vegetable Oil Production from Palm Oil Mill Effluents: Status, Opportunities and Challenges. Biofuels Bioprod. Biorefining 2022, 16, 1153–1158. [Google Scholar] [CrossRef]
  71. Xu, H.; Lee, U.; Wang, M. Life-cycle energy use and greenhouse gas emissions of palm fatty acid distillate derived renewable diesel. Renew. Sustain. Energy Rev. 2020, 134, 110144. [Google Scholar] [CrossRef]
  72. Neste. Neste Sets Ambitious PFAD Targets: 100% Traceable in 2020. Available online: https://www.neste.com/news/neste-sets-ambitious-pfad-targets-100-traceable-in-2020 (accessed on 13 August 2024).
  73. Taheripour, F.; Sajedinia, E.; Karami, O. Oilseed Cover Crops for Sustainable Aviation Fuels Production and Reduction in Greenhouse Gas Emissions Through Land Use Savings. Front. Energy Res. 2022, 9, 790421. [Google Scholar] [CrossRef]
  74. Ritchie, H. Palm Oil. Published online at OurWorldinData.org. 2020. Available online: https://ourworldindata.org/palm-oil (accessed on 29 July 2025).
  75. Schillaci, C.; Perego, A.; Acutis, M.; Botta, M.; Tadiello, T.; Gabbrielli, M.; Barsali, T.; Tozzi, F.; Chiaramonti, D.; Jones, A. Assessing marginality of Camelina (C. sativa L. Crantz) in rotation with barley production in Southern Europe: A modelling approach. Agric. Ecosyst. Environ. 2023, 357, 108677. [Google Scholar] [CrossRef]
  76. CORDIS. Initiative Towards Sustainable Kerosene for Aviation FP7; CORDIS European Commission: Luxembourg, 2025; Available online: https://cordis.europa.eu/project/id/308807/reporting (accessed on 29 July 2025).
  77. Alam, A.; Dwivedi, P. Modeling site suitability and production potential of carinata-based sustainable jet fuel in the southeastern United States. J. Clean. Prod. 2019, 239, 117817. [Google Scholar] [CrossRef]
  78. Karami, O.; Dwivedi, P.; Lamb, M.; Field, J.M. Economics of Crop Rotations With and Without Carinata for Sustainable Aviation Fuel Production in the SE United States. Front. Energy Res. 2022, 10, 830227. [Google Scholar] [CrossRef]
  79. Gaveau, D.L.A.; Locatelli, B.; Salim, M.A.; Husnayaen, T.M.; Descals, A.; Angelsen, A.; Meijaard, E.; Sheil, D. Slowing Deforestation in Indonesia Follows Declining Oil Palm Expansion and Lower Oil Prices. PLoS ONE 2022, 17, e0266178. [Google Scholar] [CrossRef]
  80. Goldman, E.M.J.; Weisse, N.H.; Schneider, M. Estimating the Role of Seven Commodities in Agriculture-Linked Deforestation: Oil Palm, Soy, Cattle, Wood Fiber, Cocoa, Coffee, and Rubber; Technical Note; World Resources Institute: Washington, DC, USA, 2020. [Google Scholar] [CrossRef]
  81. RSPO. Impact Update 2023; RSPO: Kuala, Malasia, 2023; Available online: https://rspo.org/wp-content/uploads/Impact-Update-2023_.pdf (accessed on 29 July 2025).
  82. Loh. Biogas Capturing Facilities in Palm Oil Mills: Current Status and Way Forward—Palm Oil Engineering Bulletin. Available online: http://poeb.mpob.gov.my/biogas-capturing-facilities-in-palm-oil-mills-current-status-and-way-forward/ (accessed on 26 March 2024).
  83. Environment Protection Department (EPD), et Sabah. Guideline on Waste Management (Effluent and Solid Wastes) for Palm Oil Mills in Sabah; Environment Protection Department: Hong Kong, China, 2022. [Google Scholar]
  84. Taheripour, F.; Mueller, S.; Emery, I.; Karami, O.; Sajedinia, E.; Zhuang, Q.; Wang, M. Biofuels Induced Land Use Change Emissions: The Role of Implemented Land Use Emission Factors. Sustainability 2024, 16, 2729. [Google Scholar] [CrossRef]
  85. Wang, M. Opportunities for Lowering GHG Emissions of Corn Ethanol. 2022. Available online: https://www.energy.gov/sites/default/files/2022-03/02-beto-gen-1-wksp-wang.pdf (accessed on 29 July 2025).
  86. Naidu, L.; Moorthy, R.; Huda, M.I.M. The Environmental and Health Sustainability Challenges of Malaysian Palm Oil in the European Union. J. Oil Palm Res. 2024, 36, 1–15. [Google Scholar] [CrossRef]
  87. Schroeder, K. Waiting for Takeoff Ethanol Producer Magazine. Available online: https://ethanolproducer.com/articles/waiting-for-takeoff (accessed on 5 August 2024).
  88. O’Malley, J.; Pavlenko, N. Drawbacks of Adopting a ”Similar” LCA Methodology for U.S.; Sustainable Aviation Fuel (SAF): Singapore, 2023; Available online: https://theicct.org/wp-content/uploads/2023/09/ID-16-Briefing-letter-v3.pdf (accessed on 29 July 2025).
  89. IEA BioEnergy. IEA Bioenergy Webinar—Understanding Indirect Land-Use Change (ILUC) and Why Reality Is a Special Case—Bioenergy. Available online: https://www.ieabioenergy.com/blog/publications/iea-bioenergy-webinar-understanding-indirect-land-use-change-iLUC-and-why-reality-is-a-special-case/ (accessed on 13 August 2024).
  90. Trase. Brazil Beef—Supply Chain—Explore the Data—Trase; trase.earth: Oxford, UK, 2023; Available online: https://trase.earth/explore/supply-chain/brazil/beef (accessed on 14 October 2024).
  91. Steinfeld, H.; Gerber, P.; Wassenaar, T.; Castel, V.; Rosales, M.; de Haan, C. Livestock’s Long Shadow. 2006. FAO. Available online: https://www.fao.org/4/a0701e/a0701e.pdf (accessed on 29 July 2025).
  92. Freitas, G.; Veloso, T.; Chipman, K. US Edged out by Brazil Beef Fat Destined for Biofuels; Energy Connects: London, UK, 2024. [Google Scholar]
  93. Xu, H.; Ou, L.; Li, Y.; Hawkins, T.R.; Wang, M. Life Cycle Greenhouse Gas Emissions of Biodiesel and Renewable Diesel Production in the United States. Environ. Sci. Technol. 2022, 56, 7512–7521. [Google Scholar] [CrossRef]
  94. Gerveni, M.; Hubbs, T.; Irving, S. FAME Biodiesel, Renewable Diesel and Biomass-Based Diesel Feedstock Volume Estimates; Farmdoc Daily: Urbana, IL, USA, 2024. [Google Scholar]
  95. Lee, U.; Kwon, H.; Wu, M.; Wang, M. Retrospective Analysis of the U.S. Corn Ethanol Industry for 2005–2019: Implications for Greenhouse Gas Emission Reductions. Biofuels Bioprod. Biorefining 2021, 15, 1318–1331. [Google Scholar] [CrossRef]
  96. Edwards, R.; Padella, M.; Giuntoli, J.; Koeble, R.; O’ Connell, A.P.; Bulgheroni, C.; Marelli, L. Definition of Input Data to Assess GHG Default Emissions from Biofuels in EU Legislation: Version 1c—July 2017; JRC Publications Repository: Brussels, Belgium, 2017. [Google Scholar] [CrossRef]
  97. IEA BioEnergy. Comparison of Biofuel Life Cycle Analysis Tools—Phase 2, Part 1: FAME and HVO/HEFA; IEA: Paris, France, 2018; Available online: https://www.ieabioenergy.com/wp-content/uploads/2019/07/Task-39-CTBE-biofuels-LCA-comparison-Final-Report-Phase-2-Part-1-February-11-2019.pdf (accessed on 29 July 2025).
  98. Staples, M.D.; Malina, R.; Barrett, S.R.H. The Limits of Bioenergy for Mitigating Global Life-Cycle Greenhouse Gas Emissions from Fossil Fuels. Nat. Energy 2017, 2, 16202. [Google Scholar] [CrossRef]
  99. Staples, M.D.; Malina, R.; Suresh, P.; Hileman, J.I.; Barrett, S.R.H. Aviation CO2 Emissions Reductions from the Use of Alternative Jet Fuels. Energy Policy 2018, 114, 342–354. [Google Scholar] [CrossRef]
  100. de Oliveira, C.C.N.; Angelkorte, G.; Rochedo, P.R.R.; Szklo, A. The Role of Biomaterials for the Energy Transition from the Lens of a National Integrated Assessment Model. Clim. Change 2021, 167, 57. [Google Scholar] [CrossRef]
  101. de Oliveira, C.C.N.; Zotin, M.Z.; Rochedo, P.R.R.; Szklo, A. Achieving Negative Emissions in Plastics Life Cycles through the Conversion of Biomass Feedstock. Biofuels Bioprod. Biorefining 2021, 15, 430–453. [Google Scholar] [CrossRef]
  102. FORGE Hydrocarbons. FORGE Hydrocarbons Corporation; FORGE Hydrocarbons Corporation: Oakville, ON, Canada, 2024; Available online: http://www.forgehc.com/home.html (accessed on 21 June 2025).
  103. Bressler, D. Methods for Producing Hydrocarbon Compositions with Reduced Acid Number and for Isolating Short Chain Fatty Acids. U.S. Patent 10995276B2, 4 May 2021. Available online: https://patents.google.com/patent/US10995276B2/en (accessed on 29 June 2025).
  104. Hiebert, D.R. Decarboxylation and Hydrogenation of Safflower and Rapeseed Oils and Soaps to Produce Diesel Fuels. Master’s Thesis, Montana State University, Bozeman, MT, USA, 1985. Available online: https://scholar.google.com/scholar_lookup?title=Decarboxylation+and+Hydrogenation+of+Safflower+and+Rapeseed+Oils+and+Soaps+to+Produce+Diesel+Fuels&author=Hiebert,+D.R.&publication_year=1985 (accessed on 18 June 2025).
  105. Cheng, F.W. China Produces Fuels from Vegetable Oil. In Chemical Engineering 1945-01: Vol 52 Iss 1; Access Intelligence LLC. 1945. Available online: https://archive.org/details/sim_chemical-engineering_1945-01_52_1/page/98/mode/2up (accessed on 1 July 2025).
  106. Chang, C.-C.; Wan, S.-W. China’s Motor Fuels from Tung Oil. Ind. Eng. Chem. 1947, 39, 1543–1548. [Google Scholar] [CrossRef]
  107. FORGE Hydrocarbons. Forge Hydrocarbons To Build $30M Biofuel Plant In Ontario—Canadian Biomass Magazine. Available online: https://www.canadianbiomassmagazine.ca/forge-hydrocarbons-to-build-30m-biofuel-plant-in-ontario/ (accessed on 15 July 2025).
  108. European Bioplastics. Bioplastics Market Development Update 2024; European Bioplastics e.V.: Berlin, Germany, 2024; Available online: https://www.european-bioplastics.org/market/ (accessed on 22 June 2025).
  109. Khedr, M. Bio-Based Polyamide. Phys. Sci. Rev. 2021, 8, 76. [Google Scholar] [CrossRef]
  110. Eswaran, S.; Subramaniam, S.; Geleynse, S.; Brandt, K.; Wolcott, M.; Zhang, X. Techno-Economic Analysis of Catalytic Hydrothermolysis Pathway for Jet Fuel Production. Renew. Sustain. Energy Rev. 2021, 151, 111516. [Google Scholar] [CrossRef]
  111. Lam, S.S.; Wan Mahari, W.A.; Ok, Y.S.; Peng, W.; Chong, C.T.; Ma, N.L.; Chase, H.A.; Liew, Z.; Yusup, S.; Kwon, E.E.; et al. Microwave Vacuum Pyrolysis of Waste Plastic and Used Cooking Oil for Simultaneous Waste Reduction and Sustainable Energy Conversion: Recovery of Cleaner Liquid Fuel and Techno-Economic Analysis. Renew. Sustain. Energy Rev. 2019, 115, 109359. [Google Scholar] [CrossRef]
  112. Omidghane, M.; Bartoli, M.; Asomaning, J.; Xia, L.; Chae, M.; Bressler, D.C. Pyrolysis of Fatty Acids Derived from Hydrolysis of Brown Grease with Biosolids. Environ. Sci. Pollut. Res. Int. 2020, 27, 26395–26405. [Google Scholar] [CrossRef]
  113. Chen, G.; Liu, C.; Ma, W.; Zhang, X.; Li, Y.; Yan, B.; Zhou, W. Co-Pyrolysis of Corn Cob and Waste Cooking Oil in a Fixed Bed. Bioresour. Technol. 2014, 166, 500–507. [Google Scholar] [CrossRef]
  114. Wang, Z.; An, S.; Zhao, J.; Sun, P.; Lyu, H.; Kong, W.; Shen, B. Plastic Regulates Its Co-Pyrolysis Process with Biomass: Influencing Factors, Model Calculations, and Mechanisms. Front. Ecol. Evol. 2022, 10, 964936. [Google Scholar] [CrossRef]
  115. Anshu, K.; Kenttämaa, H.I.; Thengane, S.K. A Comprehensive Review on Co-Pyrolysis of Lignocellulosic Biomass and Polystyrene. Renew. Sustain. Energy Rev. 2024, 205, 114832. [Google Scholar] [CrossRef]
  116. Engamba Esso, S.B.; Xiong, Z.; Chaiwat, W.; Kamara, M.F.; Longfei, X.; Xu, J.; Ebako, J.; Jiang, L.; Su, S.; Hu, S.; et al. Review on Synergistic Effects during Co-Pyrolysis of Biomass and Plastic Waste: Significance of Operating Conditions and Interaction Mechanism. Biomass Bioenergy 2022, 159, 106415. [Google Scholar] [CrossRef]
  117. Federal Economic Development Agency for Southern Ontario. Two Renewable Fuel Producers Scale up to Increase Productivity and Economic Growth in Rural Southwestern Ontario; Government of Canada: Ottawa, ON, Canada, 2020. Available online: https://www.canada.ca/en/economic-development-southern-ontario/news/2020/07/two-renewable-fuel-producers-scale-up-to-increase-productivity-and-economic-growth-in-rural-southwestern-ontario.html (accessed on 15 July 2025).
  118. Wang, Y.; Dai, L.; Fan, L.; Cao, L.; Zhou, Y.; Zhao, Y.; Liu, Y.; Ruan, R. Catalytic Co-Pyrolysis of Waste Vegetable Oil and High Density Polyethylene for Hydrocarbon Fuel Production. Waste Manag. 2017, 61, 276–282. [Google Scholar] [CrossRef] [PubMed]
  119. Sergius, P.; Prats, A.E. Process of Producing Gasoline and Other Hydrocarbons from Coconut Oil and Related Animal and Vegetable Oils and Fats. US2437438A, 9 March 1948. Available online: https://patents.google.com/patent/US2437438A/en (accessed on 18 June 2025).
  120. Barbera, E.; Naurzaliyev, R.; Asiedu, A.; Bertucco, A.; Resurreccion, E.P.; Kumar, S. Techno-Economic Analysis and Life-Cycle Assessment of Jet Fuels Production from Waste Cooking Oil via in Situ Catalytic Transfer Hydrogenation. Renew. Energy 2020, 160, 428–449. [Google Scholar] [CrossRef]
  121. Burli, P.H.; Hartley, D.S.; Thompson, D.N. Woody Feedstocks 2021 State of Technology Report; Idaho National Laboratory: Idaho Falls, ID, USA, 2021. [Google Scholar] [CrossRef]
  122. Thompson, D.N.; Hartley, D.S.; Wiatrowski, M.R.; Klinger, J.; Paudel, R.; Ou, L.; Cai, H. Techno-Economic and Life-Cycle Analysis of Strategies for Improving Operability and Biomass Quality in Catalytic Fast Pyrolysis of Forest Residues. Next Energy 2025, 7, 100225. [Google Scholar] [CrossRef]
  123. Besseau, R.; Scarlat, N.; Hurtig, O.; Motola, V.; Bouter, A. Assessing the Carbon Intensity of E-Fuels Production in European Countries: A Temporal Analysis. Appl. Sci. 2024, 14, 10299. [Google Scholar] [CrossRef]
  124. Nguyen, E.; Olivier, P.; Pera, M.-C.; Pahon, E.; Roche, R. Impacts of Intermittency on Low-Temperature Electrolysis Technologies: A Comprehensive Review. Int. J. Hydrogen Energy 2024, 70, 474–492. [Google Scholar] [CrossRef]
  125. Pipitone, G.; Zoppi, G.; Pirone, R.; Bensaid, S. Sustainable Aviation Fuel Production Using In-Situ Hydrogen Supply via Aqueous Phase Reforming: A Techno-Economic and Life-Cycle Greenhouse Gas Emissions Assessment. J. Clean. Prod. 2023, 418, 138141. [Google Scholar] [CrossRef]
  126. Air Liquide. Profits Without Subsidies? 2020. Available online: https://engineering.airliquide.com/sites/engineering/files/2022-07/air_liquide_biodiesel_final.pdf (accessed on 12 October 2024).
  127. Dutta, A.; Sahir, A.; Tan, E. Process Design and Economics for the Conversion of Lignocellulosic Biomass to Hydrocarbon Fuels: Thermochemical Research Pathways with In Situ and Ex Situ Upgrading of Fast Pyrolysis Vapors; NREL: Golden, Colorado, 2015; p. 275. [Google Scholar]
  128. Swanson, R.M.; Satrio, J.A.; Brown, R.C. Techno-Economic Analysis of Biofuels Production Based on Gasification 1 Novembre 2010; NREL: Golden, Colorado, 2010. [Google Scholar] [CrossRef]
  129. Irwin, S. Biodiesel Prices and Profits…Again. Farmdoc Daily 2024, 14, n49. Available online: https://farmdocdaily.illinois.edu/2024/03/biodiesel-prices-and-profits-again.html (accessed on 1 July 2025).
  130. van Dyk, S.; Saddler, J. Progress in Commercialization of Biojet/Sustainable Aviation Fuels (SAF): Technologies, Potential and Challenges. 2021. Available online: https://www.ieabioenergy.com/wp-content/uploads/2021/06/IEA-Bioenergy-Task-39-Progress-in-the-commercialisation-of-biojet-fuels-May-2021-1.pdf (accessed on 1 July 2025).
  131. IEA Energy. Will More Wind and Solar PV Capacity Lead to More Generation Curtailment?—Renewable Energy Market Update—June 2023—Analysis; IEA: Paris, France, 2023; Available online: https://www.iea.org/reports/renewable-energy-market-update-june-2023/will-more-wind-and-solar-pv-capacity-lead-to-more-generation-curtailment (accessed on 5 August 2024).
  132. Ritchie, H.; Rosado, P.; Roser, M. “Energy”. Data Adapted from Ember, Energy Institute. “Data Page: Carbon Intensity of Electricity Generation”, Part of the Following Publication. 2023. Available online: https://ourworldindata.org/grapher/carbon-intensity-electricity (accessed on 1 July 2025).
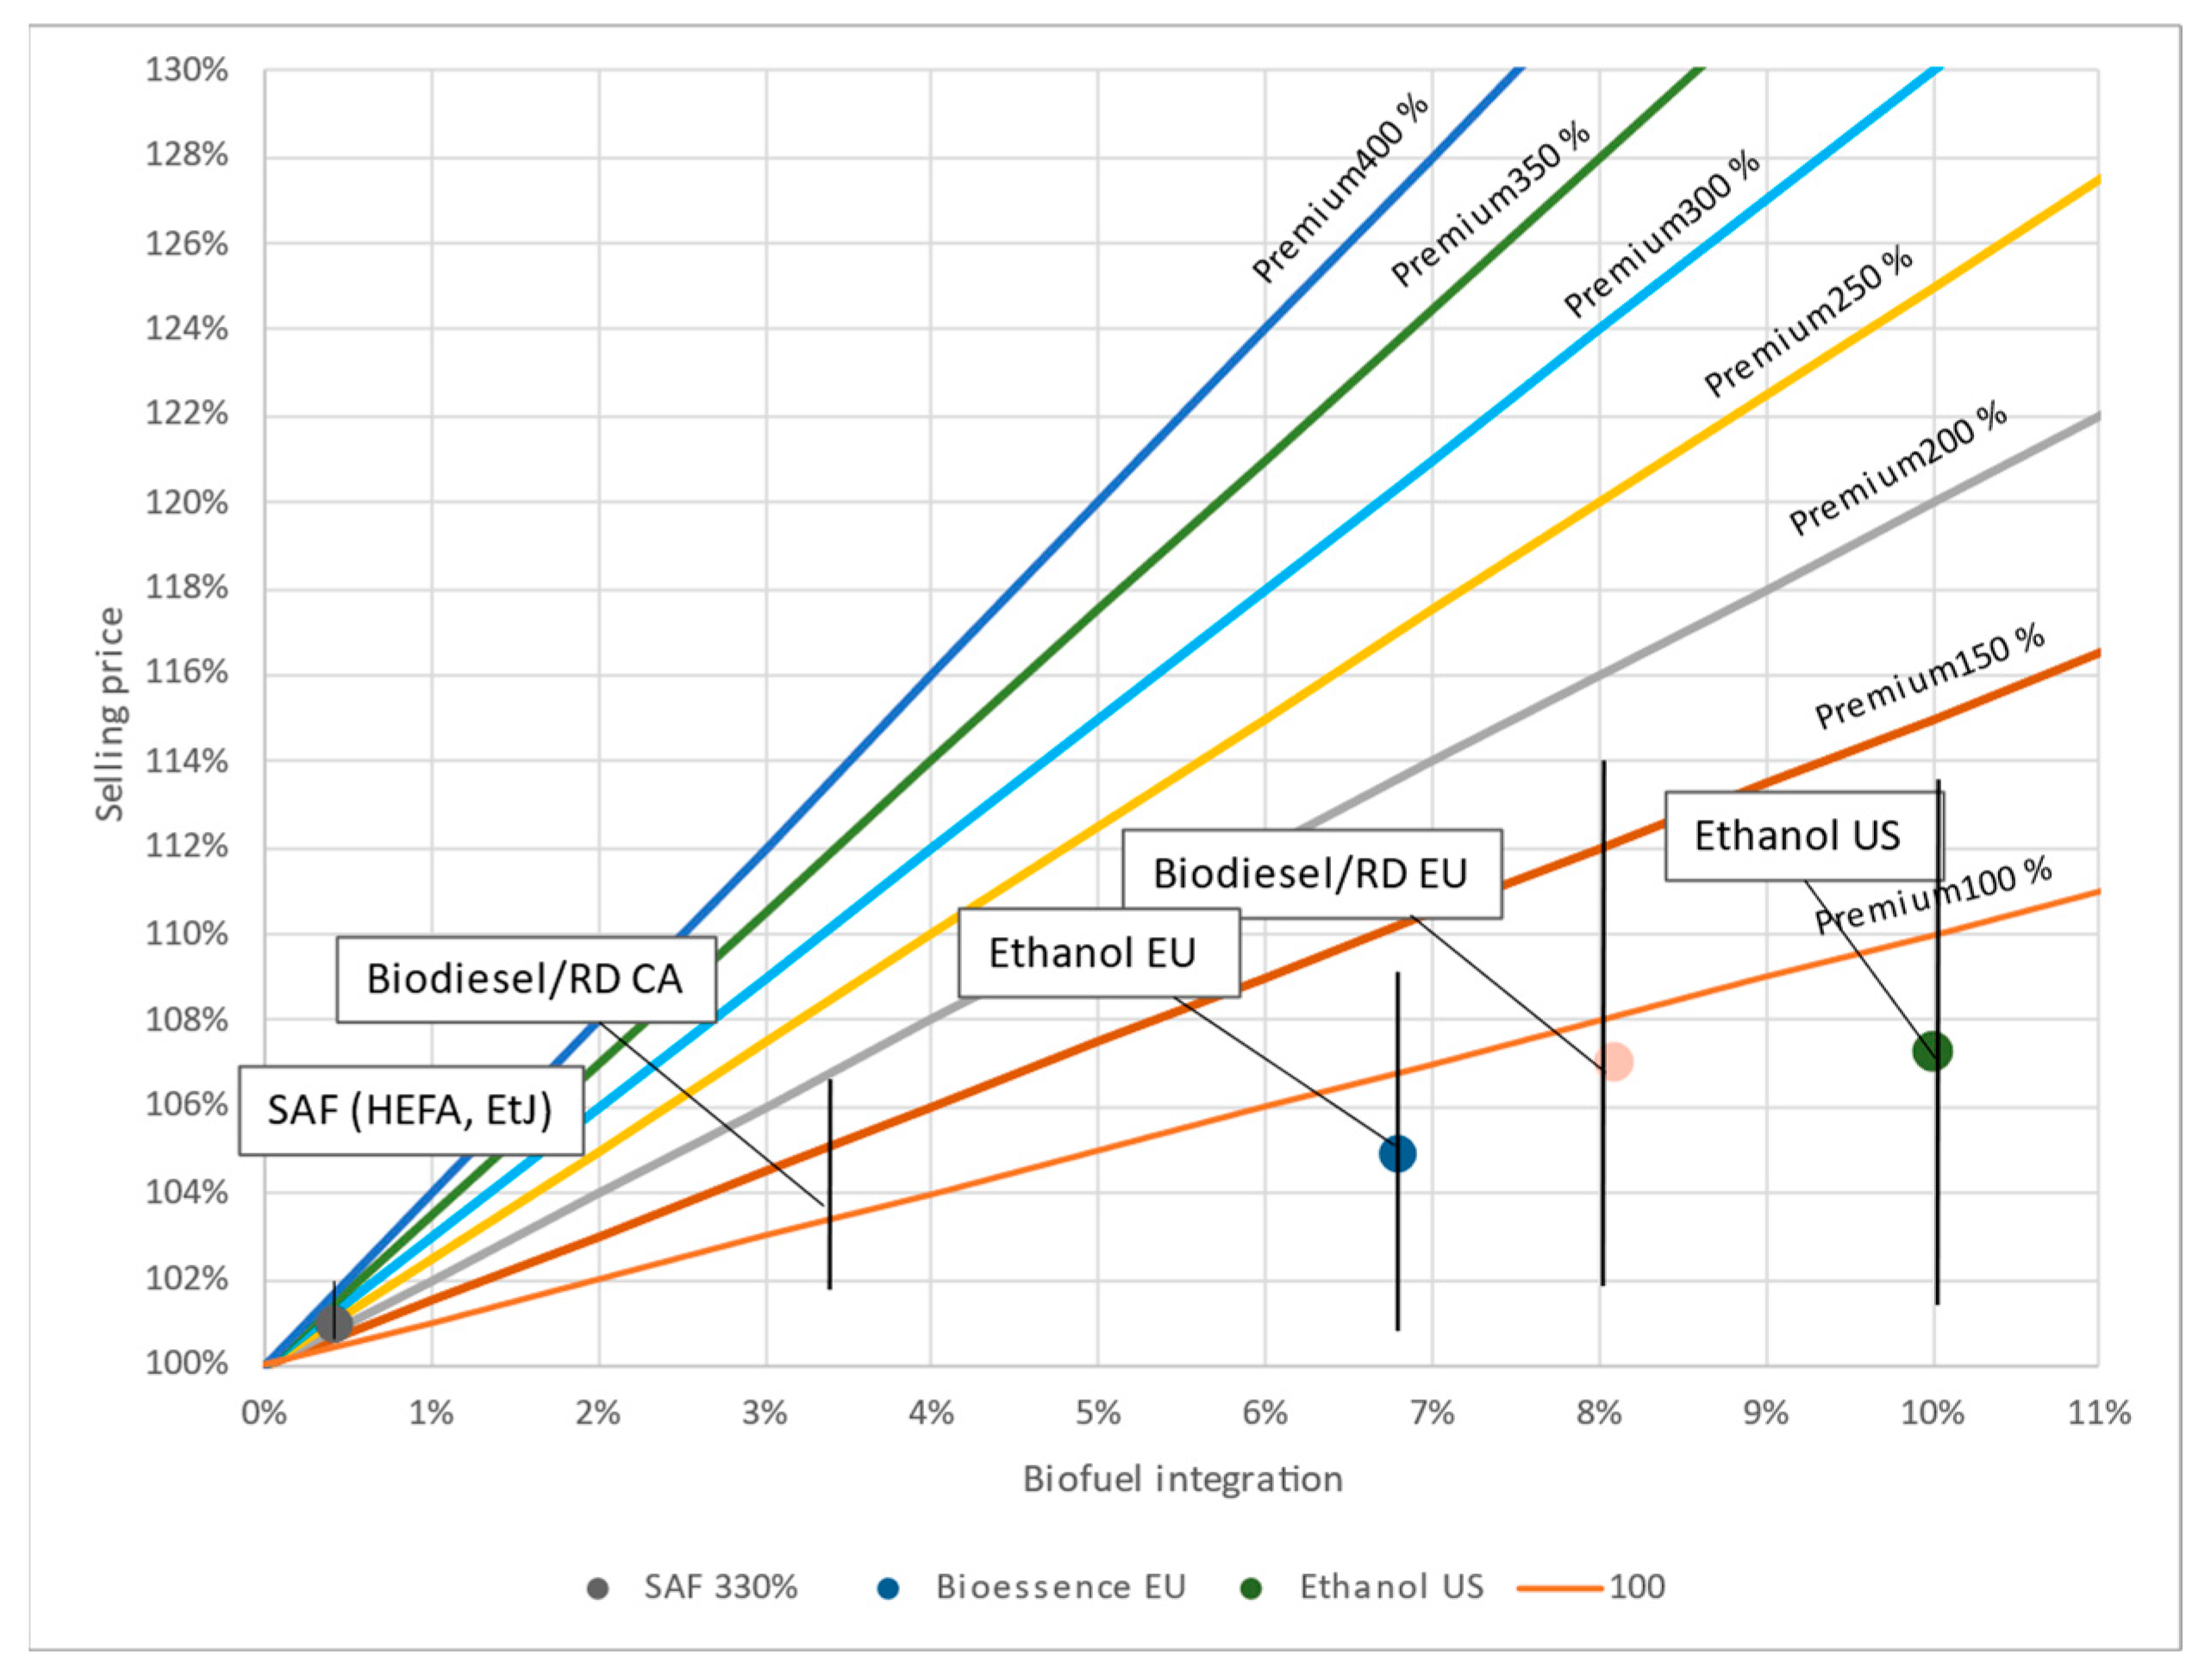
Figure 1. Sustainable fuel integration rate impact on selling price. Estimation of market integration (x axis) and selling price (y axis) is given based on expected premium cost from 100 to 400% [28].
Energies 18 04156 g001
Figure 2. Soybean RD and SAF compared to fossil diesel and jet fuel.
Energies 18 04156 g002
Figure 3. Resource premiums for RD and SAF compared to fossil fuels (diesel and jet).
Energies 18 04156 g003
Figure 4. Feedstock used for biodiesel in 2018 and 2022 [61,62].
Energies 18 04156 g004
Figure 5. Estimated kabupaten CI for HEFA production, considering peatland conversion before and after 2003.
Energies 18 04156 g005
Figure 6. Resources used for BD and RD in the U.S. [94] and potential cumulative CI if these resources were used for SAF.
Energies 18 04156 g006
Figure 7. Effect of yield variations on the carbon intensity of HEFA-tJ pathway when used with various resources.
Energies 18 04156 g007
Figure 8. Carbon intensity evaluation for HEFA-tJ, BD, and RD.
Energies 18 04156 g008
Figure 9. GHG emissions avoided for HEFA pathways according to yield and resources.
Energies 18 04156 g009
Figure 10. Social cost (USD/t) of GHG reduction for HEFA-tJ, RD, and BD from 2017 to 2023. BD production is evaluated both with its current feedstock usage and the RD feedstock usage in the U.S. The latter option requires the adoption of new technologies to be possible.
Energies 18 04156 g010
Table 1. HEFA-tJ vs. HEFA-road yields and selectivity.
Pearlson et al., 2013 [19]Zech et al., 2018 [20]
HEFA-tJHEFA-RoadHEFA-tJHEFA-Road
Jet fuels49.412.845.412
Diesel fuels23.368.1866
Naphtha71.8274
Refinery gas10.25.87.23
Yield without conversion losses88908688
Yield with conversion losses79867384
Table 2. CORSIA official CI for HEFA-tJ with different resources [18].
RegionFeedstockCore LCA ValueiLUC LCATotal (g/MJ)
GlobalTallow22.5022.5
GlobalUsed cooking oil 13.913.9
GlobalPalm fatty Acid Distillate20.720.7
GlobalCorn oil17.217.2
USASoybean oil40.424.564.9
BrazilSoybean oil40.42767.4
EURapeseed oil47.424.171.5
Malaysia and IndonesiaPalm oil-closed pond37.439.176.5
Malaysia and IndonesiaPalm oil-open pond6039.199.1
Table 3. Main hypotheses of the compared models between LUC and iLUC.
ModelScopeShock Size
(PJ)
Peatland Conversion Emission Factor
(t/ha)
Palm Oil Expansion on Peatland
(%)
Considered ParametersMathematic Formulation for CI
(Simplified)
Peatland Fire
(PF)
LUC Subsidence (S)
GTAP-BIOCountry-level
HEFA production
207.738.133?xx(LUC + S)/Shock (25 years)
GLOBIUM-9020
CORSIA207.738.133GTAP-BIO + 4.45 g/MJ
TRASERegional level
Palm oil production
-90Regional dataxxxPF + LUC + S
This studyRegional level
HEFA production based on palm oil emissions
460 (BD)38.1Regional data ( P F + L U C + S ) P r o d Y i e l d F u e l   E n e r g y   D e n s i t y
Table 4. Evaluation of kabupaten CI based on TRASE data.
UnitTotal Palm Oil Production (t/y)Average CIPeatland Conversion (% w/o < 2003)Total Emissions (Mt)
(w/o < 2003, Year 2022)
% Indonesian Palm Oil Production
(2021)
w < 2003w/o < 20035 Year av.
30 high producing kabupaten>430 t/y26,626,69259.844.574.210.441.963.4
Very high CI>200 g/MJ1,934,031297.7231.1250.650.515.74.6
High CI100–200 g/MJ 2,944,526135.873.6102.912.89.17
Low CI<20 g/MJ7,373,8628.7720.21.32.217.6
Table 5. Average CI distribution between peatland fire, LUC, and subsidence.
Sample SizeAverage Peatland Fire
CI
Average LUC CIAverage Subsidence CI
w/o < 20035 Year av.w/o < 20035 Year av.
30 high producing kabupaten302293.46.239
Very high CI732.448.26.410.1192.3
High CI106.539139.8254.1
Low CI90.019.71.25.26.4
Table 6. TCI for HEFA-tJ and BD based on the literature and company announcements.
ReferencePlant TypeData TypeCapacity kt/y FeedstockTCI (USD/t Feedstock)TCI (2024)
Zech. H. et al., 2018 [20]HEFA-tJLiterature500
260
116–378
1470
396550
Tao. L, et al., 2017 [42]HEFA-tJLiterature13461869
Pearlson, M. et al., 2013 [19]HEFA-tJLiterature293-619440–937
Neste [8]HEFA-tJAnnouncement 1337
World Energy Paramount [9] HEFA-tJAnnouncement1500 1337
TotalEnergy Grandpuits [48]HEFA-tJAnnouncement470 ~1168
Hofstrand, D., 2024 [56]BDTEA106 493
AirLiquide 2022 [126]BDAnnouncement50–350 315–475
Our estimatesHEFA-tJNo SMR included>1000 1200–1600
Our estimatesRDNo SMR included700 1080–1440
Our estimatesBD 110 500–650
Table 7. Main hypotheses for the simplified economic model.
Simplified Economic Model Hypothesis
Study period (SP)15
DepreciationTCI/SP
RI7%%TCI
Taxes2%%TCI
Maintenance5%%TCI
Resource cost hypotheses (by ton of feedstock)
Methanol cost441$/t
NG cost335$/t
H2 cost2000$/t
Electricity cost0.08$/kWh
Table 8. Resource usage hypotheses.
Resource Usage Hypothesis for Different Pathways (by Ton of Feedstock)
BDMethanol105kg/t
NG46kg/t
Electricity179kWh/t
RDH229.8kg/t
Electricity66kWh/t
HEFA-tJH235.7kg/t
Electricity66kWh/t
Table 9. Carbon intensity and GHG reduction of HEFA-tJ, RD, and BD with US resource usage.
CI g/MJCI ReductionMJ/kg Fuelg/kg of GHG Avoided by Feedstock
HEFA-tJ BD mix54.2939%40.51111
HEFA-tJ RD mix38.2357%40.51624
BD mix43.3152%37.371725
RD mix31.1266%43.22236
Disclaimer/Publisher’s Note: The statements, opinions and data contained in all publications are solely those of the individual author(s) and contributor(s) and not of MDPI and/or the editor(s). MDPI and/or the editor(s) disclaim responsibility for any injury to people or property resulting from any ideas, methods, instructions or products referred to in the content.