Article

Stochastic Optimization Scheduling Method for Mine Electricity–Heat Energy Systems Considering Power-to-Gas and Conditional Value-at-Risk

1
CEC Technical & Economic Consulting Center of Power Construction, Electric Power Development Research Institute Co., Ltd., Beijing 100053, China
2
School of Economics and Management, Yanshan University, Qinhuangdao 066000, China
*
Author to whom correspondence should be addressed.
Energies 2025, 18(15), 4146; https://doi.org/10.3390/en18154146
Submission received: 24 June 2025 / Revised: 27 July 2025 / Accepted: 28 July 2025 / Published: 5 August 2025

Abstract

To fully accommodate renewable and derivative energy sources in mine energy systems under supply and demand uncertainties, this paper proposes an optimized electricity–heat scheduling method for mining areas that incorporates Power-to-Gas (P2G) technology and Conditional Value-at-Risk (CVaR). First, to address uncertainties on both the supply and demand sides, a P2G unit is introduced, and a Latin hypercube sampling technique based on Cholesky decomposition is employed to generate wind–solar-load sample matrices that capture source–load correlations, which are subsequently used to construct representative scenarios. Second, a stochastic optimization scheduling model is developed for the mine electricity–heat energy system, aiming to minimize the total scheduling cost comprising day-ahead scheduling cost, expected reserve adjustment cost, and CVaR. Finally, a case study on a typical mine electricity–heat energy system is conducted to validate the effectiveness of the proposed method in terms of operational cost reduction and system reliability. The results demonstrate a 1.4% reduction in the total operating cost, achieving a balance between economic efficiency and system security.

1. Introduction

With the accelerated global transition towards a clean and low-carbon energy structure and the deepening implementation of China’s “dual carbon” strategic goals, the traditional mining industry, characterized by high energy consumption and high emissions, is confronted with unprecedented pressure to achieve energy conservation, emission reduction, and sustainable development [1,2]. Mining production activities, particularly large-scale open-pit mining and deep underground mining, are quintessential energy-intensive industries. These activities not only consume substantial amounts of electricity but also involve significant demands for thermal energy, such as for heating in mining areas and heat used in washing and sorting processes [3]. The satisfaction of energy demands within mining areas is highly reliant on fossil fuels, such as coal and natural gas. This dependency not only results in substantial operational costs but also constitutes a significant source of greenhouse gas emissions and environmental pollution. Consequently, the transition towards a cleaner, more efficient, and intelligent energy system in mining areas has become an imperative choice for the sustainable development of the industry.
During the production process, a substantial amount of derivative energy is generated within mining areas. In terms of their physical states, these derivative energies can be categorized into gaseous, liquid, and solid forms. The gaseous derivatives include exhausted air and coal mine methane, among others. The liquid derivatives consist of mine water inflow, etc. The solid derivatives include coal gangue, among others [4]. For the energy system of mining areas, the full utilization of derivative energy sources not only effectively reduces environmental pollution but also enhances overall energy utilization efficiency. Additionally, mining enterprises typically possess vast tracts of idle land (such as waste rock dumps, tailing ponds, and industrial plazas) and rooftop resources, which provide favorable conditions for the deployment of distributed photovoltaic (PV) and wind power generation systems. However, the inherent intermittency and fluctuation of renewable energy sources pose severe challenges to the stable and reliable energy supply in mines [5,6]. Mining production is characterized by its continuity and safety sensitivity, and thus, it demands extremely high stability and quality of power supply [7]. The effective mitigation of fluctuations in renewable power generation output, along with the high-proportion integration of renewable energy and its derivatives while achieving precise alignment with mining production loads, constitutes a fundamental challenge in establishing a green mining area’s electricity–heat integrated energy system (MIES).
In this context, Power-to-Gas (P2G) technology, as a highly promising flexibility resource and energy storage solution, offers a novel approach to addressing the aforementioned challenges [8,9]. P2G technology comprises two distinct phases. The first phase involves electrolyzing water to produce hydrogen using surplus electricity, particularly during off-peak periods or times of abundant wind/solar generation. In the second phase, the produced hydrogen is combined with carbon dioxide (CO2) through methanation, thereby not only consuming electrical energy but also reducing CO2 emissions. Consequently, P2G technology has gained widespread adoption.
Currently, scholars both domestically and internationally have conducted relevant research on MIES. Liang R et al. [10], considering the demand response capability of the entire production process in mining areas and the energy balance constraints of the system, proposed a high-quality coal mine energy system optimization model to achieve the full integration of renewable energy. Miao Q et al. [11] proposed a self-correcting optimization strategy for mining area energy systems with asymmetric prediction error fusion coefficients to enhance load forecasting accuracy, thereby effectively reducing system scheduling costs. Liu J et al. [12] proposed a multi-objective optimal coordination dispatch model for abandoned coal mine energy systems, incorporating P2G and power-to-hydrogen (P2H) technologies, aiming to minimize operational costs and carbon emissions. Wu F et al. [13] conducted a comprehensive review on utilizing underground coal mine spaces for energy storage, analyzing and discussing various energy storage technologies tailored for subsurface environments, along with their associated risks and challenges, with the aim of advancing the development of underground energy storage systems in abandoned mines. Xiong Y et al. [14] conducted a systematic review of advancements in green coal mining, encompassing intelligent green mining technologies and the green co-extraction of coal and its derivative resources, with a particular emphasis on the rational utilization of derivative resources as a critical research focus in mining area energy systems.
On the other hand, the inherent uncertainty in renewable energy output and load fluctuations poses significant risks to the dispatch decision-making and secure operation of MIES. Consequently, developing optimal dispatch strategies to mitigate or quantify the impact of these uncertainties on mining area energy systems, thereby ensuring both economic efficiency and operational security, has emerged as a critical research focus in academia. Currently, the predominant approaches for addressing uncertainties primarily include robust optimization [15,16], stochastic optimization [17,18], and fuzzy optimization [19,20], among others. Each method exhibits distinct characteristics and applicability in handling different types of uncertainty in mining area energy systems. Robust optimization accounts for the most extreme operating scenarios of the system, often yielding overly conservative dispatch results that compromise operational economic efficiency. Meanwhile, the selection of membership degrees in fuzzy optimization exhibits strong subjectivity. Stochastic optimization transforms uncertain problems into deterministic ones by generating discrete scenarios based on probability distributions of source–load variations. However, the computational burden increases significantly with a large number of discrete scenarios. Typically, scenario reduction techniques are required to cluster and retain representative scenarios for dispatch decision-making. It should be noted that the performance of traditional K-means algorithms depends heavily on the pre-specified number of clusters [21]. Moreover, multiple stochastic factors within the same region—including wind power, photovoltaic generation, and load demand—typically exhibit significant correlations. Xiang Y et al. [22] investigated the spatiotemporal correlation between wind and photovoltaic power to enhance PV utilization efficiency in complex mountainous regions. Ru Y et al. [23] established a probabilistic model of joint PV-wind power generation using copula functions. Subsequently, they employed Latin hypercube sampling combined with an improved K-means clustering technique to derive typical output scenarios. Zhong M et al. [24] utilized a MemoryFormer architecture to mine latent temporal correlations between reconstructed and enhanced wind-PV power output data.
However, the existing research exhibits several limitations: (1) None of the aforementioned studies quantitatively analyzed the economic risks induced by uncertainty factors. The Conditional Value-at-Risk (CVaR) [25], as a risk measurement metric, demonstrates superior advantages over Value at Risk (VaR) [26], including monotonicity, subadditivity, and accurate tail risk estimation. These properties enable CVaR to effectively evaluate operational risks in mining-area energy systems at specified confidence levels, thereby enhancing system security and reliability. (2) Existing studies on MIES have largely overlooked the utilization of derivative energy sources within the system, such as mine ventilation air methane (VAM) and mine water discharge. This oversight leads to significant resource wastage. Specifically, VAM refers to coal mine methane with a concentration below 0.75%, also known as coal mine ventilation air methane. Its long-term direct emission not only represents energy loss but also exacerbates the greenhouse effect due to methane’s high global warming potential. Therefore, MIES should incorporate technologies for VAM recovery and utilization to achieve both energy efficiency and environmental benefits.
Building upon existing research, this study develops an optimal dispatch strategy for mining-area energy systems by comprehensively considering P2G technology and source–load correlations. The proposed framework incorporates CVaR to quantitatively assess operational risks, thereby establishing a risk-aware optimization model for electricity–heat integrated energy systems in mining regions. The main contributions of this work are as follows:
  • A Cholesky decomposition technique is employed to analyze source–load correlations in the mining-area integrated energy system (MIES). Building upon this correlation structure, Latin hypercube sampling (LHS) is implemented to generate a source–load sample matrix with predetermined correlation coefficients, followed by Affinity Propagation clustering to produce representative scenarios.
  • With the objective of minimizing the total cost, which is constituted by dispatching cost, expected adjustment cost, and CVaR, a stochastic optimization dispatch model for the mining area energy system incorporating P2G technology is formulated. This model enables the reduction in operational costs of the mining area energy system and the enhancement of the renewable energy utilization rate while effectively addressing the impact of uncertain power outputs on both the supply and demand sides.
  • A simulation study of the proposed optimal dispatch model was conducted on a typical mining area energy system to verify the model’s performance in terms of reducing operational costs and enhancing renewable energy accommodation, as well as the necessity of considering the correlation between supply and demand sides.
The rest of this paper is organized as follows: The structure of MIES containing P2G is analyzed in Section 2. In Section 3, the operation model of the unit in MIES is introduced. The model is simulated from several angles in Section 4, and the main conclusions are presented in Section 5.

2. The MIES Structure and Source–Load Risk Measurement

2.1. Analysis of the Architecture of the MIES Containing P2G

The architecture of the mining area’s electricity–heat integrated energy system incorporating P2G technology, as constructed in this study, is depicted in Figure 1.
In the MIES, the energy supply side consists of the external power grid, gas network, wind energy, photovoltaic (PV), mine ventilation air methane, and mine water discharge. The utilization equipment for derivative energy includes devices such as exhausted air heat storage oxidation units and water source heat pumps. The energy coupling equipment primarily comprises a micro gas turbine (MT) unit and a P2G system. On the demand side, the system caters to both electrical and thermal loads. In this system, the primary sources of uncertainty stem from the renewable energy sources on the supply side, namely wind energy and PV, as well as the loads on the demand side. Neglecting these uncertainties may increase the operational risks of the system, especially under extreme weather conditions, where the output of renewable energy sources may significantly decrease, thereby heightening the risk to energy supply security. Moreover, this can lead to the underutilization of renewable and derivative energy sources, thereby increasing the operational costs and CO2 emissions of the system.

2.2. Generation of Typical Scenes on Both Sides of the Source and Load

The operation of the MIES is confronted with multiple uncertainties, including the fluctuating output of renewable energy sources and the variability of electrical load. Affected by natural environmental factors such as temperature and wind speed, these uncertain variables within the same region usually exhibit a certain degree of correlation. Based on this, this section employs the Spearman rank correlation coefficient to analyze historical data of wind speed, solar irradiance, and electrical load in a certain region of China. The resulting correlation heatmap is shown in Figure 2.
This study employs stochastic optimization to characterize the uncertainties of supply and demand. Stochastic optimization involves sampling based on the probability distributions of supply and demand to obtain discrete scenarios for handling uncertainties. Specifically, the probability models for the prediction errors of solar irradiance, wind speed, and electrical load are described using the beta distribution, Weibull distribution, and normal distribution, respectively. In terms of correlation control, the Cholesky decomposition method is a simple, practical, and widely adopted technique for managing the correlation structure among samples of random variables [27]. The Cholesky-based LHS method approximates the correlation matrix of the generated sample matrix to that of the historical data through procedures such as sampling and sorting. The detailed sampling steps can be found in reference [28]. Finally, 1000 samples of solar irradiance, wind speed, and electrical load are generated.
To avoid excessive computational burden caused by generating a large number of samples, clustering algorithms are commonly employed to reduce the sample set. The selected clustering algorithm should strive to preserve the correlation structure among the random variables within the generated samples. Affinity Propagation (AP) clustering is an unsupervised clustering algorithm based on message-passing mechanisms for cluster formation [29]. It is capable of adaptively determining the final number of clusters, and its resulting cluster centers correspond to actual data points within the sample set. Compared with traditional clustering algorithms such as K-means, the AP algorithm exhibits greater robustness to outliers and anomalies, resulting in more stable clustering outcomes. The detailed procedure of the AP clustering algorithm can be found in Ref. [29] and is therefore not reiterated in this paper.

2.3. Risk Measurement of the MIES

Due to the uncertainties associated with energy sources and loads, the system’s operational cost is exposed to risk. CVaR, a widely used risk measure in the field of economics, provides an effective means of capturing tail risk. A brief overview of the CVaR theory is presented below.
Let x denote the decision variable and y the uncertainty variable, with p ( y ) representing the probability density function of y . Given a fixed decision, the associated loss function is defined as L ( x , y ) . At a specified confidence level α , the VaR is defined as follows:
f V a R x = m i n θ L ( x , y ) p ( y ) α
where f V a R x is the VaR value at the confidence level α , and θ is the boundary value of the loss function L ( x , y ) . In this paper, the CVaR is evaluated at a 95% confidence level ( α = 0.95 ) to quantify the expected tail risk of operational costs under worst-case scenarios.
The VaR represents the maximum potential loss over a given future period. However, due to its limitations—such as difficulty in capturing tail risk, non-convexity, and failure to satisfy subadditivity—this paper adopts CVaR as the risk measure. CVaR is defined as the expected loss exceeding the VaR threshold, as expressed in Equation (2).
F C V a R = 1 1 α L ( x , y ) θ L ( x , y ) p ( y ) d x
Typically, CVaR cannot be directly computed using Equation (2); instead, an auxiliary function is introduced to facilitate its calculation, as shown in Equation (3).
F C V a R = f V a R + 1 1 α L x , y θ + p ( y ) d y
where L x , y θ + = m a x L x , y θ , 0 .
When the probability distribution of the random variable y is continuous, it can be discretized by sampling N scenarios. In this case, Equation (3) can be reformulated as follows:
F C V a R = θ + 1 1 α s = 1 N L x , y θ + π s
where N is the number of discrete scenes, and π s is the probability of scenes occurring; it reflects the empirical frequency of observed source–load patterns, ensuring statistically representative sampling.

3. Optimization Scheduling Model for MIES

3.1. Objective Function

The objective function of the MIES primarily comprises two components: the operational cost and the risk-related cost measure. The total operational cost includes external energy transaction cost F b u y , equipment operation and maintenance cost F o m , system carbon emission cost F c o , renewable and derivative energy curtailment cost F c u t , and adjustment expectation cost F a d .
min F = F 1 + F 2 + β F C V a R F 1 = F b u y + F o m + F c o + F c u t F 2 = F a d
where F C V a R is the risk measurement cost of the system, and β is the risk coefficient. CVaR is mainly used to measure the risk of changes in system operating costs caused by uncertain factors. F 1 is the system operation scheduling cost, and F 2 is the adjustment expected cost. t represents the scheduling time period, and T is the scheduling cycle t T .
(1) External energy transaction cost F b u y
F b u y = t = 1 T P g r i d , t c g r i d + V g a s , t c g a s
where P g r i d , t and c g r i d are the purchased electricity from the grid and the corresponding electricity prices, respectively. V g a s , t and c g a s are the natural gas volume purchased from the gas market and the corresponding gas price, respectively.
(2) Equipment operation and maintenance cost F o m
F o m = t = 1 T P k , t C k
where P k , t is the power consumed by the k -th class device, and C k is the operation and maintenance cost of the k -th class device.
(3) Carbon emission cost F c o
F c o = t = 1 T P k 1 , t ε k 1 M c o , t N c o λ c o
where ε k 1 is the carbon emission coefficient per unit power of the k 1 st equipment in the mining area’s electric thermal energy system, excluding P2H. M c o , t is the amount of carbon dioxide consumed during the hydrogen methanation process, while N c o is the system’s carbon quota. λ c o is the average carbon trading price.
(4) Renewable and derivative energy curtailment cost F c u t
F c u t = t = 1 T P c u t , t W T + P c u t , t P V c c u t R + P c u t , t R T + P c u t , t W S c c u t O
where P c u t W T and P c u t P V are the abandoned energy of wind and photovoltaic power, respectively. c c u t R represents the abandoned energy cost of renewable energy. P c u t R T and P c u t W S represent the abandoned energy of mine ventilation air methane and mine water discharge, respectively, while c c u t O represents the abandoned energy cost of derivative energy.
(5) Adjustment expectation cost F a d
F a d = s = 1 N π s t = 1 T F t , s r , M T + F t , s r , g r i d
where F t , s r , M T and F t , s r , g r i d represent the cost of calling gas turbines and external grid backup resources in scenario s, respectively. The detailed calculation formulas for the scheduling and dispatch costs of various types of reserve resources can be found in Ref. [30] and are therefore omitted in this paper.

3.2. Operating Constraints

3.2.1. Two-Stage P2G System

In the P2G system, the first stage involves the electrolysis process in which water is decomposed into hydrogen and oxygen through the electrolyzer.
P t E L H = η E L P t E L P E L m i n P t E L P E L m a x P d o w n E L P t E L P t 1 E L P u p E L V t H 2 = P t E L η E L / H H V
where P u p E L and P d o w n E L are the up and down ramp rates of the electrolyzer, respectively. P t E L H is the hydrogen production power of the electrolyzer, and H H V is the high calorific value of hydrogen gas. P E L m i n and P E L m a x are the minimum and maximum hydrogen production power of the electrolyzer, respectively. V t H 2 is the gas production of the P2G system. η E L is the efficiency of the electrolyzer. The first line reflects the conversion efficiency of electrical energy to hydrogen energy, the second line ensures that the equipment operates under safe conditions, the third line represents the climbing constraints of the equipment, and the fourth line represents the calculation of hydrogen production.
The efficiency of the electrolyzer varies with its power output, exhibiting an initial increase followed by a decrease. Within the operating range considered in this study, the electrolyzer efficiency is approximately linear and is expressed by the following formula:
η E L = 0.18 P t E L P r a t e E L + 0.926
where P r a t e E L is the rated power input that the electrolytic cell can maintain during continuous operation.
After the electrolysis process is completed, the produced hydrogen can be transported to a reactor where it reacts with carbon dioxide to generate C H 4 through methanation. Methanation enables the storage of excess renewable energy in the form of C H 4 , thereby facilitating the accommodation of renewable energy output within the system. The reaction process can be represented as follows:
V M R , t C H 4 = ξ η M R P t E L H / L C H 4 V M R , t C H 4 = V M R , t C O 2 M c o , t = ρ c o 2 V M R , t C O 2
where V M R , t C H 4 is the volume of natural gas produced by the methane reactor. The energy conversion efficiency of the methane reactor is represented by η M R . M c o , t is the consumption of carbon dioxide. ρ c o 2 is the density of carbon dioxide. V M R , t C O 2 is the hourly volumetric consumption of CO2 by the MR during methanation. ξ is a practical adjustment factor accounting for non-ideal conversion efficiency in the methanation reaction.
The cost of P2G primarily originates from electricity expenses and raw material costs, with CO2 being the predominant contributor. Considering the costs associated with CO2 procurement, transportation, and storage, the overall system cost of CO2 typically exceeds the base price observed in the carbon trading market. This is because the effective CO2 cost for P2G (0.502 DKK/kg) includes purification and transportation premiums, exceeding the carbon market price (0.252 DKK/kg) due to technical requirements for methanation [8].

3.2.2. Micro Gas Turbine Unit (MT)

The gas turbine obtains natural gas from the external gas network and the P2G system. While generating electricity through combustion, it simultaneously recovers heat from the high-temperature exhaust gases to meet the thermal load demands of the mining site. The operational constraints of the MT unit are as follows:
s M T , t s d s M T , t s M T , t 1 s M T , t s u 0 s M T , t s u + s M T , t s d 1 s M T , t P M T m i n P M T , t s M T , t P M T m a x r M T P M T , t P M T , t 1 r M T P M T , t = V g a s , t + V M R , t C H 4 η M T L N G 3600 Q M T , t = P M T , t 1 η M T η M T , l η M T P M T , t r m i n P M T m a x P M T , t , r M T
where Q M T , t is the residual heat of the MT during the period t , and η M T , l is the heat loss coefficient of the MT. s M T , t is a 0–1 variable, which means MT is on or off during the period t . P M T , t is the output of MT during the period t . P M T m i n and P M T m a x represent the minimum and maximum output of MT, respectively.   r M T represents the ramping rate of MT. L N G is the low calorific value of natural gas. P M T , t r represents the reserve power from MT. s M T , t s u and s M T , t s d is a 0–1 variable, which means MT starts up or not during the period t . η M T is the power generation efficiency of MT.

3.2.3. Exhausted Air Heat Storage Oxidation Unit (RT)

During coal mining operations, low-concentration methane gas (commonly referred to as “exhaust gas”) is generated. Direct discharge of this gas can lead to significant environmental pollution. The operational constraints of the RT are as follows:
Q R T , t = V f w , t d f w , t L N G η R T Q R T m i n Q R T , t Q R T m a x r R T Q R T , t Q R T , t 1 r R T
where Q R T , t is the heat generation of the RT unit. Q R T m i n and Q R T m a x are the minimum and maximum values of heat generation, respectively. V f w , t is the flow rate of the exhaust mixed gas, d f w , t is the concentration of the exhaust mixed gas, and η R T is the efficiency of the RT unit. r R T is the climbing efficiency of the RT unit.

3.2.4. Water Source Heat Pump Unit (WS) and Air Source Heat Pump Unit (AS)

Water source heat pumps (WS) provide heating services to mining areas by extracting low-temperature thermal energy from mine drainage. Air source heat pump (AS) serves as a backup heat source to supplement heating when the thermal energy of mine drainage is insufficient. The operational constraints of WS and AS are as follows:
Q W S , t = P W S , t η W S Q W S m i n Q W S , t Q W S m a x r W S Q W S , t Q W S , t 1 r W S
where Q W S , t is the heat generation of the water source heat pump unit, and P W S , t is the corresponding power consumption. η W S is the heating energy efficiency ratio.
Q A S , t = P A S , t η A S Q A S m i n Q A S , t Q A S m a x r A S Q A S , t Q A S , t 1 r A S
where Q A S , t is the heat generation of the air source heat pump unit, and P A S , t is the corresponding power consumption. η A S is the heating energy efficiency ratio.

3.2.5. Battery and Thermal Energy Storage Unit (BT, TT)

Batteries and thermal energy storage can provide flexible regulation capabilities for system operation by temporarily storing and releasing energy, with the following operational constraints:
P t B T = P 0 B T + t = 1 T E t c h η c h t t = 1 T E t d i s η d i s t P T B T = P 0 B T P B T , t m i n P t B T P B T , t m a x 0 E t c h s c h , t E t c h , m a x ,   0 E t d i s s d i s , t E t d i s , m a x 0 s c h , t + s d i s , t 1
Q t T T = Q 0 T T + t = 1 T H t c h η T T , c h t t = 1 T H t d i s η T T , d i s t Q T T T = Q 0 T T Q T T , t m i n Q t T T Q T T , t m a x 0 H t c h u c h , t H t c h , m a x ,   0 H t d i s u d i s , t H t d i s , m a x 0 u c h , t + u d i s , t 1
where P t B T is the energy stored in BT, and P 0 B T is the initial state. E t c h and E t d i s are the charging and discharging power, respectively. η c h and η d i s are the charging and discharging efficiency, respectively. P B T , t m i n and P B T , t m a x are the minimum and maximum power, respectively. E t c h , m a x and E t d i s , m a x are the maximum charging and discharging power, respectively. s c h , t and s d i s , t are the 0–1 variables. In addition, TT have similar constraints.

3.2.6. Renewable Energy and Purchased Energy Constraint

0 P c u t , t W T P W T , t f 0 P c u t , t P V P P V , t f
where P W T , t f is the predicted WT output, and P P V , t f is the predicted PV output.
0 P g r i d , t P g r i d m a x P g r i d , t r P g r i d m a x P g r i d , t 0 V g a s , t V g a s m a x
where P g r i d m a x is the maximum amount of electricity purchased from the external power grid, and V g a s m a x is the maximum amount of gas purchased from the external gas grid.

3.2.7. Power Balance Constraint

P M T , t + P P V , t + P W T , t + P g r i d , t + E t d i s = E t c h + P c u t , t W T + P c u t , t P V + P A S , t + P W S , t + P t E L + P t l o a d Q A S , t + Q W S , t + Q R T , t + Q M T , t + H t d i s = H t c h + Q t l o a d
where P t l o a d and Q t l o a d are the system electrical load and thermal load, respectively.

3.2.8. CVaR Constraint

For discrete distributions, based on the relevant introduction in Section 2.3, CVaR can be transformed into the following linear programming problem for solution.
F C V a R = min ξ , θ s ξ + 1 1 α s Ω π s θ s
s.t.
t = 1 T F b u y + F o m + F c o + F c u t + F a d ξ θ s
where ξ is the VaR value, Ω is the set composed of all scenes s . θ s represents the portion of the scheduling cost of the electric thermal energy system in the mining area that exceeds ξ in scenario s, θ s 0 .

3.3. Model Solving

The decision variables in the model can be categorized into the scheduling plan variables X , the scenario-specific reserve deployment variables Y , and the auxiliary variables ( ξ and θ s ) introduced in the CVaR constraint formulation. Since both the variable Y and the objective function F C V a R are scenario-dependent, and the feasible domain of variable Y is constrained by the values of variable X , it is necessary to determine variable X prior to solving for variable Y . Accordingly, the original problem can be reformulated as a bi-level optimization model, as shown in Equations (25) and (26), with the upper-level optimization problem defined in Equation (25).
m i n F X , Y = F 1 X + s = 1 N π S F 2 , s X , Y s + β F C V a R s . t .   h X = 0 g ( X ) 0
where F 1 X and F 2 , s X , Y s are the operating and scheduling costs of the MIES and the adjustment costs under scenario s , respectively. h X and g ( X ) are the equality constraint and inequality constraint related to variable X , respectively.
After the variable X is determined, the lower level solves for the backup adjustment amount Y s in scenarios.
m i n G X , Y s = s = 1 N π S F 2 , s X , Y s + β F C V a R s . t .   h s X , Y s = 0 ,   s = 1,2 , , N g s ( X , Y s ) 0 ,   s = 1,2 , , N
where G X , Y s is a lower-level optimization model that can be transformed into N independent subproblems for solution.
This article uses an improved genetic algorithm to iteratively optimize the upper variable X . After X is determined, the lower objective function and constraints can be solved using mature commercial software CPLEX.

4. System Simulation

4.1. Parameter Settings

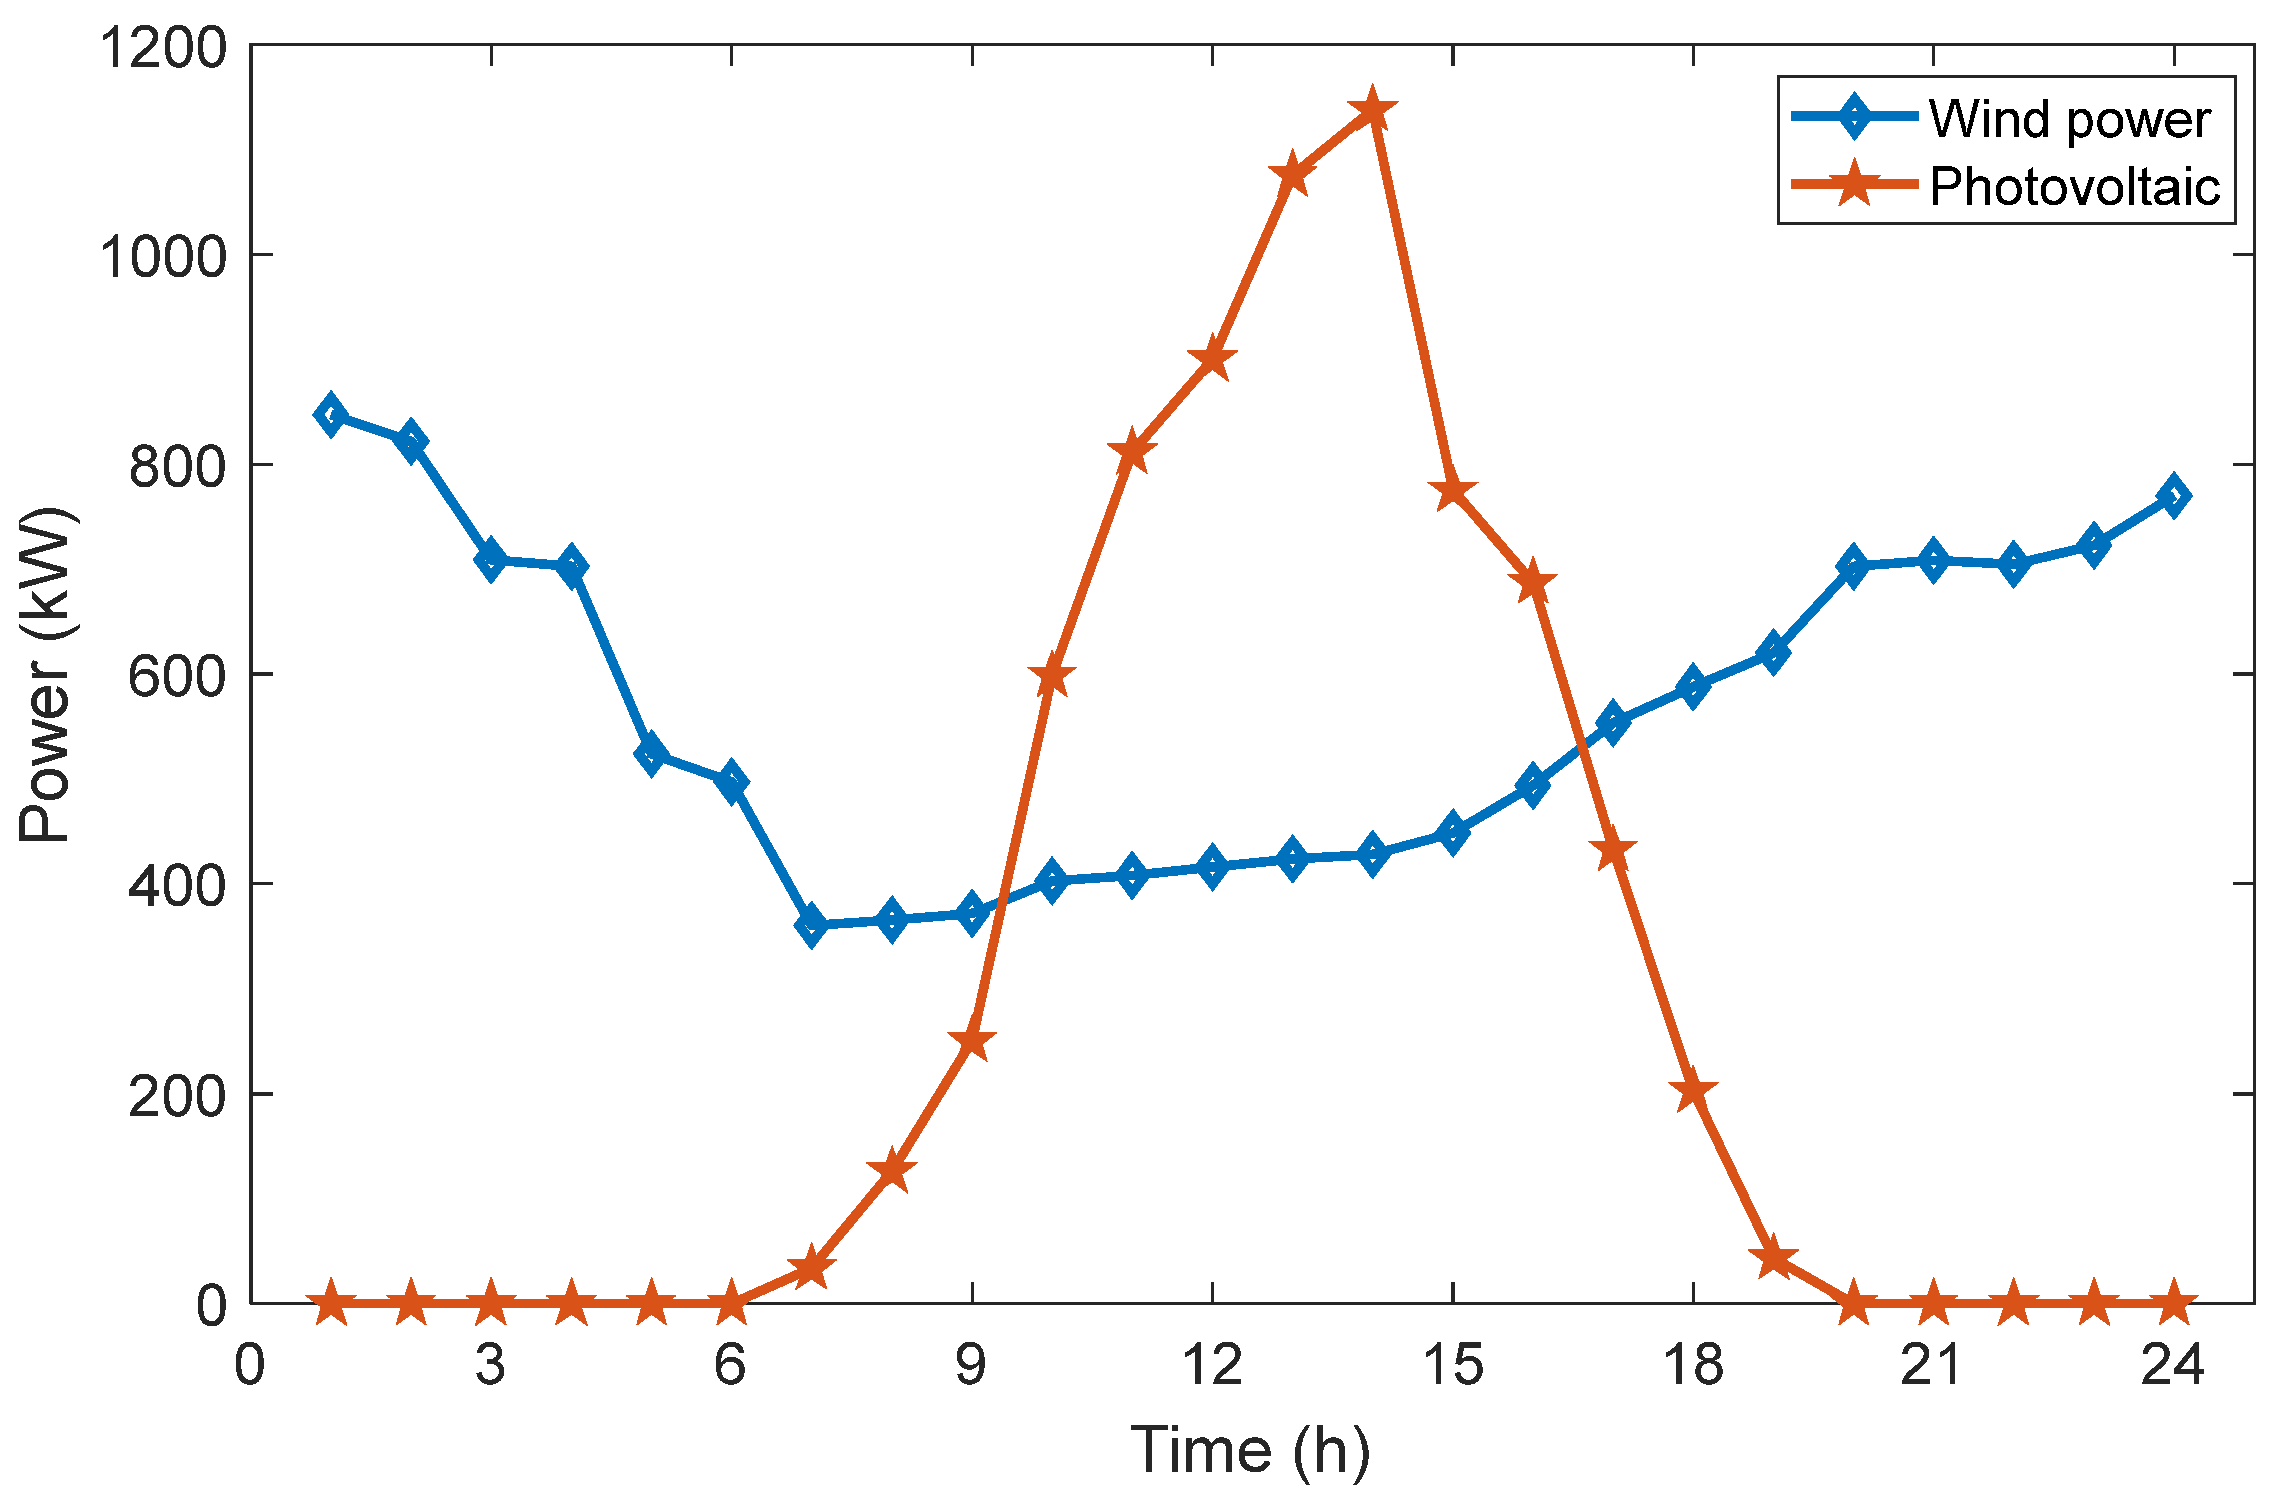
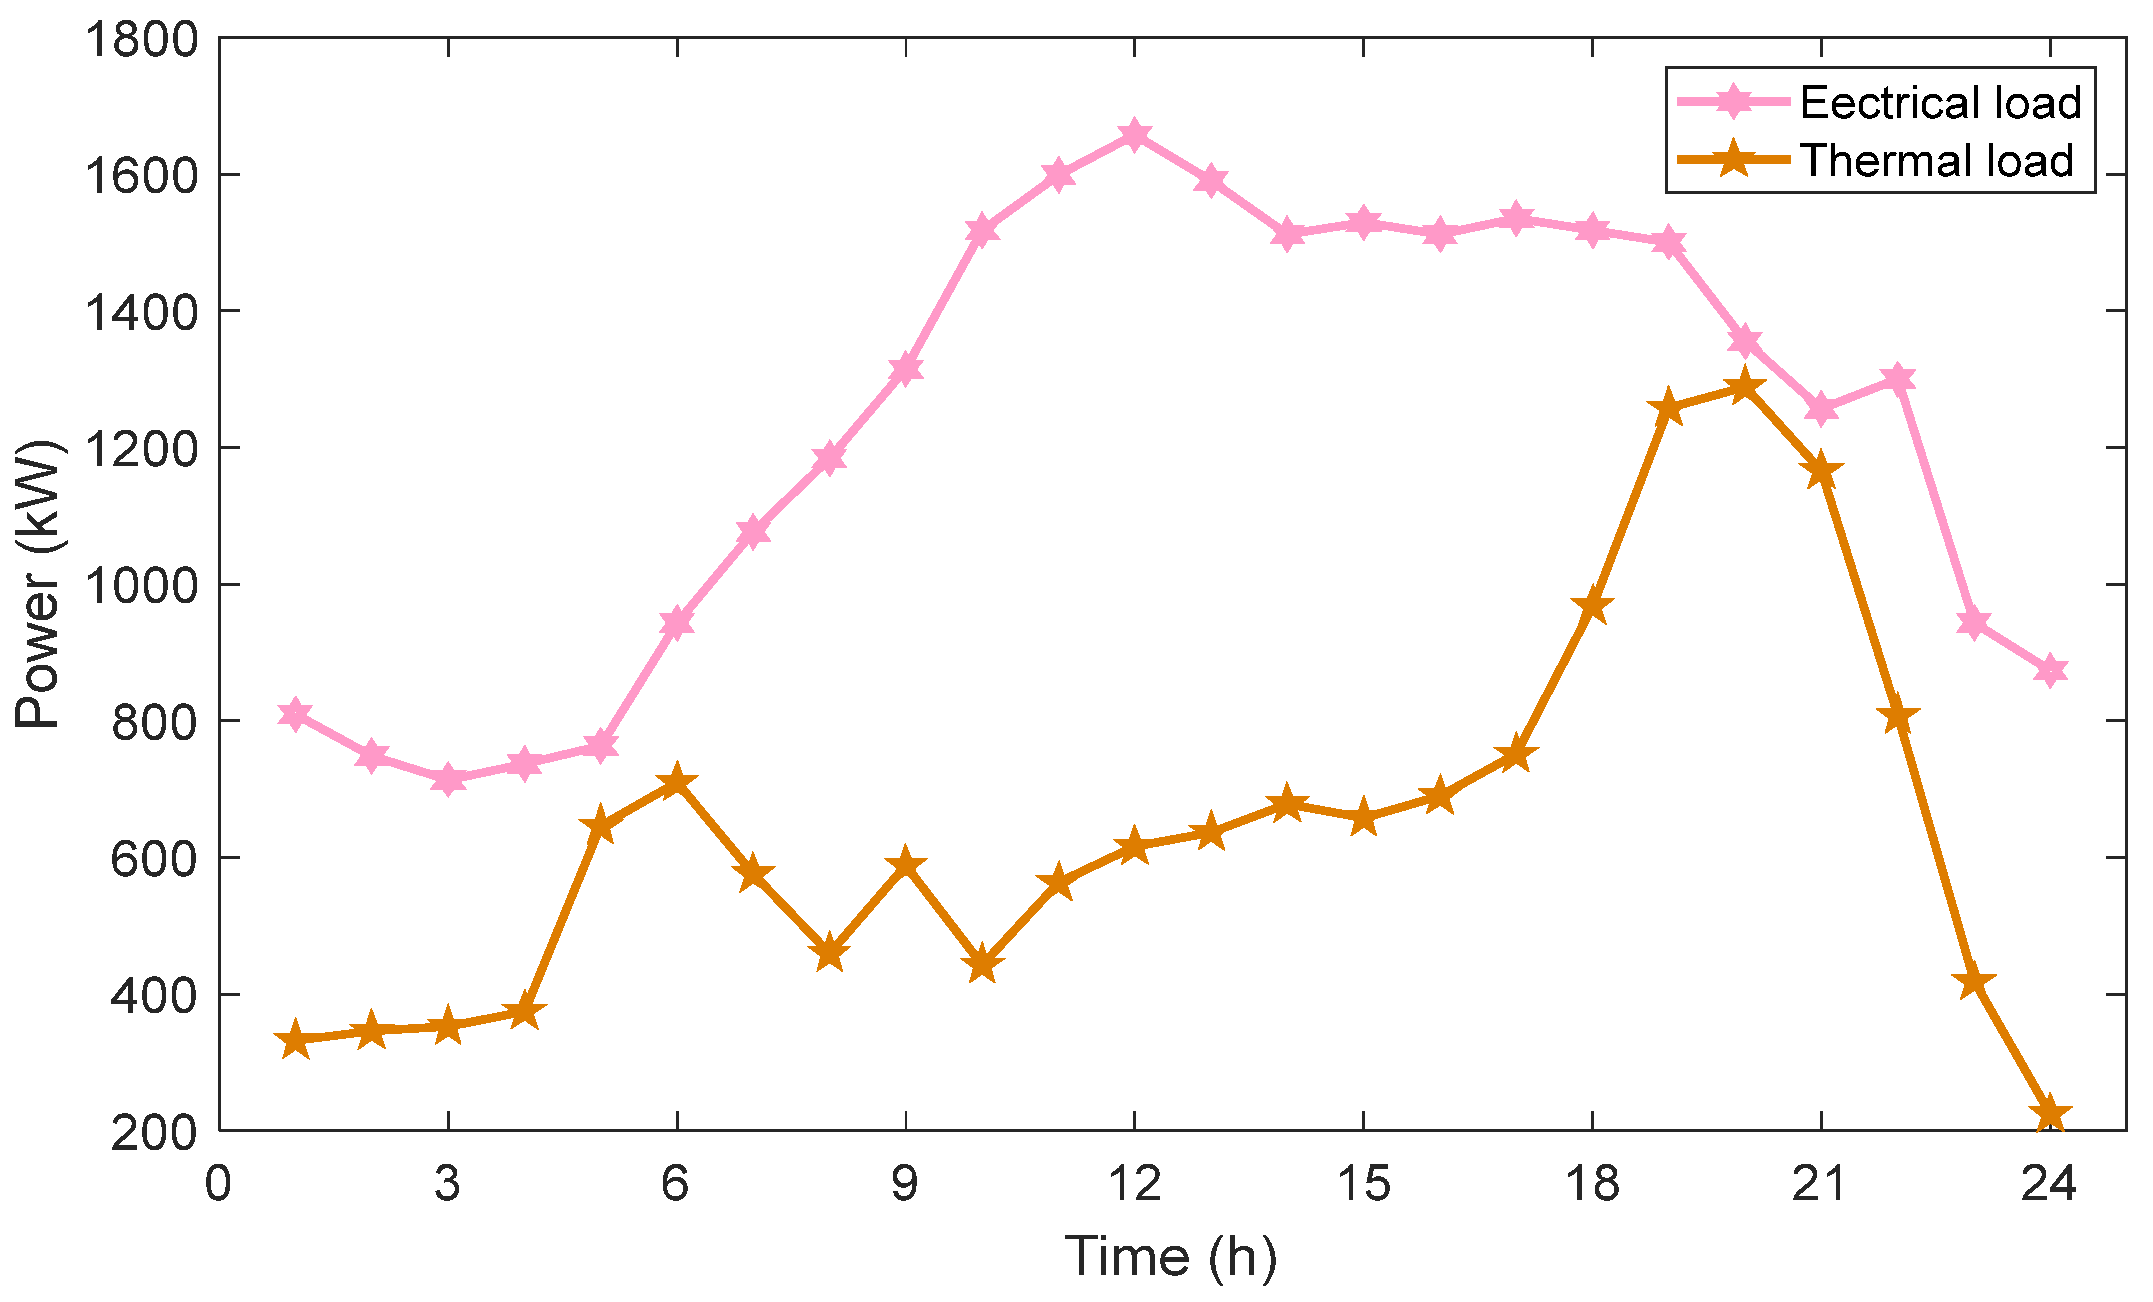
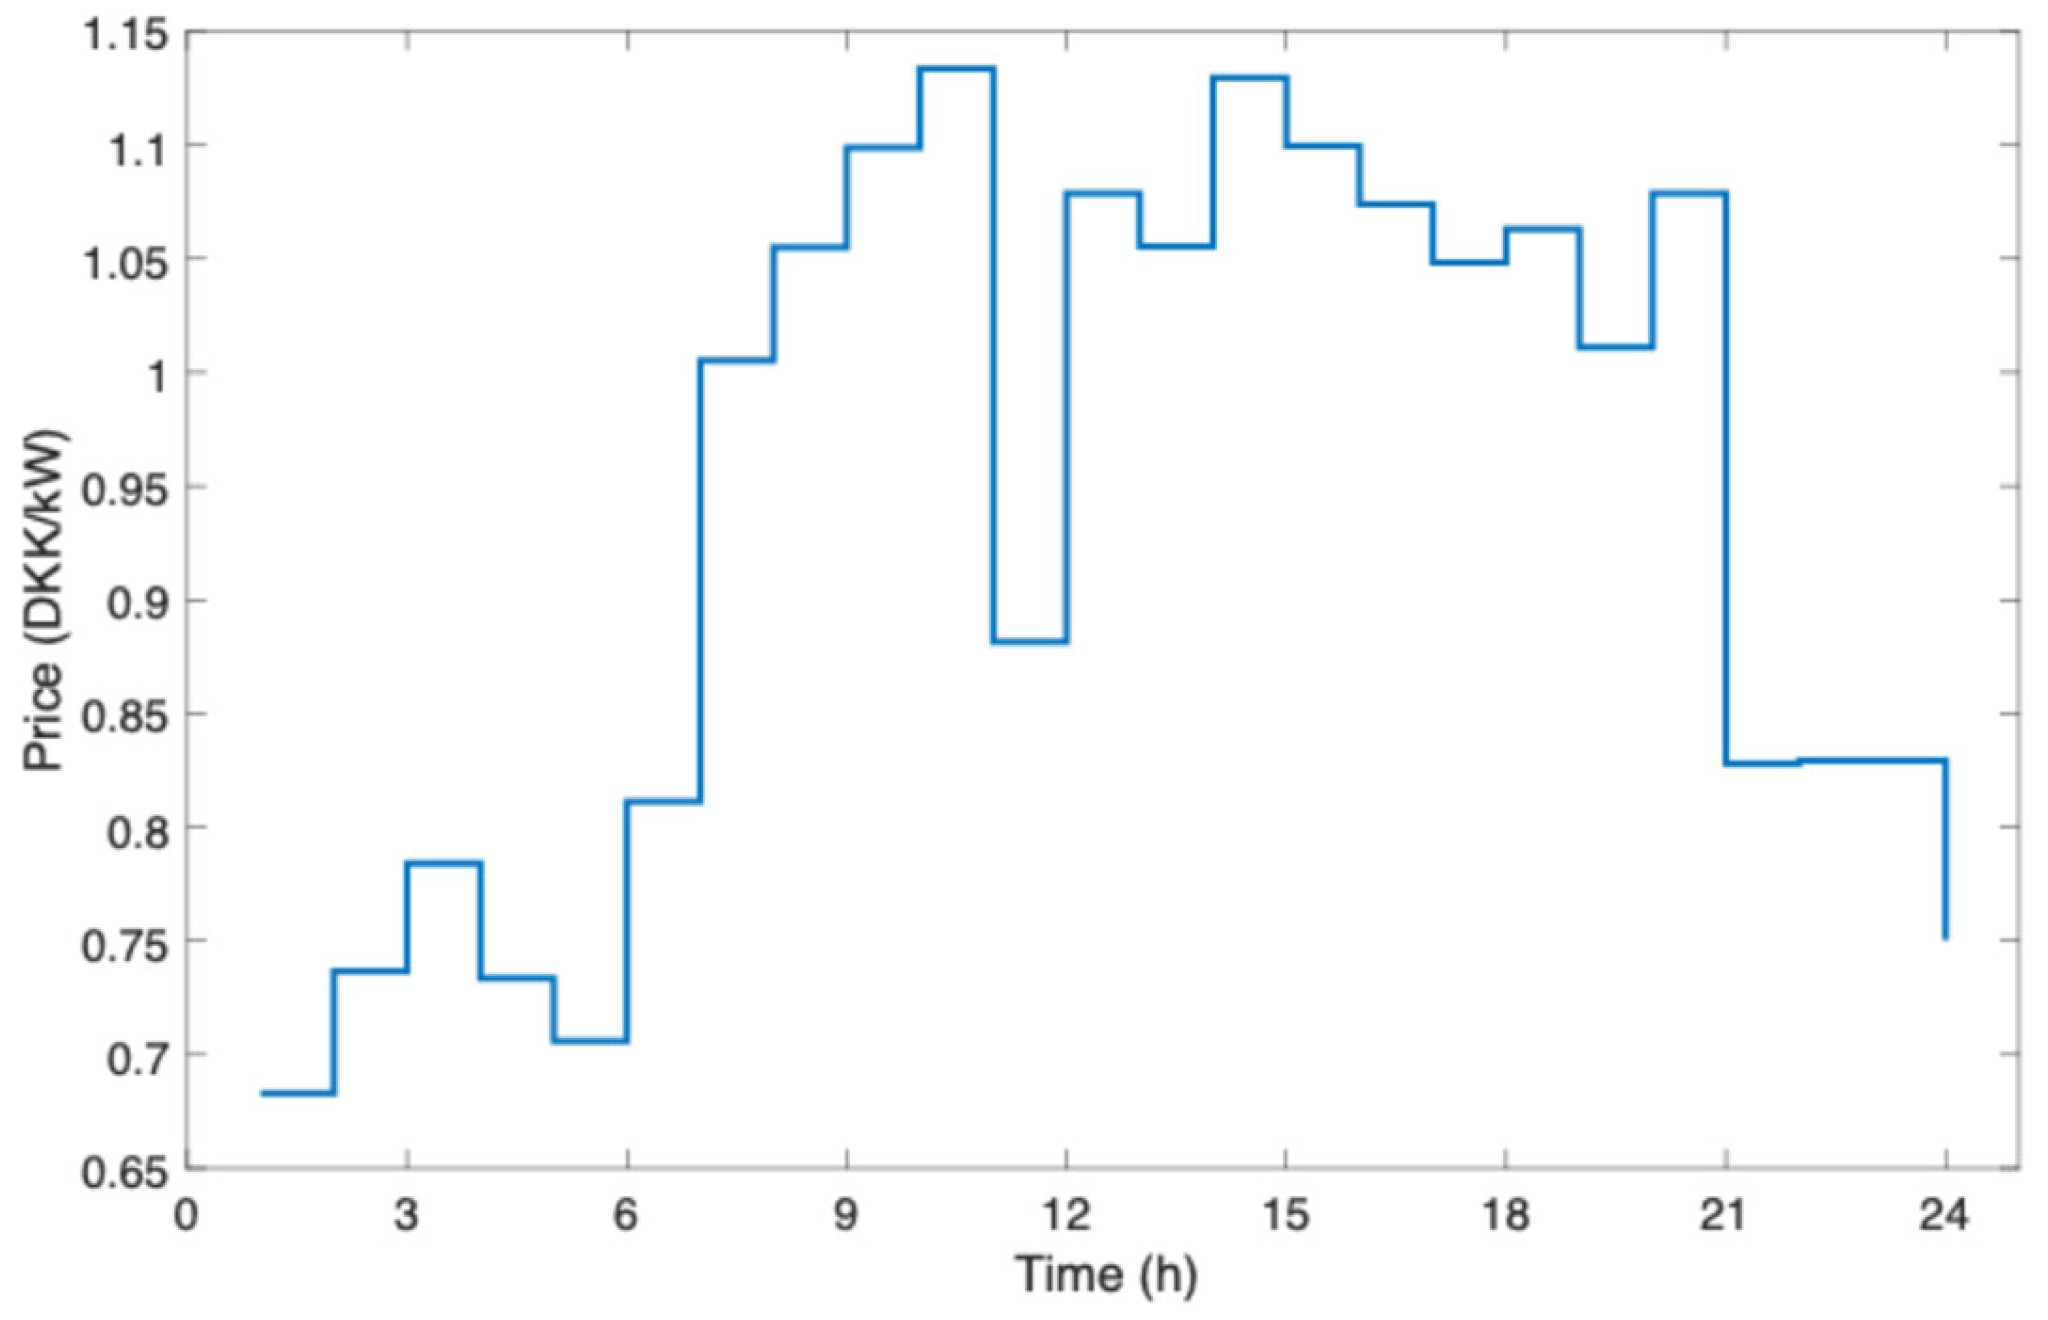
In this study, a mine located in the Inner Mongolia Autonomous Region of China is used as a case study to validate the proposed model. The forecasted wind and solar power outputs, as well as various types of loads within the mine’s electricity–heat energy system, are illustrated in Figure 3 and Figure 4. The parameters of different units within the energy system are provided in Table 1. The electricity market price profile is depicted in Figure 5. The system operation model is programmed using MATLAB R2019 and the YALMIP toolbox, with the CPLEX 12.8.0 solver employed for optimization. The computer used features a Quad-Core Intel Core i5 processor and 16 GB of memory.

4.2. Analysis of Source–Load Bilateral Parameter Clustering Results

In this section, the Silhouette index is employed to evaluate the quality of clustering results. This metric measures the similarity of each data point to other points within the same cluster and its dissimilarity to points in other clusters. The Silhouette value ranges from [−1, 1], where a higher value indicates a more appropriate and well-separated clustering outcome. Assume that a given clustering method partitions the original dataset into n clusters. For any data point i , the average distance to all other points within the same cluster is defined as a ( i ) . A smaller value of a ( i ) indicates that data point i is more similar to the other points in its own cluster. The minimum of the average distances between data point i and all points in the other clusters is defined as b ( i ) . A larger value of b ( i ) indicates that data point i is less similar to the points in the other clusters. Therefore, an effective clustering method corresponds to a smaller a ( i ) and a larger b ( i ) . Accordingly, the Silhouette index S ( i ) is defined as follows:
S i = b i a i m a x a i , b i
Table 2 presents a comparison of the Silhouette coefficients between the Affinity Propagation (AP) clustering algorithm and the K-means algorithm under different numbers of clusters. As shown in Table 2, for the same number of clusters, the Silhouette index values obtained by the AP clustering algorithm are consistently higher than those of the K-means algorithm, demonstrating the superior clustering performance of AP. Furthermore, unlike K-means, the AP algorithm does not rely on predefined initial values, leading to more stable clustering results.
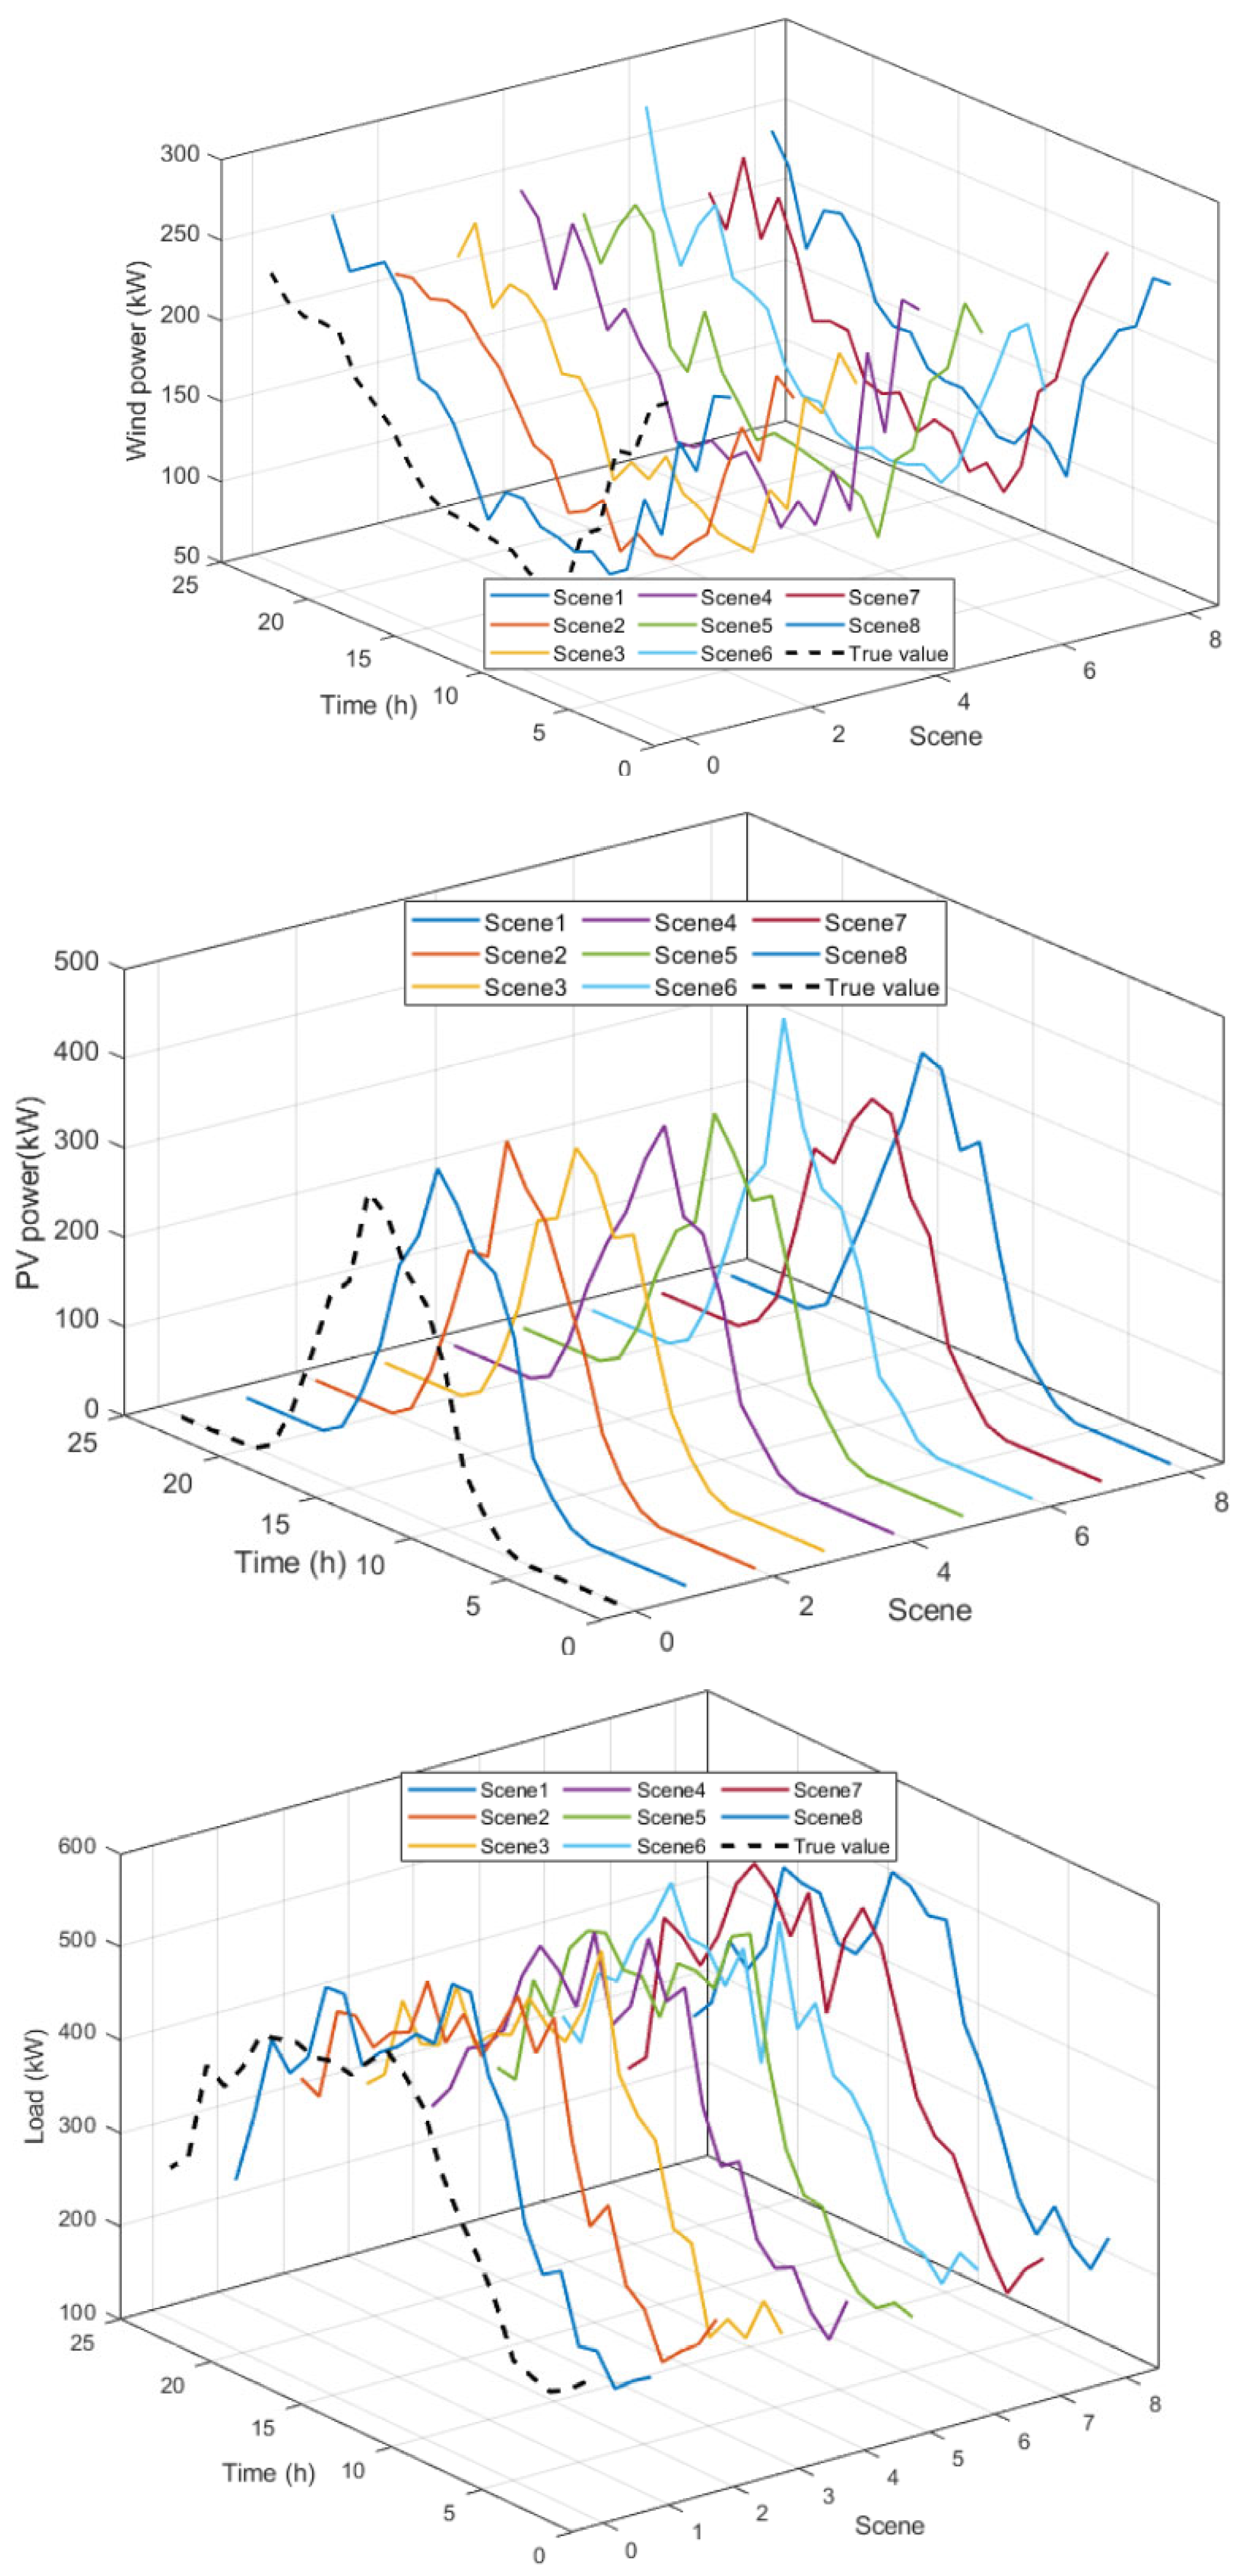
In this section, both clustering performance and computational efficiency are comprehensively considered, leading to the selection of six clusters. A comparison between the representative scenarios generated through stochastic optimization and the actual historical output curves is illustrated in Figure 6. The probabilities associated with each representative scenario are presented in Table 3.
As shown in Figure 6, the generated typical scenarios effectively preserve the variation trends of the source–load power curves while exhibiting fluctuations within a reasonable range of the actual power values. This reflects the inherent stochastic characteristics of the source–load power and indicates that the typical scenarios obtained through clustering are representative.

4.3. Results of Optimized Dispatch of Mining Area Energy System

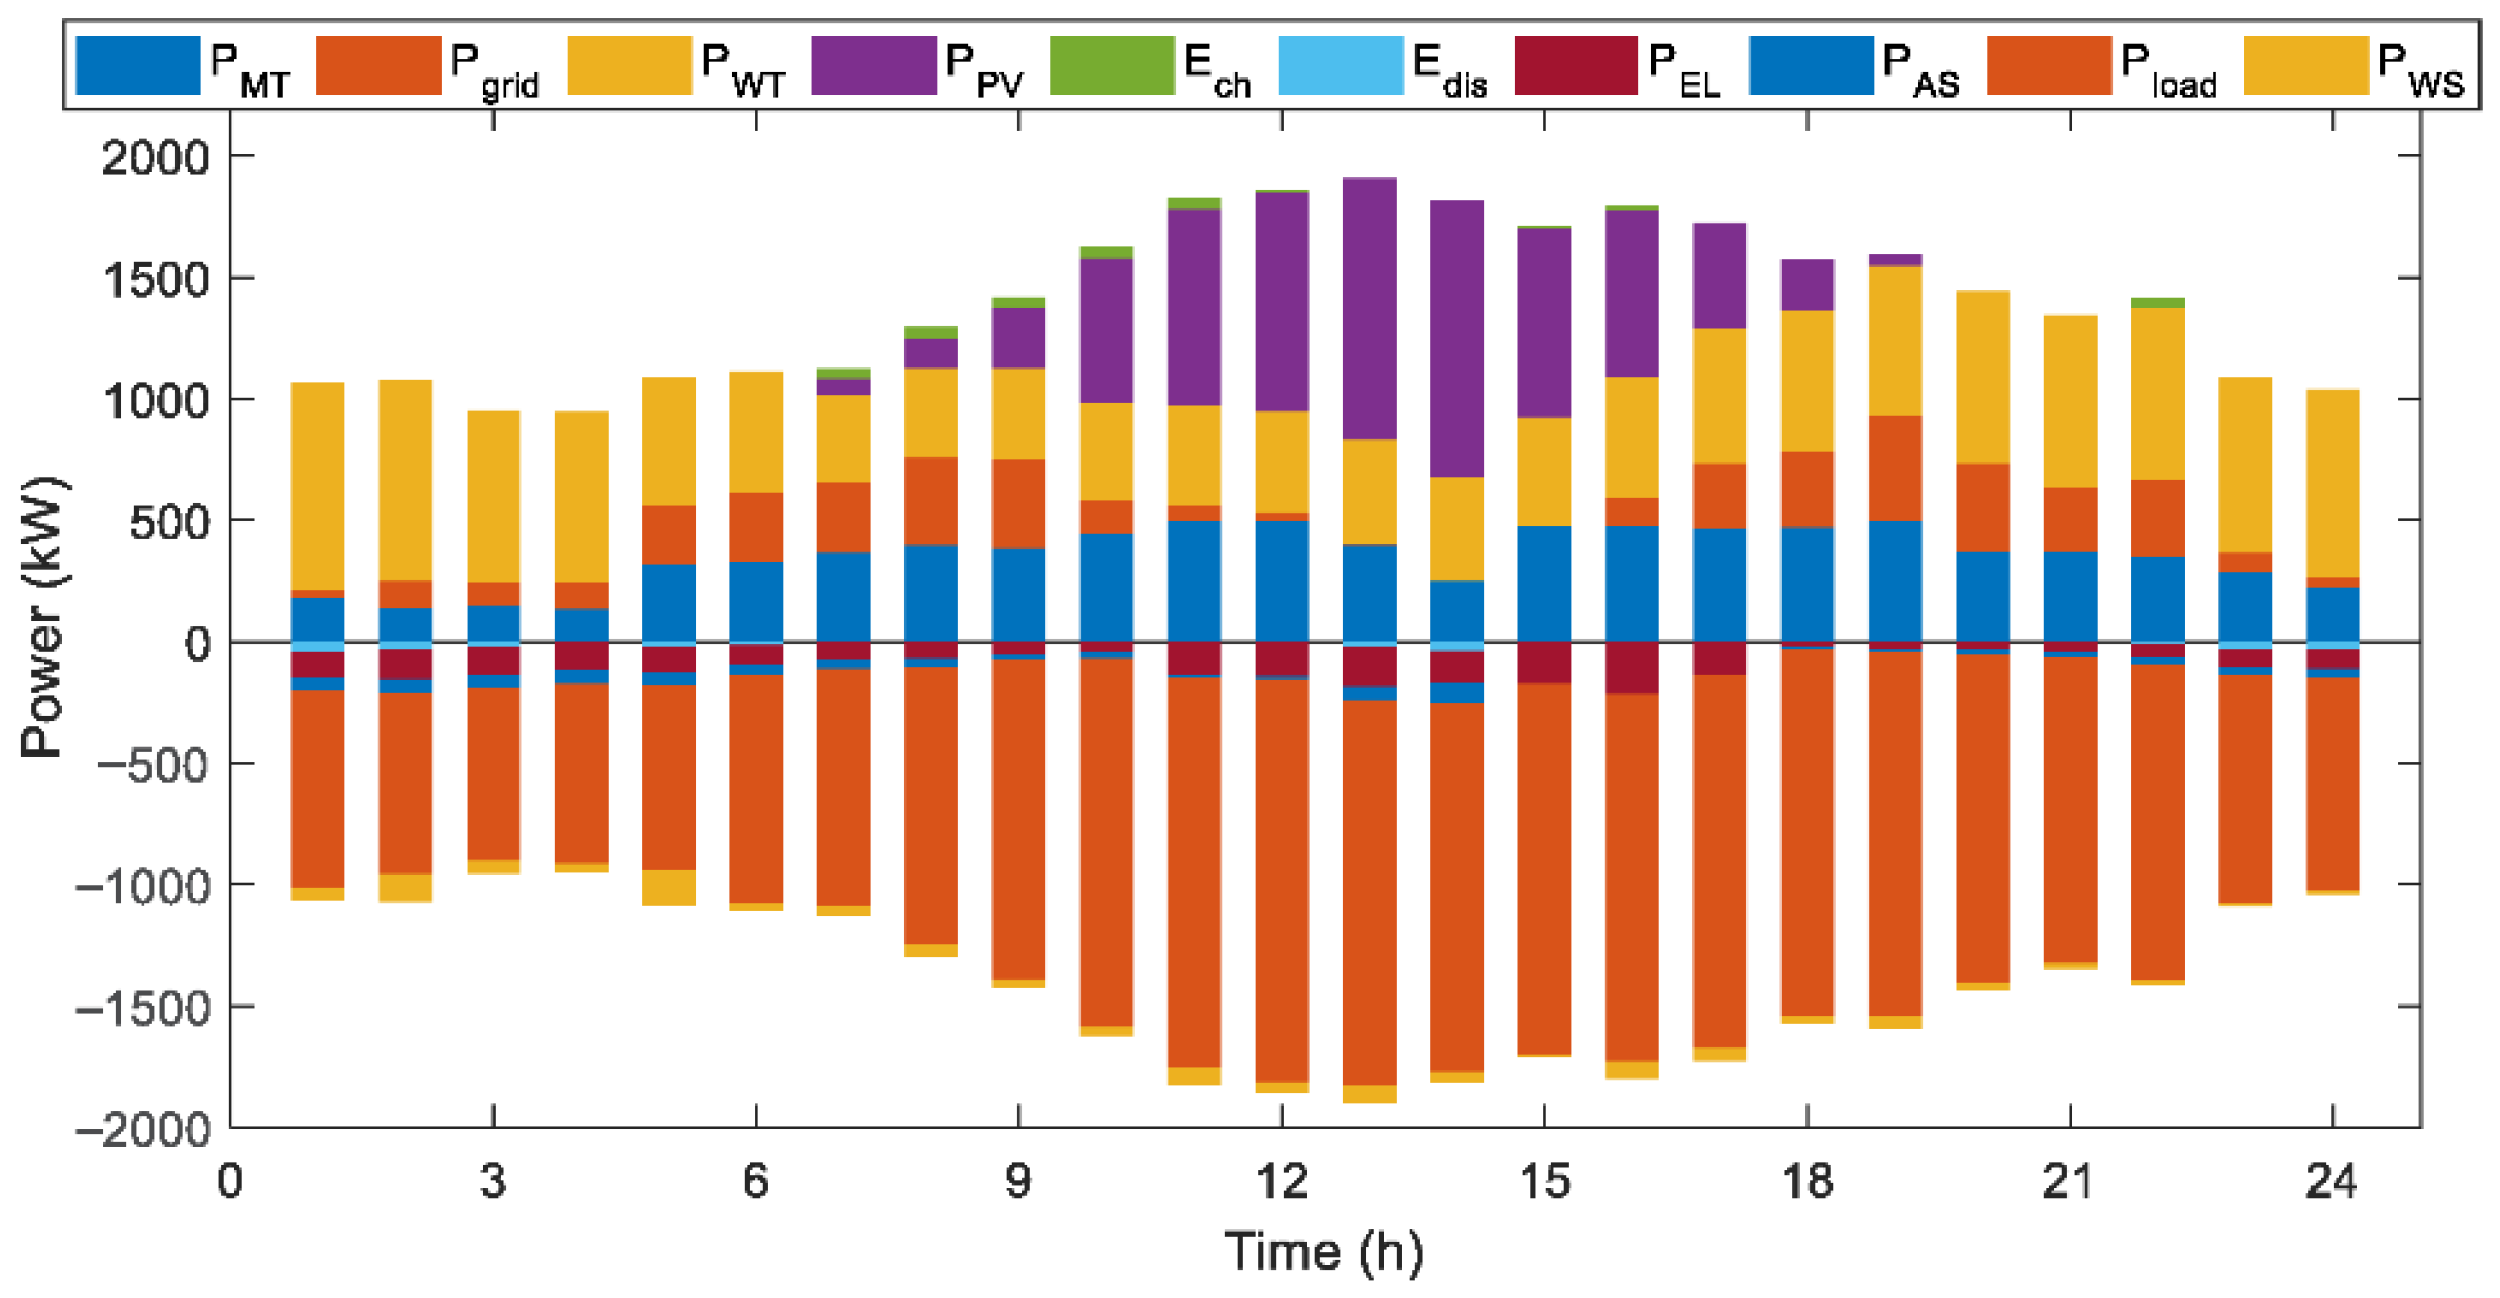
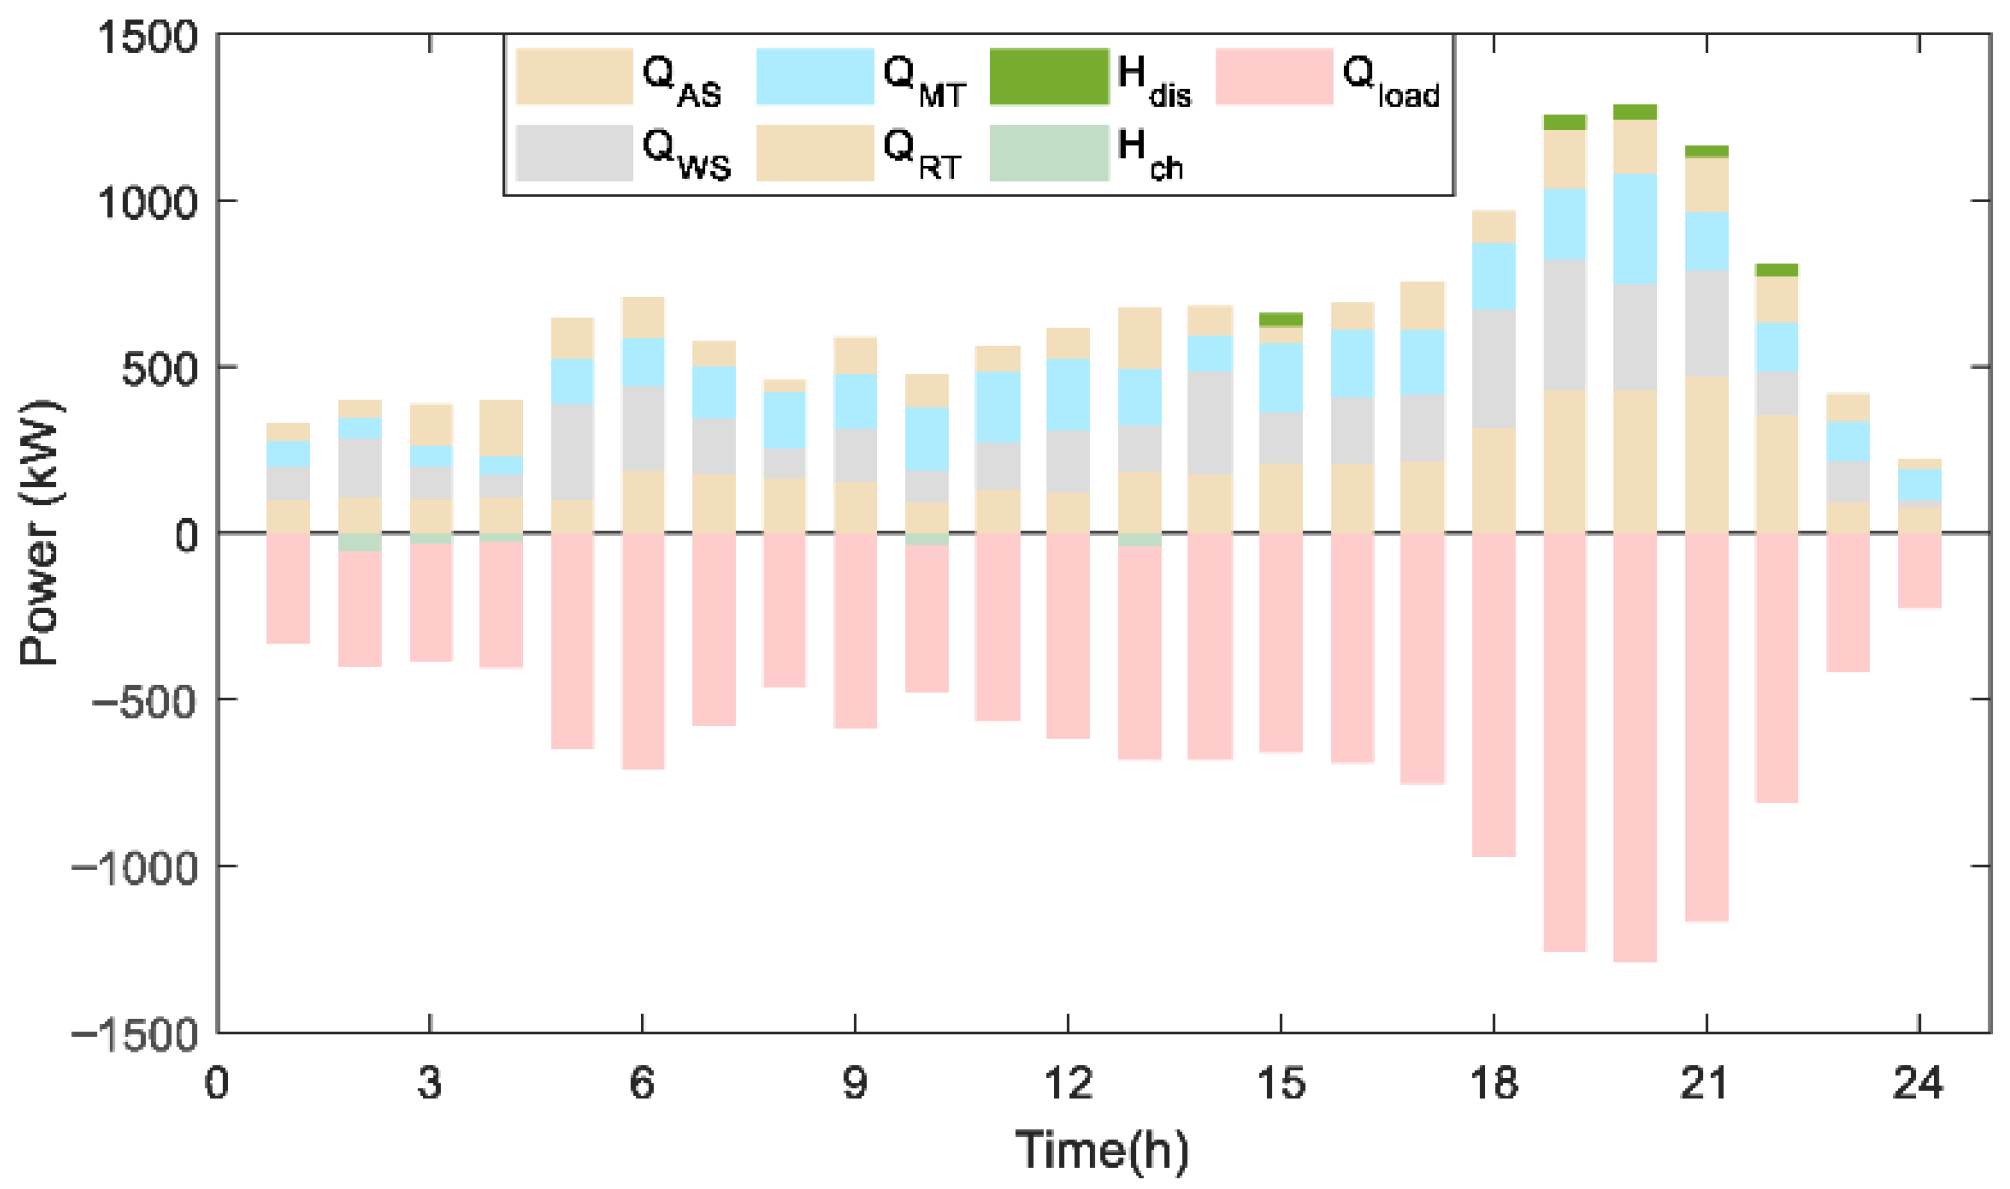
Figure 7 and Figure 8, respectively, show the scheduling results of electrical and thermal energy in the mining area energy system.
As illustrated in Figure 7, during the time periods from 00:00 to 05:00 and from 20:00 to 24:00, solar irradiance is zero. During these hours, electrical power is primarily supplied by gas turbines and wind power units, with the shortfall compensated by electricity purchased from the external grid. At 08:00, solar irradiance gradually increases, and photovoltaic units begin to supply power. As the output from renewable energy sources becomes surplus, the amount of electricity purchased from the external grid decreases significantly. Simultaneously, the power consumption of the P2G unit increases noticeably, contributing to the absorption of excess wind and solar energy. Specifically, when renewable energy generation exceeds load demand during periods of low electricity prices, P2G systems prioritize the conversion of electrical energy into hydrogen through electrolyzers, followed by methanation to produce synthetic natural gas. As exemplified by the operational data at 13:00, the P2G system consumes 168 kW of power while the surplus renewable generation reaches 201 kW, achieving a conversion efficiency of 83.6%. Consequently, the remaining 23.6% of unconverted renewable energy is either stored in battery systems or strategically curtailed based on system operational requirements.
During MIES system operation, the BT unit primarily performs charging and discharging in response to electricity market price fluctuations, thereby achieving the objective of economic arbitrage. As observed from the charging and discharging profile of the BT unit, charging primarily occurs during periods such as 04:00–08:00 and 23:00–24:00. In conjunction with Figure 4, it can be seen that these time intervals correspond to relatively low electricity market prices and high wind power output. The BT unit discharges during periods with relatively high electricity prices, such as 07:00–09:00. During these hours, the electricity market price is comparatively elevated, enabling the ES unit to achieve the goal of “charging at low prices and discharging at high prices,” thereby reducing the overall system cost.
As shown in Figure 8, the MIES system’s thermal load is primarily supplied by the MT unit and the RT unit. Due to the significant environmental harm caused by exhaust gas (low-concentration methane), while the environmental impact of drainage water is relatively minimal, this study assigns a higher penalty cost to the curtailment of exhaust gas. As a result, the output of the exhaust gas oxidation device is comparatively higher. In addition, due to the thermoelectric coupling characteristics of the MT unit, electricity generation is inevitably accompanied by the production of residual heat. This may lead to a mismatch between thermal supply and demand, resulting in potential thermal energy waste. Therefore, the TT unit ensures the efficient utilization of residual heat resources through thermal charging and discharging. For instance, at 03:00, if the TT unit does not perform thermal charging, it may result in a thermal energy waste of approximately 34 kW.
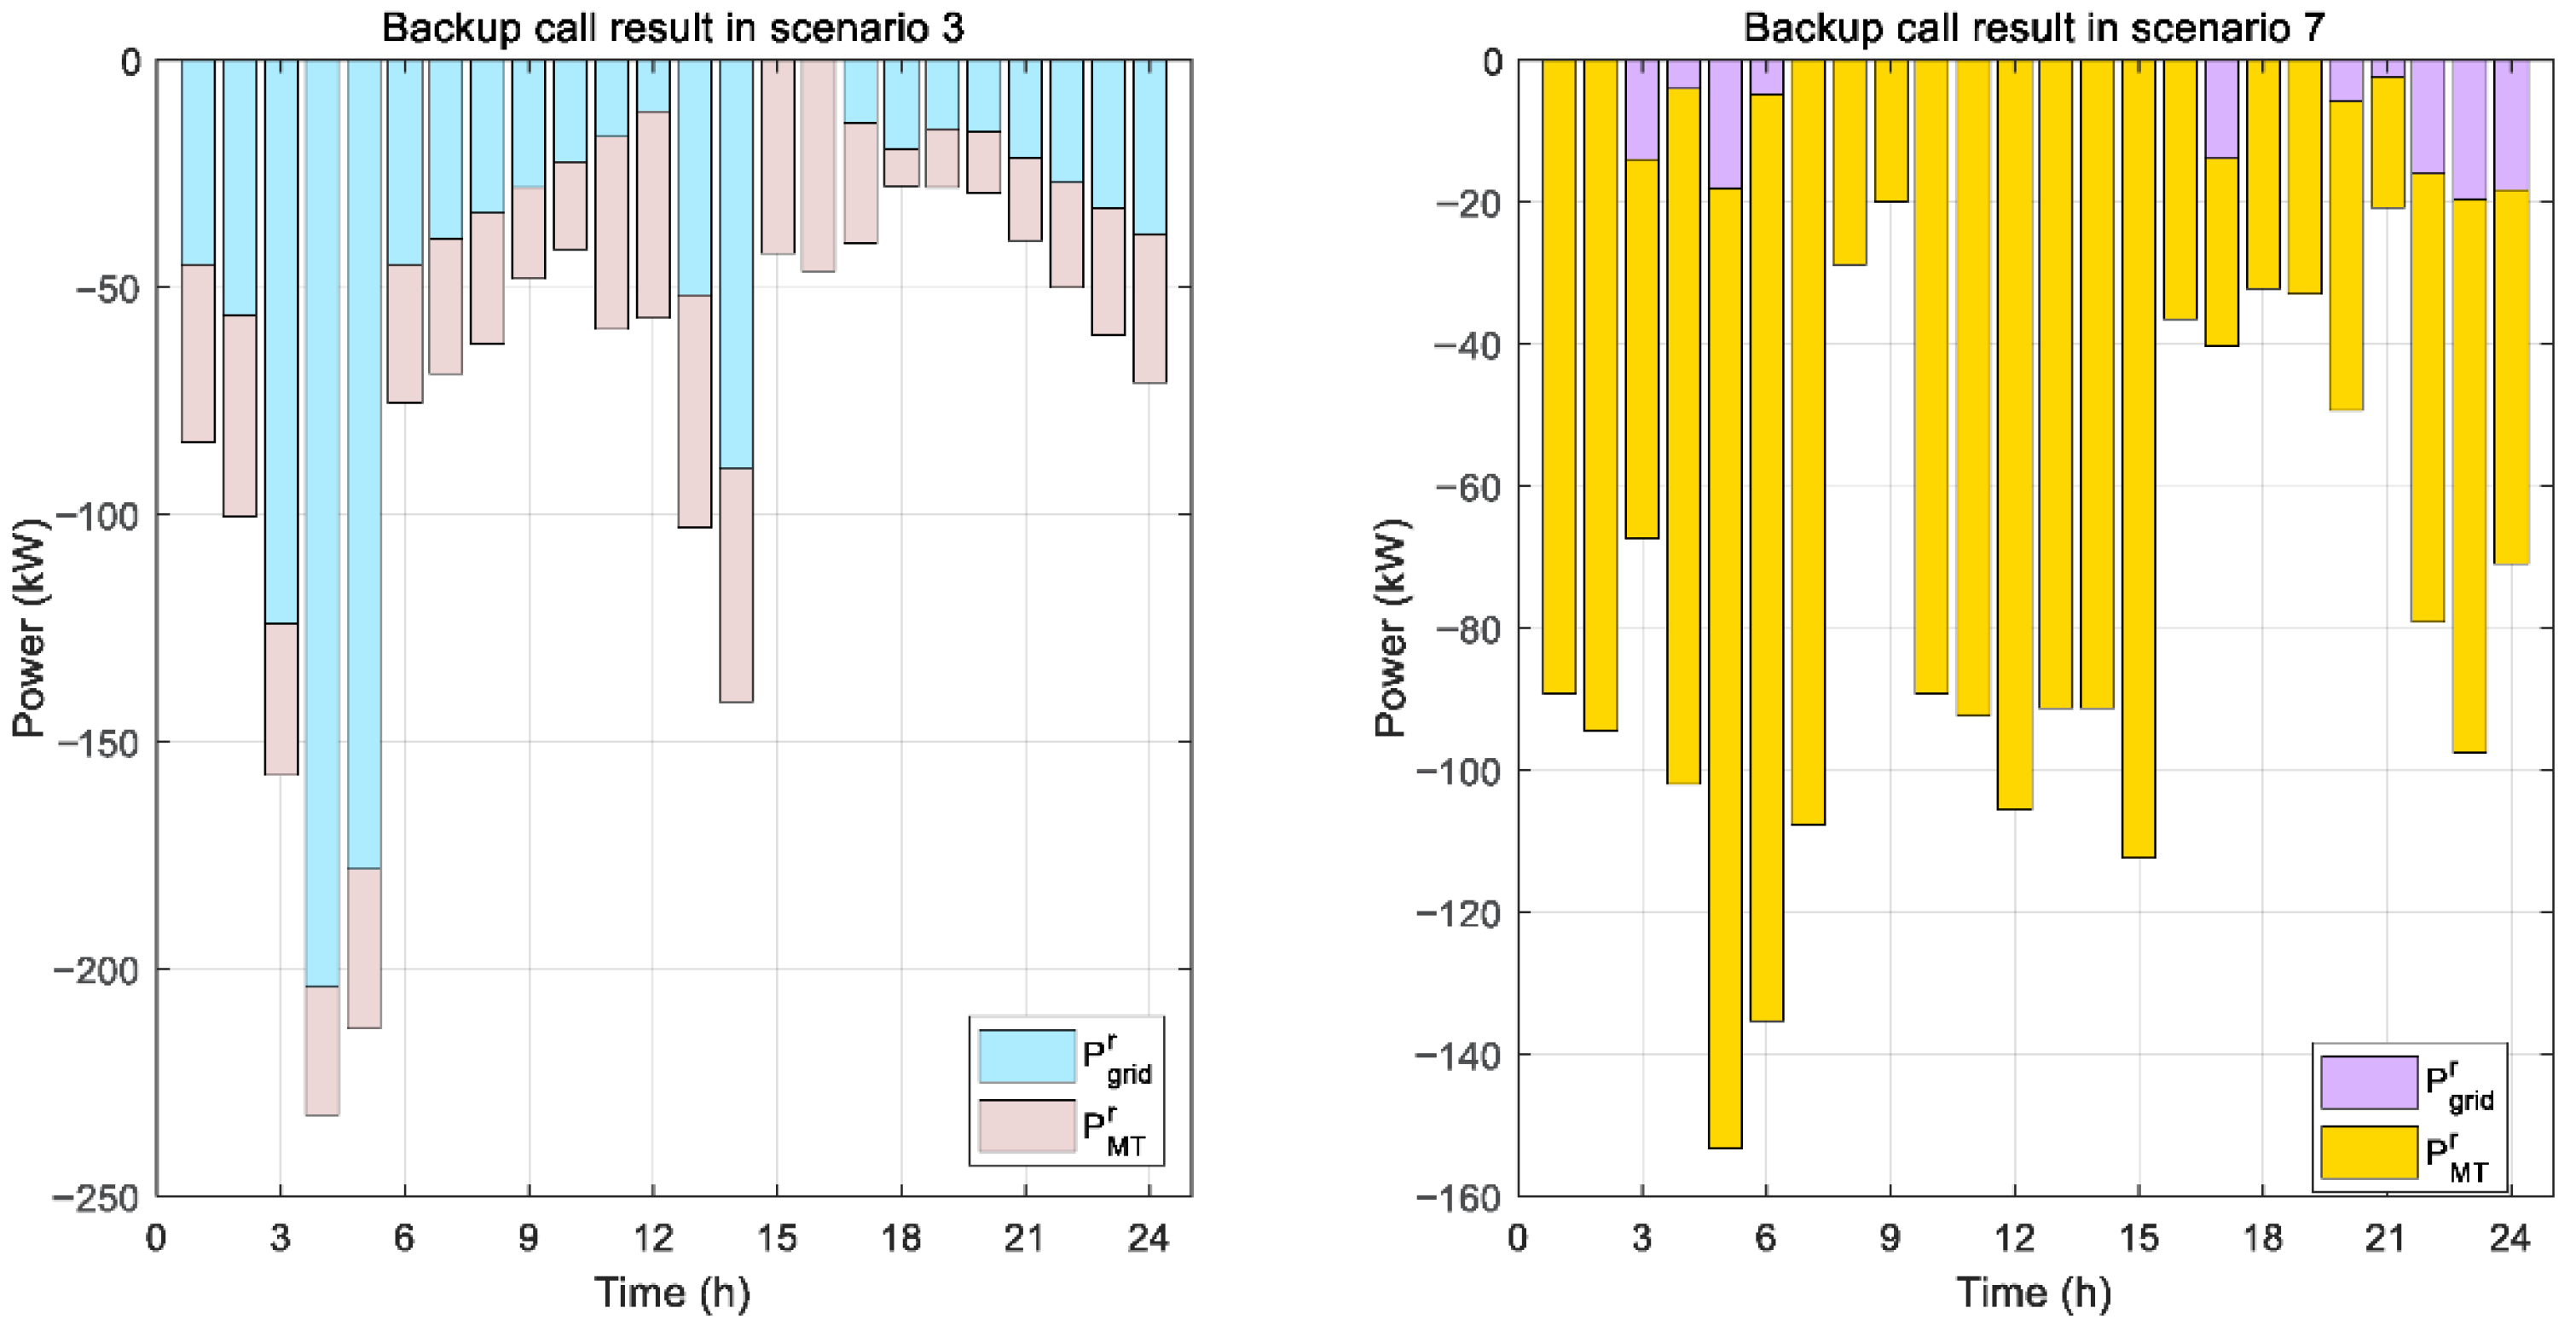
To analyze the impact of scenario probabilities on the types of reserve resources deployed, the reserve utilization under typical Scenario 3 (probability 0.070) and Scenario 7 (probability 0.215) is compared. The corresponding reserve power dispatch is illustrated in Figure 9.
In Scenario 3, both the external power grid and gas turbines are utilized to meet the system’s reserve requirements. In contrast, Scenario 7 involves limited reliance on the external grid. This distinction arises from the lower occurrence probability of Scenario 3, which results in a smaller expected reserve deployment cost. Consequently, minimizing operational scheduling costs becomes the dominant objective, making the use of external grid resources for reserves more economically favorable in this scenario. Conversely, in Scenario 7, which has a higher probability of occurrence, the high cost of grid-based reserve deployment leads to a greater expected adjustment cost. Under these conditions, relying solely on gas turbines for reserve capacity is more conducive to the system’s economic operation.

4.4. Model Comparison and Analysis

In order to verify the effectiveness of the model in this paper, the following scenarios are designed for comparative analysis:
Scheme 1: Deterministic operation model of the MIES without P2G equipment. In this scheme, the predicted (average) values of renewable energy generation and load are used, ignoring uncertainty.
Scheme 2: Stochastic optimization model of the MIES without P2G equipment, but without considering CVaR.
Scheme 3: Robust optimization model of the MIES with P2G equipment.
Scheme 4: Stochastic optimization model of the MIES with P2G equipment, but without considering CVaR.
Scheme 5: Stochastic optimization model of the MIES with P2G equipment, and considering CVaR, that is, the model in this paper.
(1) Operating costs under different solutions
The operating costs of the MIES under different operating schemes are shown in Table 4.
In terms of total cost, Scheme 1 yields the lowest operational cost at 23,499.4 DKK, while Scheme 3 incurs the highest cost at 32,674.3 DKK. The cost levels of the other schemes fall between those of Scheme 1 and Scheme 3, and all employ stochastic optimization methods to address uncertainties in the mine energy system. The primary reason is that Scheme 1 relies on the predicted values of uncertainties on both the supply and demand sides, without accounting for their stochastic fluctuations, and performs deterministic optimization scheduling for the mine energy system. Although Scheme 1 achieves a lower operational cost, its disregard for the uncertainties on both the supply and demand sides may compromise system operational stability. In contrast, Scheme 3 adopts a robust optimization approach, which schedules the MIES system based on the worst-case scenarios of supply and demand uncertainties. However, since such extreme cases have a low probability of occurrence, the solution tends to be overly conservative, resulting in the highest operational cost.
A comparison between Schemes 2, 4, and 5 reveals that the operational cost of Scheme 5 lies between those of Schemes 2 and 4, with Scheme 4 outperforming Scheme 2 in terms of cost efficiency. The primary reason is that, after integrating the P2G equipment in Scheme 4, the system can better accommodate renewable energy output and reduce natural gas purchases from the external gas network, thereby lowering the overall energy system cost in the MIES. Scheme 5 builds upon Scheme 4 by further incorporating CVaR, which leads to a moderate increase in operational costs. This is because the CVaR-based stochastic optimization method not only considers the expected costs under typical scenarios but also accounts for operational risks caused by supply and demand uncertainties, thus achieving a better balance between economic efficiency and system robustness.
To quantify the operational risks of the system in different scenarios, two evaluation indicators are introduced, and the results are shown in Table 5.
E U D = s = 1 N π s 1 24 t = 1 24 m a x P t , s l o a d P t , s s u p p l y , 0
where E U D is the expected unmet demand. That is, the average hourly power shortfall across all scenarios. P t , s s u p p l y includes MT, grid, and renewable generation.
L O L P = N u m b e r   o f   s c e n a r i o s   w i t h   P t , s l o a d > P t , s s u p p l y T o t a l   s c e n a r i o s × 100 %
where L O L P is the percentage of scenarios with any unmet demand.
Deterministic scheduling (Scheme 1) ignores uncertainties, leading to recurrent load shortfalls (EUD > 14 kW in 12.3% of scenarios). While robust optimization (Scheme 3) eliminates these risks, our stochastic-CVaR method (Scheme 5) achieves a 3.4-fold reduction in EUD versus Scheme 1 at only 31% higher cost, demonstrating superior cost–risk balance.
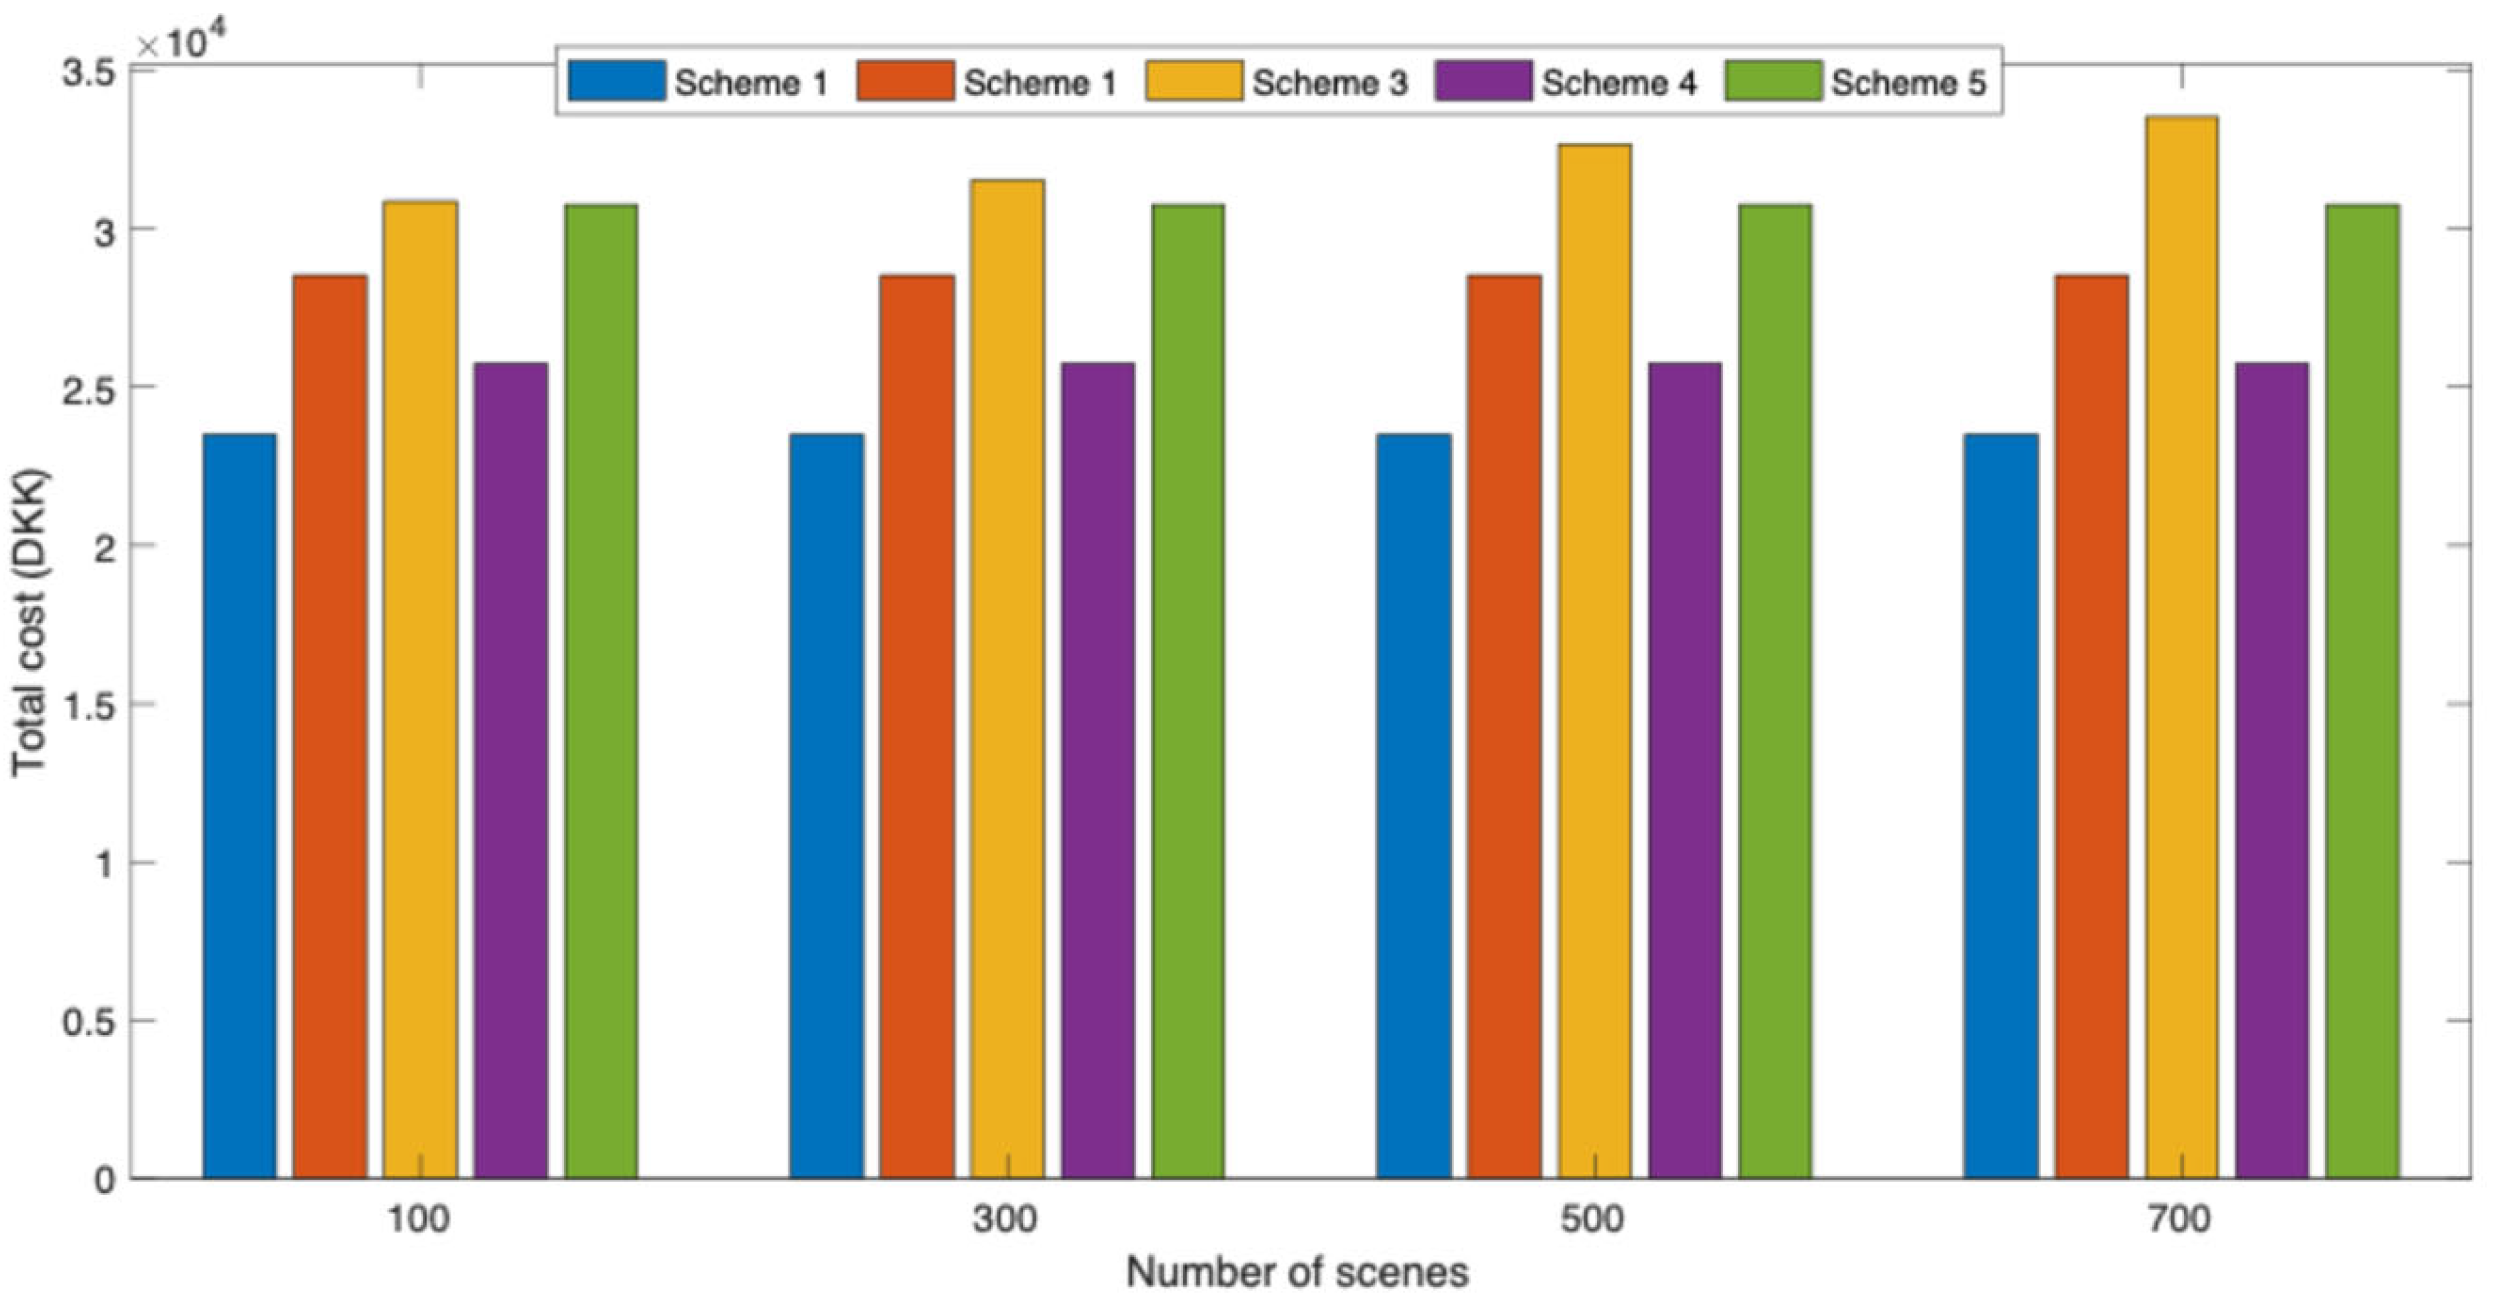
The optimization results illustrating the variation of the system’s total operational cost with respect to the number of generated source–load scenarios under different schemes are presented in Figure 10.
As shown in Figure 10, an increase in the number of scenarios leads to a rise in the total operational cost obtained via robust optimization, which is attributed to the consideration of higher-cost scenarios in scheduling decisions. In contrast, the operational costs obtained under Schemes 4 and 5 remain relatively stable despite changes in scenario quantity. This stability arises because the objective function in stochastic optimization is based on the expected value; therefore, when source–load scenarios follow the same distribution, the number of scenarios has a limited impact on the optimization outcome.
(2) Analysis of the impact of the risk preference coefficient on results
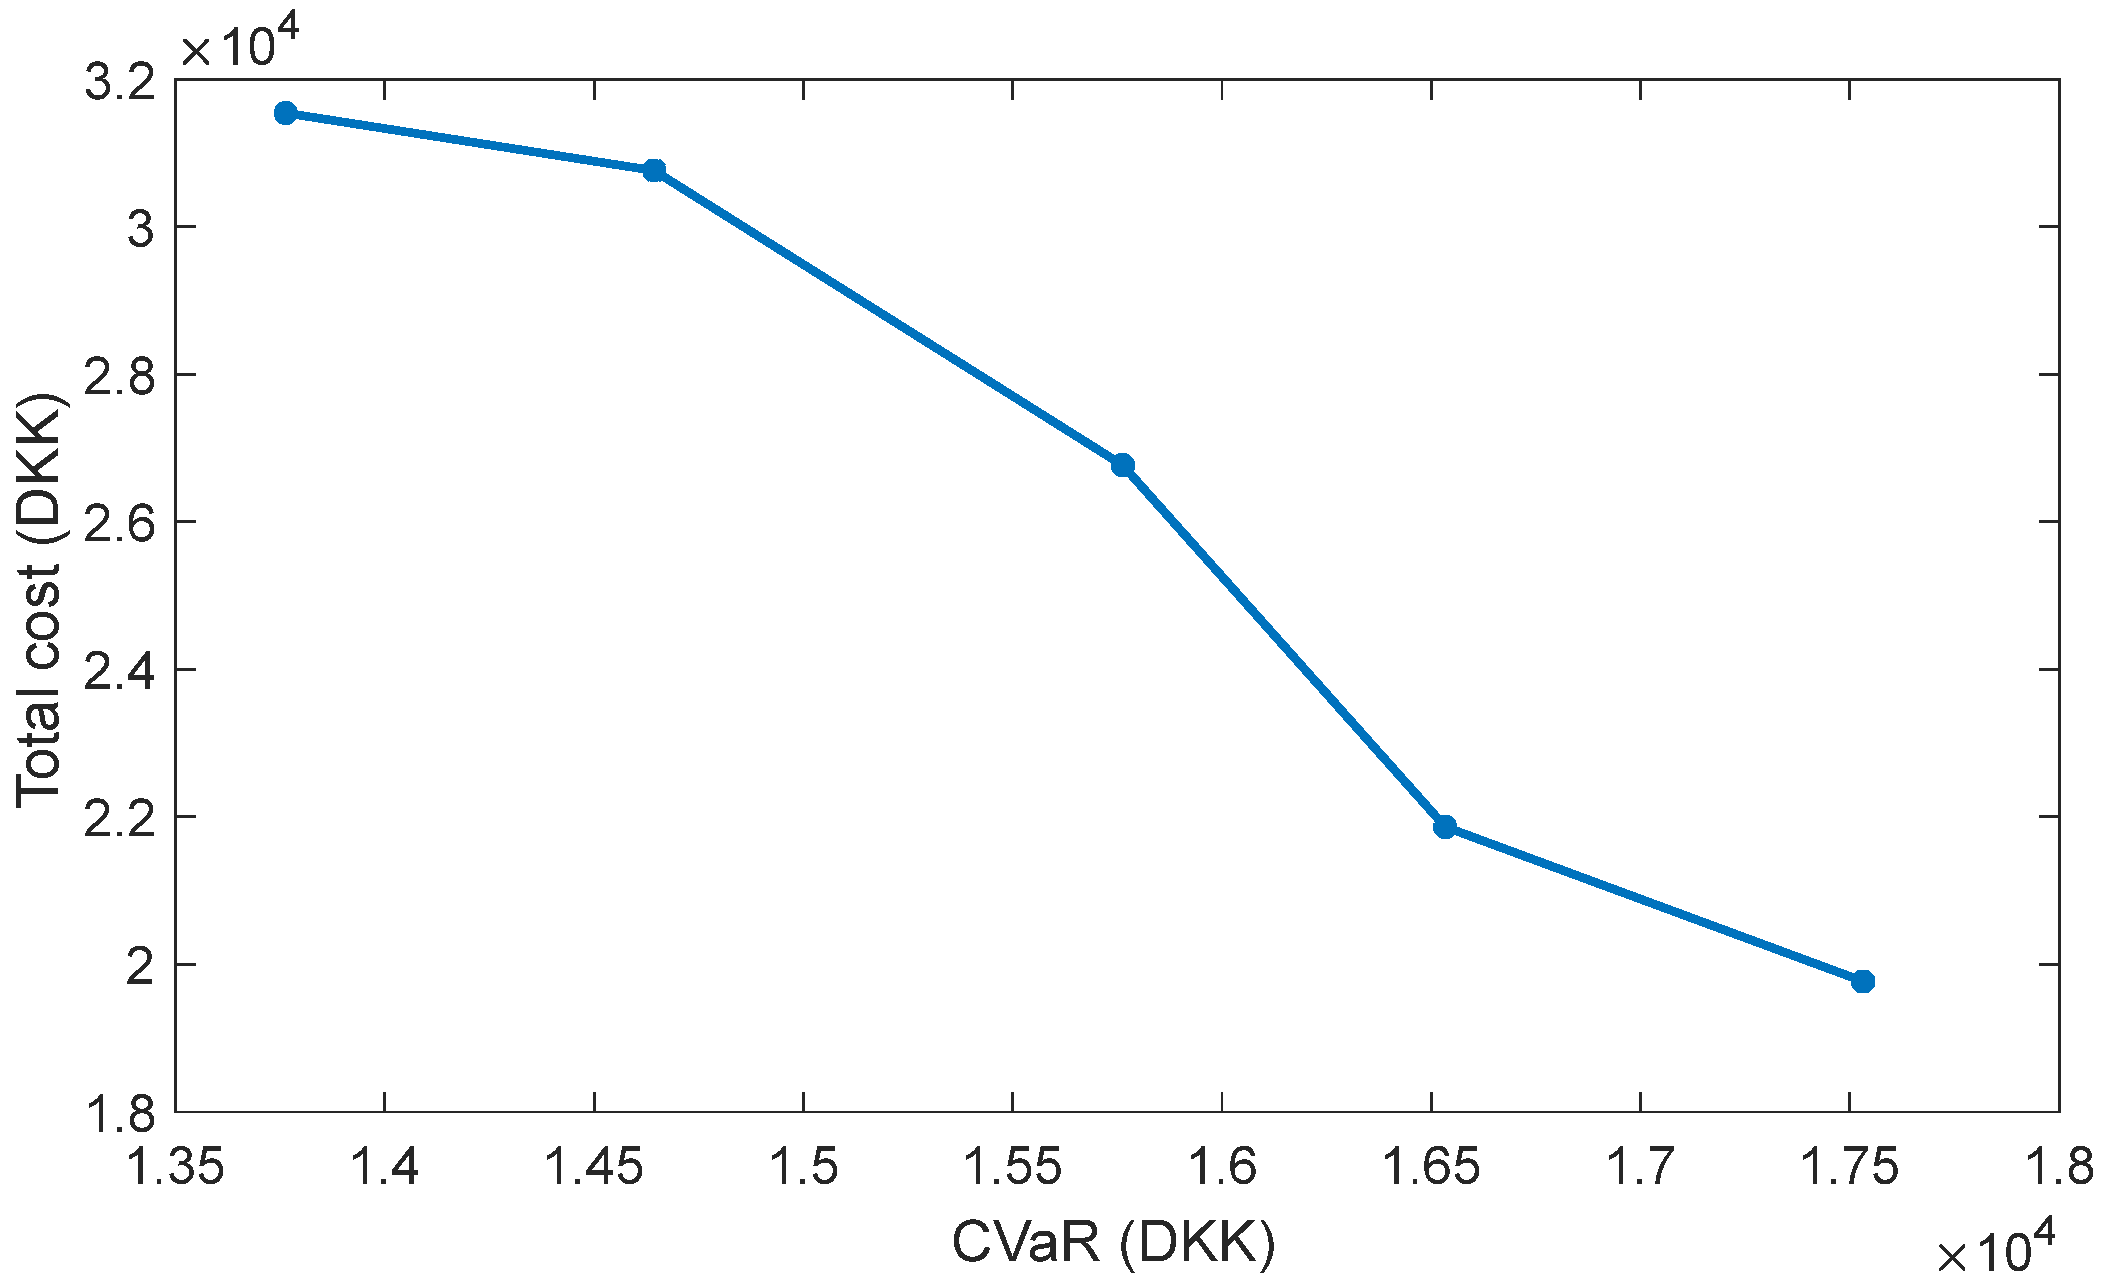
Different risk preference coefficients affect the system’s total operational cost and CVaR, with the results presented in Figure 11.
It can be seen from Figure 11 that with the increase in risk coefficient β , the total operating cost of the mining area energy system gradually increases, while the value of CVaR gradually decreases, indicating that decision-makers’ aversion to risk deepens and the scheduling strategy tends to be conservative. During the increase in β , the total operating cost increases from 19,764.1 DKK to 31,543.2 DKK, and CVaR decreases from 17,532.3 DKK to 13,763.4 DKK; that is, a 27.4% decrease in CVaR leads to a 37.3% increase in total operating costs.
When the risk coefficient β is low, the operation strategy focuses on minimizing expected costs while neglecting tail risk—e.g., reducing MT reserve capacity and purchasing electricity during low-price periods—resulting in high CVaR and vulnerability to extreme events. At a medium β , the strategy balances cost and risk by maintaining moderate MT reserves and charging batteries during low-risk periods, thereby lowering CVaR at the expense of higher costs. When β is high, the strategy prioritizes worst-case avoidance, such as maintaining high MT reserves, which further reduces CVaR but significantly increases operational costs.
(3) Analysis of the impact of source–load correlation
In order to explore the impact of source–load correlation on the operation of the mining area energy system, the following operation schemes are set.
Scheme 6: Consider source–load correlation (that is, consider the correlation between source loads in Section 2.2).
Scheme 7: Do not consider source–load correlation.
The operation results of the mining area energy system considering the source–load correlation are shown in Section 4.2. This section further analyzes the operation results of the mining area energy system without considering the source–load correlation, as shown in Figure 12.
A comparison of Figure 8 and Figure 12 reveals that, for most time periods, considering the correlation between supply and load leads to reductions in both gas turbine output and electricity procurement from the grid. However, during the midday peak period from 12:00 to 15:00, due to an upward fluctuation in electrical load and a simultaneous downward fluctuation in combined wind and solar output, the gas turbine output increases to meet the demand. Overall, the complementary fluctuations between wind, solar, and load effectively reduce the system’s scheduling costs. The impact of source–load correlation on system operating costs is shown in Table 6.
As shown in Table 6, when correlation is taken into account, both the operational scheduling cost and the expected adjustment cost of the mine energy system decrease by 1.5% and 1.4%, respectively. In terms of total operational cost, considering correlation results in a 1.4% reduction in system cost. Therefore, incorporating source–load correlation in the mine energy system is beneficial for optimizing system operating costs.

5. Conclusions

This paper comprehensively considers the correlations on both the supply and demand sides of the mine energy system, as well as the characteristics of renewable energy surplus in mining areas. A stochastic optimization model for a mine electricity–heat energy system incorporating P2G technology is proposed. CVaR is introduced to quantify the risk posed by multiple uncertainties to the system’s operation. This approach enhances the economic performance of system operation while constraining operational risks within acceptable limits. The main conclusions drawn from the case study analysis are summarized as follows.
(1)
The Latin hypercube sampling (LHS) method based on the correlation coefficient matrix can more accurately characterize the uncertainty and interdependencies of multiple random variables in the mine energy system. The Affinity Propagation (AP) clustering algorithm adaptively determines the number of cluster centers and selects actual scenarios from the original dataset as representative scenarios, resulting in clustering outcomes with strong representativeness.
(2)
By considering the correlation between supply and load and optimizing the operational power of adjustment devices based on the complementary characteristics of multiple uncertainties, the total operational cost of the mine energy system is reduced by 1.4%, thereby enhancing the system’s economic performance. The integration of the P2G unit into the traditional mine energy system effectively addresses issues such as renewable energy surplus and high carbon emissions.
(3)
The economic dispatch model of the mine energy system incorporating CVaR enables decision-makers to formulate reasonable operating strategies according to their risk preferences, achieving a balance between economic efficiency and operational robustness.

Author Contributions

X.W. guided the research, established the model, and implemented the simulation; C.H. wrote this article; Y.Z. and X.Z. are responsible for project management and investigation. All authors have read and agreed to the published version of the manuscript.

Funding

This research was funded by Hebei Natural Science Foundation under grant number G2024203017 and National Natural Science Foundation of China under grant number 71973043.

Data Availability Statement

The original contributions presented in the study are included in the article, further inquiries can be directed to the corresponding author.

Conflicts of Interest

Author Chao Han, Yun Zhu and Xing Zhou were employed by the company CEC Technical & Economic Consulting Center of Power Construction, Electric Power Development Research Institute Co., Ltd. The remaining authors declare that the research was conducted in the absence of any commercial or financial relationships that could be construed as a potential conflict of interest.

References

  1. Wang, X.; Li, B.; Wang, Y.; Lu, H.; Zhao, H.; Xue, W. A bargaining game-based profit allocation method for the wind-hydrogen-storage combined system. Appl. Energy 2022, 310, 118472. [Google Scholar] [CrossRef]
  2. Adom, S.; Matsui, K. Investigating Barriers to Low-Carbon Policy Implementation among Mining Companies in Ghana. Sustainability 2024, 16, 1798. [Google Scholar] [CrossRef]
  3. Xue, D.; Shao, Z. Patent text mining based hydrogen energy technology evolution path identification. Int. J. Hydrogen Energy 2024, 49, 699–710. [Google Scholar] [CrossRef]
  4. Zhu, Y.; An, Y.; Li, X.; Cheng, L.; Lv, S. Geochemical characteristics and health risks of heavy metals in agricultural soils and crops from a coal mining area in Anhui province, China. Environ. Res. 2024, 241, 117670. [Google Scholar] [CrossRef] [PubMed]
  5. Gong, X.; Li, X.; Zhong, Z. Strategic bidding of hydrogen-wind-photovoltaic energy system in integrated energy and flexible ramping markets with renewable energy uncertainty. Int. J. Hydrogen Energy 2024, 80, 1406–1423. [Google Scholar] [CrossRef]
  6. Lei, H.; Liu, P.; Cheng, Q.; Xu, H.; Liu, W.; Zheng, Y.; Chen, X.; Zhou, Y. Frequency, duration, severity of energy drought and its propagation in hydro-wind-photovoltaic complementary systems. Renew. Energy 2024, 230, 120845. [Google Scholar] [CrossRef]
  7. Ofélia de Queiroz, F.A.; Morte, I.B.B.; Borges, C.L.; Morgado, C.R.; de Medeiros, J.L. Beyond clean and affordable transition pathways: A review of issues and strategies to sustainable energy supply. Int. J. Electr. Power Energy Syst. 2024, 155, 109544. [Google Scholar]
  8. Kim, Y.; Moon, I.; Kim, J.; Lee, J. Renewable natural gas value chain based on cryogenic carbon capture, utilization and storage, and power-to-gas for a net-zero CO2 economy. Renew. Sustain. Energy Rev. 2025, 212, 115425. [Google Scholar] [CrossRef]
  9. Hu, J.; Zou, Y.; Zhao, Y. Robust operation of hydrogen-fueled power-to-gas system within feasible operating zone considering carbon-dioxide recycling process. Int. J. Hydrogen Energy 2024, 58, 1429–1442. [Google Scholar] [CrossRef]
  10. Liang, R.; Li, J.; Gong, D.; Huang, H.; Liang, K.; Liu, H.; Li, X. Optimal planning method for the high-quality coal mine energy system with complete clean energy supply. J. China Coal Soc. 2024, 49, 1669–1679. [Google Scholar]
  11. Miao, Q.; Sun, X.; Ma, C.; Zhang, Y.; Gong, D. Rescheduling costs and adaptive asymmetric errors guided closed-loop prediction of power loads in mine integrated energy systems. Energy AI 2025, 21, 100516. [Google Scholar] [CrossRef]
  12. Liu, J.; Li, R.; Wu, T. Short-term multi-objective optimal scheduling of the integrated power grid-abandoned coal mine energy system. Results Eng. 2024, 22, 102103. [Google Scholar] [CrossRef]
  13. Wu, F.; Liu, Y.; Gao, R. Challenges and opportunities of energy storage technology in abandoned coal mines: A systematic review. J. Energy Storage 2024, 83, 110613. [Google Scholar] [CrossRef]
  14. Xiong, Y.; Kong, D.; Song, G. Research hotspots and development trends of green coal mining: Exploring the path to sustainable development of coal mines. Resour. Policy 2024, 92, 105039. [Google Scholar] [CrossRef]
  15. Li, C.; Han, S.; Zeng, S.; Yang, S. Robust optimization. In Intelligent Optimization: Principles, Algorithms and Applications; Springer Nature: Singapore, 2024; pp. 239–251. [Google Scholar]
  16. Yang, C.; Xia, Y. Interval Pareto front-based multi-objective robust optimization for sensor placement in structural modal identification. Reliab. Eng. Syst. Saf. 2024, 242, 109703. [Google Scholar] [CrossRef]
  17. Kim, S.; Choi, Y.; Park, J.; Adams, D.; Heo, S.; Lee, J.H. Multi-period, multi-timescale stochastic optimization model for simultaneous capacity investment and energy management decisions for hybrid Micro-Grids with green hydrogen production under uncertainty. Renew. Sustain. Energy Rev. 2024, 190, 114049. [Google Scholar] [CrossRef]
  18. Wu, M.; Yan, R.; Zhang, J.; Fan, J.; Wang, J.; Bai, Z.; He, Y.; Cao, G.; Hu, K. An enhanced stochastic optimization for more flexibility on integrated energy system with flexible loads and a high penetration level of renewables. Renew. Energy 2024, 227, 120502. [Google Scholar] [CrossRef]
  19. Sarkar, D.; Srivastava, P.K. Recent development and applications of neutrosophic fuzzy optimization approach. Int. J. Syst. Assur. Eng. Manag. 2024, 15, 2042–2066. [Google Scholar] [CrossRef]
  20. Wang, S.; Tan, Q.; Ding, X.; Li, J. Efficient microgrid energy management with neural-fuzzy optimization. Int. J. Hydrogen Energy 2024, 64, 269–281. [Google Scholar] [CrossRef]
  21. Ran, X.; Suyaroj, N.; Tepsan, W.; Ma, J.; Zhou, X.; Deng, W. A hybrid genetic-fuzzy ant colony optimization algorithm for automatic K-means clustering in urban global positioning system. Eng. Appl. Artif. Intell. 2024, 137, 109237. [Google Scholar] [CrossRef]
  22. Xiang, Y.; Tang, Q.; Xu, W.; Hu, S.; Zhao, P.; Guo, J.; Liu, J. A multi-factor spatio-temporal correlation analysis method for PV development potential estimation. Renew. Energy 2024, 223, 119962. [Google Scholar] [CrossRef]
  23. Ru, Y.; Wang, Y.; Mao, W.; Zheng, D.; Fang, W. Dynamic Environmental Economic Dispatch Considering the Uncertainty and Correlation of Photovoltaic–Wind Joint Power. Energies 2024, 17, 6247. [Google Scholar] [CrossRef]
  24. Zhong, M.; Fan, J.; Luo, J.; Xiao, X.; He, G.; Cai, R. InfoCAVB-MemoryFormer: Forecasting of wind and photovoltaic power through the interaction of data reconstruction and data augmentation. Appl. Energy 2024, 371, 123745. [Google Scholar] [CrossRef]
  25. Zhang, Q.; Leng, S.; Ma, X.; Liu, Q.; Wang, X.; Liang, B.; Liu, Y.; Yang, J. CVaR-constrained policy optimization for safe reinforcement learning. IEEE Trans. Neural Netw. Learn. Syst. 2024, 36, 830–841. [Google Scholar] [CrossRef] [PubMed]
  26. Elias, I.I.; Ali, T.H. Optimal level and order of the Coiflets wavelet in the VAR time series denoise analysis. Front. Appl. Math. Stat. 2025, 11, 1526540. [Google Scholar] [CrossRef]
  27. Pedersen, T.B.; Lehtola, S.; Fdez Galván, I.; Lindh, R. The versatility of the Cholesky decomposition in electronic structure theory. Wiley Interdiscip. Rev. Comput. Mol. Sci. 2024, 14, e1692. [Google Scholar] [CrossRef]
  28. Iordanis, I.; Koukouvinos, C.; Silou, I. On the efficacy of conditioned and progressive Latin hypercube sampling in supervised machine learning. Appl. Numer. Math. 2025, 208, 256–270. [Google Scholar] [CrossRef]
  29. Zhao, M.K.; Guo, J.; Xu, Z.S.; Wu, X.H. A large-scale group decision-making method based on improved affinity propagation algorithm and adjustable minimum-cost consensus model in social networks. Comput. Ind. Eng. 2024, 187, 109819. [Google Scholar] [CrossRef]
  30. Brehm, P.A.; Johnston, S.; Milton, R. Backup power: Public implications of private substitutes for electric grid reliability. J. Assoc. Environ. Resour. Econ. 2024, 11, 1419–1445. [Google Scholar] [CrossRef]
Figure 1. Basic framework of the MIES.
Energies 18 04146 g001
Figure 2. Correlation heatmap of wind speed, solar irradiance, and electric load.
Energies 18 04146 g002
Figure 3. Predicted output of wind power and PV power in the MIES.
Energies 18 04146 g003
Figure 4. Various loads in the MIES.
Energies 18 04146 g004
Figure 5. Electricity market price.
Energies 18 04146 g005
Figure 6. Typical scenario based on AP clustering.
Energies 18 04146 g006
Figure 7. System power dispatch results.
Energies 18 04146 g007
Figure 8. System thermal power scheduling results.
Energies 18 04146 g008
Figure 9. Backup call results in different scenarios.
Energies 18 04146 g009
Figure 10. Relationship between total cost and number of options under different schemes.
Energies 18 04146 g010
Figure 11. Changes in cost and CVaR for different risk appetite coefficients.
Energies 18 04146 g011
Figure 12. System power dispatch results under Scheme 7.
Energies 18 04146 g012
Table 1. System equipment parameters.
ParametersValueParametersValue
c g a s 3.14   D K K / m 3 λ c o 0.252   D K K / k g
P E L m i n 50 kW P E L m a x 400 kW
η M R 1.08 r M T 30 kW
P M T m a x 500 kW L N G 38.97   MJ / m 3
η R T 0.82 η W S 3
η c h 0.8 η d i s 0.8
P B T , t m i n 50 kWh E t c h , m a x 50 kW
η T T , c h 0.75 η T T , d i s 0.75
Q T T , t m i n 30 kWh H t c h , m a x 30 kW
P g r i d m a x 1000 kW η M T 0.65
ρ c o 2 1.977   kg / m 3 C P V 0.351 DKK/kWh
C M T 0.085 DKK/kWh C R T 0.127 DKK/kWh
H H V 35   MJ / m 3 P M T m i n 50 kW
P u p E L / P d o w n E L 50 kW r R T 30 kW
η A S 2.7 E t d i s , m a x 50 kW
P B T , t m a x 300 kWh Q T T , t m a x 200 kWh
H t d i s , m a x 30 kW C W T 0.462 DKK/kWh
η M T , l 0.1 C W S 0.032 DKK/kWh
Table 2. Comparison of profile coefficient between AP and K-means.
Number of CategoriesK-Means Clustering
Silhouette Coefficient
AP Clustering
Silhouette Coefficient
30.3740.598
60.2750.418
100.1510.275
Table 3. Probability distribution of typical scenarios.
Scenario12345678
Probability Value0.0800.0750.0700.1650.0800.1450.2150.170
Table 4. Operating costs under different schemes.
Operation and
Scheduling Costs (DKK)
Adjusting Expected Costs (DKK)Total Cost (DKK)
Scheme 1 21,047.52451.923,499.4
Scheme 2 25,578.42955.428,533.8
Scheme 3 29,304.93369.432,674.3
Scheme 4 23,067.52676.425,743.9
Scheme 5 27,585.13178.330,763.4
Table 5. Risk indicators for all schemes.
EUD (kW)LOLP (%)
Scheme 1 14.212.3
Scheme 3 00
Scheme 5 2.71.8
Table 6. Impact of source–load correlation on operating costs.
Operation and Scheduling Costs (DKK)Adjusting Expected Costs (DKK)Total Cost (DKK)
Scheme 6 27,585.13178.330,763.4
Scheme 7 27,999.23224.431,223.5
Cost reduction rate1.5%1.4%1.4%
Disclaimer/Publisher’s Note: The statements, opinions and data contained in all publications are solely those of the individual author(s) and contributor(s) and not of MDPI and/or the editor(s). MDPI and/or the editor(s) disclaim responsibility for any injury to people or property resulting from any ideas, methods, instructions or products referred to in the content.