Article

Geochemical Assessment of Long-Term CO2 Storage from Core- to Field-Scale Models

by
Paa Kwesi Ntaako Boison
1,*,
William Ampomah
2,*,
Jason D. Simmons
2,
Dung Bui
2,
Najmudeen Sibaweihi
2,
Adewale Amosu
2 and
Kwamena Opoku Duartey
1
1
Petroleum Engineering Department, New Mexico Institute of Mining and Technology, Socorro, NM 87801, USA
2
Petroleum Recovery Research Center, New Mexico Institute of Mining and Technology, Socorro, NM 87801, USA
*
Authors to whom correspondence should be addressed.
Energies 2025, 18(15), 4089; https://doi.org/10.3390/en18154089 (registering DOI)
Submission received: 16 June 2025 / Revised: 21 July 2025 / Accepted: 25 July 2025 / Published: 1 August 2025

Abstract

Numerical simulations enable us to couple multiphase flow and geochemical processes to evaluate how sequestration impacts brine chemistry and reservoir properties. This study investigates these impacts during CO2 storage at the San Juan Basin CarbonSAFE (SJB) site. The hydrodynamic model was calibrated through history-matching, utilizing data from saltwater disposal wells to improve predictive accuracy. Core-scale simulations incorporating mineral interactions and equilibrium reactions validated the model against laboratory flow-through experiments. The calibrated geochemical model was subsequently upscaled into a field-scale 3D model of the SJB site to predict how mineral precipitation and dissolution affect reservoir properties. The results indicate that the majority of the injected CO2 is trapped structurally, followed by residual trapping and dissolution trapping; mineral trapping was found to be negligible in this study. Although quartz and calcite precipitation occurred, the dissolution of feldspars, phyllosilicates, and clay minerals counteracted these effects, resulting in a minimal reduction in porosity—less than 0.1%. The concentration of the various ions in the brine is directly influenced by dissolution/precipitation trends. This study provides valuable insights into CO2 sequestration’s effects on reservoir fluid dynamics, mineralogy, and rock properties in the San Juan Basin. It highlights the importance of reservoir simulation in assessing long-term CO2 storage effectiveness, particularly focusing on geochemical interactions.

1. Introduction

In 2023, CO2 emissions worldwide increased by 410 million tonnes, a 1.1% rise, setting a new high of 37.4 billion tonnes. This occurred despite significant progress in renewable energy and concerted global efforts to diminish carbon footprints, according to the International Energy Agency [1]. The relentless rise in atmospheric carbon continues to propel climate change, as indicated by escalating global temperatures. Earth’s average surface temperature in 2023 was the highest recorded since 1880 [2]. Geological Carbon Sequestration (GCS), the process of injecting CO2 into underground formations for long-term storage, is increasingly viewed as a critical strategy for significantly lowering atmospheric emissions. GCS not only addresses the potential release of carbon dioxide into the atmosphere but also plays a vital role in alleviating the ongoing climate crisis.
Geological Carbon Sequestration (GCS) offers a range of solutions by exploiting various underground formations that can securely contain carbon dioxide, standing out as one of the most effective approaches for long-term carbon storage [3,4,5,6,7,8]. These formations, which include depleted oil and gas fields, unmineable coal beds, deep saline aquifers, and sites for CO2 storage during enhanced oil recovery, significantly vary in their characteristics and suitability for storing CO2 [6,9,10]. Each storage type presents unique benefits and challenges, influenced by geological attributes, existing infrastructure, and their capacity for securing carbon dioxide over the long term. Saline aquifers have attracted significant interest due to their widespread availability and considerable storage capacity. Typically located deep underground, these aquifers contain brine with Total Dissolved Solid (TDS) levels above 10,000 ppm, making them unsuitable for use as drinking water sources or for other economic purposes [11]. Their characteristics, including abundant availability and current underutilization, make them excellent options for extensive CO2 sequestration efforts.
Injecting CO2 into deep saline aquifers triggers a complex interplay of physical and chemical events [7,12,13,14]. This sequestration process is facilitated by four main mechanisms [15,16]: first, hydrodynamic trapping, where CO2 is trapped under impermeable cap rocks either as a gas or a supercritical fluid; second, solubility trapping, which involves CO2 dissolving into brine, increasing its acidity, and affecting the dissolution of surrounding minerals; third, residual trapping, which occurs when CO2 remains in pore spaces as immobile bubbles held in place by capillary forces; and fourth, mineral trapping, which happens when CO2 reacts with brine and reservoir rocks to form stable carbonate minerals. Mineral trapping is considered the most reliable and permanent form of CO2 storage. In this process, CO2 is transformed into inert, stable, and immobile carbonate minerals, ensuring long-term containment. However, the specific conditions required for this mineralization—particular interactions among CO2, water, and minerals—introduce complexity to the geochemical dynamics, making the process less predictable and intricate [17]. These interactions, critical for the effectiveness of CO2 mineral trapping, vary widely due to the unique mineral compositions, brine chemistry, and conditions of each aquifer.
CO2 reactive transport modeling integrates multiphase fluid flow, solute transport, and geochemical reactions to evaluate the behavior of CO2 injected into geological formations such as saline aquifers. When CO2 is injected into saline aquifers, it dissolves in the water and forms carbonic acid (H2CO3), which breaks down into bicarbonate (HCO3) and carbonate (CO32−) as seen in Figure 1. This reaction significantly lowers the pH, acidifying the environment and leading to the dissolution of silicate and oxide minerals. As these minerals dissolve, concentrations of ions like calcium (Ca2+), magnesium (Mg2+), sodium (Na+), silica (SiO44−), and iron (Fe2+) increase in the solution [18,19,20]. This increase facilitates the secondary precipitation of silica, silicates, and carbonates [21,22,23]. As CO2 continues to migrate within the reservoir, these geochemical changes impact the reservoir rock’s porosity and permeability.
Recent experimental studies have been conducted to examine the effects of CO2 on rock properties and investigate the reaction kinetics of CO2 with sandstone under both static and dynamic flow conditions [24,25,26,27,28,29,30,31,32]. These experiments help confirm the suitability of sandstone as a viable repository for CO2. Laboratory tests allow for the control of critical variables such as pressure and temperature, providing a comprehensive analysis of the interactions between CO2, brine, and minerals [33]. Simulation models become essential in understanding the intricate dynamics of multi-component flows within subterranean reservoirs, describing geochemical reactions, and predicting mineralogical alterations over the long-term storage of CO2 [34,35].
Xiao et al. [36] noted a decrease in porosity at the interface between the reservoir and the caprock due to mineral precipitation, which improved the caprock’s sealing properties. Research by Dai et al. [14] suggested that CO2 interactions with rock might bolster seal integrity through the precipitation of minerals such as dawsonite, magnesite, siderite, and illite. This research underscored the significance of the mineral composition of the matrix in determining seal integrity through mineral trapping. Sun & Bourg [37] used molecular dynamics simulations to examine water–mineral wettability and assess mineral trapping in geological sequestration. Their results highlighted that the mineralization capture process is exceedingly slow, potentially taking centuries to securely store CO2. Simulations performed by Elgendy et al. [38] found limited calcite dissolution due to pH changes caused by CO2 plume development and noted water vaporization near the wellbore. In a study by Ma et al. [39], reactive transport modeling on sandstone demonstrated significant mineral changes resulting from CO2 interactions. Notable findings include the dissolution of calcite and chlorite and their re-precipitation as more stable minerals like dolomite and ankerite, emphasizing the critical role of mineral kinetics and the distribution of aluminosilicate minerals in the long-term effectiveness of CO2 sequestration in deep siliciclastic reservoirs.
Most field-scale reactive transport simulations traditionally utilize one-dimensional (1D) models [40,41,42,43]. Contrarily, this research adopts a three-dimensional (3D) model to incorporate the complex heterogeneity of the geological structures, thereby enhancing the precision and applicability of our findings in modeling reactive transport processes. A geochemical reactive transport modeling analysis was conducted, focusing on the Entrada Sandstone injection area within the San Juan Basin, New Mexico, USA. Employing the compositional numerical simulator GEM version 2024.20 by Computer Modelling Group (CMG), this study is pivotal in evaluating the long-term sustainability of CO2 geological storage and offers insightful contributions to the understanding of CO2 geochemical dynamics, which are relevant to similar sandstone formations across various pilot or target sites.
This study examines the fate of injected CO2 and assesses the effects of CO2–water–rock interactions on reservoir characteristics, with a specific focus on brine chemistry and reservoir porosities. This paper provides crucial insights into the four main CO2 trapping mechanisms; it explores the associated processes and pertinent equations, offering a robust understanding of each mechanism’s role. Additionally, this research includes an analysis of the history-matching process, the properties of the reservoir model, and the geochemical modeling relevant to aqueous and mineral reactions observed in this study.
This study presents comprehensive findings, including history-matching, CO2 plume containment, pH evolution, trapping mechanisms, and the impact of geochemical reactions on reservoir properties, as well as the dynamics of primary ions in solution. This manuscript is structured to comprehensively cover the study of CO2 sequestration within the Entrada Sandstone. Section 2 outlines the methodology employed, beginning with the hydrodynamic history match, followed by core-scale simulations for geochemical history-matching. The model was then upscaled to a field-scale model prior to CO2 injection. Section 3 and Section 4 present the results and discussion for this study. Finally, Section 5 concludes this study, summarizing the findings, their significance, and the implications they have on the field-scale CO2 storage project. The governing equations and underlying theories related to fluid flow through porous media and geochemical reactions are provided in the Appendix A.

2. Materials and Methods

In this section, we explore the reactive transport modeling approach employed to simulate and analyze the long-term behavior of CO2 storage within the Entrada Sandstone formation. The initialized base case model is history-matched using observed data from nearby saltwater disposal wells to validate the simulation model to be utilized in simulating geochemical reactions, informed by brine composition and X-ray diffraction (XRD) data. Figure 2 delineates the detailed steps followed in the reactive transport modeling process used in this study for the field-scale simulations.

2.1. Study Area and Geological Model

The San Juan Basin is a structural asymmetric basin located in northwest New Mexico, covering an area of approximately 7500 square miles (19,425 km2). The San Juan Basin contains a thick sedimentary section, with sedimentary fill of about 15,000 ft (4.57 km) in the deepest part of the basin. The region is highly favorable for CO2 sequestration. The main injection and confining zones are the Entrada Sandstone and the Summerville and Todilto formations. The Entrada Sandstone consists of fine-grained interdune sands and reworked dune deposits. This sandstone is about 140 feet thick and is made up of eolian, well-sorted, fine- to medium-grained particles. The Entrada consists of quartz, feldspar, calcite, dolomite, biotite, kaolinite, illite, and other clay minerals. The porosity ranges can be as high as 25% in the shallow portion, decreasing due to compaction and cementation in the lower part. The Todilto Limestone formation is made up of carbonate, evaporite, and anhydrite and acts as an effective seal for the Entrada Sandstone. Above Todilto lies the Summerville Formation, which can act as an additional seal. The Summerville deposits consist of thin-bedded sandstones, siltstones, and mudstones with varying depositional environments [44,45]. The Carmel formation found beneath the Entrada Sandstone formation is a reddish fine-grained siltstone, and the Wingate formation beneath it consists of flat-bedded, dark-red calcareous siltstone mixed with a thin stratum of silty sandstone.
The geological model was initially constructed utilizing Petrel software version 2024.1, after which it was imported into CMG-GEM version 2024.20 for numerical modeling. This model delineates the structure into five distinct zones, namely the Summerville, Todilto, Entrada, Camel, and Wingate formations, which are representative of the San Juan Basin.

2.2. Hydrodynamic Model History-Matching

The simulation model was history-matched using two saltwater wells within the Entrada. This history-matching covered several years and included parameters such as water injection rates and corresponding bottom-hole pressures (BHPs).

History Match Error

The degree of deviation in history-matching is calculated by comparing the relative difference between simulation predictions and actual field data for each objective function. This process assigns specific measurement errors and weightings to different types of production data from each well, influencing the calculated error for each objective function. History-matching error is thus quantified by the discrepancy between simulated results and observed field data for targeted objective functions, with data quality playing a key role. Measurement inaccuracies and importance levels are allocated to different production data types per well, contributing to the error calculation. Equations (1)–(5) were used to calculate the history-match error [46].
L H M E i = 1 j = 1 N i t w i , j × j = 1 N i t = 1 T i , j m w i , j , t m 2 Y i , j , t S Y i , j , t m 2 t = 1 T i , j m w i , j , t m 2 S c a l e i , j × 100 % × t w i , j
G l o b a l   H M   E r r o r = w i L H M E i w i
where i ,   j and t are subscripts denoting the well, injection data type, and time step, respectively. N i represents the total number of injection data types for well i , and T i , j is the total number of measured data points for each data type. Y i , j , t s and Y i , j , t m denote the simulated and measured values, respectively. Each objective function term is weighted by t w i , j , which reflects the relative importance of the data type. The normalization factor S c a l e i , j adjusts for differences in data scale and unit, ensuring that all production or injection data types comparably contribute to the objective function. Physically, it accounts for the range or uncertainty of measured values and is calculated based on either data variability or a defined measurement error. The point-specific weighting factor m w i , j , t m allows individual data points to be emphasized or de-emphasized based on confidence or relevance, with a default value of 1. Together, these factors contribute to the objective function L H M E i for a group of injection wells.
S c a l e i , j is the maximum of the following three quantities:
Δ Y i , j m + 4 × M e r r i , j
0.5 × m i n ( | m a x ( Y i , j , t m ) | , | m i n ( Y i , j , t m ) | ) + 4 × M e r r i , j
0.25 × m a x ( | m a x ( Y i , j , t m ) | , | m i n ( Y i , j , t m ) | ) + 4 × M e r r i , j
where Y i , j m is the measured maximum change for well i and production/injection data type j , and M e r r i , j is the measurement error.

2.3. Geochemical Modeling

X-ray diffraction (XRD) analysis of a core sample from the Entrada Sandstone identified quartz as the primary mineral in the sandstone grains. The sample also contained illite, calcite, chlorite, smectite, and various feldspars, including albite, plagioclase, and orthoclase, as shown in Table 1. It is important to note that the sample’s location and depth may influence its mineral composition.
The initial brine composition used can be seen in Table 2, highlighting the various ions in solution. Sodium (Na+) and chloride (Cl) ions were the most prevalent, with concentrations measuring at 5245 ppm and 7633 ppm, respectively. The aquifer’s initial pH level was measured to be 8.37, which is basic. The pH of a system is very important as it impacts geochemical processes influencing the solubility, speciation, and reactivity of minerals [48,49]. Analysis also identified other significant ionic presences, including sulfate (SO42−), bicarbonate (HCO3), and carbonate (CO32−), with calcium (Ca2+) and magnesium (Mg2+) present in much smaller concentrations.
Our study characterizes geochemical processes through interactions at two levels: within the aqueous phase (homogeneous reactions) and between minerals and aqueous components (heterogeneous reactions). While a variety of equilibrium reactions could be relevant, our simulation focuses on those listed in Table 3. On the other hand, mineral dissolution and precipitation are represented as rate-dependent processes. The reaction kinetics are modeled using the kinetic rate law; it links reaction rates to parameters such as reactive surface area and activation energy. The kinetic parameters used for modeling mineral dissolution and precipitation are presented in Table 4.
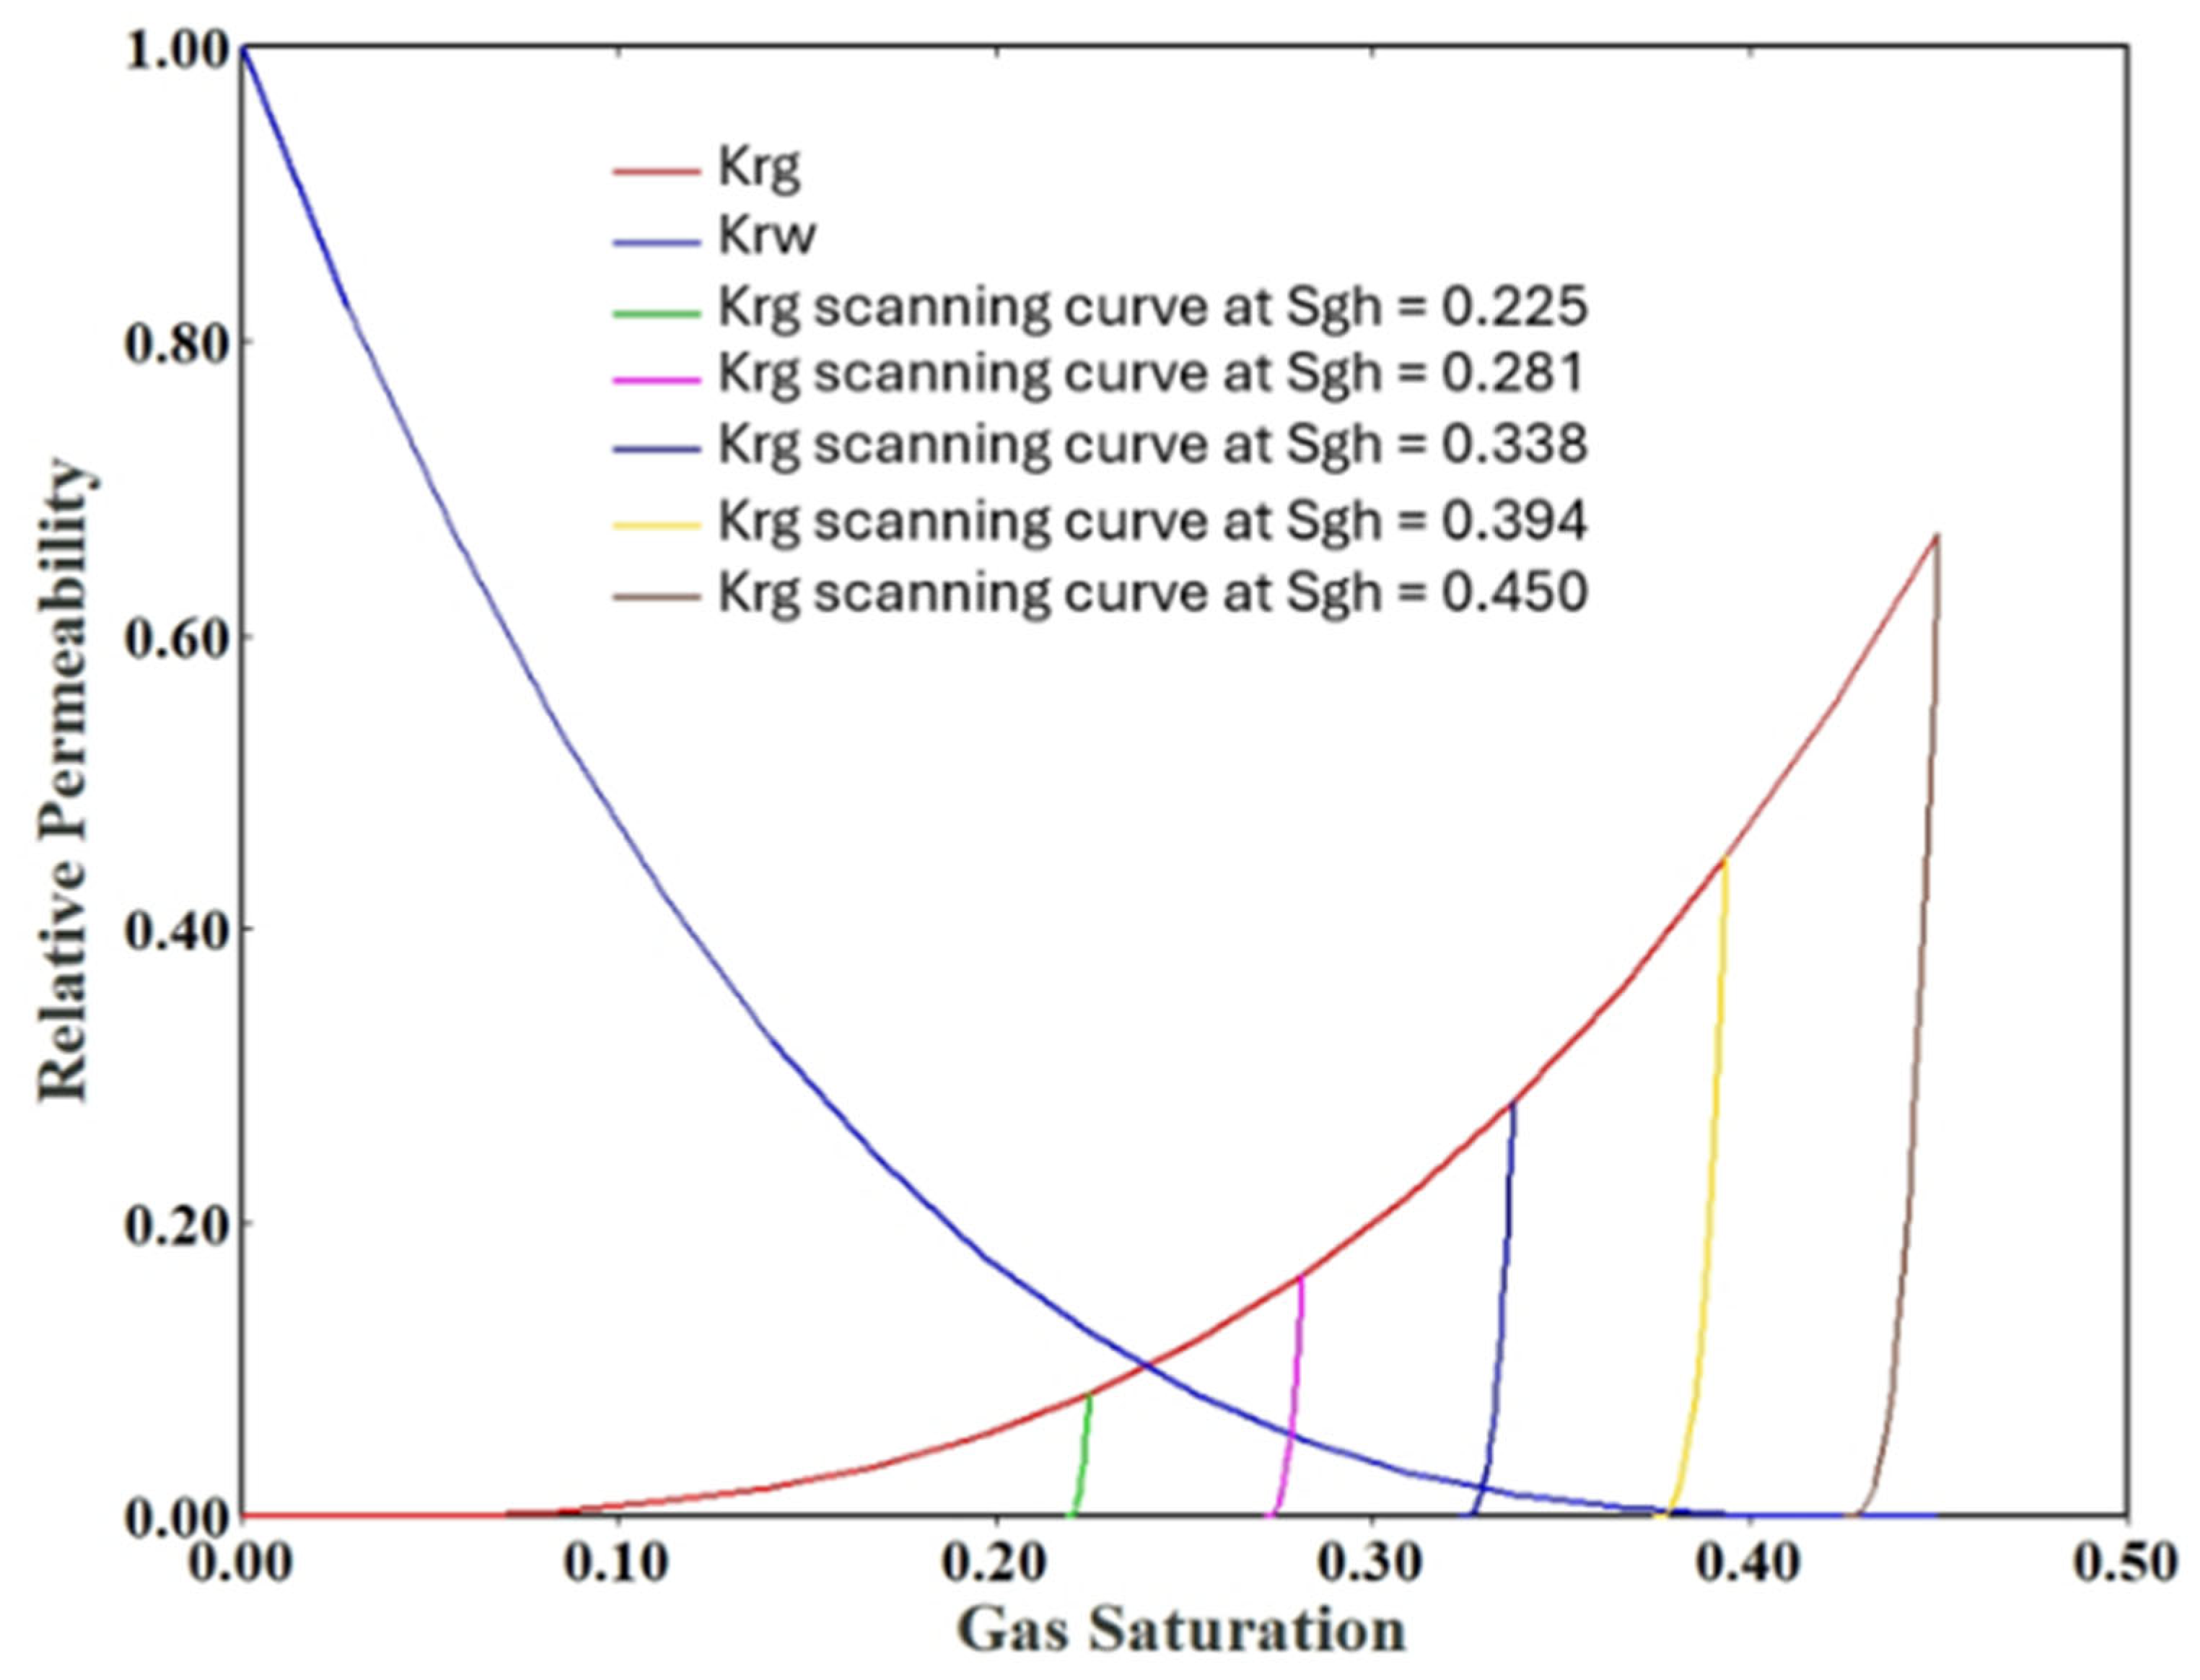
The Brooks–Corey function was used to create the relative permeability curves for gas and water [51], which was applied to experimental data obtained from sandstone samples from the Entrada formation. Figure 3 illustrates the relative permeability curves for the gas phase, featuring five scanning curves used for modeling hysteresis (residual trapping).

Geochemical History-Matching

The core-scale simulation is used to achieve a history match between the geochemical processes observed in the core-scale flow-through experiment and those predicted by the simulation. A 1-D model in CMG-GEM was used, as fluid flow in core flooding experiments is predominantly axial. The simulation replicated the core sample, its fluids, and the observed geochemical processes to align simulated results with experimental data [52,53].
Data categories for the model included rock properties (e.g., porosity, permeability, and mineral composition), fluid properties (e.g., viscosity, density, and composition of formation water and CO2), and rock–fluid interaction parameters (e.g., relative permeability and geochemical reaction kinetics). Initial conditions such as pressure, temperature, and water saturation were set to match the experimental setup. The model dimensions matched the core sample size, with rock properties like porosity and permeability taken from pre-experiment measurements. Table 5 lists core sample characteristics and relevant experimental parameters.
The model was initialized with 100 percent water saturation using deionized water to match the conditions of the flow-through experiment. Two injection wells were placed at the grid ends, one for formation brine and the other for CO2, replicating the experiment’s setup. A producer well at the opposite end simulated the experiment’s outlet. The injected formation water’s composition matched the details in Table 3, faithfully recreating the experimental conditions.

2.4. Field-Scale Modeling

After history-matching, a forecast of the core-scale simulation was performed before upscaling to the field-scale model. A summary of the input data for the model is provided in Table 6. The maximum injection pressure was set to 4631.4 psi (31.9 Mpa), corresponding to 90% of the fracture pressure. The injection rate was set to 20 MMscf/day (566,336.94 m3/day) for the 30-year period. Figure 4 shows an aerial view of the simulation model used.

3. Results

3.1. History Match

After history-matching the field-scale model, geochemistry was calibrated using core-scale simulations and results from flow-through laboratory studies. The model was then refined and upscaled. The history-matching process focused on two saltwater disposal wells (Figure 5 and Figure 6), with particular attention to aligning simulation outputs with historical water injection rates due to operational constraints. Both wells showed an exact match in water rate, as it was the controlling parameter, although some variability was noted in the BHP simulation. The overall global error for both wells was recorded at 7.83 percent, indicating robust model performance. This history-matching validated the model for CO2 injection.

3.2. Laboratory and Core-Scale Simulation Analysis

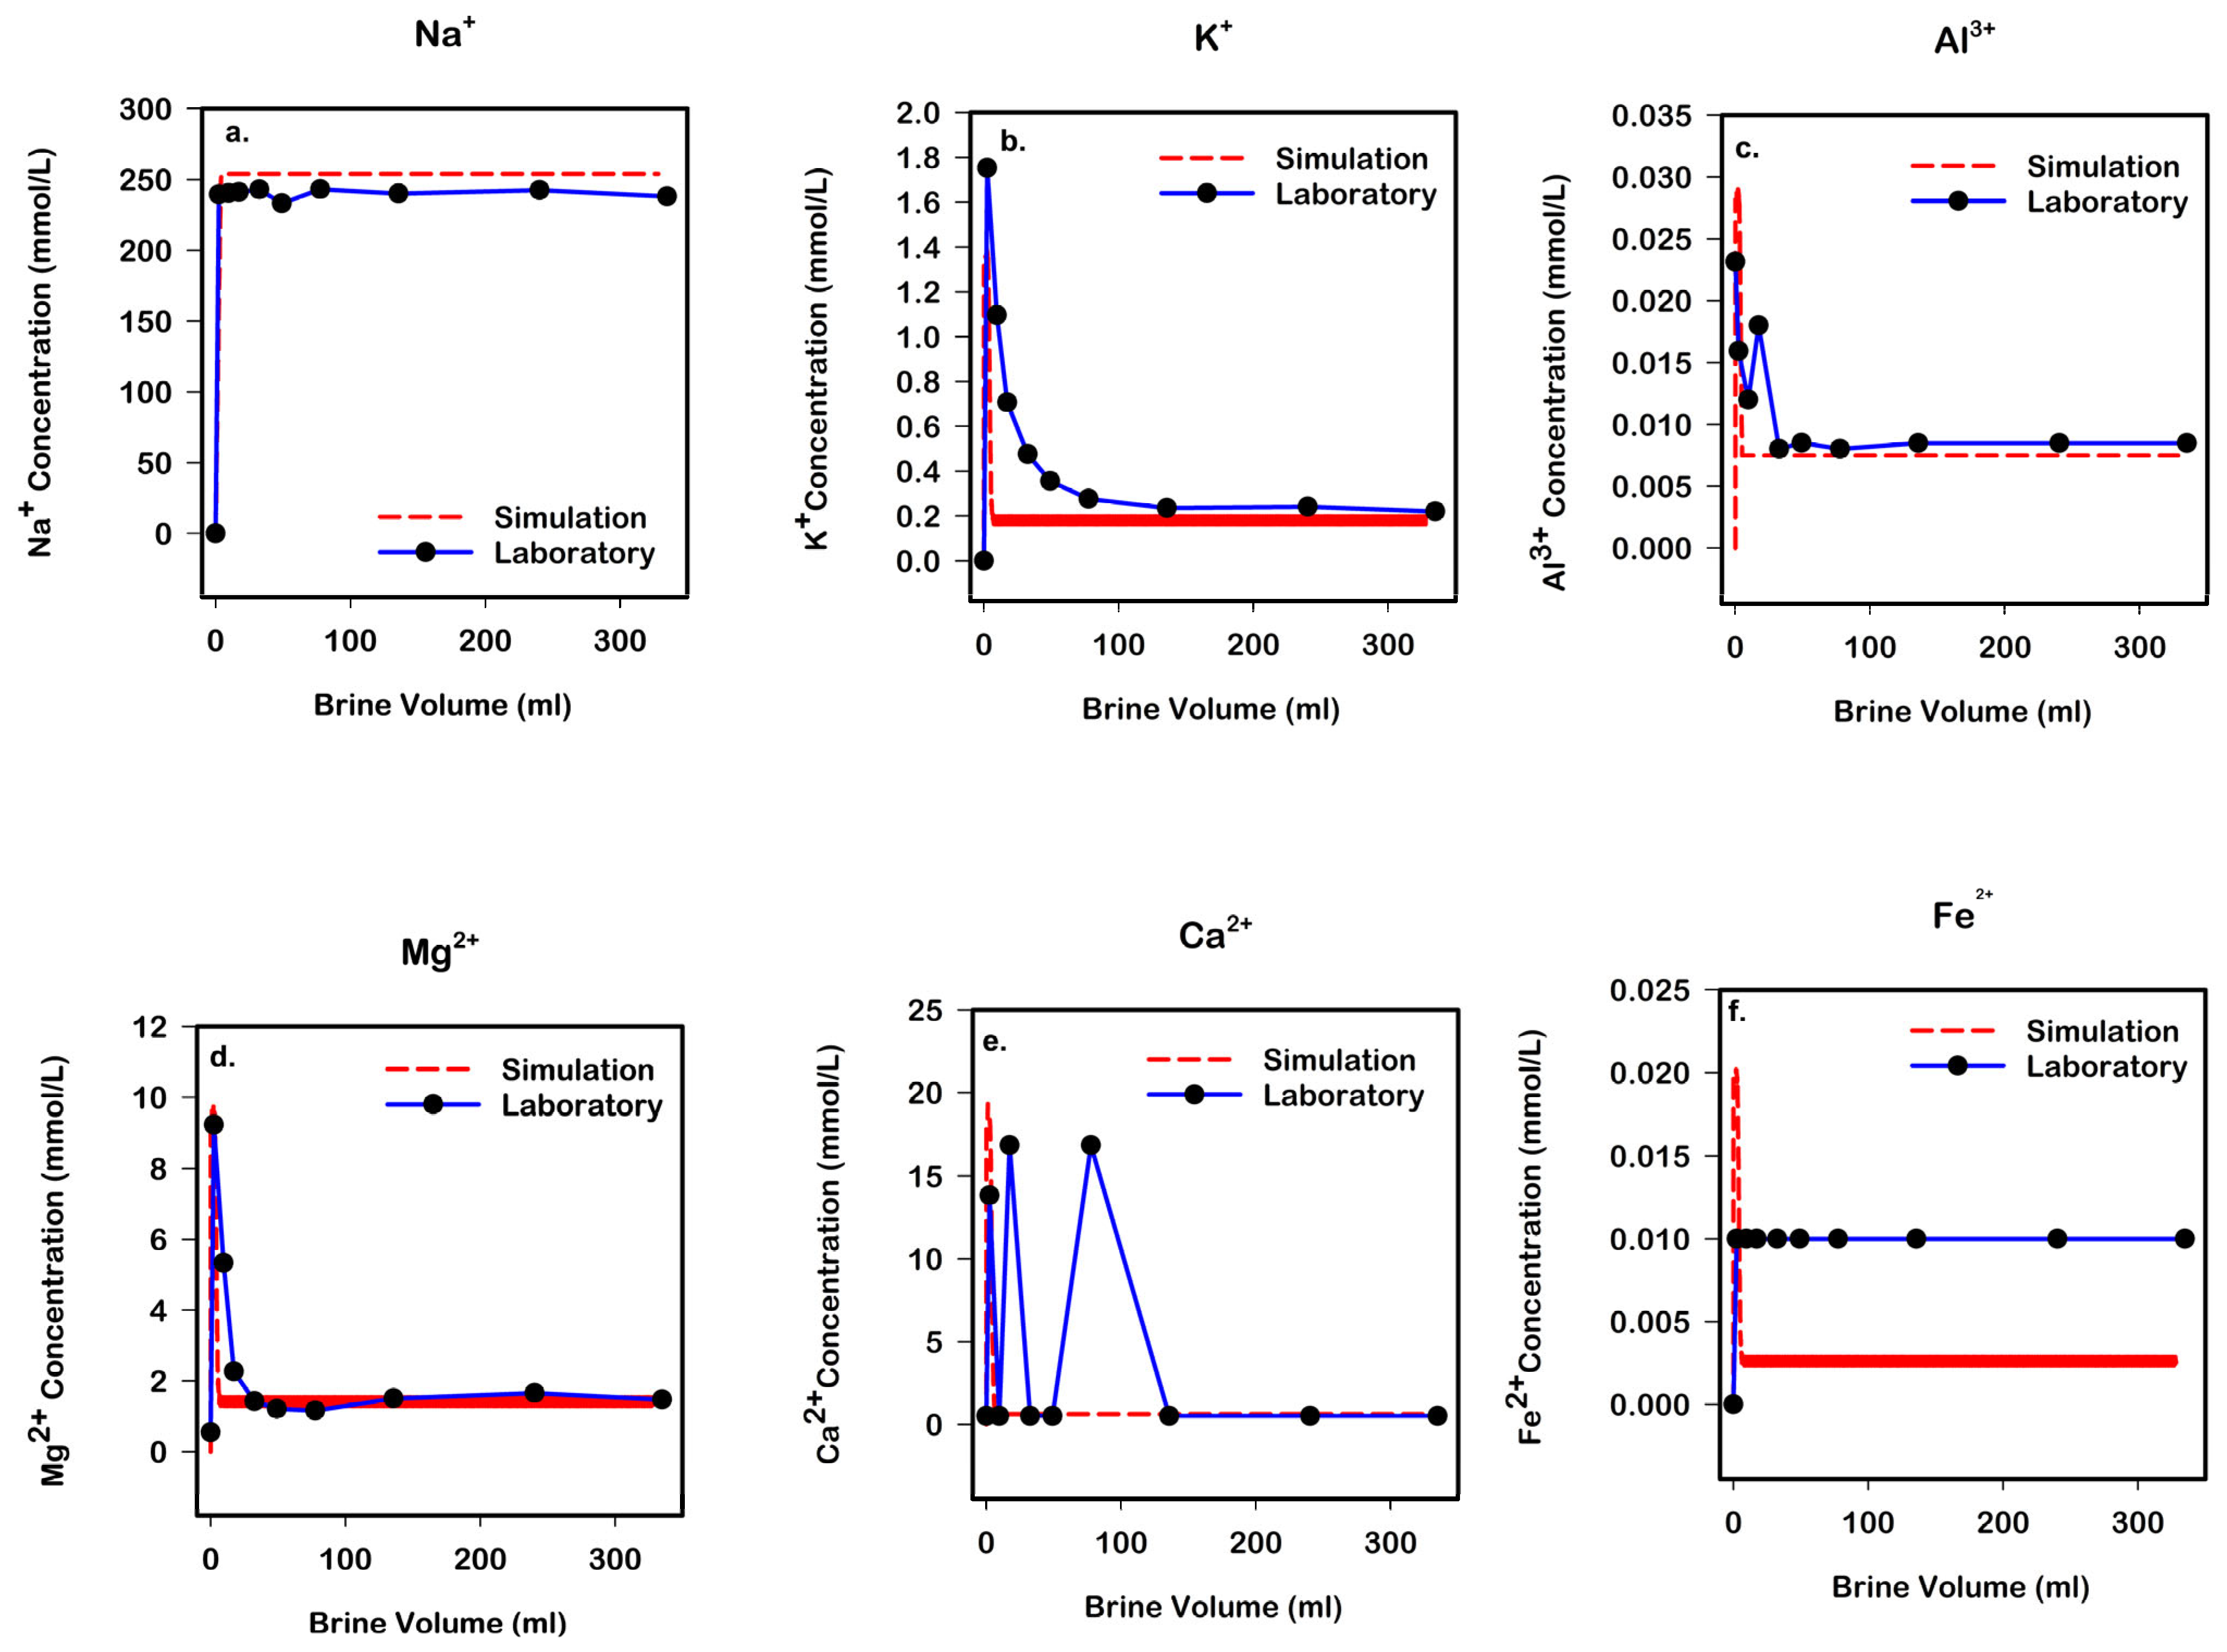
The graphs in Figure 7 illustrate a comparative analysis of ion concentrations measured in flow-through experiments on a core sample against those obtained from corresponding simulations across various brine volumes. The ions analyzed include Na+, Fe2+, K+, Mg2+, Ca2+, and Al3+, with each subplot (a–f) detailing how the concentrations of these ions change over the course of the experiment.
The sodium ion (Na+) concentration, shown in Figure 7a, remains relatively stable in both laboratory and simulation data, with only minor discrepancies at the beginning of the brine volume range. Aluminum (Al3+), presented in Figure 7b, exhibits an initial spike followed by uniformly low levels throughout the experimental range in both datasets. Potassium (K+), shown in Figure 7c, does not exhibit a sharp decline in the experimental data but rather a gradual reduction, indicating slower release or exchange reactions; this behavior is overestimated in the simulation. In Figure 7d, magnesium (Mg2+) demonstrates a significant initial decrease followed by stability, which both the laboratory data and simulation capture effectively, indicating a well-calibrated model for Mg2+ interactions. However, Figure 7e highlights calcium (Ca2+) with notable differences; laboratory results show multiple fluctuations in calcium concentration, likely due to calcite dissolution and precipitation, while the simulation shows a single peak followed by a reduction, suggesting calcite dissolution followed by precipitation. Finally, iron (Fe2+), in Figure 7f, maintains consistently low concentrations across all laboratory measurements, closely matched by the simulation due to the very low smectite concentration.
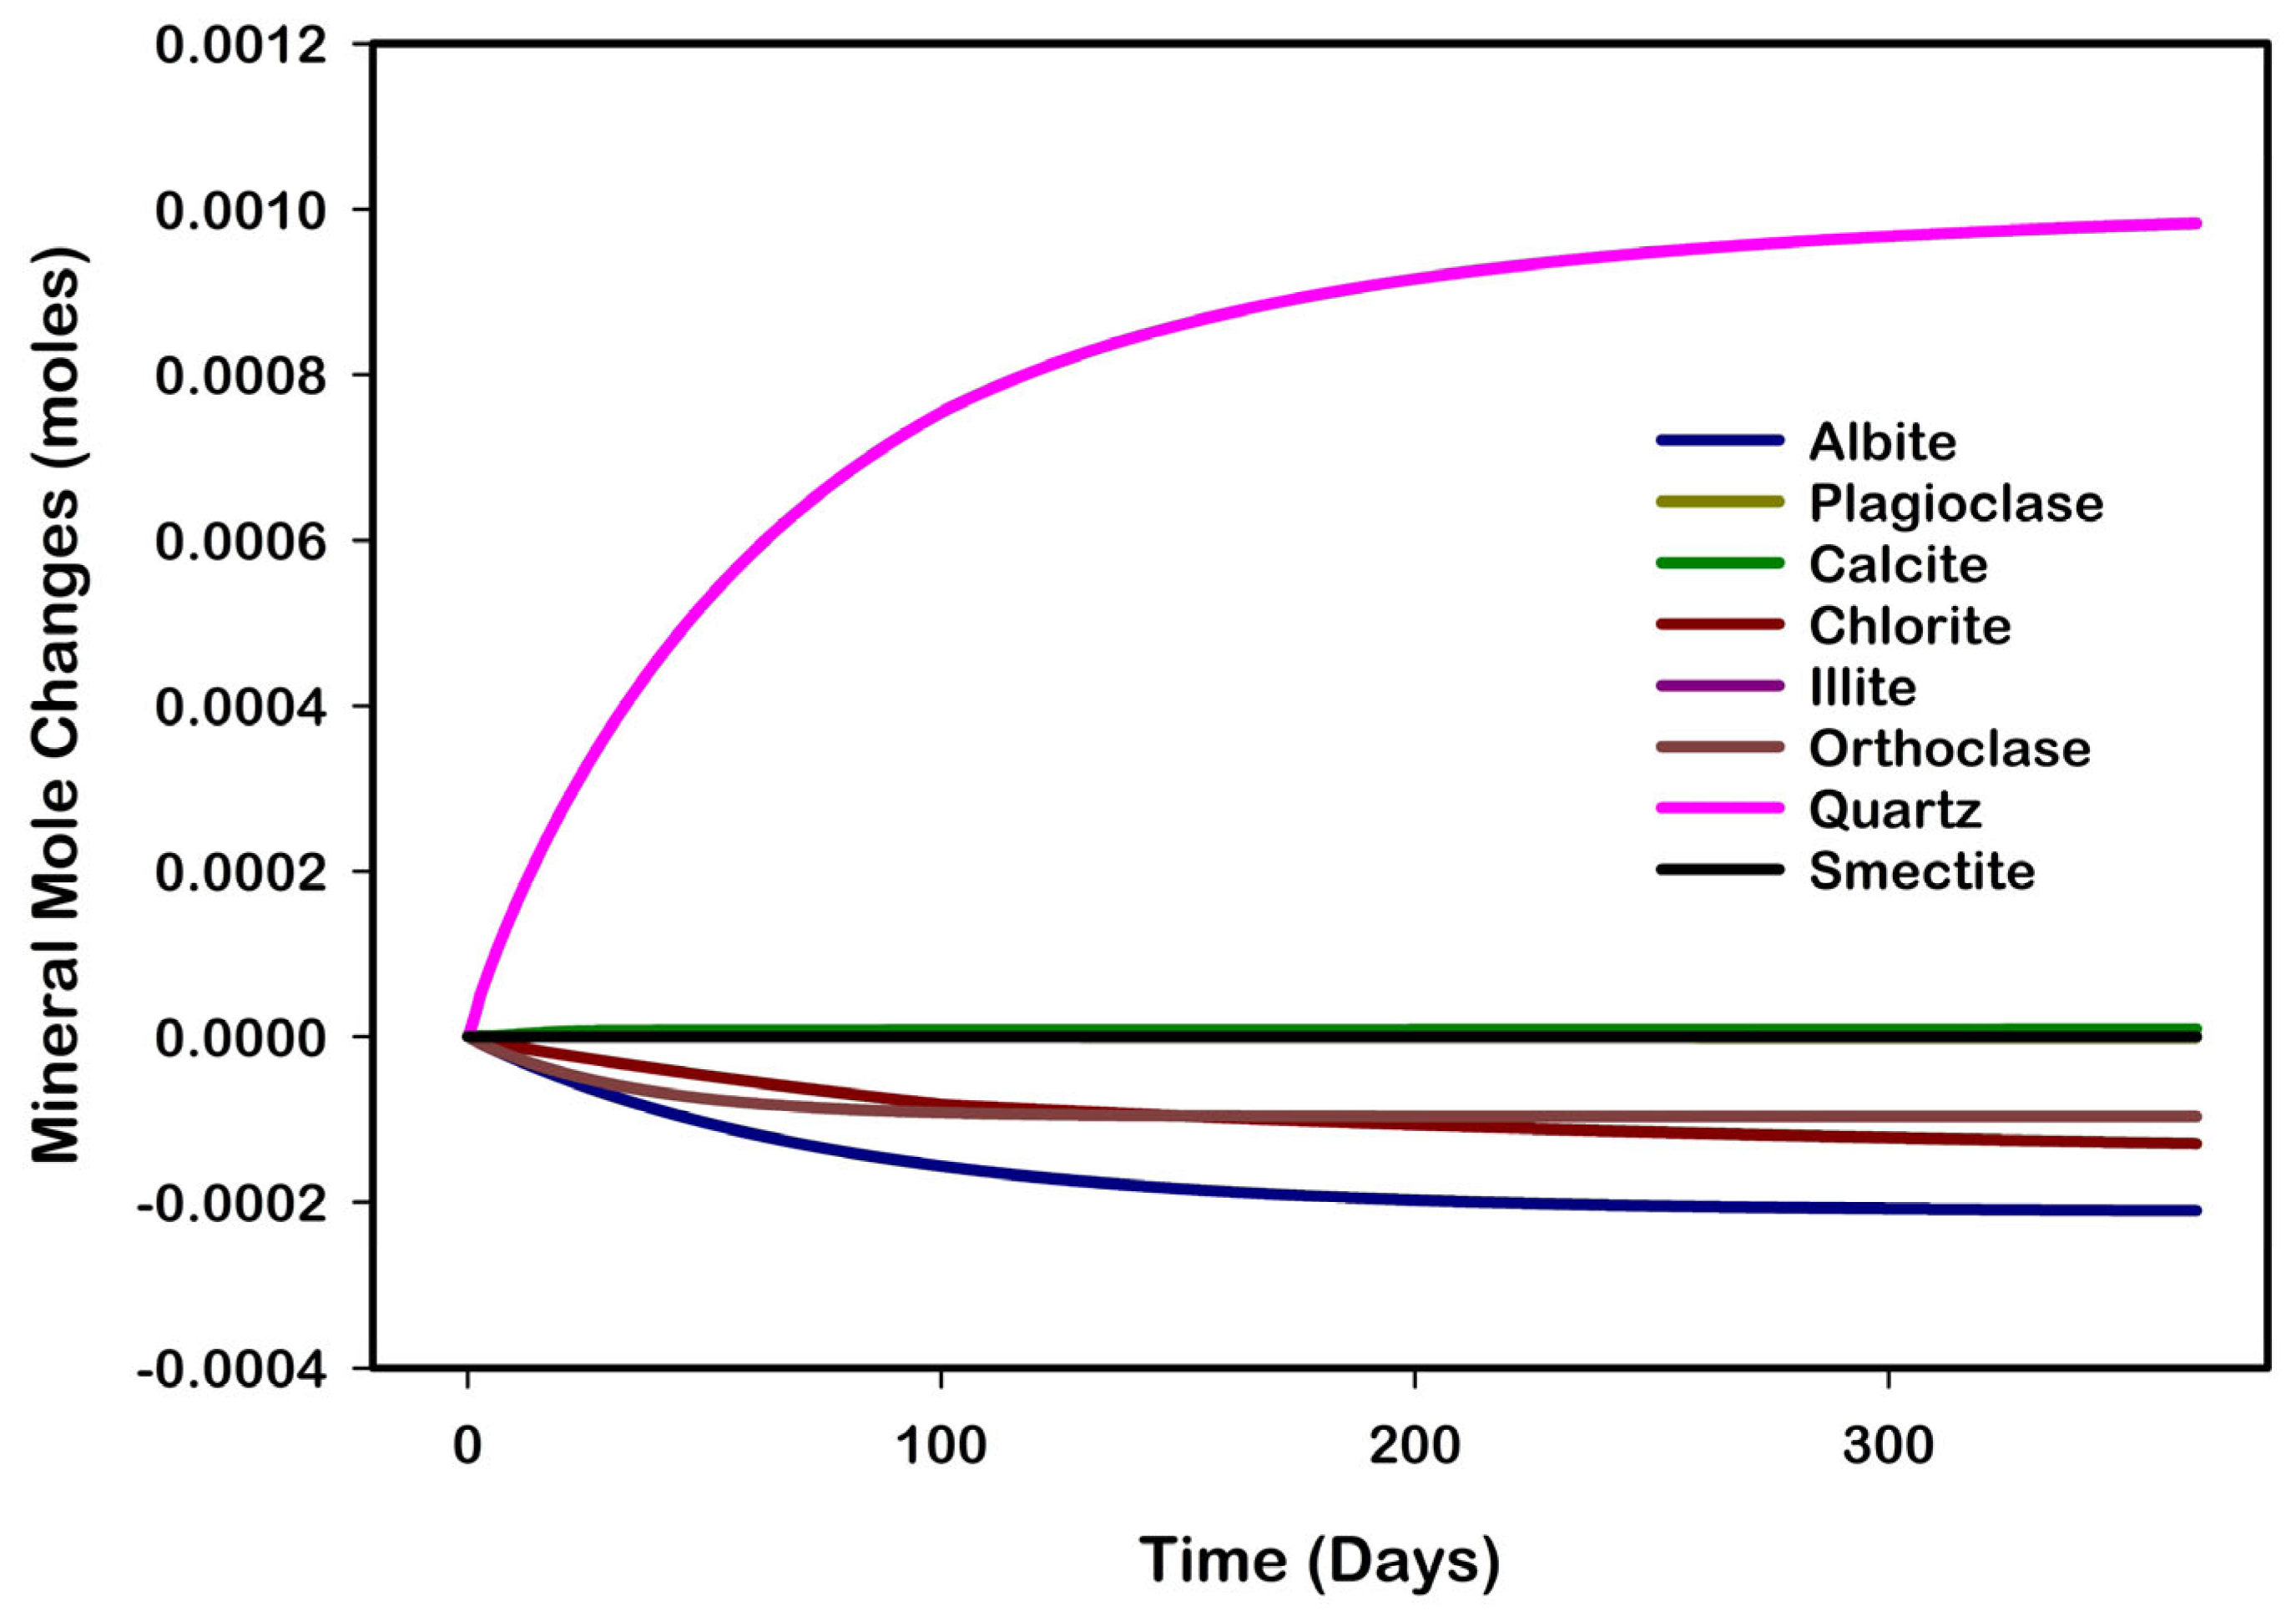
The results of the forecasting, as shown in Figure 8, illustrate the changes in mineral moles over a 365-day period. Quartz and calcite are observed to precipitate out of the solution, while the remaining minerals undergo dissolution.

3.3. CO2 Plume Containment

The plume results are illustrated in a series of diagrams in Figure 9. During injection, the CO2 forms an ascending plume that quickly reaches the reservoir–cap rock boundary. The initial average CO2 saturation within this plume is about 28%, with local peaks above 40% near the wellbore. Post-injection, CO2 spreads laterally, continuing for nearly 100 years before stabilizing into a mushroom-shaped plume, as shown in Figure 9. This lateral migration gradually slows, approaching stability between 500 and 1000 years. The simulations confirm that CO2 remains securely confined within the aquifer without leakage into the cap rock, validating the reservoir’s effectiveness for CO2 storage. By the end of the 1000-year period, CO2 saturation in the lower part of the plume decreases from 20% to 15%, mainly due to CO2 dissolution and dissociation. Near the wellbore, at the top of the plume, CO2 saturation shows a smaller reduction from 43% to 41%, while its lateral extent beneath the cap rock increases.

3.4. Changes in pH Due to CO2 Injection Across Different Distances and Depths

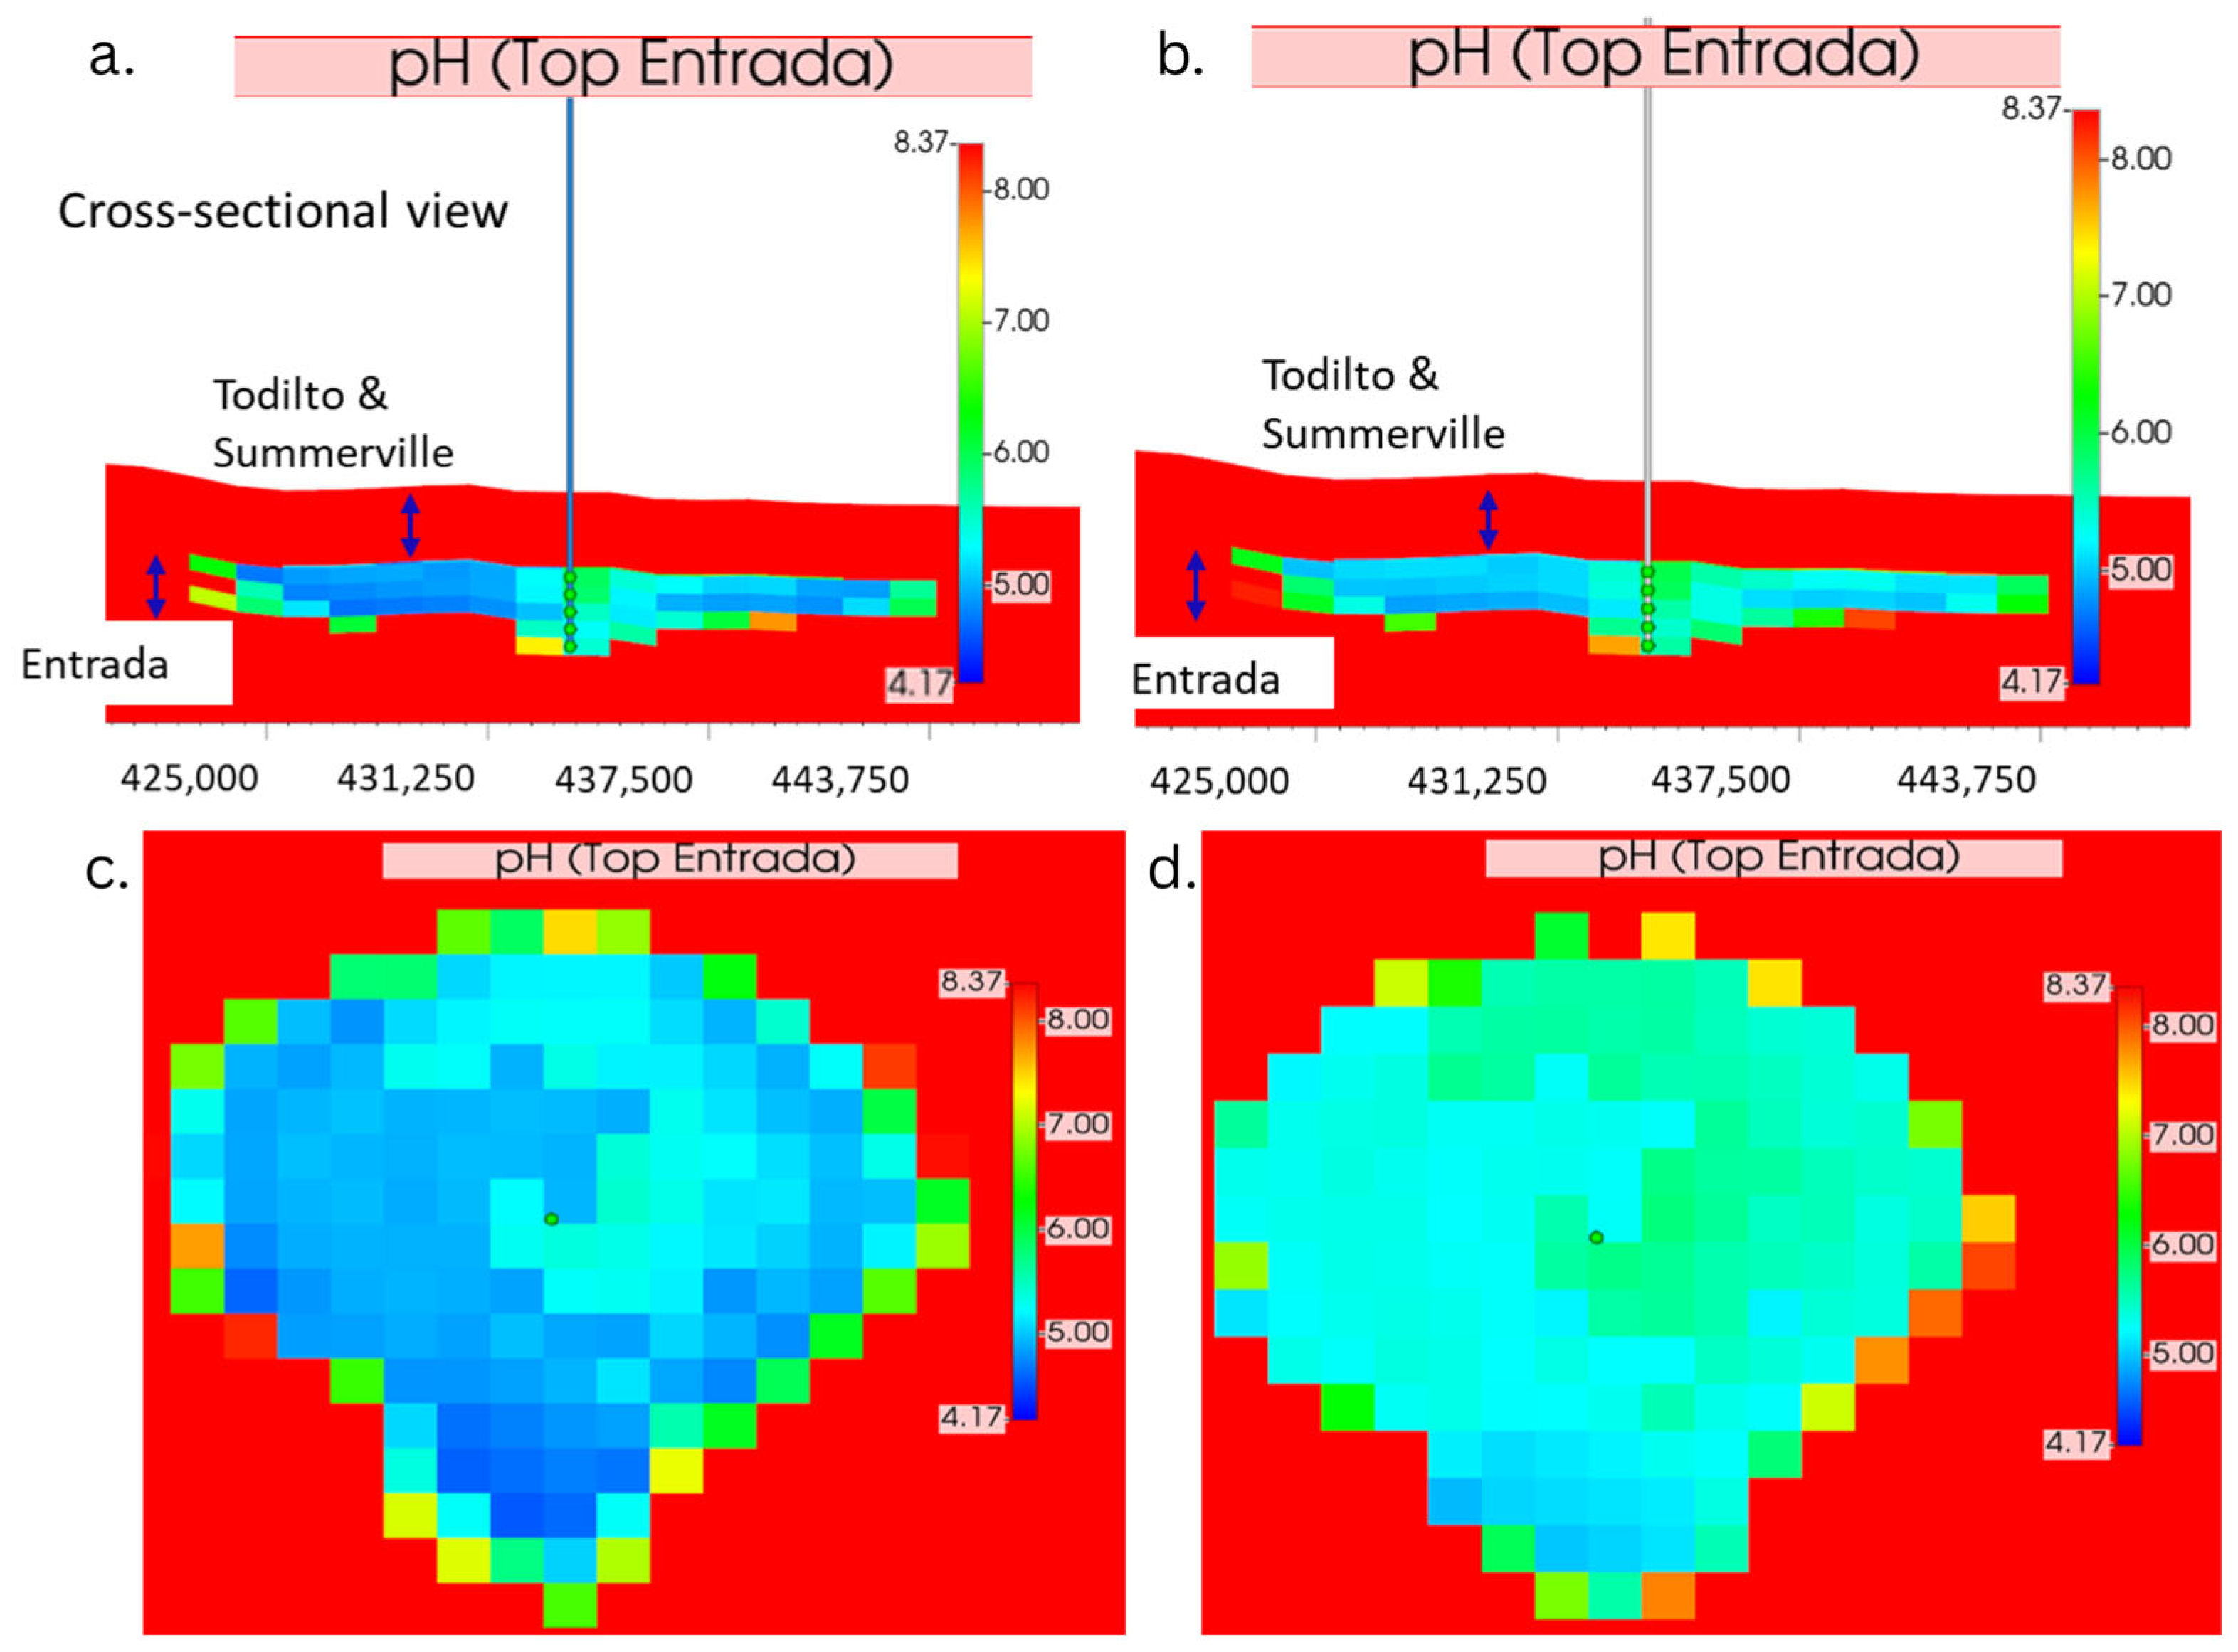
Laboratory studies show that the initial pH of the Entrada Sandstone region within the San Juan Basin is 8.37, as listed in Table 4. When CO2 injection begins, it reacts with formation brine to form carbonic acid (H2CO3), which dissociates into hydrogen ions (H+) and carbonate ions (CO32−), as described in Equation (1). The resulting hydrogen ions lower the pH within the aquifer. Shortly after injection, a rapid pH drop is observed near the wellbore, falling from an initial level of 8.37 to an acidic level of 5, as shown in Figure 10. Over time, as the CO2 plume migrates, it interacts with surrounding rock minerals, triggering buffering effects and mineral dissolution that alter the pH. This reduces the CO2 concentration around the injection well and induces pH changes across a broader area, as illustrated in Figure 10b,d.
Figure 11 illustrates the changes in pH levels and hydrogen ion (H+) concentrations in response to CO2 injection, as shown in Figure 11a,b, which depict the temporal evolution of these parameters at the injection well and at varying distances from it. In Figure 11a, a sharp decrease in pH is observed at all monitored locations (the wellbore, 1000 feet, and 2000 feet laterally) during CO2 injection, with the most significant decline near the wellbore, where CO2 concentration is initially highest. This acidification results from CO2 dissolution in formation water, which increases H+ concentration (Figure 11b). During injection, H+ concentration rises sharply, followed by a marked decrease, mainly due to CO2 migration and geochemical reactions within the aquifer. The dissolution of minerals, such as calcite, consumes H+ ions and releases divalent cations like calcium. These cations can precipitate as carbonate minerals, sequestering CO2 from the aqueous phase and reducing acidity. Additionally, non-carbonate minerals in the formation, such as chlorite and smectite, contribute to the neutralization process through their own dissolution, which consumes H+ ions. This buffering mechanism stabilizes pH over time after the initial CO2 injection.
Thirty years after CO2 injection ceased, pH levels show considerable spatial variability due to the migration and concentration of the CO2 plume. At 1000 feet from the wellbore, pH is higher than directly at the wellbore, primarily due to a rapid decline in H+ ion concentrations near the wellbore, resulting from the intense initial migration and subsequent diffusion. At 2000 feet from the wellbore, pH remains consistently higher compared to closer distances, highlighting the reduced influence of the CO2 plume at greater lateral distances. The lower CO2 concentration in this region has a diminished impact on pH relative to areas nearer the injection well.
During CO2 injection, the pH impact across different depths closely resembles the effects seen across lateral layers, with both showing a sharp and immediate reduction in pH. The pH change is especially pronounced in the uppermost layer, as shown in Figure 12. This effect is due to the significant density difference between formation brine and injected CO2, which leads to rapid buoyant segregation. As a result, CO2 rises toward the top layers, where it becomes trapped beneath the impermeable seal, creating more acidic conditions in the upper layers.

3.5. Temporal Dynamics of CO2 Trapping Mechanisms

As shown in Figure 13, during the first year of CO2 injection, structural trapping significantly increases to dominate other trapping mechanisms. By the end of year one, structural trapping accounts for 81.57% of total CO2 storage, overshadowing other mechanisms. Residual trapping is minimal at 0.1%, and dissolution trapping stabilizes at 17.39%. The precipitation of calcite sets mineral trapping to 0.94%.
By the fifth year of injection, structural trapping peaks at 84.38% before gradually declining, stabilizing at 69.20% by the end of injection. This decline is due to an increase in residual trapping, which reached 19.10%. Dissolution trapping contributes 11.70%, while mineral trapping remains negligible due to how slow the mineralization process is. A decade after injection ends (30–40 years from the start), residual trapping rises by approximately 1.6 times, reaching 30.01% of the total CO2 trapped, and further increases to 32.34% at the 125-year mark. Structurally trapped and dissolved CO2 fractions are 56.72% and 10.93%, respectively, with minimal mineral trapping (0.01%).
The trend in residual trapping growth is attributed to relative permeability hysteresis. For dissolution trapping, dissolved CO2 levels decline until 20 years post-injection (50 years since simulation start), after which they increase again and stabilize toward the end of the 500-year simulation. This resurgence in dissolved CO2 is likely driven by Rayleigh–Taylor instabilities [54], where the denser, CO2-rich brine at the reservoir top descends, and lighter brine beneath rises, enhancing dissolution through mixing and reducing structurally trapped CO2. Structurally trapped CO2 continues its decline until the end of the simulation, while mineralized CO2 remains negligible throughout.
At the conclusion of the 500-year simulation, structural, residual, dissolved CO2, and mineral-trapped CO2 account for 45.43%, 42.95%, 11.59%, and 0.03%, respectively. This trend persists until the 1000-year mark. The model’s mineralization calculations were confined to carbonate minerals, primarily calcite, and excluded changes in non-carbonate minerals, which do not contribute to mineral trapping of CO2 [48].

3.6. Characteristics of Mineralization and Its Influence on Flow Properties

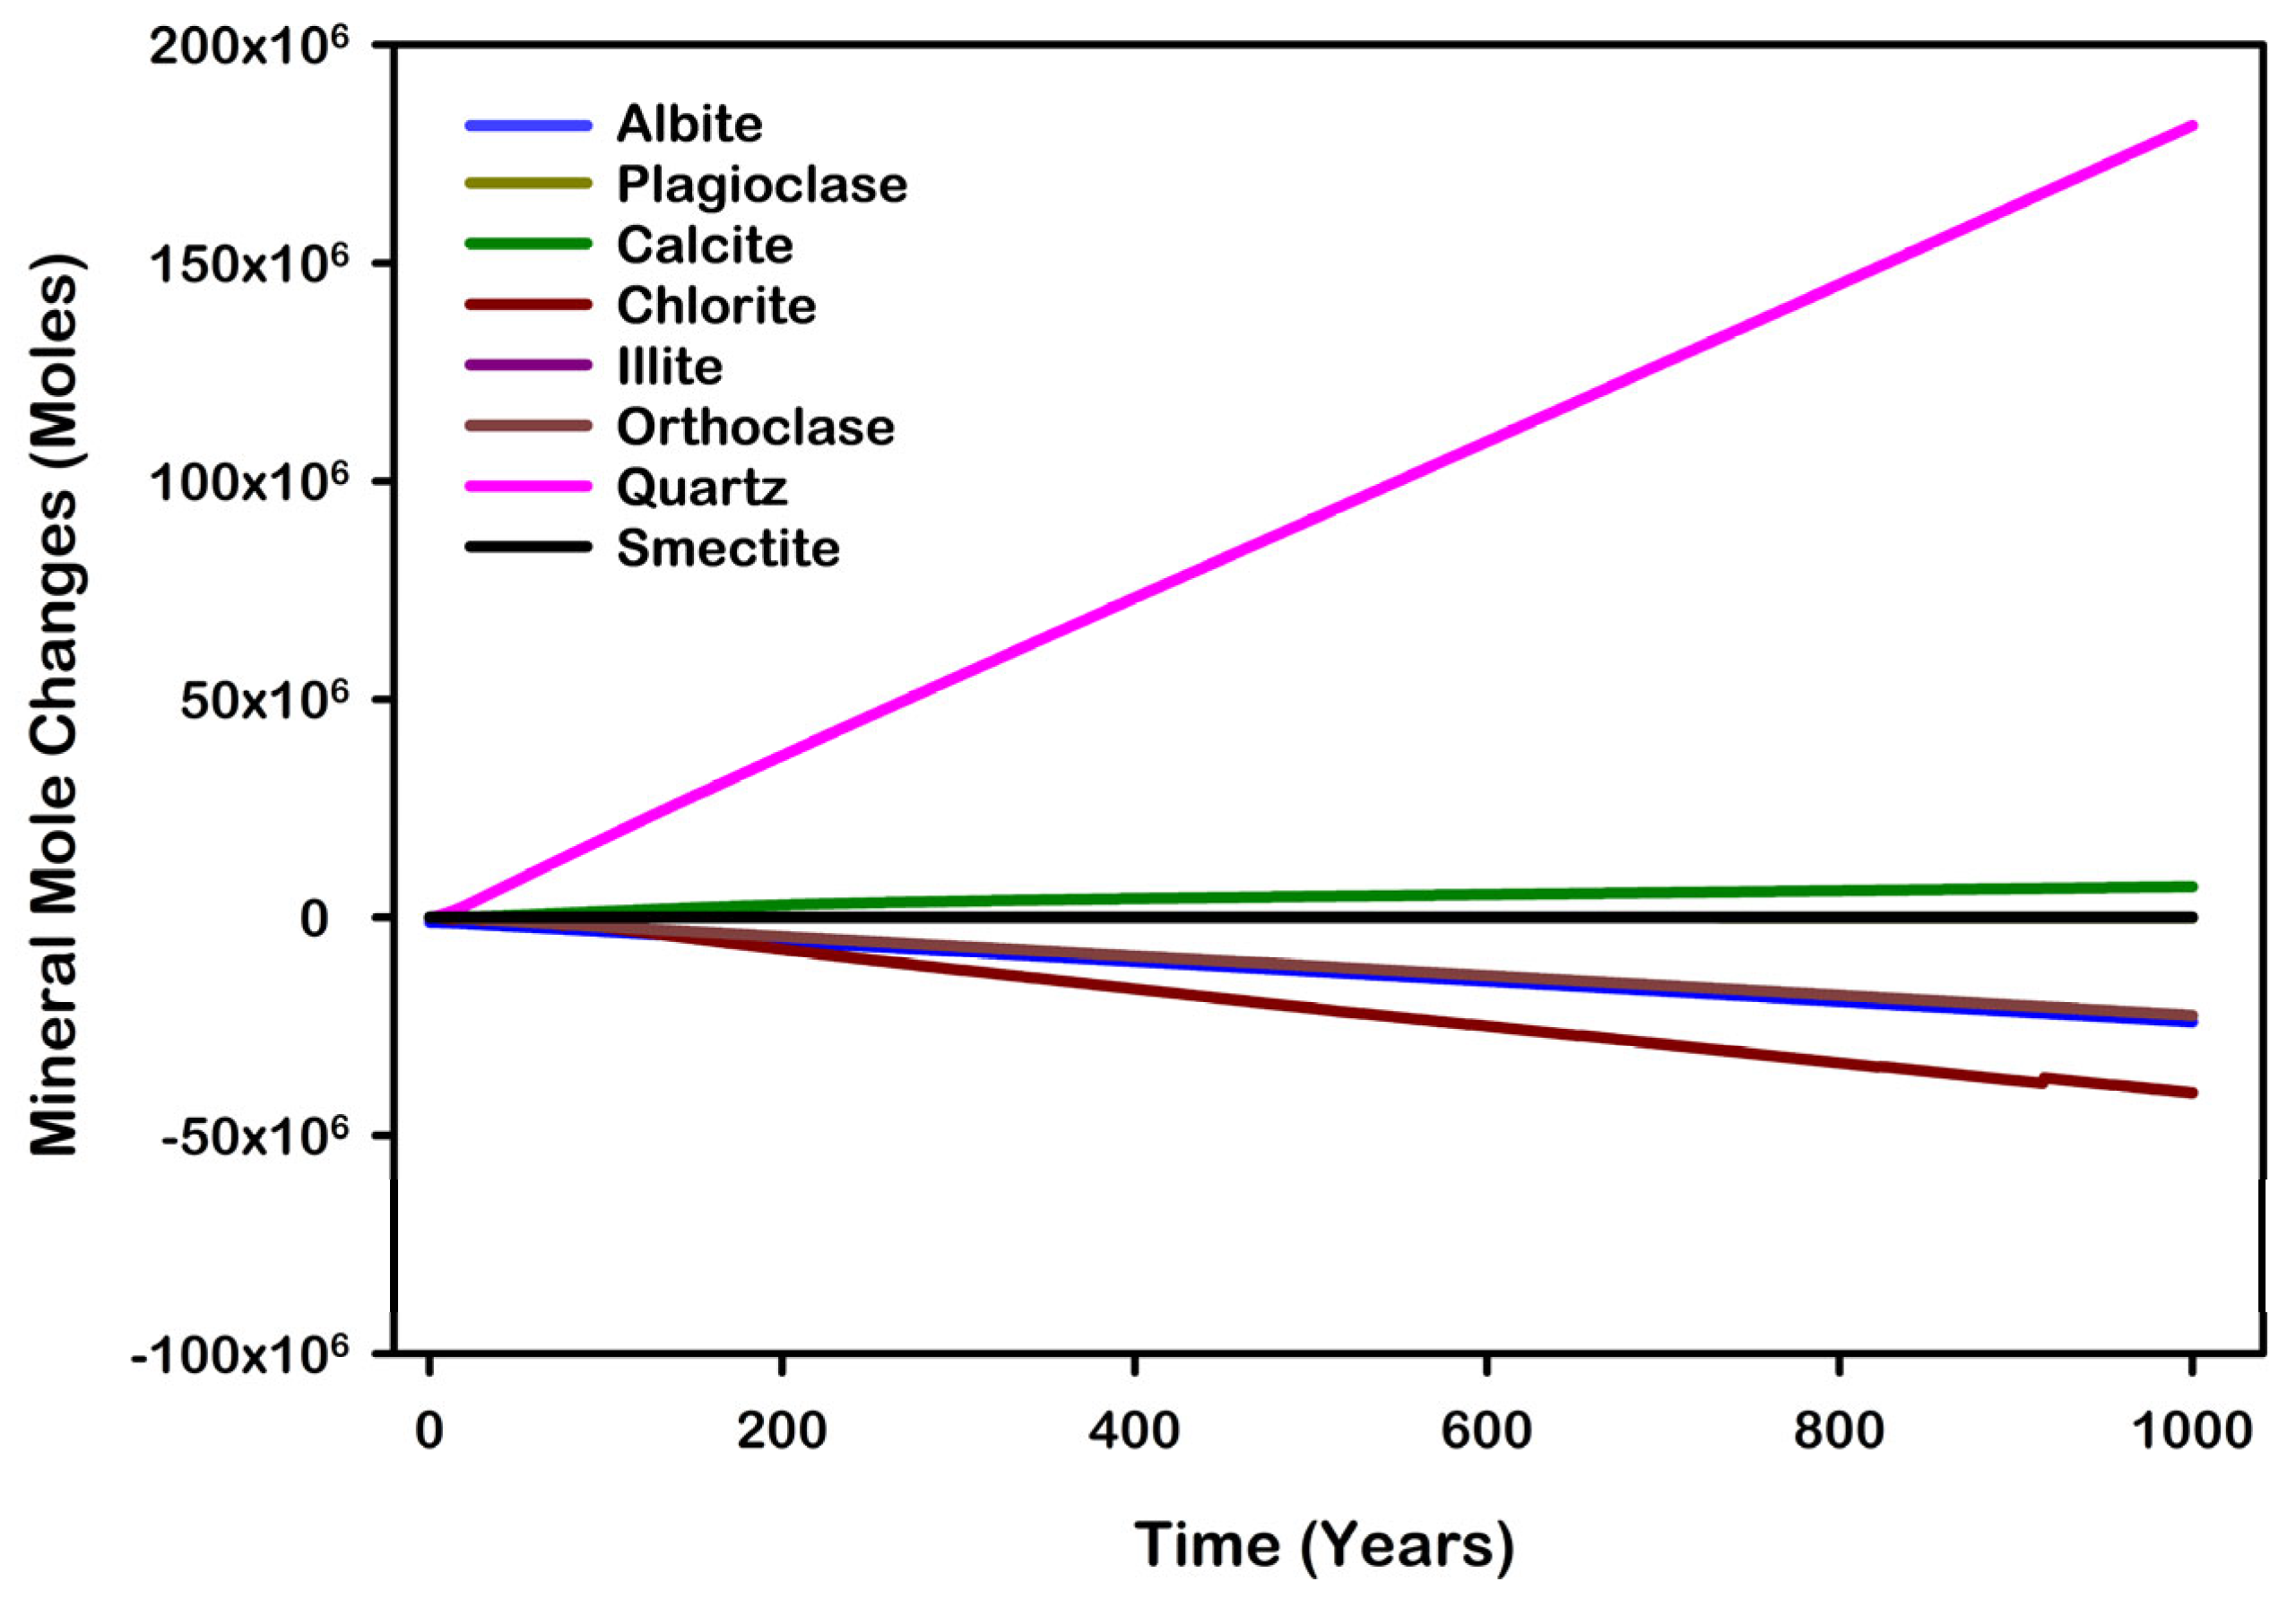
CO2 sequestration through mineralization represents a relatively small portion of CO2 trapping compared to dissolution, residual trapping, and structural CO2. This is because CO2 mineralization primarily involves converting dissolved CO2 into stable solid forms such as calcite (CaCO3), magnesite (MgCO3), siderite (FeCO3), and dawsonite (NaAlCO3(OH)2), depending on the geochemical environment and available cations. In the San Juan Basin, calcite is the only carbonate, comprising 4.3% of the initial mineral volume. While non-carbonate minerals do not directly contribute to carbonate trapping, their dissolution and precipitation can alter porosity and permeability, indirectly affecting fluid flow and reservoir behavior. This highlights a broader geochemical and geological influence beyond direct carbonate mineralization. Figure 14 illustrates all precipitation and dissolution reactions of minerals over the 1000-year period.
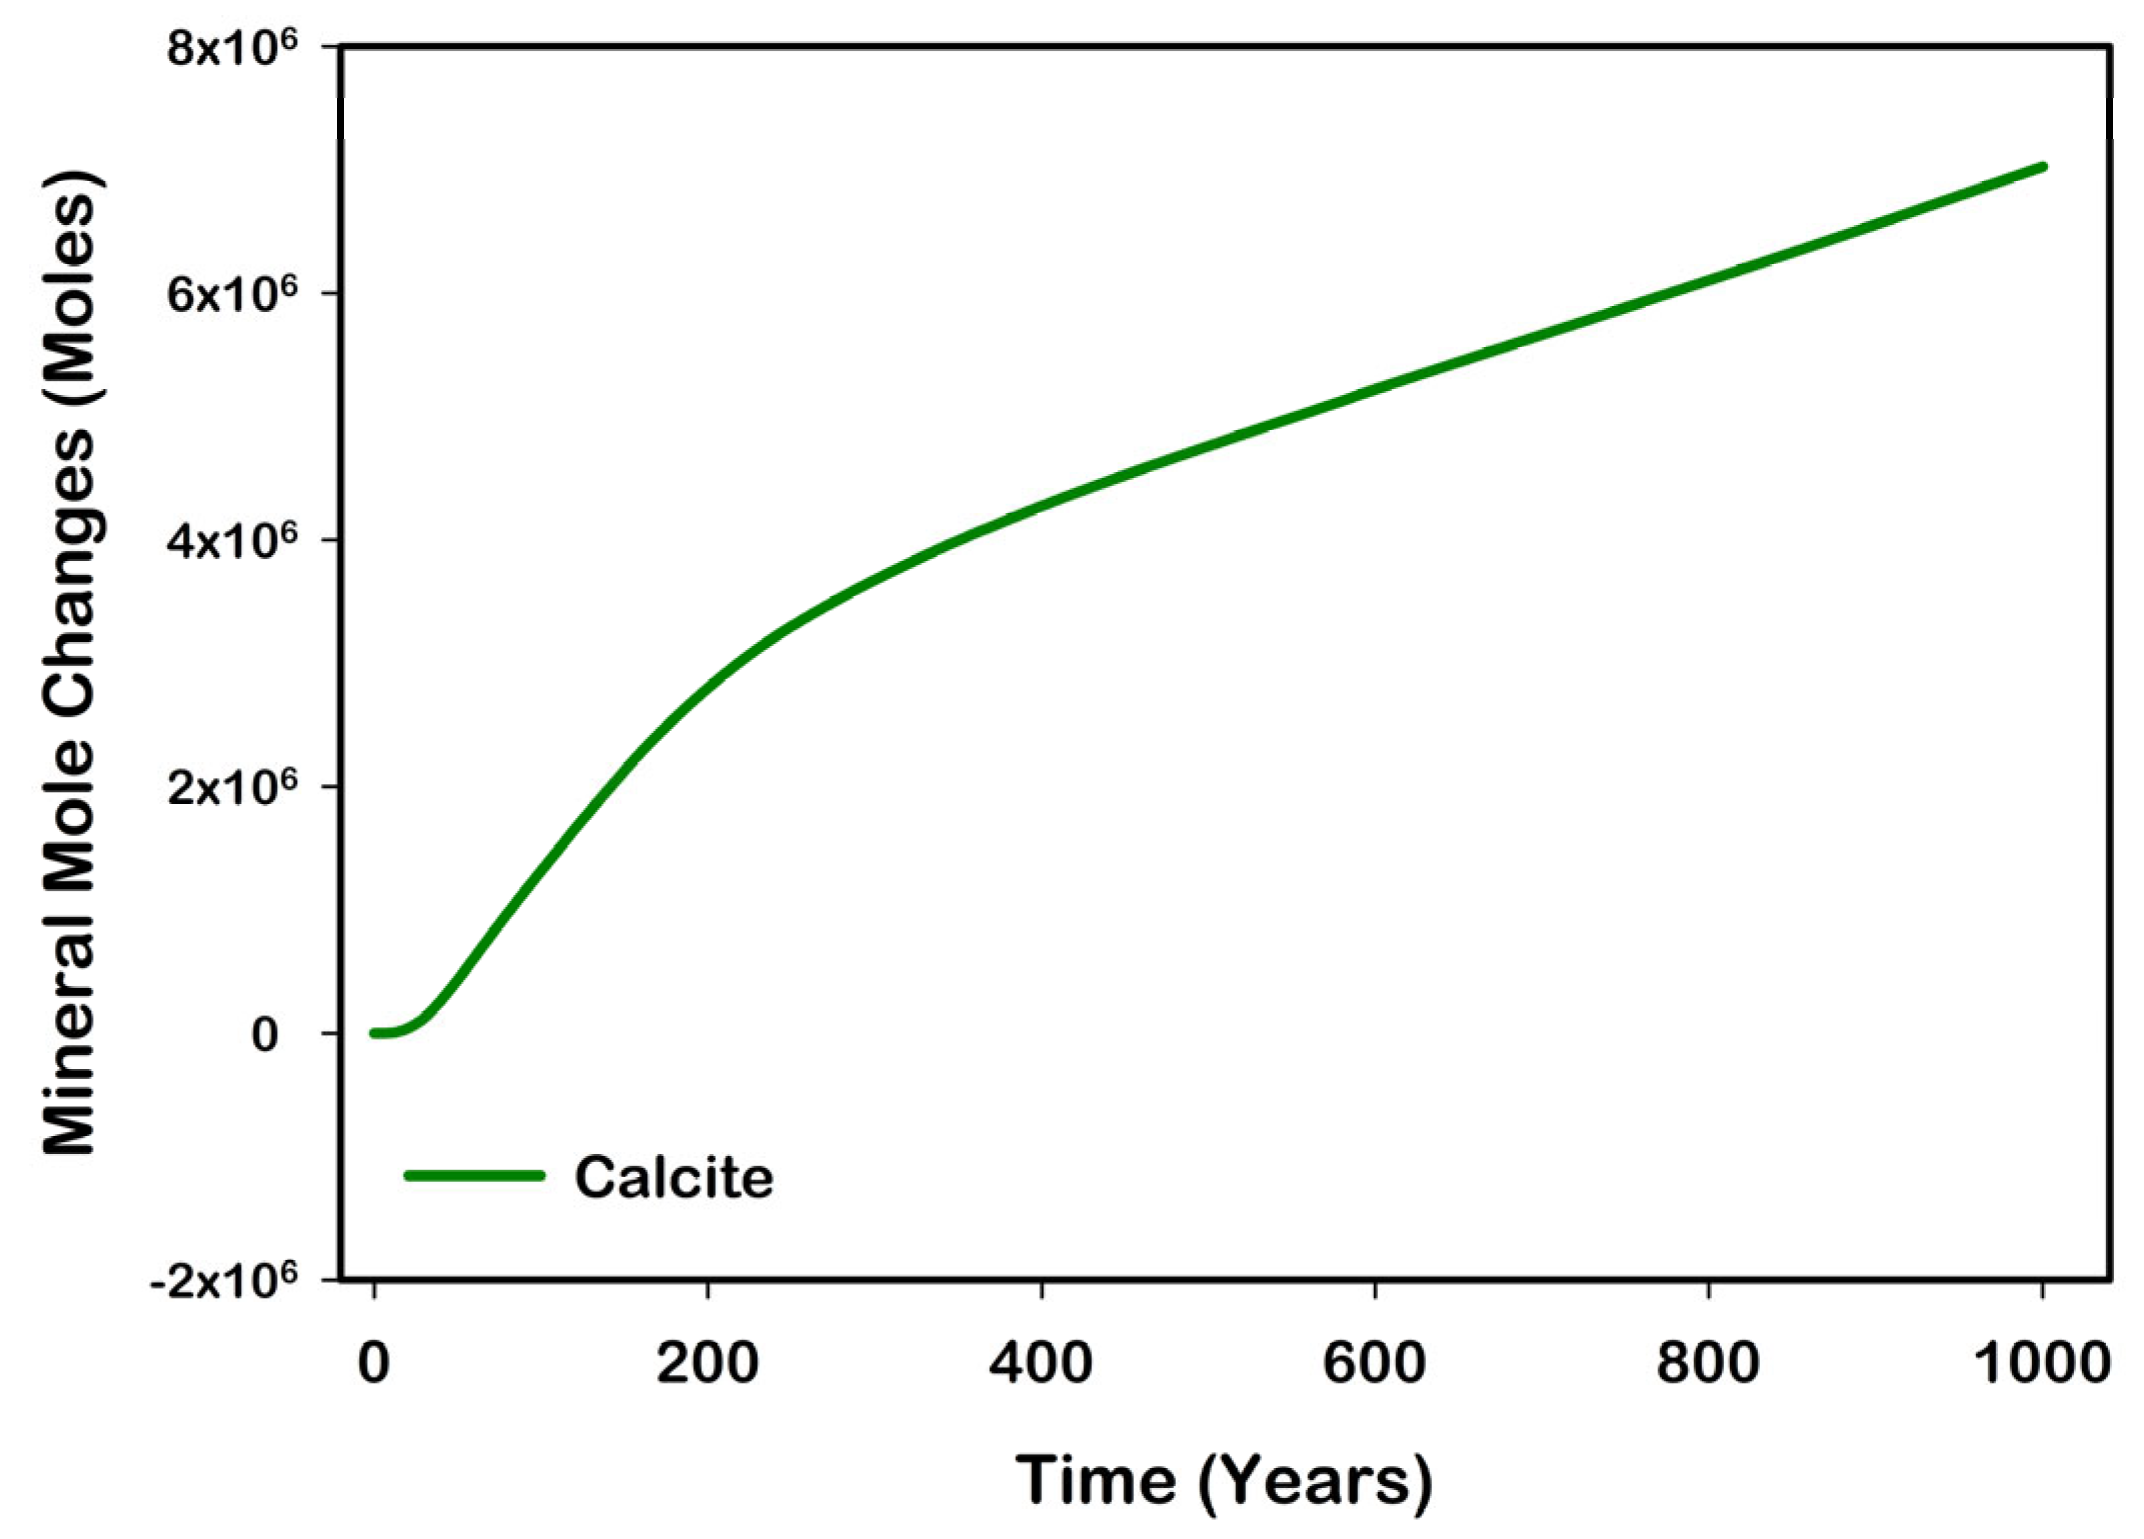
Figure 15 shows long-term changes in calcite precipitation over 1000 years. The graph indicates a continuous increase in calcite moles, reflecting a steady progression toward chemical stabilization in the system. Initially, high precipitation rates suggest an abundance of Ca2+ ions within the first 200 years; afterward, the rate of precipitation slows as Ca2+ availability declines due to plume stagnation. This pattern suggests that the brine composition and CO2 injection conditions promote calcite formation.
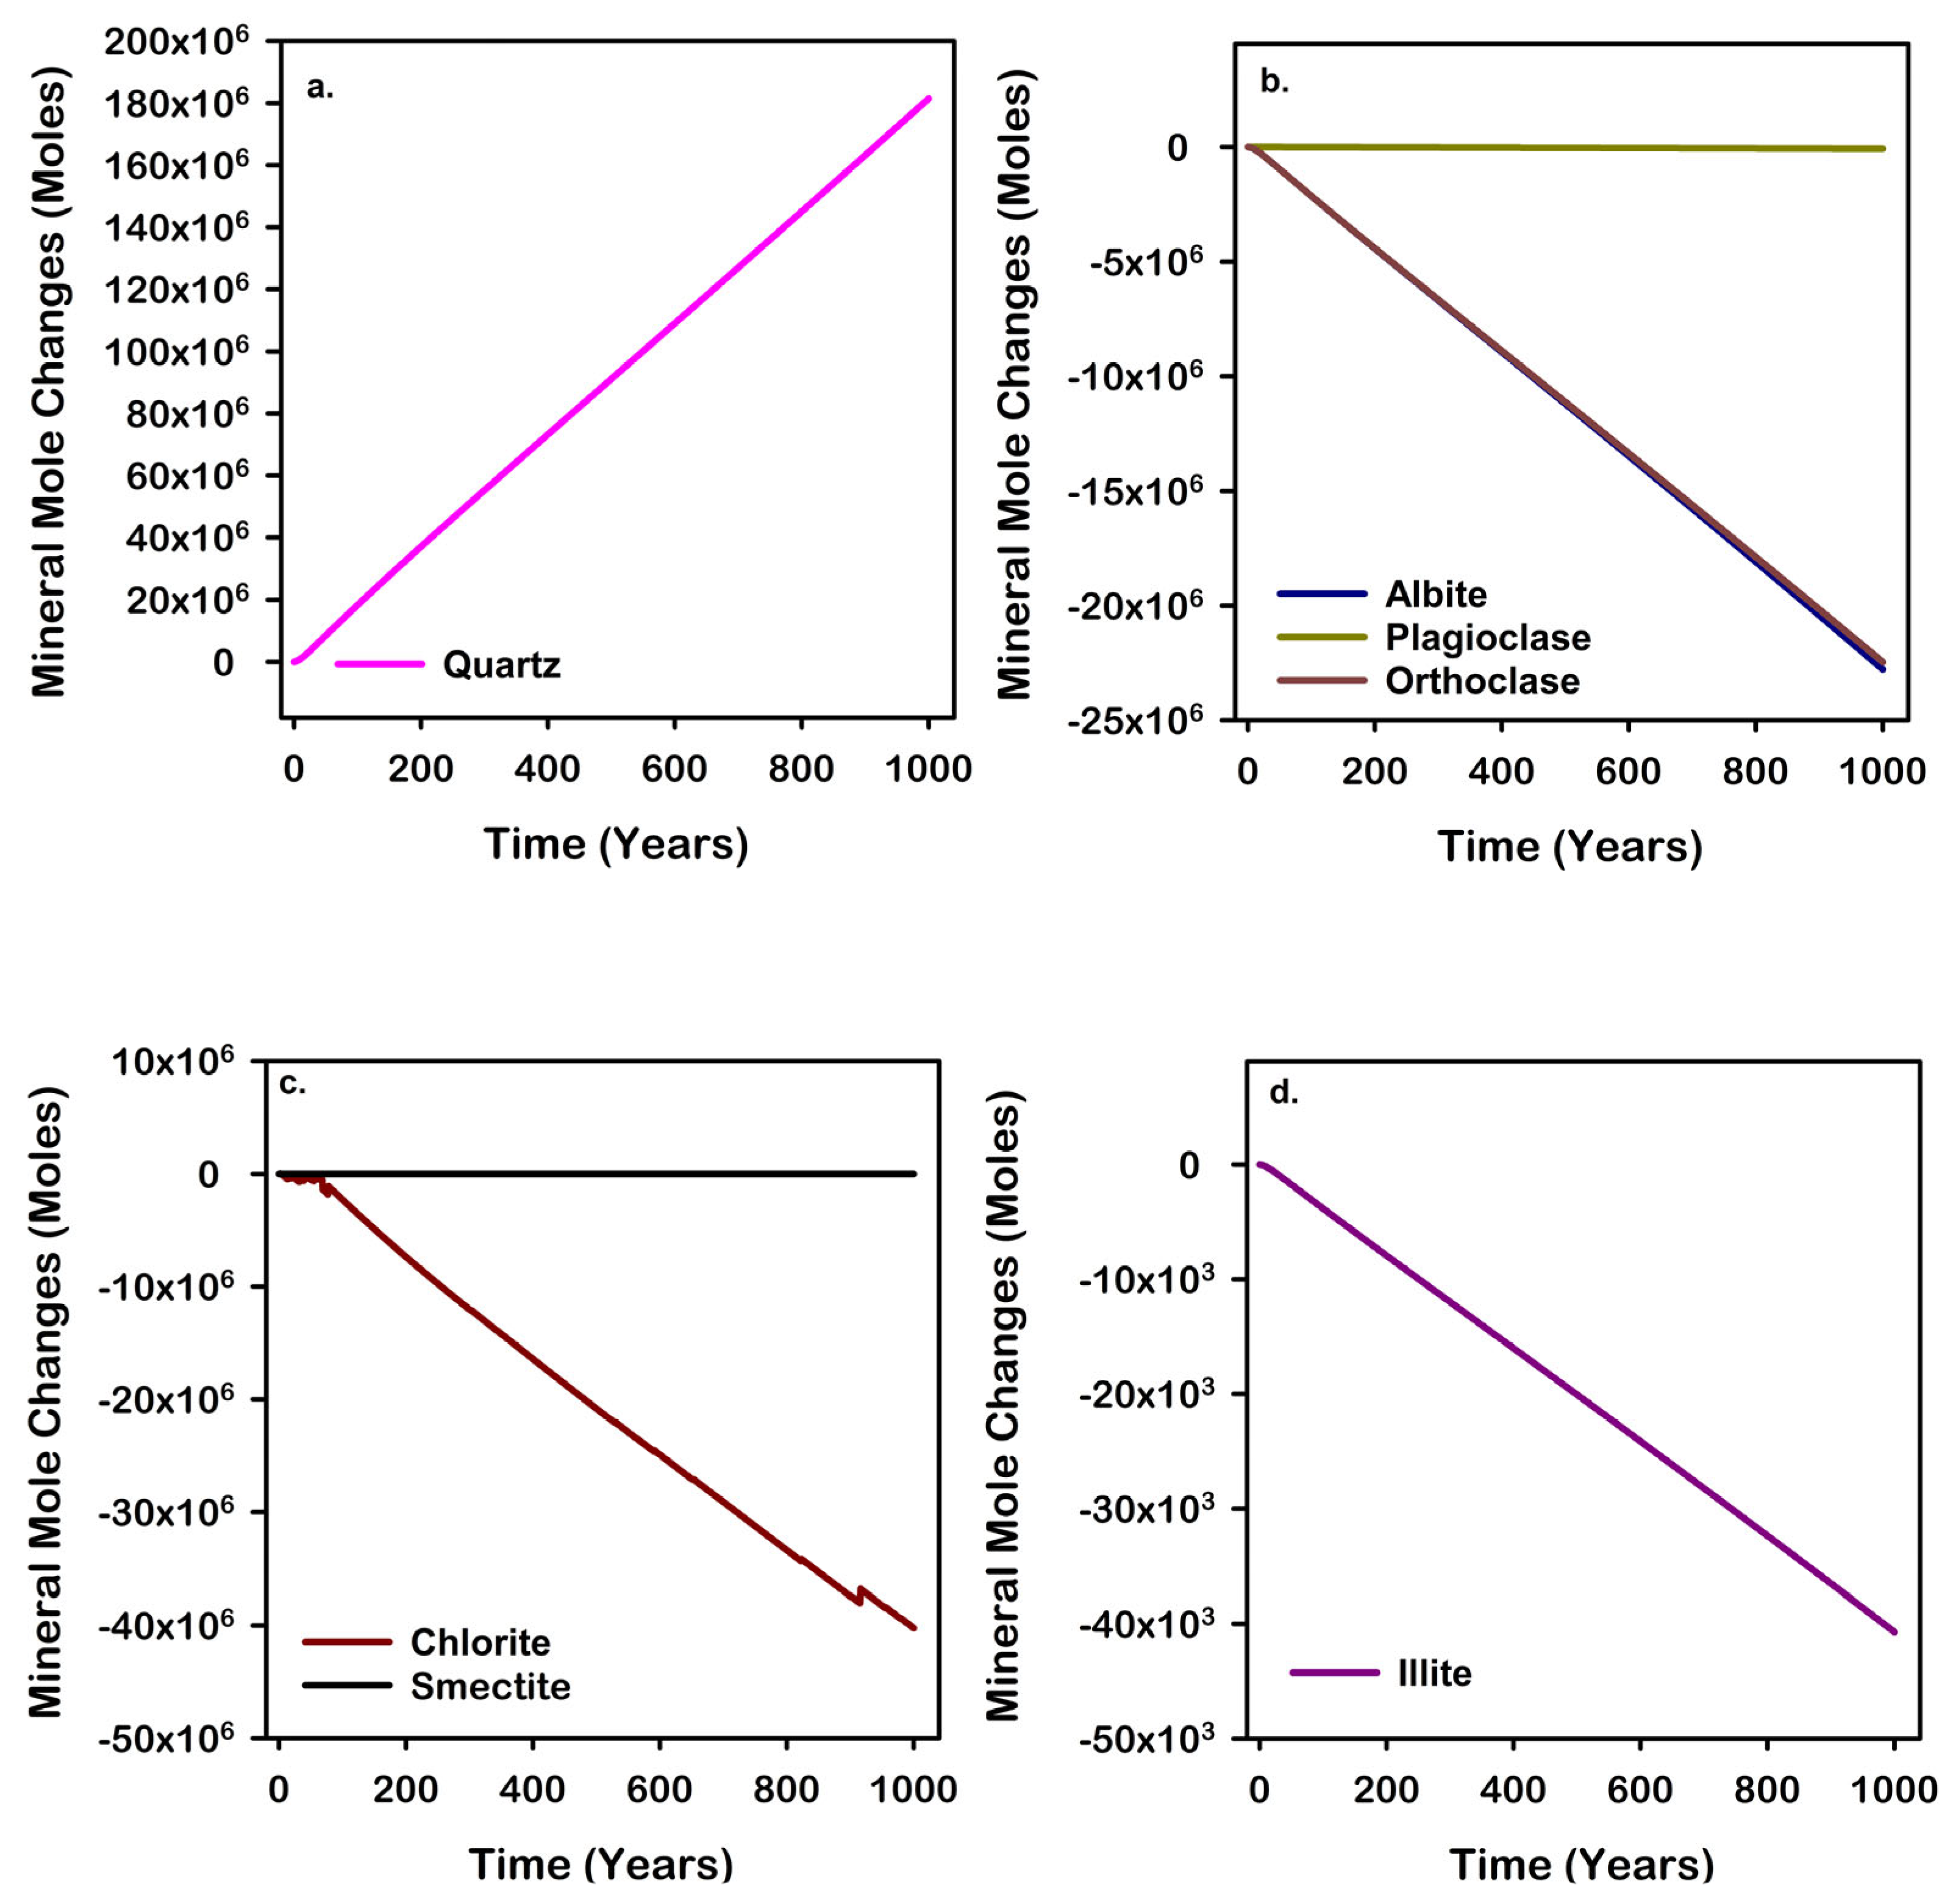
Beyond calcite, Figure 16a–d show the behavior of other minerals over 1000 years, shedding light on the reservoir’s evolving geochemistry. Quartz exhibits consistent precipitation throughout the period, which tends to reduce formation porosity as the mineral occupies previously open pore spaces. In contrast, chlorite and illite show steady dissolution over the same timeframe, potentially increasing formation porosity and partially offsetting the effects of quartz and calcite precipitation. This balance between mineral precipitation and dissolution illustrates the complex geochemical adjustments within the reservoir.
Feldspars, including albite, plagioclase, and orthoclase, consistently dissolve when exposed to CO2 over the 1000-year timeline. Albite and orthoclase dissolve more significantly than plagioclase, and their breakdown further enhances porosity, as these minerals constitute a major part of the rock matrix, and their dissolution frees up space. Smectite remains largely unchanged due to its minor initial presence, making up only 0.0184% of the total composition, and thus has minimal impact on the reservoir’s overall geochemical evolution.
Figure 17 illustrates the effect of geochemical reactions on porosity. Changes in porosity primarily occur in areas where pH variation happened, with notable alterations observed within the first 30 years, as shown in Figure 17a. During this initial period, porosity decreases due to the dominance of precipitation of minerals. As the CO2 plume migrates over time, porosity changes expand across a larger area, as depicted in Figure 17a–d. Although the dissolution of certain minerals attempts to counterbalance the porosity decrease from quartz and calcite precipitation, the overall effect of mineral reactions results in an approximate 0.09% net decrease in porosity. Despite instances of dissolution, precipitation remains the predominant process throughout.
The trend in Figure 18 indicates that the topmost grid blocks (70, 51, 11; 72, 51, 11; 74, 51, 11; 76, 51, 11) experience a more significant reduction in porosity than the deeper layers, largely due to CO2′s buoyancy. Upon injection, CO2 rises towards the top because of its lower density, leading to higher concentrations in the upper layers, which accelerates mineral dissolution in these zones. In contrast, deeper layers, exposed to lower CO2 concentrations, exhibit a lesser reduction in porosity, revealing a vertical gradient in CO2–rock interactions where the top layers undergo more active dissolution.
An initial rapid decline in porosity across all layers, followed by a plateau, possibly reflects the equilibrium state reached between dissolution and precipitation reactions over time. Our analysis identifies a distinct spatial trend in porosity changes associated with CO2 injection. Initially, the most significant porosity reduction occurs near the wellbore, where CO2 concentrations are highest, facilitating intense and immediate mineral reactions. As CO2 migrates laterally away from the wellbore, it accumulates in more distant reservoir regions, leading to a gradual decrease in the rate of porosity change in these areas, which eventually stabilizes at lower levels than those near the wellbore.

3.7. Impact of Geochemical Reactions on Ions

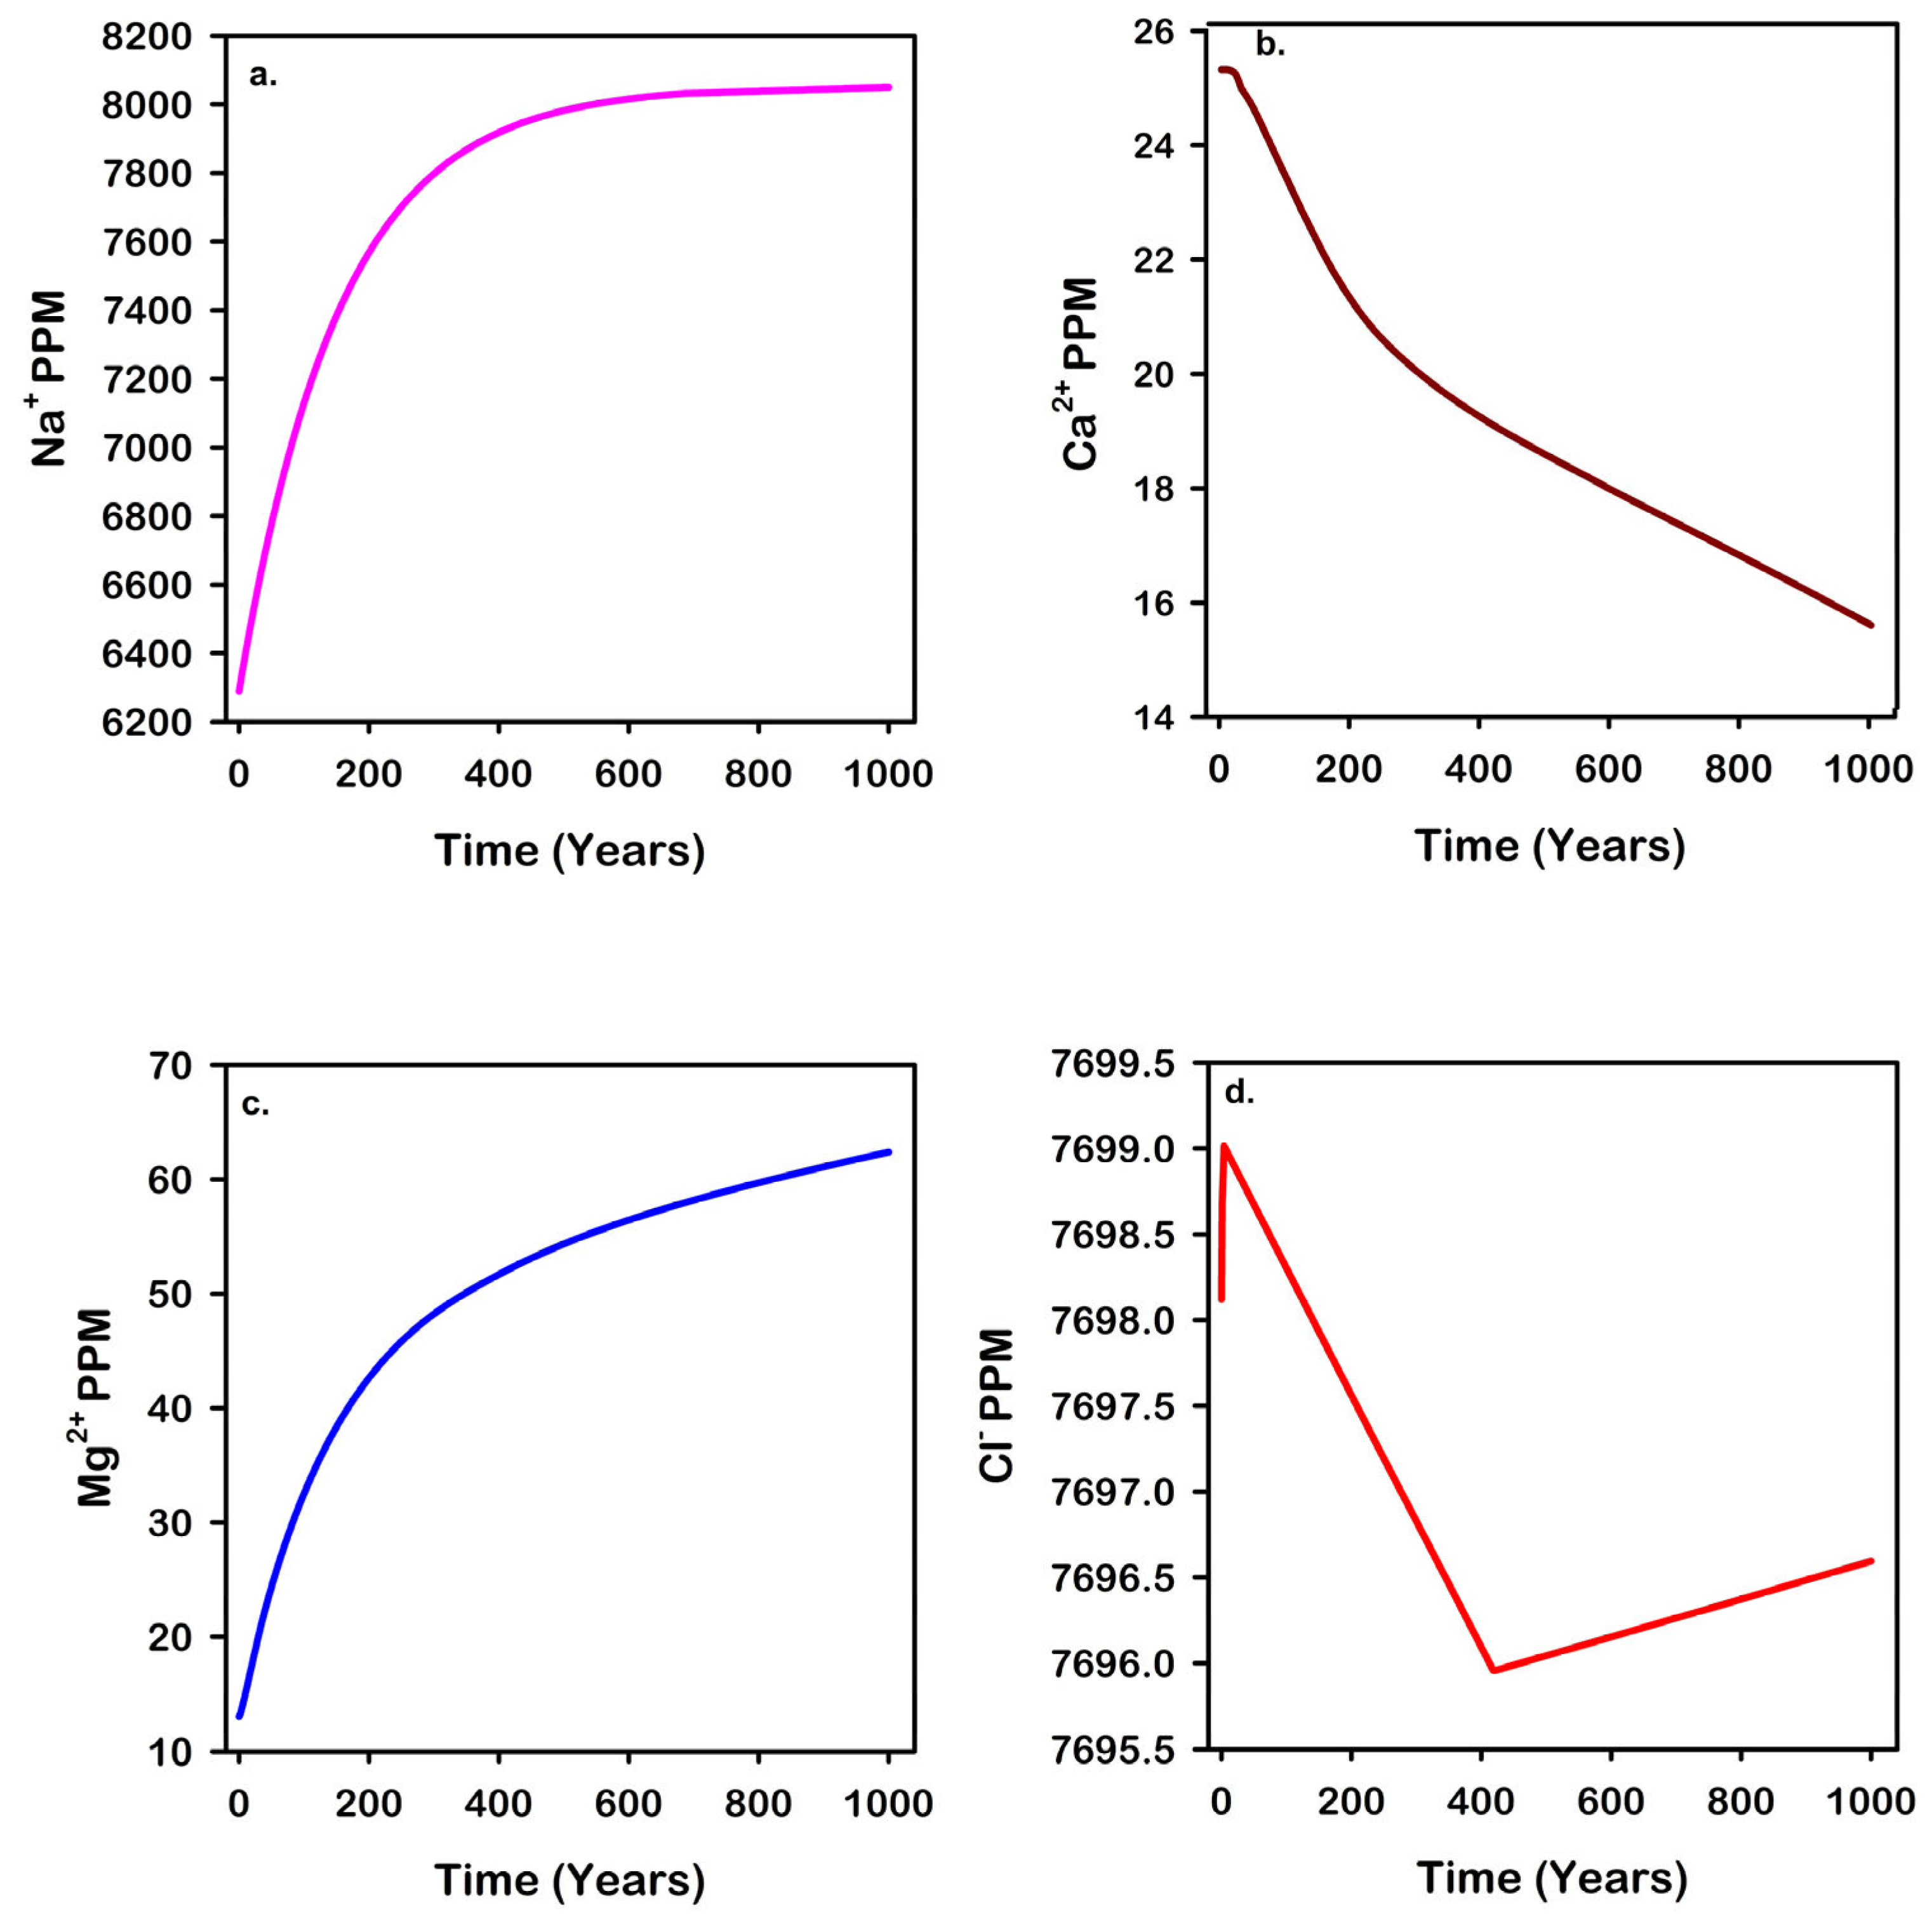
The behavior of initial ions like Na+, Ca2+, Mg2+, and Cl in a geochemical system is heavily influenced by CO2-induced mineral reactions. Figure 19 shows the concentration changes of these ions over 1000 years, illustrating the dynamic interactions between mineral dissolution and precipitation and the resulting ion distribution.
The concentration of Na+ steadily increases over time, as seen in Figure 19a. This trend suggests ongoing dissolution of sodium-bearing minerals, specifically albite and smectite. The consistent increase in Na+ concentration by over 1500 ppm indicates that Na+ is released into the system faster than it is consumed by any secondary mineral formations, which aligns with the minimal precipitation observed in smectite compared to the more significant dissolution of albite.
Figure 19b displays a continuous decline in Ca2+ concentration, reflecting the precipitation of calcium-bearing minerals. This reduction in Ca2+ is primarily attributed to calcite precipitation, as shown in Figure 15.
Similar to Na+, the concentration of Mg2+, shown in Figure 19c, gradually increases over time, indicating the dissolution of Mg-bearing minerals such as illite and chlorite. The slower increase in Mg2+ concentration could be due to the lower solubility of these minerals compared to sodium-bearing minerals or a slower reaction rate with CO2.
The behavior of Cl, depicted in Figure 19d, shows an initial decrease followed by a steady increase after approximately 400 years. It is noteworthy that these changes are minimal, under five ppm. Since Cl is generally treated as a conservative ion in this study and does not participate in mineral reactions, these shifts are likely due to dilution effects or changes in the water mass of the system, as illustrated in Figure 20, rather than direct geochemical reactions.
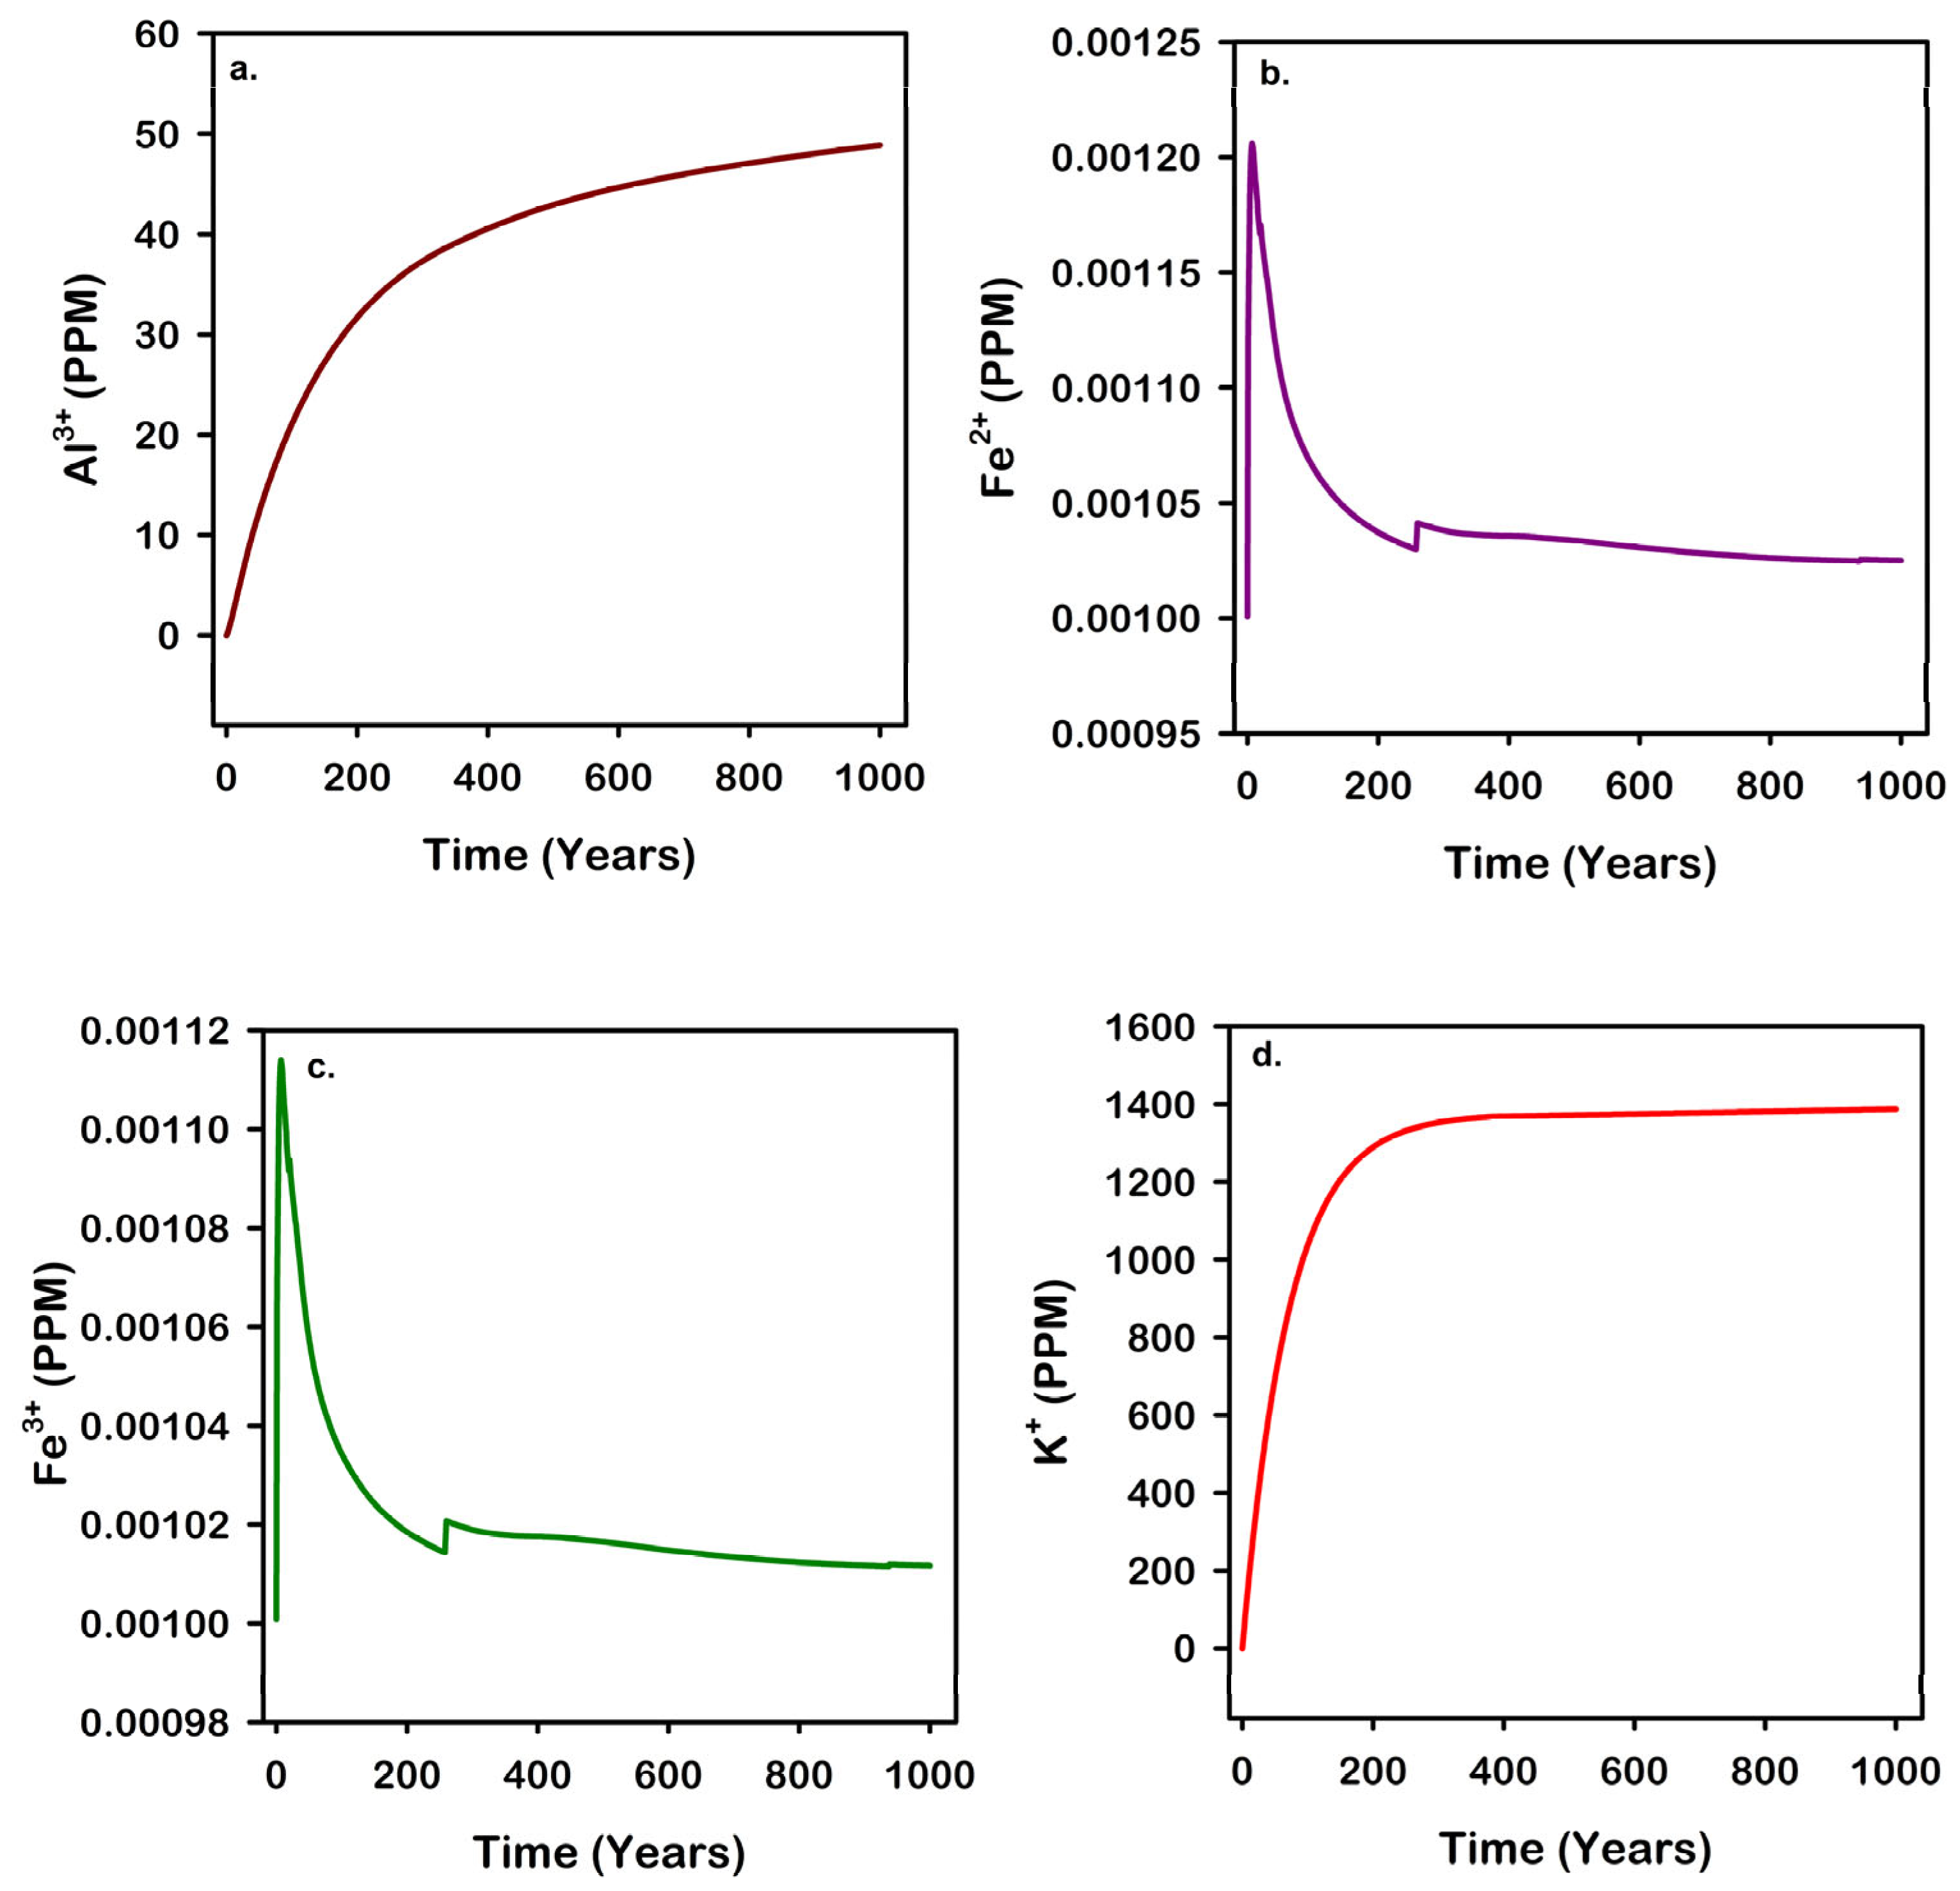
Just like the primary ions, the behavior of the secondary ions, minerals that were not present in the initial brine composition, also gets affected by the mineral dissolution and precipitation. Al2+ and K+ experience an increase in concentration, which is attributed to the dissolution of illite, chlorite, and orthoclase, while the behavior of Fe2+ and Fe3+ corresponds to the dissolution and precipitation behavior of smectite (Figure 21a–d).
These plots collectively demonstrate the intricate interactions between CO2 and the ions in a geochemical system. The dissolution of specific minerals releases ions into the solution, while the formation of secondary minerals can sequester them, thus modulating their concentrations over time.

4. Discussion

The results demonstrate a strong agreement between the simulated data and laboratory measurements, affirming the model’s effectiveness in replicating dynamic geochemical processes. While the experiments were conducted over short durations, the calibration enhances the model’s validity, supporting its application for predicting these processes over much longer timescales. The close matching of ion concentrations in most cases underscores the capability of our numerical model to accurately perform reactive transport simulations.
However, certain deviations were noted in the concentrations of specific ions, notably Ca2+ as seen in Figure 7e. These discrepancies could potentially be attributed to various factors beyond the scope of the initial model settings. For instance, the mineral composition of the rock used in laboratory experiments, which can significantly influence ion interactions and behavior, may differ from the average values used in the simulation.
The field-scale simulation results provide a detailed view of CO2 plume containment during and after the injection phase. Initially, the CO2 forms an ascending plume that rapidly reaches the boundary between the reservoir and the cap rock. With CO2 saturation exceeding 40% near the wellbore, the plume subsequently spreads laterally, forming a characteristic mushroom shape as seen in Figure 9a,b. The confinement of CO2 within the aquifer, without fluid movement into the cap rock, underscores the reservoir’s effectiveness in secure CO2 storage. The decrease in CO2 saturation from 20% to 15% in the lower part of the plume is primarily due to the buoyant nature of the gas, allowing it to rise upward. Near the wellbore, a minor reduction in CO2 saturation from 43% to 41% suggests relative stability and limited lateral spread beneath the cap rock.
Changes in pH levels due to CO2 injection are key indicators of the geochemical interactions taking place within the aquifer. The initial sharp decline in pH from 8.37 to around 5 near the wellbore is a direct consequence of CO2 dissolution, which leads to the formation of carbonic acid in the water. This acidification not only lowers the pH but also promotes a number of reactions with minerals in the surrounding rock. These reactions involve the dissolution of feldspars (albite, plagioclase, and orthoclase), phyllosilicates (chlorite and smectite), and mica-type clay (illite), releasing species like sodium ions, potassium ions, magnesium ions, orthosilicic acid, and aluminum ions into the brine, and the precipitation of tectosilicates (quartz) and carbonates (calcite), which consumes calcium and carbonate ions. Figure 16a–d show the trend of these minerals, while Figure 19a–d and Figure 21a–d show the trend of the ions. As the acidified fluid moves further from the wellbore, buffering effects mitigate this acidification, stabilizing pH levels. Spatial variability in pH, with higher levels at greater distances from the wellbore, indicates dispersal and dilution effects of the CO2 plume. The pronounced pH reduction in the uppermost layers, due to buoyant segregation of CO2, highlights the vertical migration and trapping behavior of CO2 within the aquifer.
Evaluating the temporal dynamics of CO2 trapping mechanisms over the 1000-year simulation period shows significant shifts in the dominant processes. Initially, dissolution trapping is predominant, but its role diminishes as structural trapping becomes more significant. The increase in residual trapping after CO2 injection ceases underscores the importance of long-term CO2 retention. The decline in mineral trapping, primarily due to continuous calcite dissolution, indicates complex interactions between geochemical reactions and CO2 trapping. The resurgence in dissolution trapping driven by Rayleigh–Taylor instabilities highlights ongoing dynamic processes influencing CO2 sequestration over extended periods.
The comparison between the core-scale simulation and the field-scale model shows consistent trends, with quartz and calcite precipitating while other minerals dissolved. The key difference lies in the magnitude of changes, as the core-scale’s smaller size and limited CO2 injection led to much smaller reactions. Despite this, the model accurately captured these trends at both scales, demonstrating its reliability in forecasting geochemical behavior.
Mineralization processes, although representing a smaller fraction of CO2 trapping, play a significant role in altering the reservoir’s flow properties. The consistent precipitation of quartz and calcite, along with the dissolution of other minerals in the reservoir, impacts reservoir porosity (Figure 17). Although there is a reduction in porosity due to the dominance of precipitating minerals, these changes are less than 1%, rendering their effect on flow properties and permeability largely negligible. This minimal alteration in porosity means that, while precipitation and dissolution processes are occurring, they are unlikely to significantly impact fluid movement, CO2 injection efficiency, or long-term storage capacity within the reservoir.
The behavior of primary ions such as Na+, Ca2+, Mg2+, and Cl provides insights into the geochemical system’s response to CO2 injection. The steady increase in Na+ and Mg2+ concentrations indicates ongoing dissolution of sodium- and magnesium-bearing minerals. The initial spike and subsequent stabilization of Ca2+ concentration reflect dynamic dissolution and precipitation processes involving calcium-bearing minerals. The complex pattern observed for Cl, with initial fluctuations followed by stabilization, likely indicates dilution effects and interactions with other ions rather than direct geochemical reactions. These trends highlight the intricate interactions between CO2, mineral dissolution, and ion concentrations, emphasizing the importance of considering geochemical reactions in assessing the long-term impacts of CO2 sequestration.

5. Conclusions

This study presents a comprehensive assessment of CO2 sequestration within a deep saline aquifer, incorporating both laboratory coreflood validation and long-term field-scale simulation. The numerical model demonstrated strong consistency with laboratory data, particularly in replicating ion transport and geochemical interactions, thereby supporting its application for long-term reactive transport prediction.
Over the 1000-year simulation period, the model showed effective confinement of CO2 within the reservoir, supported by lateral plume expansion and vertical restriction beneath the caprock. Although no CO2 or brine flux into the caprock was observed in the simulation, this result reinforces the structural sealing capability of the formation.
A major focus was the evolution of pH, which showed a sharp drop near the injection zone—from 8.37 to around 5—due to carbonic acid formation. This acidification initiated extensive mineral dissolution, particularly of feldspars (e.g., albite), phyllosilicates (e.g., smectite, chlorite), and mica-type clays, while promoting precipitation of quartz and calcite. These reactions had a measurable but modest effect on porosity (less than 1%), indicating limited impact on injectivity and flow over the modeled period.
In terms of mineral trapping, calcite dynamics were particularly important. Although the amount of trapped CO2 via mineralization was small compared to residual and solubility trapping, its role in buffering pH and participating in long-term geochemical cycles is critical. Notably, no evidence of extreme mineral buildup leading to pore-blocking was observed in our results, contradicting generalized concerns about injectivity loss. However, the temporal analysis did reveal that trapping mechanisms evolve: solubility trapping dominated early stages, while residual and structural trapping gained importance over time.
Our findings also reveal mineral-specific behaviors that influence ion concentrations. For example, Na+ and Mg2+ increased due to feldspar and chlorite dissolution, respectively, while Ca2+ showed non-monotonic trends reflecting the complex interplay of dissolution and precipitation. These trends emphasize the importance of accounting for mineral heterogeneity and kinetic rates in long-term forecasts.
Ultimately, this study advances our understanding of the geochemical and physical transformations induced by CO2 storage. Future work should explore broader mineral suites, variable salinity regimes, and coupled mechanical effects to improve the robustness of storage predictions under diverse reservoir conditions.

Author Contributions

P.K.N.B.—Writing—Review and Editing, Writing—Original Draft, Visualization, Software, Methodology, Investigation, Formal Analysis; W.A.: Writing—Review and Editing, Writing—Original Draft, Validation, Supervision, Software, Resources, Project Administration, Investigation, Funding Acquisition, Formal Analysis; J.D.S.: Writing—Review and Editing, Validation, Visualization; D.B.: Writing—Review and Editing, Writing—Original Draft, Validation, Software, Methodology; N.S.: Writing—Review and Editing, Writing—Original Draft, Validation, Software, Methodology; A.A.: Writing—Review and Editing, Writing—Original Draft, Validation, Software; K.O.D.—Review and Editing, Writing—Original Draft. All authors have read and agreed to the published version of the manuscript.

Funding

This research was funded by the U.S. Department of Energy’s (DOE) National Energy Technology Laboratory (NETL), grant number DE-FE0032064, and additional support from the San Juan Basin CarbonSAFE project (DE-FE0031890) also funded by the DOE.

Data Availability Statement

The original contributions presented in this study are included in the article. Further inquiries can be directed to the corresponding author.

Conflicts of Interest

The authors declare no conflicts of interest.

Abbreviations

The following abbreviations are used in this manuscript:
SJBSan Juan Basin
CO2Carbon dioxide
GCSGeological Carbon Storage

Appendix A

Appendix A.1. Multiphase Multicomponent Transport in Porous Media

The fundamental equations governing multiphase, multicomponent transport in porous media incorporate mass conservation, Darcy’s law, and thermodynamic equilibrium [55,56]. Mass conservation for any component j in phase β is expressed in Equation (A1) as
M j , β t + F j , β = Q ^ j , β  
where M j , β is the mass accumulation, F j , β the mass flux (via advection and diffusion), and Q ^ j , β accounts for sources and sinks.
The mass accumulation term is (Equation (A2)):
M j , β = ϕ β S β ρ β m j , β
where ϕ is porosity, S β is saturation, ρ β refers to the mass density, and m j , β represents the mass. The total flux includes advective and diffusive terms and is given by (Equation (A3)):
F j , β = β v β ρ β m j , β + J j , β
J j , β is the diffusive flux (Equation (A4)) [57]:
J j , β = c β D β x j , β
c β is the concentration of the species, D β is the diffusion coefficient, and x β represents the gradient of the mole fraction
Also, the v β mentioned in the total flux equation (Equation (A5)) is the Darcy velocity, given by
v β = k k r β   μ β p β ρ β g  
where k r β   is the relative permeability, k is the absolute permeability of the porous medium, μ β is the viscosity, p β is the pressure,   ρ β is the density, and g is the gravitational acceleration. The source or sink term Q ^ j , β is represented as (Equation (A6)):
Q ^ j , β = r j , β + ψ j , β
where r j , β is the rate of production or consumption of component j due to chemical reactions and ψ j , β denotes external sources or sinks.
Substituting these expressions back into the mass conservation equation, we get
β t ϕ S β ρ β m j , β = β · S β ρ β m j , β + J j , β + r j , β + ψ j , β

Appendix A.2. Stoichiometry of Geochemical Reactions and Chemical Equilibrium

Chemical interactions may transpire among components within the aqueous phase or between minerals and aqueous phase components. Where R a q (Equation (A8)) is the number of reactions involving only aqueous species, and R n m (Equation (A9)) is the number of reactions that occur between minerals and components of the aqueous phase. The components in the aqueous phase consist of n c components, which are gaseous elements that are water-soluble, as well as n a components, which exclusively exist in the aqueous phase. The number of mineral species is represented by n m , the total count of aqueous species by n a q (where n a q = n c + n a ), and the comprehensive total of all species across gaseous, aqueous, and mineral phases is represented by n c t (where n c t = n c + n a + n m ) [46].
The stoichiometry for reactions among aqueous species is given by (Equation (A8)).
i = 1 n a q ν i j A i = 0 ,         j = 1 , , R a q
where A i represents the chemical symbol for the i-th species in the aqueous phase.
The stoichiometry for the chemical reaction involving the dissolution or precipitation of a mineral (Equation (A9)) is outlined as follows:
i = 1 n c t ν i j A i = 0 ,         j = 1 , , R n m
Aqueous-phase reactions are rapid and modeled as equilibrium processes, while mineral-related reactions depend on reaction rates.
The chemical equilibrium reactions, as described in Equation (A9), are characterized using chemical equilibrium constants [58]. The governing equations for these chemical equilibrium reactions (Equation (A10)) are
Q k a q K e q , k a q = 0 ,         k a q = 1 ,   ,   n a q  
With
Q k a q = i = 1 n a q a j v j k a q    
In this model, K e q , k a q represents the chemical equilibrium constant for aqueous reaction k a q , a j is the activity of component j ,   v j k a q are the stoichiometric coefficients, and Q k a q is the activity product. Comprehensive tables of K e q , k a q values, which vary with temperature for numerous aqueous reactions, are provided in the literature [47,59].
a j = γ j m j ,         j = 1 ,   ,   n a q ,  
where γ j is the activity coefficient. In an ideal solution, γ j equals 1, making the activity directly proportional to the molality. In this paper, the B-dot model approach is used for modeling the ionic activity coefficients [58].

Appendix A.3. Kinetics of Mineral Dissolution and Precipitation

The rate law governing the mineral dissolution and precipitation reactions (Equation (A13)) is as follows [58]:
r b = A b ^ k b 1 Q b K e q , b ,         b = 1 , ,   R m n
where r b represents the rate of mineral reaction, A b ^ denotes the reactive surface area of mineral reaction b , k b is the rate constant for the reaction involving the mineral, K e q , b is the chemical equilibrium constant specific to mineral reaction b , and Q b is the activity product associated with mineral reaction b . The activity product Q b corresponds similarly to the activity product defined for aqueous chemical equilibrium reactions (Equation (A11)) [60].
The term Q b K e q , b is referred to as the saturation index of the reaction. When Q b K e q , b is greater than 1, mineral precipitation takes place; conversely, if Q b K e q , b is less than 1, mineral dissolution occurs, following the convention where the rate r b is negative for dissolution and positive for precipitation. The rate equals zero when Q b K e q , b equals 1.
The rate of dissolution/precipitation in Equation (A13) applies to the minerals. To determine the rate of formation/consumption of the different aqueous species, multiply r b by the respective stoichiometry coefficient:
r i b = v i b × r b  
The reaction rate constants, k b (Equation (A13)), are typically provided in the literature for a reference temperature T 0 (commonly 25 °C). To calculate the rate constant at a different temperature T , Equation (A15) is used:
k b = k 0 b e x p E a b R 1 T 1 T 0  
The activation energy for reaction b is denoted by E a b [J/mol], and k 0 b [mol/(m2·s)] represents the reaction rate constant for reaction b at the reference temperature T 0 .
The reactive surface area, which is a critical parameter in calculating the rate, is determined by Equation (A16), which accounts for changes in the moles of minerals through dissolution or precipitation:
A b ^ = A b 0 ^ × N b N b 0  
where A b 0 ^ is the reactive surface area at time zero, N b represents the current mole number of mineral b per unit grid block volume, and N b 0 is the mole number of mineral b per unit grid block bulk volume at time zero.

Appendix A.4. Changes in Porosity–Permeability Due to Reactions

Changes in mineral dissolution and precipitation affect the void volume within the porous medium. The porosity is calculated using the following equation:
ϕ * ^ = ϕ * b = 1 n m N b ρ b N b 0 ρ b
ϕ = ϕ * ^ 1 + c ϕ p p *  
where ϕ is the porosity, ϕ * is the reference porosity unaffected by mineral changes, and ϕ * ^ is the reference porosity that includes the effects of mineral precipitation and dissolution. N b represents the total moles of mineral b per bulk volume at the current time, while N b 0 is the total moles of mineral b per bulk volume at time zero. ρ b is the molar density of the mineral, and c ϕ is the rock compressibility, with p * being the reference pressure.
As mineral dissolution and precipitation occur, the absolute permeability of the medium also changes. This change is quantified using the Kozeny–Carman equation [61]:
k k 0 = ϕ ϕ 0 3   × 1 ϕ 0 1 ϕ 2  
where k 0 represents the initial permeability, ϕ 0 denotes the initial porosity, and k and ϕ represent the end permeability and porosity, respectively.

References

  1. IEA. CO2 Emissions in 2023; IEA: Paris, France, 2024; Available online: https://www.iea.org/reports/co2-emissions-in-2023 (accessed on 14 May 2024).
  2. NASA’s Scientific Visualization Studio. Available online: https://svs.gsfc.nasa.gov/5207/#section_credits (accessed on 14 May 2024).
  3. Bachu, S. CO2 Storage in Geological Media: Role, Means, Status and Barriers to Deployment. Prog. Energy Combust. Sci. 2008, 34, 254–273. [Google Scholar] [CrossRef]
  4. Jiang, X. A Review of Physical Modelling and Numerical Simulation of Long-Term Geological Storage of CO2. Appl. Energy 2011, 88, 3557–3566. [Google Scholar] [CrossRef]
  5. Al Hameli, F.; Belhaj, H.; Al Dhuhoori, M. CO2 Sequestration Overview in Geological Formations: Trapping Mechanisms Matrix Assessment. Energies 2022, 15, 7805. [Google Scholar] [CrossRef]
  6. Nath, F.; Mahmood, M.N.; Ofosu, E.; Khanal, A. Enhanced Geothermal Systems: A Critical Review of Recent Advancements and Future Potential for Clean Energy Production. Geoenergy Sci. Eng. 2024, 243, 213370. [Google Scholar] [CrossRef]
  7. Gyimah, E.; Tomomewo, O.; Nkok, L.Y.; Bade, S.O.; Ofosu, E.A.; Bawuah, M.C. A Probabilistic Study of CO2 Plume Geothermal and Hydrothermal Systems: A Sensitivity Study of Different Reservoir Conditions in Williston Basin, North Dakota. Eng 2024, 5, 1407–1421. [Google Scholar] [CrossRef]
  8. Ike, I.A.; Adjimah, M.; Ike, G.U.; Ezugwu, C. Activated Carbon, a Possible Carbon Solution in Nigeria. In Proceedings of the SPE Nigeria Annual International Conference and Exhibition, Lagos, Nigeria, 5–7 August 2013; SPE: Singapore, 2013. [Google Scholar]
  9. Ajayi, T.; Gomes, J.S.; Bera, A. A Review of CO2 Storage in Geological Formations Emphasizing Modeling, Monitoring and Capacity Estimation Approaches. Pet. Sci. 2019, 16, 1028–1063. [Google Scholar] [CrossRef]
  10. Kumar, S.; Foroozesh, J.; Edlmann, K.; Rezk, M.G.; Lim, C.Y. A Comprehensive Review of Value-Added CO2 Sequestration in Subsurface Saline Aquifers. J. Nat. Gas Sci. Eng. 2020, 81, 103437. [Google Scholar] [CrossRef]
  11. Esposito, R.A.; Kuuskraa, V.A.; Rossman, C.G.; Corser, M.M. Reconsidering CCS in the US Fossil-Fuel Fired Electricity Industry under Section 45Q Tax Credits. Greenh. Gases Sci. Technol. 2019, 9, 1288–1301. [Google Scholar] [CrossRef]
  12. Adu-Gyamfi, B.; Ampomah, W.; Tu, J.; Sun, Q.; Erzuah, S.; Acheampong, S. Assessment of Chemo-Mechanical Impacts of CO2 Sequestration on the Caprock Formation in Farnsworth Oil Field, Texas. Sci. Rep. 2022, 12, 13023. [Google Scholar] [CrossRef]
  13. Ringrose, P.S.; Furre, A.-K.; Gilfillan, S.M.V.; Krevor, S.; Landrø, M.; Leslie, R.; Meckel, T.; Nazarian, B.; Zahid, A. Storage of Carbon Dioxide in Saline Aquifers: Physicochemical Processes, Key Constraints, and Scale-Up Potential. Annu. Rev. Chem. Biomol. Eng. 2021, 12, 471–494. [Google Scholar] [CrossRef]
  14. Dai, Z.; Xu, L.; Xiao, T.; McPherson, B.; Zhang, X.; Zheng, L.; Dong, S.; Yang, Z.; Soltanian, M.R.; Yang, C.; et al. Reactive Chemical Transport Simulations of Geologic Carbon Sequestration: Methods and Applications. Earth Sci. Rev. 2020, 208, 103265. [Google Scholar] [CrossRef]
  15. Ampomah, W.; Balch, R.; Cather, M.; Rose-Coss, D.; Dai, Z.; Heath, J.; Dewers, T.; Mozley, P. Evaluation of CO2 Storage Mechanisms in CO2 Enhanced Oil Recovery Sites: Application to Morrow Sandstone Reservoir. Energy Fuels 2016, 30, 8545–8555. [Google Scholar] [CrossRef]
  16. Adu-Gyamfi, B.; Ampomah, W.; Tu, J.; Sun, Q.; Erzuah, S.; Sarkodie-Kyeremeh, J. Simulation Study of Chemo-mechanical Impacts of CO2 Injection in Morrow b Sandstone Reservoir. Greenh. Gases Sci. Technol. 2022, 12, 764–783. [Google Scholar] [CrossRef]
  17. Pearce, J.; Raza, S.; Baublys, K.; Hayes, P.; Firouzi, M.; Rudolph, V. Unconventional CO2 Storage: CO2 Mineral Trapping Predicted in Characterized Shales, Sandstones, and Coal Seam Interburden. SPE J. 2022, 27, 3218–3239. [Google Scholar] [CrossRef]
  18. Kashim, M.Z.; Tsegab, H.; Rahmani, O.; Abu Bakar, Z.A.; Aminpour, S.M. Reaction Mechanism of Wollastonite In Situ Mineral Carbonation for CO2 Sequestration: Effects of Saline Conditions, Temperature, and Pressure. ACS Omega 2020, 5, 28942–28954. [Google Scholar] [CrossRef]
  19. Abousif, A.; Wronkiewicz, D.; Masoud, A. Geochemical Assessment of Mineral Sequestration of Carbon Dioxide in the Midcontinent Rift. Greenh. Gases Sci. Technol. 2024, 14, 295–318. [Google Scholar] [CrossRef]
  20. Raza, A.; Glatz, G.; Gholami, R.; Mahmoud, M.; Alafnan, S. Carbon Mineralization and Geological Storage of CO2 in Basalt: Mechanisms and Technical Challenges. Earth Sci. Rev. 2022, 229, 104036. [Google Scholar] [CrossRef]
  21. Fatah, A.; Ben Mahmud, H.; Bennour, Z.; Gholami, R.; Hossain, M. Geochemical Modelling of CO2 Interactions with Shale: Kinetics of Mineral Dissolution and Precipitation on Geological Time Scales. Chem. Geol. 2022, 592, 120742. [Google Scholar] [CrossRef]
  22. Chen, M.; Zhang, Y.; Liu, S.; Zhao, C.; Dong, S.; Song, Y. CO2 Transport and Carbonate Precipitation in the Coupled Diffusion-Reaction Process during CO2 Storage. Fuel 2023, 334, 126805. [Google Scholar] [CrossRef]
  23. Lin, J.-Y.; Garcia, E.A.; Ballesteros, F.C.; Garcia-Segura, S.; Lu, M.-C. A Review on Chemical Precipitation in Carbon Capture, Utilization and Storage. Sustain. Environ. Res. 2022, 32, 45. [Google Scholar] [CrossRef]
  24. Akono, A.-T.; Dávila, G.; Druhan, J.; Shi, Z.; Jessen, K.; Tsotsis, T. Influence of Geochemical Reactions on the Creep Behavior of Mt. Simon Sandstone. Int. J. Greenh. Gas Control 2020, 103, 103183. [Google Scholar] [CrossRef]
  25. Fuchs, S.J.; Espinoza, D.N.; Lopano, C.L.; Akono, A.-T.; Werth, C.J. Geochemical and Geomechanical Alteration of Siliciclastic Reservoir Rock by Supercritical CO2-Saturated Brine Formed during Geological Carbon Sequestration. Int. J. Greenh. Gas Control 2019, 88, 251–260. [Google Scholar] [CrossRef]
  26. Shi, Z.; Sun, L.; Haljasmaa, I.; Harbert, W.; Sanguinito, S.; Tkach, M.; Goodman, A.; Tsotsis, T.T.; Jessen, K. Impact of Brine/CO2 Exposure on the Transport and Mechanical Properties of the Mt Simon Sandstone. J. Pet. Sci. Eng. 2019, 177, 295–305. [Google Scholar] [CrossRef]
  27. Li, S.; Zhang, S.; Zou, Y.; Ma, X.; Ding, Y.; Li, N.; Zhang, X.; Kasperczyk, D. Pore Structure Alteration Induced by CO2–Brine–Rock Interaction during CO2 Energetic Fracturing in Tight Oil Reservoirs. J. Pet. Sci. Eng. 2020, 191, 107147. [Google Scholar] [CrossRef]
  28. Harbert, W.; Goodman, A.; Spaulding, R.; Haljasmaa, I.; Crandall, D.; Sanguinito, S.; Kutchko, B.; Tkach, M.; Fuchs, S.; Werth, C.J.; et al. CO2 Induced Changes in Mount Simon Sandstone: Understanding Links to Post CO2 Injection Monitoring, Seismicity, and Reservoir Integrity. Int. J. Greenh. Gas Control 2020, 100, 103109. [Google Scholar] [CrossRef]
  29. Tarokh, A.; Makhnenko, R.Y.; Kim, K.; Zhu, X.; Popovics, J.S.; Segvic, B.; Sweet, D.E. Influence of CO2 Injection on the Poromechanical Response of Berea Sandstone. Int. J. Greenh. Gas Control 2020, 95, 102959. [Google Scholar] [CrossRef]
  30. Yu, Z.; Yang, S.; Liu, K.; Zhuo, Q.; Yang, L. An Experimental and Numerical Study of CO2–Brine-Synthetic Sandstone Interactions under High-Pressure (P)–Temperature (T) Reservoir Conditions. Appl. Sci. 2019, 9, 3354. [Google Scholar] [CrossRef]
  31. Kim, K.; Makhnenko, R.Y. Changes in Rock Matrix Compressibility during Deep CO2 Storage. Greenh. Gases Sci. Technol. 2021, 11, 954–973. [Google Scholar] [CrossRef]
  32. Foroutan, M.; Ghazanfari, E.; Amirlatifi, A. Variation of Failure Properties, Creep Response and Ultrasonic Velocities of Sandstone upon Injecting CO2-Enriched Brine. Geomech. Geophys. Geo-Energy Geo-Resour. 2021, 7, 27. [Google Scholar] [CrossRef]
  33. Koukouzas, N.; Kypritidou, Z.; Purser, G.; Rochelle, C.A.; Vasilatos, C.; Tsoukalas, N. Assessment of the Impact of CO2 Storage in Sandstone Formations by Experimental Studies and Geochemical Modeling: The Case of the Mesohellenic Trough, NW Greece. Int. J. Greenh. Gas Control 2018, 71, 116–132. [Google Scholar] [CrossRef]
  34. Zhang, T.; Li, Y.; Li, Y.; Sun, S.; Gao, X. A Self-Adaptive Deep Learning Algorithm for Accelerating Multi-Component Flash Calculation. Comput. Methods Appl. Mech. Eng. 2020, 369, 113207. [Google Scholar] [CrossRef]
  35. Zhang, T.; Li, Y.; Sun, S.; Bai, H. Accelerating Flash Calculations in Unconventional Reservoirs Considering Capillary Pressure Using an Optimized Deep Learning Algorithm. J. Pet. Sci. Eng. 2020, 195, 107886. [Google Scholar] [CrossRef]
  36. Xiao, T.; Xu, H.; Moodie, N.; Esser, R.; Jia, W.; Zheng, L.; Rutqvist, J.; McPherson, B. Chemical-Mechanical Impacts of CO2 Intrusion Into Heterogeneous Caprock. Water Resour. Res. 2020, 56, e2020WR027193. [Google Scholar] [CrossRef]
  37. Sun, E.W.-H.; Bourg, I.C. Molecular Dynamics Simulations of Mineral Surface Wettability by Water Versus CO2: Thin Films, Contact Angles, and Capillary Pressure in a Silica Nanopore. J. Phys. Chem. C 2020, 124, 25382–25395. [Google Scholar] [CrossRef]
  38. Elgendy, A.M.S.; Ricci, S.; Cojocariu, E.I.; Geloni, C.; Castellani, S.; Massara, E.P.; Ortenzi, A.; Consonni, A.; Casali, P.; Idiomi, M. Geochemical Modelling of CO2 Injection: Role of Capillary-Driven Transport of Dissolved Salt on CO2 Injectivity. In Proceedings of the SPE Annual Technical Conference and Exhibition, Houston, TX, USA, 3–5 October 2022. [Google Scholar]
  39. Ma, B.; Cao, Y.; Zhang, Y.; Eriksson, K.A. Role of CO2-Water-Rock Interactions and Implications for CO2 Sequestration in Eocene Deeply Buried Sandstones in the Bonan Sag, Eastern Bohai Bay Basin, China. Chem. Geol. 2020, 541, 119585. [Google Scholar] [CrossRef]
  40. Soltanian, M.R.; Hajirezaie, S.; Hosseini, S.A.; Dashtian, H.; Amooie, M.A.; Meyal, A.; Ershadnia, R.; Ampomah, W.; Islam, A.; Zhang, X. Multicomponent Reactive Transport of Carbon Dioxide in Fluvial Heterogeneous Aquifers. J. Nat. Gas Sci. Eng. 2019, 65, 212–223. [Google Scholar] [CrossRef]
  41. Akai, T.; Kuriyama, T.; Kato, S.; Okabe, H. Numerical Modelling of Long-Term CO2 Storage Mechanisms in Saline Aquifers Using the Sleipner Benchmark Dataset. Int. J. Greenh. Gas Control 2021, 110, 103405. [Google Scholar] [CrossRef]
  42. Zhu, H.; Xu, T.; Tian, H.; Feng, G.; Yang, Z.; Zhou, B. Understanding of Long-Term CO2-Brine-Rock Geochemical Reactions Using Numerical Modeling and Natural Analogue Study. Geofluids 2019, 2019, 1426061. [Google Scholar] [CrossRef]
  43. Suchodolska, K.; Labus, K. Simplified Models for Reactive Transport and Chemical Reactions During CO2 Storage in Saline Aquifers. Energy Procedia 2016, 97, 509–514. [Google Scholar] [CrossRef]
  44. Boison, P.K.N.; Ampomah, W.; Simmons, J.; Bui, D. Integrated Geochemical Modeling for CO2 Sequestration in the San Juan Basin, New Mexico. In Proceedings of the SPE Eastern Regional Meeting, Wheeling, WV, USA, 8–10 October 2024. [Google Scholar]
  45. Boison, P.K.; Ampomah, W.; Sibaweihi, N. Impact of Vaporization on Mineral Changes and Salt Precipitation During CO2 Storage. In Proceedings of the SPE/AAPG/SEG Carbon, Capture, Utilization, and Storage Conference and Exhibition, Houston, TX, USA, 3–5 March 2025. [Google Scholar] [CrossRef]
  46. Computer Modelling Group Ltd. GEM User Guide; Computer Modelling Group Ltd.: Calgary, AB, Canada, 2021; Volume 2021, p. 10. [Google Scholar]
  47. Kharaka, Y.K.; Gunter, W.D.; Aggarwal, P.K.; Perkins, E.H.; Dedraal, J.D. SOLMINEQ. 88–A Computer Program for Geochemical Modeling of Water—Rock Interactions; U.S. Geological Survey: Menlo Park, CA, USA, 1988.
  48. Xu, P.; Zhang, Q.; Qian, H.; Yang, F.; Zheng, L. Investigating the Mechanism of PH Effect on Saturated Permeability of Remolded Loess. Eng. Geol. 2021, 284, 105978. [Google Scholar] [CrossRef]
  49. Soetaert, K.; Hofmann, A.F.; Middelburg, J.J.; Meysman, F.J.R.; Greenwood, J. The Effect of Biogeochemical Processes on PH. Mar. Chem. 2007, 105, 30–51. [Google Scholar] [CrossRef]
  50. Parkhurst, D.L. and A.C. and others Description of Input and Examples for PHREEQC Version 3—A Computer Program for Speciation, Batch-Reaction, One-Dimensional Transport, and Inverse Geochemical Calculations. US Geol. Surv. Tech. Methods 2013, 6, 497. [Google Scholar]
  51. Dullien, F.A. Porous Media: Fluid Transport and Pore Structure; Academic Press: Cambridge, MA, USA, 2012. [Google Scholar]
  52. Simmons, J.; Rinehart, A.; Luhmann, A.; Mozley, P.; Heath, J.; Majumdar, B. Using Petrographically Observable Microstructure to Predict Hydromechanical Changes in a Complex Siliciclastic Storage Site during CO2 Injection. Int. J. Greenh. Gas Control 2022, 119, 103724. [Google Scholar] [CrossRef]
  53. Simmons, J.D.; Wang, S.; Luhmann, A.J.; Rinehart, A.J.; Heath, J.E.; Majumdar, B.S. Paragenetic Controls on CO2-Fluid-Rock Interaction and Weakening in a Macroporous-Dominated Sandstone. Appl. Geochem. 2023, 156, 105744. [Google Scholar] [CrossRef]
  54. Khanal, A.; Irfan Khan, M.; Fahim Shahriar, M. Comprehensive Parametric Study of CO2 Sequestration in Deep Saline Aquifers. Chem. Eng. Sci. 2024, 287, 119734. [Google Scholar] [CrossRef]
  55. Hoteit, H.; Firoozabadi, A. Numerical Modeling of Diffusion in Fractured Media for Gas-Injection and -Recycling Schemes. SPE J. 2009, 14, 323–337. [Google Scholar] [CrossRef]
  56. Xu, T.; Sonnenthal, E.; Spycher, N.; Pruess, K.; Brimhall, G.; Apps, J. Modeling Multiphase Non-Isothermal Fluid Flow and Reactive Geochemical Transport in Variably Saturated Fractured Rocks: 2. Applications to Supergene Copper Enrichment and Hydrothermal Flows. Am. J. Sci. 2001, 301, 34–59. [Google Scholar] [CrossRef]
  57. Fick, A. Ueber Diffusion. Ann. Phys. 1855, 170, 59–86. [Google Scholar] [CrossRef]
  58. Bethke, C.M. Geochemical Reaction Modeling: Concepts and Applications; Oxford University Press: Oxford, UK, 1996; ISBN 0195094751. [Google Scholar]
  59. Delany, J.M.; Lundeen, S.R. The LLNL Thermochemical Data Base—Revised Data and File Format for the EQ3/6 Package (No. UCID-21658); Lawrence Livermore National Lab.(LLNL): Livermore, CA, USA, 1991.
  60. Nghiem, L.; Sammon, P.; Grabenstetter, J.; Ohkuma, H. Modeling CO2 Storage in Aquifers with a Fully-Coupled Geochemical EOS Compositional Simulator. In Proceedings of the SPE/DOE Symposium on Improved Oil Recovery, Society of Petroleum Engineers, Tulsa, OK, USA, 17–21 April 2004. [Google Scholar]
  61. Carman, P.C. Permeability of Saturated Sands, Soils and Clays. J. Agric. Sci. 1939, 29, 262–273. [Google Scholar] [CrossRef]
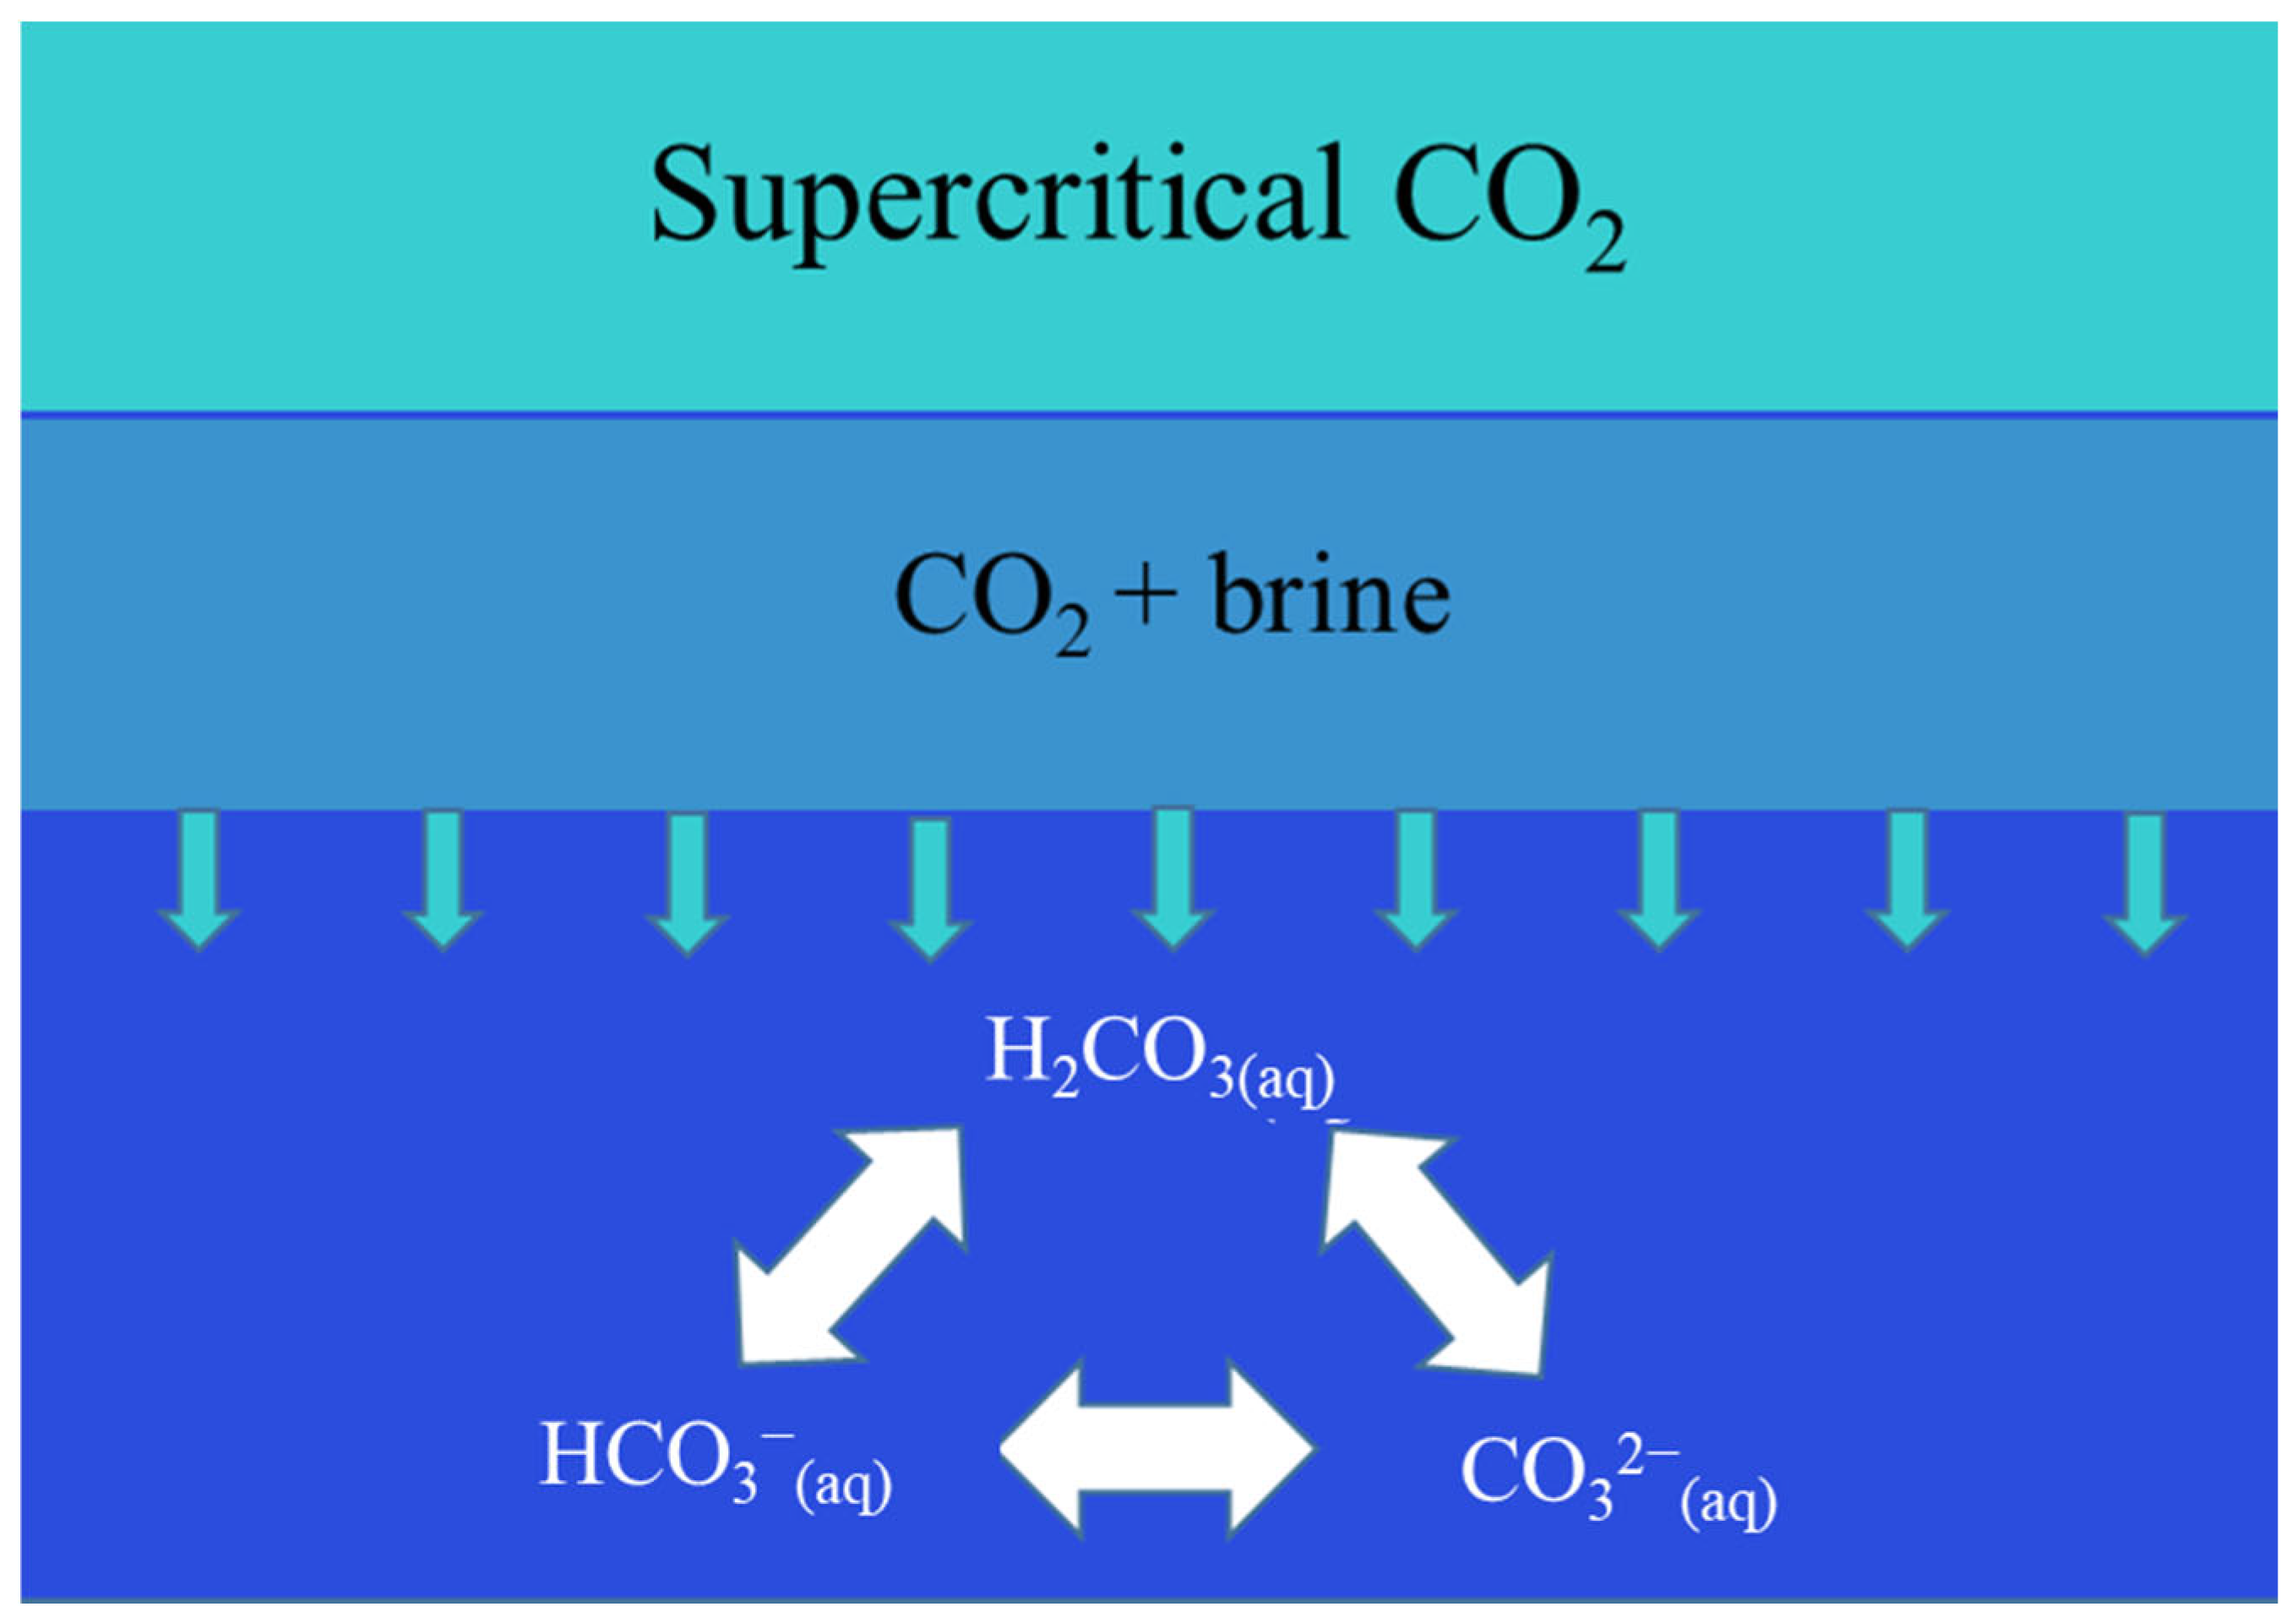
Figure 1. Dissolution and chemical transformation of supercritical CO2 in brine.
Energies 18 04089 g001
Figure 2. Workflow diagram for this study.
Energies 18 04089 g002
Figure 3. Water–gas relative permeability and scanning curves for drainage and imbibition.
Energies 18 04089 g003
Figure 4. (a) A 3D view of the simulation model showing the formation porosity; (b) a 3D view of the simulation model showing the formation permeability (mD).
Energies 18 04089 g004
Figure 5. History match results for Stanolind Gas Com SWD (water rate and well bottom-hole pressure).
Energies 18 04089 g005
Figure 6. History match results for Centerpoint SWD (water rate and well bottom-hole pressure).
Energies 18 04089 g006
Figure 7. Comparison of laboratory results with simulation.
Energies 18 04089 g007
Figure 8. One year forecast of core-scale simulation.
Energies 18 04089 g008
Figure 9. CO2 plume evolution in the reservoir: (a) cross-sectional view after injection; (b) cross-sectional view after 100 years; (c) aerial view after injection; (d) aerial view after 100 years.
Energies 18 04089 g009
Figure 10. Evolution of pH: (a) cross-sectional view after injection; (b) cross-sectional view after 100 years; (c) aerial view after injection; (d) aerial view after 100 years.
Energies 18 04089 g010
Figure 11. (a) Temporal evolution of pH at different lateral distances during and after CO2 injection; (b) temporal evolution of H+ molality at different lateral distances during and after CO2 injection.
Energies 18 04089 g011
Figure 12. Temporal evolution of pH at different depths around the wellbore during and after CO2 injection.
Energies 18 04089 g012
Figure 13. The four trapping mechanisms over the years.
Energies 18 04089 g013
Figure 14. Long−term changes in mineral moles in the Entrada Sandstone over 1000 years due to CO2 injection.
Energies 18 04089 g014
Figure 15. Changes in calcite moles over 1000 years due to CO2 injection.
Energies 18 04089 g015
Figure 16. (a) Changes in quartz moles over 1000 years; (b) changes in albite, plagioclase, and orthoclase moles over 1000 years; (c) changes in chlorite and smectite moles over 1000 years; (d) changes in illite moles over 1000 years.
Energies 18 04089 g016
Figure 17. Changes in porosity due to mineral reactions: (a) at the end of injection; (b) 100 years after injection; (c) after 500 years; (d) after 1000 years.
Energies 18 04089 g017
Figure 18. Long-term trends in porosity changes across multiple grids.
Energies 18 04089 g018
Figure 19. (a) Changes in Na+ concentration over 1000 years; (b) Changes in Ca2+ concentration over 1000 years; (c) Changes in Mg2+ concentration over 1000 years; (d) Changes in Cl concentration over 1000 years.
Energies 18 04089 g019
Figure 20. Trends in chloride concentration and water mass in a geological reservoir over 1000 years.
Energies 18 04089 g020
Figure 21. (a) Changes in Al2+ concentration over 1000 years; (b) changes in Fe2+ concentration over 1000 years; (c) changes in Fe3+ concentration over 1000 years; (d) changes in K+ concentration over 1000 years.
Energies 18 04089 g021
Table 1. Mineral parameters and initial volume fractions [47].
MineralChemical FormulaInitial Volume Fraction
QuartzSiO20.734
IlliteK0.6Mg0.25Al2.3Si3.5O10(OH)20.048
CalciteCaCO30.043
AlbiteNa(AlSi3O6)0.037
PlagioclaseCaAl2Si2O80.018
OrthoclaseK(AlSi3O6)0.014
Chlorite(14A)(Mg5Al2Si3O10(OH)80.013
Smectite(Na,Ca)0.33(Al,Mg)2Si4O10(OH)2·(H2O)n0.0001
Table 2. Ion composition of formation water.
IonsConcentration (ppm)
Na+5245
Ca2+24
Mg2+13
Cl7633
HCO3336
CO32−450
SO42−1900
Table 3. Aqueous reactions employed in modeling [50].
Intra-Aqueous Chemical Equilibrium ReactionsEquilibrium Constant (log K at 25 °C)
CO2 (aq.) + H2O = (CO32−) + 2 (H+)−16.88
(CO32−) + (H+) = (HCO3)10.33
H2O = (OH) + (H+)−14.00
Table 4. Kinetic parameters for mineral dissolution/precipitation reactions employed in modeling.
Mineral Dissolution/Precipitation ReactionsActivation Energy
J/mol
Reactive Surface Area
(m2/m3)
Log 10 of Reaction Rate at 25 °C
(1/s)
Quartz + 2 H2O = H4SiO490,9002650.00−13.4
Illite + 11.2 H2O = (K+) + (Mg2+) + (Al(OH)4−) + H4SiO4 + (H+)23,6002763.07−10.98
Calcite = (CO3) + (Ca2+)14,4002709.95−0.3
Albite + 8 H2O = (Na+) + (Al(OH)4−) + H4SiO469,8002620.00−12.04
Plagioclase + 8 H2O = (Ca2+) + (Al(OH)4−) + H4SiO416,6002760.29−3.50
Orthoclase + 8 H2O = (K+) + (Al(OH)4−) + H4SiO451,7002560.00−10.06
Chlorite + 16 (H+) = (Mg2+) + (Al3+) + H4SiO4+ H2O88,0002600.00−11.11
Smectite + 7 (H+) = (Al3+) + (Ca2+) + (Fe2+) + (Fe3+) + H2O + (K+) + (Mg2+) + (Na+) + SiO235,0002350.00−12.78
Table 5. Core characteristics and experimental conditions.
ParameterValue
Core diameter0.0248 m
Core length0.0513 m
Flow rate1.44 × 10−4 m3/day
Injection duration23 days
Initial porosity10.29
Initial permeability10.34 mD
Table 6. Initial reservoir properties for base case.
ParameterValue
Grid dimension164 × 116 × 25
Total number of grid blocks475,600
Initial water saturation100%
Initial reservoir pressure gradient0.42 psi/ft (9.5 kpa/m)
Reference depth for initial pressure8300 ft (2529.84 m)
Injection rate20 MMscf/day (566,336.94 m3/day)
Fracture pressure gradient0.62 psi/ft (14 kpa/m)
Porosity rangeUp to 25%
Permeability rangeUp to 220 mD
Disclaimer/Publisher’s Note: The statements, opinions and data contained in all publications are solely those of the individual author(s) and contributor(s) and not of MDPI and/or the editor(s). MDPI and/or the editor(s) disclaim responsibility for any injury to people or property resulting from any ideas, methods, instructions or products referred to in the content.