Abstract
CO2 sequestration is considered one of the main pillars in achieving the ongoing decarbonization efforts. A myriad of CO2 sequestration projects targeted sandstone reservoirs since carbonate reservoirs appeared to be unpropitious due to their geological complexity and unfavorable mineralogy and properties. This study investigates CO2 sequestration potential in a carbonate saline aquifer while considering various geological complexities by capitalizing on numerical simulation. A synthetic anticline reservoir model examined the optimum well location and landing zone for CO2 sequestration. Additionally, the model evaluated the role of natural fractures in the migration path of CO2 plume and geochemical reactions throughout the storage process. The study demonstrates that placing the injection well away from the top of the structure in a low-dip region while injecting in the bottom interval would yield the optimum design. After applying a plethora of analyses, geological complexity could impede the migration path of CO2 but eventually produce a similar path when injected in a similar region. The geochemical interactions between the injected CO2 and reservoir fluids and minerals reduce the free and trapped CO2 quantities by dissolving calcite and precipitating dolomite. Furthermore, natural fractures impact the CO2 quantities during early times only when the fractures cross the top layers. Similarly, the CO2 migration differs due to the higher permeability within the fractures, resulting in slightly different CO2 plumes. Consequently, the role of natural fractures should be limited in carbon storage projects, specifically if they do not cross the top of the reservoir. This study reflects a unique perspective on sequestering CO2 while capturing the roles of natural fractures and well placement in depicting the migration path of the CO2 plume. A similar systematic workflow and holistic approach can be utilized to optimize the subsurface storage process for potential formations.
1. Introduction
Greenhouse gas (GHG) emissions have been increasing significantly in the past 30 years, with carbon dioxide (CO2) representing the majority of these emissions [1,2]. Even though CO2 is considered one of the least abundant gases in the atmosphere, excess CO2 concentrations could lead to some adverse effects on the Earth’s ecosystem. Therefore, policymakers have recommended a myriad of decarbonization strategies worldwide [3]. The net-zero strategy, where any emitted GHG should be either naturally absorbed or sequestered, reflects one of the strategies for controlling the CO2 concentrations in the atmosphere. The recommended strategies have the potential to ultimately control the GHG levels, particularly the CO2, in the atmosphere [4,5].
CO2 sequestration should partially help to reduce the CO2 level in the atmosphere to reach the desired decarbonization goals [6]. The sequestration process refers to capturing the excess CO2 from the atmosphere and injecting it into suitable storage in the subsurface. Afterward, the injected CO2 can be stored permanently in the formation while maintaining healthy storage conditions [7]. The Sleipner carbon capture and storage project exemplifies a great CO2 storage example, which captured and stored more than 16 metric megatons of CO2 from 1996 to 2016 [8]. Storing CO2 into the subsurface has been showing presumably effective results in controlling the CO2 levels in the atmosphere. Consequently, decarbonization strategies capitalize on CO2 sequestration as one of the potentially feasible techniques for reaching net zero [4,5,6,9].
Generally, the injected CO2 interacts with the formation fluids and minerals in the storage process; these interactions play a major role in trapping the CO2 in the formation. The CO2 trapping materializes via two mechanisms: physical trapping mechanisms and geochemical trapping mechanisms. Stratigraphy and structure trapping and hydrodynamics trapping represent the main physical trapping mechanisms. In the stratigraphic and structure mechanism, the injected CO2 becomes trapped by a physical seal such as a caprock or a fault. Hydrodynamics, on the other hand, refers to trapping the CO2 within the pores during its migration due to buoyancy. Furthermore, geochemical trapping has the potential to develop if chemical interactions between the injected CO2 and the formation’s rocks or fluids occur. CO2 mineralizes in the formation when the CO2 interacts with the rocks while it dissolves into the in situ brine [7,9,10,11]. Each trapping mechanism contributes differently to the overall CO2 subsurface storage across time. Typically, mineral trapping requires a significantly longer time to occur compared to the other trapping mechanisms, which have the potential to take place within the first year of injection [7]. Since each trapping mechanism has its unique features and timeframe, it will be crucial to understand the expected trapping mechanisms in the targeted formation to safely optimize the injected CO2 quantity.
Even though carbonate reservoirs are considered ubiquitous, sandstone reservoirs have been utilized for CO2 sequestration projects [10,11,12]. For instance, the Quest project, which has the potential to sequestrate up to 1.1 million metric tons of CO2 per annum, targeted a sandstone reservoir [13]. Mineralogical and physical differences between carbonate and sandstone reservoirs drove the selection process due to their storage capabilities. The higher porosity values that usually appear in a sandstone reservoir compared to a carbonate reservoir provide them with a better storage capacity potential for CO2 sequestration [10,11,13]. Moreover, sandstone reservoirs tend to hold a lower percentage of calcite than carbonate reservoirs. The presence of calcite enables mineral dissolution and dolomite precipitation when injecting CO2 [14,15]. Besides the parameters and properties differences between both reservoirs, natural fractures existing in carbonate reservoirs pose additional geological complexity which makes it more challenging to depict the CO2 plume in the subsurface [16,17]. Thus, previous CO2 sequestration projects preferred to develop sandstone reservoirs because of their subsurface environment.
To date, the vast majority of CO2 sequestration research highlights the potential of sandstone reservoirs to store CO2. If a study investigates a carbonate reservoir, it would be localized and focus on a unique signature in a carbonate reservoir [8,11,12,18]. For instance, Sohal et al. examined potential storage capacity changes and plume migration due to geological heterogeneities based on the Hontomin site [18]. Since carbonate reservoirs have promising potential to store CO2, holistic analysis that captures the subsurface geochemical reactions and trapping mechanisms should be thoroughly conducted to ensure optimum and safe CO2 sequestration.
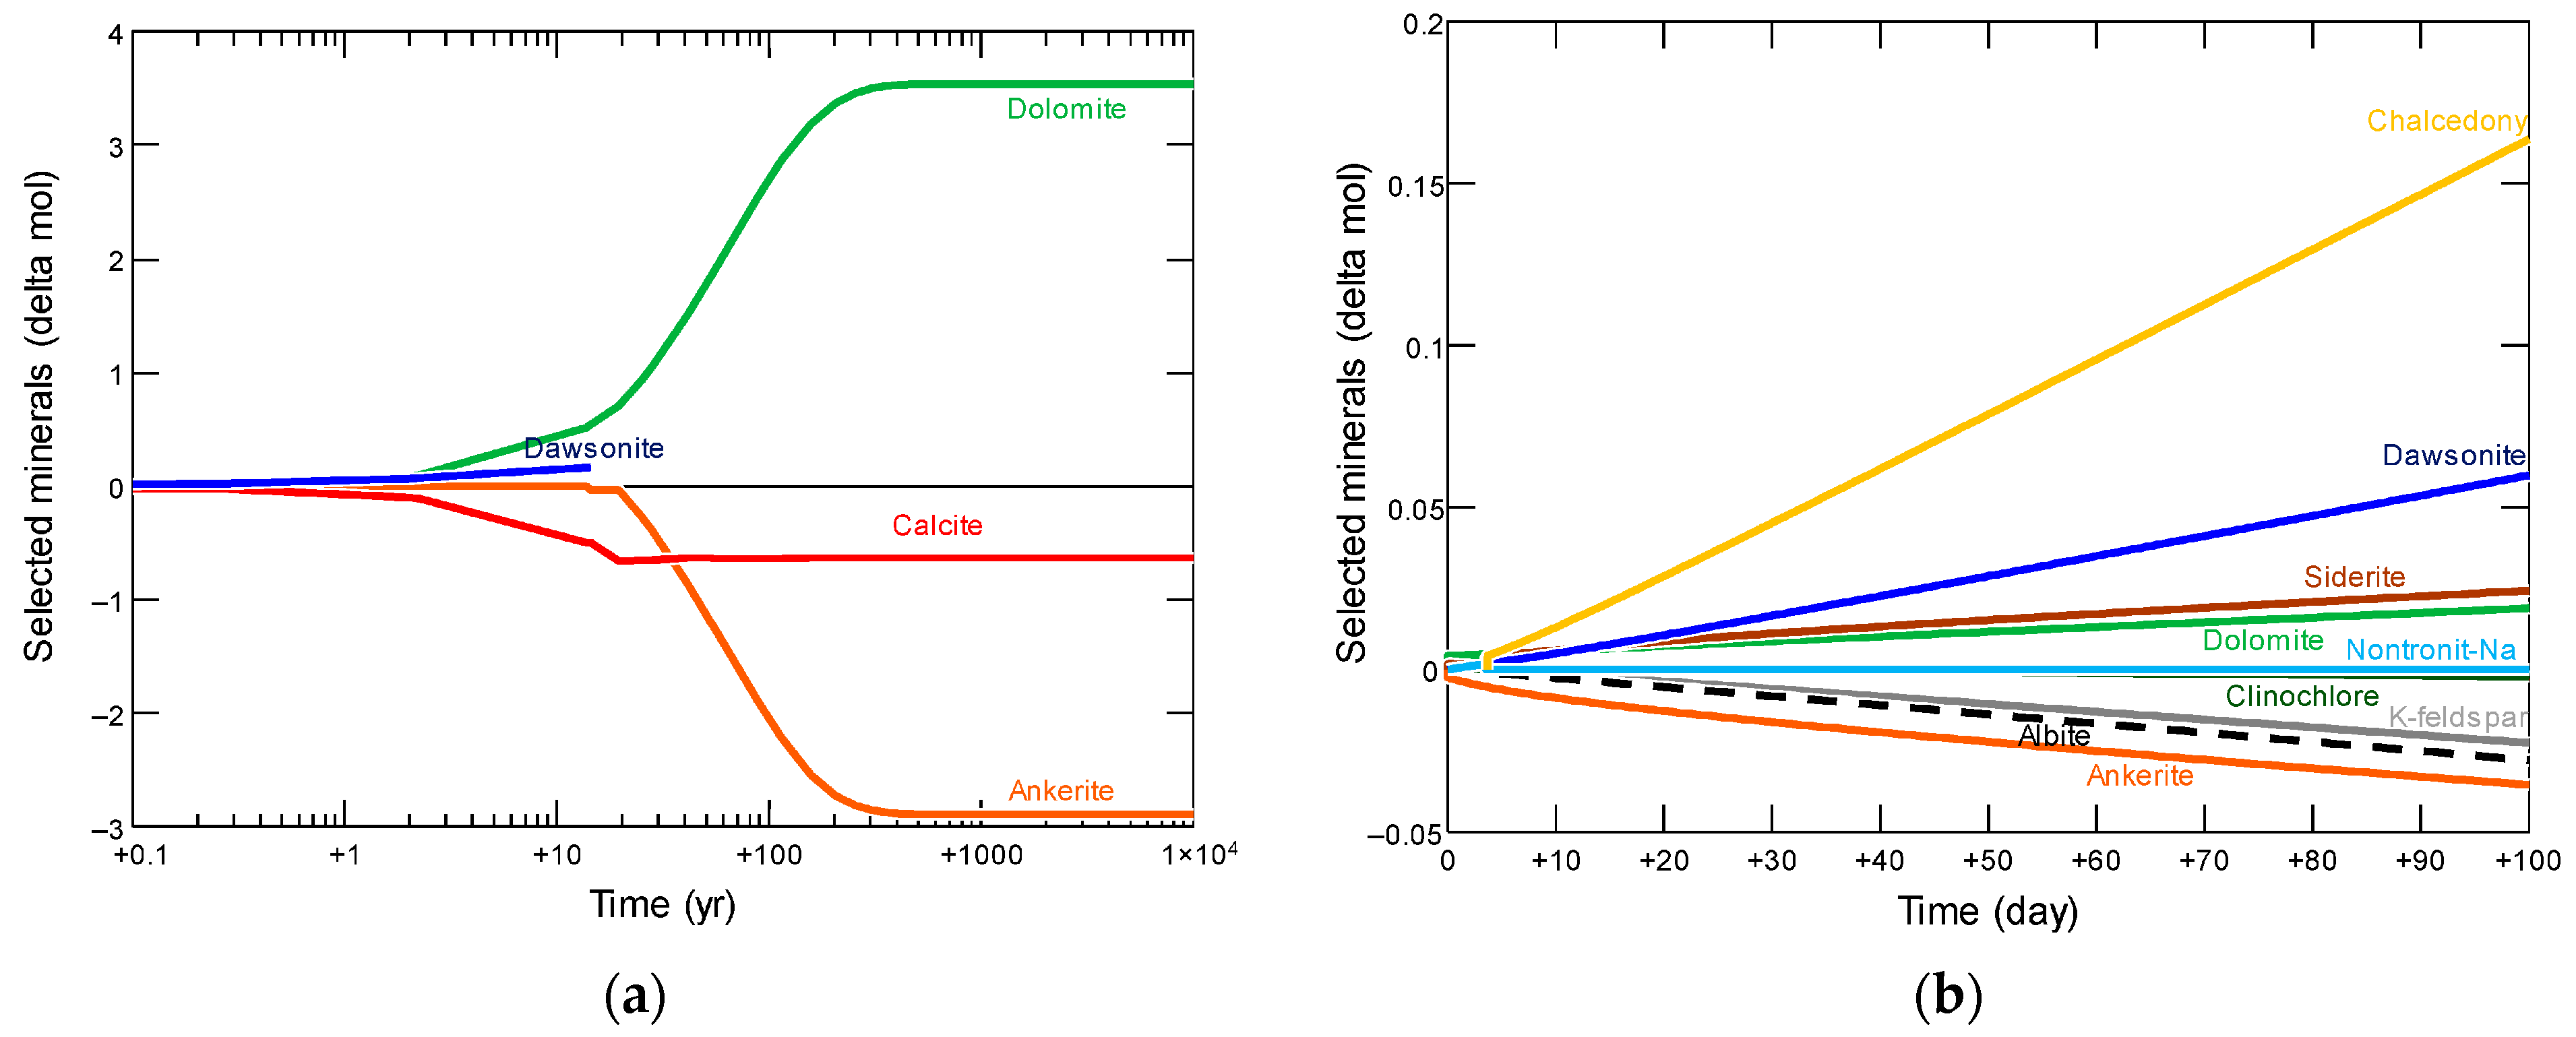
Reservoir simulators can model CO2 sequestration in saline aquifers. The simulation models capitalize on compositional models using an equation of state that can be calibrated to the aquifer’s subsurface conditions. Typically, geochemical reactions between the injected CO2 and formation rocks can be incorporated via geochemical packages like PHREEQC or TOUGHREACT [19,20,21]. Furthermore, phase equilibrium helps to compute the CO2 solubility in the aquifer [22,23]. Figure 1 illustrates how two rock samples can undergo different geochemical reactions during CO2 sequestration based on Licbinska et al.’s results [24]. Lyu and Voskov, Ranganathan et al., and Anchliya et al. simulated the performance of CO2 sequestration while demonstrating the expected CO2 distribution and plume within the aquifer (see Figure 2) [25,26,27]. Utilizing such simulation models enables accurate estimations of the subsurface geochemical interactions as well as the depiction of flow dynamics.

Figure 1.
Mineral relative changes during CO2 storage in two different rock samples. (a) Claystone sample; (b) Dolomite sample [24].
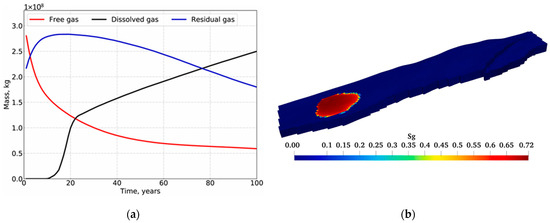
Figure 2.
Typical CO2 performance during subsurface storage process. (a) Mass distribution; (b) Gas saturation.
This study investigates CO2 sequestration in a carbonate saline aquifer using a systematic workflow that capitalizes on numerical simulation. The workflow incorporates the impacts of natural fractures on the CO2 plume migration path and resulting geochemical reactions, such as mineral precipitation and dissolution in the matrix and fractures, throughout the storage process. The study elucidates the role of each trapping mechanism in a carbonate saline aquifer, identifying the key characteristics that control the CO2 sequestration potential in a similar subsurface environment. Consequently, the CO2 sequestration project design can be optimized by locating the optimum surface and subsurface CO2 injection interval.
2. Methodology
2.1. Model Development
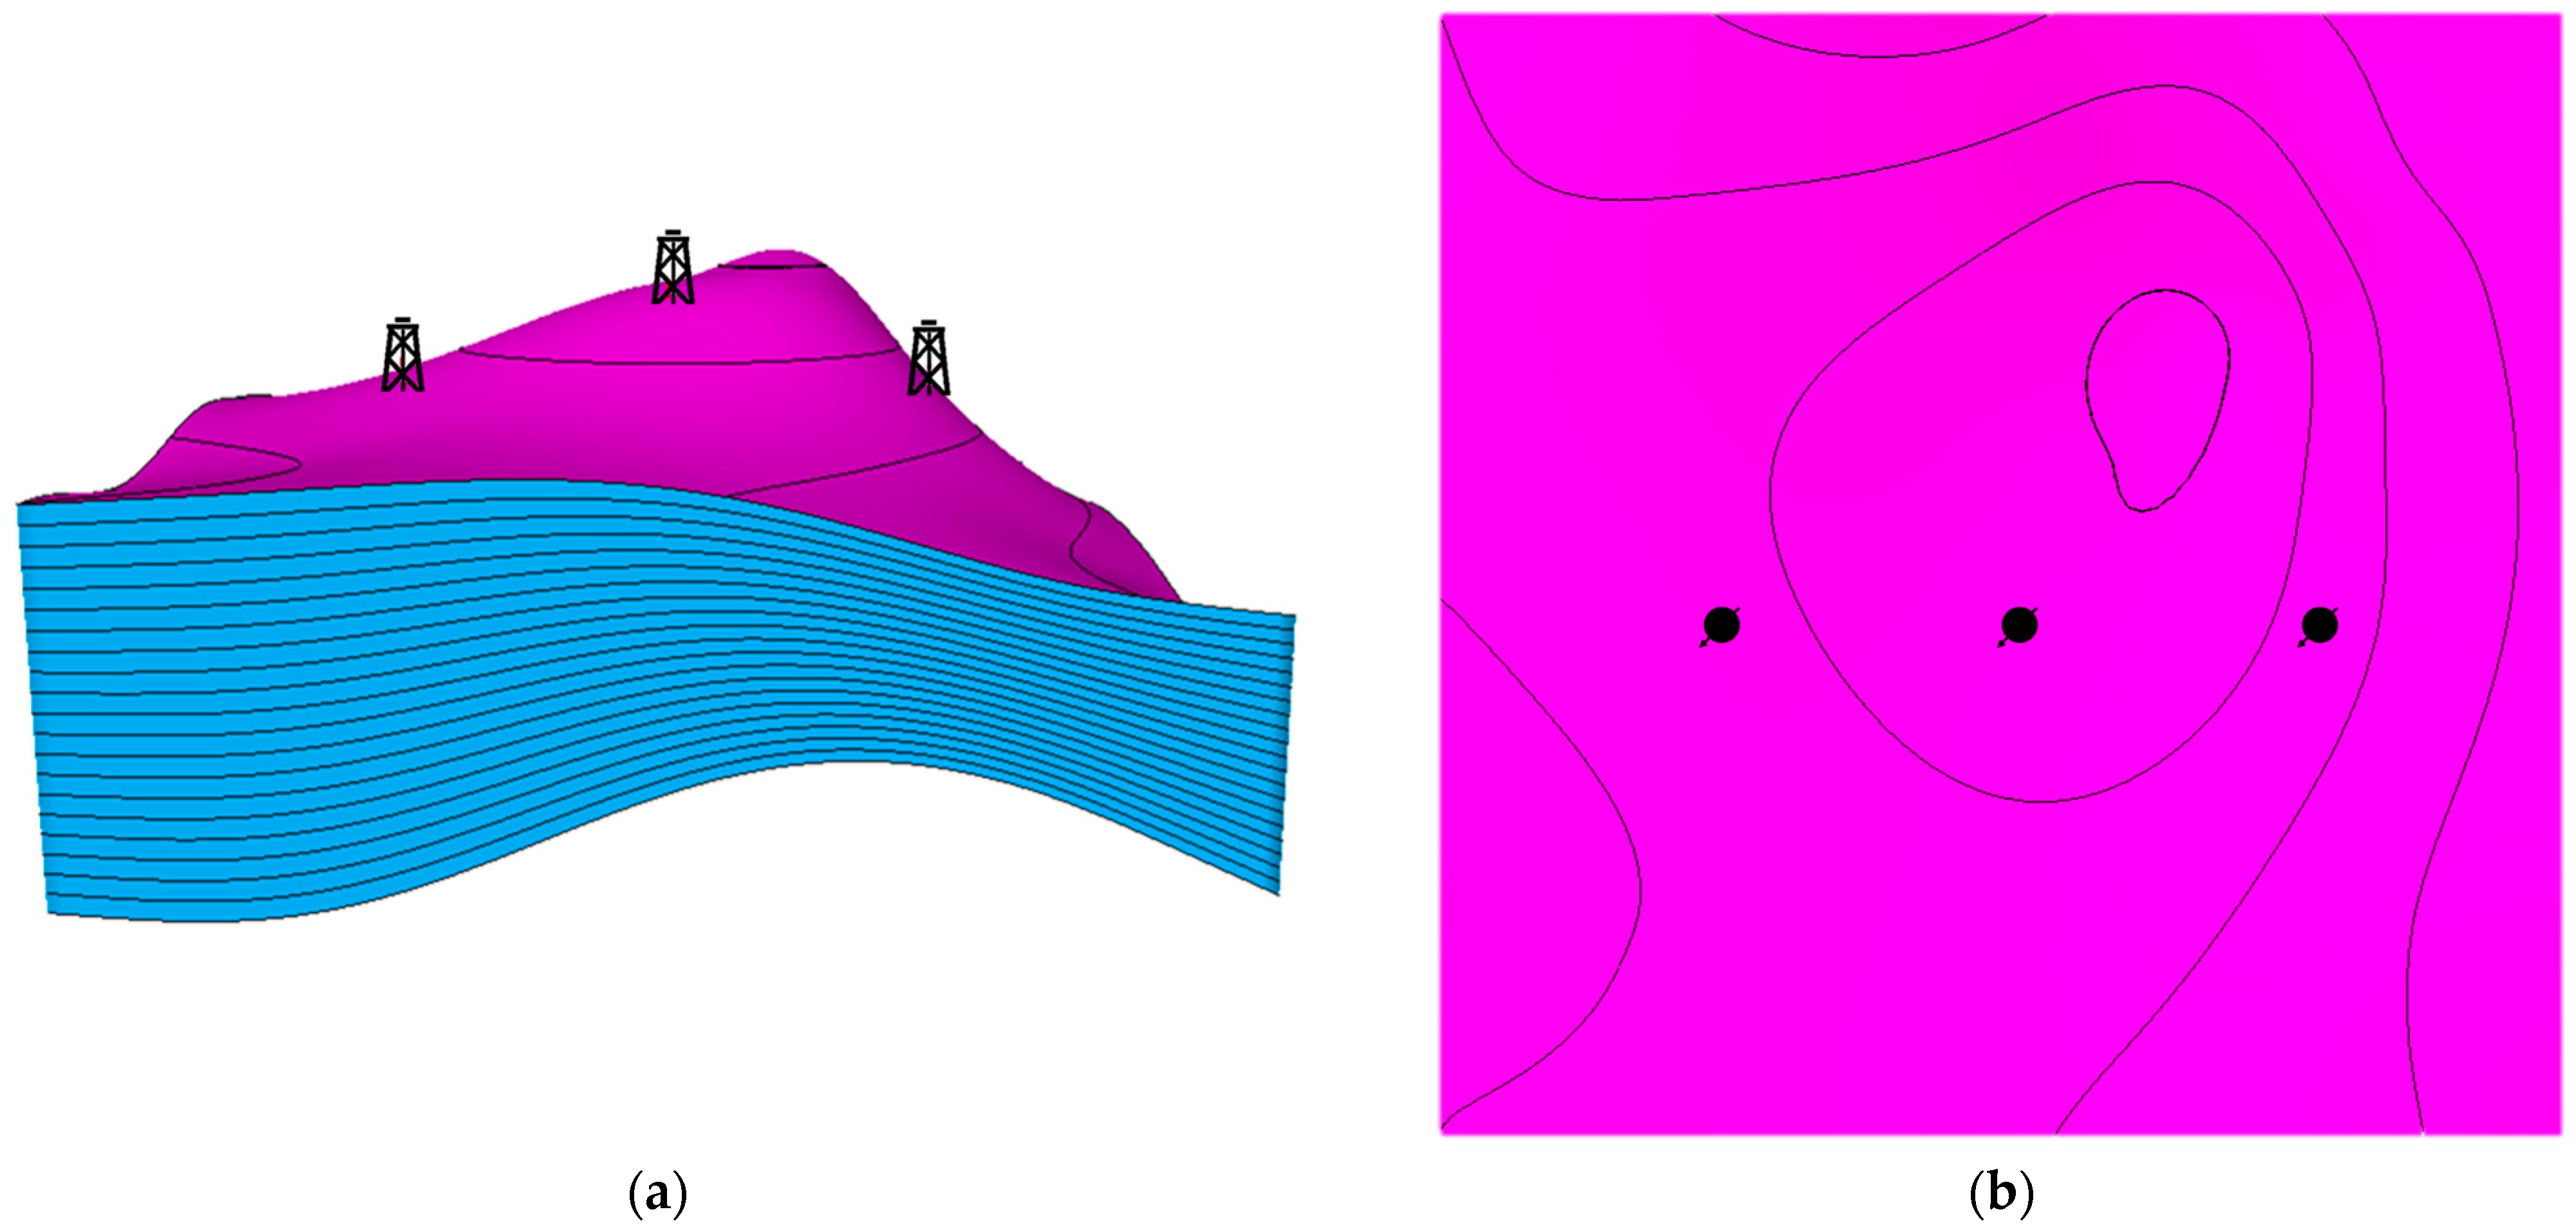
A synthetic three-dimensional reservoir model was developed to examine numerous subsurface complexities in a carbonate saline aquifer. The model was structured as an anticline emulating common petroleum systems. Intentionally, the structure was designed asymmetrically, where one side had a higher dip than the other, as illustrated in Figure 3. Furthermore, the model was initialized with homogenous petrophysical properties, which are represented in Table 1 along with other essential parameters, in a regular Cartesian grid with 75 × 75 × 20 (112,500) cells.
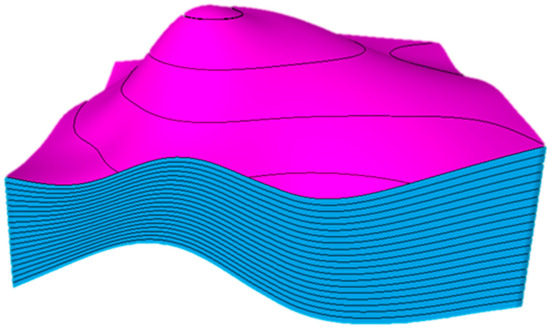
Figure 3.
The synthetic anticline reservoir model demonstrates an asymmetrical design. The magenta and blue colors show the horizons and the layers, respectively.

Table 1.
Reservoir rock and fluids’ properties and parameters.
After generating the model’s structure, a simulation model was generated to run numerical simulations in CMG-GEM® (version 2023.30) [28]. The simulator is considered a multidimensional equation-of-state compositional simulator that can compute subsurface multiphase flow using a finite volume method with finite differences. Miscible and immiscible fluid injection in various porous media can be efficiently simulated while considering all of the major mechanisms, such as viscosity alteration, in the process. Additionally, it can incorporate solubility and ionic, chemical, and residual trapping with any subsurface rock (e.g., mineral dissolution) or fluid changes (e.g., gas saturation). Coupling various geoscience packages with CMG-GEM® is considered one of the advantages of utilizing the simulator. For example, fractures can be developed in a specialized fracturing software package and coupled afterward with CMG-GEM®. Therefore, the simulator can forecast subsurface flow dynamics by smoothly integrating detailed geological, petrophysical, and geophysical features (e.g., fractures, saturations, faults, etc.), capturing various degrees of reservoir complexities.
The simulator was utilized to continuously inject CO2 for five years in the anticline model in which five metric tons per day were injected continuously. After the five-year injection, the CO2 storage process in the aquifer with the plume migrations and geochemical interactions was examined for 195 years (i.e., 200 years of simulation). The simulation was performed in a finite saline aquifer model with closed boundaries. Also, the model assumed that the caprock acts as a perfect seal. During the simulation, the injected CO2 amount can be represented by free, dissolved, or trapped CO2 quantities within the aquifer. The CO2 solubility in the aqueous phase was calculated in the model via the Li and Nghiem method with the general Henry’s law [22]. Moreover, the saline water aquifer ionic composition, concertation, and CO2 molecular diffusion rates in the aqueous phase were based on Machado et al. [29]. Carbonate reservoir relative permeability curves were utilized in the model based on Bennion and Bachu (see Figure 4) [30]. Additionally, Carlson’s model for relative permeability was incorporated using Land’s trapping function, with a maximum residual gas saturation of 0.25, according to Burnside and Naylor [31,32,33].
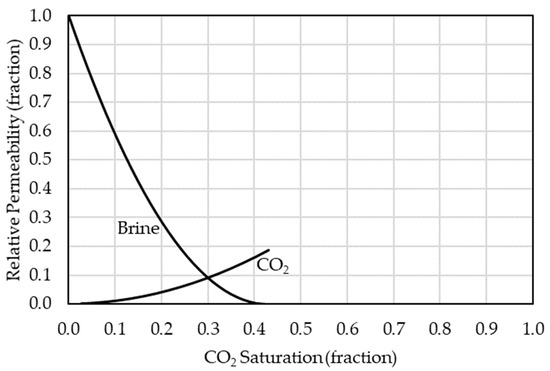
Figure 4.
Relative permeability curves for brine and CO2 in a carbonate reservoir based on Bennion and Bachu [30].
The geochemical reactions, which occurred as soon as the CO2 reached the aquifer, played an essential role in the CO2 distribution within the aquifer; hence, the reactions were captured in the model. The injected CO2 interacts with the aquifer brine, which traps the CO2 as carbonate ions, based on Equations (1)–(3), using kinetic parameters from the PHREEQC database [19]. In addition to the aquifer brine, the interactions between the CO2 with the reservoir minerals were included using transition-state-theory-derived rate laws [21]. The study mainly focused on calcite dissolution and dolomite precipitation. Equations (4) and (5) show dolomite precipitation and calcite dissolution reactions computed in the model. The geochemical interactions reflect the solubility trapping (Equations (1)–(3)) and mineralization reactions (Equations (4) and (5)) utilized in the simulation model.
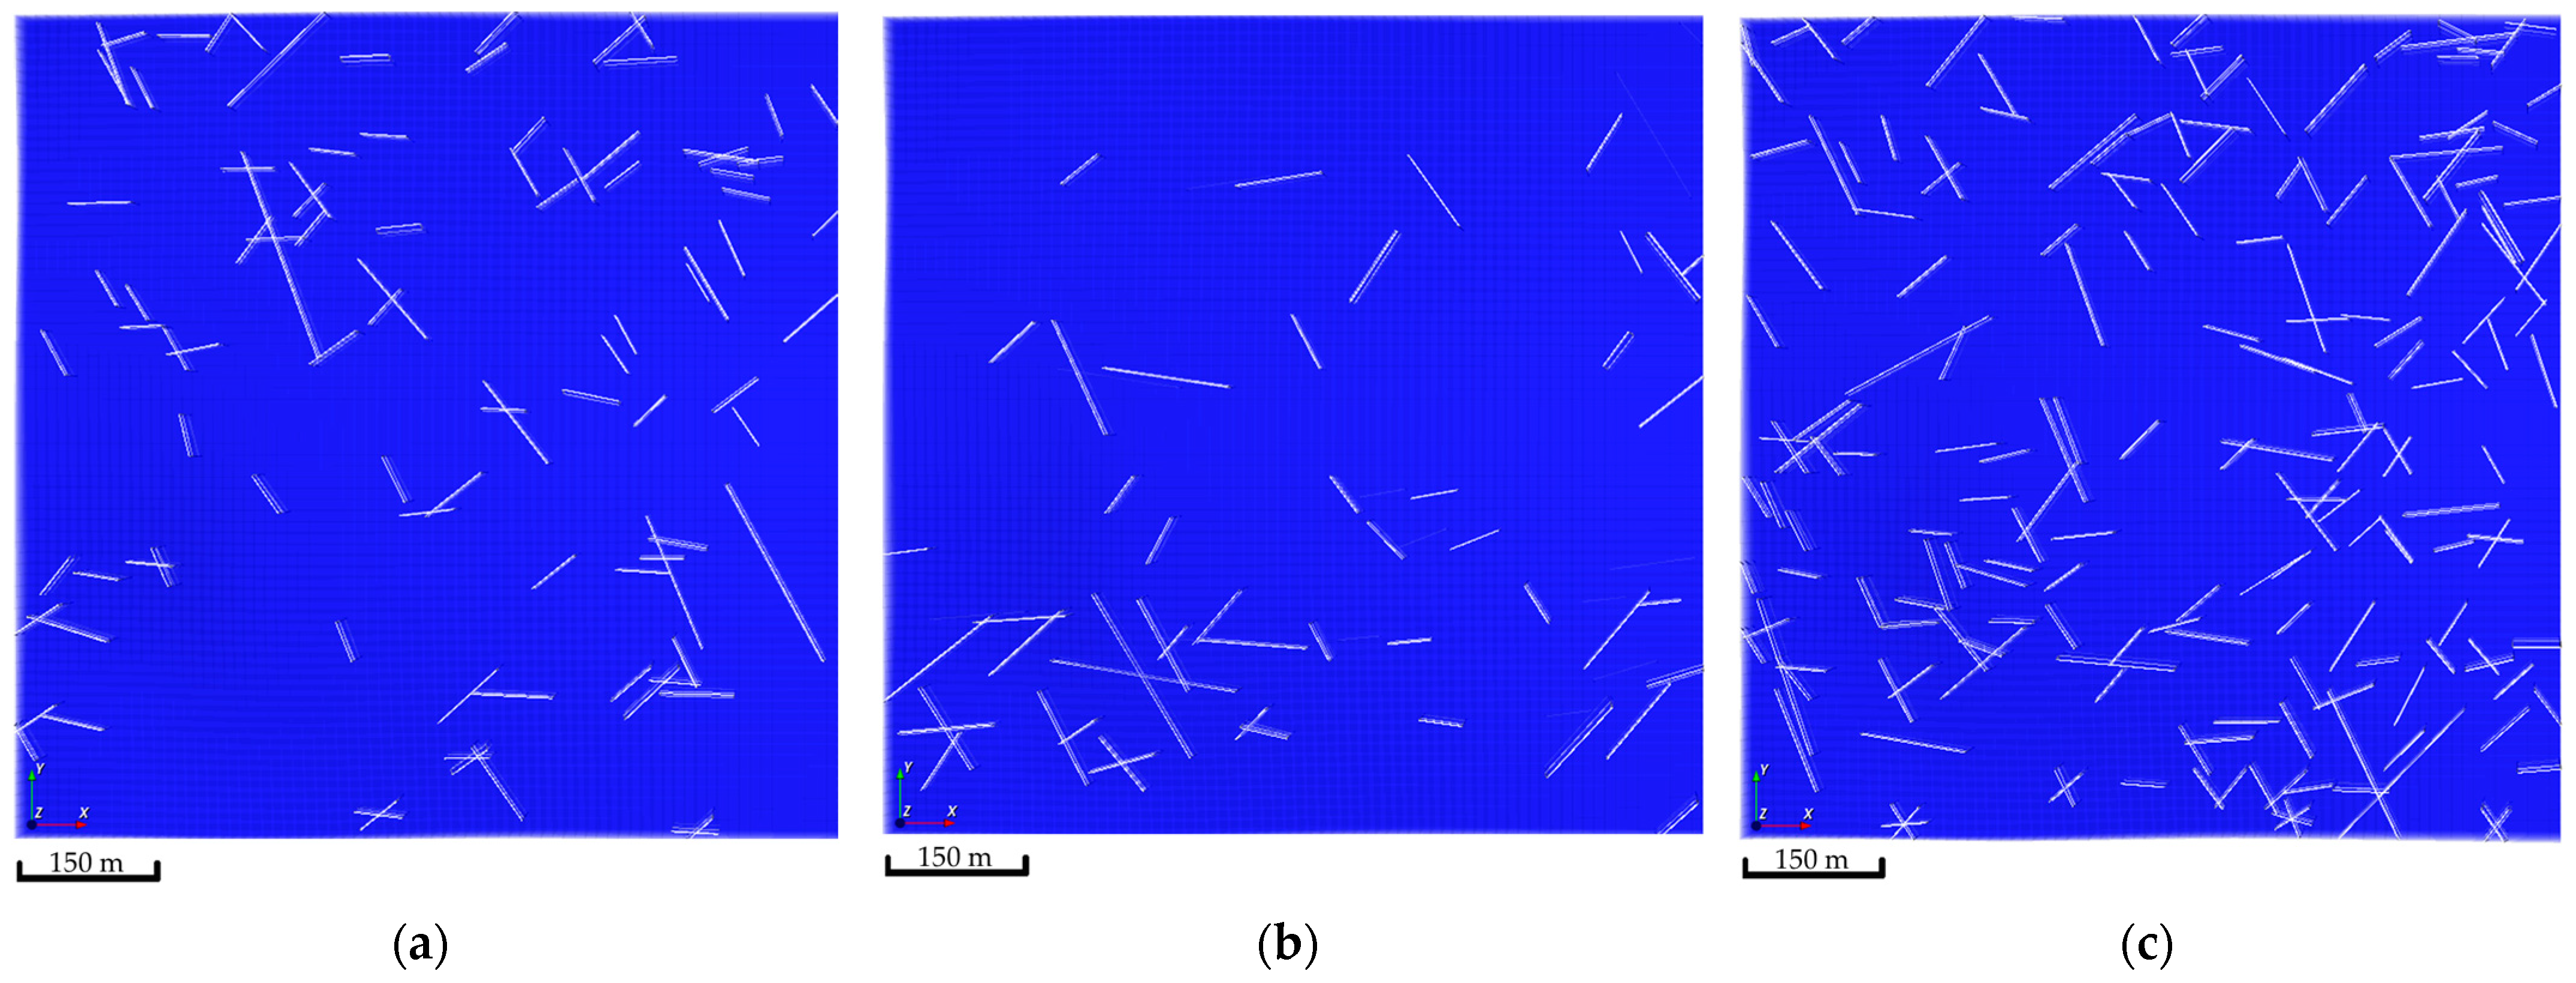
Natural fractures were introduced in the simulation model by capitalizing on the Embedded Discrete Fracture Model (EDFM) [34,35]. The EDFM technique adds additional gridblocks to the simulation model gridblocks reflecting the fracture network. These additional gridblocks introduce a transmissibility function that captures the subsurface flow mechanics [36,37,38]. The natural fracture network was generated via a stochastic approach. Three realizations of the natural fracture network were developed, as demonstrated in Figure 5. In all realizations, the introduced fractures had a permeability tenfold the matrix permeability, which should allow the injected CO2 to exhibit various flow patterns within the aquifer.
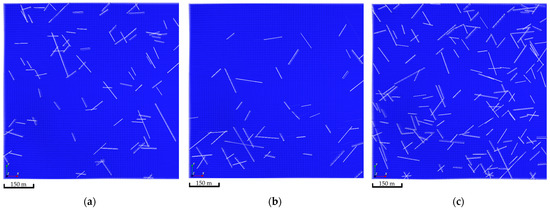
Figure 5.
Natural fractures network realizations. (a) The first realization shows 95 fractures; (b) The second realization shows 49 fractures; (c) The third realization shows 189 fractures.
2.2. Sensitivity Analysis Framework
The developed simulation model was utilized to examine different well placement strategies, which include its surface location and injection zone, during CO2 sequestration in a carbonate saline aquifer. A one-variable-at-time approach was used to analyze various scenarios. In addition to well placement, geochemical interactions and natural fractures were incorporated into the analyses, ultimately providing a deeper understanding of how to optimize CO2 storage in a similar subsurface environment.
2.2.1. Well Placement and Injection Zone
Three main locations were analyzed in the designed anticline structure. The first well location was around the top of the anticline structure. The other two locations were placed in either high-dip or low-dip regions, which were designed to be equally distanced from the first location. Figure 6 illustrates the wells’ placement in the developed structural model. Moreover, three subsurface injection zones were examined in the analysis to assess the differences when injecting in the top, middle, or bottom of the aquifer. The wells’ placements were selected to provide insights into how the dip difference along with subsurface injection zones can presumably impact the trapping mechanisms while incorporating the geochemical reactions.

Figure 6.
Locations of the injection wells. (a) Side view of the wells; (b) Top view of the wells. The magenta and blue colors show the horizons and the layers, respectively.
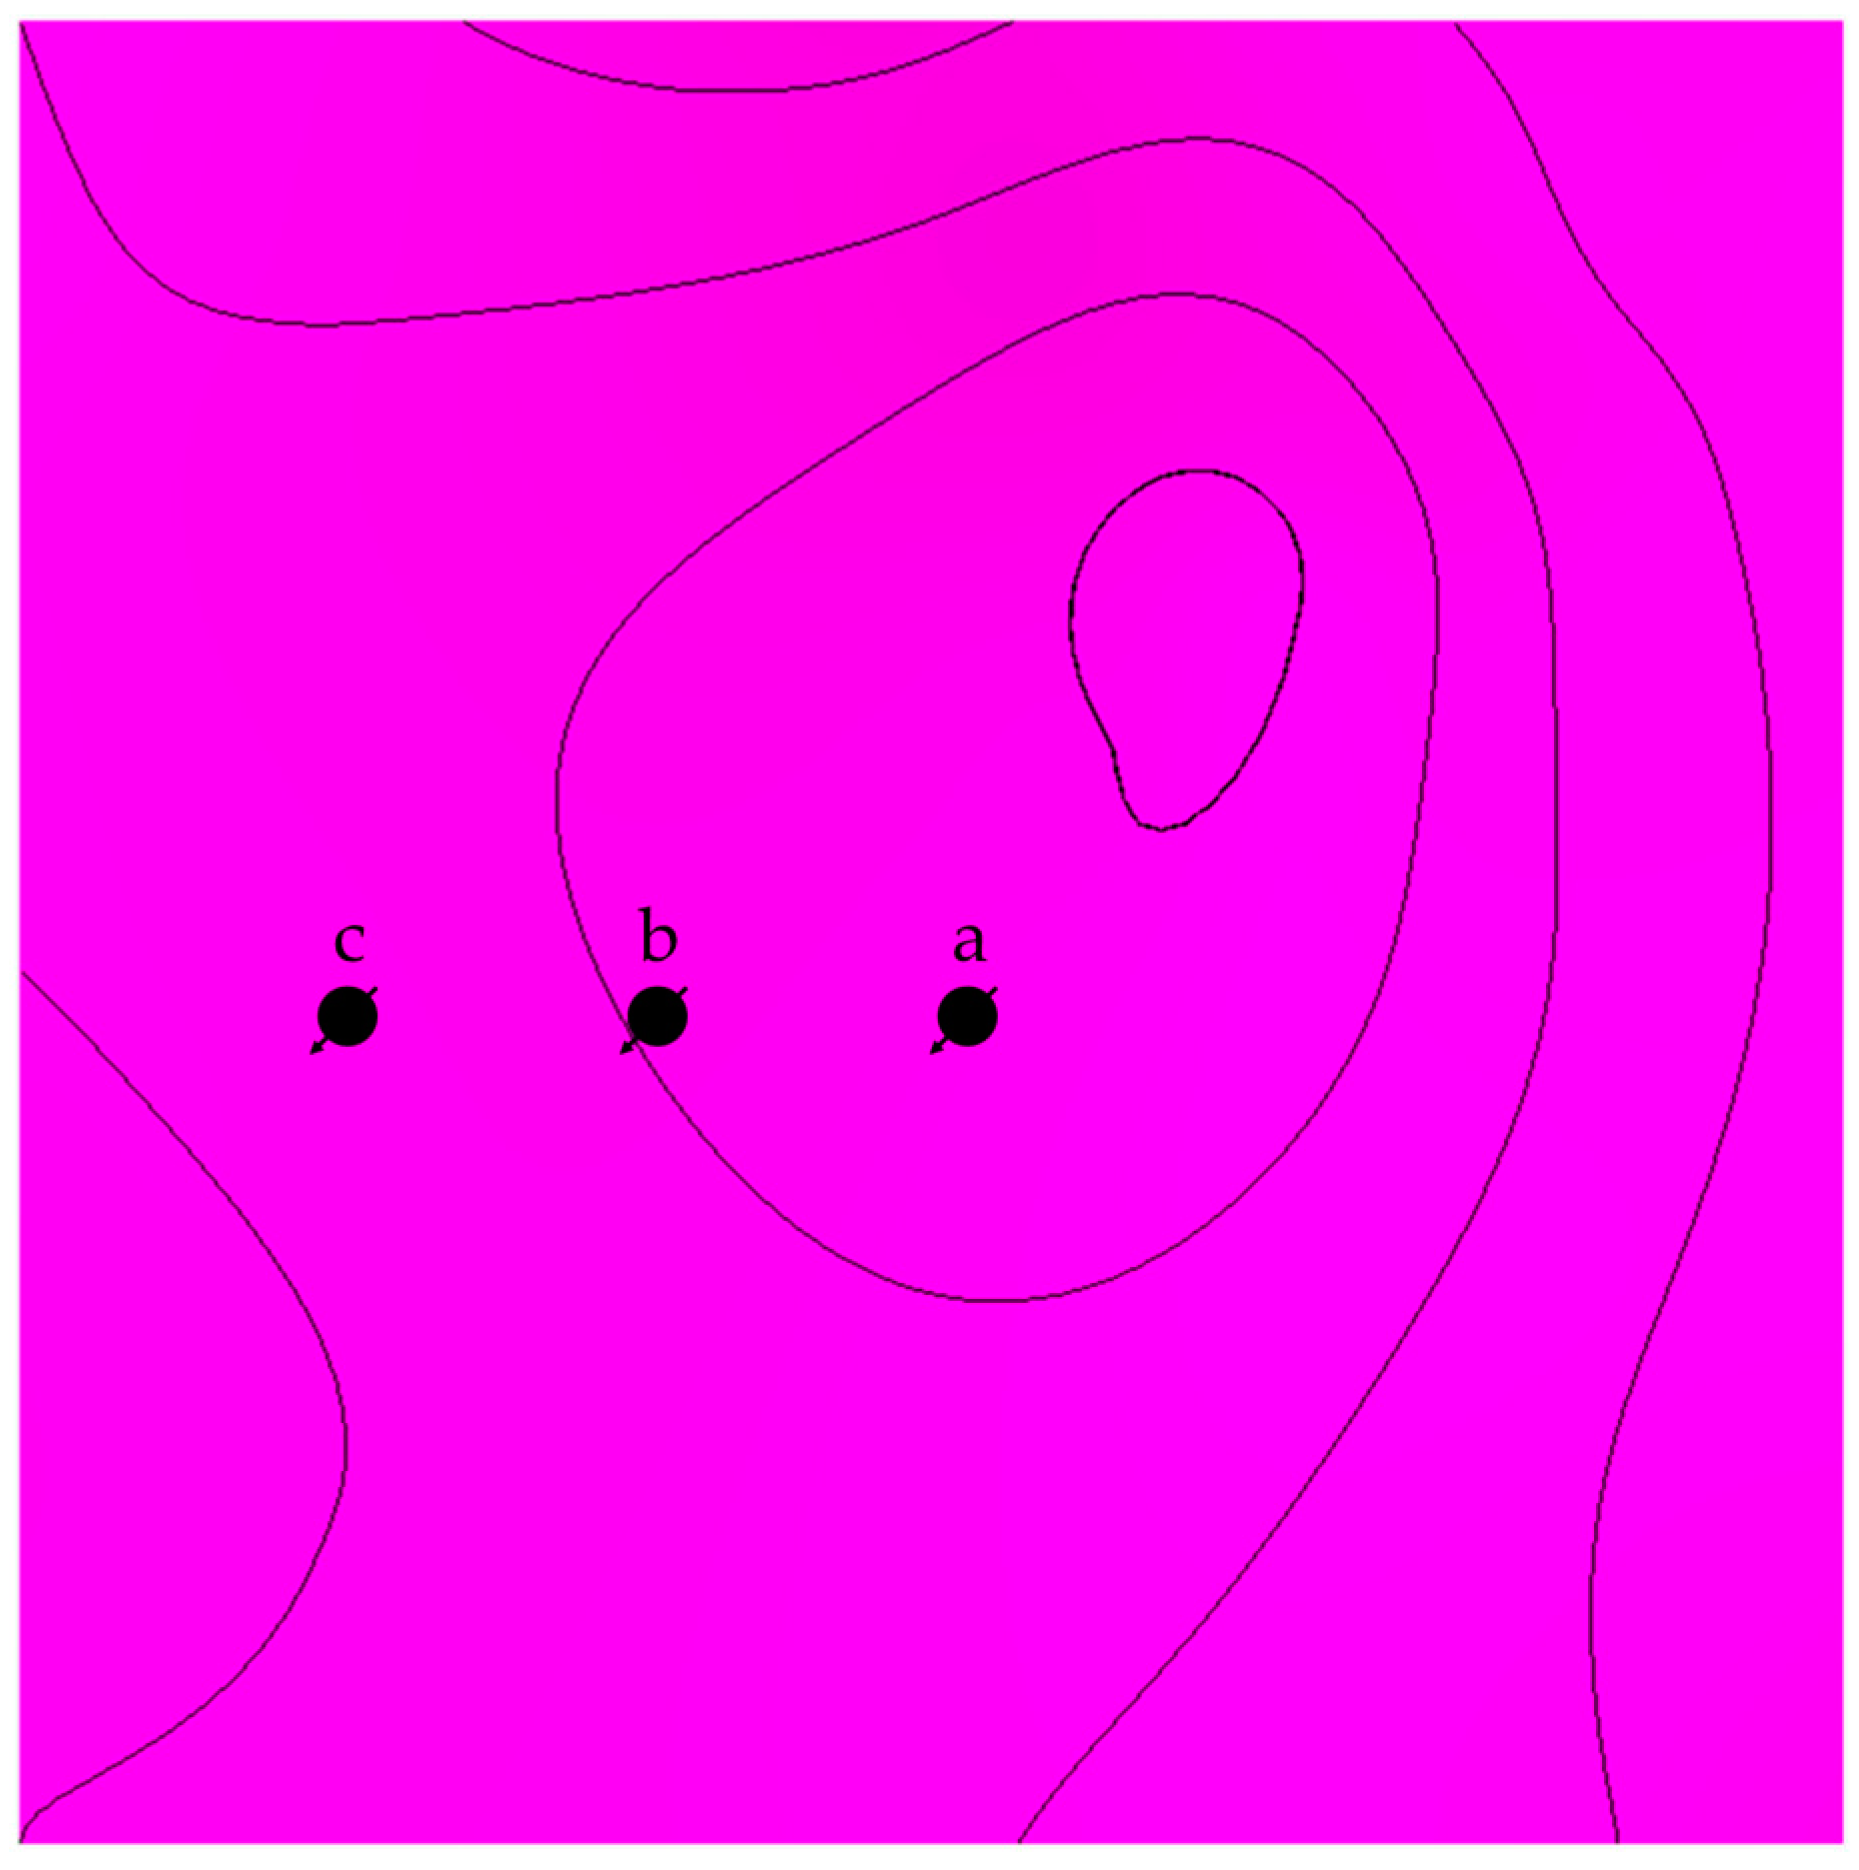
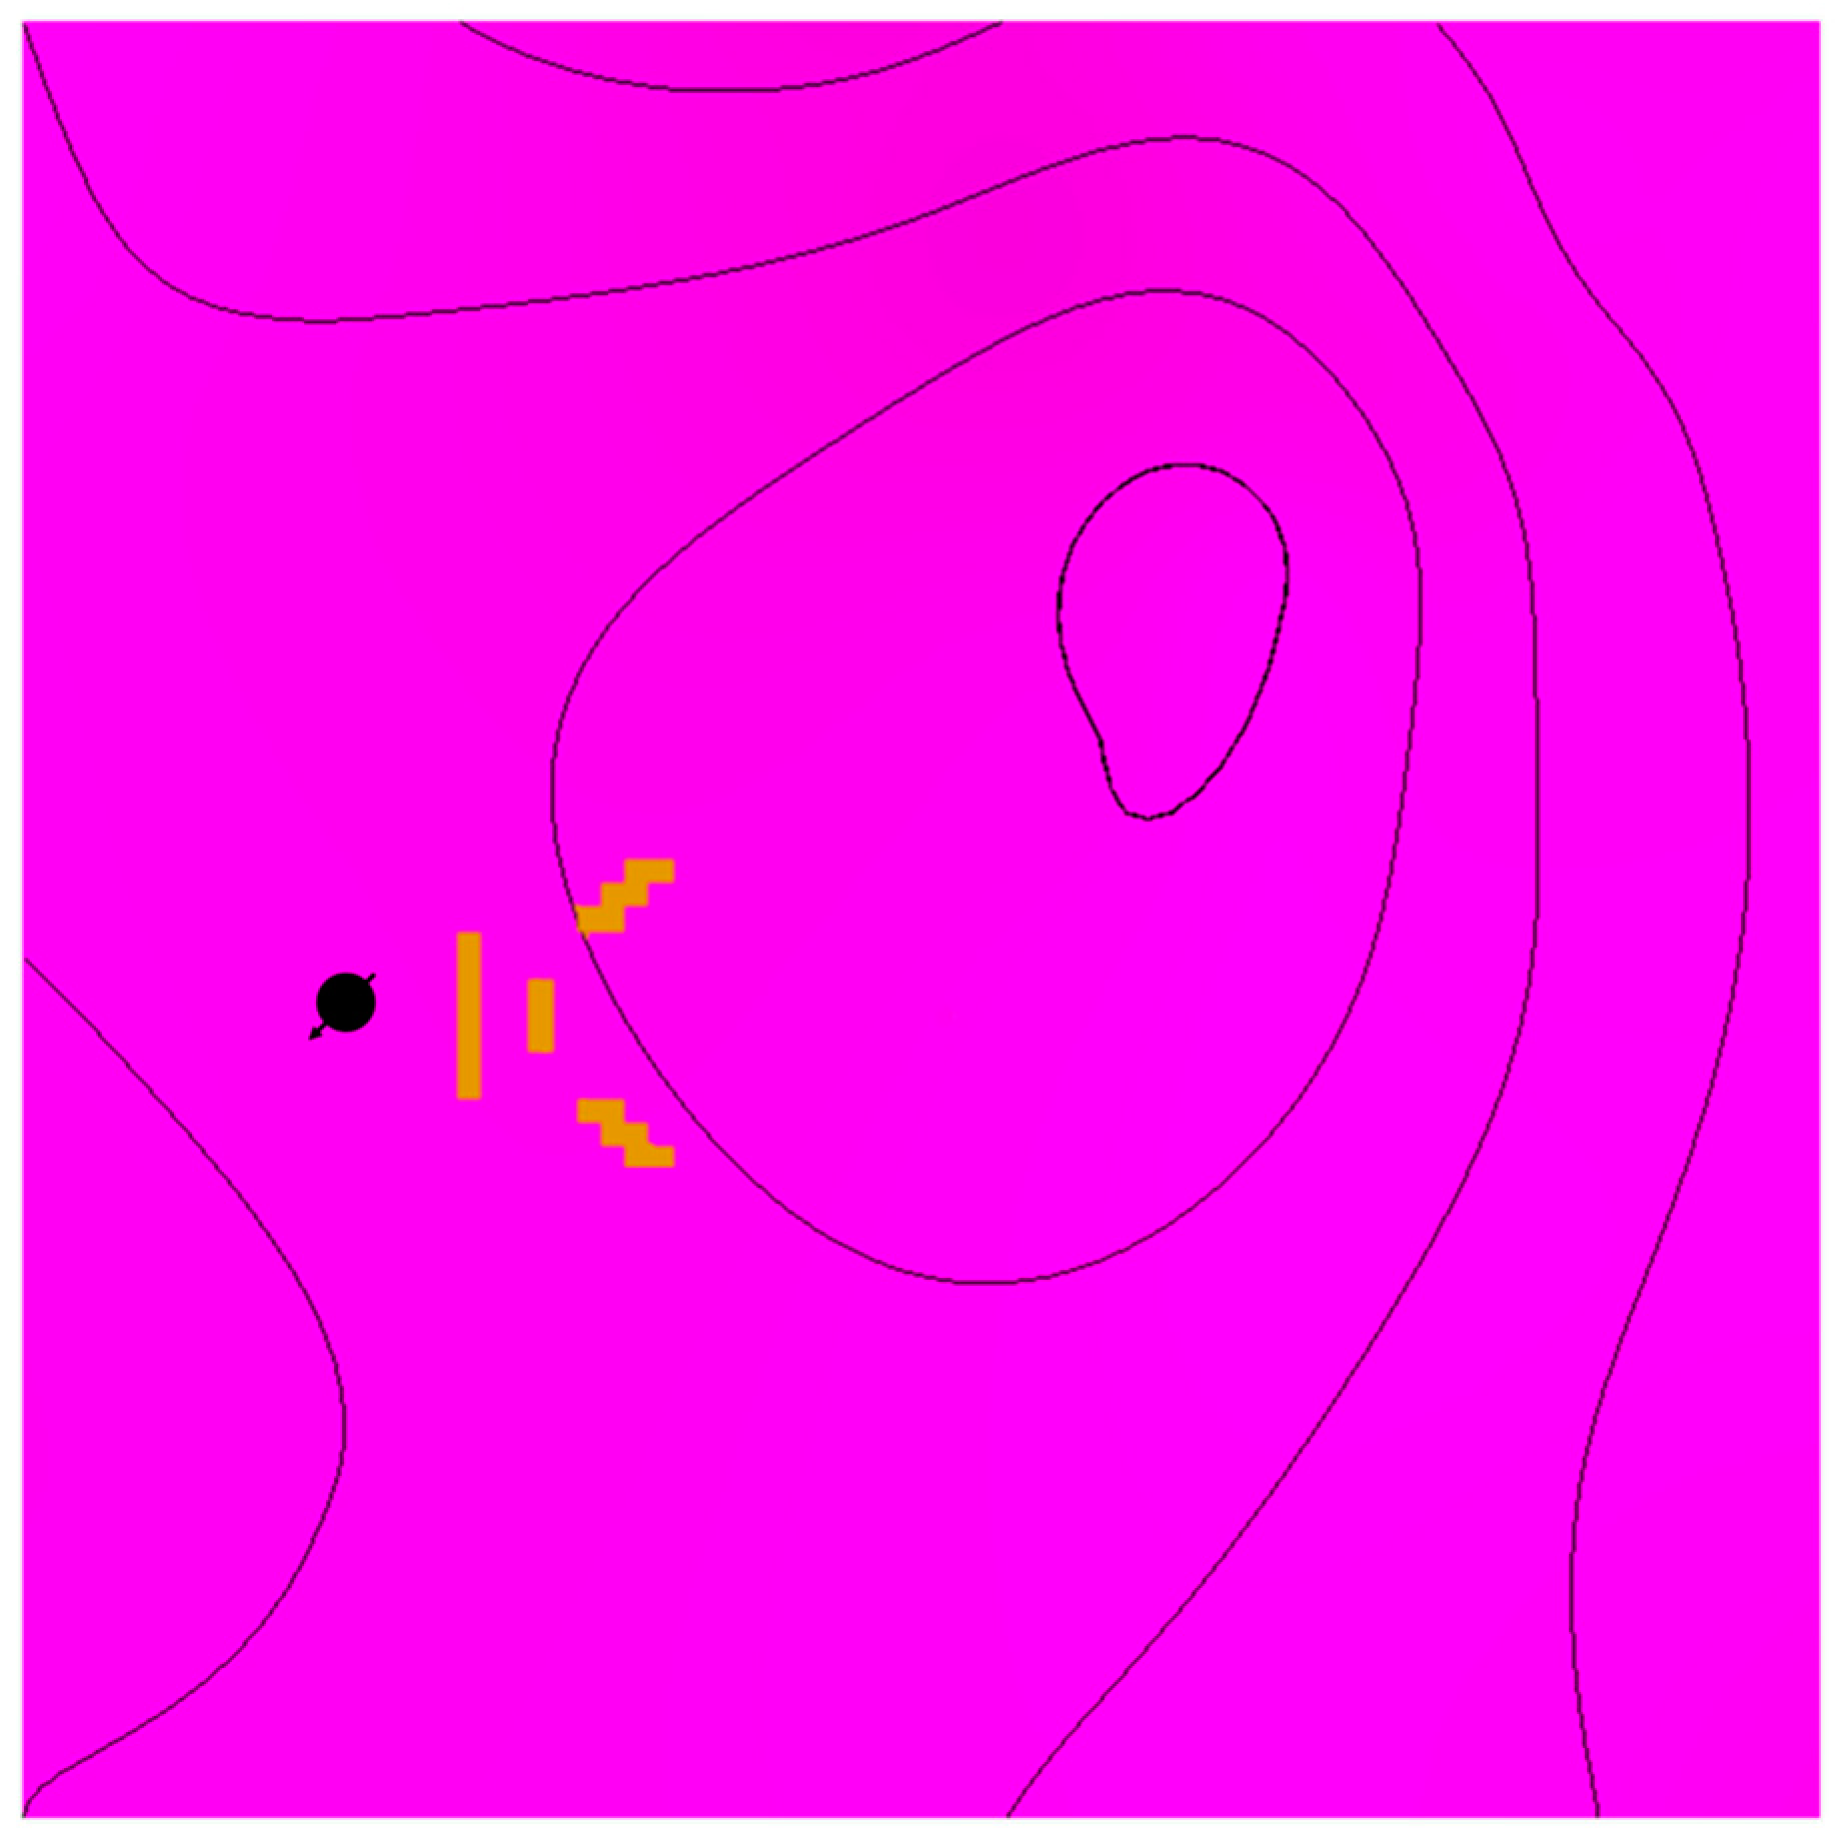
The distance from the top of the structure was investigated by placing wells away from the top with matching characteristics (see Figure 7). In addition to the distance, tortuosity was emulated in another scenario by adding flow barriers in the simulation model, as shown in Figure 8. In each scenario, the CO2 should reach the top of the structure via various paths; hence, the traveled distance would be different, reflecting the role of displacement in each trapping mechanism.
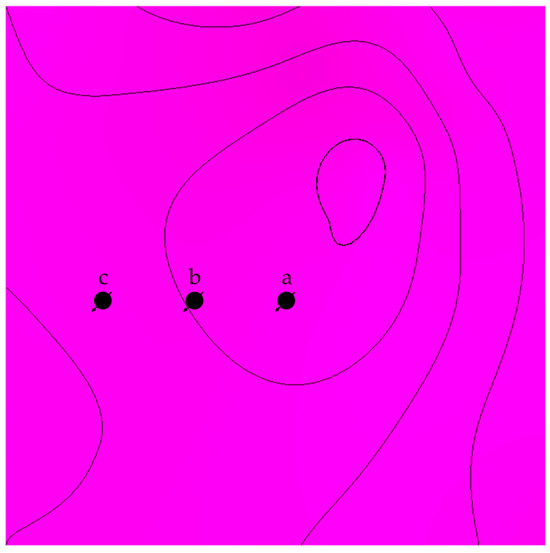
Figure 7.
Top view illustration of the lateral differences between the location of the injection well in scenario a, b, and c.
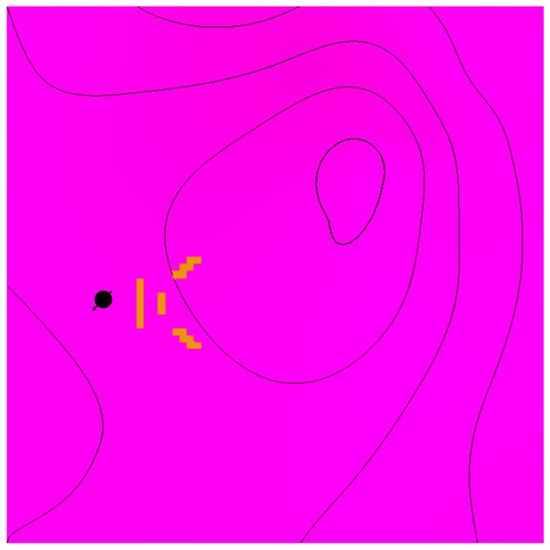
Figure 8.
Flow barriers are illustrated in yellow from a top view relative to the injection well location.
2.2.2. Natural Fractures Network
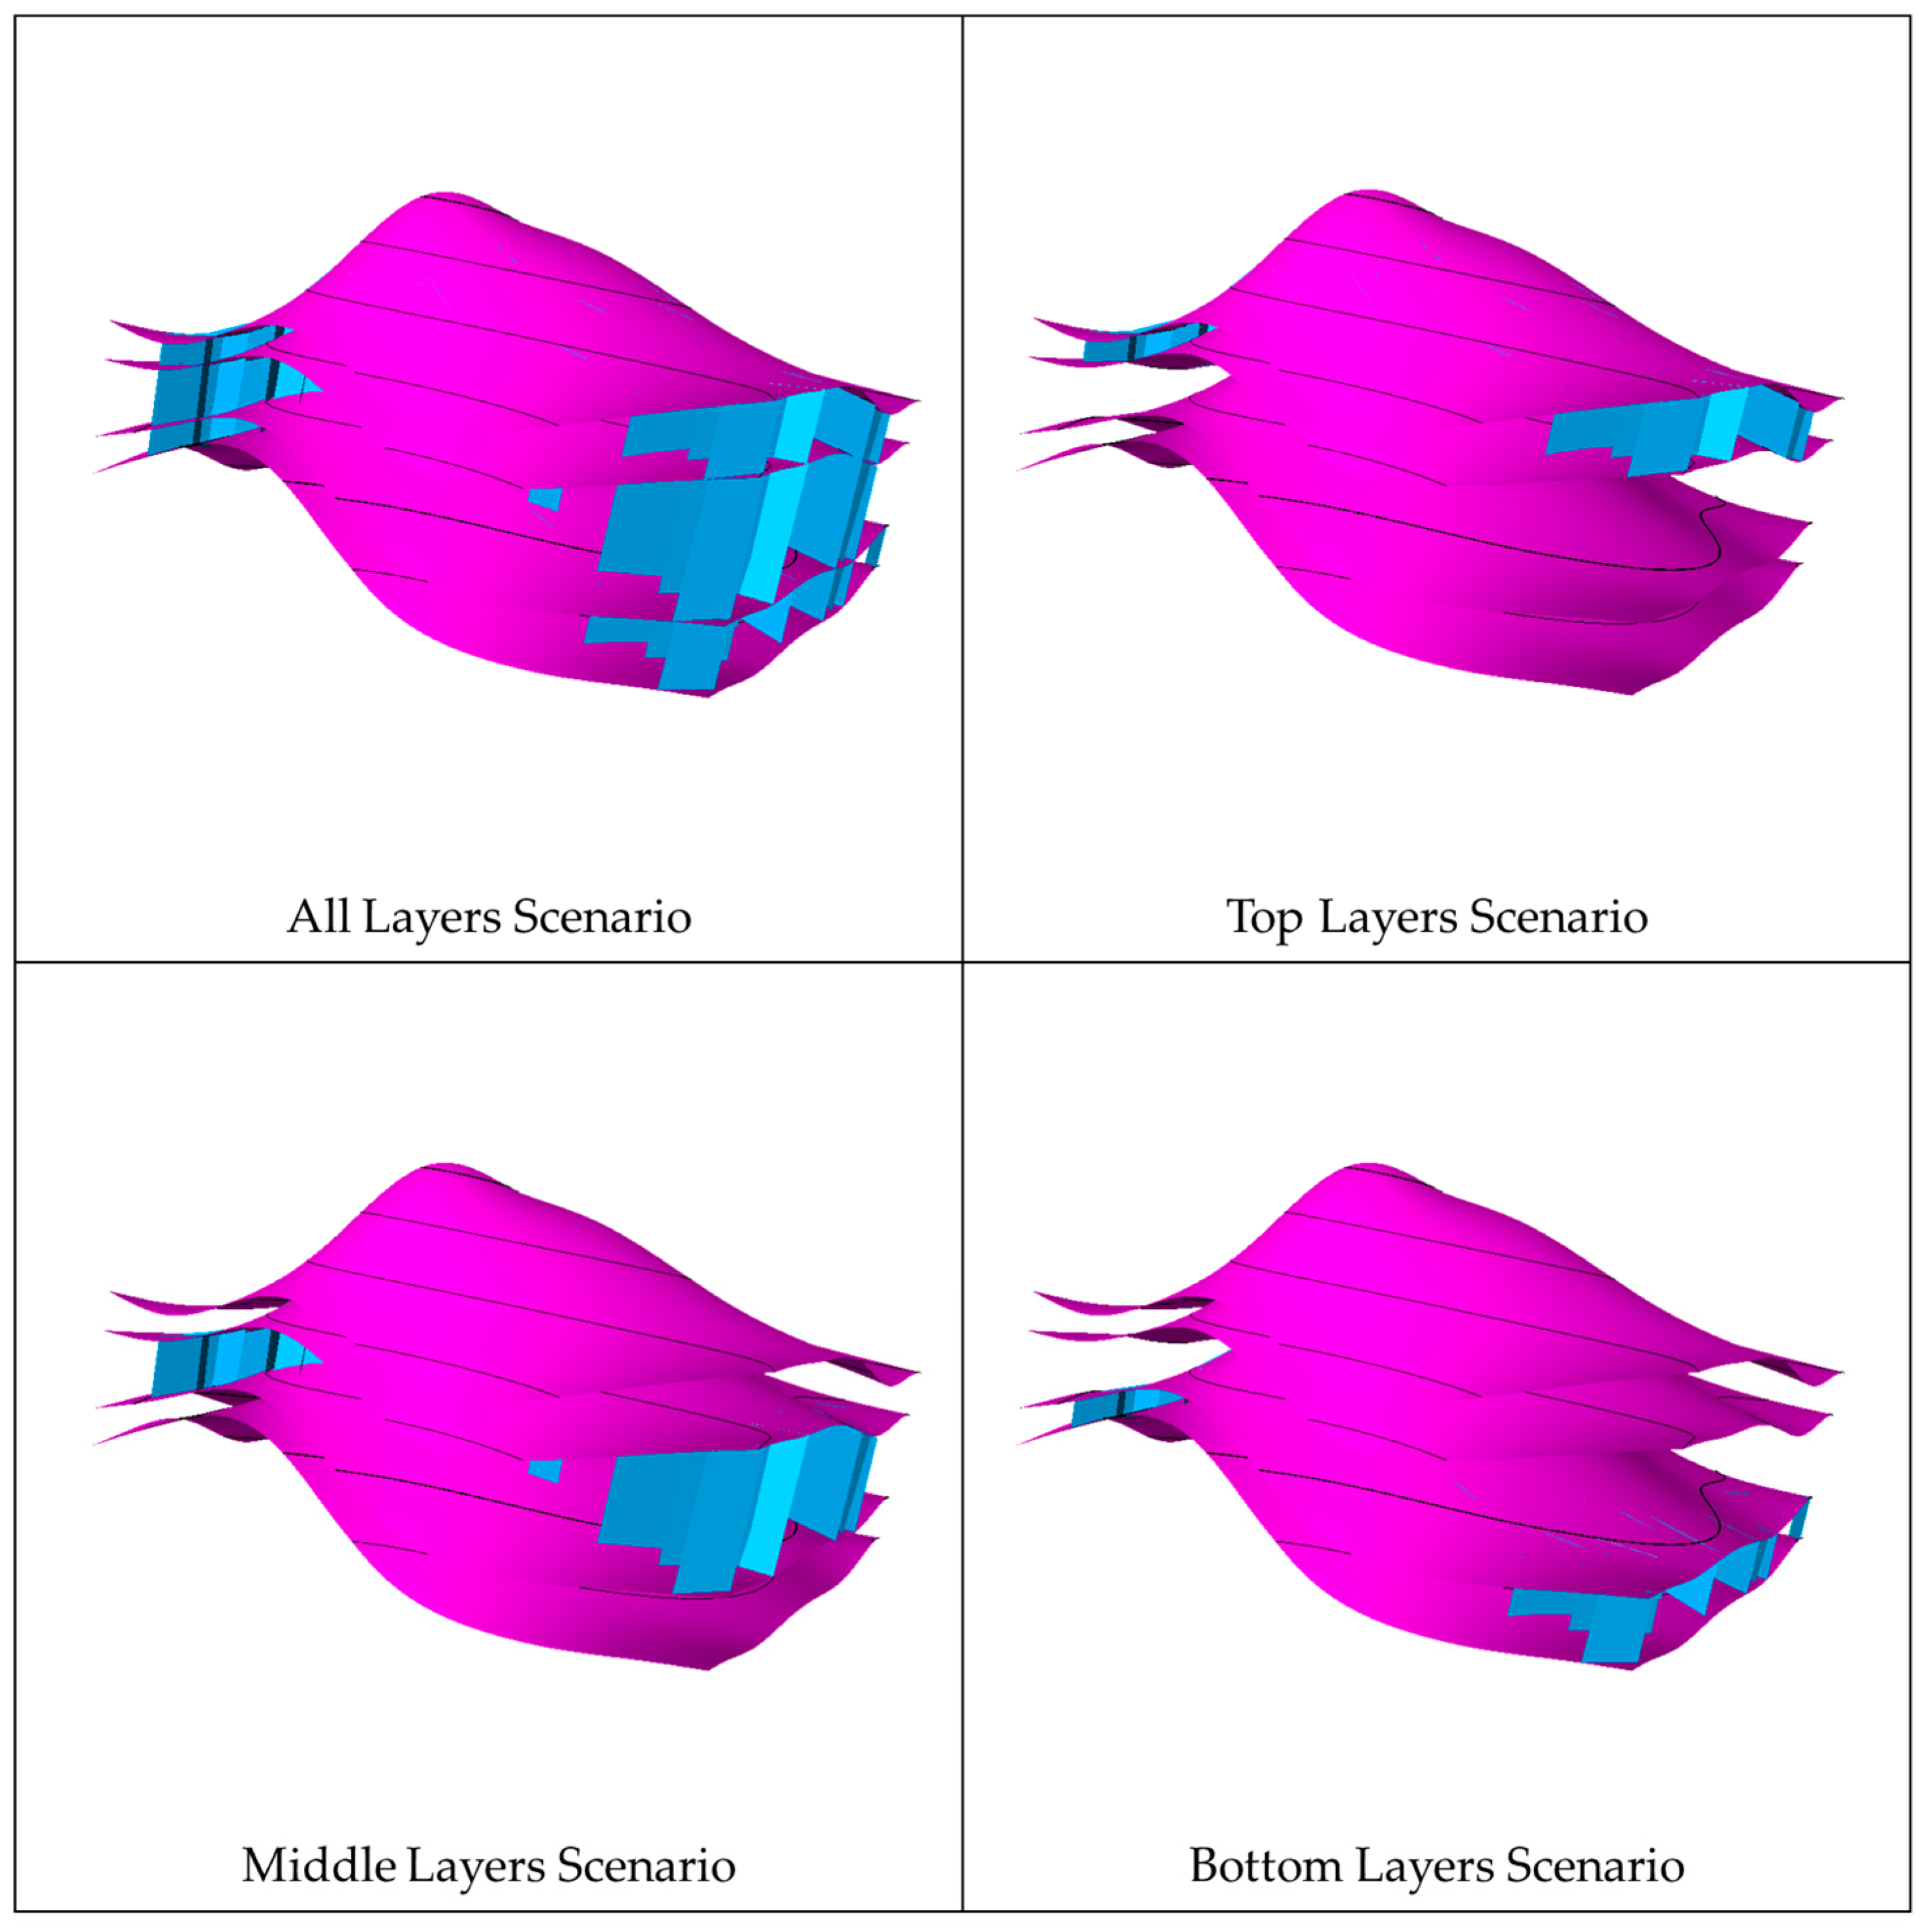
In each realization of the natural fracture network, four scenarios were considered to assess the impact of the vertical extension of the fractures on CO2 migration. The first scenario had the fracture extending across the entire aquifer, while the other scenarios had the fractures limited to the top, middle, or bottom zones. Figure 9 shows the differences between the vertical extensions in each scenario. In every scenario, the well location and injection zone were placed away from fractures to eliminate near-wellbore effects (see Figure 10). Initially, all the scenarios were analyzed without including geochemical reactions due to the computational runtime. The geochemical reactions were incorporated when the most influential scenario was determined. These scenarios should depict natural fractures’ unique signatures in a similar subsurface flow environment.

Figure 9.
Vertical extension scenarios in the natural fracture networks, where the fractures are demonstrated in blue.
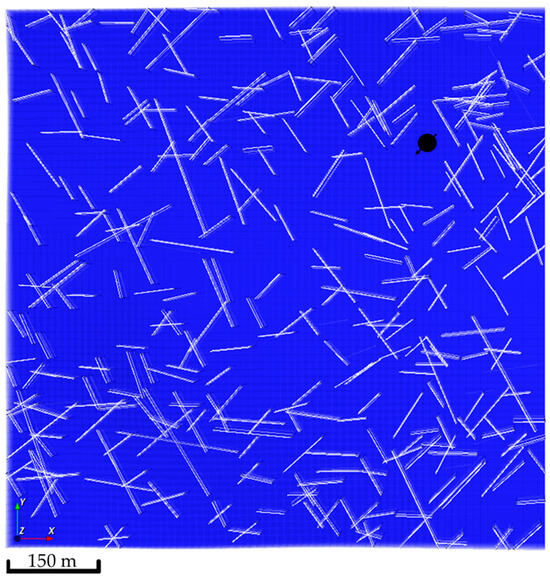
Figure 10.
Location of the injection well, showing all the natural fractures network realizations.
3. Results and Discussion
3.1. Well Placement Optimization
The well placement in CO2 sequestration has significant importance in the storage process, which generally focuses on the well location and its injection zone. Consequently, the optimization process in the developed simulation model tackled these two aspects independently while considering the various trapping mechanisms. The optimization boils down to providing the most plausible injection strategy that yields optimum CO2 storage.
3.1.1. Injection Location
The location of the well plays a major role in the subsurface CO2 distribution due to the varying contribution of each trapping mechanism. Figure 11 illustrates the three main locations and the global mole fraction, which includes the dissolved and free CO2, in the formation after 200 years of injection. The anticline structure aids in capturing the trapping mechanisms signatures; thus, it plays a significant role in understanding how each mechanism contributes to the migration of the CO2 plume.
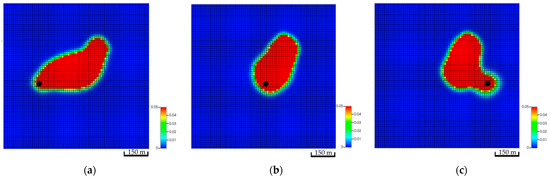
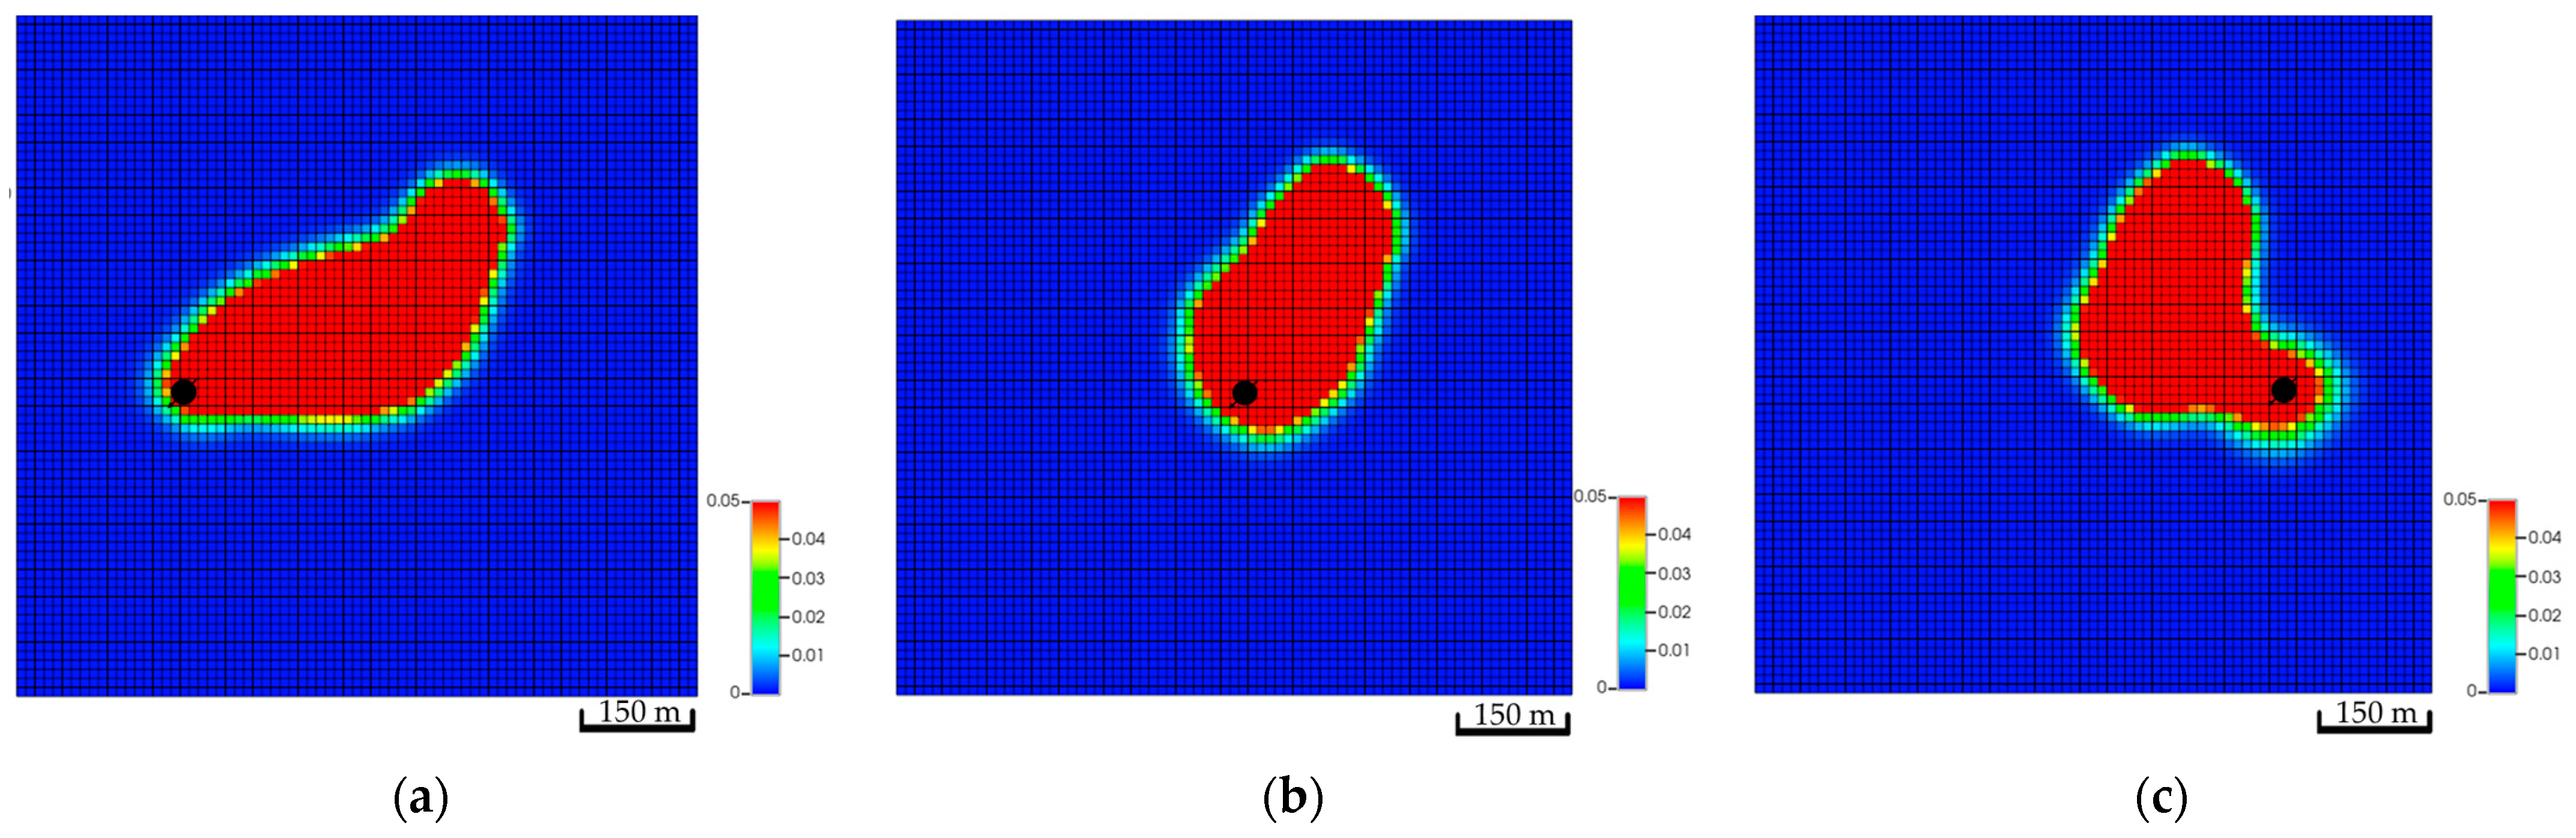
Figure 11.
Top view of the global CO2 mole fractions of three different well locations after 200 years of simulation. (a) Global mole fraction distribution in the low-dip scenario; (b) Global mole fraction distribution in the top structure scenario; (c) Global mole fraction distribution in the high-dip scenario.
CO2 vertically migrates from the bottom to the top of the structure because of the density differences between CO2 and resident water in all simulation scenarios. However, the amount of CO2 (i.e., free, dissolved, or trapped CO2) are quite different. The low-dip location has the potential to dissolve more CO2 while maintaining lower free gas compared to the other scenarios. Furthermore, only a mere difference can be expected among the three scenarios for the amount of trapped gas. Figure 12 clarifies the differences between the CO2 quantities for 200 years. Even though the low-dip scenario shows relatively higher trapped CO2 in the early stages, the top structure scenario tends to trap slightly more CO2 because it has higher free CO2, providing an opportunity for the excess gas to get trapped within the pores. Since the results revealed that the low-dip scenario can potentially maximize the dissolved CO2 while minimizing the free CO2, it would be preferable to place the injection well in a low-dip region.
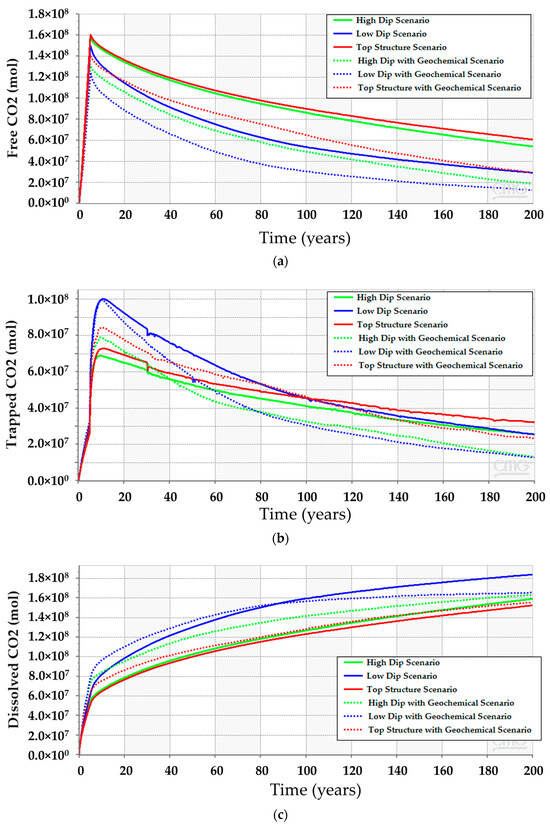
Figure 12.
Comparison between the CO2 amounts in the high-dip, low-dip, and top structure scenarios with and without modeling the geochemical reactions. (a) Free CO2; (b) Trapped CO2; (c) Dissolved CO2.
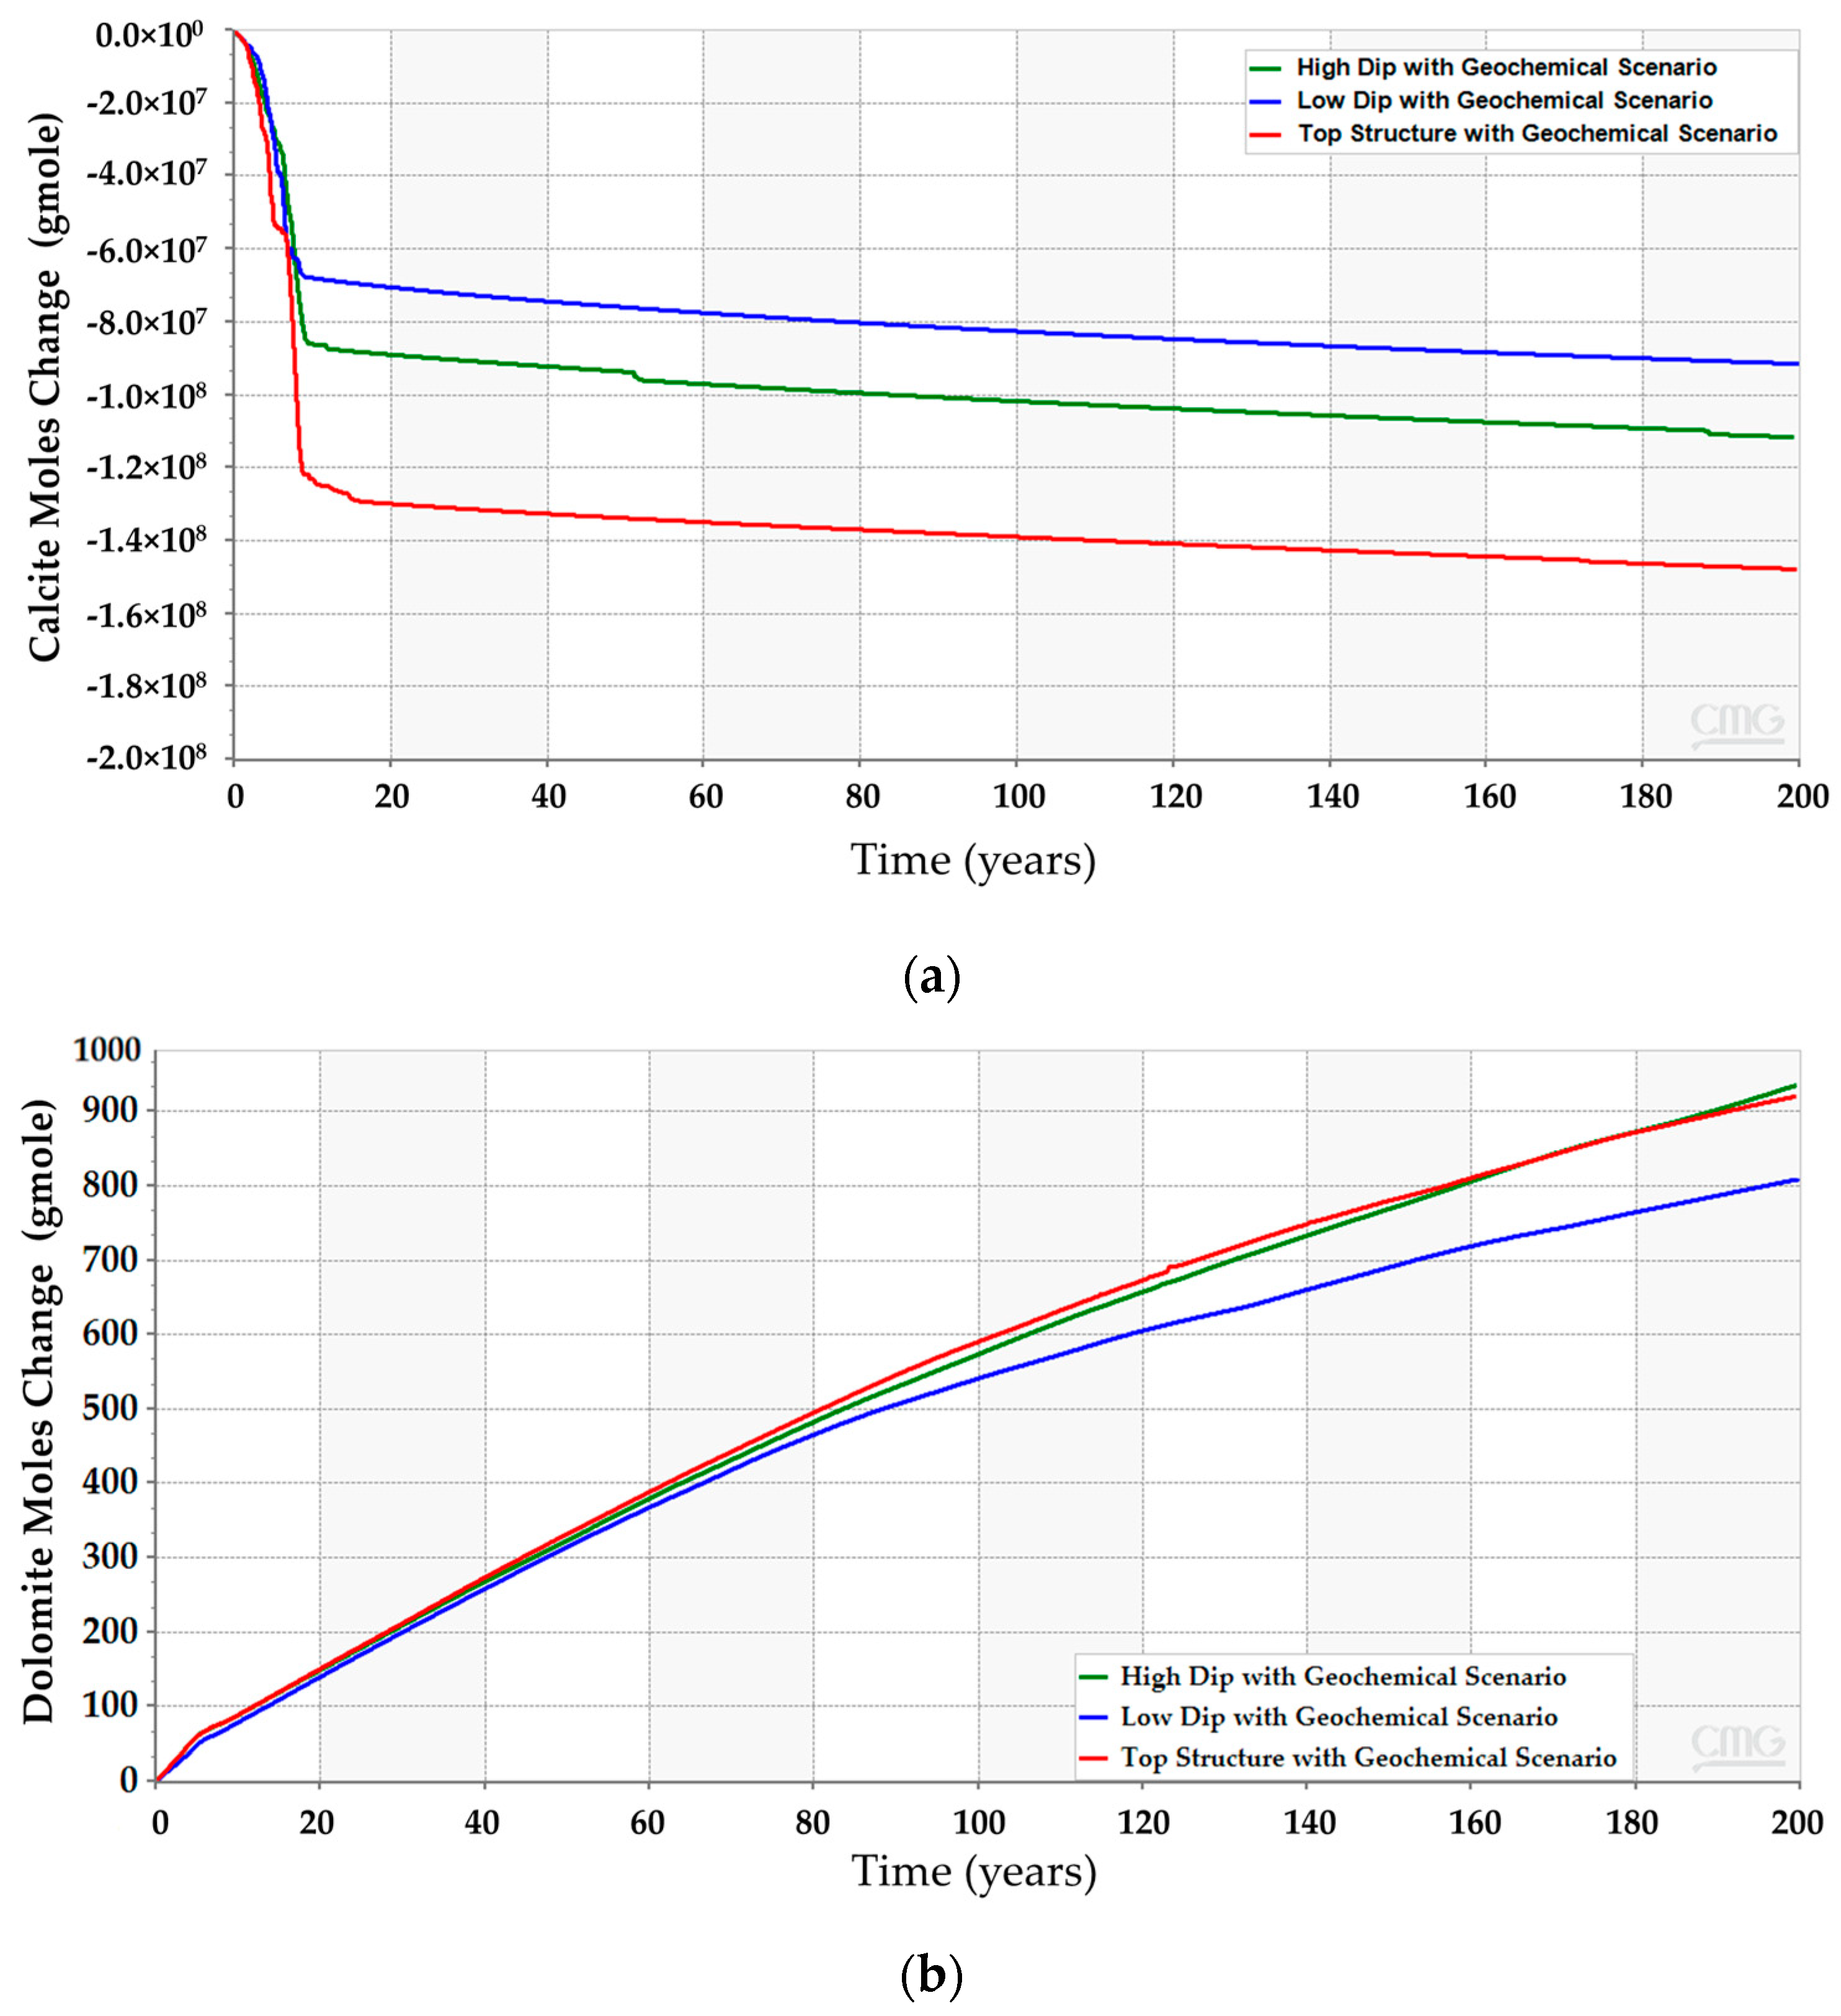
After incorporating the geochemical reactions into the simulation model for the three scenarios, the analyses suggest that all of them should obey a similar trend (see Figure 12). Even though the geochemical reactions reduce the gap between the scenarios, the difference in the CO2 amounts resulted from the different reactions with the reservoir rock minerals. The anticipated interactions between the injected CO2 and the subsurface minerals yield calcite dissolution and dolomite precipitation, as demonstrated in Figure 13. The low-dip scenario yields the lowest calcite dissolution and dolomite precipitation. Moreover, the free CO2 has the most significant reduction in the top structure scenario since more calcite dissolution occurs. It is noteworthy that the majority of these processes require a relatively long-time post-injection for all scenarios. Thus, the low-dip region would be preferable to start the CO2 sequestration development, even when including the geochemical interactions.
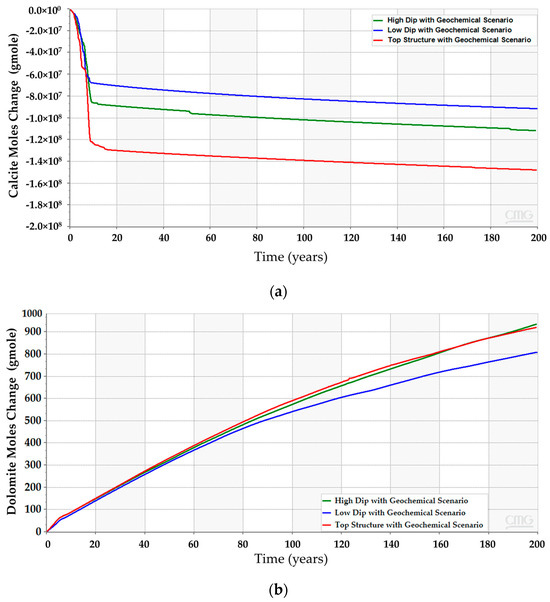
Figure 13.
Subsurface chemical reactions due to dissolved CO2 and minerals interactions in the high-dip, low-dip, and top structure scenarios. (a) Calcite dissolution; (b) Dolomite precipitation.
In addition to the dip differences, the distance between the injector and the top of the structure can influence the CO2 storage. Placing the well further away from the top of the structure helped to dissolve more CO2 compared to the other scenarios. Table 2 reflects the variation in the amount of CO2 for all scenarios. Similar to the dip, the distance impacts the distribution of the CO2 within the aquifer. For instance, the simulation results imply that Scenario A has more than double the free CO2 compared to Scenario C. The difference between the scenarios has been dissolved in Scenario C. Moreover, adding a flow barrier impacts the amount of CO2 in the early stages but yields a relatively similar plume migration path after 200 years, as illustrated in Figure 14. Initially, barriers force the flow to find an easier path to flow; hence, the plume slightly expands until it overcomes the barriers. It is crucial to note that CO2 quantities after including the tortuous path remain almost the same, which highlights the distance influence on the trapping mechanisms compared to the plume path.
Table 2.
Total moles of CO2 for different well distances from the top of the structure.
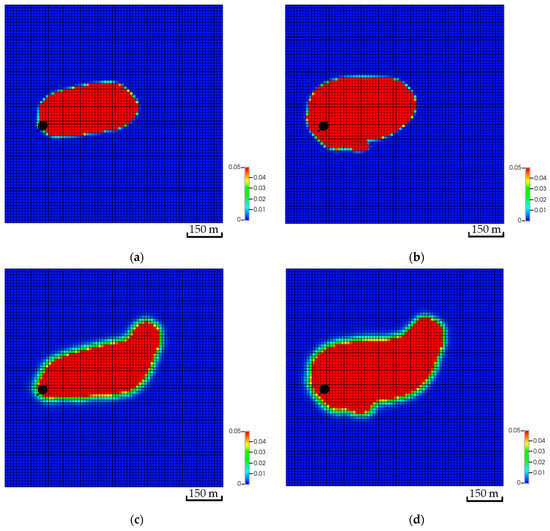
Figure 14.
Effect of tortuosity on CO2 global mole fraction distribution. (a) The base scenario after the injection stops; (b) The tortuosity scenario after the injection stops; (c) The base scenario after 200 years of simulation; (d) The tortuosity scenario after 200 years of simulation.
3.1.2. Injection Zone
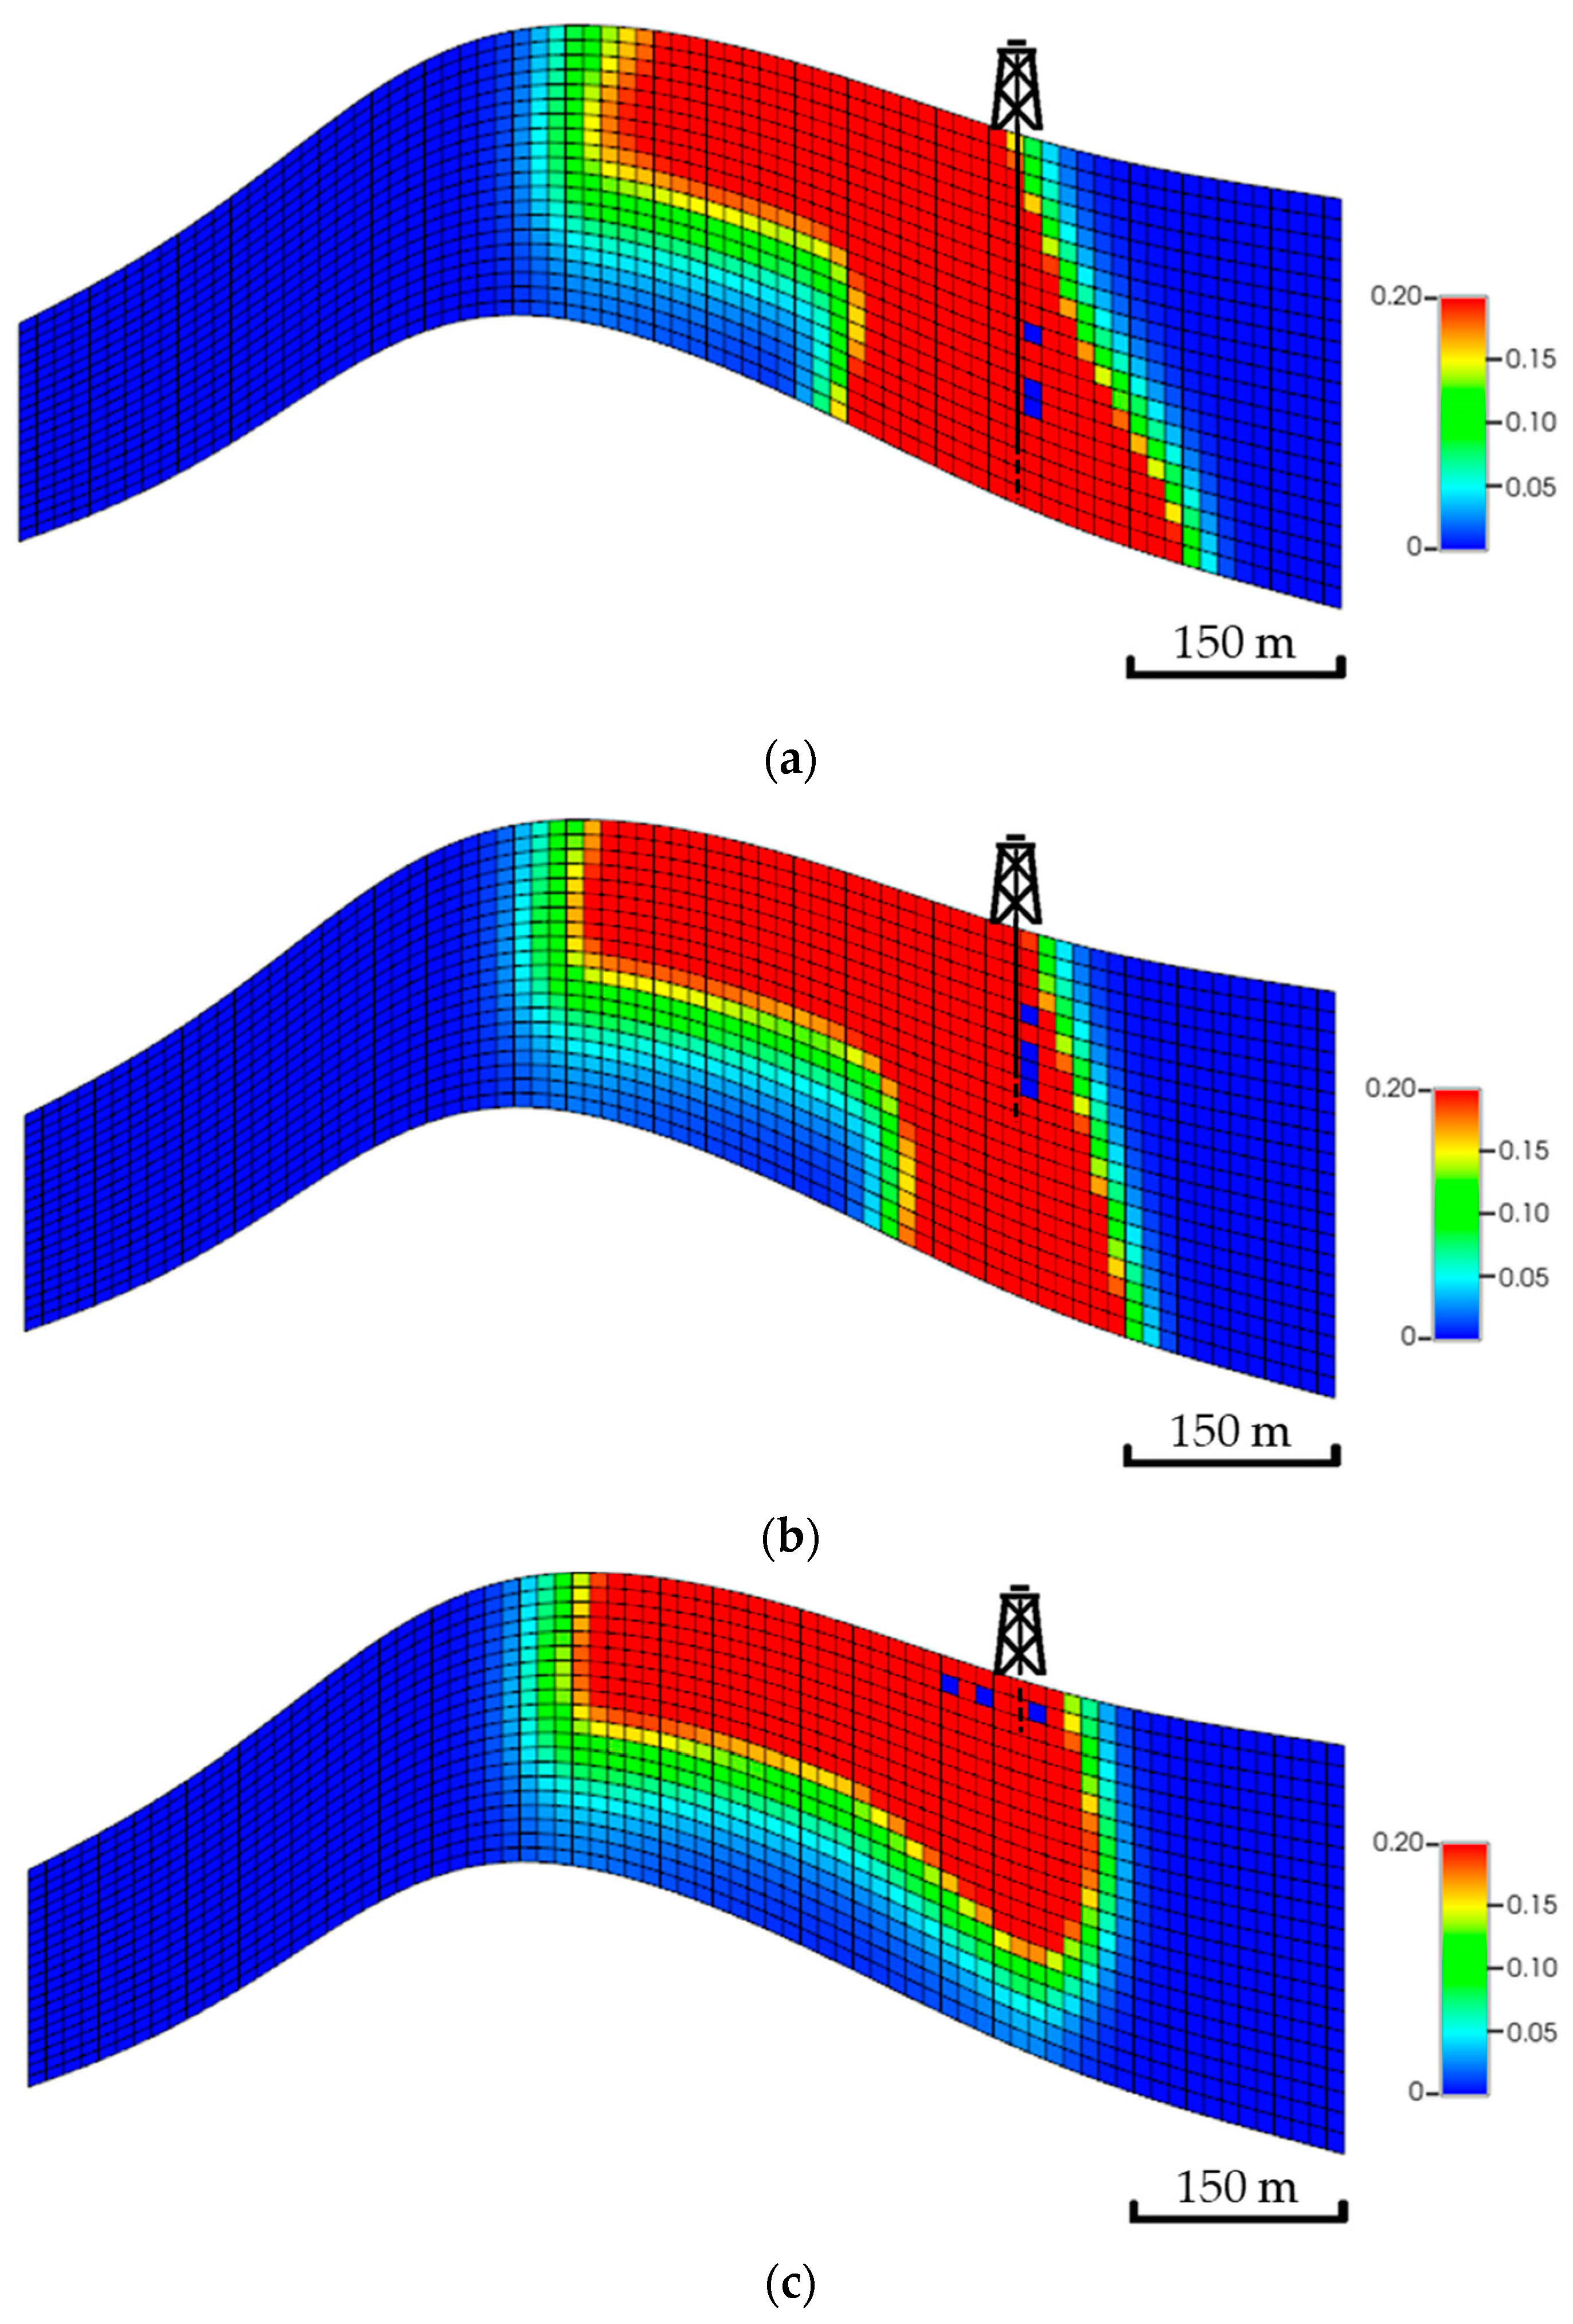
Theoretically, injecting the CO2 into the bottom zones enables it to possibly get more exposure to the aquifer volume (i.e., higher swept volume). The developed scenarios examine if injecting at different zones could lead to potential impacts on the plume migration path. Figure 15 shows a side view of the global mole fractions for all scenarios. Unlike the top zone injection, the bottom zone allows the CO2 to have more contact with the formation as well as the fluids, yielding a higher possibility of dissolving and trapping the injected CO2. Eventually, the overall plume extension implies that the landing zone could define its shape, specifically when neglecting the bottom zones, due to the significant wasted opportunity around the wellbore.
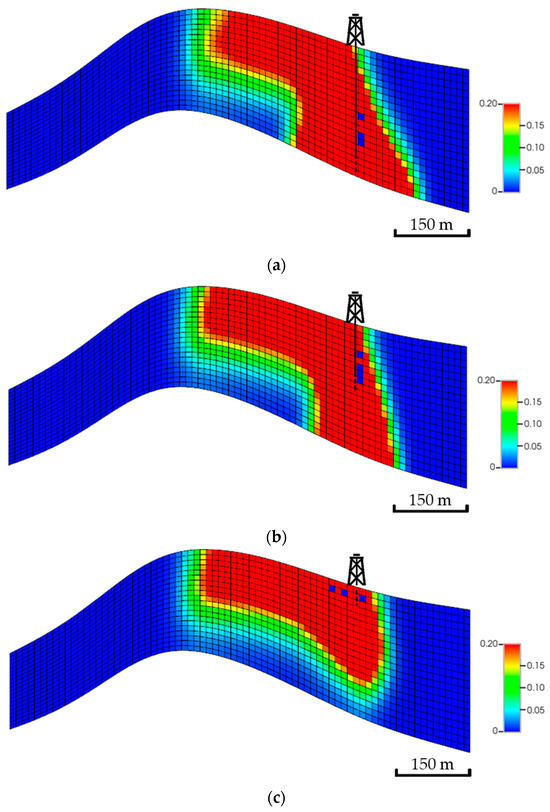
Figure 15.
Side view of the CO2 global mole fractions when injecting the CO2 at multiple zones. (a) Bottom zone injection; (b) Middle zone injection; (c) Top zone injection.
3.2. Natural Fractures Network Influence
The three fracture network realizations aid in analyzing the fracture roles across different layers. The generated scenarios reflect the trapping mechanisms within the fractures throughout the storage process. The natural fractures around the wellbore region provide significantly faster corridors to transport the CO2 from the bottom to the top of the aquifer. However, the free CO2 has the potential to dissolve across the fracture path either laterally or vertically when it encounters fractures away from the wellbore. Figure 16 illustrates the global mole fraction in the fractures throughout the migration path. Additionally, the fractures have a noticeable impact in the earlier stages but a negligible impact on the plume shape in the long term, as demonstrated in Figure 17.
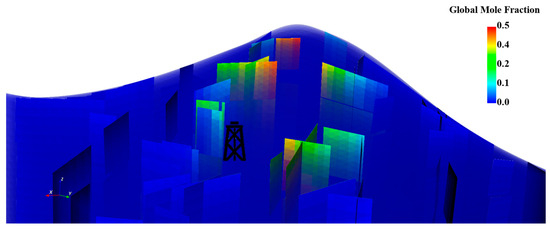
Figure 16.
Global mole fraction distribution in the fractures for the first realization where fractures intersect all the layers.
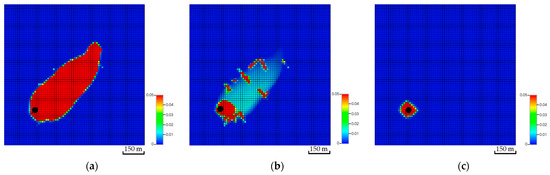
Figure 17.
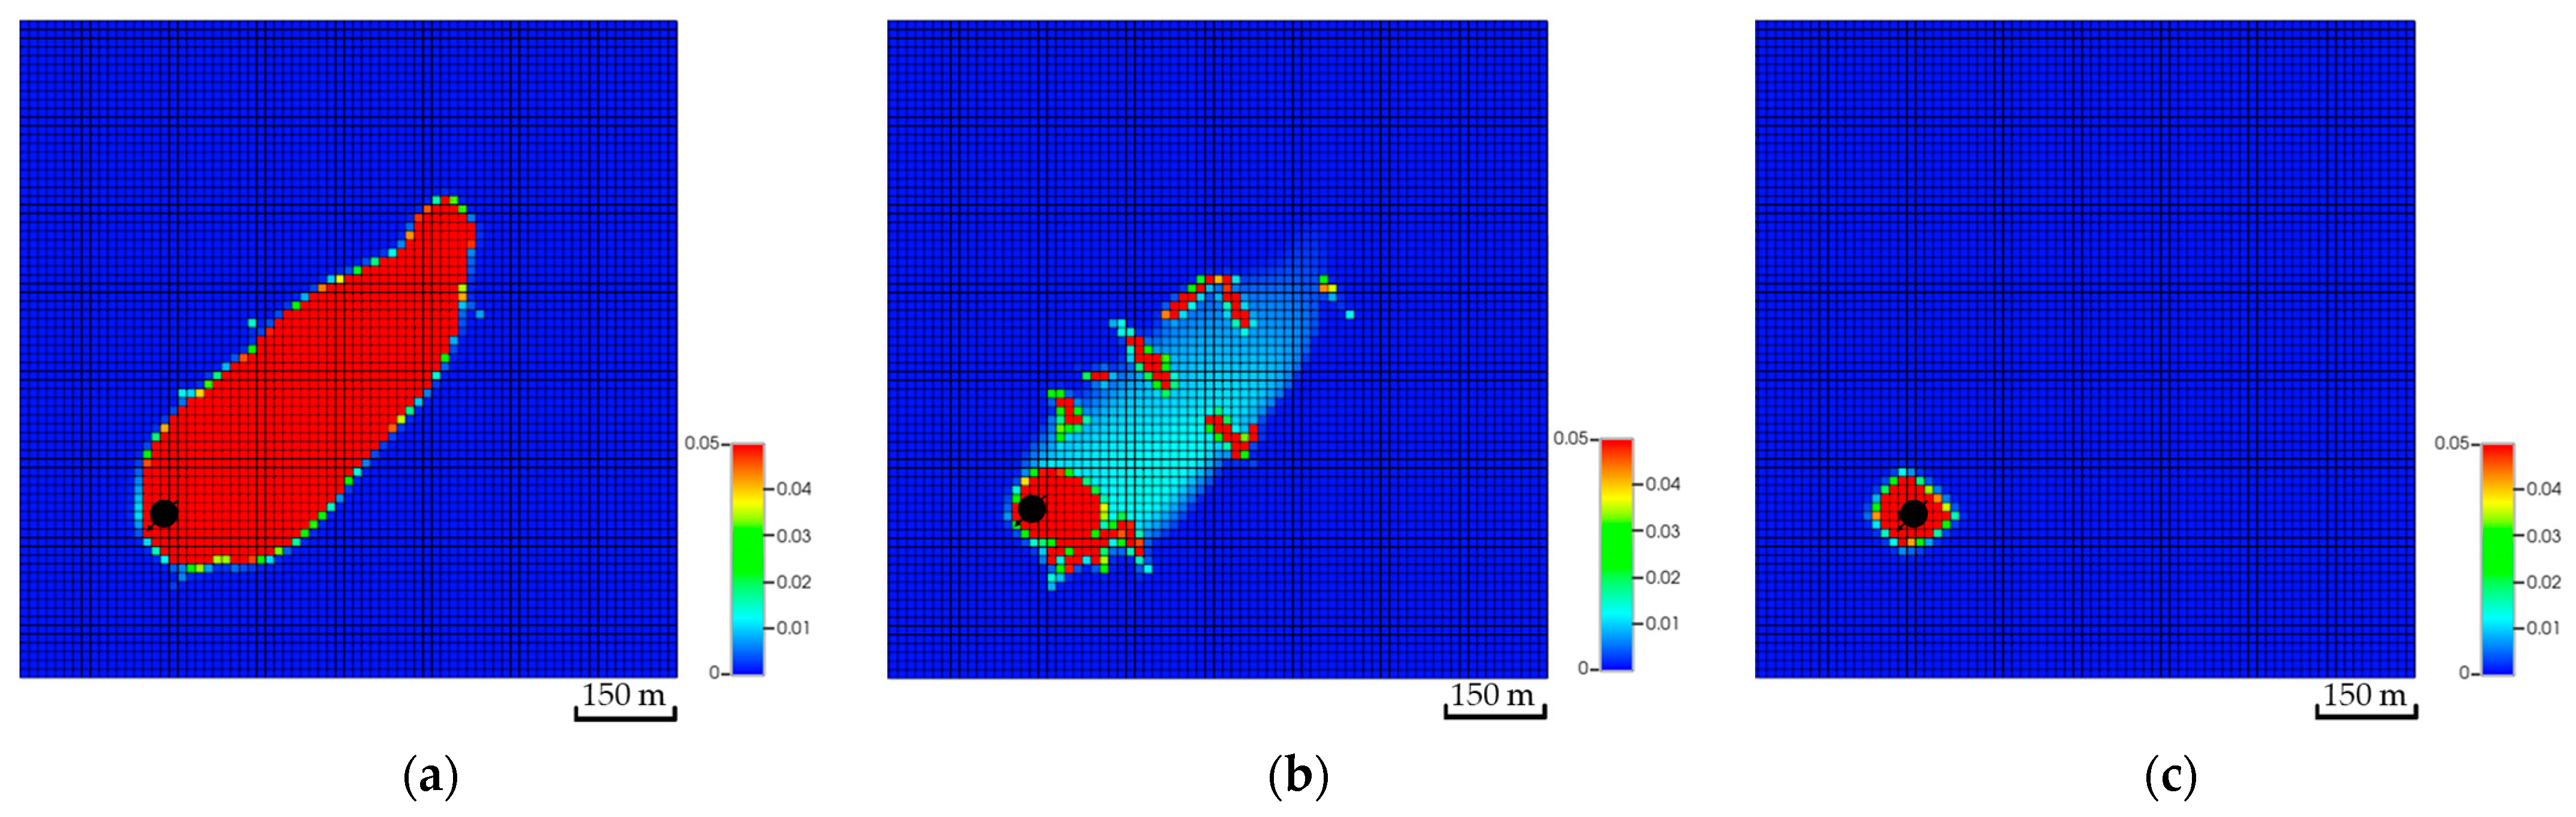
Global CO2 mole fraction distributions after ten years of injection across multiple layers while incorporating the first natural fracture network realization. (a) The 1st layer; (b) The 5th layer; (c) The 20th layer.
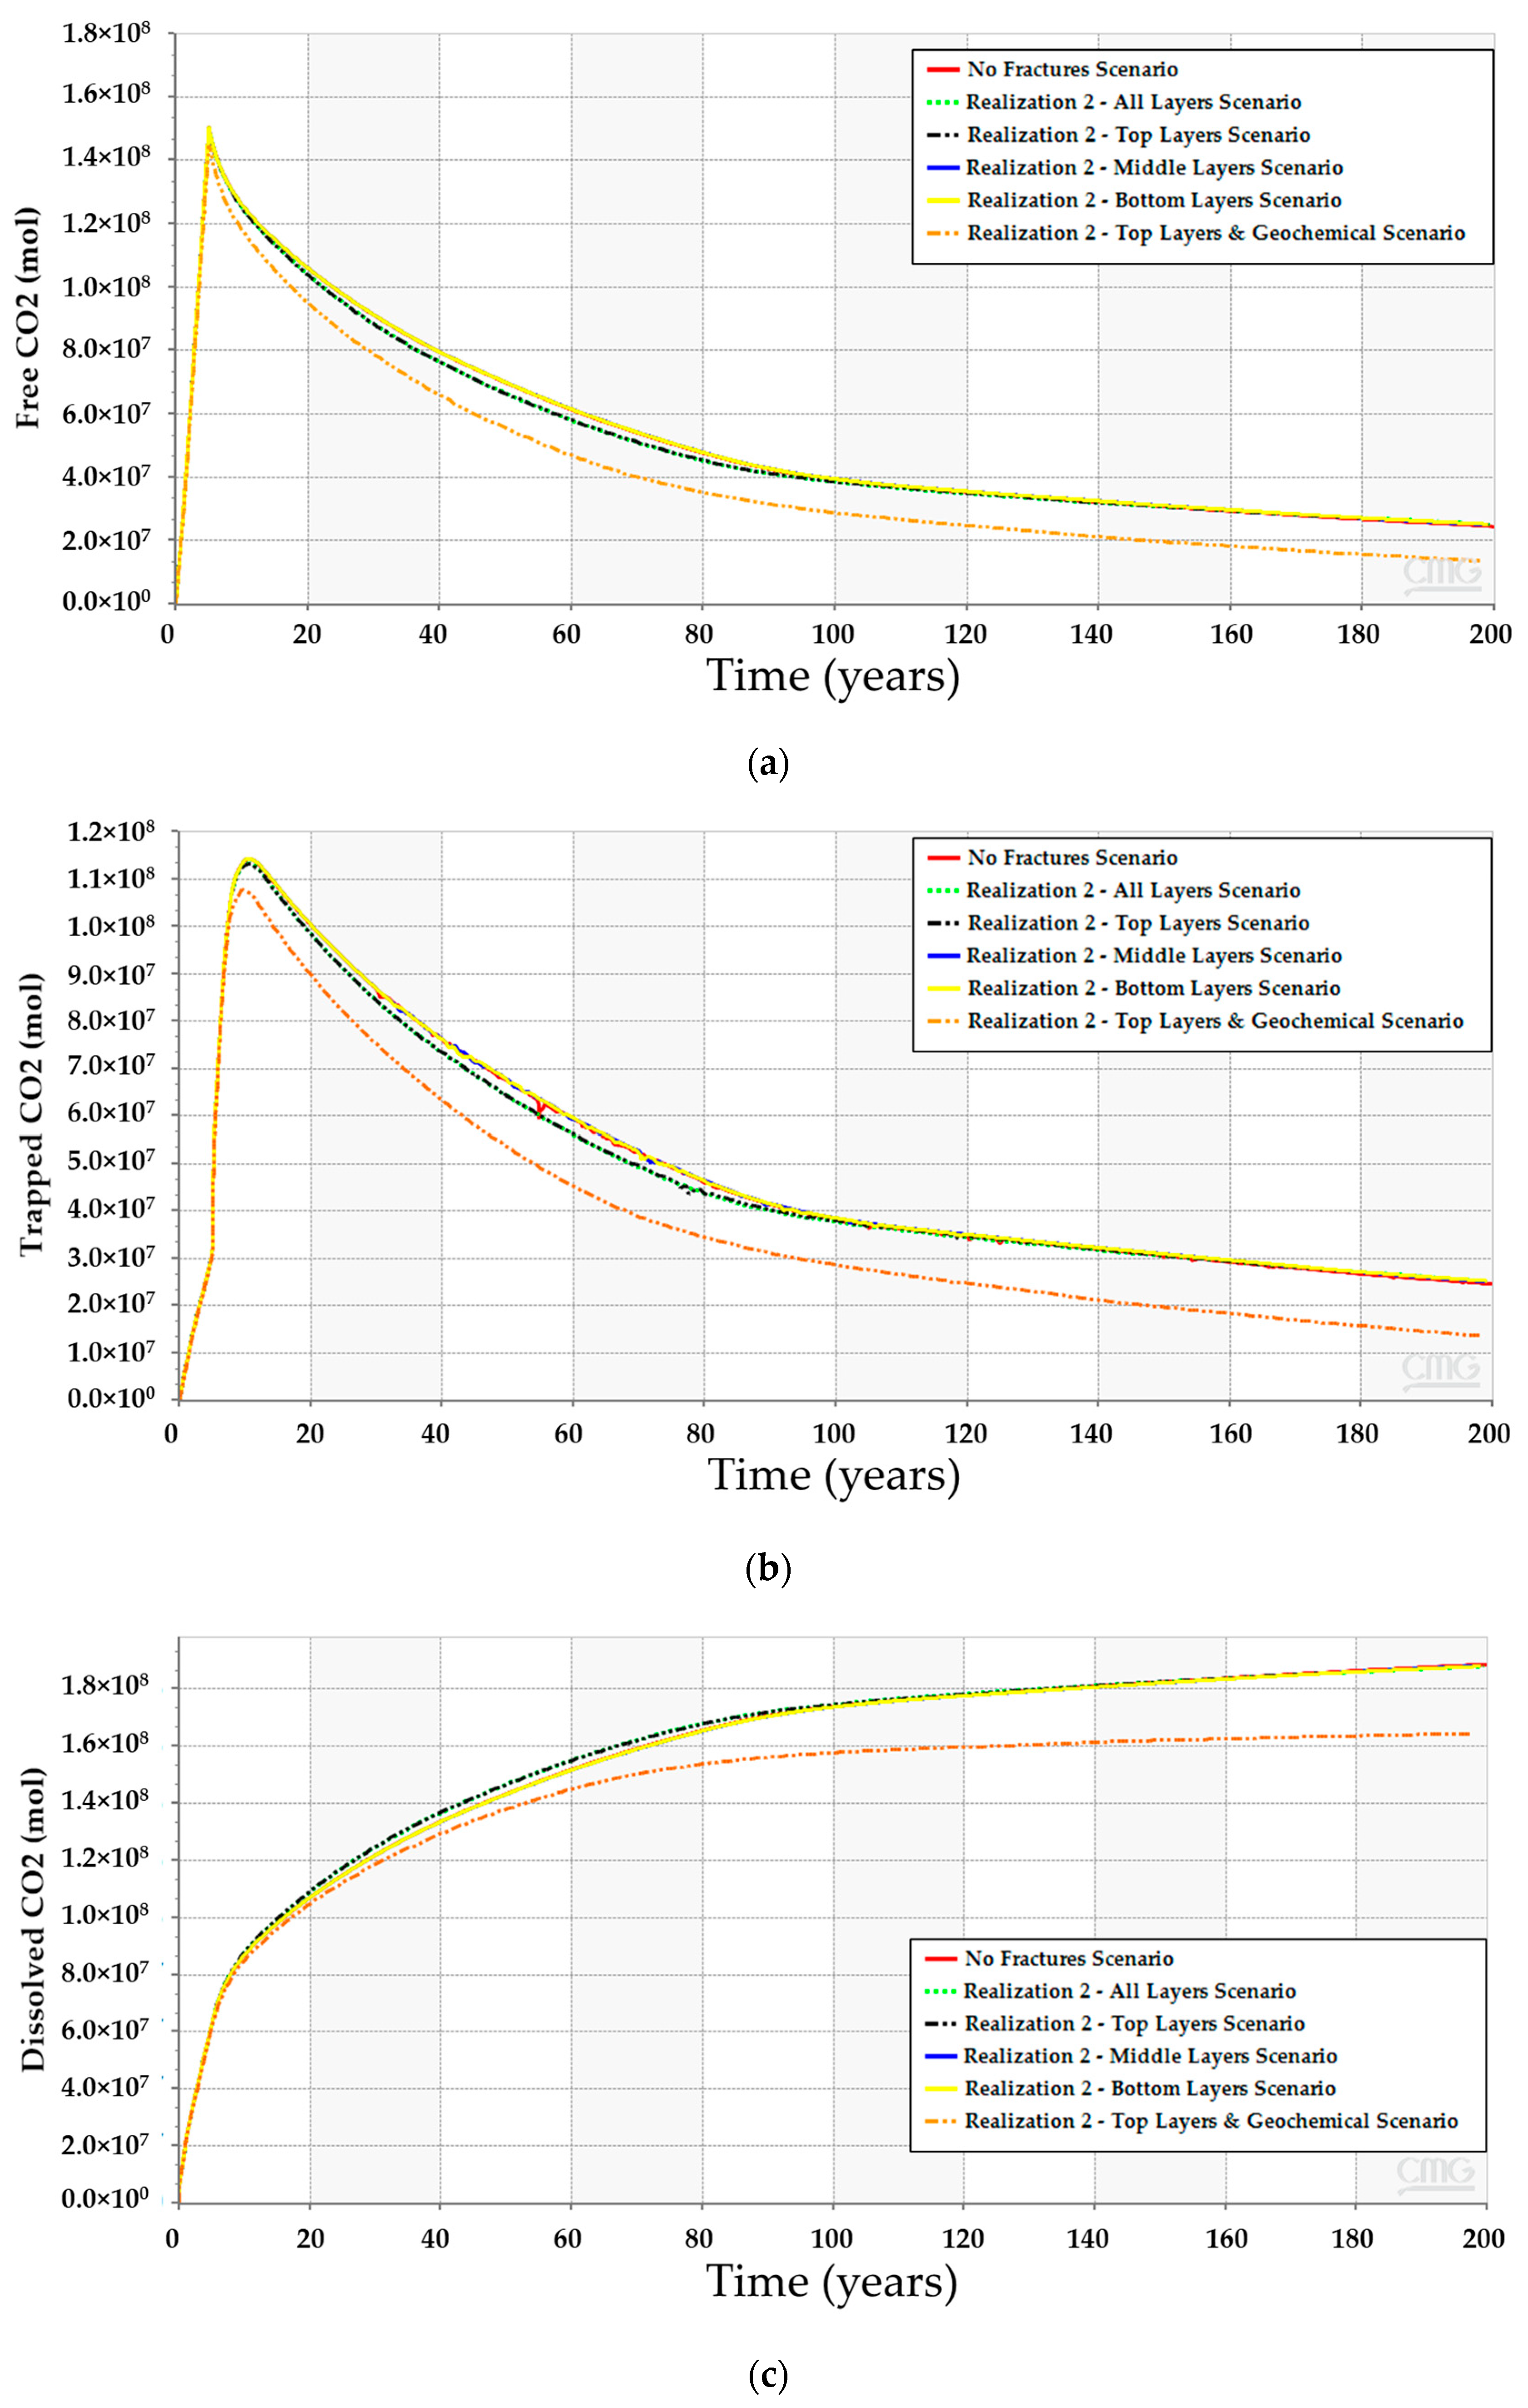
The vertical extension of fractures plays a major role in the CO2 distribution, specifically when the fractures are located away from the wellbore. The free CO2 eventually moves to the top of the reservoir since it is lighter than the saline water. Consequently, any fracture that crosses the top layers could interrupt the migration path. It is crucial to consider that the aquifer bottom layers tend to transport trapped and dissolved CO2 while the free CO2 remains in the top layers, as reflected in Figure 18. In the long term, the results for all scenarios suggest that all fracture network intensities and extensions yield comparable CO2 amounts, as shown in Table 3. The major role of the fractures, however, can be noticeable in the short term when the fractures either extend across all the layers or are limited to the top layers, allowing them to dissolve a relatively higher volume of CO2 and trap less volume (see Figure 19). Therefore, natural fractures should have a negligible contribution to the overall CO2 migration path while altering the dissolved CO2 distribution if some fractures cross in the top layers.
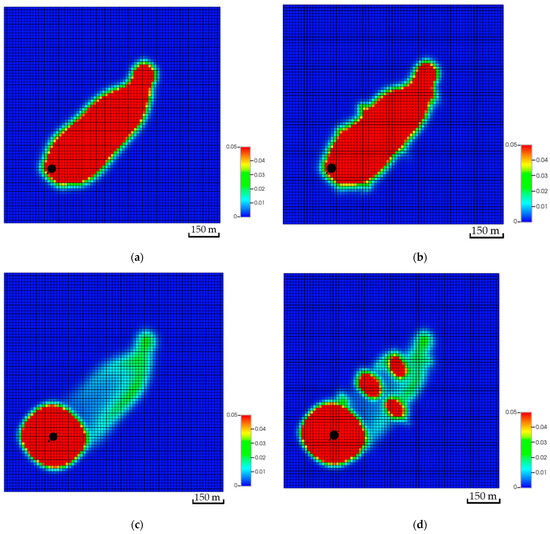
Figure 18.
Comparison between the global mole fraction distributions after 200 years with and without a natural fracture network. (a) Top of the aquifer excluding the natural fracture network; (b) Top of the aquifer with the natural fracture network; (c) Bottom of the aquifer excluding the natural fracture network; (d) Bottom of the aquifer with the natural fracture network.
Table 3.
Total CO2 moles with different fracture network realizations.
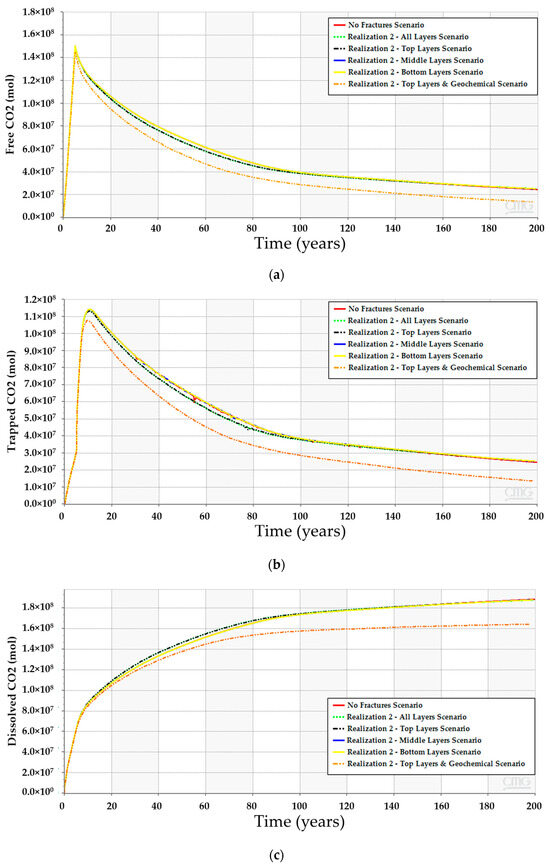
Figure 19.
CO2 quantities when incorporating fractures in the simulation model. (a) Free CO2; (b) Trapped CO2; (c) Dissolved CO2.
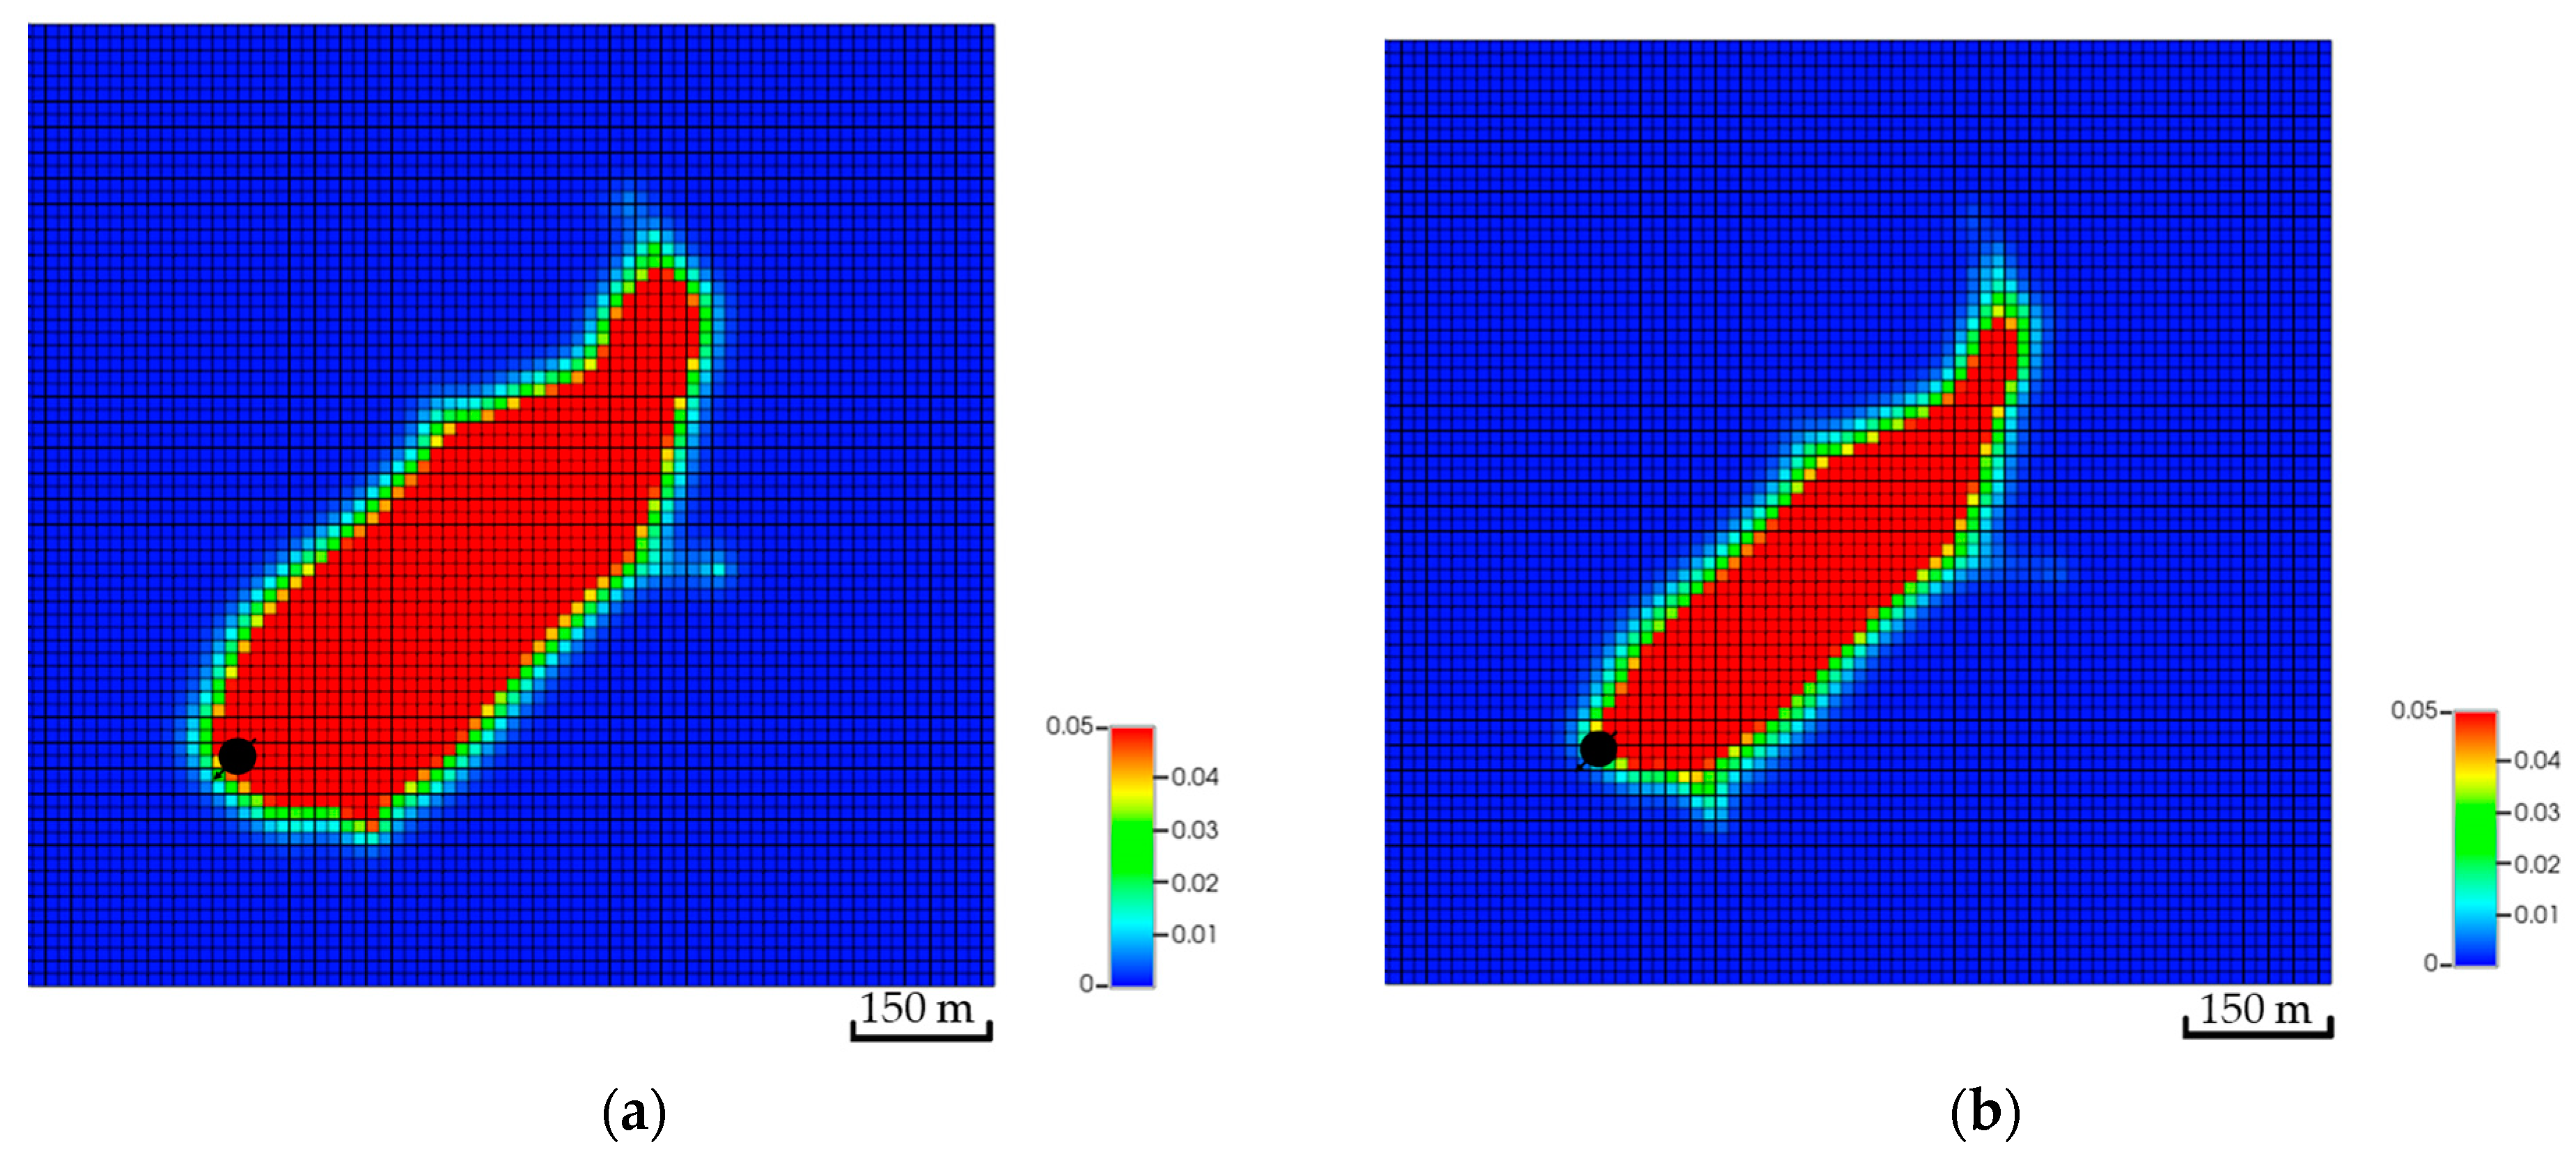
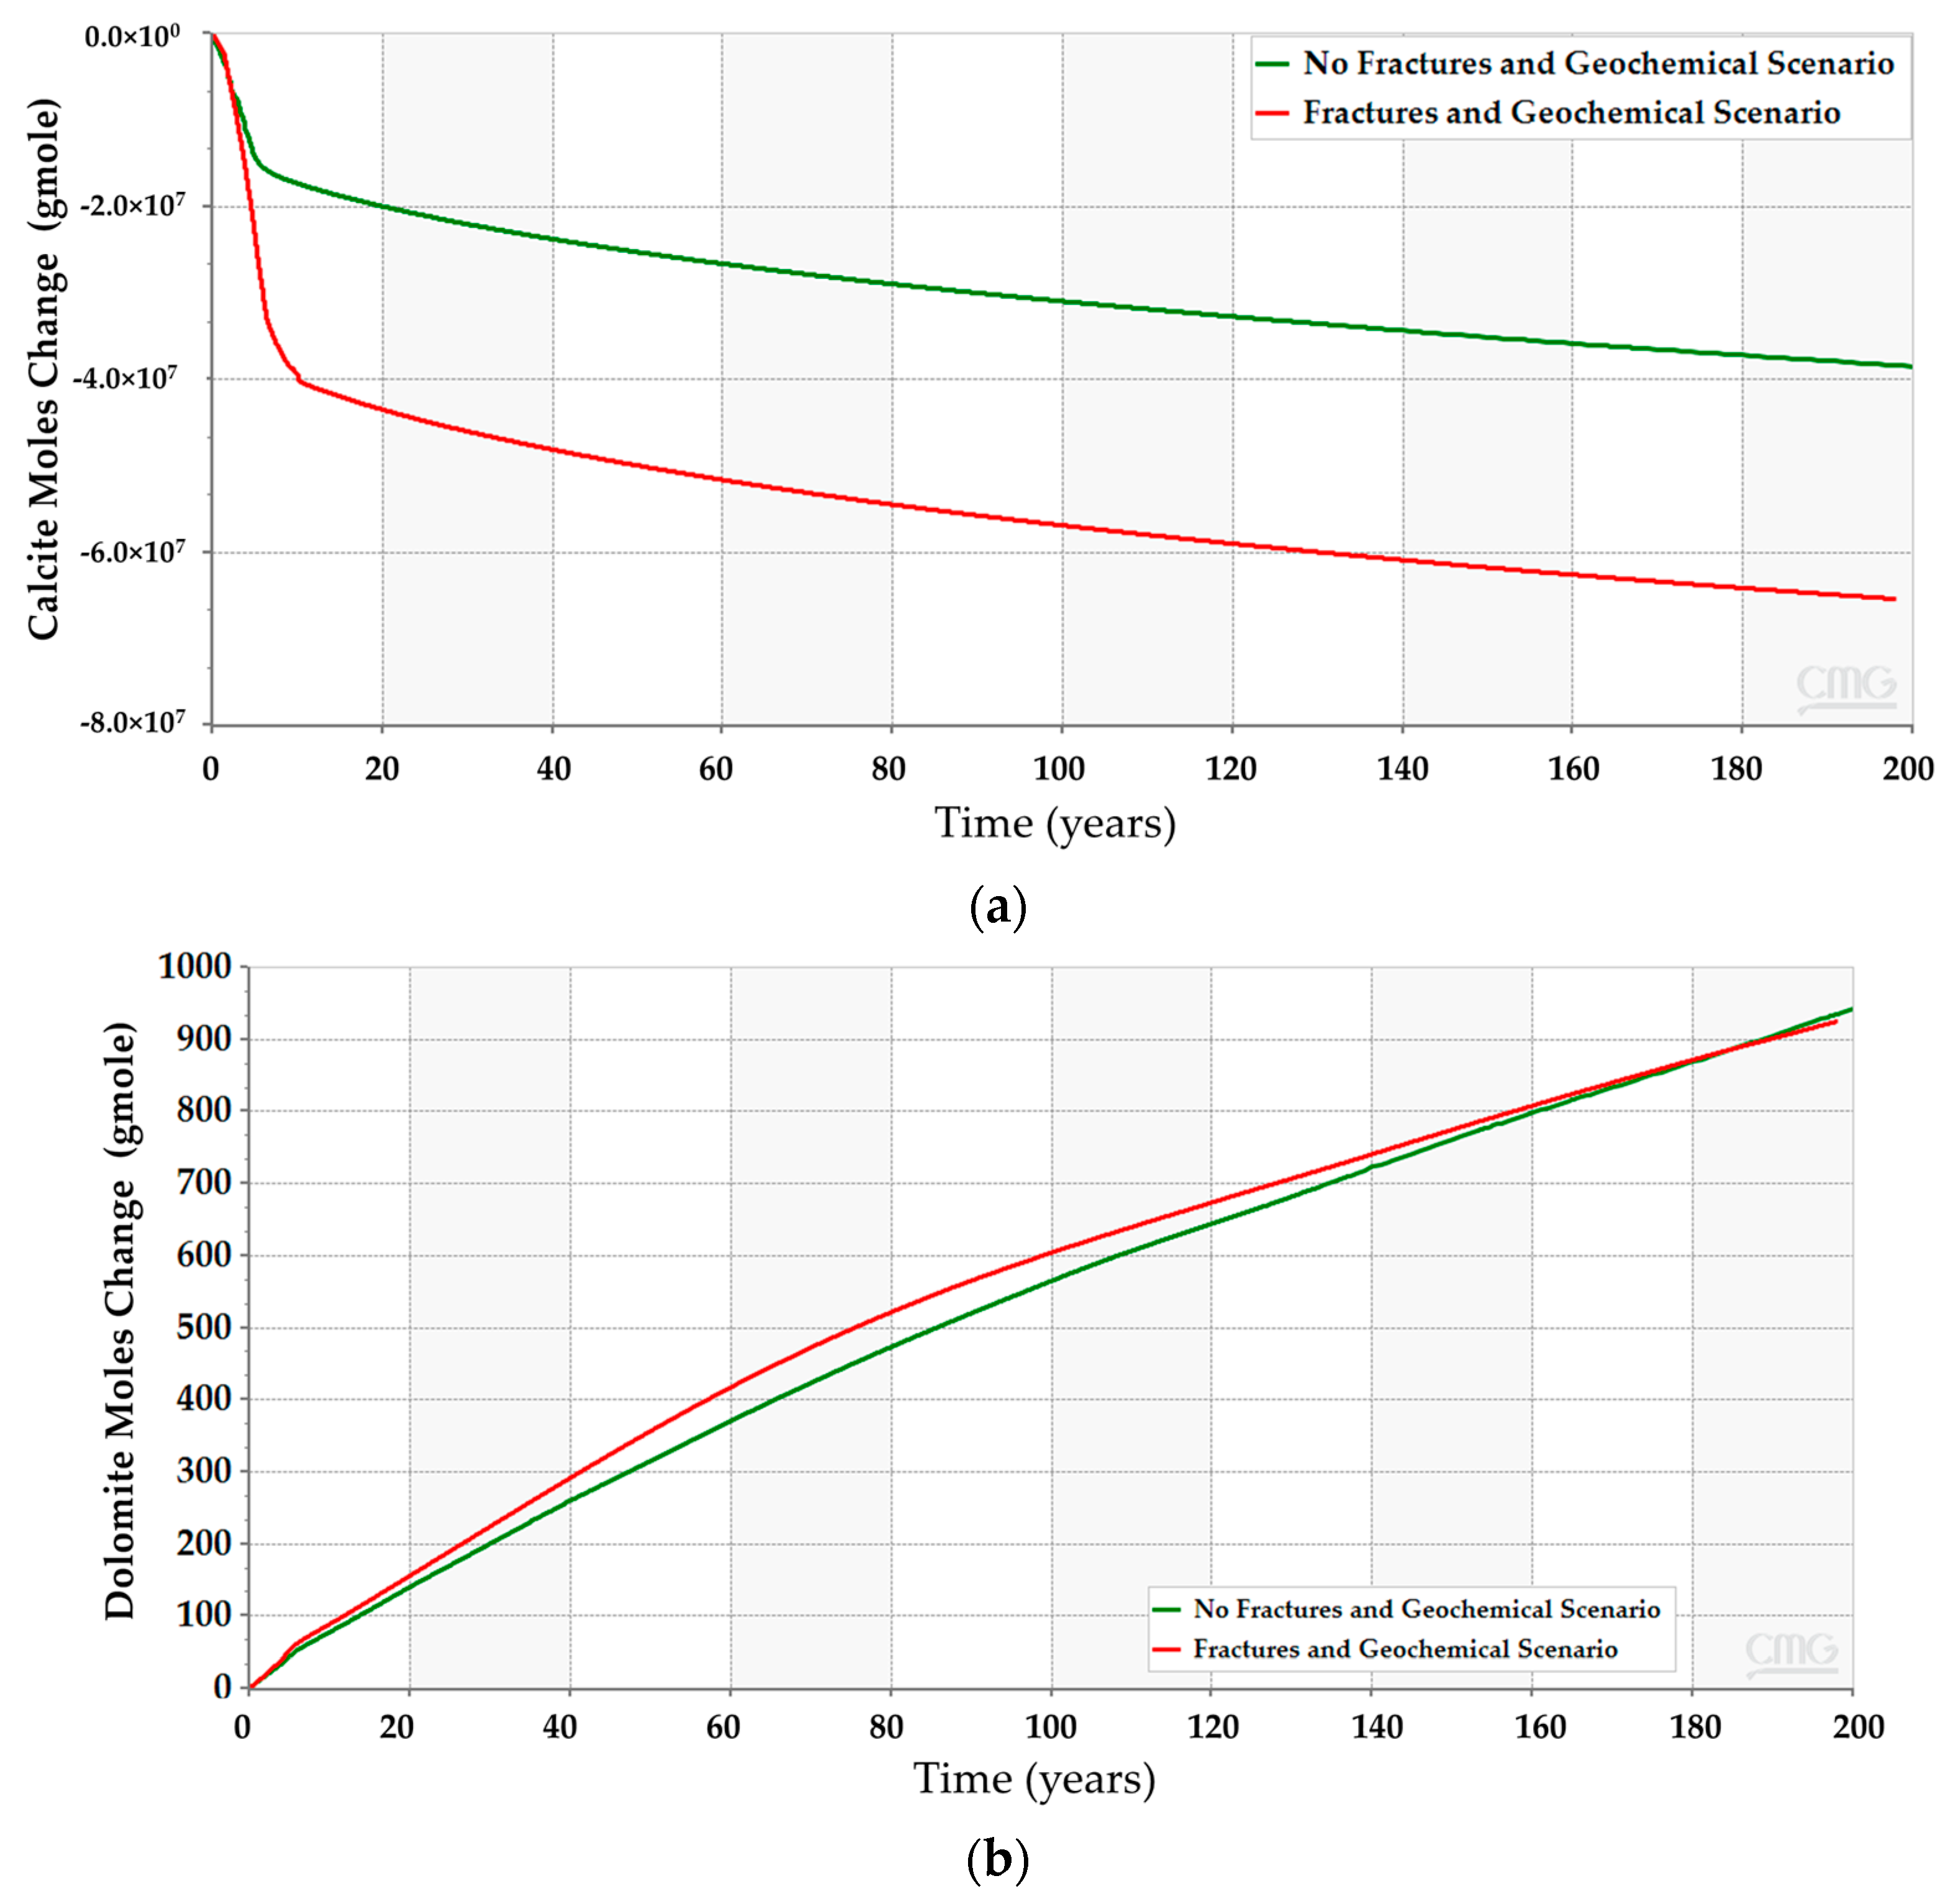
Incorporating the geochemical reactions in the fractured scenarios yields a comparable trend to the geochemical scenarios without the fractures (see Figure 12 and Figure 19). The dissolved CO2 exhibits similar behavior to the low-dip scenario, where the dissolved volume is reduced compared to the scenarios that exclude the geochemical reactions. The similarities can be related to the similar well placement resulting in similar plume migration paths. Since the overall CO2 quantities decrease, the plume size should shrink due to the interactions with the minerals. Figure 20 demonstrates the expected changes when including the geochemical reactions. Moreover, the dolomite precipitation across the aquifer shows that the fracture network expedites the dolomitization process only in the short term, as represented in Figure 21. On the other hand, the overall calcite dissolution will be higher with the presence of fractures. The impact relates to the faster exposure to the aquifer’s minerals due to the fracture network presence. Ultimately, the fracture network reduces the CO2 quantities by capitalizing on the mineral trapping.
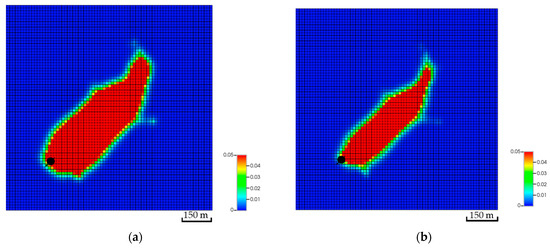
Figure 20.
Top view of the CO2 global mole fraction for the second fracture network realization. (a) The CO2 plume excluding the geochemical reactions; (b) The CO2 plume with the geochemical reactions.
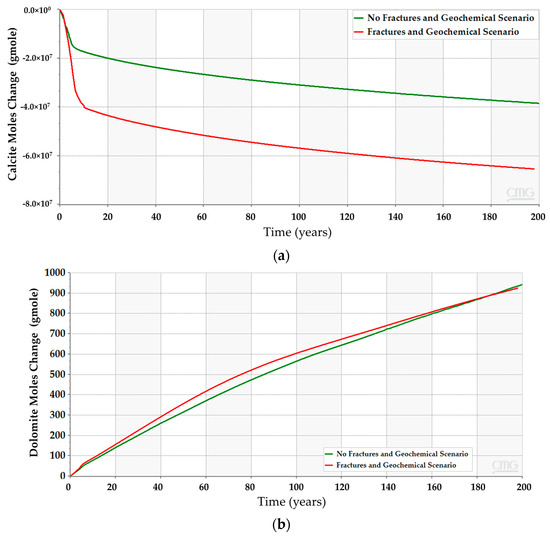
Figure 21.
Chemical reactions outcome due to CO2 and minerals interactions when incorporating natural fractures in the simulation model. (a) Calcite dissolution; (b) Dolomite precipitation.
4. Conclusions
CO2 sequestration will definitively contribute to reducing the GHG concentrations in the atmosphere by safely storing it in subsurface formations. The study suggests that the optimum well placement should be in a relatively low-dip region. Furthermore, the injection zones aid in defining the CO2 plume shape since it has the potential to influence the trapping mechanisms. Due to the maximum vertical exposure, injecting in the bottom zones enables the CO2 to optimize its distribution. In addition to the injection zone, tortuosity can impede the path of the CO2 plume but will eventually yield a similar plume. Incorporating the natural fracture realizations into the developed model reveals that the CO2 mainly utilizes the fractures, which extend into the top of the formation, to dissolve relatively higher volumes in the early stages. However, the overall CO2 quantities should not significantly be impacted after 200 years. Unlike the natural fracture network, the geochemical reactions will alter the amount of CO2 in different forms because of the calcite dissolution and dolomite precipitation.
The injection well distance and tortuosity should be further analyzed to capture the heterogeneity roles in the trapping mechanisms. Additionally, an investigation of the well’s injectivity must be incorporated for long-term injection, specifically with intermittent injection, since the mineralization could alter the injectivity. Incorporating X-ray diffraction (XRD) and mineral analysis should be considered in future work with geochemical reactions to provide a better depiction of the CO2 plume migration. This study highlights a workflow and optimization process that can be extended to obtain optimum storage by capitalizing on detailed structural models, reservoir properties, and mineralogy.
Author Contributions
Conceptualization, A.K.A.M. and M.D.; methodology, A.K.A.M., M.D. and K.S.; software, A.K.A.M.; validation, A.K.A.M., M.D. and K.S.; formal analysis, A.K.A.M.; investigation, A.K.A.M.; resources, A.K.A.M., M.D. and K.S.; data curation, A.K.A.M.; writing—original draft preparation, A.K.A.M.; writing—review and editing, M.D. and K.S.; visualization, A.K.A.M.; supervision, M.D. and K.S.; project administration, M.D. and K.S.; funding acquisition, M.D. and K.S. All authors have read and agreed to the published version of the manuscript.
Funding
This research received no external funding.
Data Availability Statement
The original contributions presented in this study are included in the article. Further inquiries can be directed to the corresponding author.
Conflicts of Interest
The authors declare no conflicts of interest.
References
- Dhakal, S.; Minx, J.C.; Toth, F.L. Emissions Trends and Drivers. In IPCC, 2022: Climate Change 2022—Mitigation of Climate Change; Cambridge University Press: Cambridge, UK; New York, NY, USA, 2023; pp. 215–294. [Google Scholar]
- U.S. Environmental Protection Agency (EPA). Inventory of U.S. Greenhouse Gas Emissions and Sinks: 1990–2022—EPA 430-R-24-004; EPA: Washington, DC, USA, 2024.
- Kuh, K.F. The Law of Climate Change Mitigation: An Overview. Encycl. Anthr. 2017, 1–5, 505–510. [Google Scholar] [CrossRef]
- Butnar, I.; Cronin, J.; Pye, S. Review of Carbon Capture Utilisation and Carbon Capture and Storage in Future EU Decarbonisation Scenarios; UCL Energy Institute: London, UK, 2020. [Google Scholar]
- Paltsev, S.; Morris, J.; Kheshgi, H.; Herzog, H. Hard-to-Abate Sectors: The Role of Industrial Carbon Capture and Storage (CCS) in Emission Mitigation. Appl. Energy 2021, 300, 117322. [Google Scholar] [CrossRef]
- Peridas, G.; Mordick Schmidt, B. The Role of Carbon Capture and Storage in the Race to Carbon Neutrality. Electr. J. 2021, 34, 106996. [Google Scholar] [CrossRef]
- Prepared by Working Group III of the Intergovernmental Panel on Climate Change; Metz, B.; Davidson, O.; Coninck, H.D.; Loos, M.; Meyer, L. IPCC Special Report on Carbon Dioxide Capture and Storage; Cambridge University Press: Cambridge, UK, 2005. [Google Scholar]
- Furre, A.K.; Eiken, O.; Alnes, H.; Vevatne, J.N.; Kiær, A.F. 20 Years of Monitoring CO2-Injection at Sleipner. Energy Procedia 2017, 114, 3916–3926. [Google Scholar] [CrossRef]
- Snæbjörnsdóttir, S.Ó.; Sigfússon, B.; Marieni, C.; Goldberg, D.; Gislason, S.R.; Oelkers, E.H. Carbon Dioxide Storage through Mineral Carbonation. Nat. Rev. Earth Environ. 2020, 1, 90–102. [Google Scholar] [CrossRef]
- Ehrenberg, S.N.; Nadeau, P.H. Sandstone vs. Carbonate Petroleum Reservoirs: A Global Perspective on Porosity-Depth and Porosity-Permeability Relationships. Am. Assoc. Pet Geol. Bull. 2005, 89, 435–445. [Google Scholar] [CrossRef]
- Hosa, A.; Esentia, M.; Stewart, J.; Haszeldine, S. Injection of CO2 into Saline Formations: Benchmarking Worldwide Projects. Chem. Eng. Res. Des. 2011, 89, 1855–1864. [Google Scholar] [CrossRef]
- Eiken, O.; Ringrose, P.; Hermanrud, C.; Nazarian, B.; Torp, T.A.; Høier, L. Lessons Learned from 14 Years of CCS Operations: Sleipner, In Salah and Snøhvit. Energy Procedia 2011, 4, 5541–5548. [Google Scholar] [CrossRef]
- Bourne, S.; Crouch, S.; Smith, M. A Risk-Based Framework for Measurement, Monitoring and Verification of the Quest CCS Project, Alberta, Canada. Int. J. Greenh. Gas Control 2014, 26, 109–126. [Google Scholar] [CrossRef]
- Loring, J.S.; Miller, Q.R.S.; Thompson, C.J.; Schaef, H.T. Experimental Studies of Reactivity and Transformations of Rocks and Minerals in Water-Bearing Supercritical CO2. In Science of Carbon Storage in Deep Saline Formations; Elsevier: Amsterdam, The Netherlands, 2019; pp. 63–88. [Google Scholar]
- Rackley, S.A. Mineral Carbonation. In Carbon Capture and Storage; Elsevier: Amsterdam, The Netherlands, 2017; pp. 253–282. [Google Scholar]
- Kim, M.; Kim, K.; Han, W.S.; Oh, J.; Park, E. Density-Driven Convection in a Fractured Porous Media: Implications for Geological CO2 Storage. Water Resour. Res. 2019, 55, 5852–5870. [Google Scholar] [CrossRef]
- Iding, M.; Ringrose, P. Evaluating the Impact of Fractures on the Performance of the In Salah CO2 Storage Site. Int. J. Greenh. Gas Control 2010, 4, 242–248. [Google Scholar] [CrossRef]
- Sohal, M.A.; Le Gallo, Y.; Audigane, P.; de Dios, J.C.; Rigby, S.P. Effect of Geological Heterogeneities on Reservoir Storage Capacity and Migration of CO2 Plume in a Deep Saline Fractured Carbonate Aquifer. Int. J. Greenh. Gas Control 2021, 108, 103306. [Google Scholar] [CrossRef]
- Parkhurst, D.L.; Thorstenson, D.C.; Plummer, N. PHREEQE: A Computer Program for Geochemical Calculations; US Geological Survey, Water Resources Division: Reston, VA, USA, 1980.
- TOUGHREACT. Available online: https://tough.lbl.gov/software/toughreact_v4-13-omp/ (accessed on 11 December 2024).
- Lasaga, A.C. Chemical Kinetics of Water-rock Interactions. J. Geophys. Res. Solid Earth 1984, 89, 4009–4025. [Google Scholar] [CrossRef]
- Li, Y.; Nghiem, L.X. Phase Equilibria of Oil, Gas and Water/Brine Mixtures from a Cubic Equation of State and Henry’s Law. Can. J. Chem. Eng. 1986, 64, 486–496. [Google Scholar] [CrossRef]
- Wang, P.; Stenby, E.H. Phase Equilibrium Calculation in Compositional Reservoir Simulation. Comput. Chem. Eng. 1992, 16, S449–S456. [Google Scholar] [CrossRef]
- Licbinska, M.; Labus, K.; Klempa, M.; Matysek, D.; Vasek, M. Laboratory Experiments and Geochemical Modeling of Gas–Water–Rock Interactions for a CO2 Storage Pilot Project in a Carbonate Reservoir in the Czech Republic. Minerals 2024, 14, 602. [Google Scholar] [CrossRef]
- Lyu, X.; Voskov, D. Advanced Modeling of Enhanced CO2 Dissolution Trapping in Saline Aquifers. Int. J. Greenh. Gas Control 2023, 127, 103907. [Google Scholar] [CrossRef]
- Ranganathan, P.; Van Hemert, P.; Rudolph, E.S.J.; Zitha, P.Z.J. Numerical Modeling of CO2 Mineralisation during Storage in Deep Saline Aquifers. Energy Procedia 2011, 4, 4538–4545. [Google Scholar] [CrossRef]
- Anchliya, A.; Ehlig-Economides, C.; Jafarpour, B. Aquifer Management To Accelerate CO2 Dissolution and Trapping. SPE J. 2012, 17, 805–816. [Google Scholar] [CrossRef]
- Computer Modelling Group Ltd. CMG-GEM Compositional & Unconventional Simulator (Version 2023.30). Available online: https://www.cmgl.ca/solutions/software/gem/ (accessed on 7 November 2024).
- Machado, M.V.B.; Khanal, A.; Delshad, M. Unveiling the Essential Parameters Driving Mineral Reactions during CO2 Storage in Carbonate Aquifers through Proxy Models. Appl. Sci. 2024, 14, 1465. [Google Scholar] [CrossRef]
- Bennion, D.B.; Bachu, S. Drainage and Imbibition Relative Permeability Relationships for Supercritical CO2/Brine and H2S/Brine Systems in Intergranular Sandstone, Carbonate, Shale, and Anhydrite Rocks. SPE Reserv. Eval. Eng. 2008, 11, 487–496. [Google Scholar] [CrossRef]
- Carlson, F.M. Simulation of Relative Permeability Hysteresis to the Nonwetting Phase. In Proceedings of the SPE Annual Technical Conference and Exhibition, San Antonio, TX, USA, 4–7 October 1981. [Google Scholar]
- Land, C.S. Calculation of Imbibition Relative Permeability for Two- and Three-Phase Flow From Rock Properties. Soc. Pet. Eng. J. 1968, 8, 149–156. [Google Scholar] [CrossRef]
- Burnside, N.M.; Naylor, M. Review and Implications of Relative Permeability of CO2/Brine Systems and Residual Trapping of CO2. Int. J. Greenh. Gas Control 2014, 23, 1–11. [Google Scholar] [CrossRef]
- Li, L.; Lee, S.H. Efficient Field-Scale Simulation of Black Oil in a Naturally Fractured Reservoir Through Discrete Fracture Networks and Homogenized Media. SPE Reserv. Eval. Eng. 2008, 11, 750–758. [Google Scholar] [CrossRef]
- Moinfar, A.; Varavei, A.; Sepehrnoori, K.; Johns, R.T. Development of an Efficient Embedded Discrete Fracture Model for 3D Compositional Reservoir Simulation in Fractured Reservoirs. SPE J. 2014, 19, 289–303. [Google Scholar] [CrossRef]
- Sepehrnoori, K.; Xu, Y.; Yu, W. Embedded Discrete Fracture Modeling and Application in Reservoir Simulation; Elsevier: Amsterdam, The Netherlands, 2020. [Google Scholar]
- Poli, R.E.B.; Barbosa Machado, M.V.; Sepehrnoori, K. Advancements and Perspectives in Embedded Discrete Fracture Models (EDFM). Energies 2024, 17, 3550. [Google Scholar] [CrossRef]
- Barbosa Machado, M.V.; Delshad, M.; Sepehrnoori, K. A Computationally Efficient Approach to Model Reactive Transport during CO2 Storage in Naturally Fractured Saline Aquifers. Geoenergy Sci. Eng. 2024, 236, 212768. [Google Scholar] [CrossRef]


Disclaimer/Publisher’s Note: The statements, opinions and data contained in all publications are solely those of the individual author(s) and contributor(s) and not of MDPI and/or the editor(s). MDPI and/or the editor(s) disclaim responsibility for any injury to people or property resulting from any ideas, methods, instructions or products referred to in the content. |
© 2025 by the authors. Licensee MDPI, Basel, Switzerland. This article is an open access article distributed under the terms and conditions of the Creative Commons Attribution (CC BY) license (https://creativecommons.org/licenses/by/4.0/).