1. Introduction
The global shift toward sustainable energy solutions has intensified the need for reliable and efficient renewable energy systems. However, the intermittency and variability of renewable sources, particularly solar energy, present challenges for a consistent energy supply. To address these limitations, technologies that enable the simultaneous generation of electricity and heat have gained increasing attention. Among them, photovoltaic–thermal (PVT) systems offer a promising solution by combining photovoltaic (PV) modules with solar thermal collectors. This hybrid approach maximizes the utilization of solar energy, resulting in higher overall conversion efficiency compared to standalone PV or solar thermal systems [
1].
The main advantage of PVT systems lies in their ability to recover waste heat from the PV modules, which can be used for domestic hot water heating or as a low-temperature heat source for heat pumps [
2]. Several studies have confirmed this benefit. For instance, Luboń et al. [
3] reported that thermal energy recovered from a PVT panel accounted for approximately 40% of the total energy supplied to an air-source heat pump during operation and up to 60% when the compressor was inactive. Additionally, active cooling improved electricity generation by around 5% annually.
Despite numerous publications on PVT systems, much of the existing research is based on short-term experiments or simulation studies that do not adequately represent seasonal or real-life operating conditions. For example, Yildirim and Cebula [
4] presented two-day measurements of a PVT and a PV module in the moderate climate of Kraków, Poland, where the PVT module produced 5.3 kWh of electricity and 19.6 kWh of heat, outperforming the uncooled PV module, which produced 4.7 kWh of electricity. Similarly, Zhou et al. [
5] tested a 7.56 kWp PVT system with 36 modules and reported daily outputs of 32 kWh (electricity) and 288 MJ (thermal).
Longer-term studies are less common but provide valuable insights. Barbu et al. [
6] monitored a PVT system from May to July and observed that electricity generation was consistently higher in cooled panels, especially in July when overheating was most severe, with an energy difference of 4.17 kWh/m
2. In a one-year study conducted in Ghana, Abdul-Ganiyu et al. [
7] reported annual outputs of 149.9 kWh/m
2 (electricity) and 1087.8 kWh/m
2 (heat) for a PVT system. However, they also found that a higher-rated PV module generated more electricity, highlighting the importance of using normalized metrics and consistent system configurations in comparative studies.
Several simulation-based studies have explored the impact of climate on PVT performance. Gagliano et al. [
8] compared PVT and combined PV + solar thermal systems in various European locations, showing notable differences in solar energy yield based on solar irradiance. For instance, PV output in Catania and Split reached 250 kWh/(m
2·y), while in Freiburg, it was about 172 kWh/(m
2·y). Similarly, Vassiliades et al. [
9] examined building-integrated PVT systems in Cyprus and Italy, reporting that active cooling improved electricity production by up to 20 kWh/(m
2·y) compared to passive systems. Annual thermal yields reached up to 3.2 kWh/(m
2·y) in Cyprus and 3.7 kWh/(m
2·y) in Italy.
PVT thermal output strongly depends on the cooling method, fluid mass flow rate, and heat exchanger design, among others. Both air- and water-based cooling systems have been shown to significantly enhance electrical efficiency by maintaining lower PV operating temperatures [
10]. The authors’ previous research, Kozak-Jagieła et al. [
11], demonstrated that active cooling, such as water circulation, can efficiently regulate PV temperature and increase energy yields, especially in moderate climates with high summer irradiance. What is more, Pang et al. [
12] emphasized that optimizing the cooling fluid flow rate, panel tilt, and volume of heated fluid can increase system efficiency by up to 60%. Ammar et al. [
13] proposed an optimal power operating point (OPOP) model to adjust flow rates in real time, depending on weather conditions.
To further improve its performance, PVT systems can be installed on solar trackers, which adjust module orientation and inclination to maximize solar energy gains during the day. Several studies have shown that single- and dual-axis tracking systems can increase PV output by 20–40% [
14,
15]. For instance, Huang et al. [
16] reported a 35% increase using a one-axis three-position tracker, while Sharaby et al. [
17] found that dual-axis tracking with PV cooling improved daily electrical output by 14.5%. Next, Płachta et al. [
18] showed that sun-tracked PV systems produced 45% more electricity than stationary ones, and adding active water cooling provided an additional 5% gain.
Other research has evaluated concentrated PVT (CPVT) systems mounted on trackers, showing up to 2.5 times higher electrical output compared to stationary modules [
19]. Hybrid systems that combine tracking, cooling, and optical concentration have demonstrated improvements in both electrical and thermal efficiencies of 19% and 55%, respectively [
20]. Akpinar et al. [
21] also reported PV output increases of up to 26.3% with tracking, while recent developments include innovative dual-axis tracking devices with weather protection features that provide over 30% more electricity annually and offer improved wind and hail resistance [
22,
23].
The literature review clearly demonstrates the advantages of combining active cooling with solar tracking in PVT systems. However, a major gap remains: most studies are limited to short-term tests or simulations. Even when longer-term research is cited, the presented data often cover only a single representative day. Moreover, some comparisons between PV and PVT systems fail to normalize for nominal power, leading to inaccurate conclusions about cooling benefits.
Therefore, the aim of this study is to present long-term experimental results comparing stationary and dual-axis sun-tracked PVT systems. The systems were operated continuously from April 2020 to March 2021 under real climatic conditions in southern Poland. Poland is characterized by a temperate climate with distinct seasonal variations, including cold winters and moderately warm summers. These conditions provide a valuable context for evaluating the year-round performance of solar technologies, particularly hybrid systems like PVT, which must operate efficiently under both low and high ambient temperatures.
The analysis includes detailed measurements of both electricity and thermal energy yields. It is also worth noting that the analyses take into account the energy consumption for the systems’ own needs, which is also very rare in the literature but provides important information regarding the validity of additional systems. The novelty of this research lies in the use of a fully operational hybrid solar installation over an extended period, addressing a clear gap in the current literature and providing a reliable basis for system optimization and deployment in temperate climates.
An additional contribution of this study is the experimental evaluation of a novel, modular PV cooling system, designed for universal application across various PV module types. Its compatibility with both stationary and sun-tracked configurations, combined with ease of installation and robust performance under diverse climatic conditions, provides practical value for broader deployment in real-world systems.
2. Materials and Methods
This study investigates the long-term performance of PVT systems with and without sun tracking, focusing on the combined electrical and thermal output under real climatic conditions. The primary objective is to evaluate how system configuration—specifically, fixed vs. sun-tracked orientation—affects the total useful energy yield. Additionally, the research examines the effectiveness of a newly developed modular cooling system (ELFRAN, Nowy Targ, Poland) integrated into both system types.
The motivation for this comparative analysis stems from the growing interest in hybrid solar technologies that can simultaneously generate electricity and heat, as well as the need for field data to assess their practical performance. The study does not assume the superiority of any configuration a priori; instead, it aims to quantify the energy output and operational behavior of each system under identical boundary conditions.
2.1. System Configurations and Experimental Setup
Two PVT system configurations were analyzed: a stationary array and a dual-axis sun-tracked array. Both systems were installed on the rooftop of the District Headquarters of the State Fire Service (DHSFS) in Oświęcim, Poland. The stationary system consists of 30 PVT modules mounted at a fixed tilt of 18°, oriented 33° southwest. The sun-tracked PVT system includes five independent tracking units, each holding six PVT modules. The dual-axis trackers (ELFRAN, Nowy Targ, Poland) continuously adjust both azimuth and tilt angles (0–270° and 0–90°, respectively) to maximize incident irradiance.
Each PVT module incorporates a liquid cooling system for waste heat recovery and PV cell temperature control. The heat recovered supports a ground-source heat pump system for space heating. During the summer period, excess heat is used to regenerate the ground source through borehole heat exchangers.
2.2. Modular PV Cooling System
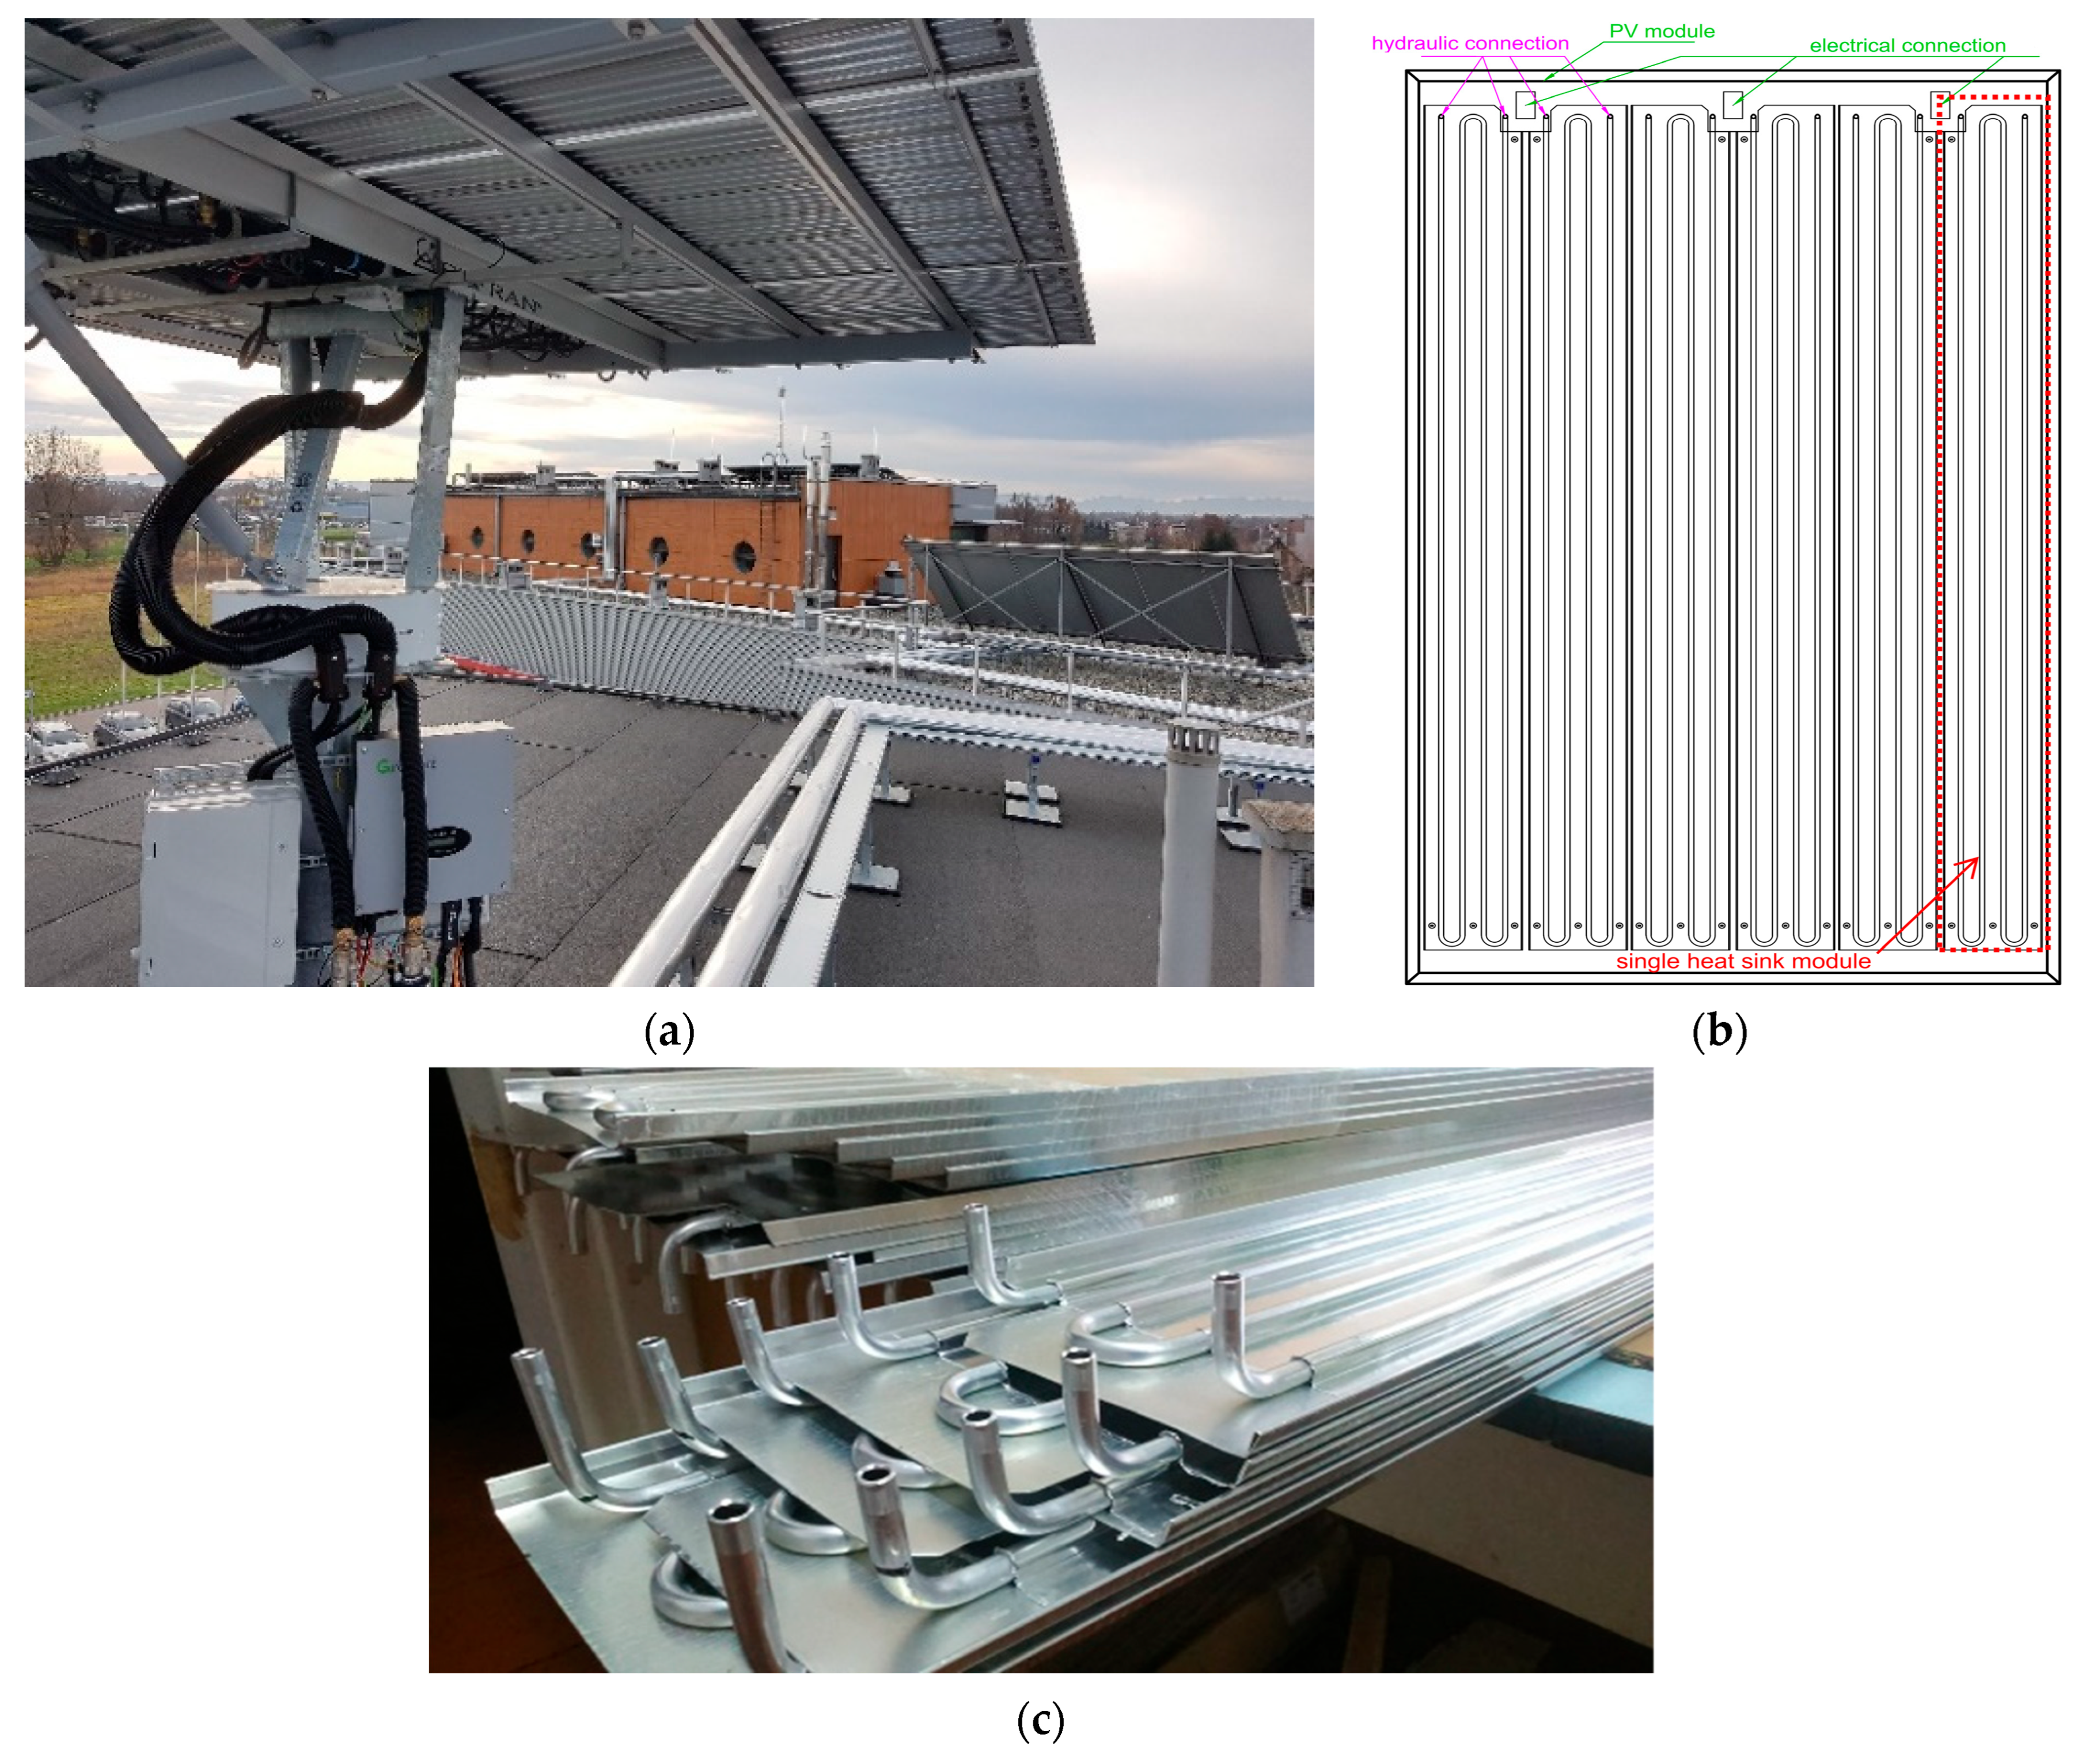
The cooling system used in this study is based on a modular heat sink design, developed to enable efficient and flexible thermal management of PV modules. Each heat sink module (
Figure 1b) comprises two aluminum sheets of 0.5 mm and 0.2 mm thicknesses and two U-shaped tubes, with an inner diameter of 6 mm and a wall thickness of 1 mm, through which a water–glycol mixture (50/50) circulates. The heat sinks are attached to the underside of PV modules using thermally conductive adhesive, ensuring good thermal contact without compromising mechanical stability.
This design is intended to be universal and compatible with standard PV modules from various manufacturers. The system was tested across a wide temperature range (−20 °C to 65 °C) and under high humidity conditions. A schematic representation is shown in
Figure 1, and detailed modeling of the cooling module is provided in [
24].
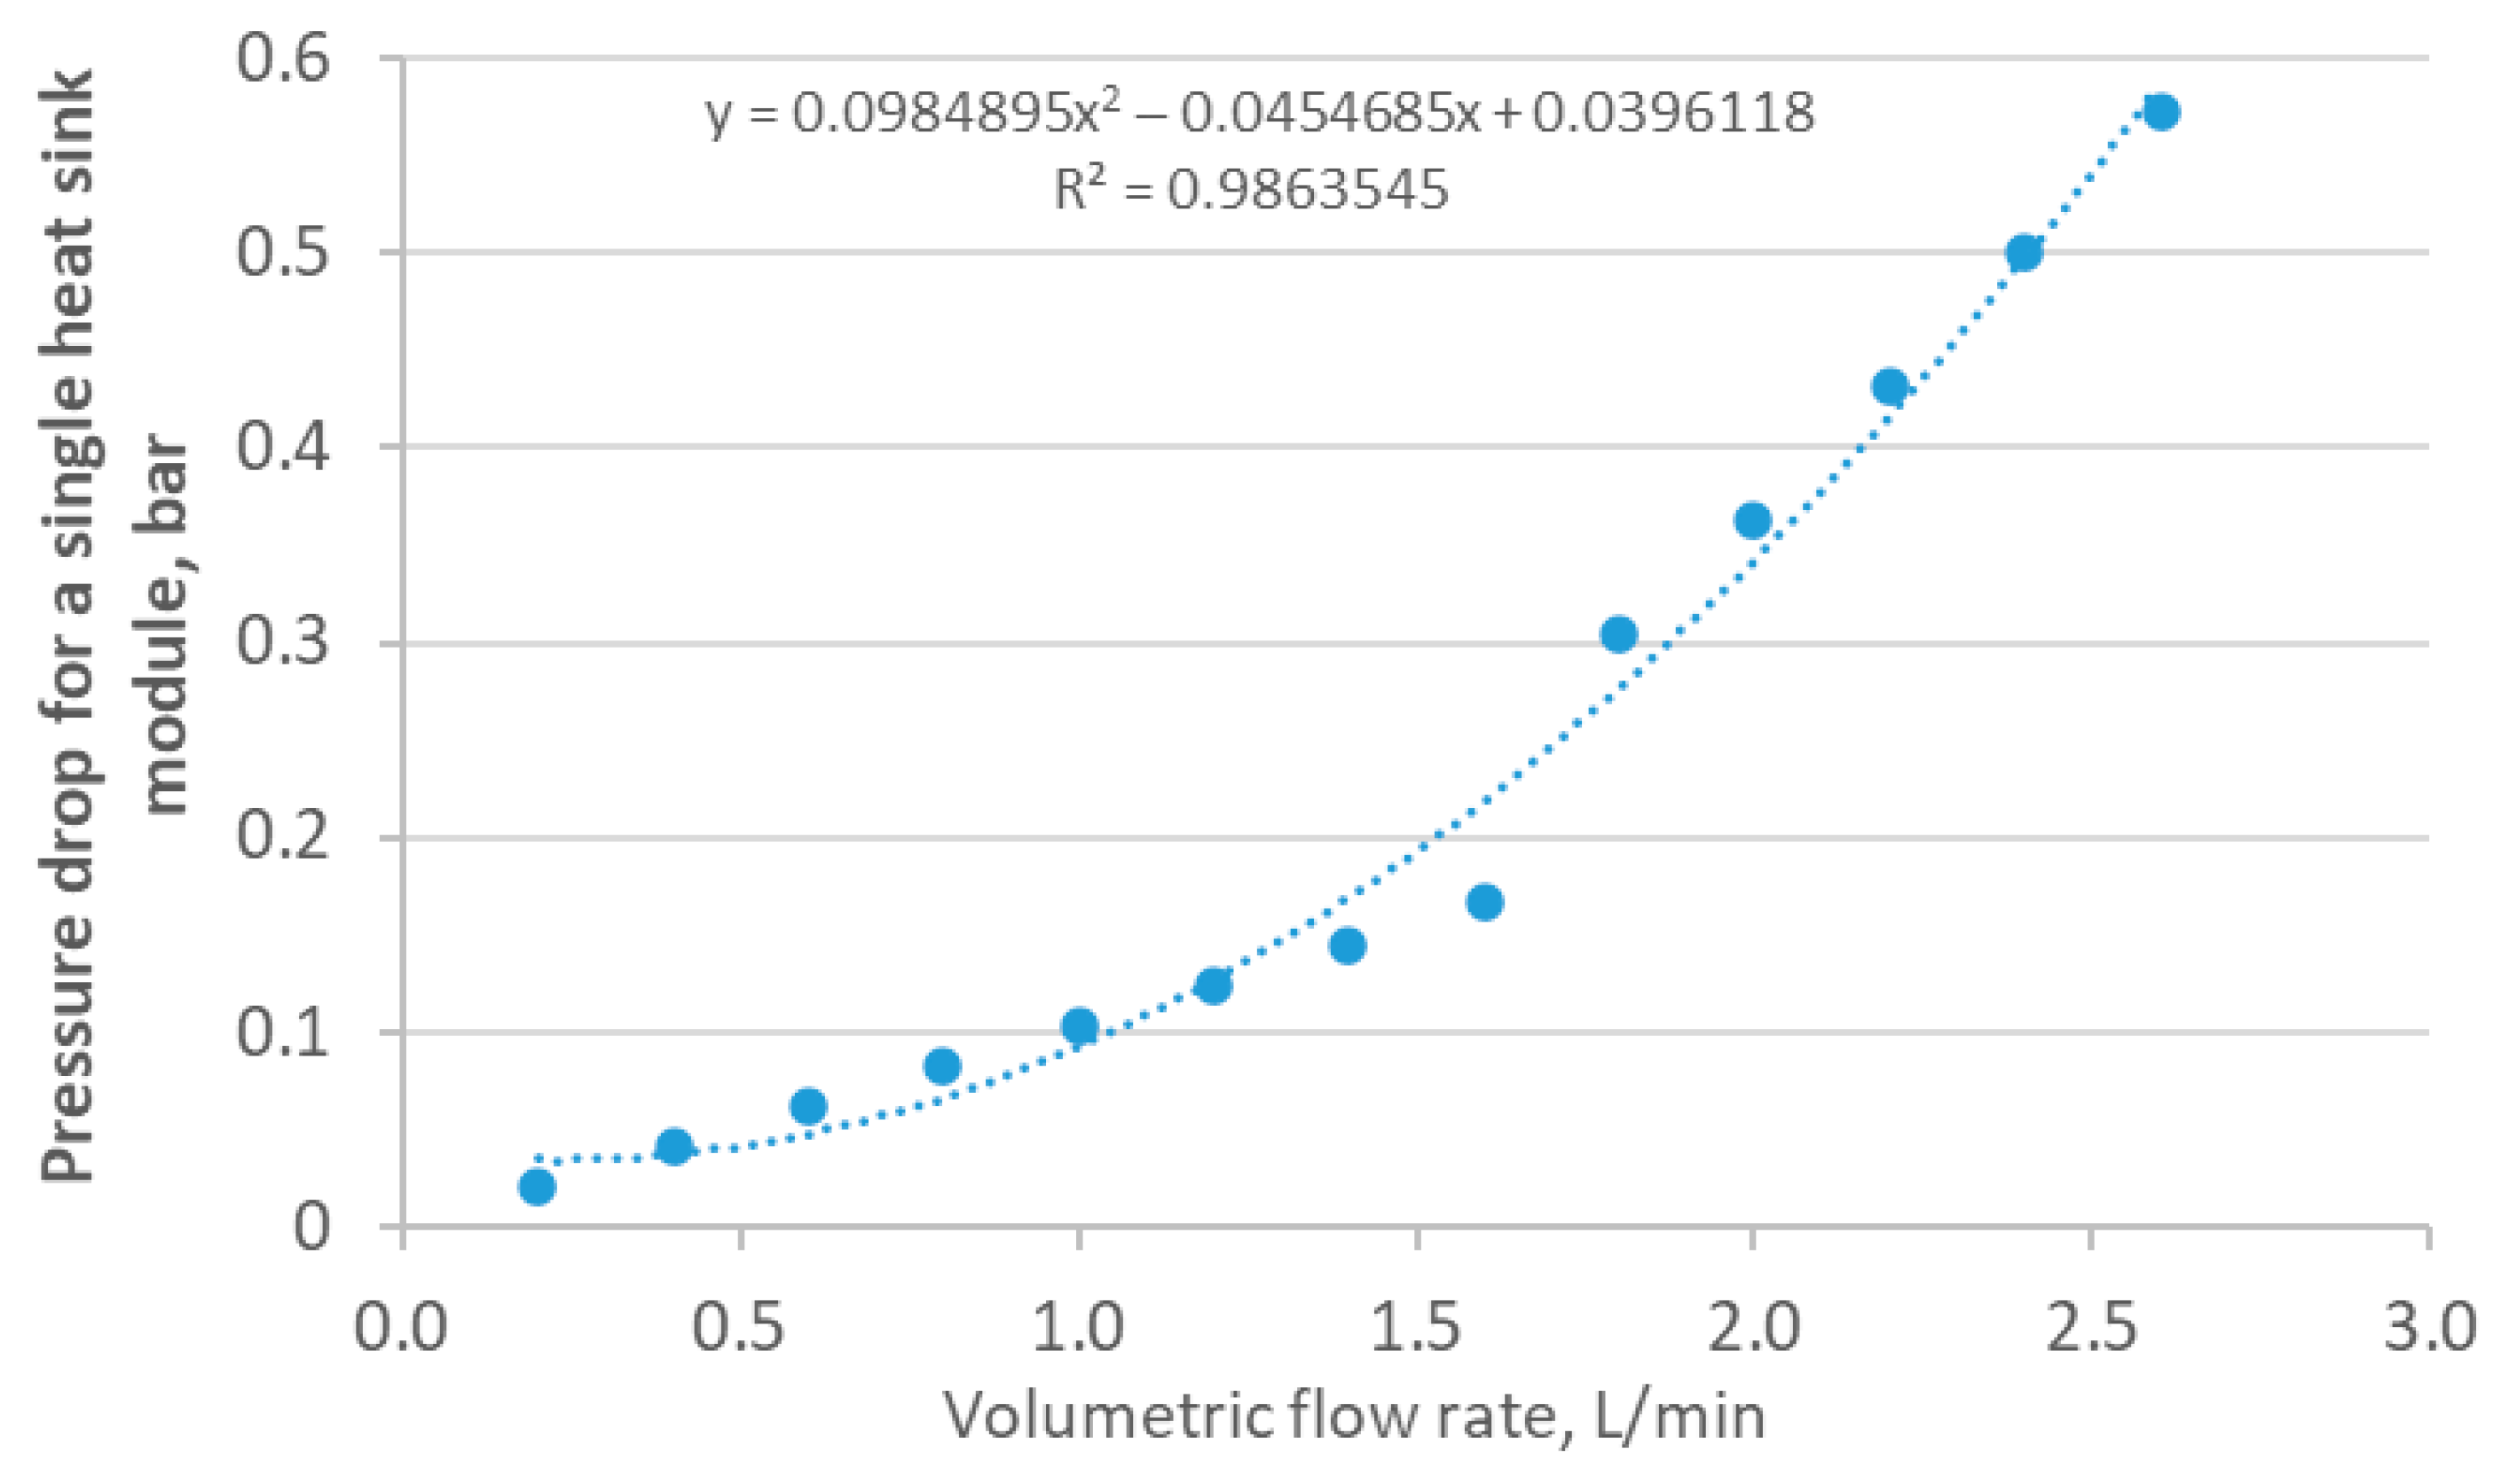
Pressure losses of the PV cooling system developed are shown in
Figure 2.
By evaluating this cooling system under real operational conditions, the study also contributes to the ongoing development of efficient PVT technologies, offering insight into the performance of compact, scalable cooling solutions.
2.3. Description of the Demo Site
The performance of the developed PVT modules was evaluated under real-world conditions at a demonstration site located on the rooftop of the DHSFS in Oświęcim, Poland. A detailed description of the DHSFS building and an analysis of the heating system operation is provided by Taler et al. [
25].
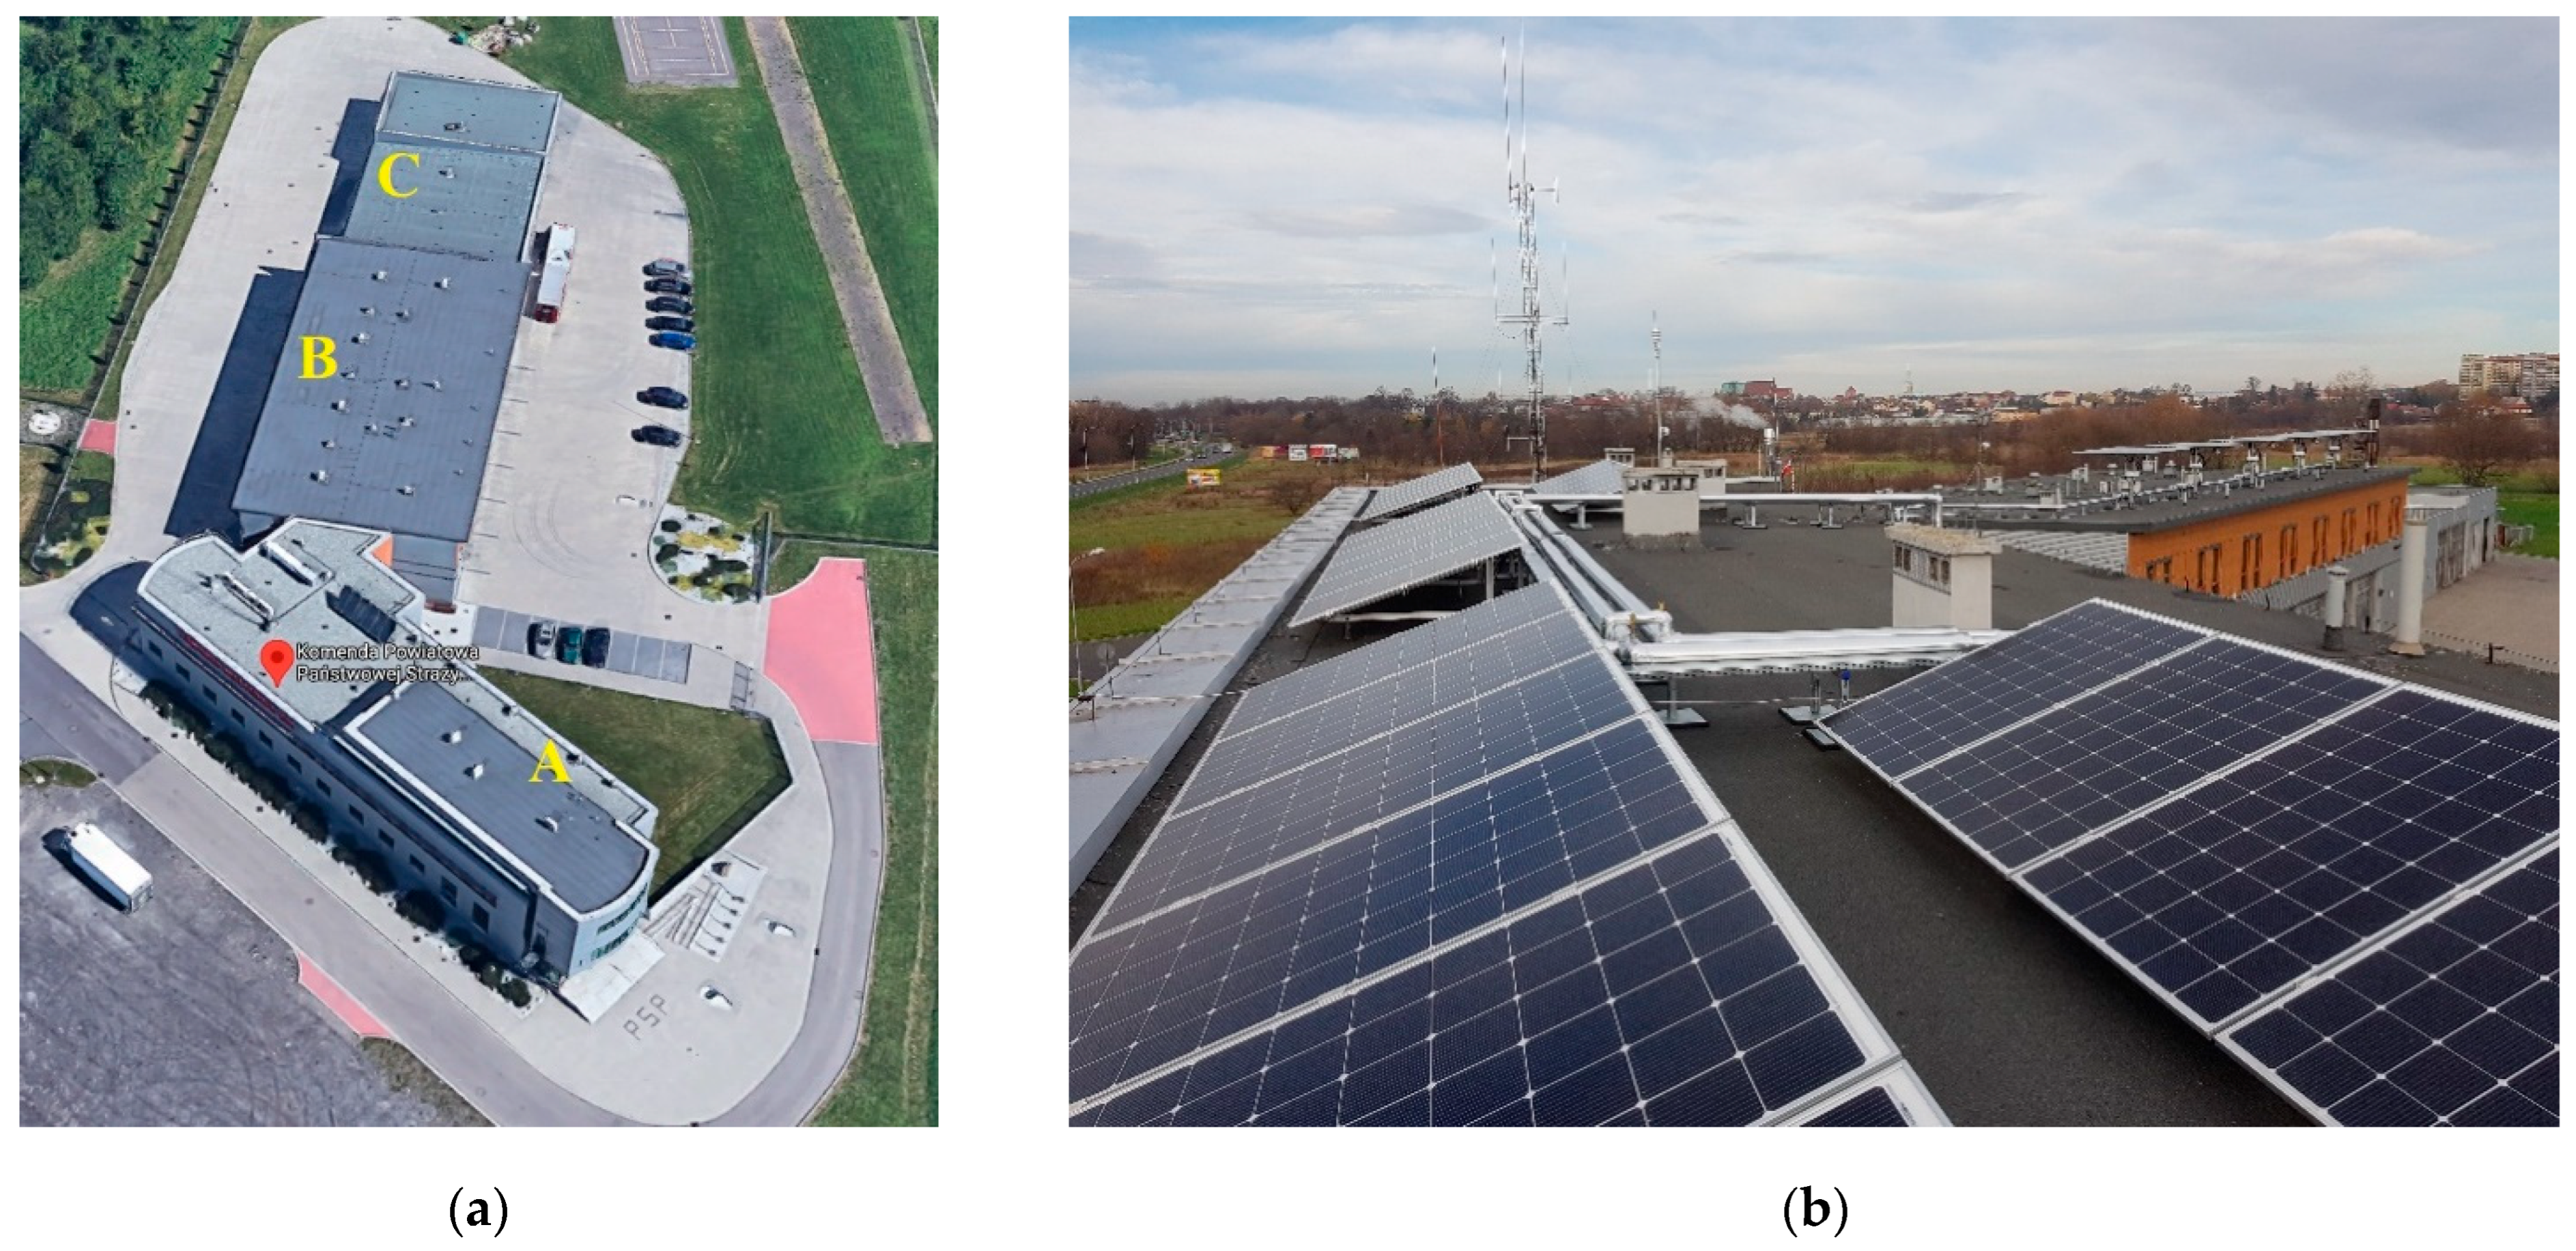
The demo site comprises two installations:
Building A: equipped with 30 stationary PVT modules, each with an electrical power output of 300 W, for a total electrical power of 9.0 kW at STCs;
Building B: equipped with five sun-tracked PVT units, each comprising six PVT modules (1.8 kW per unit), for a total electrical power output of 9.0 kW at STCs.
Figure 3 shows the demo installation: (a) the DHSFS building (from Google Maps) and (b) stationary and sun-tracked PVT modules located on the rooftop of the building.
Figure 4 presents the construction of the demo site installation.
All of the PV modules installed are ZN SHINE ZXM6-TD60 modules (ZN SHINE, Changzhou, China) featuring a self-cleaning graphene coating, which minimizes the impact of dirt deposition on their performance.
Table 1 presents the ZN SHINE ZXM6-TD60 modules parameters.
The stationary PV modules (at Building A) are oriented 33° southwest with an inclination angle of 18° to the ground surface. A heat sink is mounted on the underside of each PV module. Each module is equipped with a cooling system consisting of six heat sink sections, connected in three pairs in series. These three pairs are then hydraulically connected in parallel, forming a hybrid serial–parallel configuration.
The sun-tracked PVT modules, located on Building B, are installed using a dual-axis tracking system, enabling modules rotation within orientation angles from 0° to 270° and tilt angle from 0° to 90°. The proposed control strategy adjusts the orientation of the PV tracker to maximize solar irradiance. The system uses two irradiance sensors mounted orthogonally on the tracker structure. By continuously comparing the irradiance values measured by each sensor, the controller identifies the optimal orientation. The tracker position is adjusted until both sensors record similar irradiance levels, indicating that the PV module surface is correctly aligned with the sun. The tracking system responds to irradiance differences greater than 80 W/m2, dynamically adjusting the module orientation to enhance total solar exposure.
In addition, the system includes a wind protection (stow) mode designed to reduce the risk of damage during strong wind conditions. High wind speeds can cause mechanical stress on the panels, potentially leading to structural failure. To prevent this, the tracker moves the PV panels to a stow position when wind speeds exceed a predefined threshold. In this mode, the PV panels are tilted to 0°, minimizing their exposure to wind forces. The default wind speed that triggers the stow function is set to 12 m/s, although this value can be adjusted depending on the structural characteristics of the tracking system.
The demo stand is equipped with an 800-liter buffer tank that serves as a lower source of a heat pump. During the summer, the heat extracted by the PVT system regenerates the ground as the lower heat source, enhancing the heat pump’s efficiency. A water–glycol mixture circulates through borehole heat exchangers, transferring heat to the ground. During the winter season, the buffer tank serves as a storage system for the water–glycol mixture, which transfers heat from the ground to the heat pump evaporator that serves for building heating.
The cooling system flow rate has been optimized to 30 L/h per each PVT module, resulting in a total nominal flow rate of 0.9 m
3/h separate for the stationary and sun-tracked systems. The system is managed by a SCADA control platform, which includes a weather station (Thies CLIMA, Göttingen, Germany), pyranometer (Delta OHM (Senseca), Caselle, Italy), flow meters (APATOR Powogaz SA, Żerniki, Poland), and temperature sensors (CZAMARA, Limanowa, Poland) installed across the modules and cooling systems. The electrical power output from the PV system is measured using sensors integrated into the PV inverters (GROWATT, Shenzhen, China). The exact brands and measurement uncertainties of the instruments used are listed in
Table 2 and
Table 3.
A solar controller managed the operation of the circulation pumps in the research installation. The controller activated the pumps when the surface temperature of the PV panels exceeded 25 °C and when the temperature of the solar fluid returning from the cooling system was at least 4 K higher than the temperature of the liquid in the storage tank. This control strategy reduces heat losses in the installation when the panel temperature falls significantly below 25 °C and ensures that the PV panels operate within their optimal temperature range.
3. Results
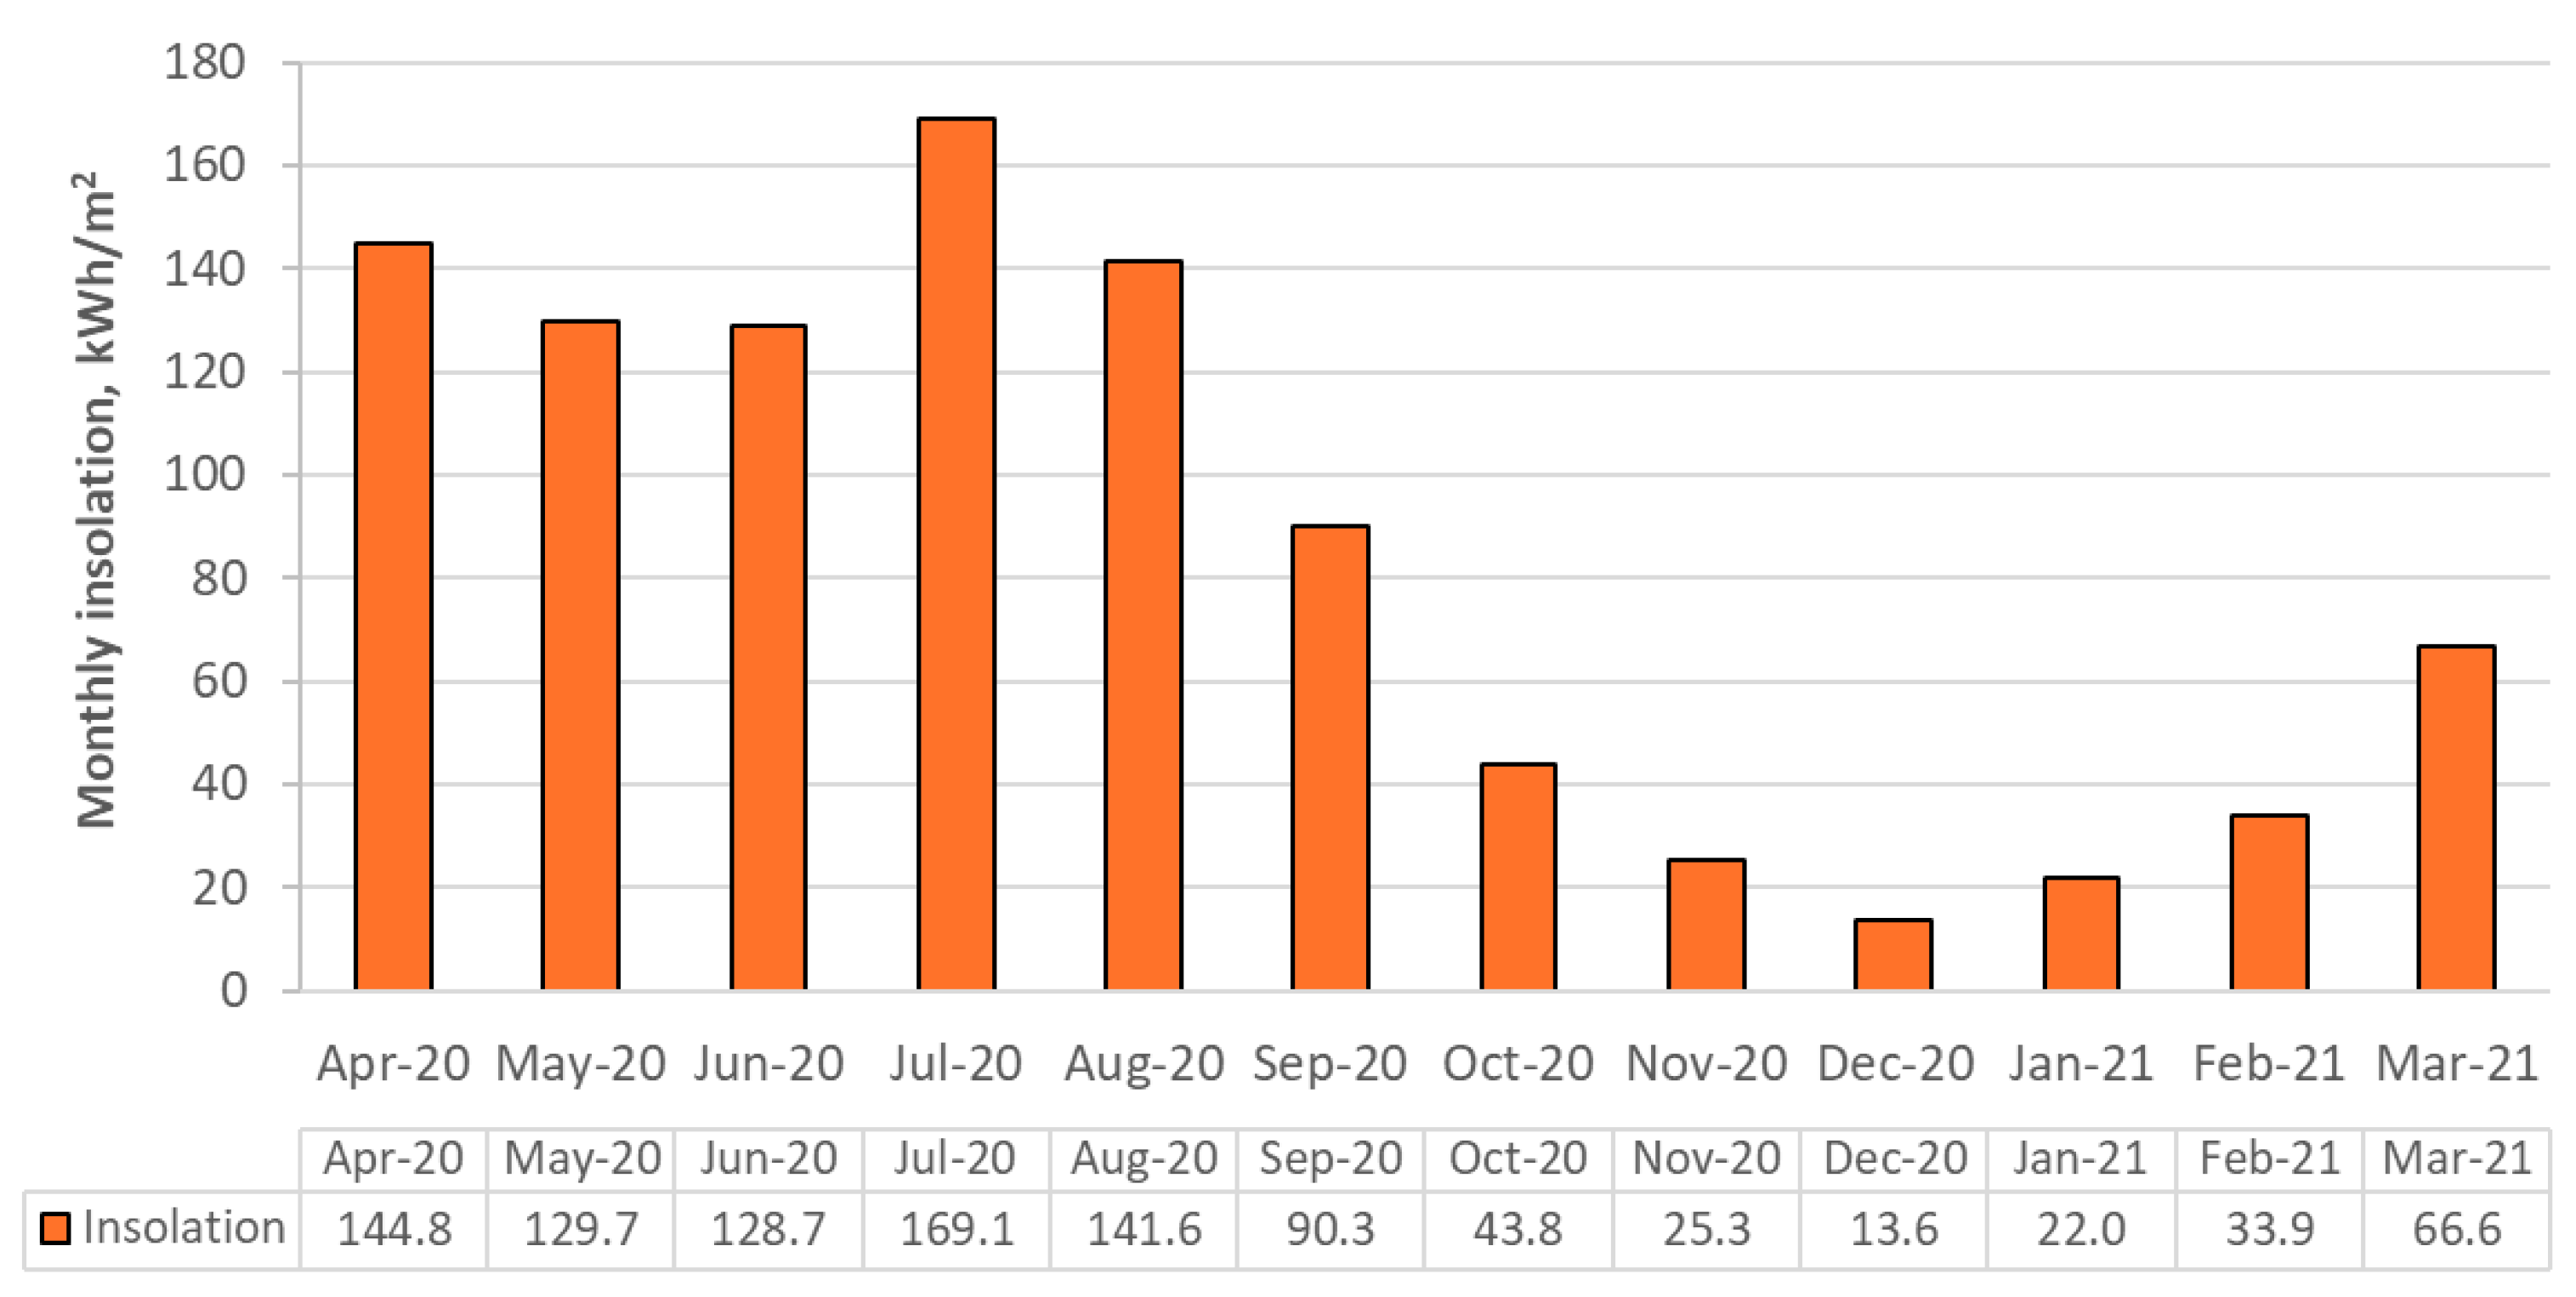
The study investigated the electrical and thermal energy performance of stationary and sun-tracked PVT modules over a full-year operational period, from 1 April 2020 to 31 March 2021. Monthly solar insolation data recorded during the monitoring period are presented in
Figure 5. The experimental site is located in Oświęcim, southern Poland (49.8° N, 19.2° E), which lies within the temperate climate zone characterized by significant seasonal variation in solar irradiance. The average annual insolation for this region is approximately 1100–1200 kWh/m
2, with the highest monthly values observed between May and August, and the lowest during the winter months (November to January). These climatic conditions make the region representative of Central European locations, where the effective utilization of solar energy technologies requires careful adaptation to low winter insolation and variable seasonal temperatures.
The experimental setup included thirty stationary PVT modules (9.0 kW at STCs) and five sun-tracked PVT units, each containing six modules (9.0 kW at STCs in total). Over the year, the system generated 20,605.7 kWh of electricity, with 12,104.1 kWh contributed by the sun-tracked PVT and 8501.6 kWh by the stationary PVT system. The gross electricity yield excludes energy used by auxiliary equipment such as the sun-tracking mechanism, inverters, circulating pumps for PV cooling, heat storage, and the SCAD system, among others. These losses were incorporated into the net electricity yield calculation. A single PVT tracker consumed approximately 105 kWh of electricity for 805 h of operation, equating to an average electrical power of 130 W.
Figure 6 illustrates the monthly gross (
Figure 6a) and net (
Figure 6b) electricity yields of both stationary and sun-tracked PVT units. Annually, sun-tracked PVT units produced 42% more gross electricity than stationary systems. The seasonal differences were also significant:
Spring–summer period (April–September): Sun-tracked PVT generated 36% more gross electricity (9152.0 kWh vs. 6719.4 kWh).
Autumn–winter period (October–March): The increase reached over 66% (2952.1 kWh vs. 1782.0 kWh).
Net electricity yield for the system was 17,370.3 kWh, representing a 15.7% reduction (3235.4 kWh) due to self-consumption. Nevertheless, the sun-tracked PVT system outperformed the stationary system, producing approximately 34% more net electricity annually.
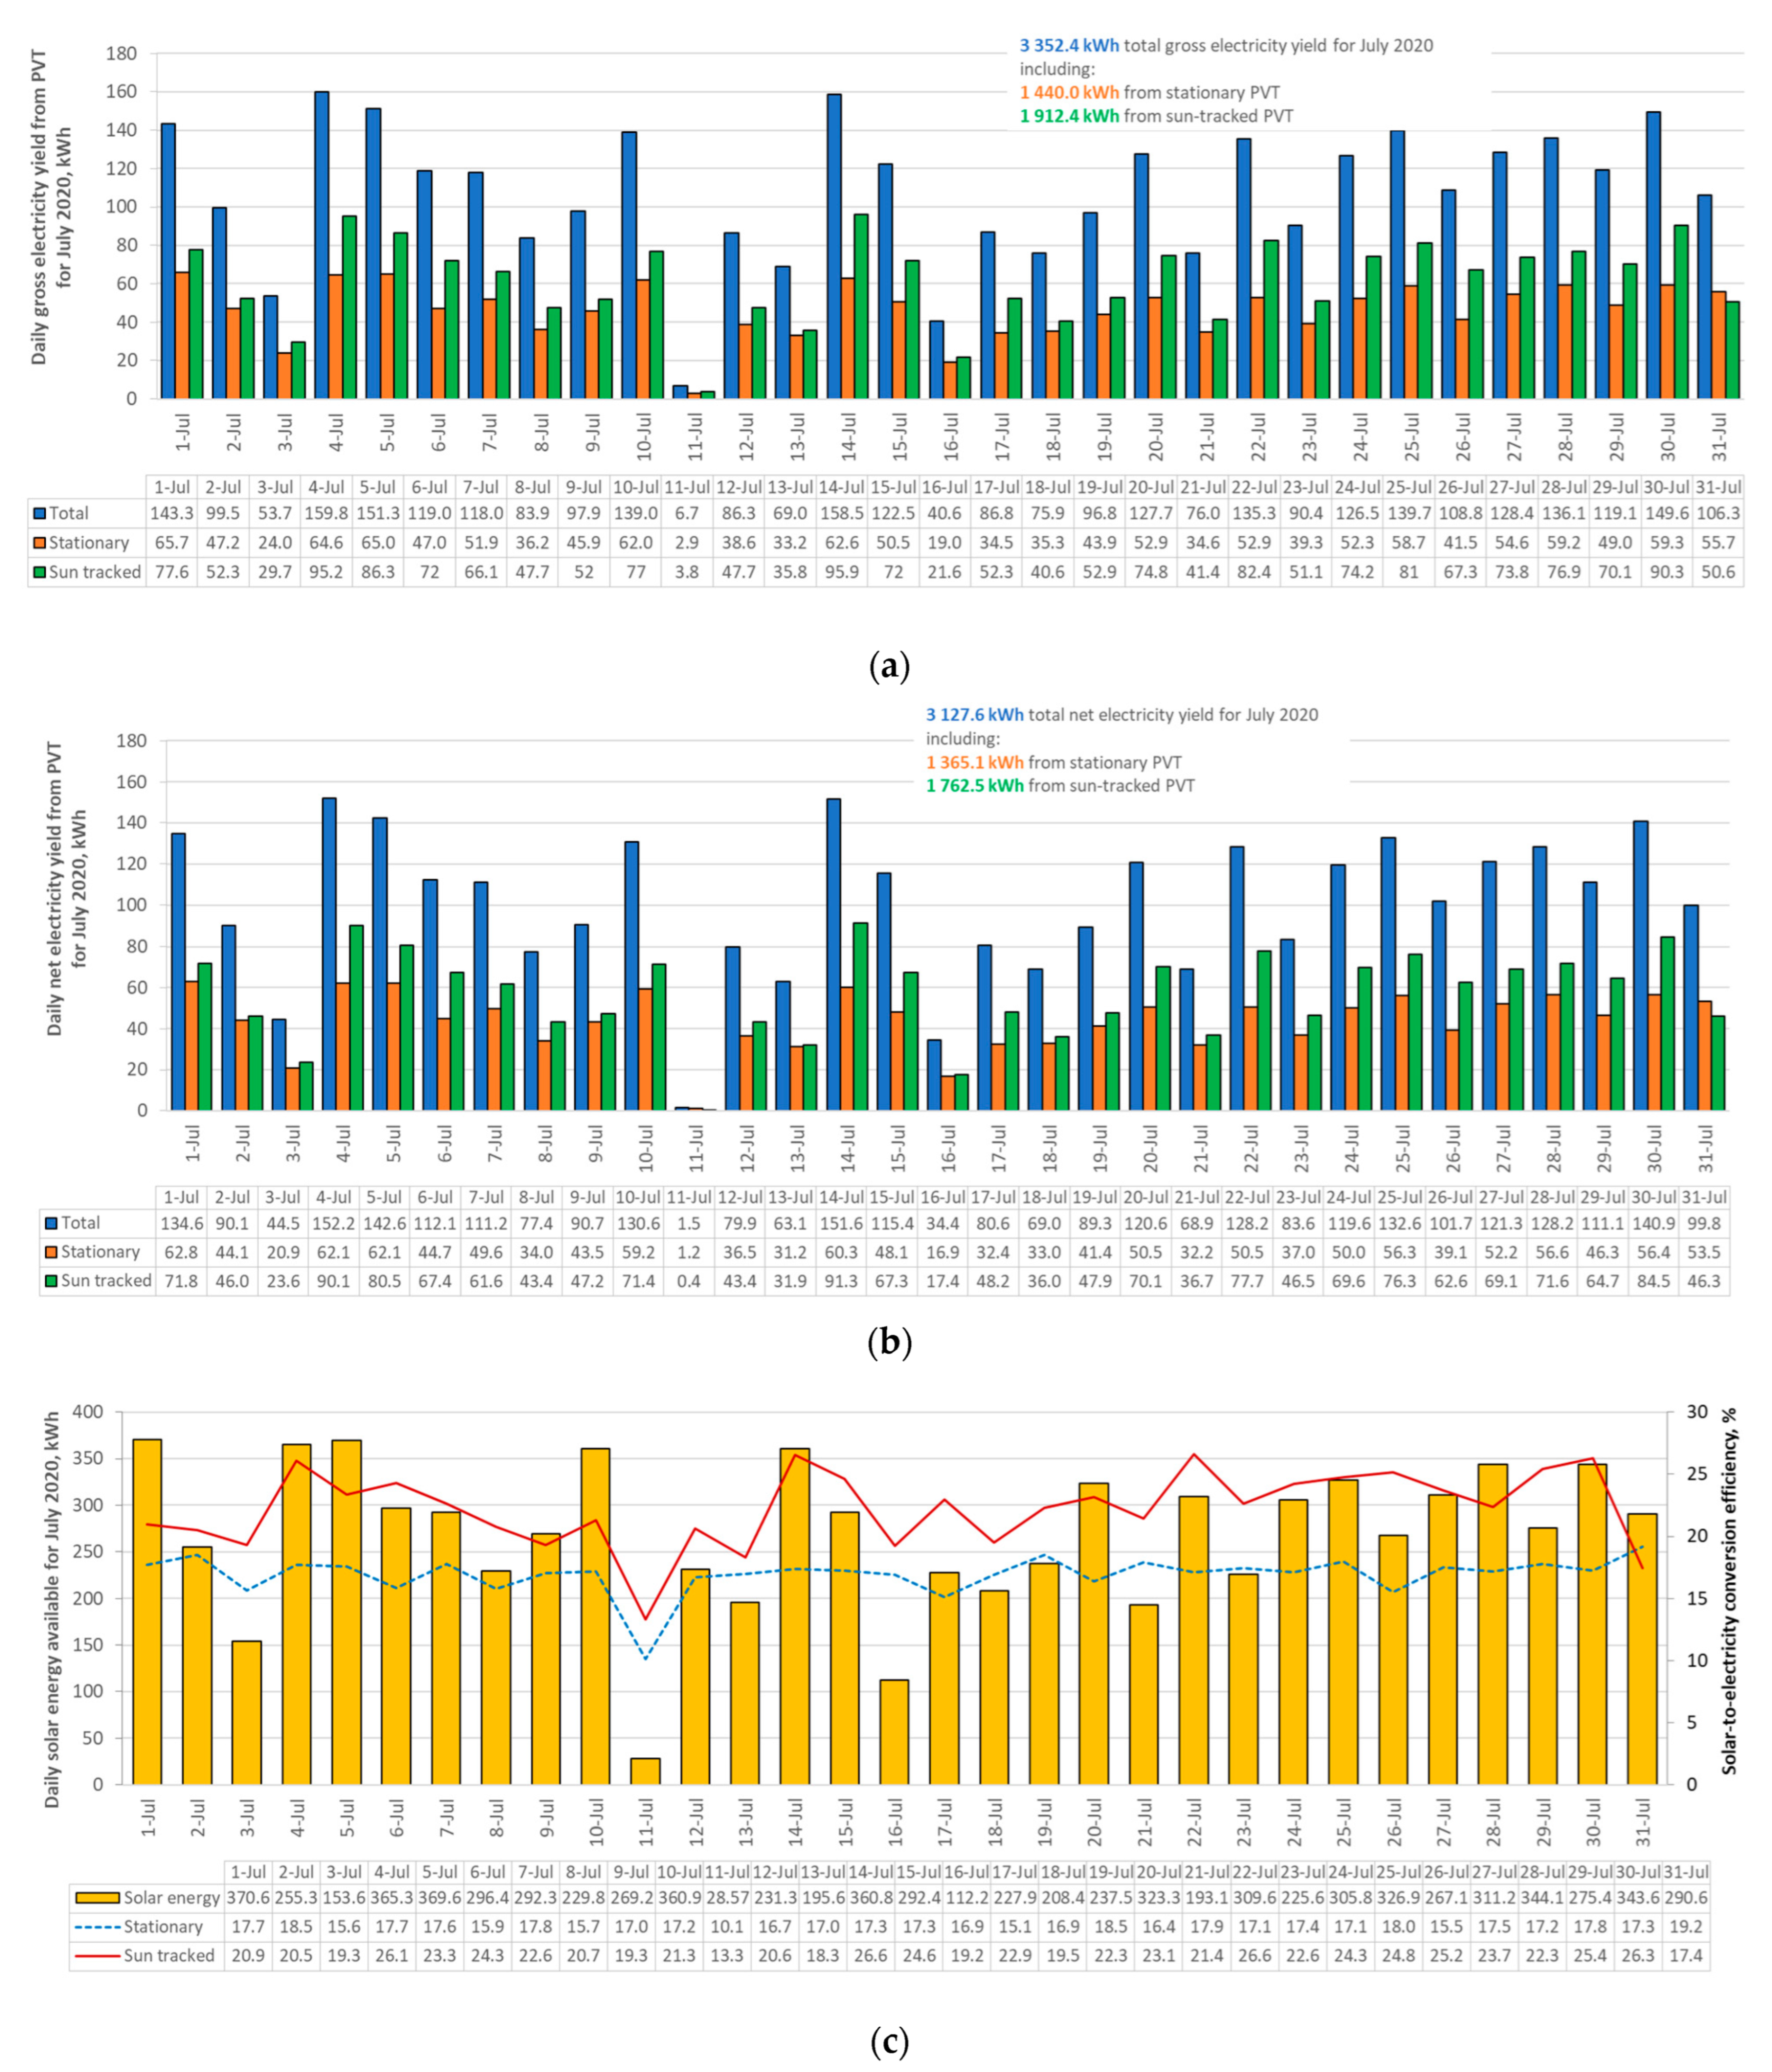
Figure 7 presents the daily gross and net electricity yields during July 2020, the month with the highest solar energy output. The gross energy generated in July was 3352.4 kWh, with 224.8 kWh consumed for system operation.
Based on the data presented in
Figure 7a,b, the average daily solar-to-electrical conversion efficiencies for both stationary and sun-tracked PVT modules were determined. These calculations utilized the daily solar isolation values shown in
Figure 7c, which illustrates the daily insolation data for each day of July 2020. The resulting efficiency curves are also included in
Figure 7c. The highest conversion efficiencies were recorded for the sun-tracked PVT system, with peak values approaching 27% on days with the greatest total daily insolation. This improvement is attributed to the extended exposure time of the PV modules to direct sunlight, enabled by the dual-axis solar tracking system. In contrast, the stationary PVT modules exhibited significantly lower conversion efficiencies, with maximum values not exceeding 19% throughout the analyzed period.
Figure 8 illustrates how the PVT installation meets the electricity demand of the DHSFS building. On average, during the spring–summer period, the PVT system covers approximately 39% of the energy demand, whereas in the autumn–winter period, this value decreases to about 4%. Notably, the average energy coverage exceeds 50% during the summer months. The low values observed for June 2020 can be explained by unfavorable weather conditions. In contrast, for July and August 2020, the energy yield reached relatively high levels, covering 66% of the electricity demand. When splitting the energy coverage on stationary and sun-tracking PVT systems, one may notice that during the April–September period, the sun-tracked PVT accounted for 22% of the energy demand coverage, while the stationary PVT contributed approximately 17%.
3.1. Thermal Energy Yield from PV Cooling
The cooling system is also designed to protect PV panels from overheating and to mitigate the adverse impact of temperature on PV efficiency. To determine the thermal energy gains during the cooling system operation, measurements of inlet and outlet cooling medium temperatures, as well as their flow rates, are continuously recorded. These measurements are performed for separate groups of six PVT modules, both stationary and sun tracked, as illustrated in
Figure 4.
Thermal energy generated by the cooling system is calculated using the temperature difference of the cooling medium Δ
T and its flow rate
ṁ according to the following equation:
Here,
Eth is the thermal energy generated, J;
ṁ is the mass flow rate of the cooling medium, kg/s;
cp is the specific heat capacity of the cooling medium, J/kg·K;
ΔT is the temperature difference between the inlet and outlet of the cooling system, K.
The measured values are recorded at the given time τ at a frequency of Δτ = 10 s. Consequently, to determine daily, monthly, and annual energy yields, the instantaneous values are summed over time.
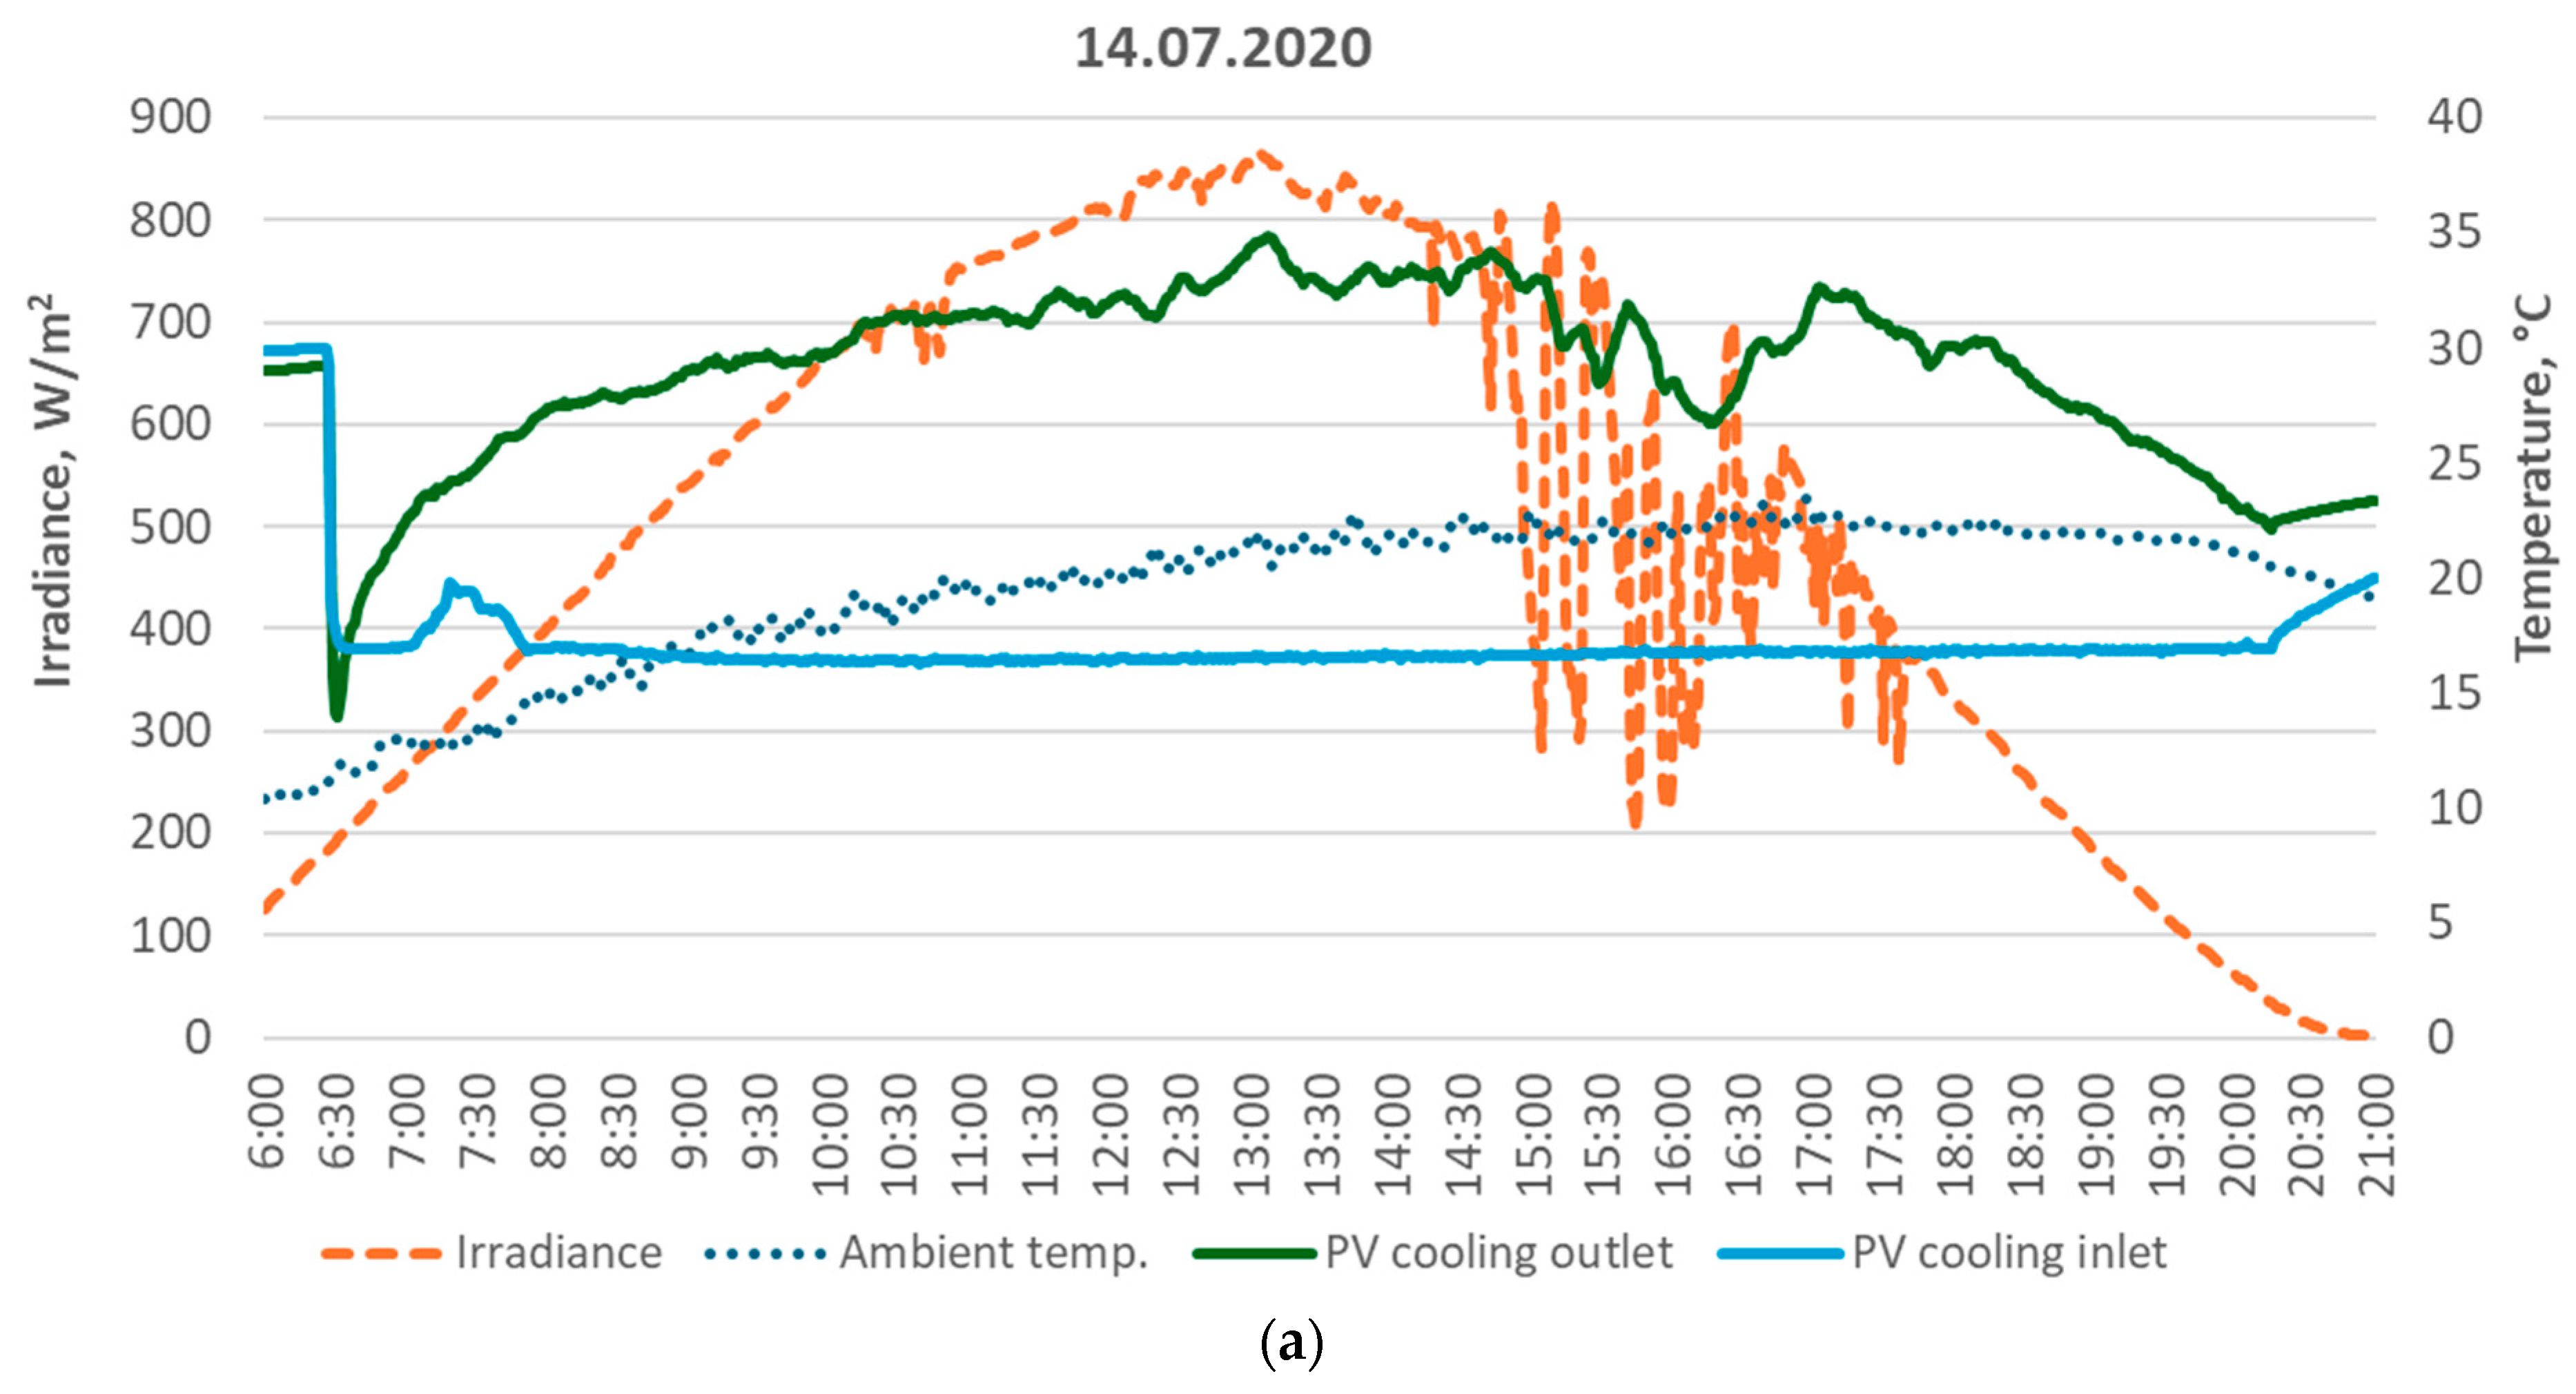
Figure 9 presents representative measurement data recorded during the operation of the sun-tracked PVT system. The sample day selected—14 July 2020—was characterized by one of the highest thermal energy yields from PV cooling observed throughout the month. As shown in
Figure 9a, the solar tracking system enables the cooling circuit to begin operation in the early morning hours due to optimal module orientation. This early activation allows for the effective recovery of both thermal and electrical energy from sunrise.
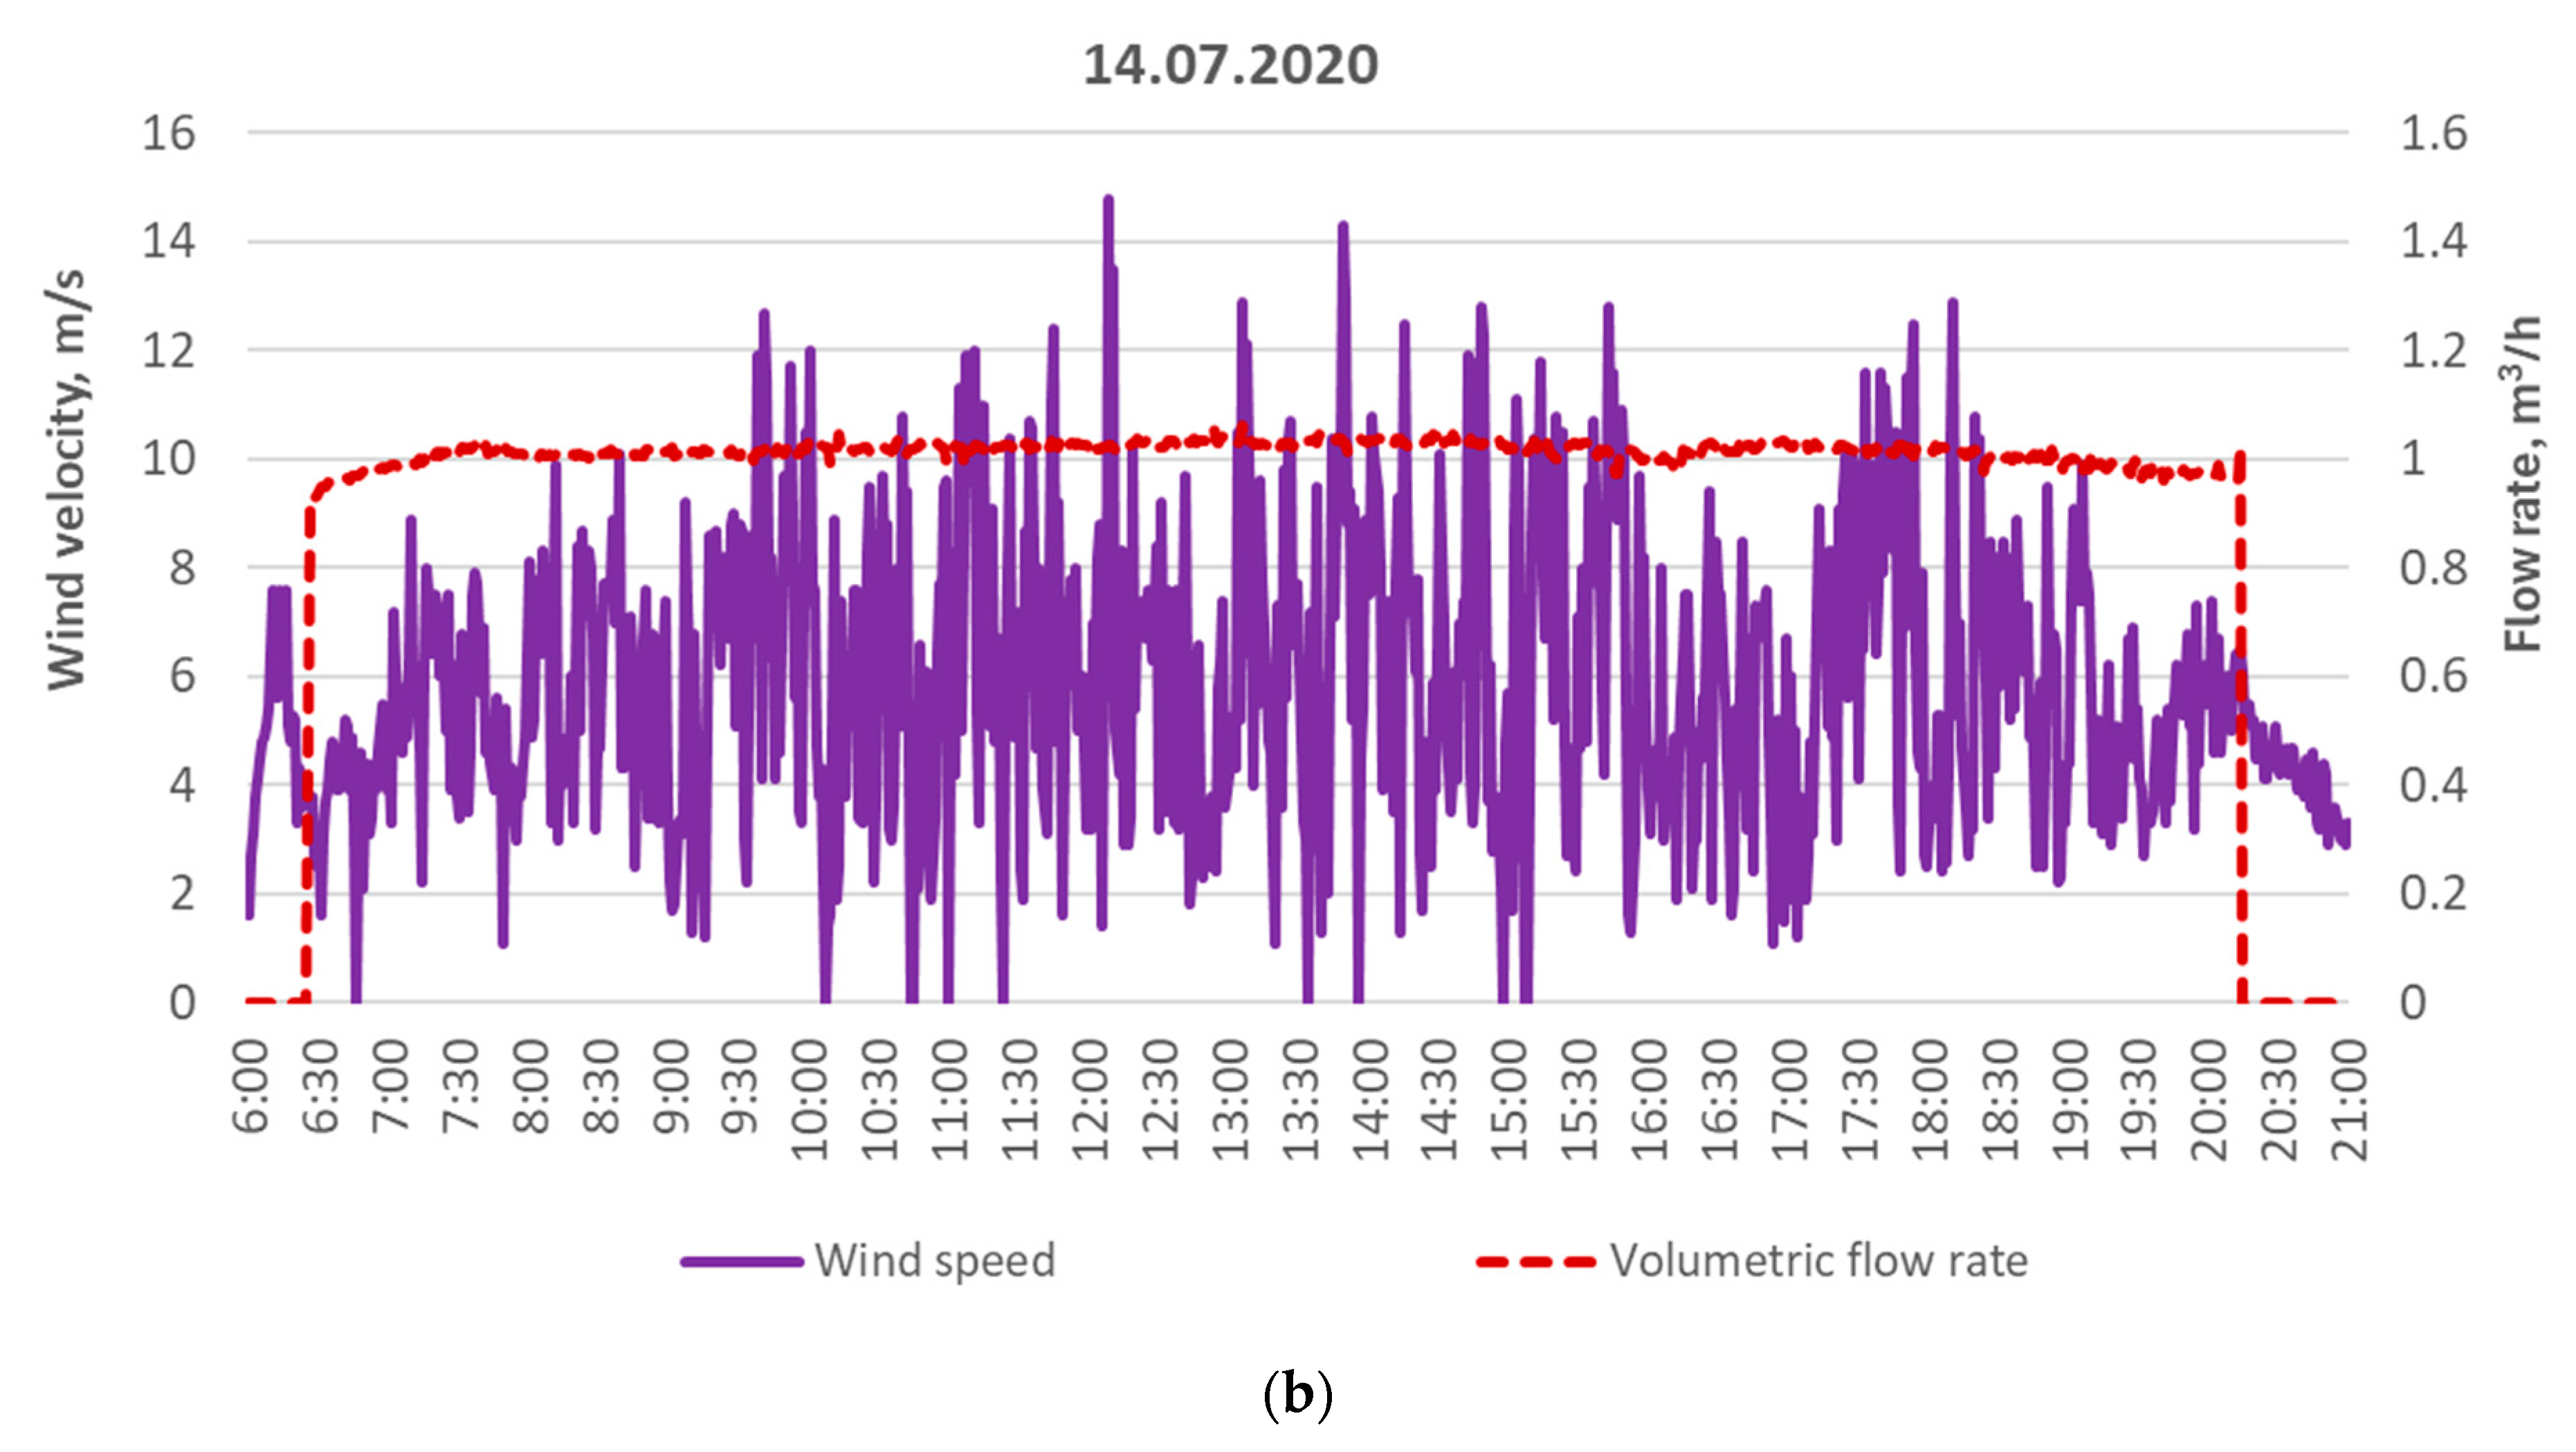
Figure 9b illustrates that the flow rate of the working fluid remains stable throughout the day, within the range of 0.9 to 1.0 m
3/h. The maximum outlet temperature of the cooling medium reaches approximately 32–35 °C. What should be noted is that the wind speed influences the convective heat losses from the PV surface, which, in turn, affect the fluid temperature. Nonetheless, outlet temperatures of about 35 °C are typical for moderate climate conditions. Notably, the significant variability in solar irradiance observed between 15:00 and 17:00 does not interrupt the cooling system operation, allowing for continuous thermal energy harvesting throughout the day.
Using Equation (1), daily thermal energy yields were calculated for the entire measurement period. The results are summarized in
Figure 10, which presents monthly thermal yields for both stationary and sun-tracked PVT systems. During the spring–summer period (April to September), a total of 24,043.9 kWh of thermal energy was generated. In contrast, the autumn–winter period (October to March) yielded only 4484.7 kWh, which accounts for approximately 16% of the annual total. The highest thermal energy outputs were recorded between June and September, coinciding with elevated working fluid temperatures due to stronger solar radiation. In the winter months—from November to March—the thermal output was significantly lower. However, the actual energy yield in each month strongly depends on the local weather conditions specific to the given year.
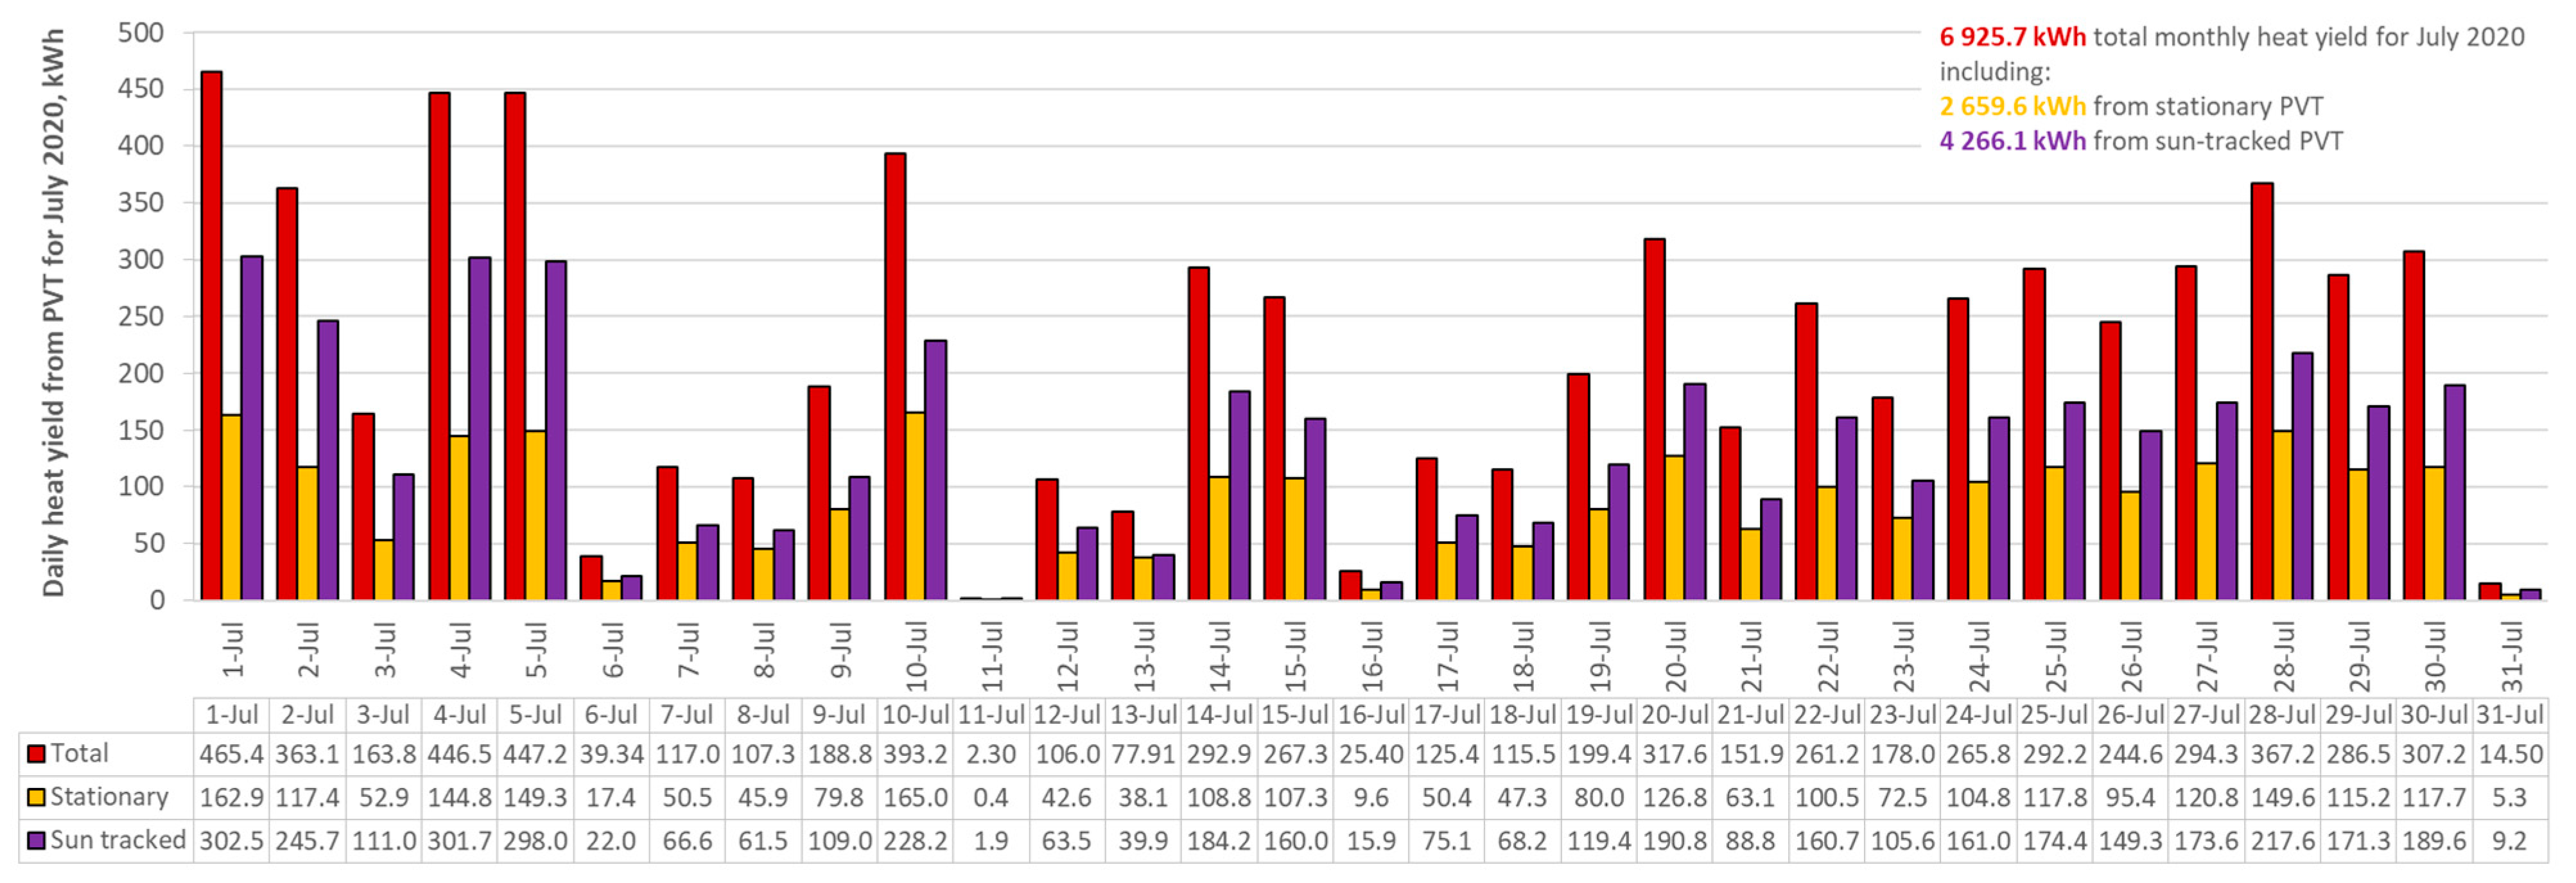
For July 2020—the month with the highest thermal energy output—daily heat yields are presented in
Figure 11. A comparison with the electrical energy production shown in
Figure 7a reveals that the thermal output was approximately 1.5–2 times higher than the electricity generated on the same days. The heat sink geometry and layout were specifically designed and optimized to enhance heat removal from the PV modules, as described in detail by Ocłoń et al. [
24]. In addition to extracting heat from the PV modules, the system also absorbs thermal energy from the surrounding air, effectively operating as a hybrid PV–air solar collector. The high amount of recovered heat does not negatively affect the system’s operation. As seen in
Figure 9a, the temperature of the thermal storage tank remains stable. The tank is hydraulically connected to a ground heat exchanger, allowing the excess heat to be transferred into the ground. This setup enables thermal regeneration of the ground-source heat pump’s lower source, effectively preparing it for the upcoming heating season.
In order to determine the reliability of the measurement results, a measurement uncertainty analysis was performed. The annual uncertainty of the PVT system was calculated using the root sum of squares method, following the GUM guidelines [
26]. Based on the total annual thermal yield of 28,530 kWh, the combined standard uncertainty was estimated at 583.59 kWh/year, which corresponds to a relative uncertainty of approximately 2%. This result reflects the overall accuracy of long-term energy measurements.
It should be noted, however, that this annual value does not fully represent variations that may occur from month to month. Monthly uncertainty can be higher due to changing weather conditions, sensor noise, or short-term system instability, especially during periods of low solar irradiation. These effects tend to average out over the year, but they can have a noticeable impact when evaluating monthly results. This has been taken into account in the interpretation of the data.
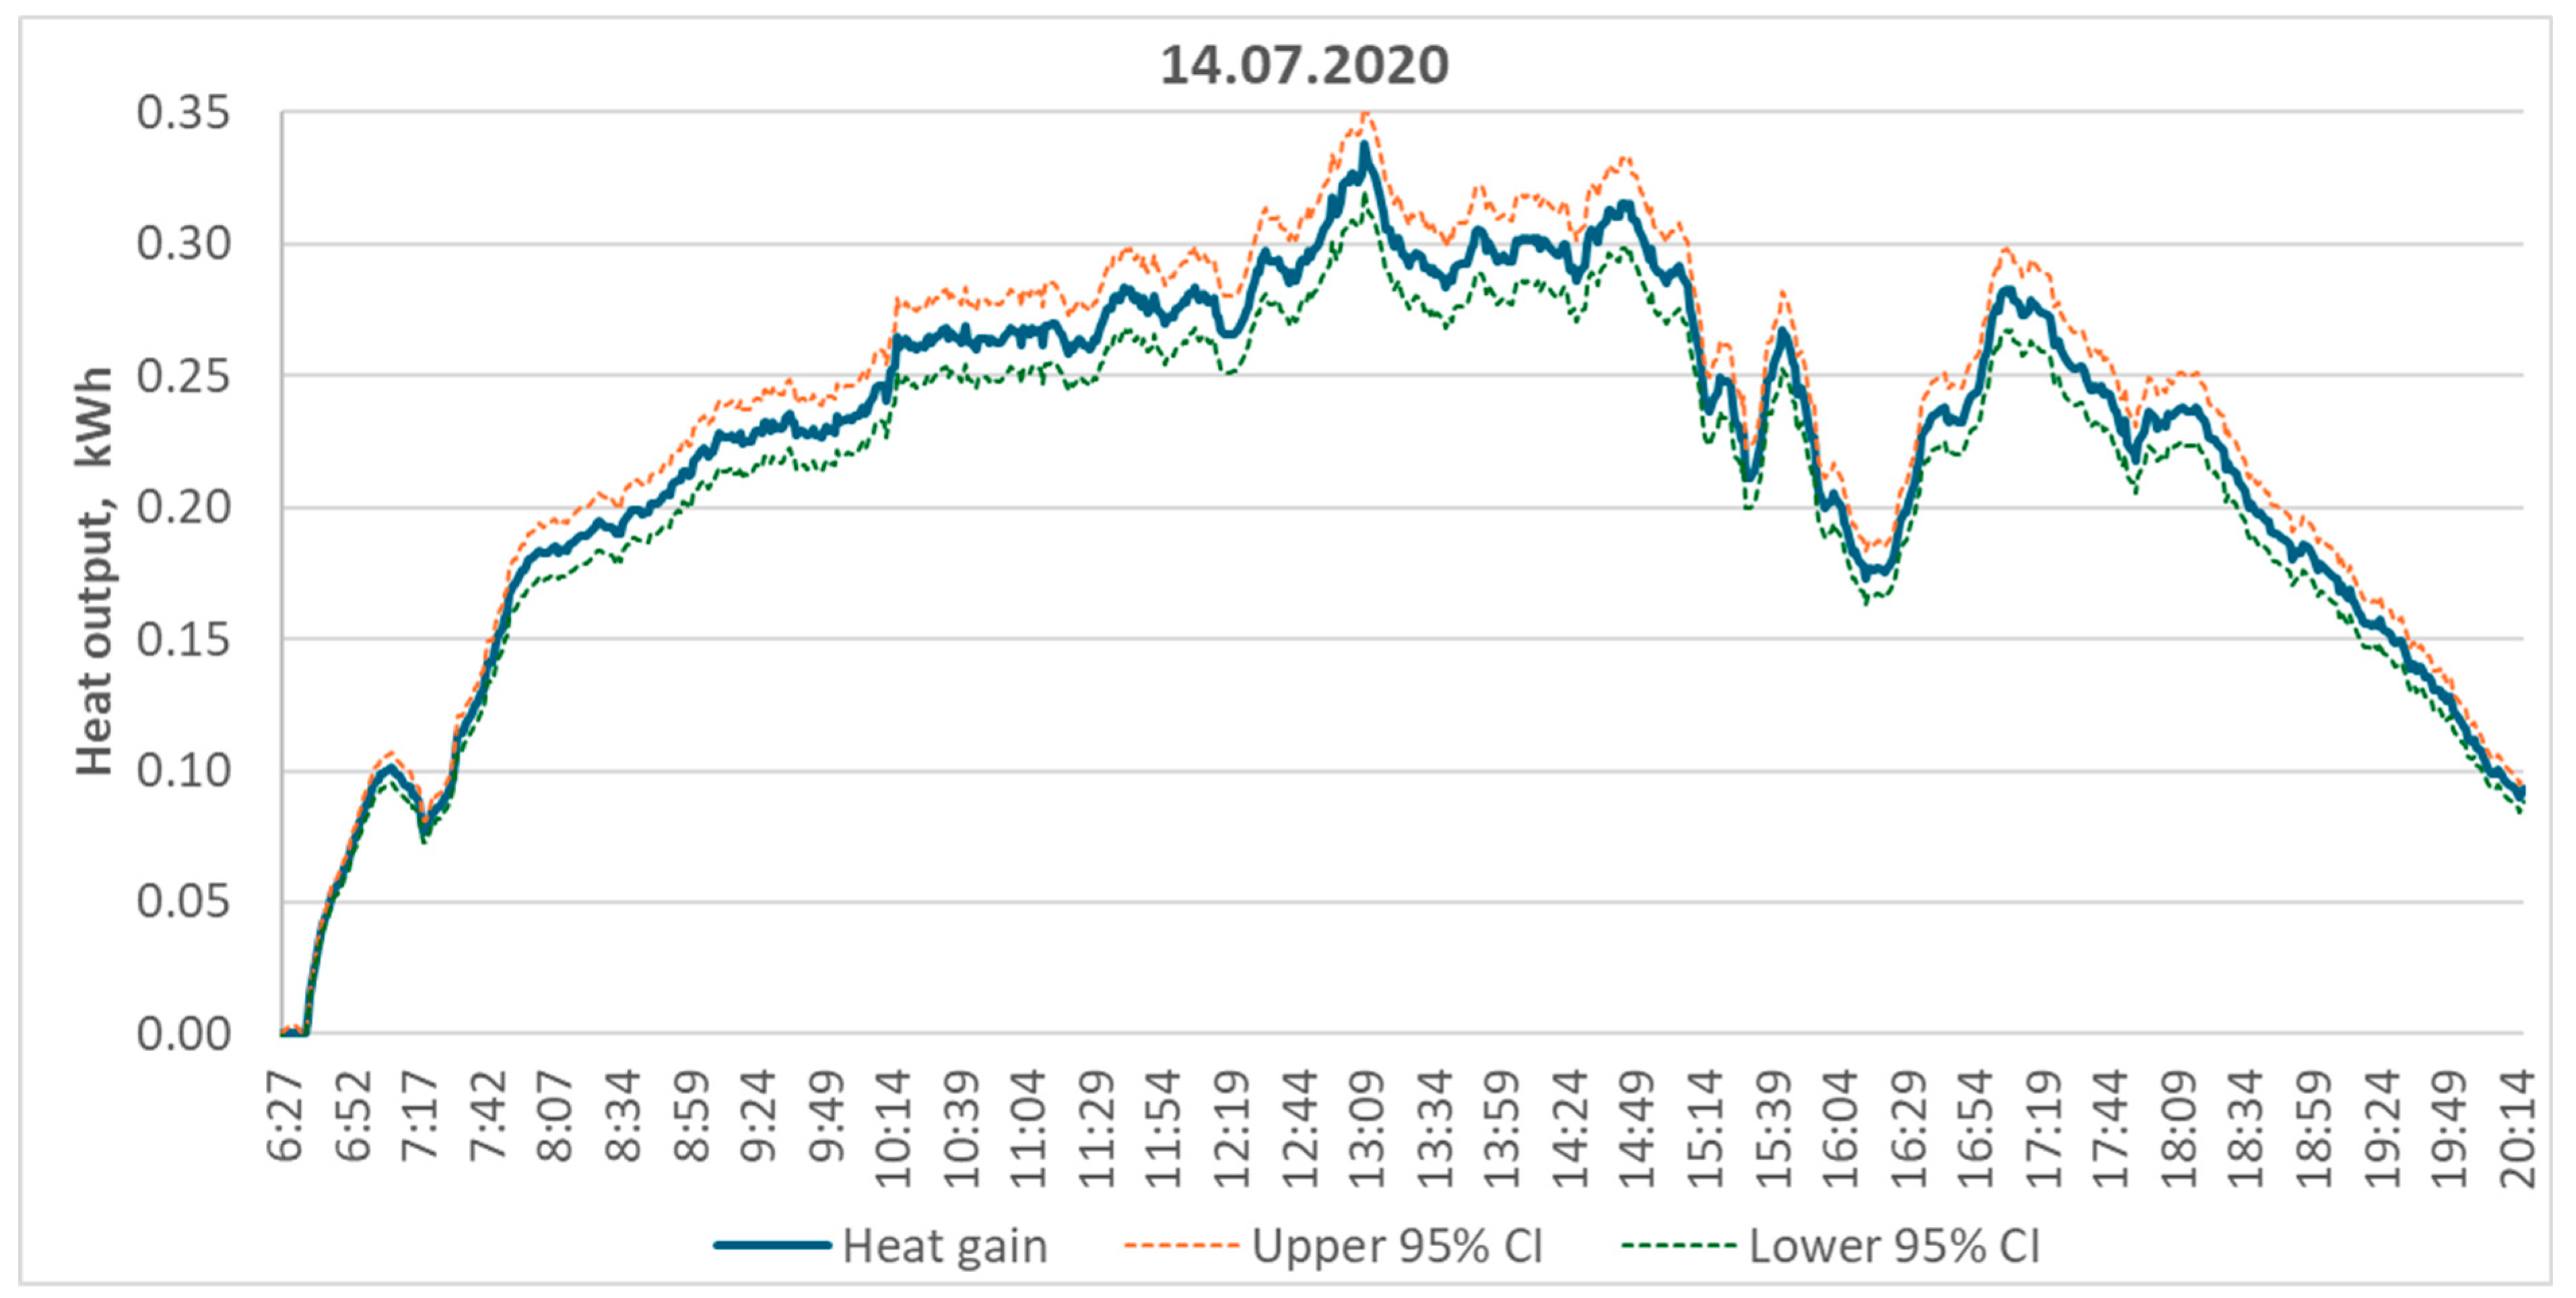
Although the manuscript presents only monthly aggregated data, which do not allow for direct statistical uncertainty analysis, an illustrative calculation was performed using high-resolution experimental data (recorded at 1 min intervals) for a single representative day, 14 July 2020.
Figure 12 presents a high-resolution heat output profile with expanded uncertainty for a sun-tracked PVT module on 14 July 2020.
The expanded uncertainty of the calculated heat output was determined using the differential method based on [
27]:
Q: Instantaneous heat output, kWh;
ṁ: Mass flow rate of the working fluid, kg/s;
cₚ: Specific heat capacity of the fluid, J/(kg·K);
ΔT: Temperature difference between supply and return, K;
: Partial derivative of Q with respect to mass flow rate;
: Partial derivative of Q with respect to specific heat capacity;
: Partial derivative of Q with respect to temperature difference;
2σm: Expanded uncertainty of mass flow rate;
2σcp: Expanded uncertainty of specific heat capacity;
2σΔT: Expanded uncertainty of temperature difference;
2σQ: Expanded uncertainty of Q.
This expression allowed to estimate the 95% confidence intervals for each minute of the selected day. The analysis showed that the average relative width of the confidence interval was approximately 10% with respect to the mean instantaneous heat output (mean: 0.256 kWh, CI width: ±0.0077 kWh). This indicates a moderate level of statistical uncertainty, which reflects the inherent fluctuations in system operation throughout the day.
3.2. Summary of the System Performance
To assess the performance of the PVT installation in comparison to a standard PV system, the online tool PVGIS [
28] was used. The calculations were based on the same installation parameters as described in
Section 2, including the exact location, a total installed electrical capacity of 9.0 kW at STCs, an orientation of 33° southwest, a tilt angle of 18°, and standard system losses of 14%. According to the PVGIS calculations, the expected annual energy yield of a standard fixed PV system is 176.7 kWh/m
2, with an approximate year-to-year variability of 7.9 kWh/m
2.
The analysis revealed a clear advantage of the experimental stationary PVT system over the theoretical performance of a standard fixed PV installation calculated using PVGIS. Specifically, the stationary PVT system generated 26.1 kWh/m2 ± 11.67 kWh/m2 more electricity annually than the fixed PV system estimated by PVGIS, representing a 14.8% increase. This difference significantly exceeds the expected year-to-year variability of 7.9 kWh/m2 for standard PV systems, suggesting that the hybrid PVT design effectively enhances energy production. Higher electricity yield can be achieved by using PV cooling, which reduces the PV modules’ operating temperature, maintaining higher conversion efficiency.
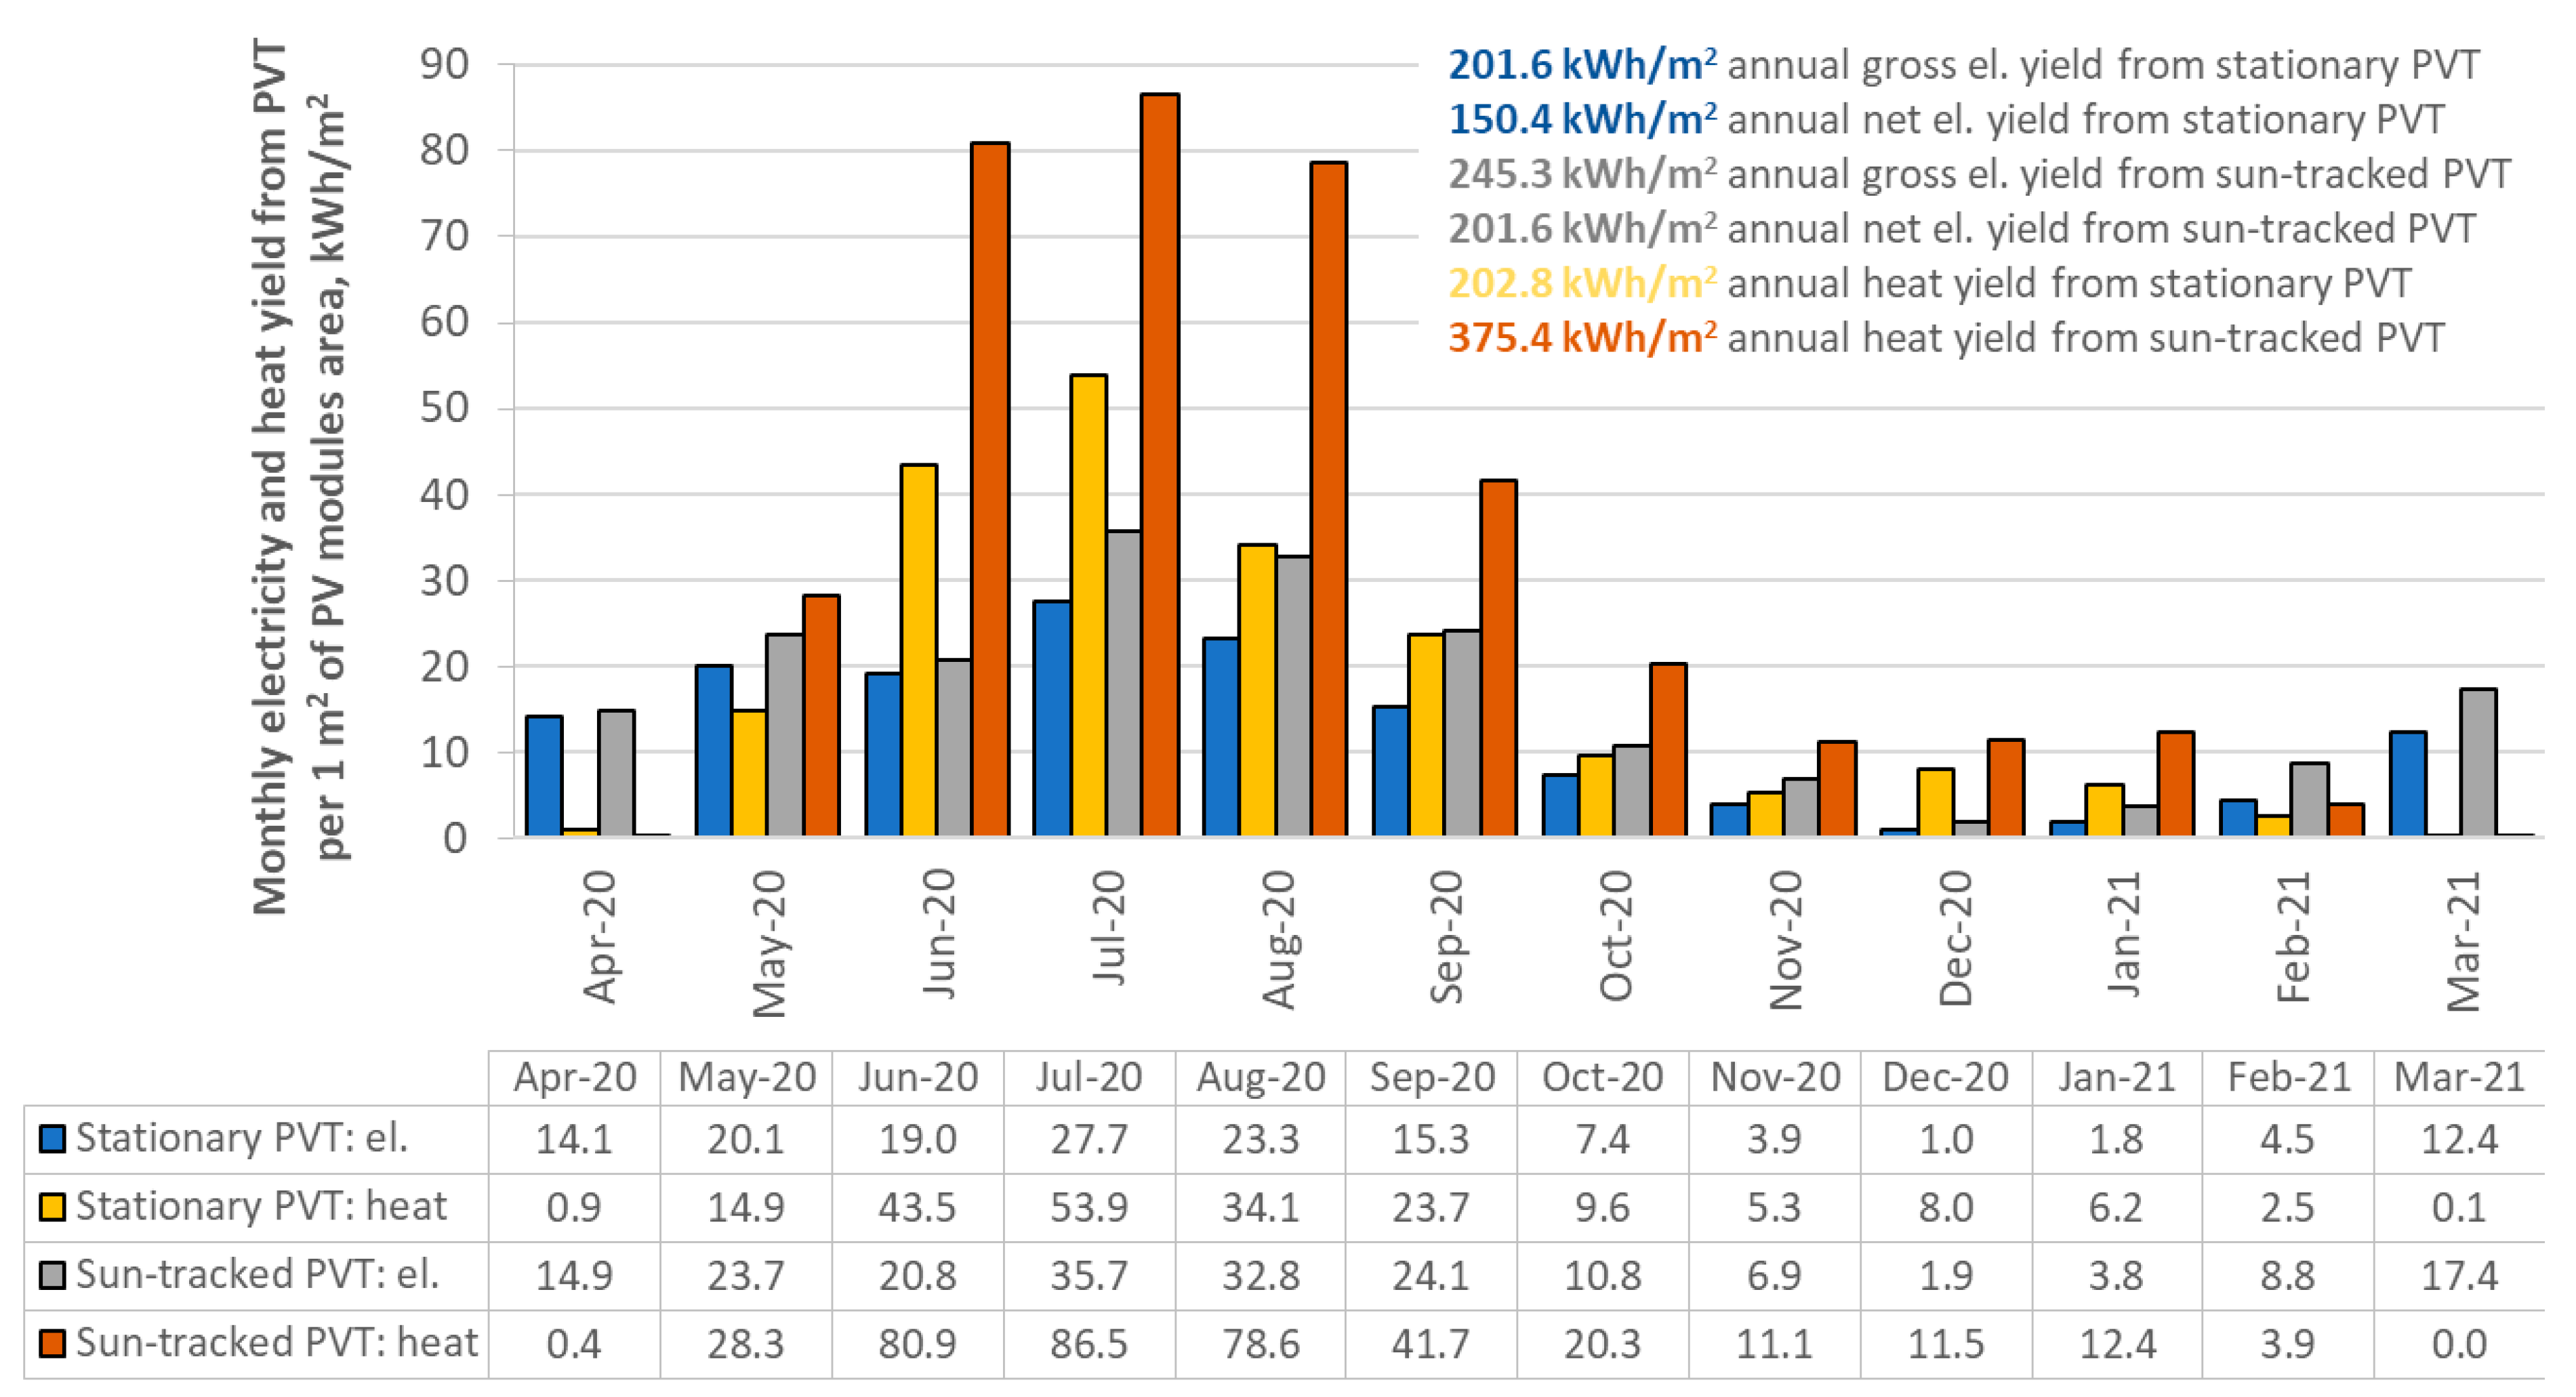
A comparative analysis of the stationary and sun-tracked PVT systems is shown in
Figure 13, where monthly gross and net electricity, as well as thermal energy yield, are normalized per square meter of the PVT module surface area. The specific parameters are as follows:
Stationary PVT: 49.34 m2, electrical output: 9 kW at STCs;
Sun-tracked PVT: 49.34 m2, electrical output: 9 kW at STCs;
Combined system: 98.68 m2, total electrical output: 18 kW at STCs.
Table 4 provides a summary of the annual energy yields obtained from the stationary and sun-tracked PVT systems installed at the DHSFS Oświęcim demonstration site. The results clearly indicate the advantages of integrating sun tracking and active cooling into PVT technology. The sun-tracked PVT system achieved an annual gross electricity yield of 259.4 kWh/m
2, which is 28% higher than the stationary PVT system (202.8 kWh/m
2) and 47% higher than the PVGIS-estimated output of a conventional stationary PV module (176.7 kWh/m
2). When accounting for internal consumption, the net electricity yield for the sun-tracked PVT system reached 215.7 kWh/m
2/year, compared to 160.9 kWh/m
2/year for the stationary system, resulting in a 34% net gain (+54.8 kWh/m
2/year).
In terms of thermal performance, the sun-tracked system produced 375.4 kWh/m2/year of heat, compared to 200.8 kWh/m2/year for the stationary configuration: an increase of 174.4 kWh/m2/year or 85%. This confirms that dual-axis tracking not only improves electrical generation but also significantly enhances thermal energy recovery.
These findings demonstrate that hybrid PVT systems equipped with sun tracking and active cooling can substantially outperform both conventional PV systems and stationary PVT configurations in moderate climates. The combination of electricity and heat production makes such systems a promising alternative for maximizing solar energy use in space-constrained or energy-intensive applications.
4. Discussion
The experimental results demonstrate that both the electrical and thermal performances of PVT systems can be significantly improved through the use of dual-axis sun tracking and active cooling. Sun-tracked PVT modules generated up to 42% more gross electricity annually than stationary modules, and 34% more net electricity after accounting for system self-consumption. These gains reflect the ability of tracking systems to extend daily exposure to solar irradiance and maintain optimal panel orientation throughout the year.
Thermal energy recovery also showed substantial improvements. Sun-tracked PVT modules produced 85% more thermal energy per square meter compared to stationary ones. This was achieved through the combined effect of higher solar exposure and the modular cooling system, which efficiently removed heat from the PV modules while also capturing energy from the surrounding air. As a result, the system functioned not only as a PV cooler but also as a low-temperature air-sourced thermal collector.
Additionally, a comparison with PVGIS estimates confirmed that even the stationary PVT system generated 14.8% more electricity annually than a standard fixed PV installation. This difference exceeds typical inter-annual variability and confirms the beneficial impact of integrated PV cooling on overall system efficiency.
The energy generated by the PVT systems also contributed meaningfully to building energy needs. During the spring–summer period, the system covered approximately 39% of the electricity demand, reaching up to 66% in July and August. About 15% of the generated electricity was used to power system components such as inverters, pumps, and trackers, which is a typical level of internal consumption for hybrid systems with active control.
While the performance gains of sun-tracked PVT systems are evident, it is also important to consider the added complexity, significant material costs, and energy use of tracking mechanisms. These systems may be best suited for applications where space is limited or where module orientation cannot be optimized using conventional fixed mounts.
5. Conclusions
This paper presented a full-year experimental evaluation of two photovoltaic–thermal (PVT) systems—stationary and sun-tracked—equipped with a modular liquid cooling system. The systems were installed on a real building in a temperate climate in southern Poland. The results confirmed that the application of dual-axis tracking leads to a significant increase in total energy yield. The sun-tracked PVT modules produced 42% more electricity and 85% more thermal energy per unit area compared to the stationary system.
The stationary PVT system alone outperformed a conventional fixed PV installation, as its annual electricity production was 14.8% higher than the reference values estimated using PVGIS. These findings emphasize the value of active cooling in maintaining PV performance and enabling effective thermal energy recovery throughout the year.
The total thermal energy recovered over the 12-month measurement period reached 28.5 MWh. The recovered heat, although relatively low in temperature, is suitable for integration with low-temperature systems such as ground-source heat pumps. Importantly, approximately 15% of the electricity generated by the PVT modules was used to power auxiliary components, including inverters, circulation pumps, and tracking motors. Despite this internal consumption, the system demonstrated the ability to cover up to 66% of the building’s electricity demand during the summer months.
The modular cooling system used in the study proved to be effective, mechanically robust, and compatible with different module types. Its simple integration with both stationary and sun-tracked systems makes it a viable solution for hybrid solar installations in various applications. While sun-tracked systems offer clear performance advantages, their higher complexity and energy use may limit their cost effectiveness in certain contexts. Therefore, the choice between stationary and sun-tracked PVT configurations should be based on site-specific factors, such as available space, solar access, and energy demand profiles.
Further research should address the optimization of system control strategies, the energy balance of auxiliary systems, and the integration of PVT installations with thermal storage and building energy management systems. The findings presented in this study contribute to the practical development and deployment of PVT technology under real operating conditions and provide a valuable reference for future applications in Central European climates.


