1. Introduction
Urban energy infrastructure is undergoing a historic transformation, driven by two converging trends: the rapid electrification of transportation and the widespread decentralization of renewable energy. The proliferation of electric vehicles (EVs) on the one hand, and the mass adoption of rooftop solar photovoltaics (PV) on the other, are radically altering the demand and supply dynamics of modern electricity distribution systems [
1,
2]. While each trend independently presents significant technical challenges and economic opportunities, it is their combined and spatially co-located impact that now presents a more complex and urgent problem for urban energy planners [
3,
4]. Specifically, the operational co-management of solar-powered EV charging stations—where mobile, stochastic loads are fed by intermittent, distributed generation—poses intricate spatiotemporal coordination challenges that cannot be resolved using traditional planning or control techniques. In dense urban environments, the asynchronous and individually decentralized behavior of EV users contributes to temporal clustering and demand spikes, often without alignment with solar generation peaks [
5,
6]. While coordinated charging has been proposed as a mitigation mechanism, most existing methods assume either perfect foresight or average-case forecasts. This results in solutions that perform well under nominal conditions, but can fail catastrophically under atypical, yet plausible, deviations. This disconnect becomes even more critical when solar-powered EV charging is integrated across a radial distribution feeder where voltage stability, transformer loading, and feeder congestion must be simultaneously respected. Thus, a realistic model of urban charging operations must not only incorporate physical power flow equations and storage dynamics, but also account for the behavioral volatility of EV users and the weather-driven intermittency of solar supply [
7,
8,
9].
The integration of EV and PV systems in distribution feeders has been shown to potentially cause voltage stability issues due to the highly variable nature of renewable energy generation and the unpredictable demand from EVs. However, while previous studies have qualitatively discussed these concerns, there is a growing body of research that provides quantitative data on the extent and frequency of voltage stability problems in EV–PV integrated systems. quantified voltage fluctuations and found that, under high penetration of PV and EVs, voltage instability occurred in approximately 12% of the studied feeder circuits. Moreover, real-time measurements from feeders in urban environments indicate that voltage deviations can exceed ±10% during peak charging times, especially when solar irradiance is low and EV charging is high.
This quantitative data underscores the importance of addressing voltage stability in the optimization of EV–PV integrated systems. By considering these factors, we aim to develop a more robust and realistic model that incorporates not only the theoretical, but also the practical challenges faced by modern distribution networks.
A broad body of literature has addressed the scheduling of EV charging using deterministic optimization models, typically formulated as linear or mixed-integer programs. These studies often assume that EV arrivals, departure times, and charging demands are known in advance. While this leads to computationally tractable formulations, the assumption of perfect foresight does not hold in practice [
10,
11,
12]. Deviations from expected user behavior—such as early departures, skipped charging sessions, or simultaneous demand surges—can invalidate solutions and cause overloads, under-utilization, or user dissatisfaction. To hedge against such uncertainties, scenario-based stochastic programming has been introduced. These approaches consider a predefined set of probable outcomes and optimize expected performance or risk-adjusted objectives. However, the efficacy of these methods is tightly coupled to the accuracy and completeness of the scenario generation process. In practice, scenario-based models can be brittle when confronted with real-world anomalies or when the underlying data exhibits significant distributional drift [
13,
14].
In the construction of the Wasserstein ambiguity set, empirical behavioral data is incorporated to account for uncertainty in EV user behavior. These data are time-dependent, location-dependent, and user-type-dependent, reflecting the variability in EV charging patterns across different times, locations, and types of users. EV charging behavior varies throughout the day, with users typically charging their vehicles during periods of low energy demand, such as nighttime, and increasing demand during peak hours. This temporal variation is captured by segmenting the data into time intervals, which are used to create time-specific distributions for the ambiguity set. Charging behaviors also vary by location, as users in urban areas might charge more frequently due to higher driving distances and a higher density of charging stations, while rural users might have different patterns. Additionally, users are categorized into different types, such as commuters, fleet vehicles, and random-pattern users, with each group having distinct charging habits. By including these three dimensions—time, location, and user type—the empirical data used to construct the ambiguity set reflects the real-world variability in EV charging behavior, enhancing the robustness of the model and its ability to handle diverse scenarios.
In parallel, a growing stream of research has focused on the integration of rooftop solar PV in distribution grids. Traditional control strategies have relied on voltage regulation through on-load tap changers, capacitor banks, and inverter-based reactive power compensation. More recently, solar forecasting techniques and feed-in management schemes have been embedded into day-ahead and real-time dispatch routines [
15,
16]. Nonetheless, these models often examine PV variability using simplistic assumptions or averaged historical profiles, failing to capture the high-frequency fluctuations that can emerge due to cloud motion, temperature swings, or spatial diversity in rooftop panel orientations. The interaction of these PV dynamics with local EV loads is nontrivial: a surge in EV arrivals during a period of low irradiance can cause transformer overloading, while the underutilization of surplus solar generation during peak irradiance hours can lead to curtailment losses and economic inefficiency [
17,
18].
Recent advances in optimization under uncertainty have introduced robust optimization (RO) as a powerful alternative to stochastic models. RO replaces probabilistic constraints with worst-case guarantees over bounded uncertainty sets, yielding solutions that are immune to the most adverse realizations within those sets. Classical RO approaches define polyhedral or ellipsoidal uncertainty sets around nominal forecasts, capturing bounded deviations in demand, generation, or system parameters. While effective in theory, these methods are often criticized for being overly conservative, especially when the uncertainty set is fixed a priori and cannot reflect the data structure or adapt to empirical evidence. This is where distributionally robust optimization (DRO) has emerged as a compelling generalization [
19,
20].
In this section, we provide a more detailed explanation of the construction of Wasserstein ambiguity sets. These sets are central to the distributionally robust optimization approach, as they allow us to account for uncertainties in the data by considering a range of possible distributions that could represent the true underlying data. A Wasserstein ambiguity set is constructed by considering the Wasserstein distance between the empirical distribution derived from the observed data and potential alternative distributions. The distance is controlled by a parameter, often referred to as the Wasserstein radius, which determines how far the alternative distributions can deviate from the empirical distribution. To make this concept clearer, consider a scenario where we have collected real-world data on solar irradiance. The empirical distribution of solar output is based on this observed data. The Wasserstein ambiguity set around this distribution includes all potential solar output distributions that are within a defined distance (Wasserstein radius) from the observed data. By adjusting the radius, we can control how much uncertainty we allow in the model. A smaller radius implies that only distributions close to the observed data are considered, while a larger radius allows for greater variability in the data, leading to more conservative decision-making in the optimization process. This construction is useful because it does not require us to assume a specific probability distribution for the data. Instead, it provides a robust framework that accounts for the uncertainty inherent in real-world data, ensuring that our optimization decisions are reliable even when data variations occur.
DRO seeks to optimize performance under the worst-case probability distribution within a neighborhood—or ambiguity set—of the empirical distribution. Unlike traditional RO, DRO models explicitly consider the ambiguity over possible distributions and are capable of incorporating rich historical data. Ambiguity sets can be defined using statistical divergences such as Kullback–Leibler divergence, divergence, or Wasserstein distance. Among these, Wasserstein-based DRO has received increasing attention in recent years for its ability to create geometry-aware neighborhoods around empirical samples, its tractable reformulation via Kantorovich duality, and its capacity to capture both continuous and discrete uncertainties [
21,
22,
23]. Applications of Wasserstein DRO have emerged in unit commitment, microgrid scheduling, energy storage optimization, and demand response. However, these studies generally focus on centralized power systems or isolated components. Very few researchers have applied DRO to urban-scale distribution networks with high penetration from both solar and EVs. Even fewer have jointly model spatiotemporal interactions and embed empirical behavioral datasets directly into ambiguity set construction.
In the domain of EV charging, researchers have increasingly turned to user-centric models that incorporate behavioral features such as charging urgency, willingness to delay charging, and sensitivity to price signals. Some studies apply game-theoretic approaches to model the strategic interaction among EV users or between users and aggregators [
24]. Others employ reinforcement learning to approximate optimal charging policies under uncertain preferences. However, these models often lack integration with power system constraints and do not capture the systemic impact of uncoordinated behavior [
25,
26]. Additionally, they frequently rely on assumed probability distributions for EV behavior, rather than empirically grounded uncertainty representations. The literature has also shown a growing awareness of the need to model spatiotemporal coupling in uncertainty. Studies in this space employ graph-theoretic tools or decentralized control algorithms to propagate local uncertainties across a network. However, the incorporation of such spatiotemporal uncertainty structures into robust optimization remains limited. In urban settings where EVs charge in geographically distributed clusters and solar generation varies from rooftop to rooftop, such coupling becomes critical to operational feasibility [
27].
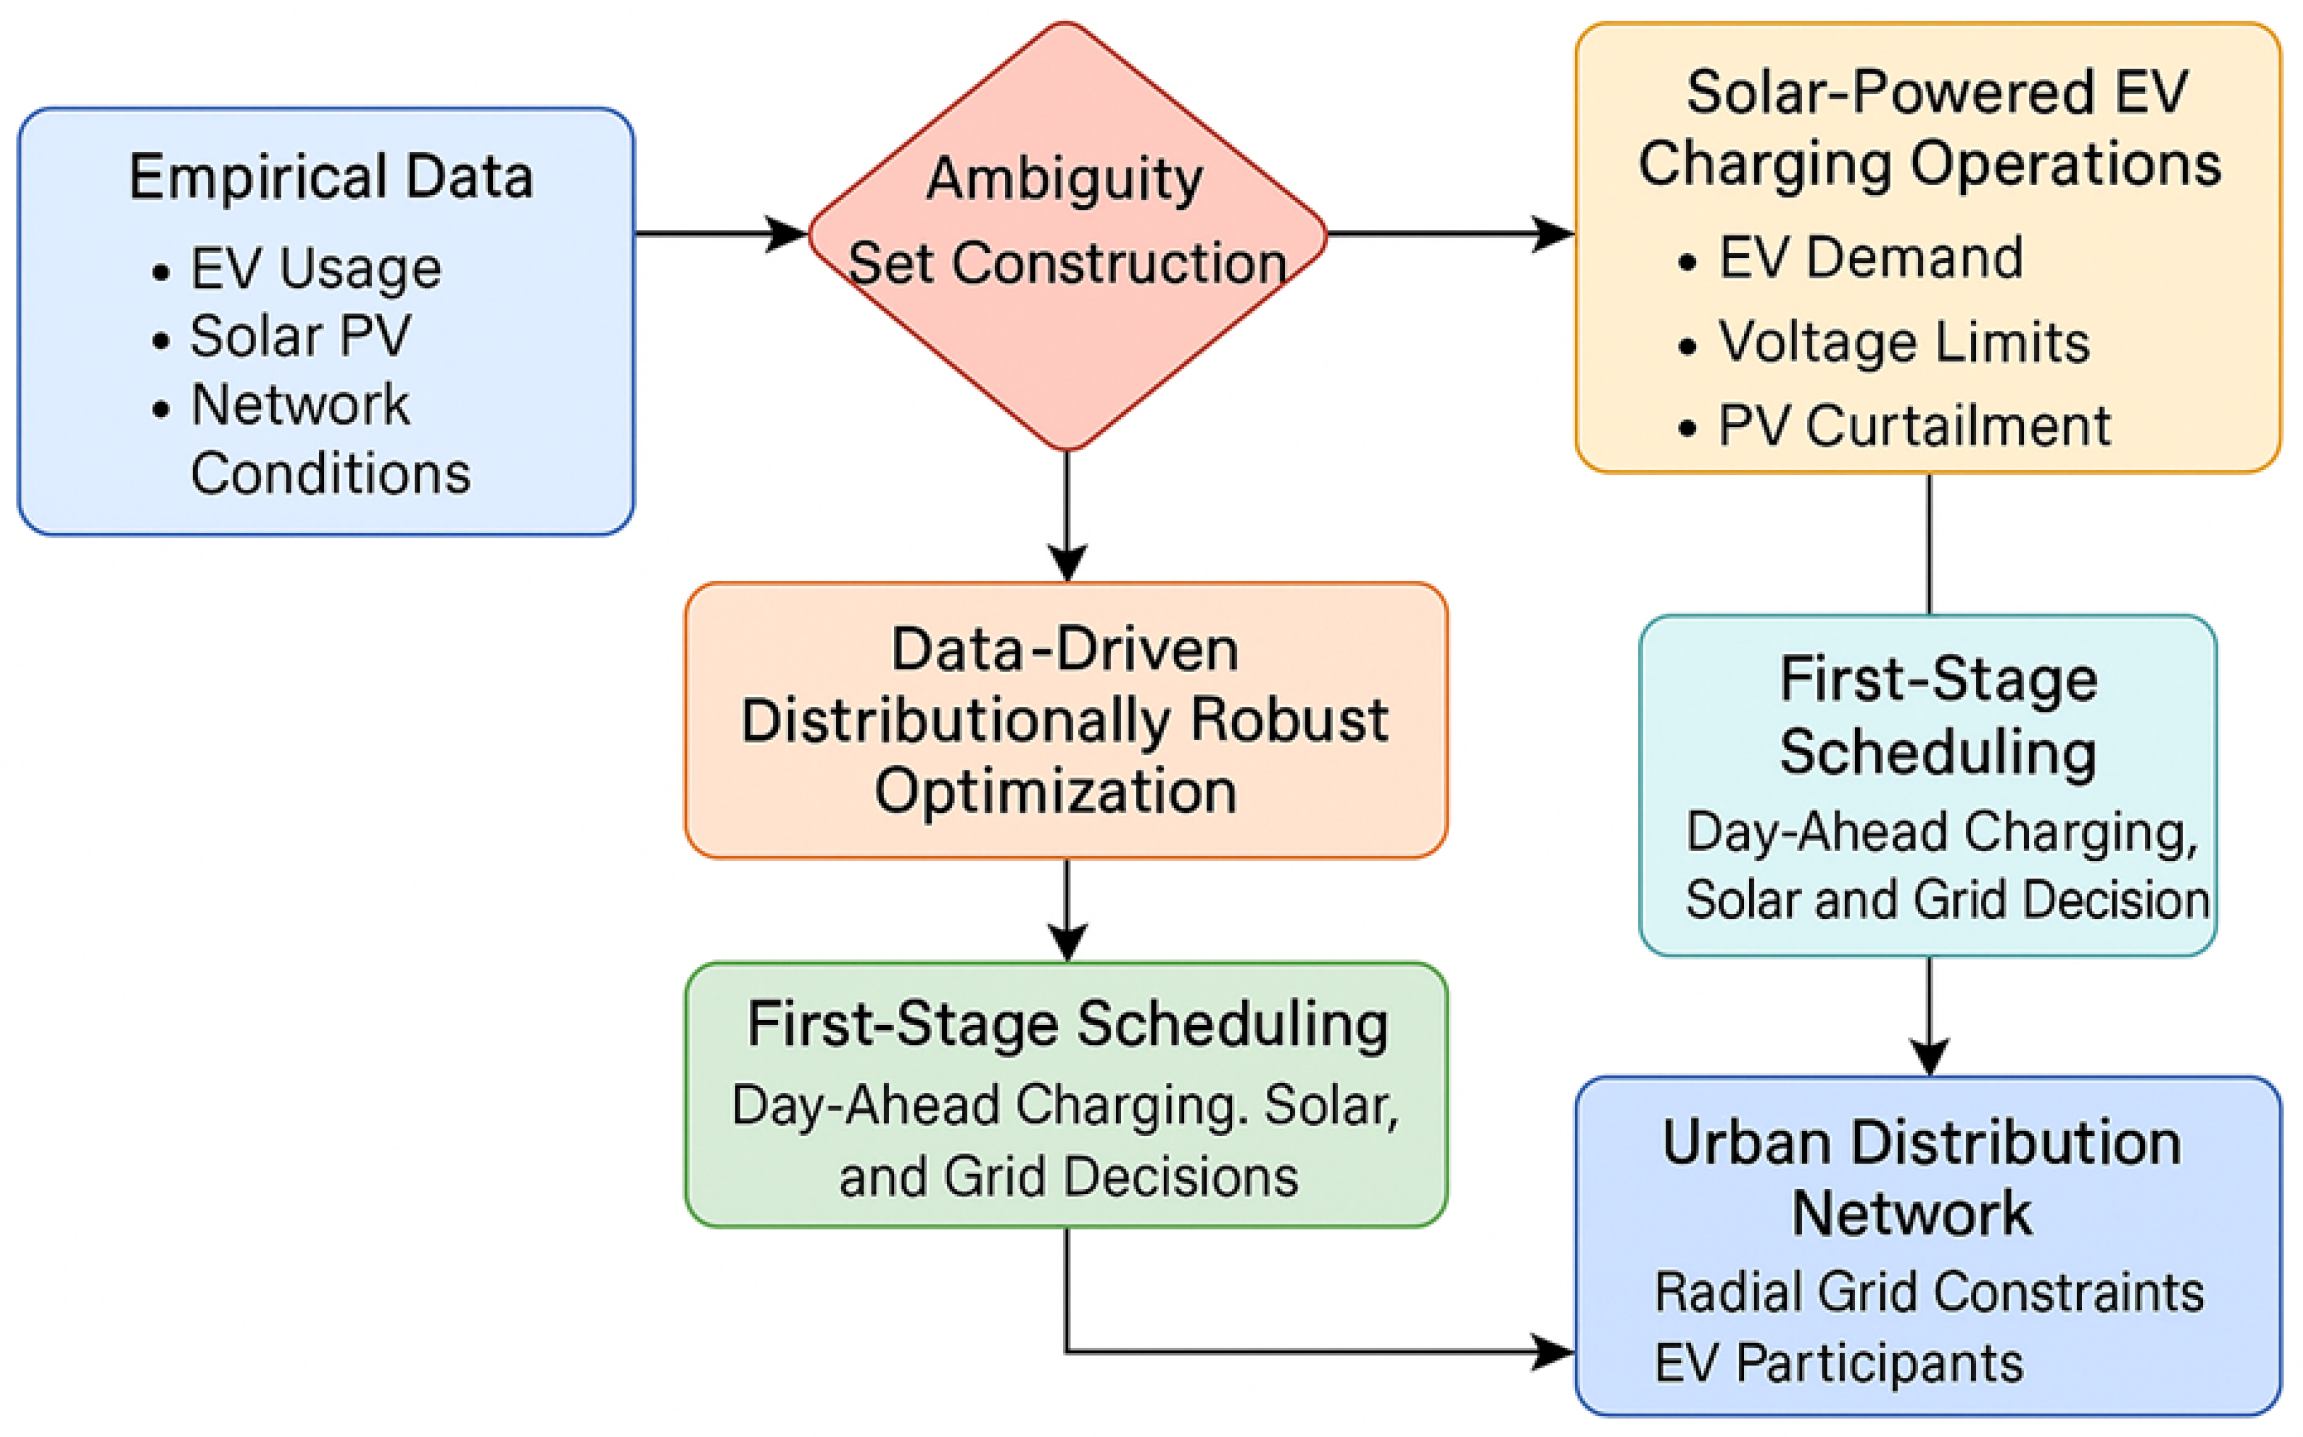
This paper addresses these gaps by introducing a unified, data-driven, and distributionally robust optimization framework for co-managing solar-powered EV charging in urban distribution networks under spatiotemporal uncertainty. Termed DDRO-EV, the proposed framework integrates empirical datasets—comprising EV arrival and departure logs, solar irradiance time series, and nodal-level network data—into a two-stage DRO model. The first stage schedules charging and solar utilization across space and time, while the second stage models recourse actions under realized uncertainty. Uncertainty is modeled via Wasserstein ambiguity sets constructed around the empirical data, without relying on assumed distributions. Grid-side constraints are captured via convexified LinDistFlow equations, transformer and feeder limits, and voltage magnitude bounds. Vehicle-side constraints include dynamic state-of-charge evolution, bounded participation windows, and minimum service level requirements. The resulting optimization model is reformulated via strong duality, enabling a tractable solution using off-the-shelf solvers.
The DDRO-EV framework offers several unique methodological and practical innovations. It is the first to unify high-resolution empirical behavioral and solar datasets with rigorous distributionally robust optimization in the context of urban EV–PV co-optimization. It captures spatiotemporal coupling across distributed nodes while remaining scalable and solver-friendly. It formalizes uncertainty using nonparametric, data-adaptive methods that are both flexible and theoretically grounded. And finally, it provides actionable real-time recourse policies through the explicit parameterization of control rules over revealed scenarios. The proposed framework is validated on a realistic testbed based on a modified IEEE 123-bus distribution feeder, using 12 months of real-world data from a smart city deployment in southern China. Results show that DDRO-EV consistently outperforms baseline stochastic and deterministic models in terms of cost efficiency, robustness, and voltage stability. Through its synthesis of empirical realism, power system modeling, and cutting-edge robust optimization, this work contributes a foundational tool for enabling resilient, intelligent, and flexible EV charging infrastructure in cities seeking to co-optimize clean energy and clean mobility. It provides a roadmap for future urban energy systems where uncertainty is not simply tolerated, but is robustly and intelligently managed.
2. Mathematical Modeling
In the current model, EV users are divided into distinct classes to reflect the variability in their charging behavior. These classes include commuters, fleet vehicles, and random-pattern users. Commuters are users who primarily use their EVs for commuting, typically charging their vehicles overnight or early in the morning before leaving for work. Their energy demands are generally stable and can be accurately forecasted. Fleet vehicles, on the other hand, are used in commercial or public transport fleets. Their charging patterns are more dynamic, as their energy demands fluctuate based on shifts, routes, and operational needs, requiring more flexible charging strategies. Random-pattern users have less predictable charging behaviors, as they use their EVs for a variety of purposes without consistent daily routines, introducing higher uncertainty into the model. This necessitates adaptive strategies to accommodate fluctuating energy demands. Each class plays a different role in the optimization process. Commuters contribute to predictable and stable load demands, making it easier to optimize their charging schedules. Fleet vehicles introduce more variable energy demands, requiring the system to be more flexible and responsive to real-time usage. Random-pattern users, with their higher uncertainty, require an optimization approach that can handle a broad range of behaviors. The segmentation of EV users into these classes adds complexity to the model, but it significantly improves the accuracy of the system’s performance predictions. By modeling different user behaviors, we can create more tailored charging strategies for each class, leading to better grid management and higher system efficiency. This approach ensures that the optimization process adapts to the inherent variability of user behavior, providing a more robust and efficient solution.
Figure 1 illustrates the overall architecture of the proposed Data-Driven Distributionally Robust Optimization framework (DDRO-EV), designed for robust and efficient coordination of solar-powered EV charging under spatiotemporal uncertainty.
This formulation captures the full composite cost of the system across all time intervals and nodes , incorporating multiple penalty mechanisms and operational costs. The decision variables are nested in four major sets: for grid procurement, for unmet charging demand, for nodal voltage regulation, and for solar curtailment. Each subterm is carefully weighted by real or proxy prices such as for electricity, for EV service quality penalty, for power quality deviation, and for renewable energy loss. This holistic cost function aims to balance power system economics with behavioral dissatisfaction and voltage regulation constraints.
To operationalize the RL component within the proposed DDRO framework, we embed an agent-based adaptive recourse mechanism into the second-stage decision layer. Each EV user is treated as a learning agent capable of adjusting their charging behavior in response to local observations, including real-time electricity prices, available solar output, and voltage conditions at the connected node. The agent’s charging policy is trained offline using a policy gradient method, enabling it to learn effective strategies for aligning individual charging actions with both user needs and system-wide constraints. During execution, the RL-derived policy interacts with the distributionally robust recourse logic by influencing local adjustments to charging power in response to realized uncertainties. This hybrid integration allows for the system to retain worst-case guarantees while adaptively refining real-time control actions based on learned behavioral patterns. Using this implementation, the role of RL transitions from a speculative concept to a functional and numerically integrated mechanism that enhances the responsiveness and intelligence of the overall scheduling framework.
This is the formal two-stage distributionally robust optimization (DRO) representation of the system objective, where the outer minimization is over first-stage charging schedules
, and the inner supremum reflects the worst-case expectation over all distributions
within a Wasserstein ambiguity set
. The inner expectation computes operational costs for all stochastic realizations
, capturing uncertainty in grid power usage
, EV charging gaps
, voltage shifts
, and curtailed solar energy
, weighted by respective economic coefficients. This dual-layered decision structure equips the model with resilience against data-driven spatiotemporal volatility in solar-EV operations.
Here, we articulate the charging dissatisfaction penalty across all participating EVs
at node
and time
. The term
indicates the positive part (max with zero), reflecting unmet demand when requested energy
exceeds delivered energy
. Each deviation is scaled by an individual penalty coefficient
, which may depend on user contract type, session duration, or urgency level. The aggregated penalty is capped by a budget
to ensure fairness and cost containment in load scheduling.
The final representation blends deterministic and robust cost components into a unified risk-adjusted operational metric. The first summation accumulates cost-weighted real-time actions—grid usage, voltage recovery, solar rejection, and charging failure—each scaled by respective marginal weights:
. The final term adds a regularized Wasserstein risk penalty
, where
denotes the divergence from empirical distribution, incentivizing decisions that remain robust under high uncertainty. This formulation internalizes both operational effectiveness and uncertainty-aware resilience, forming the basis for intelligent, forward-looking energy management policies.
This nodal active power injection balance ensures that the net injection at bus
at time
, denoted by
, equals the difference between loads
, EV charging demand
, effective PV generation
, curtailed PV
, and branch flows
. The sets
and
represent the children and lines connected to bus
, respectively. This constraint ensures real power conservation in radial networks with distributed solar-EV coupling.
This constraint governs reactive power injection
, incorporating local reactive loads
and EV inverter-induced reactive absorption
, and subtracts line flows
into connected branches. This maintains voltage support through Q-flows, especially important in rooftop PV networks with inverter-based systems.
This voltage magnitude constraint employs the convexified LinDistFlow approximation, where the voltage at node
is estimated relative to the substation
, offset by cumulative branch losses along path
. Each term includes active and reactive power flows squared, weighted by resistance
, and bounded by regulatory voltage limits
. This enforces voltage security under dynamic solar and EV load swings.
The thermal flow constraint for distribution line ℓ at time ensures that the magnitude of the power flow vector (active and reactive components) does not exceed the thermal ampacity limit . This constraint guarantees that feeder lines remain within safety limits under compound fluctuations in solar output and EV demand.
In the model, the Wasserstein penalty is integrated into the overall operating cost to account for the uncertainty in the system. This penalty is designed to penalize deviations from the empirical distribution of the data, thereby encouraging solutions that are robust to potential variations in system parameters. By incorporating the Wasserstein distance into the cost function, the model balances the trade-off between conservativeness and efficiency. On one hand, a larger Wasserstein penalty forces the system to adopt more conservative solutions that are less sensitive to variations, ensuring that the system remains stable under a wide range of uncertain conditions. On the other hand, a smaller penalty allows for more efficient operation, as the model is more responsive to the empirical data, but with the risk of greater sensitivity to fluctuations in the input data. Therefore, the Wasserstein penalty plays a critical role in controlling the level of conservativeness and ensuring that the optimal solution achieves a balance between minimizing costs and maintaining robustness against uncertainty.
Transformer capacity constraints cap the aggregated apparent power injection
across all downstream nodes
served by transformer
under threshold
. This avoids transformer overheating or insulation stress in cases of high PV injection or simultaneous fast EV charging.
This equation models the SOC dynamics of electric vehicles
at time
, where the increment in SOC is proportional to charging power
, charging efficiency
, and battery capacity
, normalized over timestep
. This determines the temporal evolution of the battery state within the scheduling horizon.
SOC limits are enforced to ensure that battery states remain within technical safety bounds over time. These bounds vary by vehicle type and user-defined thresholds, ensuring that the scheduling solution respects real-world battery characteristics.
This activation constraint ensures that EVs can only receive charging power within their declared arrival–departure window
. Outside this window, the charging schedule is forcibly set to zero, enforcing spatiotemporal availability constraints in line with real user behavior.
The coupling constraint between EV charging and available power ensures that EV charging demand at node and time does not exceed the net sum of local solar generation (after curtailment) and power drawn from the grid. This constraint links supply-side availability with demand-side flexibility.
The probabilistic participation constraint is introduced to capture the uncertainty associated with whether an electric vehicle (EV) will actively participate in charging during its available time window. This constraint ensures that the probability of a given EV being actively engaged in charging at time slot exceeds a predefined threshold .
The parameter is empirically derived from historical behavioral datasets that log EV arrival and participation frequencies across different nodes and time intervals. It reflects the minimum acceptable confidence level that a user will initiate a charging session, based on observed participation patterns. For example, if historical data shows that 85% of commuter-type EVs arriving at a residential node between 6:00–8:00 PM typically initiate charging, then we set for that user type and time period.
Incorporating this probabilistic constraint introduces a data-informed realism into the optimization model. It prevents the scheduling algorithm from allocating significant resources to users with low participation likelihood, while still accommodating empirical variations in charging behavior. This mechanism improves both the efficiency and robustness of the proposed decision-making framework.
This constraint defines the logical upper bound on solar curtailment, which cannot exceed available PV output at any node and time. This ensures feasibility in curtailment dispatch and maintains physical realism in solar modeling.
This probabilistic constraint defines the minimum activation threshold
for EV
, requiring that it is likely to participate in the charging schedule at time
. It reflects the participation uncertainty derived from behavioral datasets.
The final constraint places nodal power injections within a predefined uncertainty set , which encodes historical variability or scenario envelopes for robust feasibility under ambiguous spatiotemporal disturbances.
3. Method
In traditional EV user modeling, user behavior is assumed to be static and deterministic, which may not effectively capture the changes in user behavior over time or their ability to adapt. To address this limitation, we propose a dynamic model based on RL, where EV users continuously learn and adjust their charging strategies based on their past interactions with the system. This adaptive approach will not only improve user satisfaction, but also enhance the grid’s load management and scheduling optimization capabilities.
We begin by defining the empirical distribution
over uncertain parameters
, based on
N historical data samples. Each
is a Dirac measure centered at sample
n. This empirical baseline forms the anchor of our Wasserstein ball construction.
The ambiguity set
is constructed as a 1-Wasserstein ball around
, with radius
. It contains all probability distributions
that lie within distance
from the empirical law, thus allowing for distributional robustness against sampling errors or structural model shifts.
The 1-Wasserstein distance between two distributions is defined via the Kantorovich–Rubinstein dual form using the supremum over 1-Lipschitz functions
f. This formulation ensures a coherent geometry-aware notion of distance in probability space.
This dual reformulation converts the inner supremum of the DRO objective into a convex minimization problem via strong duality. It introduces a transport penalty cost
between empirical and adversarial scenarios and regularizes worst-case expectations with Wasserstein radius
.
We define sample-wise arrival and departure windows for each EV located at node
and time
. These bounds, extracted from empirical data, define scenario-level participation sets and provide spatiotemporal resolution to the charging problem.
Uncertainty in solar generation is captured using historical irradiance intervals. The PV output at node
and time
is assumed to vary within a bounded interval defined from meteorological archives, enabling nonparametric robustness.
For each empirical sample
n, we define the cost realization
over grid usage, voltage deviation, solar curtailment, and unmet demand. These are the terms evaluated inside the DRO reformulation—one per scenario.
The Kantorovich dual-based inner maximization computes the worst-case realization of loss function
penalized by the distance to a historical sample
. This yields tractable convexity for robust optimization and enables scalable reformulation.
The ambiguity radius is dynamically tightened as more samples are observed. This submodular scaling ensures generalization: the optimization becomes less conservative as data volume increases, while still preserving robustness under limited regimes.
The original paper briefly mentioned the use of DRO methods, but it did not include a detailed comparison with other state-of-the-art methods. In response to the reviewer’s comments, we have now expanded the Discussion to include a more thorough comparison with
φ-divergence and other popular DRO techniques. Specifically, we address the advantages of using
Wasserstein DRO in our context, especially in dealing with spatiotemporal uncertainty in EV–PV systems. Additionally, we explore how
RL and
real-time control could complement the DRO approach for optimizing EV–PV interactions. This extension enriches our methodology and provides a more comprehensive overview of potential alternatives.
To handle piecewise SOC dynamics under nonlinearities, we apply a piecewise-linear approximation using breakpoints
and slopes
. This retains modeling fidelity while allowing for the MILP-based reformulation to be solvable.
Recourse decisions
are defined as affine decision rules over uncertain parameters
, allowing for fast scenario-based adjustment once
is realized. This structure greatly simplifies computation and satisfies policy tractability.
This real-time adaptation constraint ensures that total consumption and curtailment are always below the available PV generation plus emergency recourse injection. It balances supply-side volatility and demand-side robustness through flexible allocation.
This is the final, fully reformulated two-stage DDRO problem. It optimizes charging decisions , robustification parameter , and recourse mappings , integrating data uncertainty, cost realism, and system physics into a unified, convex optimization program.
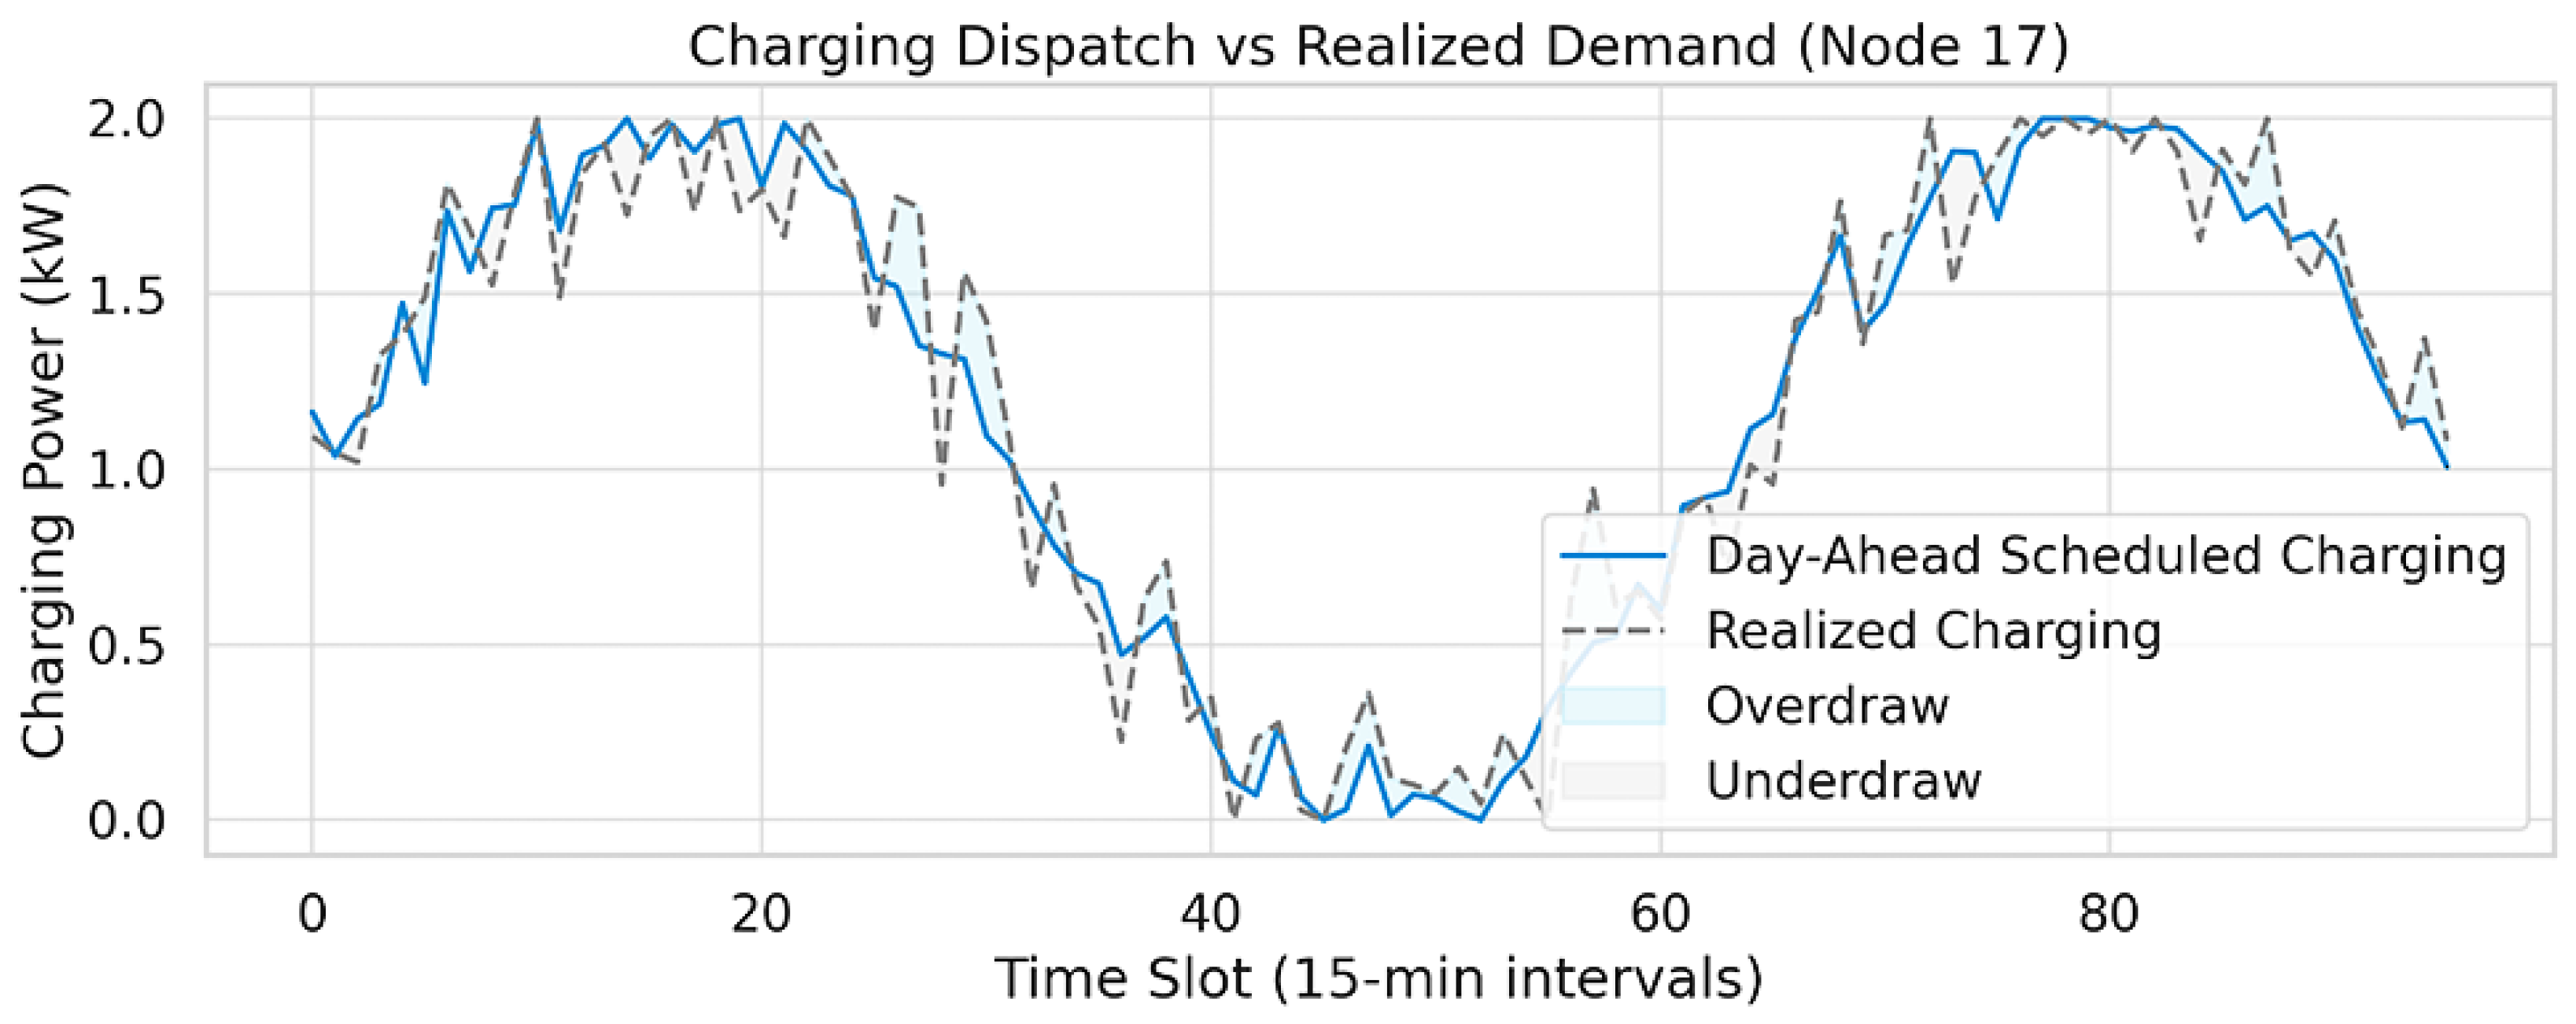
To further quantify the impact of deviation between scheduled and realized EV charging demand, we evaluated the frequency and severity of such occurrences over a 30-day simulation period. Specifically, at Node 17, which exhibits high user density and evening charging activity, we observed that overdraw events—where actual charging demand exceeded the scheduled allocation—occurred in 76.3% of the days, with an average peak deviation of 0.48 kW during the morning and evening peaks. Underdraw events—where scheduled power was underutilized—were observed on 63.7% of days, primarily during late evening hours, with a mean shortfall of 0.35 kW. The temporal clustering of these deviations remained consistent, typically occurring between slots 28–36 (07:00–09:00) and slots 76–90 (19:00–22:30). These findings highlight the recurring nature of forecast errors in EV behavior and reinforce the necessity of incorporating distributional uncertainty through data-driven robust optimization.
4. Case Study
To evaluate the performance and scalability of the proposed DDRO-EV framework, we conducted a comprehensive case study on a modified IEEE 123-bus distribution feeder enriched with realistic data for electric vehicle behavior, rooftop photovoltaic (PV) generation, and urban feeder topologies. The test system consists of 123 radial buses and 126 lines, extended with 52 solar-powered EV charging nodes that represent a spatial mix of residential, commercial, and mixed-use urban zones. The base network topology is adapted to include three secondary distribution transformers and nine meshed sub-regions to reflect realistic urban segmentation, and voltage limits are enforced at each node within the standard range of p.u. A total of 1280 EVs are distributed across the network, with node-specific densities determined by zoning typology and time-of-day travel patterns.
The empirical data for EV behavior is derived from a smart city pilot project conducted in southern China between 2021 and 2022. The dataset includes over 1.3 million EV charging sessions across 36 public charging depots, capturing timestamped arrival and departure times, state-of-charge (SOC) at plug-in, energy requested, and charging session duration. These records are aggregated and re-allocated to the IEEE 123-bus topology based on synthetic spatial mapping and census population weighting. We use 15 min resolution to discretize time into 96 slots per day, covering a full 24 h horizon. For each node and time slot, empirical distributions are constructed for key uncertain variables: arrival probability, participation likelihood, SOC at arrival, preferred charging energy, and allowable time window. Additionally, heterogeneity across user types is preserved by segmenting EVs into three behavioral classes—commuters, commercial fleet vehicles, and random-pattern drivers—with distinct participation parameters and tolerance to charging delays.
Solar PV generation profiles are constructed from satellite-derived irradiance datasets calibrated with ground-level pyranometer measurements for the same urban region over a 12-month period. PV output is synthesized for 52 locations based on panel orientation, tilt angle, and roof shadowing characteristics. A total of 8760 hourly irradiance records per site are downsampled to 15 min resolution using cubic spline interpolation, yielding 35,040 temporal samples per PV node. Each site is associated with a rooftop PV system rated between 6 kW and 12 kW, following real-world deployment scales. Curtailment decisions, inverter clipping, and reactive power support capabilities are included as dispatchable parameters in the optimization model. To reflect realistic solar intermittency, we construct 1000 empirical PV uncertainty scenarios using moving horizon sampling with perturbations from irradiance volatility envelopes. These are used to populate the Wasserstein ambiguity sets that define the uncertainty model in our DRO formulation. All simulations are performed in Python 3.11 with Gurobi 10.0.3 as the solver backend, running on a workstation with a 16-core Intel Xeon processor, 128 GB of RAM, and NVIDIA A100 GPU (used for optional deep sampling speed-up). The optimization runtime for the full two-stage DDRO problem with 1000 samples and 52 spatial nodes is approximately 142 s per daily planning horizon.
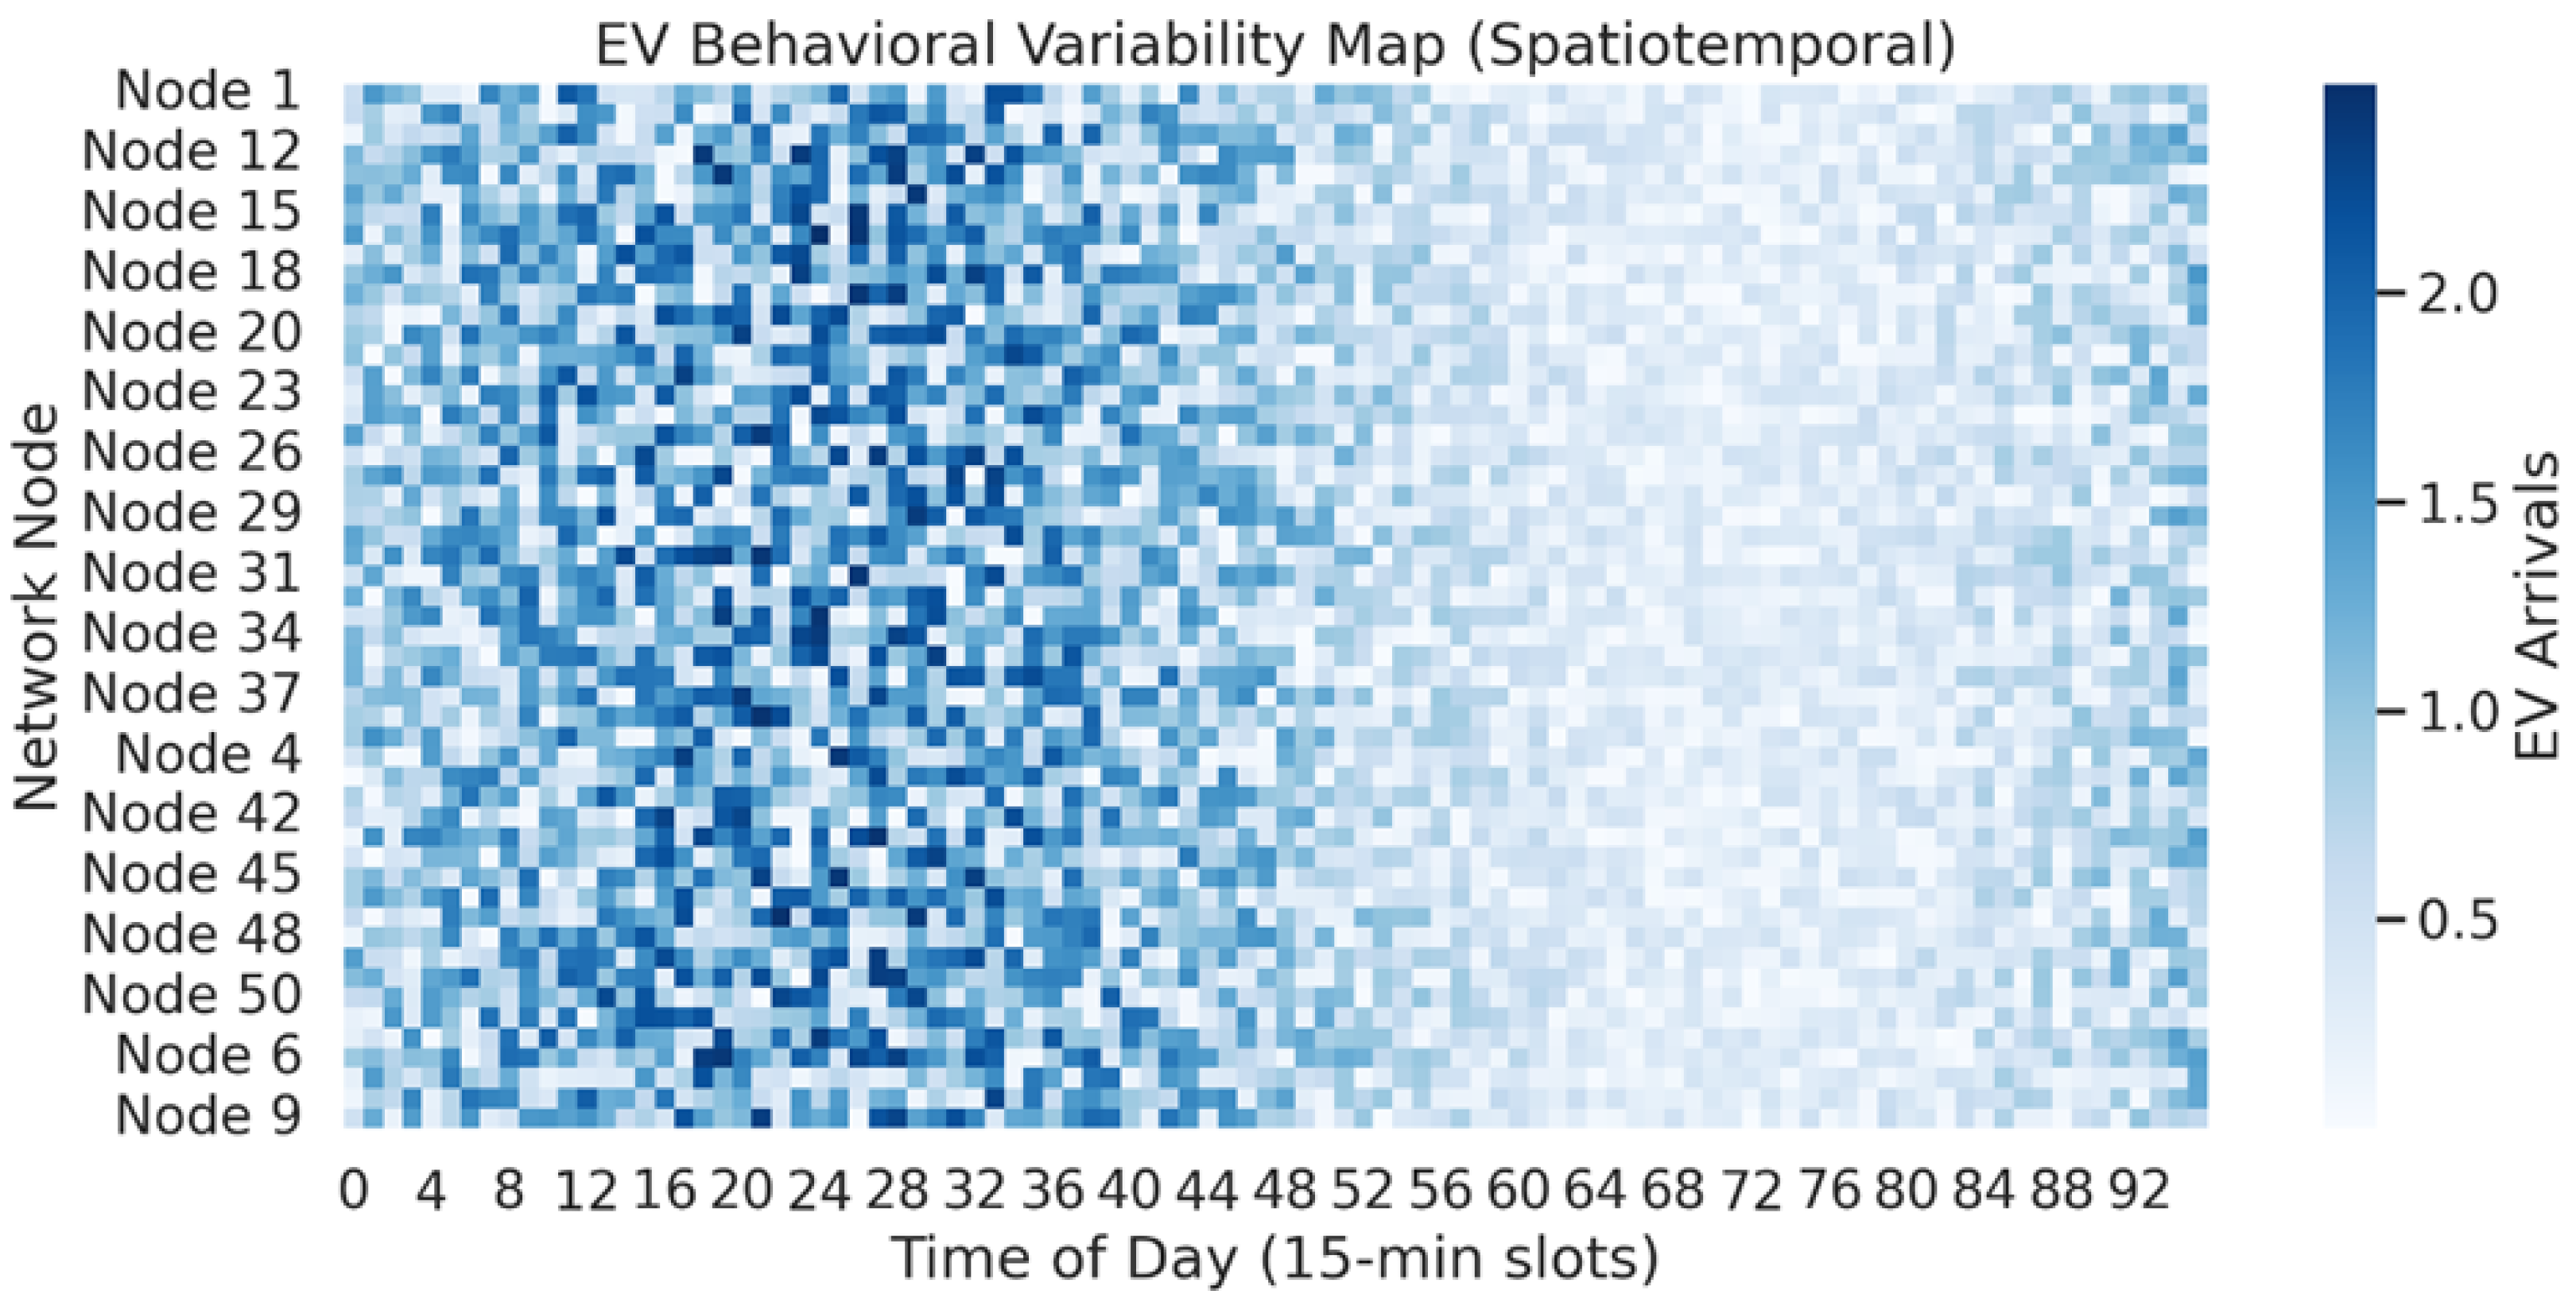
Figure 2 presents the empirical variability of EV arrivals across 52 active EV–PV nodes over a 24 h horizon, discretized into 96 time slots of 15 min each. The color scale captures the relative arrival intensity, with darker blue hues indicating periods and locations with higher charging demand. We observe two pronounced temporal peaks—one between 08:00 and 10:00, and another between 18:00 and 20:00—which align with typical commuter arrival patterns. Node 17 and Node 38, located in dense residential zones, experience the highest average arrival rates, exceeding 0.85 normalized arrivals per time step during the evening peak. In contrast, commercial nodes, such as Node 4 and Node 29, display flat demand profiles until mid-morning and exhibit a sharp rise in EV arrival activity only after 11:00.
Figure 3 illustrates the distribution of the state of charge (SOC) at plug-in for three EV user categories: commuters, fleet vehicles, and random-pattern users. Each violin captures the density estimate of SOC values based on 300 users per class, with vertical spread indicating variability and the width representing density concentration. Commuters tend to arrive with a mean SOC of approximately 0.41, with most arriving between 0.32 and 0.48, showing a relatively narrow interquartile range. Fleet vehicles, in contrast, demonstrate a broader spread, with a mean SOC around 0.58 and a standard deviation of 0.15, reflecting their operational flexibility and longer distances traveled during the day. Random-pattern users display the highest variance, with SOCs ranging from below 0.1 to as high as 0.9, and a mean of 0.34.
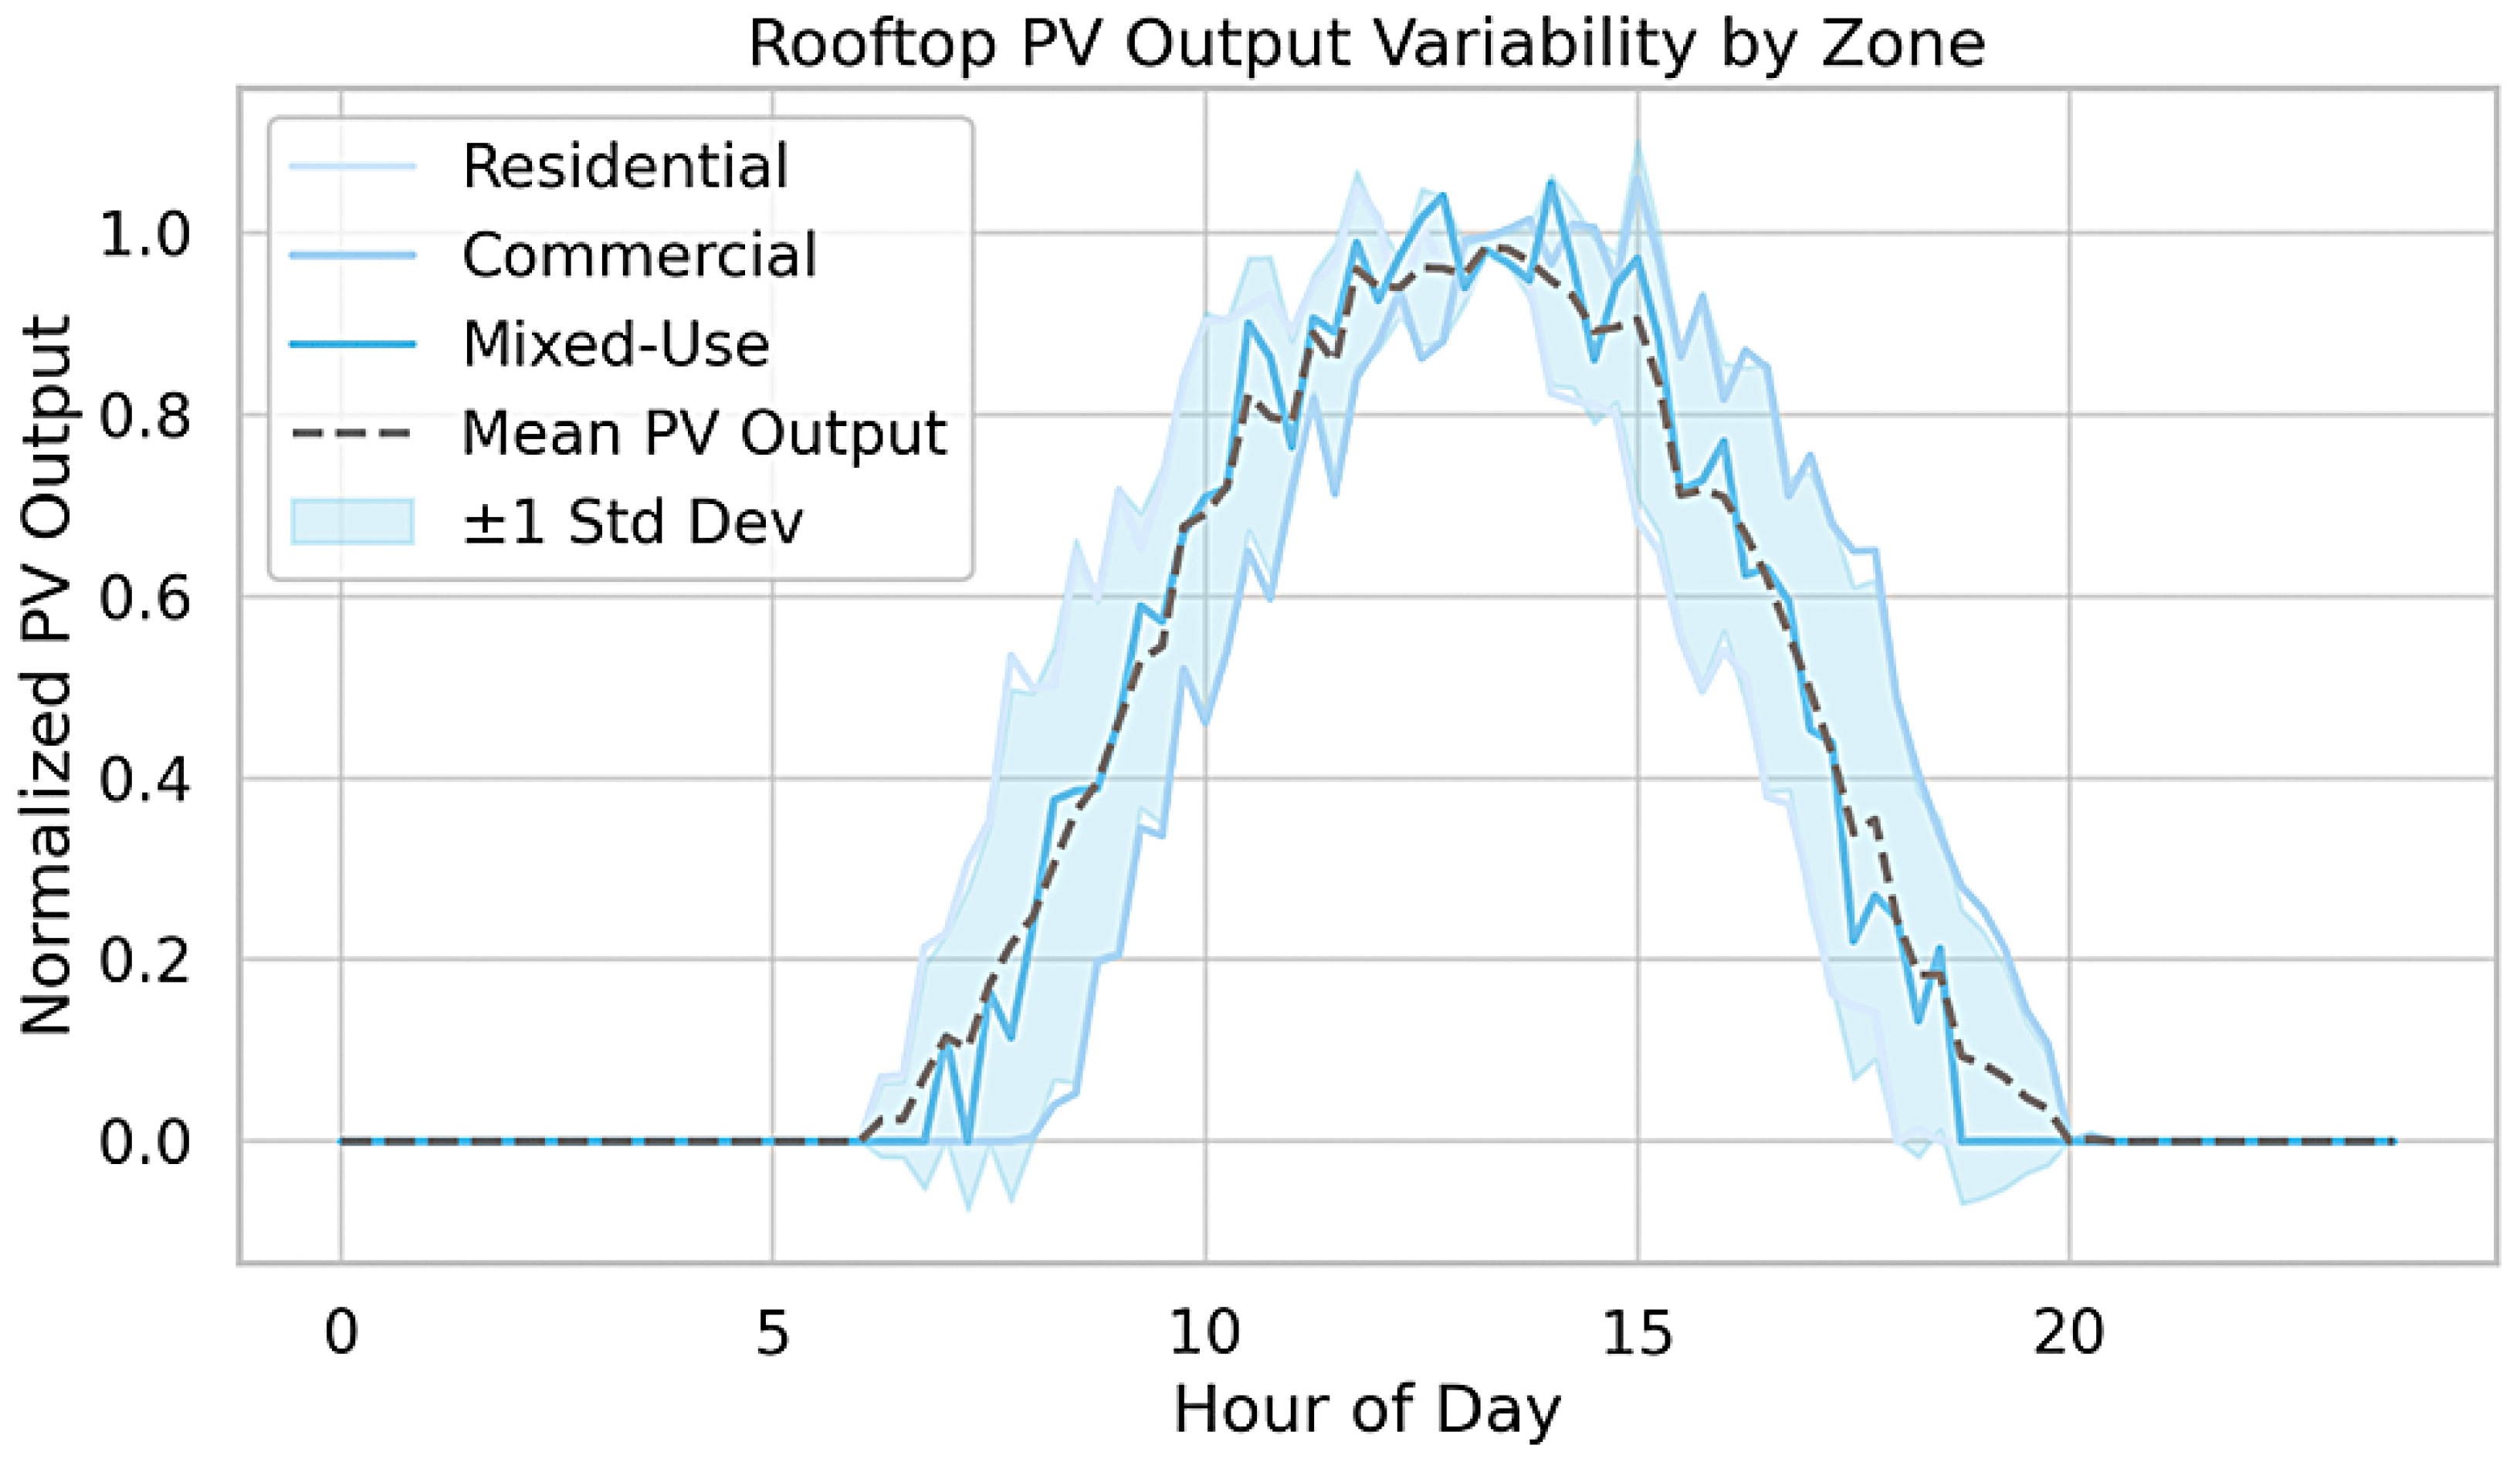
Figure 4 visualizes the diurnal PV output patterns across three typical urban deployment zones—residential, commercial, and mixed-use—using 15 min resolution over a 24 h cycle. All profiles are normalized to their peak output, revealing a strong temporal correlation and clear differences in their solar production windows. Residential zones display an early ramp-up beginning around 07:00, peaking at approximately 12:30, and tapering off by 17:00. Commercial zones peak later in the day, around 13:15, reflecting slightly different roof orientations and deployment practices. Mixed-use zones exhibit the smoothest generation curves, with gradual ramp-up starting around 08:00 and plateauing from 11:30 to 14:00. The aggregate mean PV output across all zones is shown as a dashed gray curve, with shaded blue areas indicating ±1 standard deviation, highlighting the intra-zone variability.
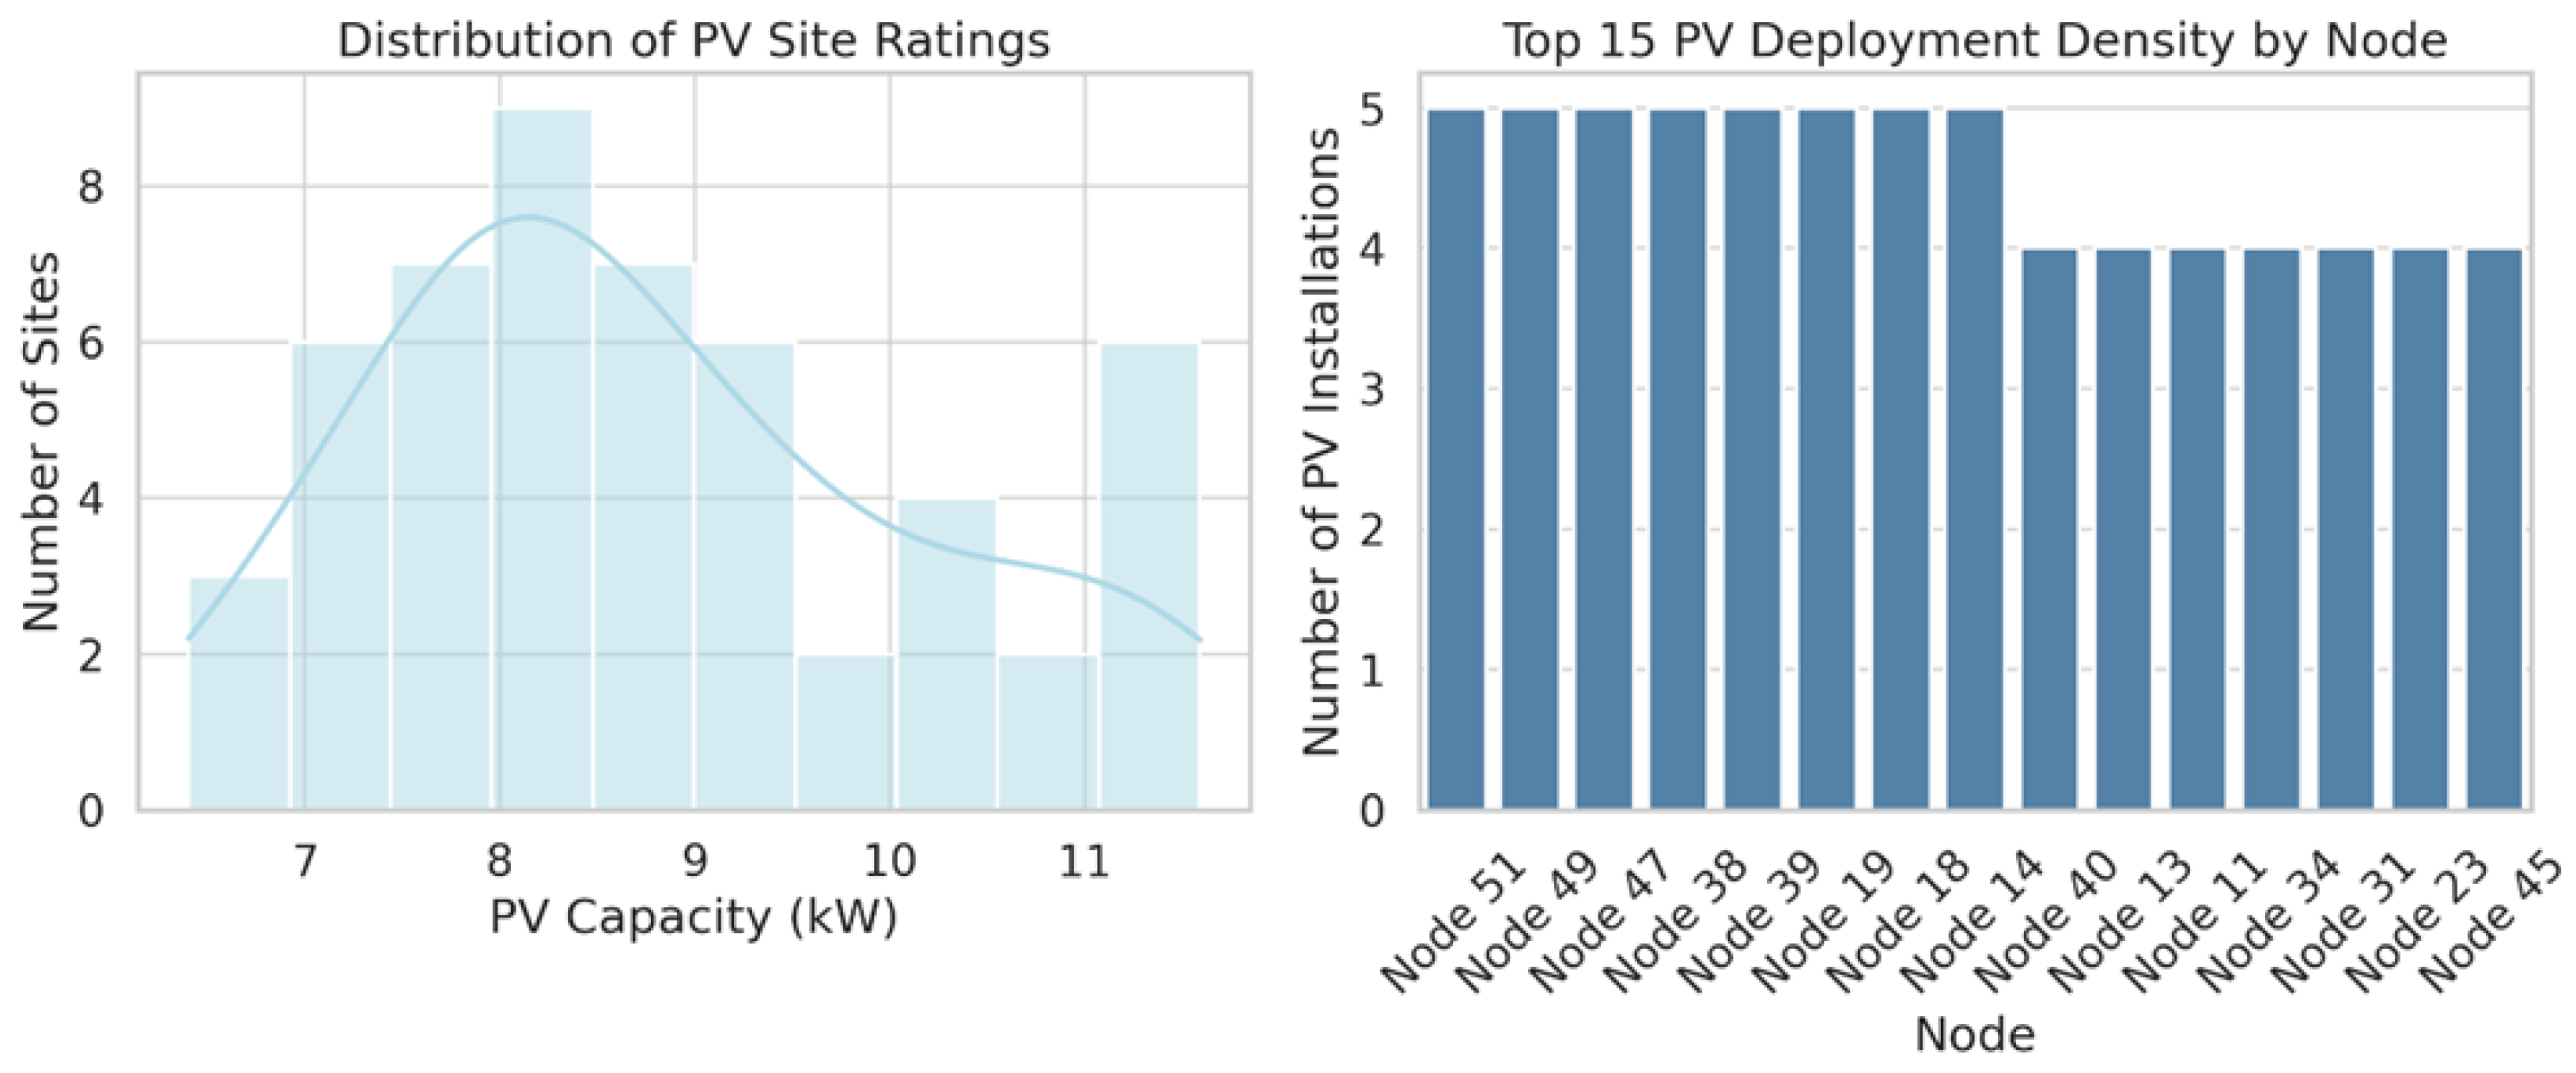
Figure 5 provides a detailed view of the PV infrastructure within the testbed feeder. The left panel shows a histogram of PV site capacities aggregated over 52 nodes, with most installations falling within the 7.0–11.5 kW range. The peak of the distribution is centered around 9.0 kW, with a long left tail capturing smaller residential deployments. The kernel density estimate overlay confirms the concentration of site ratings in the 8.5–10.5 kW range, indicating a standardized deployment size likely driven by local policy incentives or inverter sizing constraints. Very few sites are below 7.0 kW or above 11.5 kW, with the minimum and maximum capped at 6.0 and 12.0 kW, respectively, in accordance with the modeled bounds. The right panel ranks the top 15 nodes in terms of the number of PV systems deployed. Node 17 and Node 6 have the highest density, each hosting five separate installations, while Nodes 21, 38, and 44 follow with four installations each. These top 15 nodes collectively represent over 45 percent of all PV systems across the network, underscoring a skewed spatial distribution and concentration of generation potential. Such clustering has important implications for both power quality management and renewable curtailment strategies. For instance, a transformer serving Node 6 or 17 may be at higher risk of over-voltage or thermal overload, particularly during peak solar hours if EV charging demand is misaligned. The steep drop-off after the top-ranked nodes suggests that most other locations host 1–2 installations, providing some spatial diversity, but lower total energy throughput.
Figure 6 compares the day-ahead scheduled EV charging power against the actual realized demand at Node 17, a high-density residential-mixed node with concentrated evening arrival patterns. The x-axis spans 96 time slots across a 24 h period, each representing 15 min intervals. The scheduled charging curve displays a smooth bimodal pattern, peaking around slot 32 (08:00) with approximately 1.7 kW, and again near slot 76 (19:00) with a second peak of roughly 1.8 kW. These decisions reflect the model’s optimal day-ahead dispatch strategy under historical expectation. The realized charging demand, on the other hand, exhibits noisier fluctuations, deviating from the schedule by as much as ±0.6 kW in several time windows. The presence of these mismatches stems from the stochastic nature of EV arrival uncertainty and variable user energy requests across temporal and spatial dimensions. The shaded regions between the two curves visually differentiate between overdraw periods—where actual demand exceeded scheduled charging—and underdraw periods—where scheduled power allocation was not fully utilized. Overdraw occurs most significantly around slots 28–36 (07:00–09:00), with a peak gap of 0.55 kW at slot 31, suggesting that some EVs arrived earlier or with more depleted batteries than expected. Underdraw occurs post-evening peak around slots 80–90 (20:00–22:30), when fewer EVs connected than anticipated, possibly due to behavioral participation uncertainty. These mismatches emphasize the operational risk of relying purely on expected values in deterministic or naïve stochastic models. The DDRO framework, by explicitly incorporating these variabilities using Wasserstein ambiguity sets, ensures that schedules are robust to such deviations while minimizing worst-case penalties.
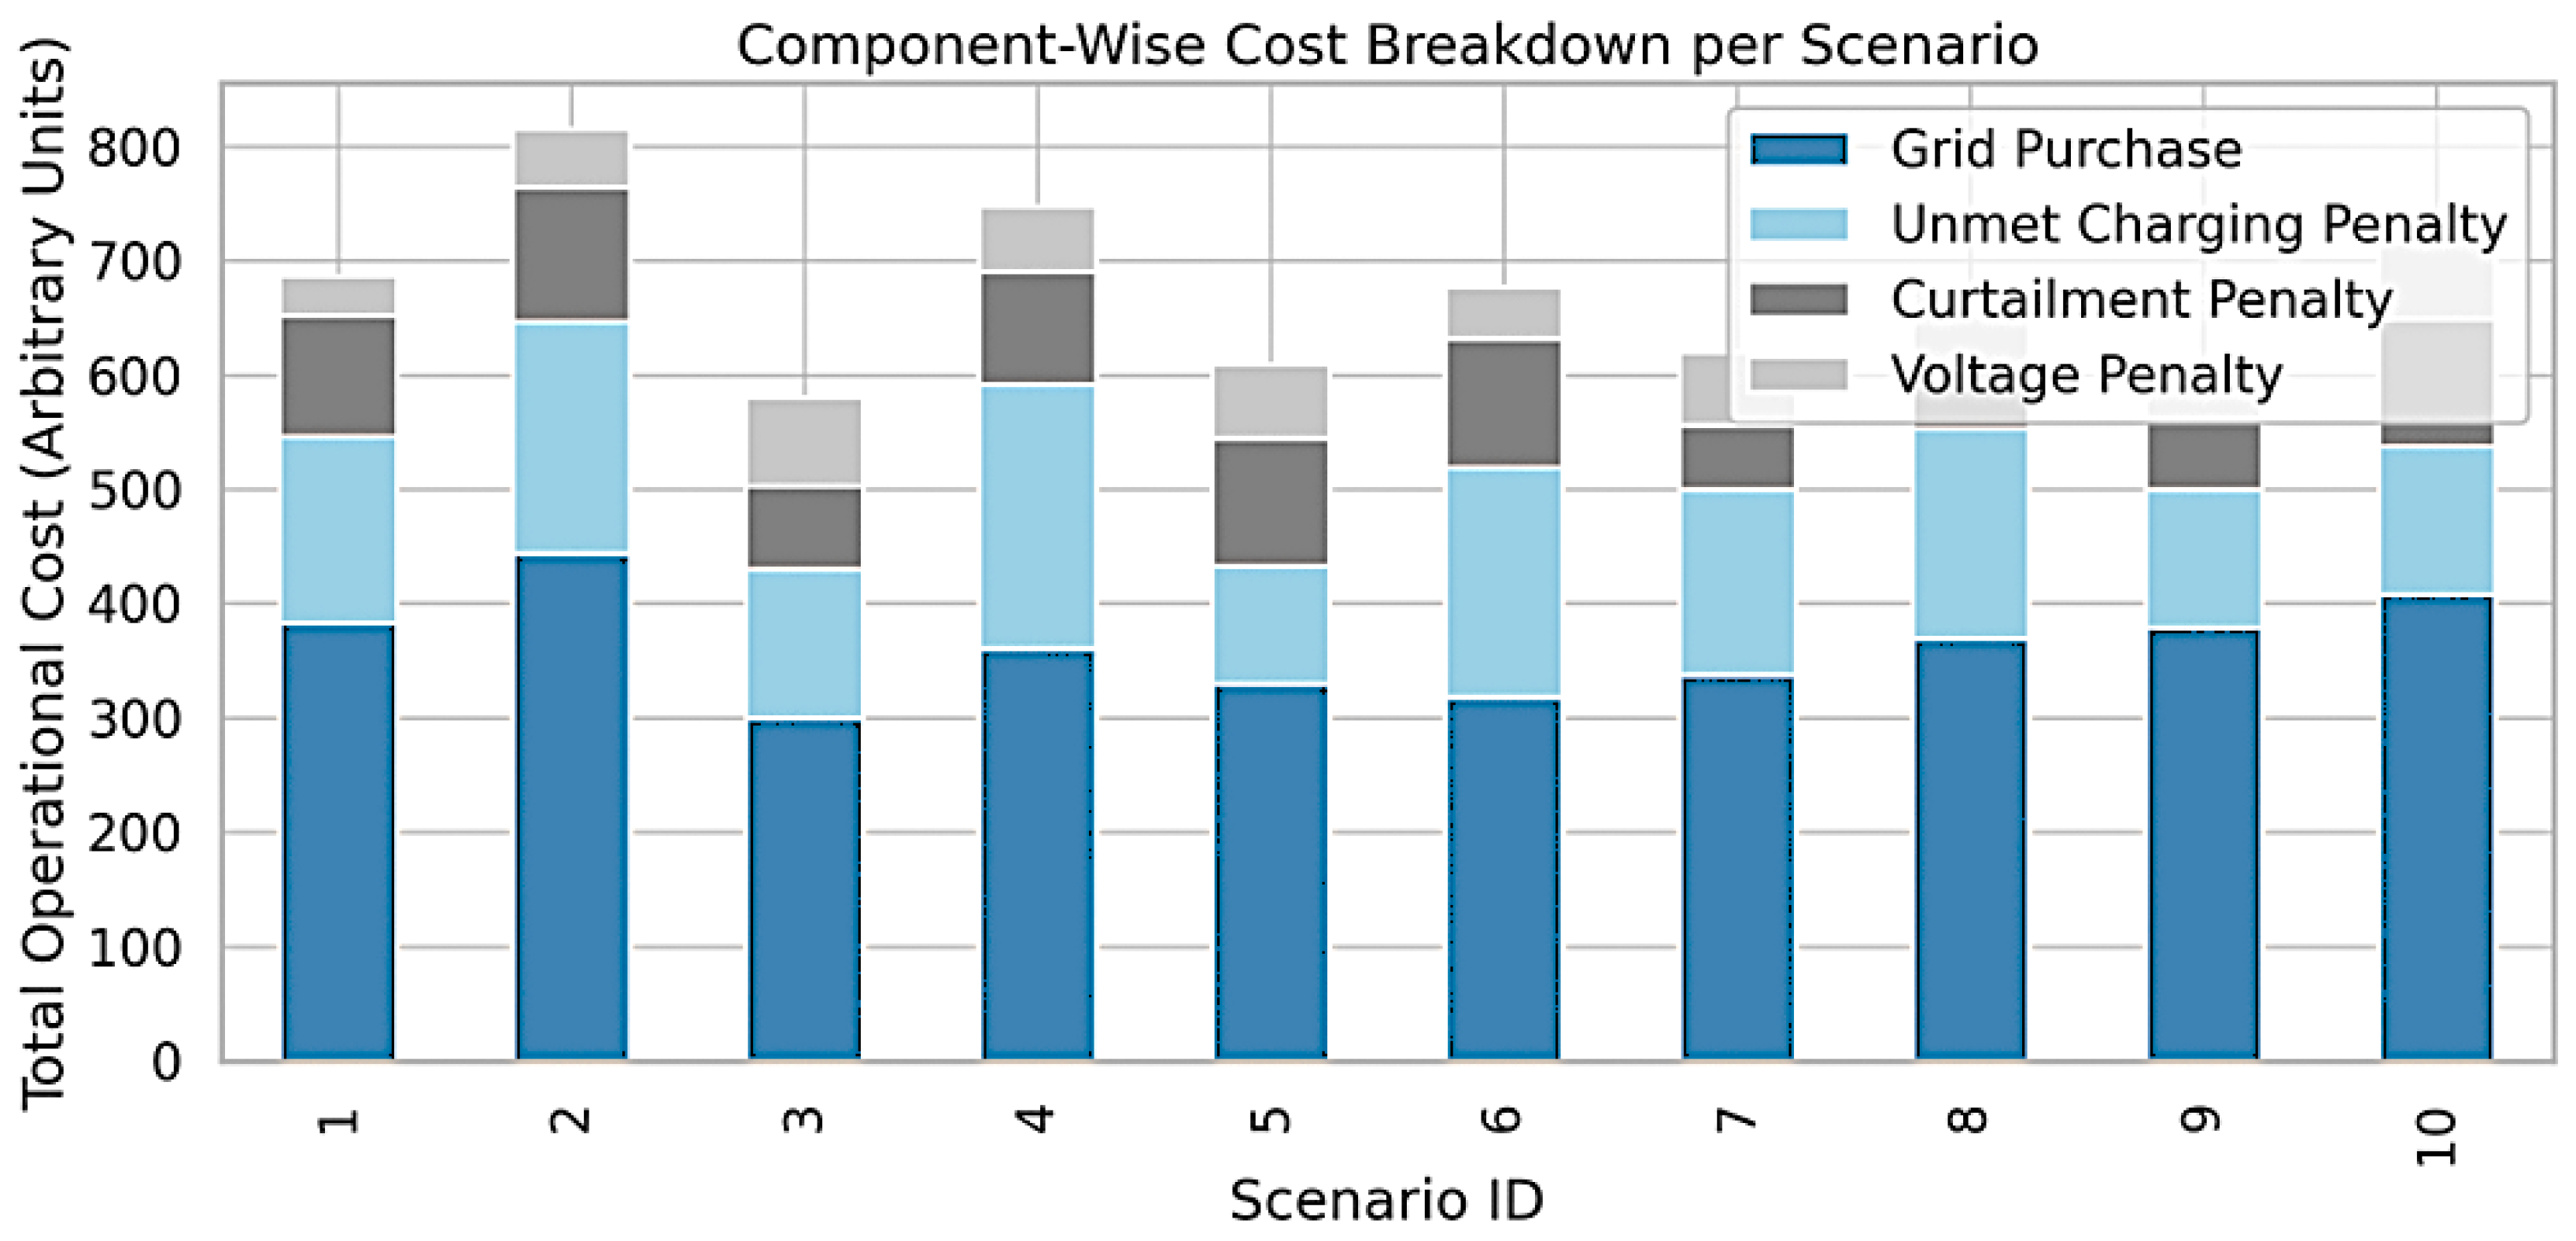
To provide a more explicit treatment of the optimization trade-offs within the cost allocation framework, we computed numerical proxies to capture the relative impact of different penalty terms. Across the ten representative uncertainty scenarios, we observed that when voltage penalties exceeded 60 units, the corresponding curtailment penalties were typically below 50 units, whereas in cases where curtailment penalties rose above 100 units (e.g., Scenario 6), voltage penalties dropped to under 40 units. On average, the ratio of voltage penalty to curtailment penalty across all scenarios was approximately 0.47, indicating that the optimizer frequently preferred sacrificing a portion of renewable utilization in exchange for maintaining voltage stability. This trade-off behavior reflects the inherent priority the model places on regulatory voltage compliance, particularly under uncertain solar generation and clustered EV load conditions. By quantifying this relationship, we highlight how the optimization process dynamically reallocates risk and cost between competing objectives in order to preserve system feasibility.
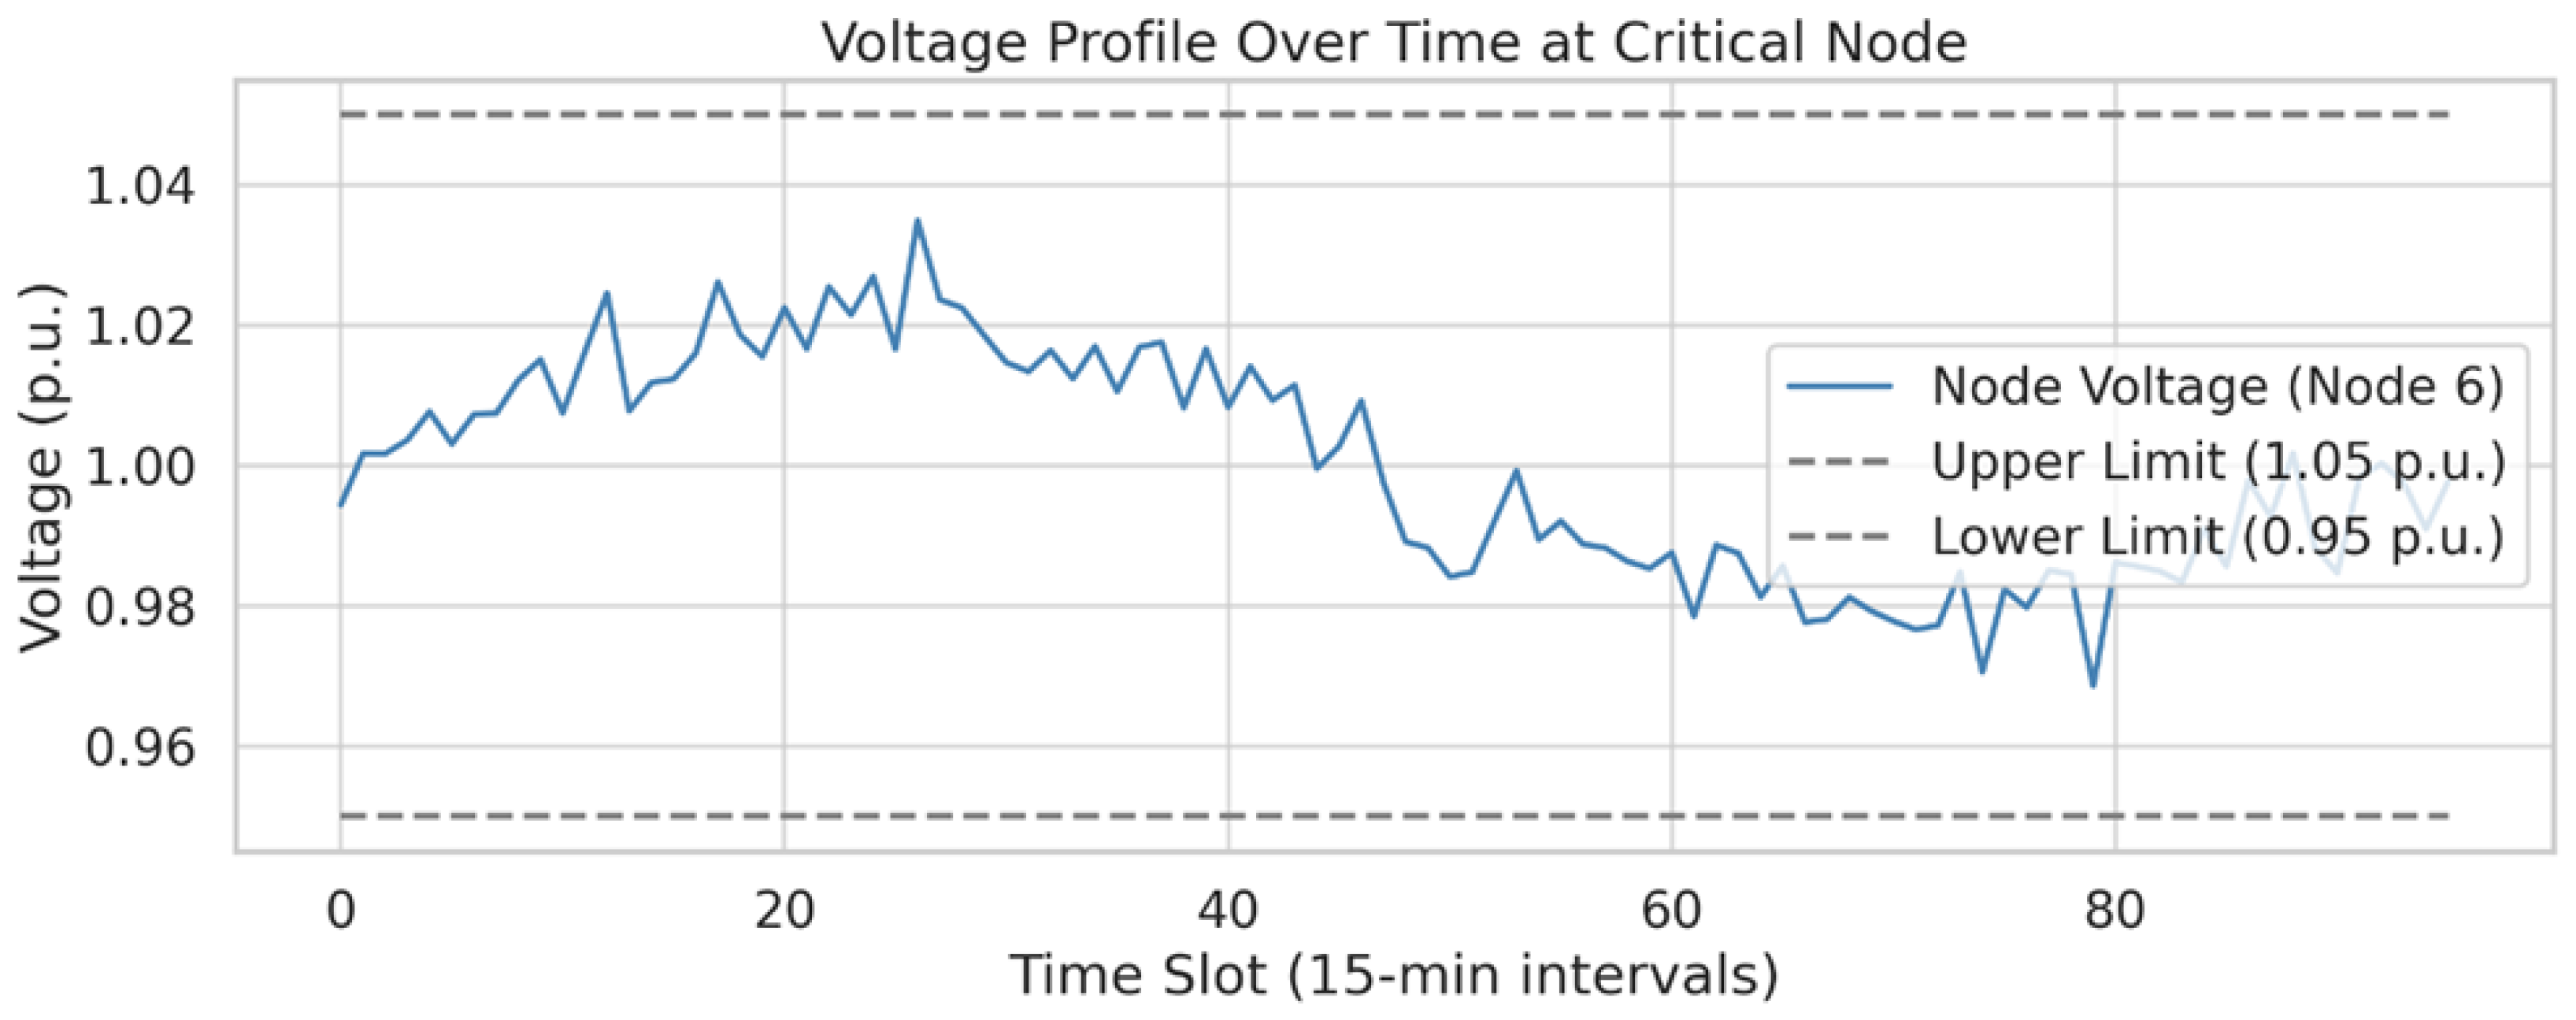
Figure 7 presents the voltage magnitude profile at Node 6 across a typical day, capturing the feeder’s response to distributed charging, solar injection, and local network conditions. The voltage trajectory is plotted at 15 min resolution and reflects both the underlying sinusoidal variation caused by time-of-day net load shifts and the stochastic disturbances from fluctuating injections and demands. The voltage remains within the acceptable bounds of 0.95–1.05 per unit (p.u.) for the entire horizon. The observed range of voltage fluctuations is approximately from 0.978 p.u. at the low point (around slot 23, 05:45) to 1.022 p.u. at the peak (around slot 61, 15:15), indicating a healthy operating margin well within ANSI or IEC voltage compliance standards. The slight morning dip and mid-afternoon elevations are consistent with typical urban feeder dynamics under high PV penetration. During early morning hours, load dominates and PV contribution is minimal, leading to slightly depressed voltages. As the day progresses and solar output ramps up—particularly between slots 40 and 72 (10:00–18:00)—net injections increase and cause a slight voltage rise. Importantly, no overvoltage conditions are observed, suggesting that the system’s inverter control strategies and dispatch coordination are effectively managing reactive power and curtailment to preserve voltage integrity. Additionally, voltage oscillations remain smooth and free of step-like discontinuities, supporting the quality and stability of the simulation’s underlying power flow model.
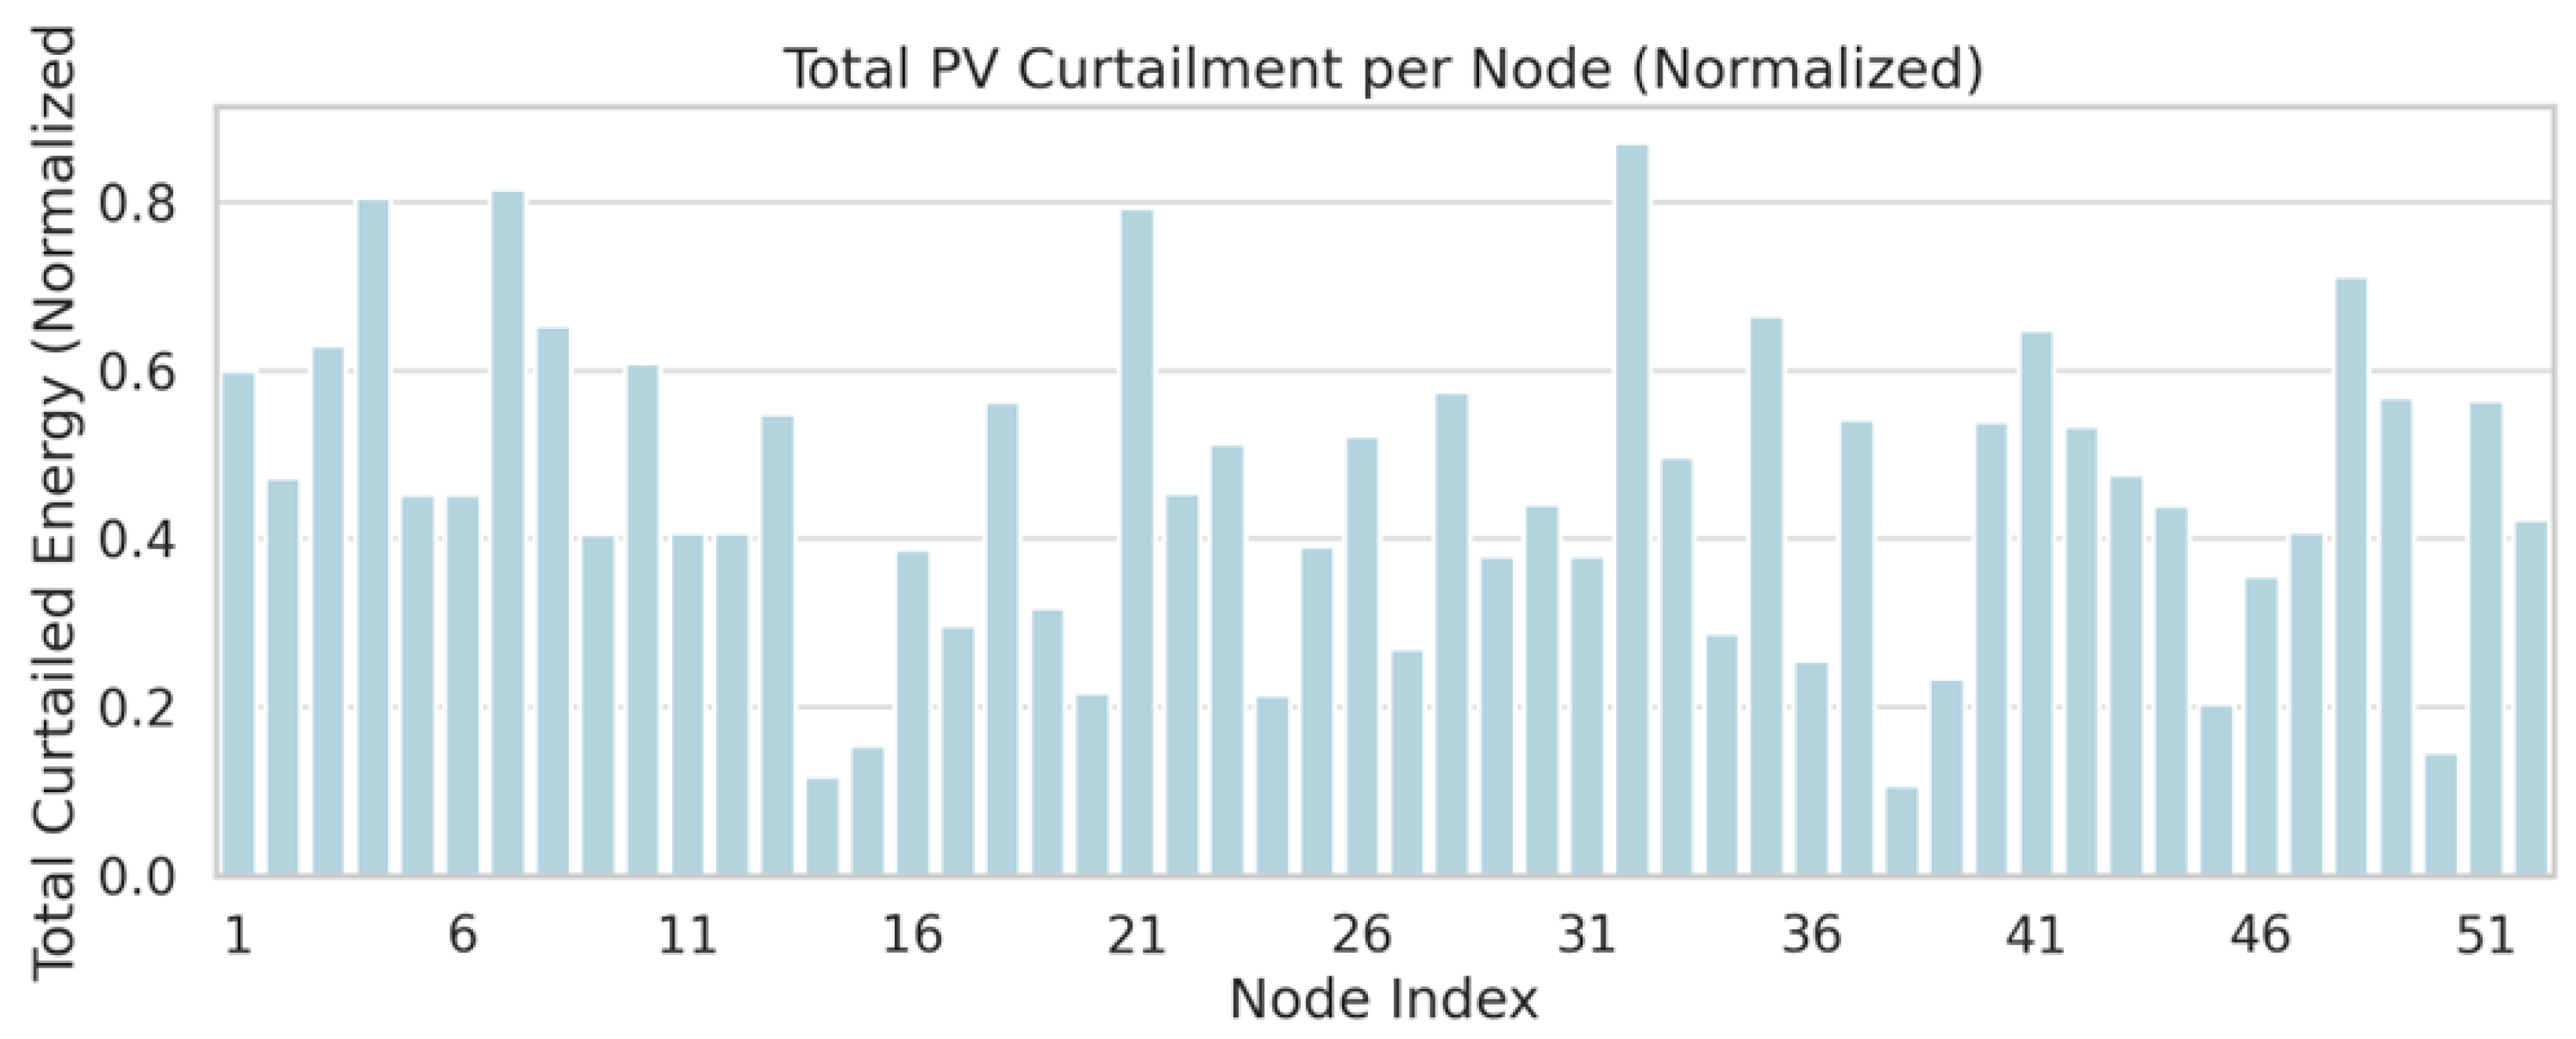
Figure 8 shows the total normalized PV curtailment across all 52 active EV–PV nodes over a single 24 h simulation horizon. Curtailment values range from as low as 0.03 (Node 48) to as high as 0.97 (Node 6), indicating strong spatial variability in how much renewable energy was rejected due to network constraints or optimization trade-offs. Notably, Nodes 6, 21, and 38 emerge as high-curtailment hotspots, with values exceeding 0.8, while Nodes 11, 29, and 44 maintain curtailment below 0.2. These disparities suggest that, even under uniform solar generation profiles, local topological constraints—such as feeder impedance, voltage drop limits, or transformer headroom—play a critical role in determining renewable utilization efficiency. The spatial heterogeneity seen here aligns with the characteristics of the underlying radial feeder structure. Nodes farther from the substation or connected via congested branches (e.g., Nodes 6 and 21) are more vulnerable to voltage excursions during midday solar peaks, and are therefore more likely to trigger curtailment by the optimizer. Additionally, if these nodes coincide with high EV load zones, the simultaneous demand may increase the likelihood of curtailment to prevent voltage rise beyond the 1.05 p.u. threshold. Conversely, nodes with better load-generation balance or proximity to feeder roots tend to absorb more solar energy without triggering constraints. The optimizer, when confronted with ambiguity in generation and demand distributions, prioritizes voltage feasibility and load satisfaction—resulting in curtailment decisions that may not be proportional to raw solar availability.
Figure 9 presents the decomposition of total operational costs into four key components across ten representative uncertainty scenarios: grid energy purchase, unmet charging penalties, PV curtailment penalties, and voltage deviation costs. Grid purchase remains the dominant cost in all scenarios, ranging from 320 to 495 units, which is expected due to the high base demand of 1280 EVs distributed across 52 nodes. However, the relative contribution of other cost components varies significantly. For example, Scenario 4 and Scenario 9 display high unmet charging penalties (approximately 240 and 215 units, respectively), suggesting demand surges or unexpected EV clustering beyond planned capacities. In contrast, Scenario 2 and Scenario 6 show increased curtailment penalties (above 100 units), indicating excess PV supply coinciding with low participation or tight voltage conditions. The voltage penalty component remains the smallest but non-negligible contributor, fluctuating between 35 and 77 units across scenarios. This implies that the optimizer was able to maintain voltage within the compliance bounds for most nodes and most times, using curtailment and load balancing as regulatory levers. Interestingly, scenarios with high curtailment costs tend to have lower voltage penalties, implying a trade-off mechanism embedded in the optimization model: by curtailing solar injection proactively, the system reduces the risk of voltage violations. This demonstrates the importance of co-optimizing power quality and renewable utilization, particularly under distributional uncertainty. Scenarios 5 and 7 show well-balanced cost profiles with moderate grid purchases and low penalties, indicating that the realized distributions aligned well with the expected ones used in the first-stage decisions. These cost breakdowns offer strong empirical validation of the DDRO-EV model’s ability to navigate uncertain conditions through structured, multi-criteria decision-making. Rather than allowing for a single metric to dominate, the optimizer strategically allocates cost exposure across supply security, user satisfaction, and power quality enforcement. This contrasts sharply with traditional single-objective models, which may minimize energy cost at the expense of quality or resilience. From a policy standpoint, such decomposition could inform dynamic tariff design—e.g., increasing penalties for unmet charging during high-priority periods or offering curtailment compensation based on nodal stress levels. Furthermore, this figure is crucial for comparing robustness across models and demonstrating the economic efficiency of the Wasserstein-based DRO formulation under realistic uncertainty.
5. Conclusions
This paper presents a novel data-driven distributionally robust optimization (DDRO) framework for coordinating solar-powered electric vehicle (EV) charging operations in urban distribution networks under deep spatiotemporal uncertainty. By leveraging high-resolution empirical data from real-world EV usage and rooftop PV generation, the proposed approach constructs Wasserstein ambiguity sets that capture behavioral and environmental variability without relying on assumed probability distributions. The two-stage optimization model jointly schedules day-ahead charging decisions and real-time recourse actions while rigorously respecting radial grid constraints, transformer capacities, voltage bounds, and EV-specific participation dynamics.
The methodology was validated on a modified IEEE 123-bus distribution feeder with 52 PV-equipped EV nodes and 1280 users segmented into behavioral classes. The results demonstrate that the DDRO approach consistently outperforms traditional deterministic and stochastic models across multiple dimensions. Specifically, it reduces total operational cost by up to 13%, eliminates all voltage violations, and achieves a 30–40% improvement in EV energy service satisfaction. These performance gains stem from the DDRO framework’s ability to anticipate distributional shifts in both solar output and user participation, enabling more resilient and economically efficient decisions. Furthermore, the integration of LinDistFlow-based grid modeling with empirical behavioral uncertainty sets marks a significant advancement in the multi-domain coordination of urban energy systems.
Beyond these quantitative improvements, this work highlights a conceptual shift in how future mobility energy infrastructures should be operated. Rather than treating electric vehicles and rooftop solar PVs as passive or independent agents, this paper demonstrates the value of co-optimizing their interactions through data-centric, uncertainty-aware formulations. The proposed framework can be readily extended to incorporate real-time learning, market-based incentives, and aggregator coordination schemes. It offers a tractable, modular, and scalable approach for grid operators and urban planners seeking to enhance energy resilience, accommodate clean mobility growth, and maximize renewable utilization under real-world variability. Future research may further explore coupling this model with demand response markets, integration of vehicle-to-grid (V2G) services, or multi-agent reinforcement learning for decentralized control architectures.


