


Operational Analysis of a Pilot-Scale Plant for Hydrogen Production via an Electrolyser Powered by a Photovoltaic System

 ,
,  ,
,  , , , and
Abstract
1. Introduction
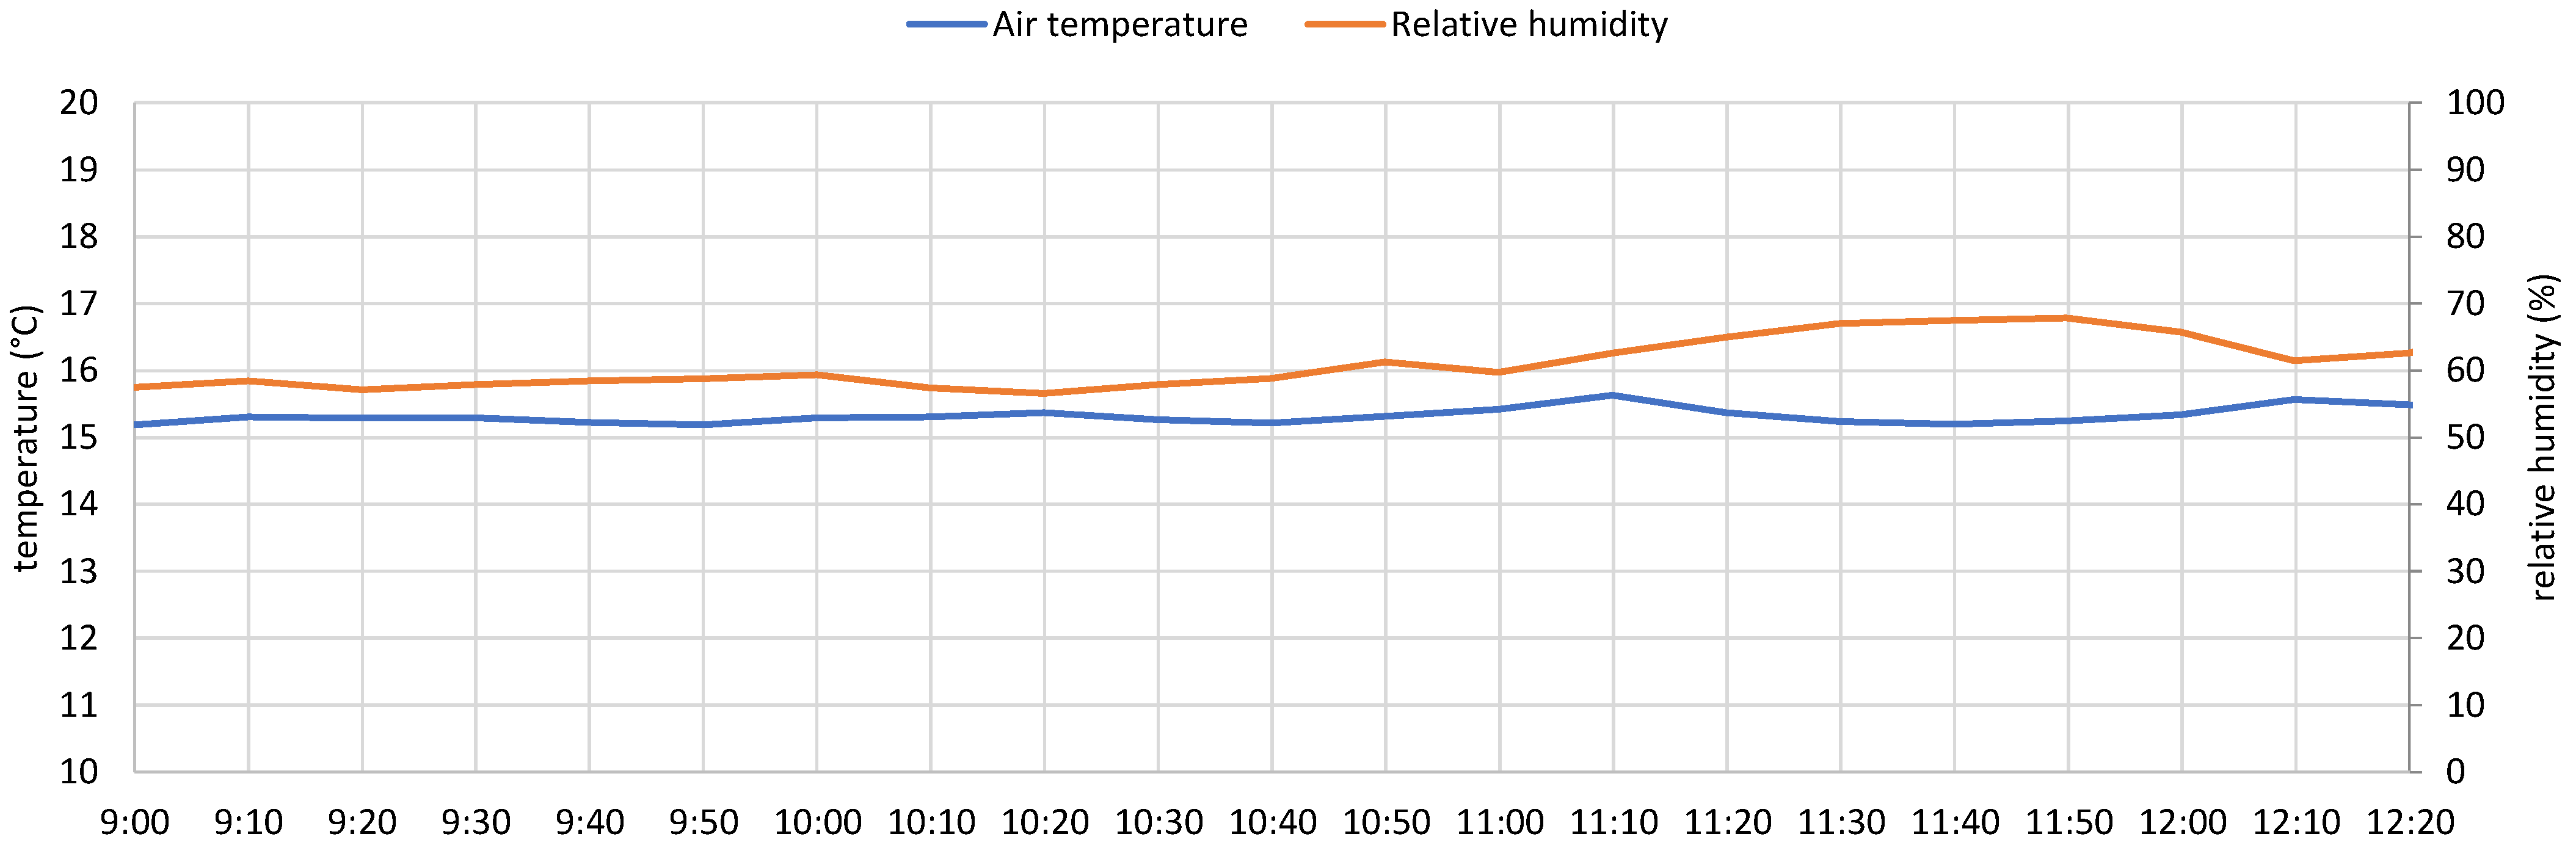
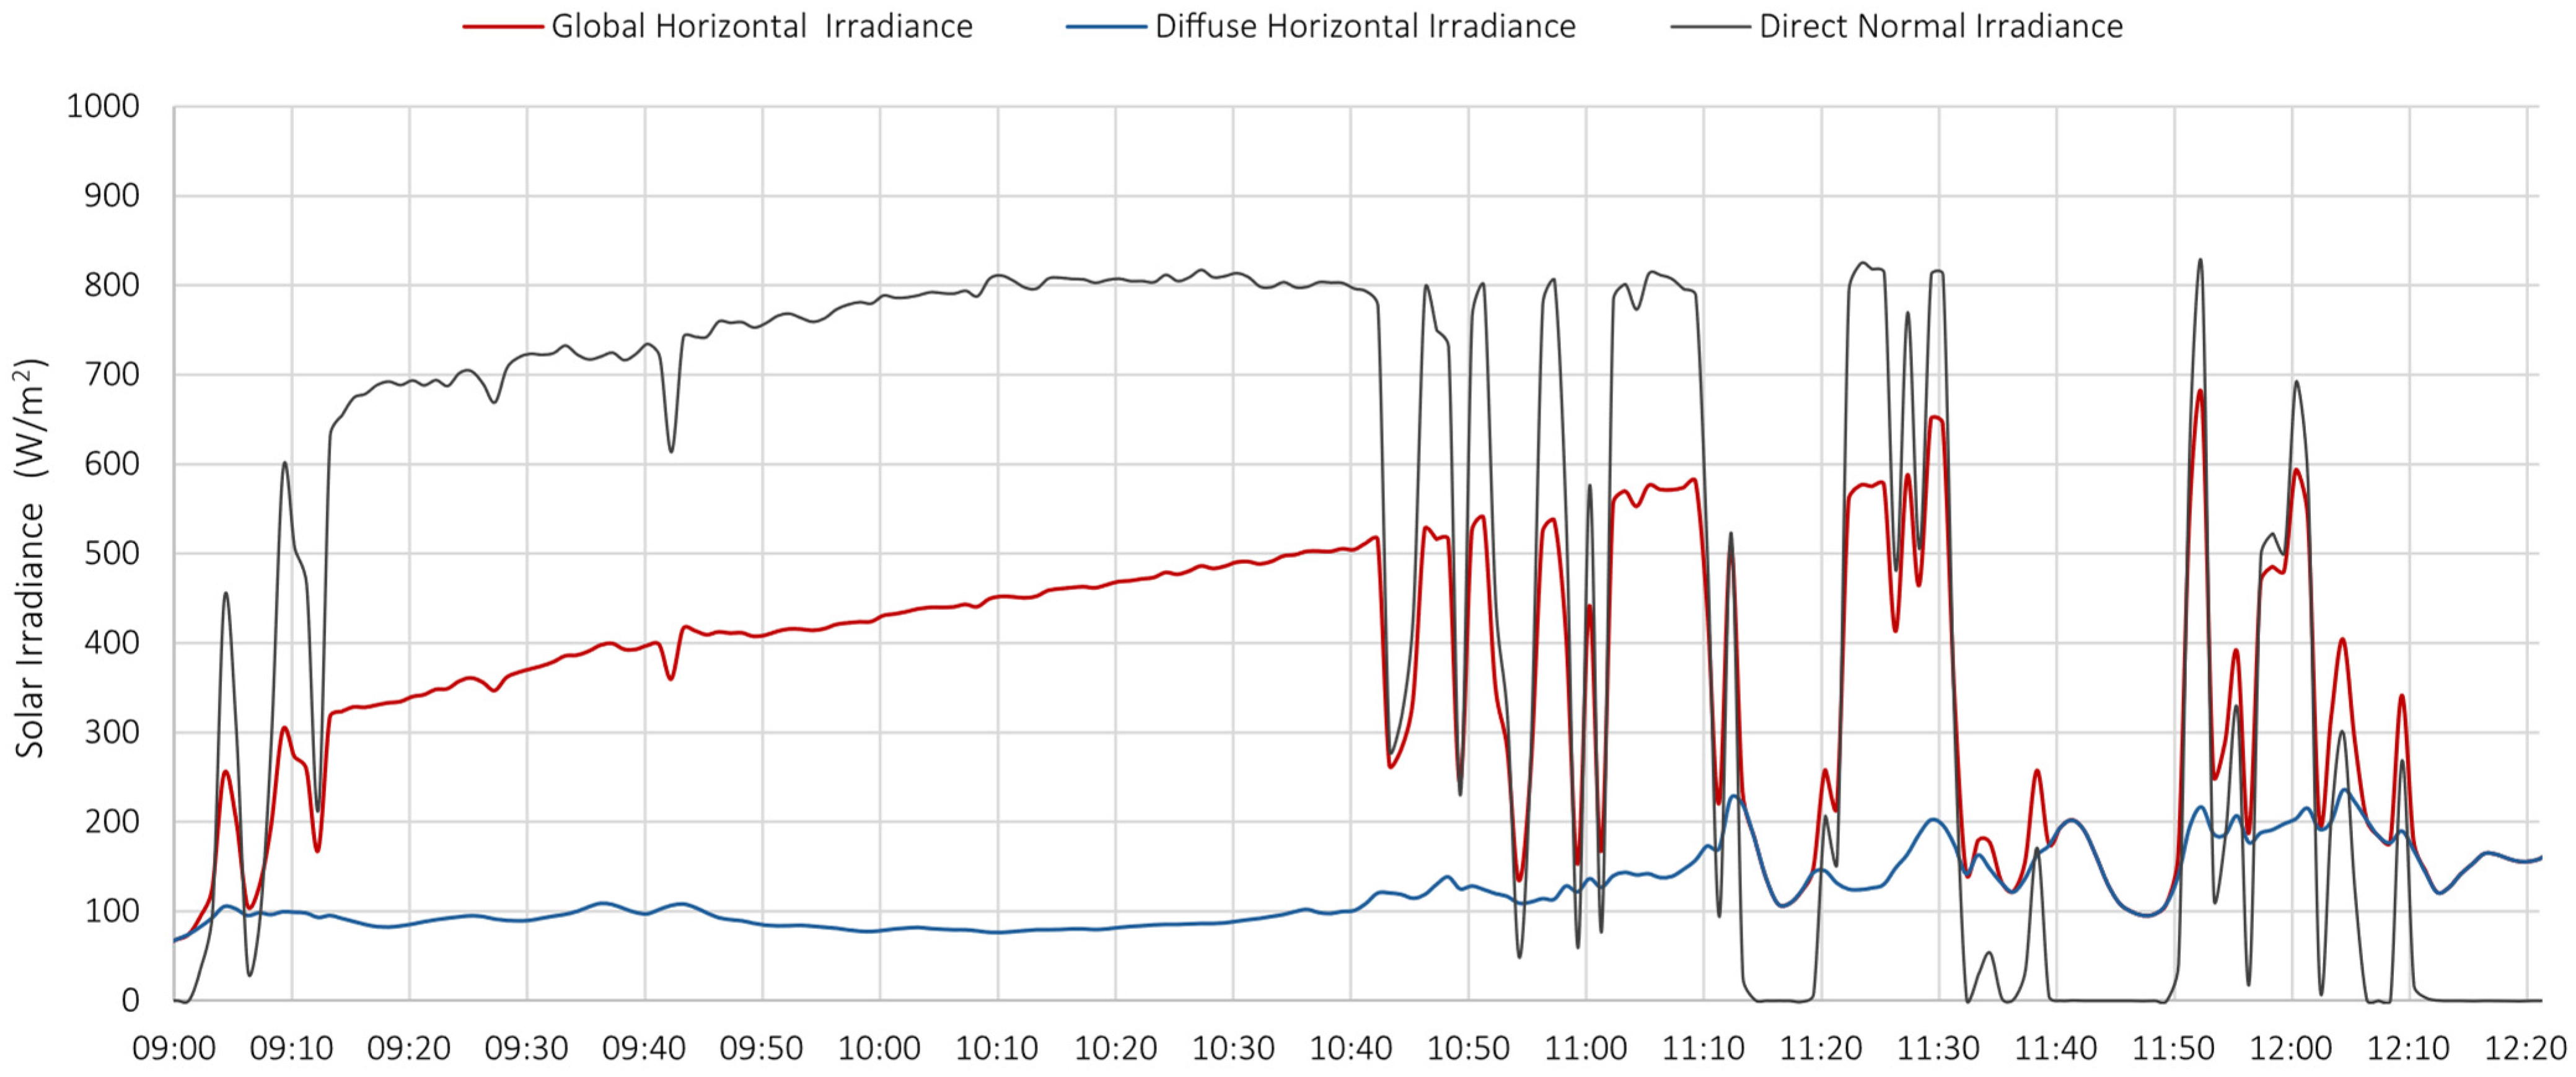
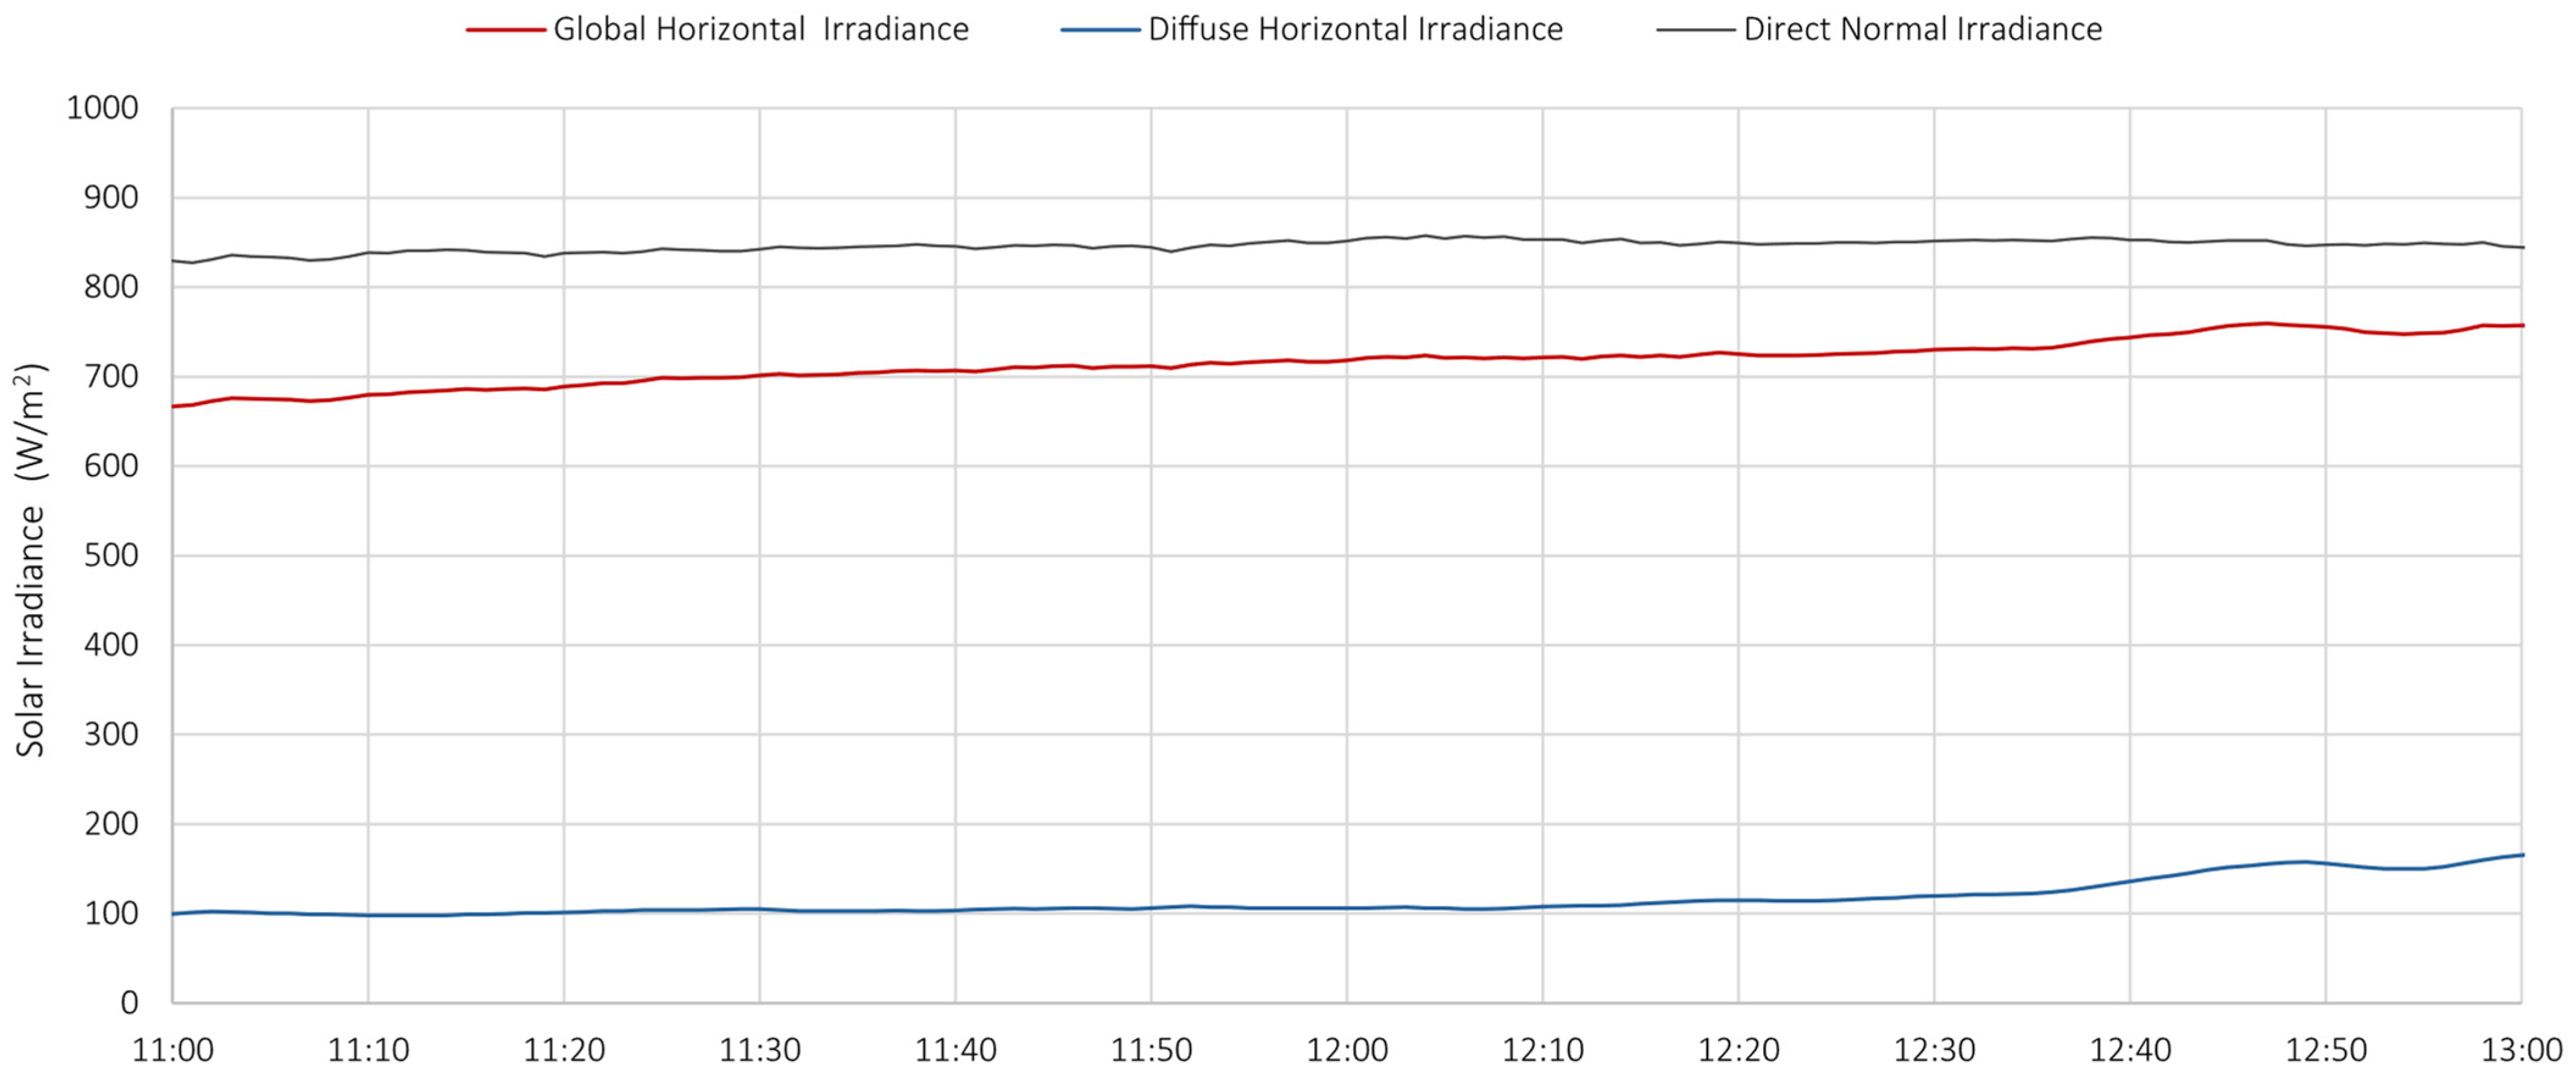
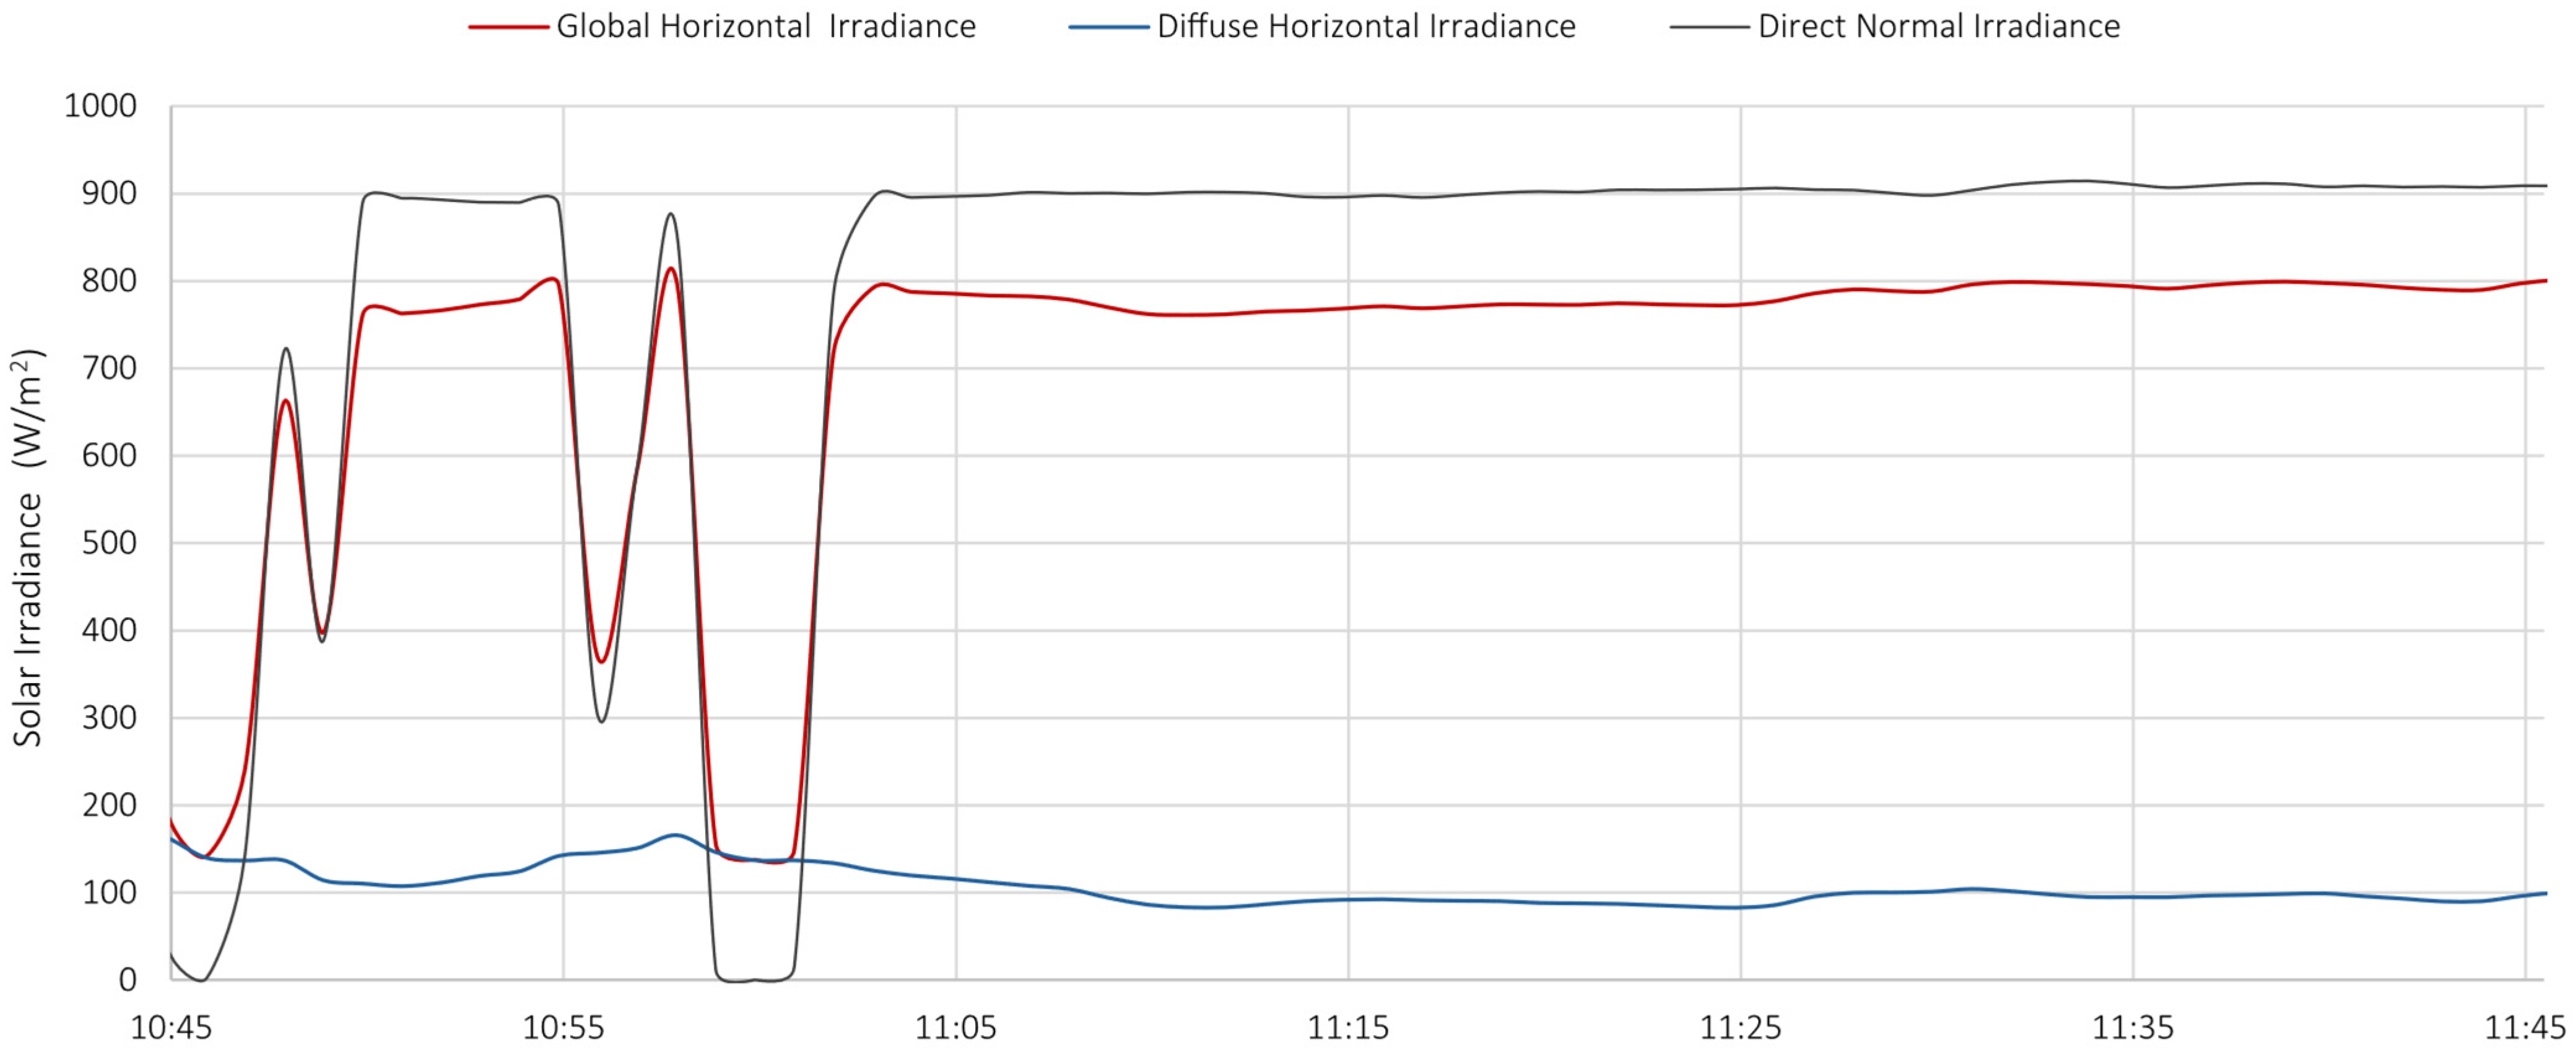
- to experimentally evaluate the main parameters of the process and energy flows under real climatic conditions, with particular attention to solar radiation;
- to identify inefficiencies affecting the plant’s overall energy performance, with a focus on critical components such as the electrolyser, storage systems, and fuel cell;
- to provide valuable data for future optimization efforts and for the calibration of simulation models.
2. Overview of the Integrated Hydrogen Production System
- Photovoltaic energy section
- Power conditioning section
- Hydrogen production and purification sections
- Reconversion section
- Control section
- Monitoring section
2.1. Photovoltaic Energy Section
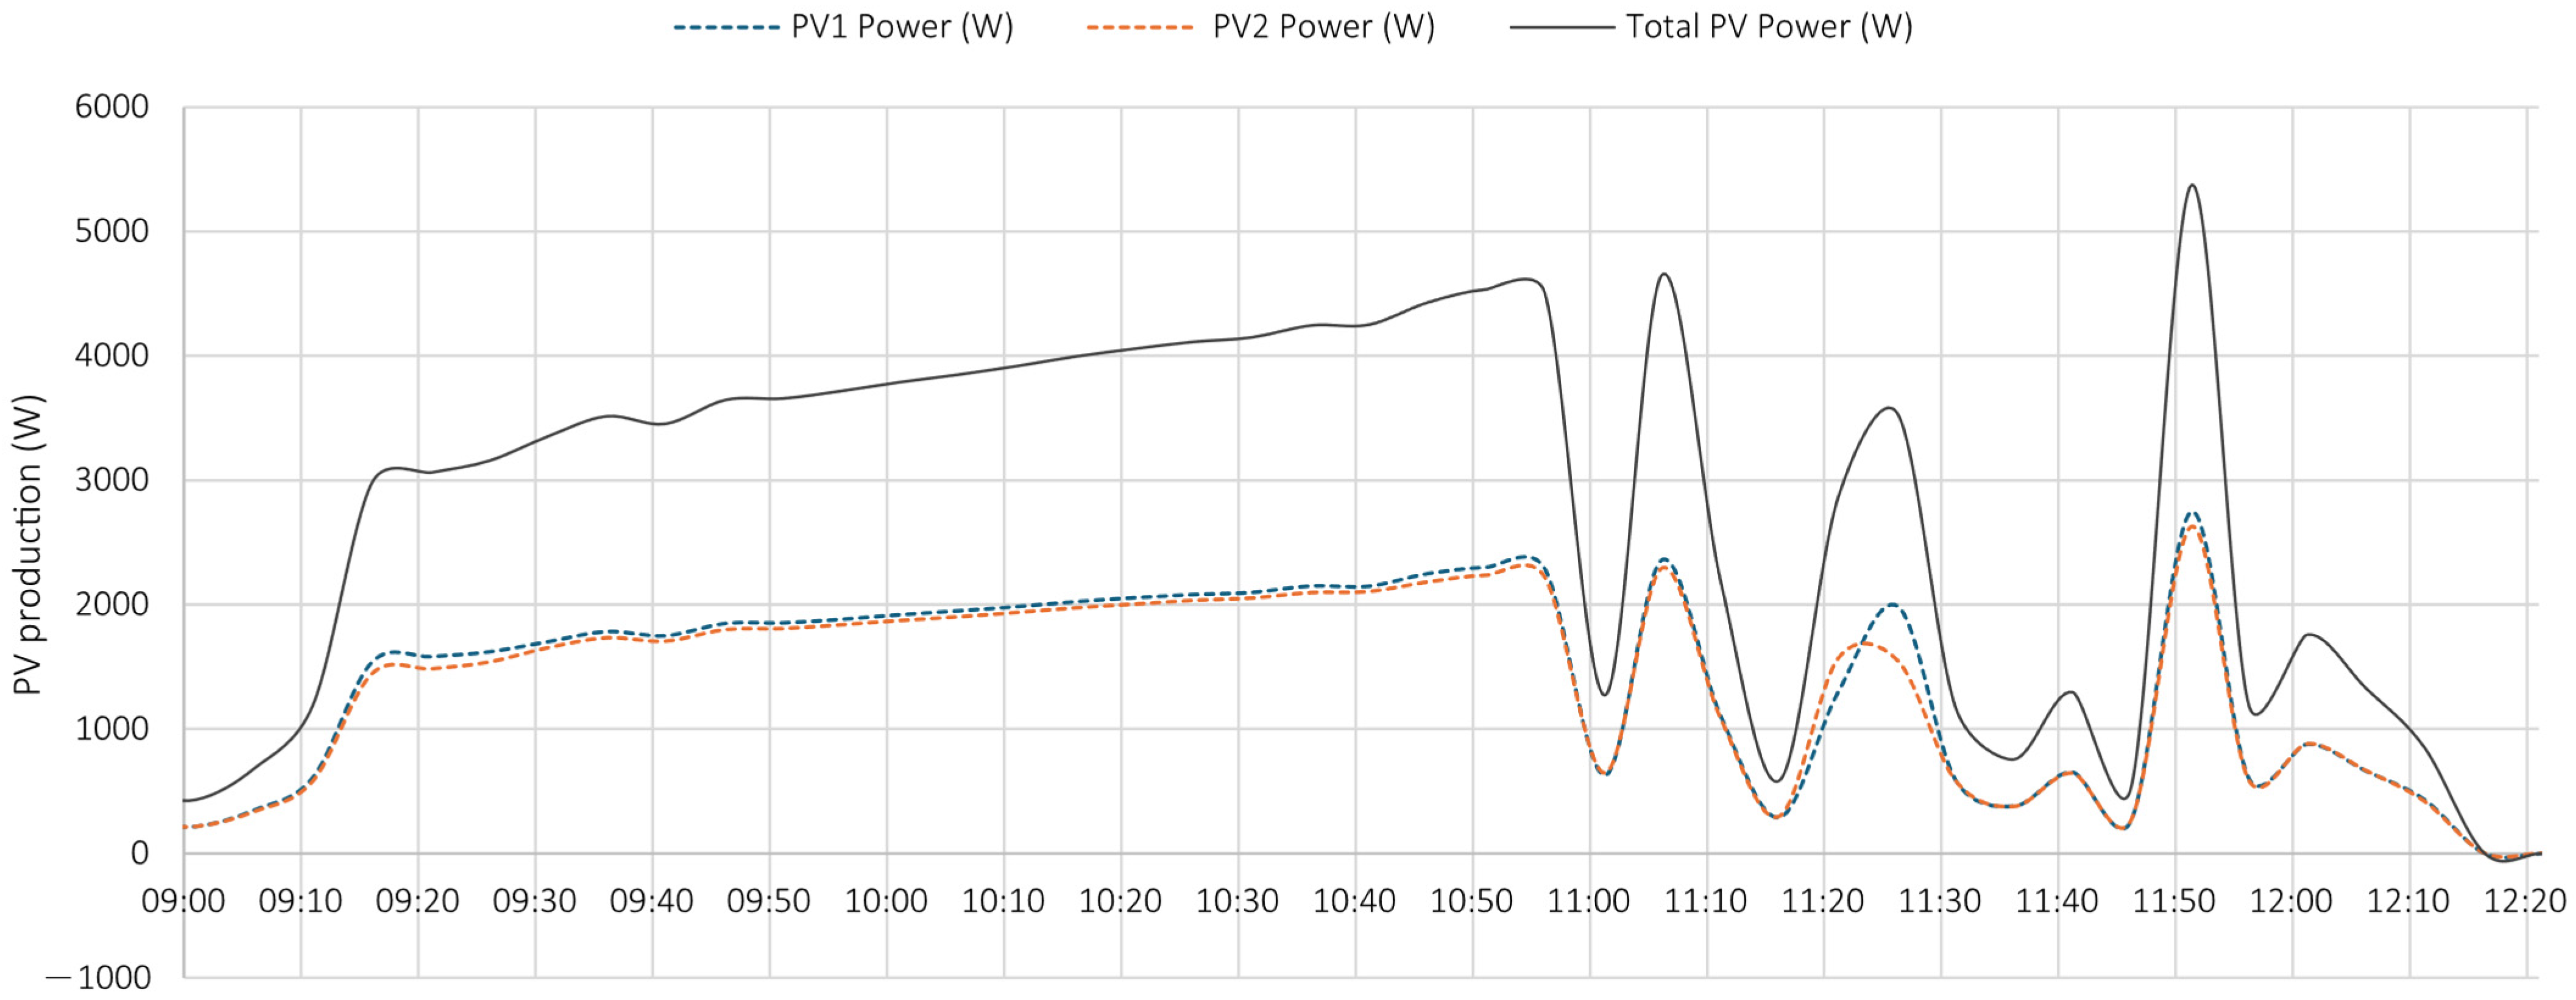
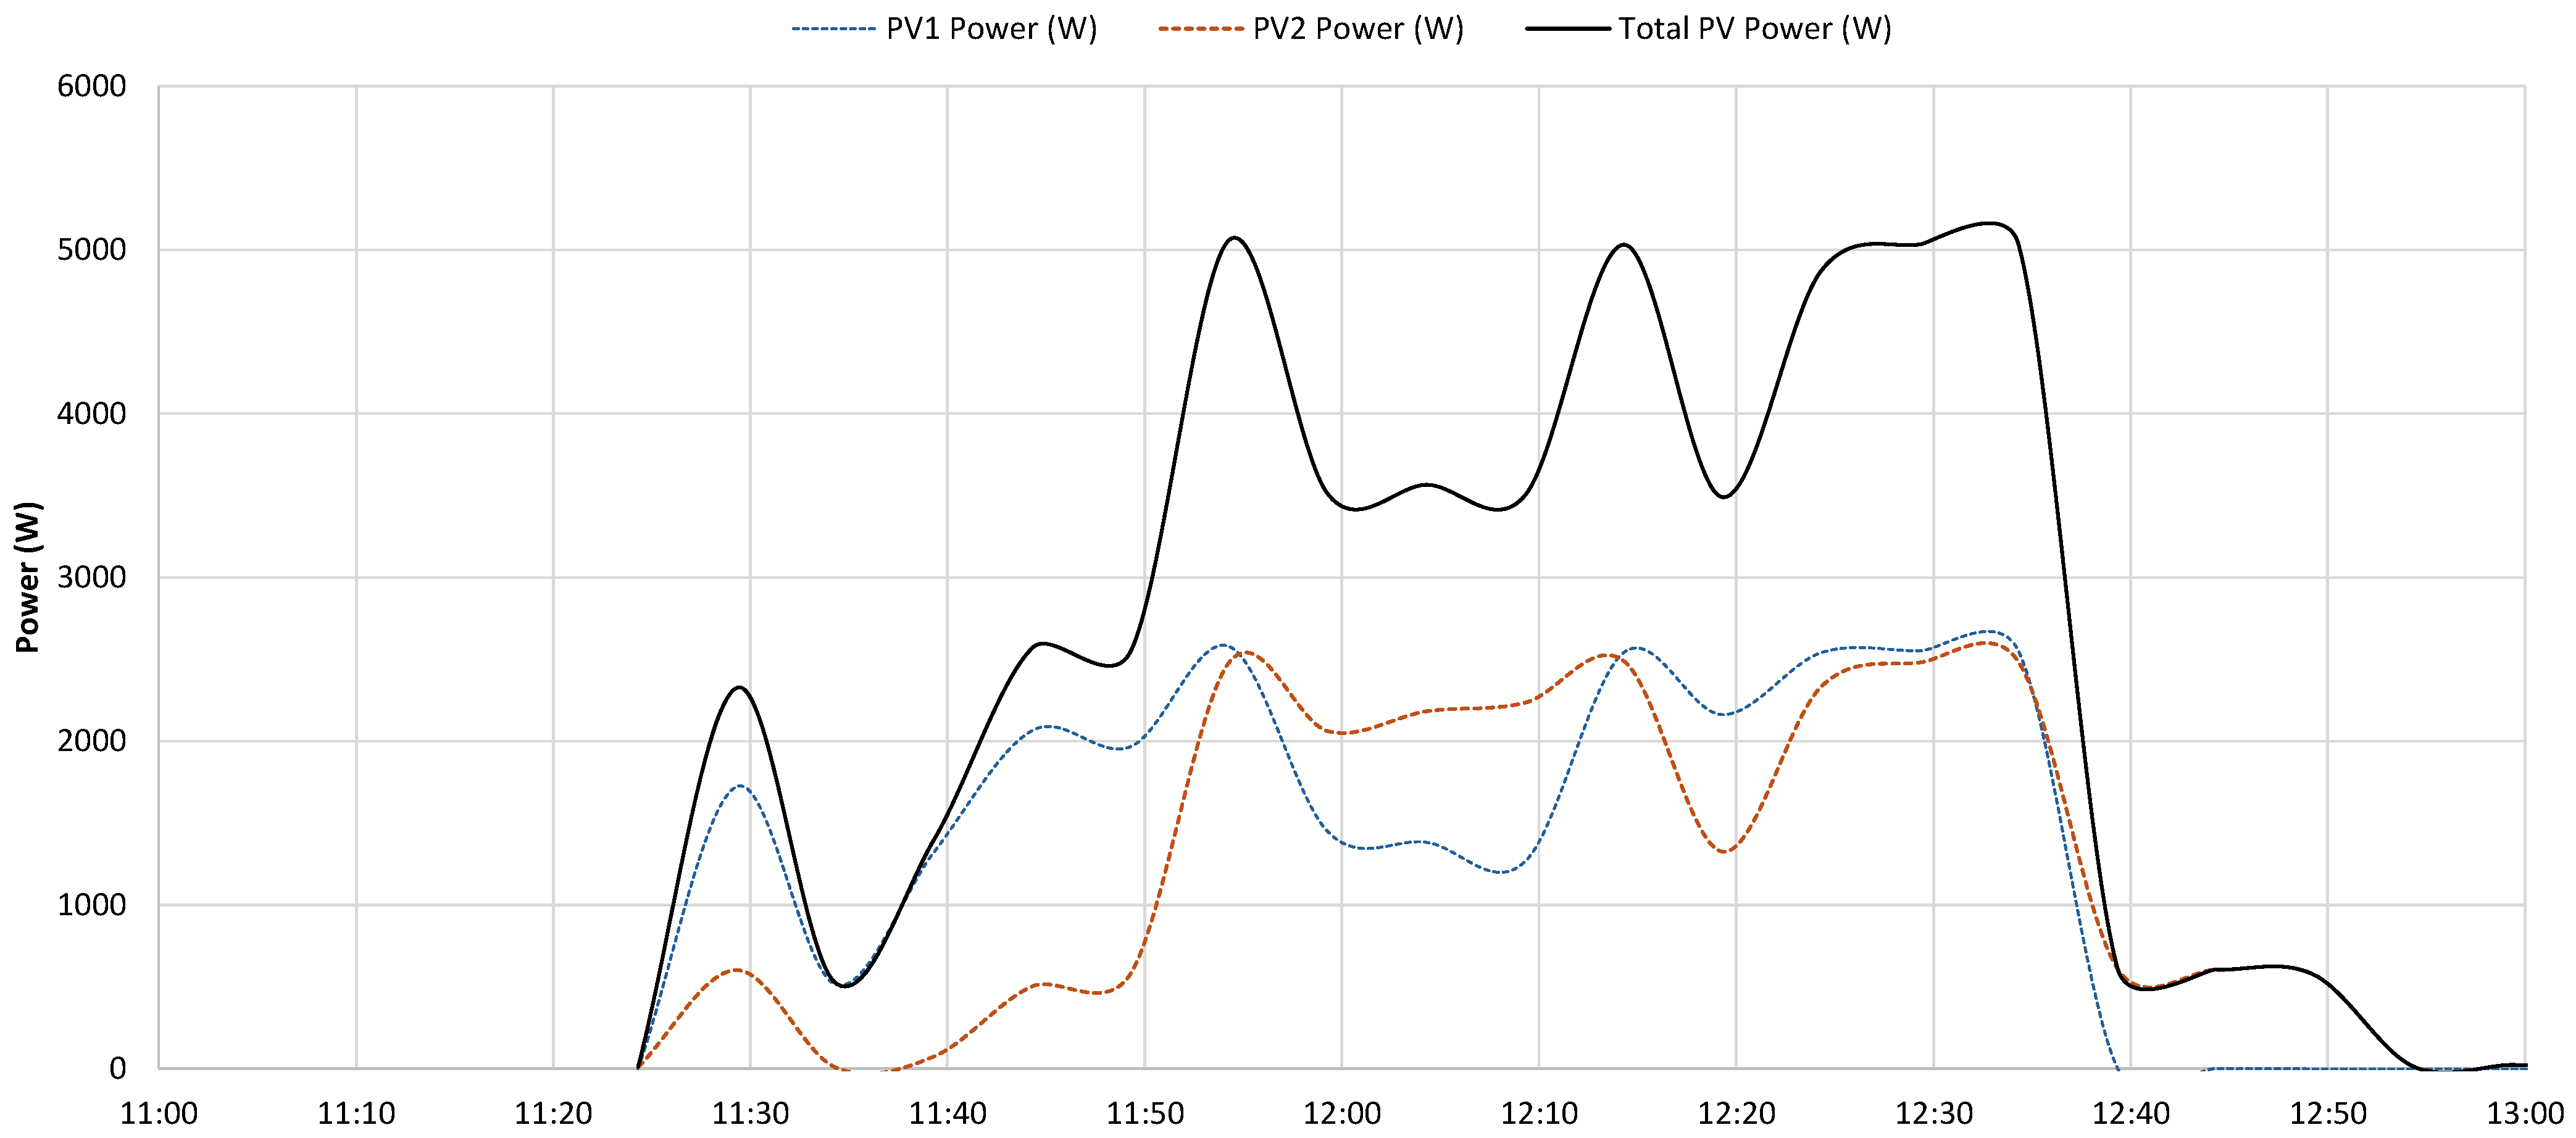
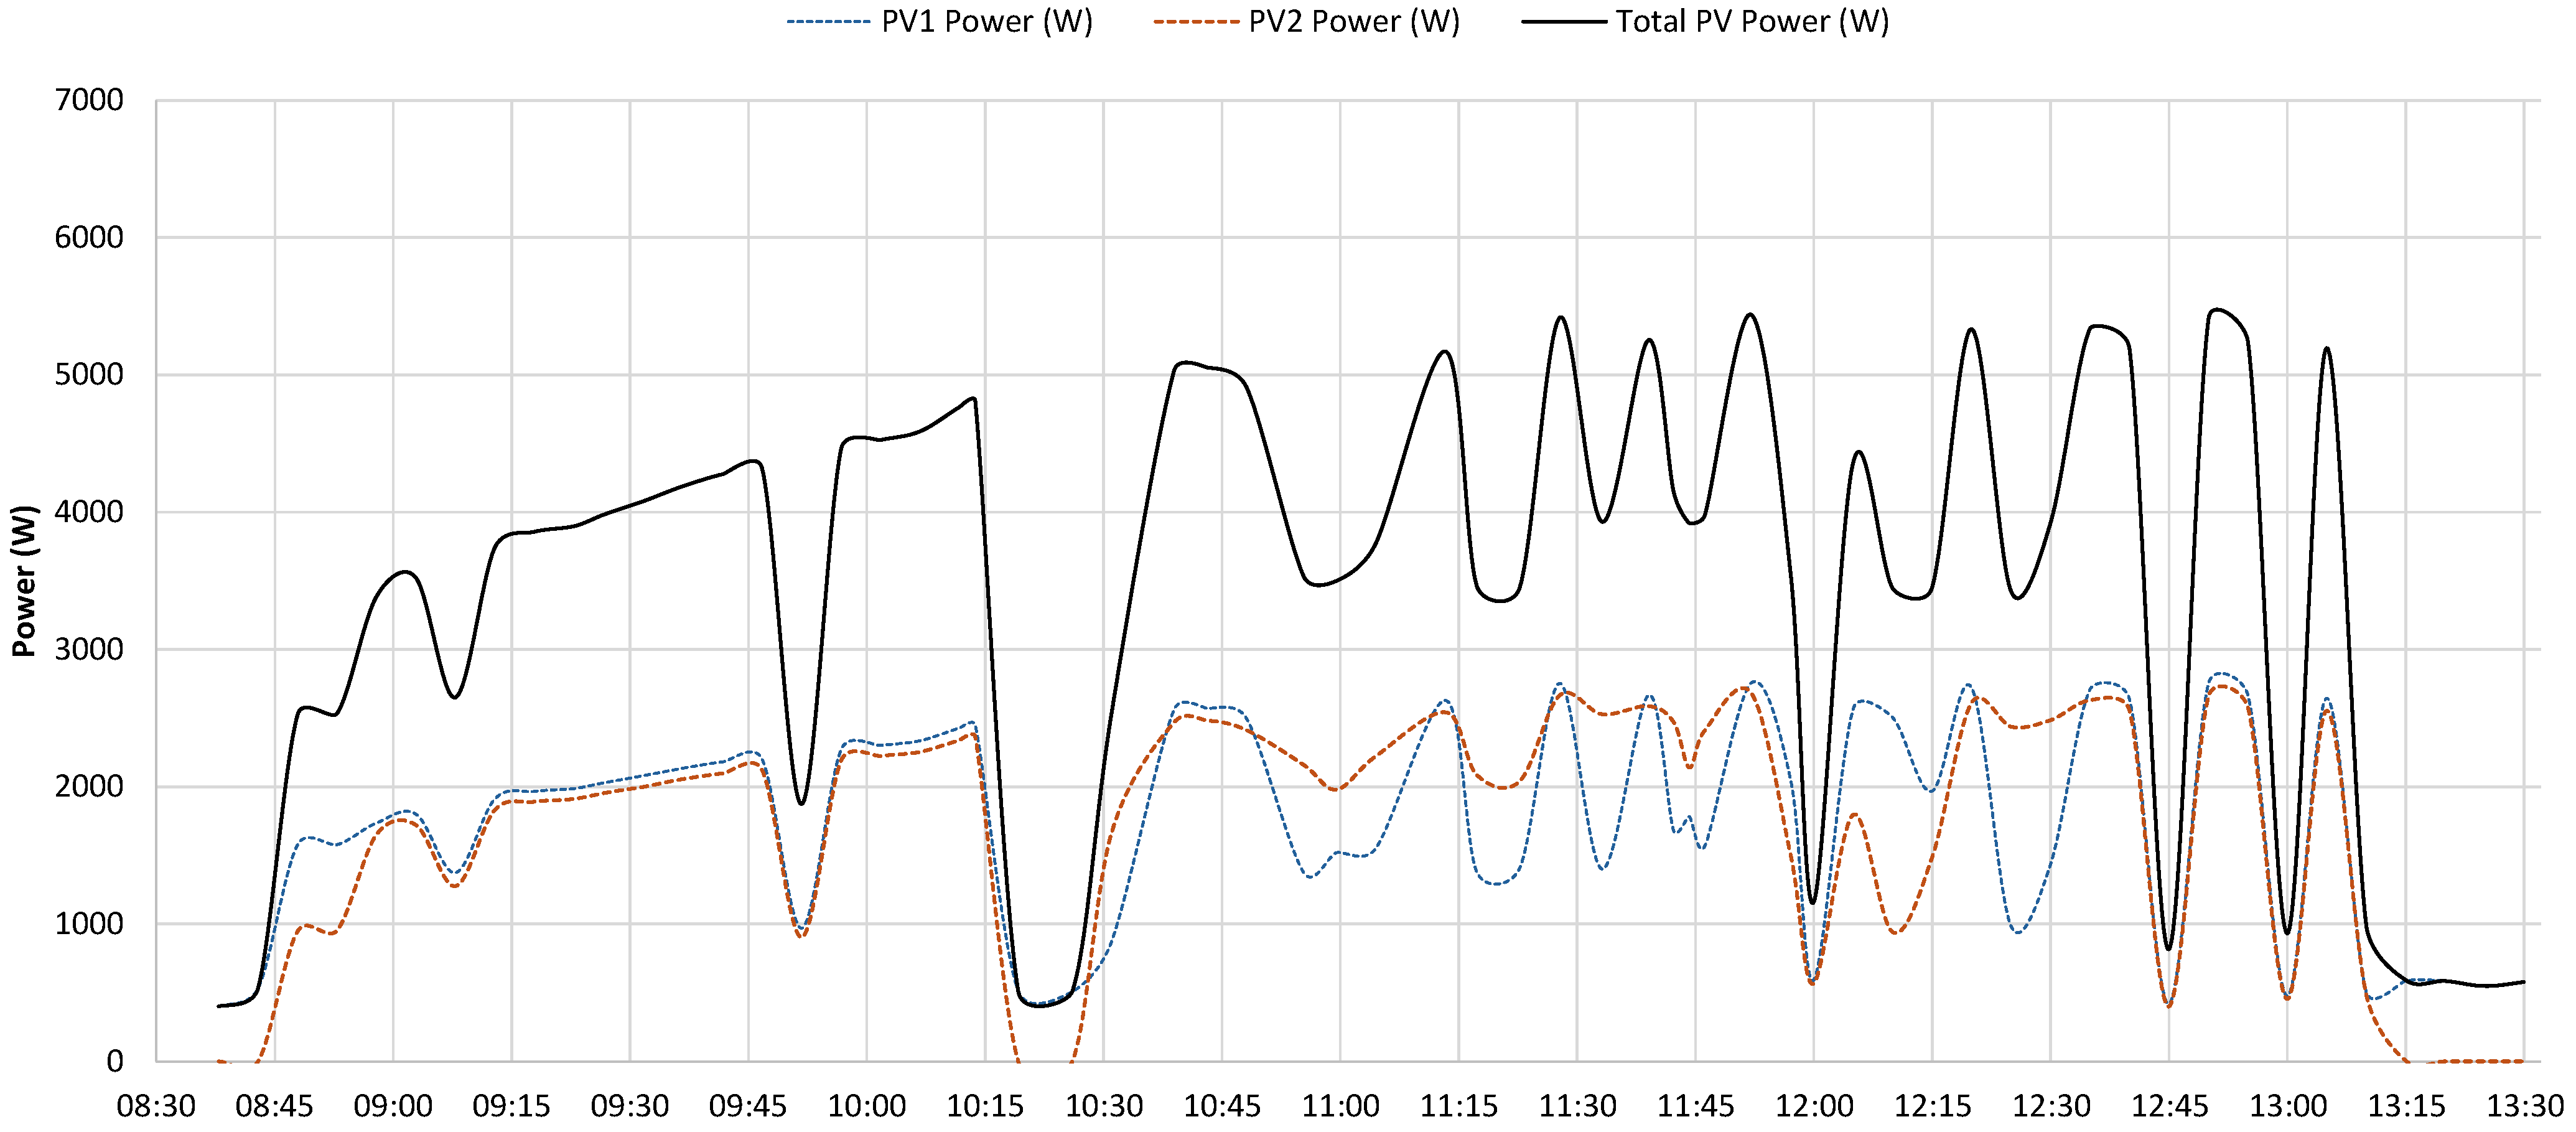
- Photovoltaic Array (PV). It consists of two strings (PV1 and PV2) of monocrystalline silicon solar panels connected in parallel. Each string includes 9 modules in series, with a total peak power output of 6.48 kWp.
- Hybrid Inverter (HI). It is a multifunctional device that manages the produced electrical energy, functioning both as an MPPT (Maximum Power Point Tracker) regulator and as an inverter to supply the electrolyser and/or to charge the batteries. It has a rated power of 6 kW.
- Battery Storage System (BSS). The bank is made of five 48 V, 50 Ah lithium batteries connected in series to provide a total of 240 V and 12 kWh of energy storage.
2.2. Power Conditioning Section
- a power electronic converter, composed of a transformer and a diode rectifier, which supplies direct current with a maximum voltage of 72 V at a rated current of 200 A;
- a power electronic control system, responsible for stabilizing the converter’s output current, also according to the user’s setting.
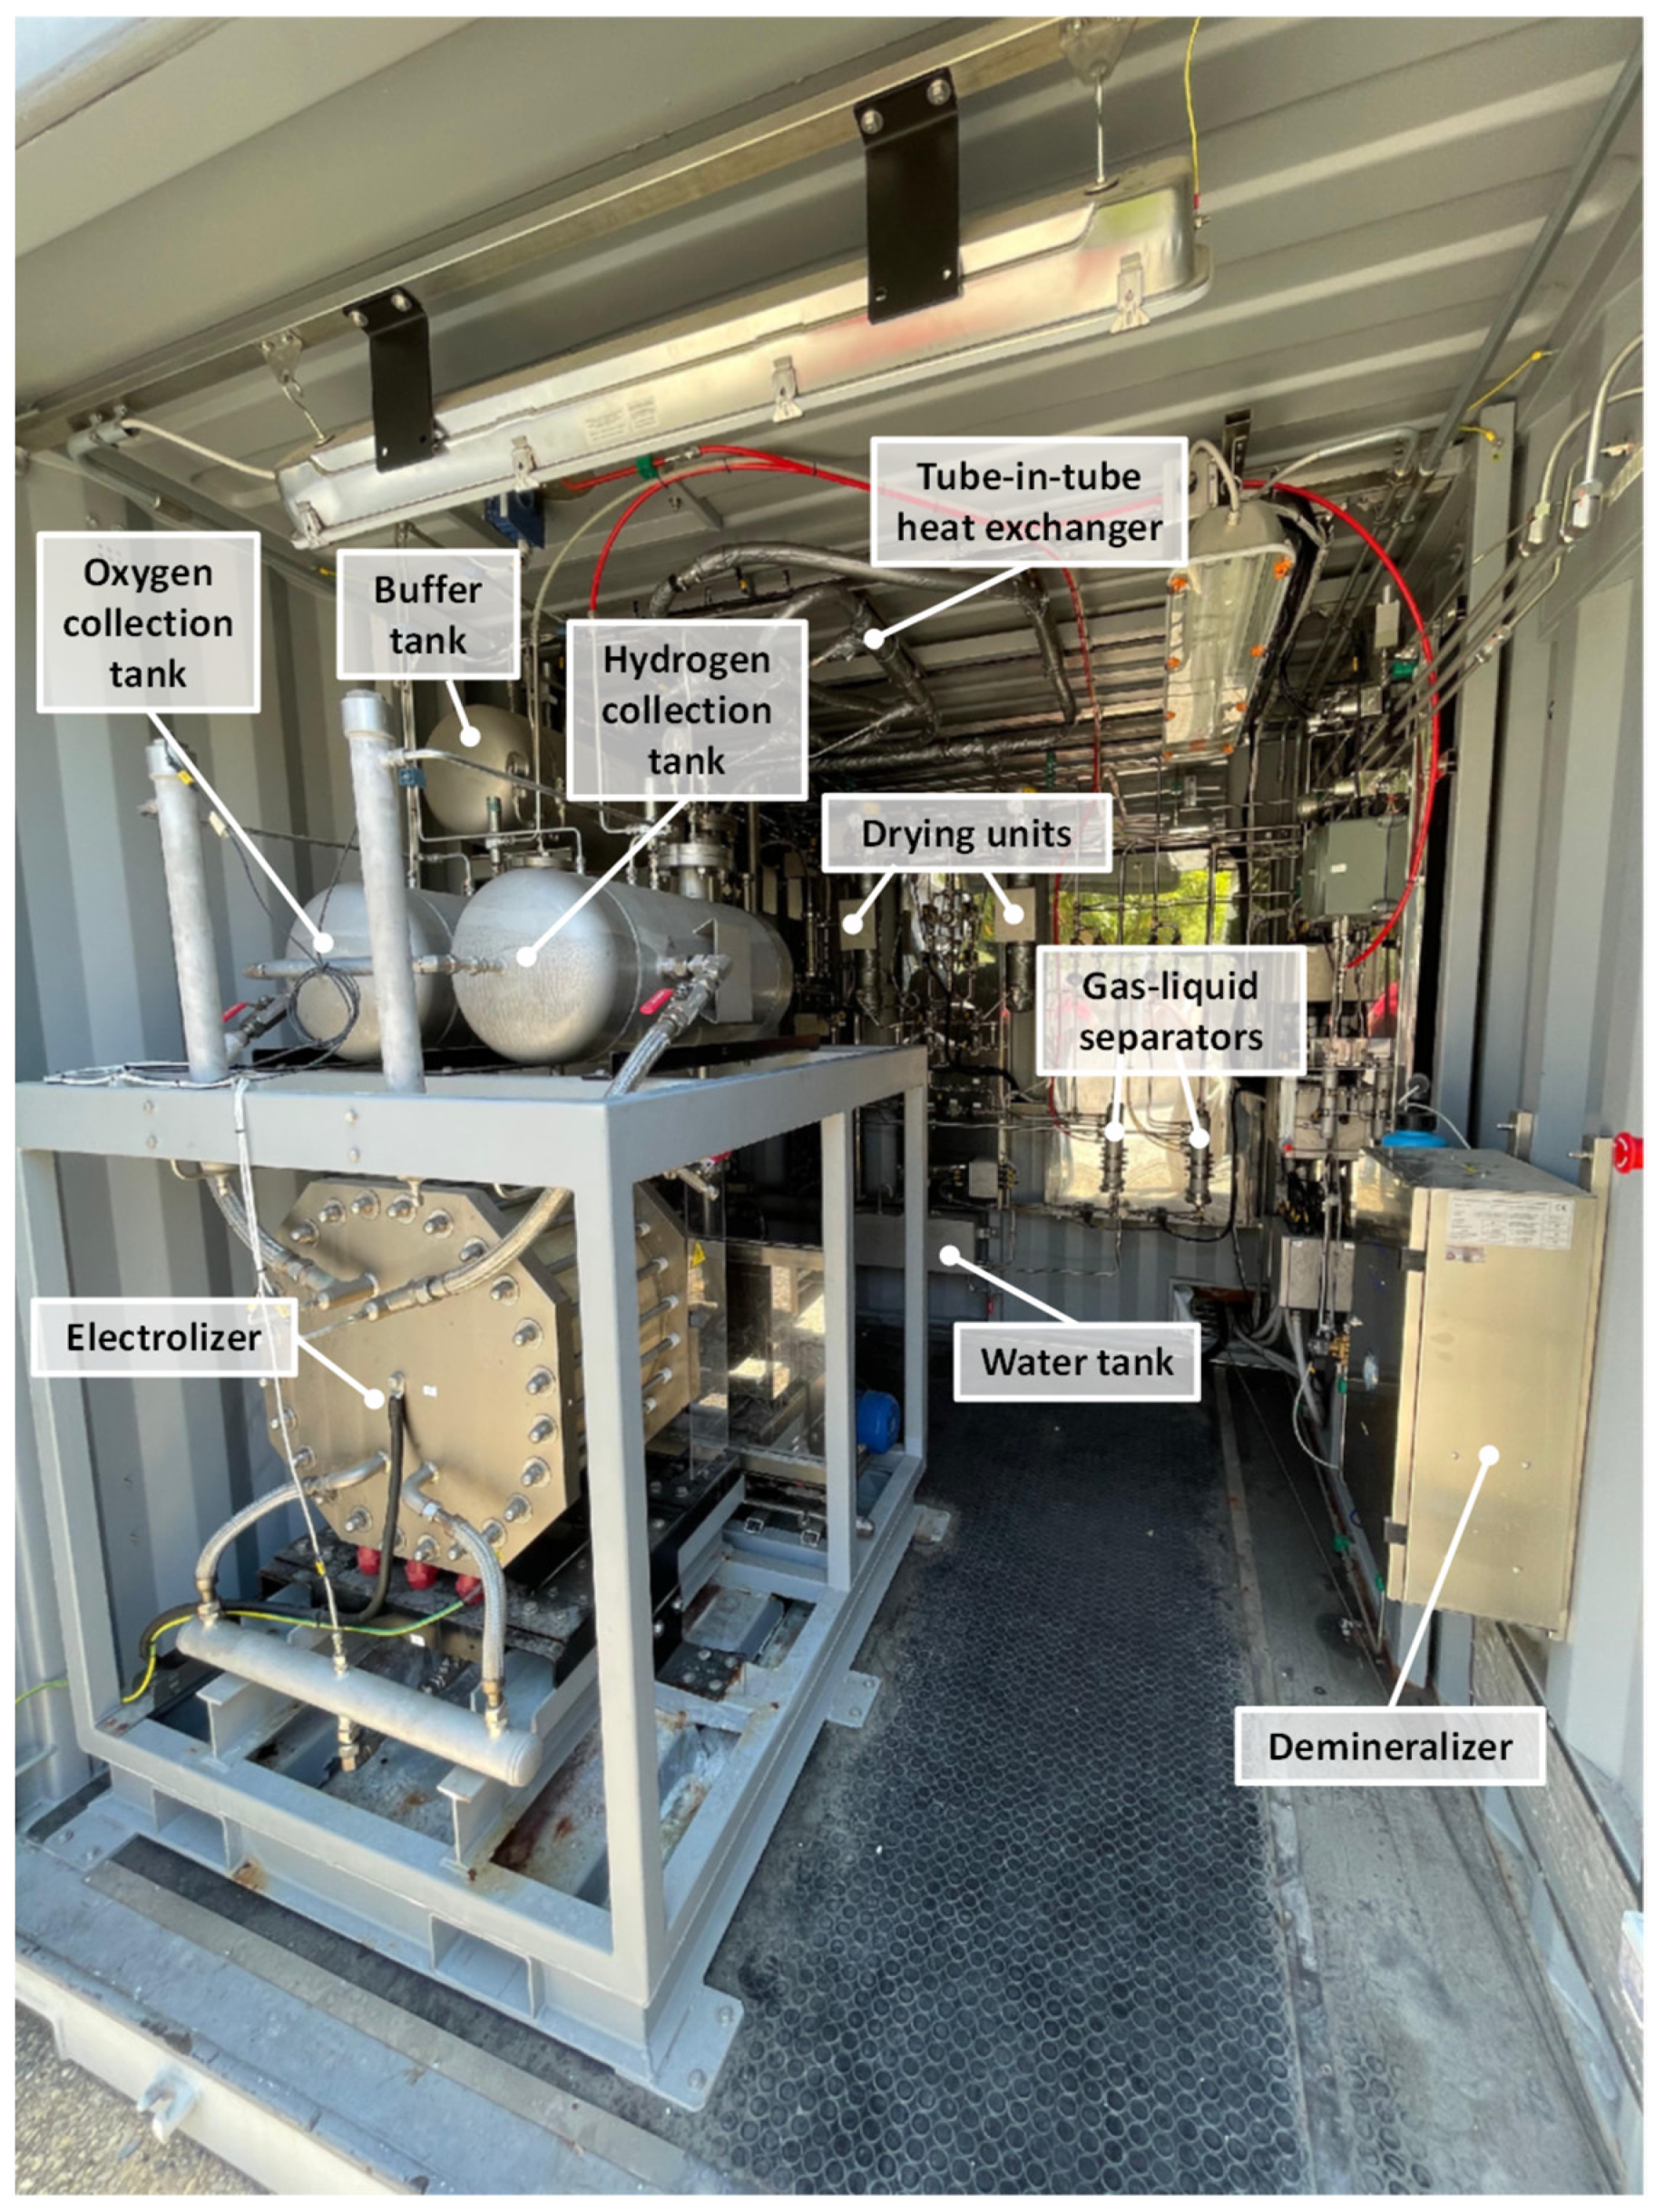
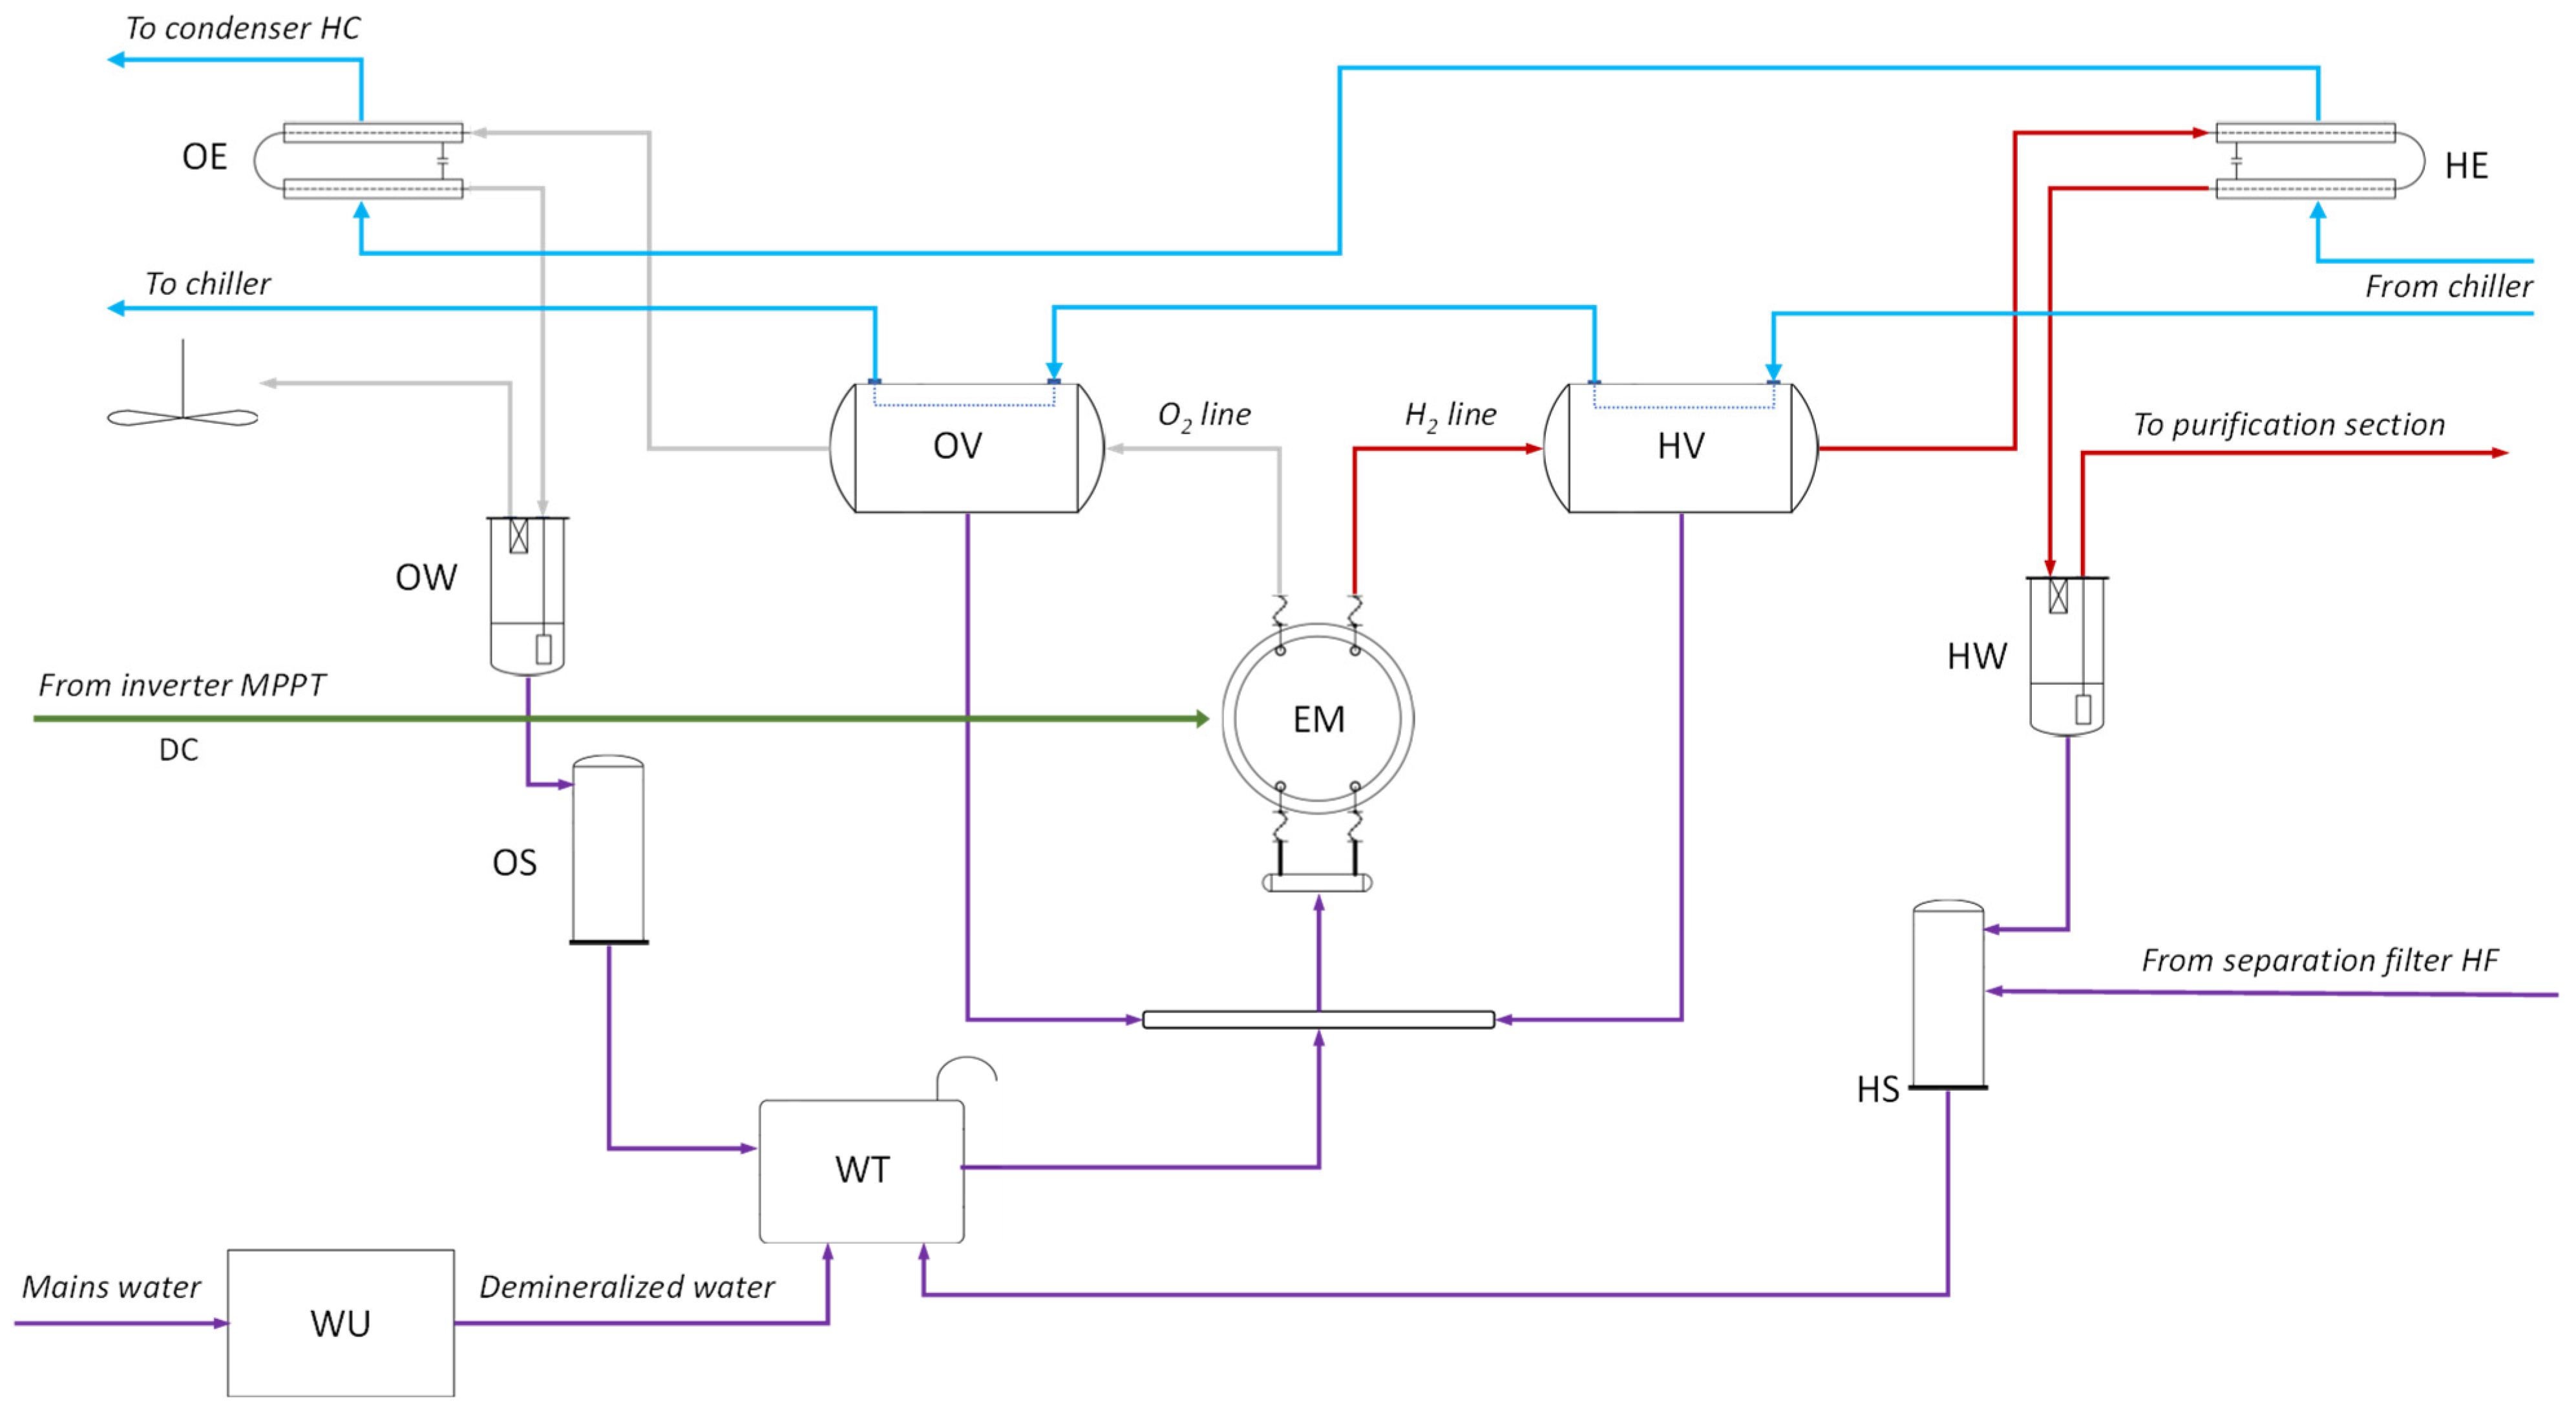
2.3. Hydrogen Production Section
- Electrolyser (EM), which splits water into hydrogen and oxygen using a potassium hydroxide (KOH) solution as the electrolyte. It can produce up to 2 Nm3/h of H2 and 1 Nm3/h of O2, operating between 2 and 10 kW and reaching pressures up to 20 bar.
- Hydrogen and oxygen collection tanks (HV and OV), where the generated gases are temporarily stored before being vented or sent to purification.
- Heat exchangers (HE and OE), tube-in-tube type, that reduce the temperature of the produced gases.
- Bubblers (HW and OW), which remove impurities such as moisture and residual gases from the produced hydrogen and oxygen.
- Gas–liquid separators (HS and OS), which recover residual water from the gas streams and send it back to the makeup water tank.
- Demineralizer (WU), where tap water is treated to make it suitable for electrolysis.
- Makeup water tank (WT), with a capacity of 15 L of demineralized water, which ensures continuous water supply to the electrolyser.
- Cooling system, consisting of a circulation pump, a 200 L buffer tank, and a 7.3 kW chiller, which removes the heat generated during electrolysis.
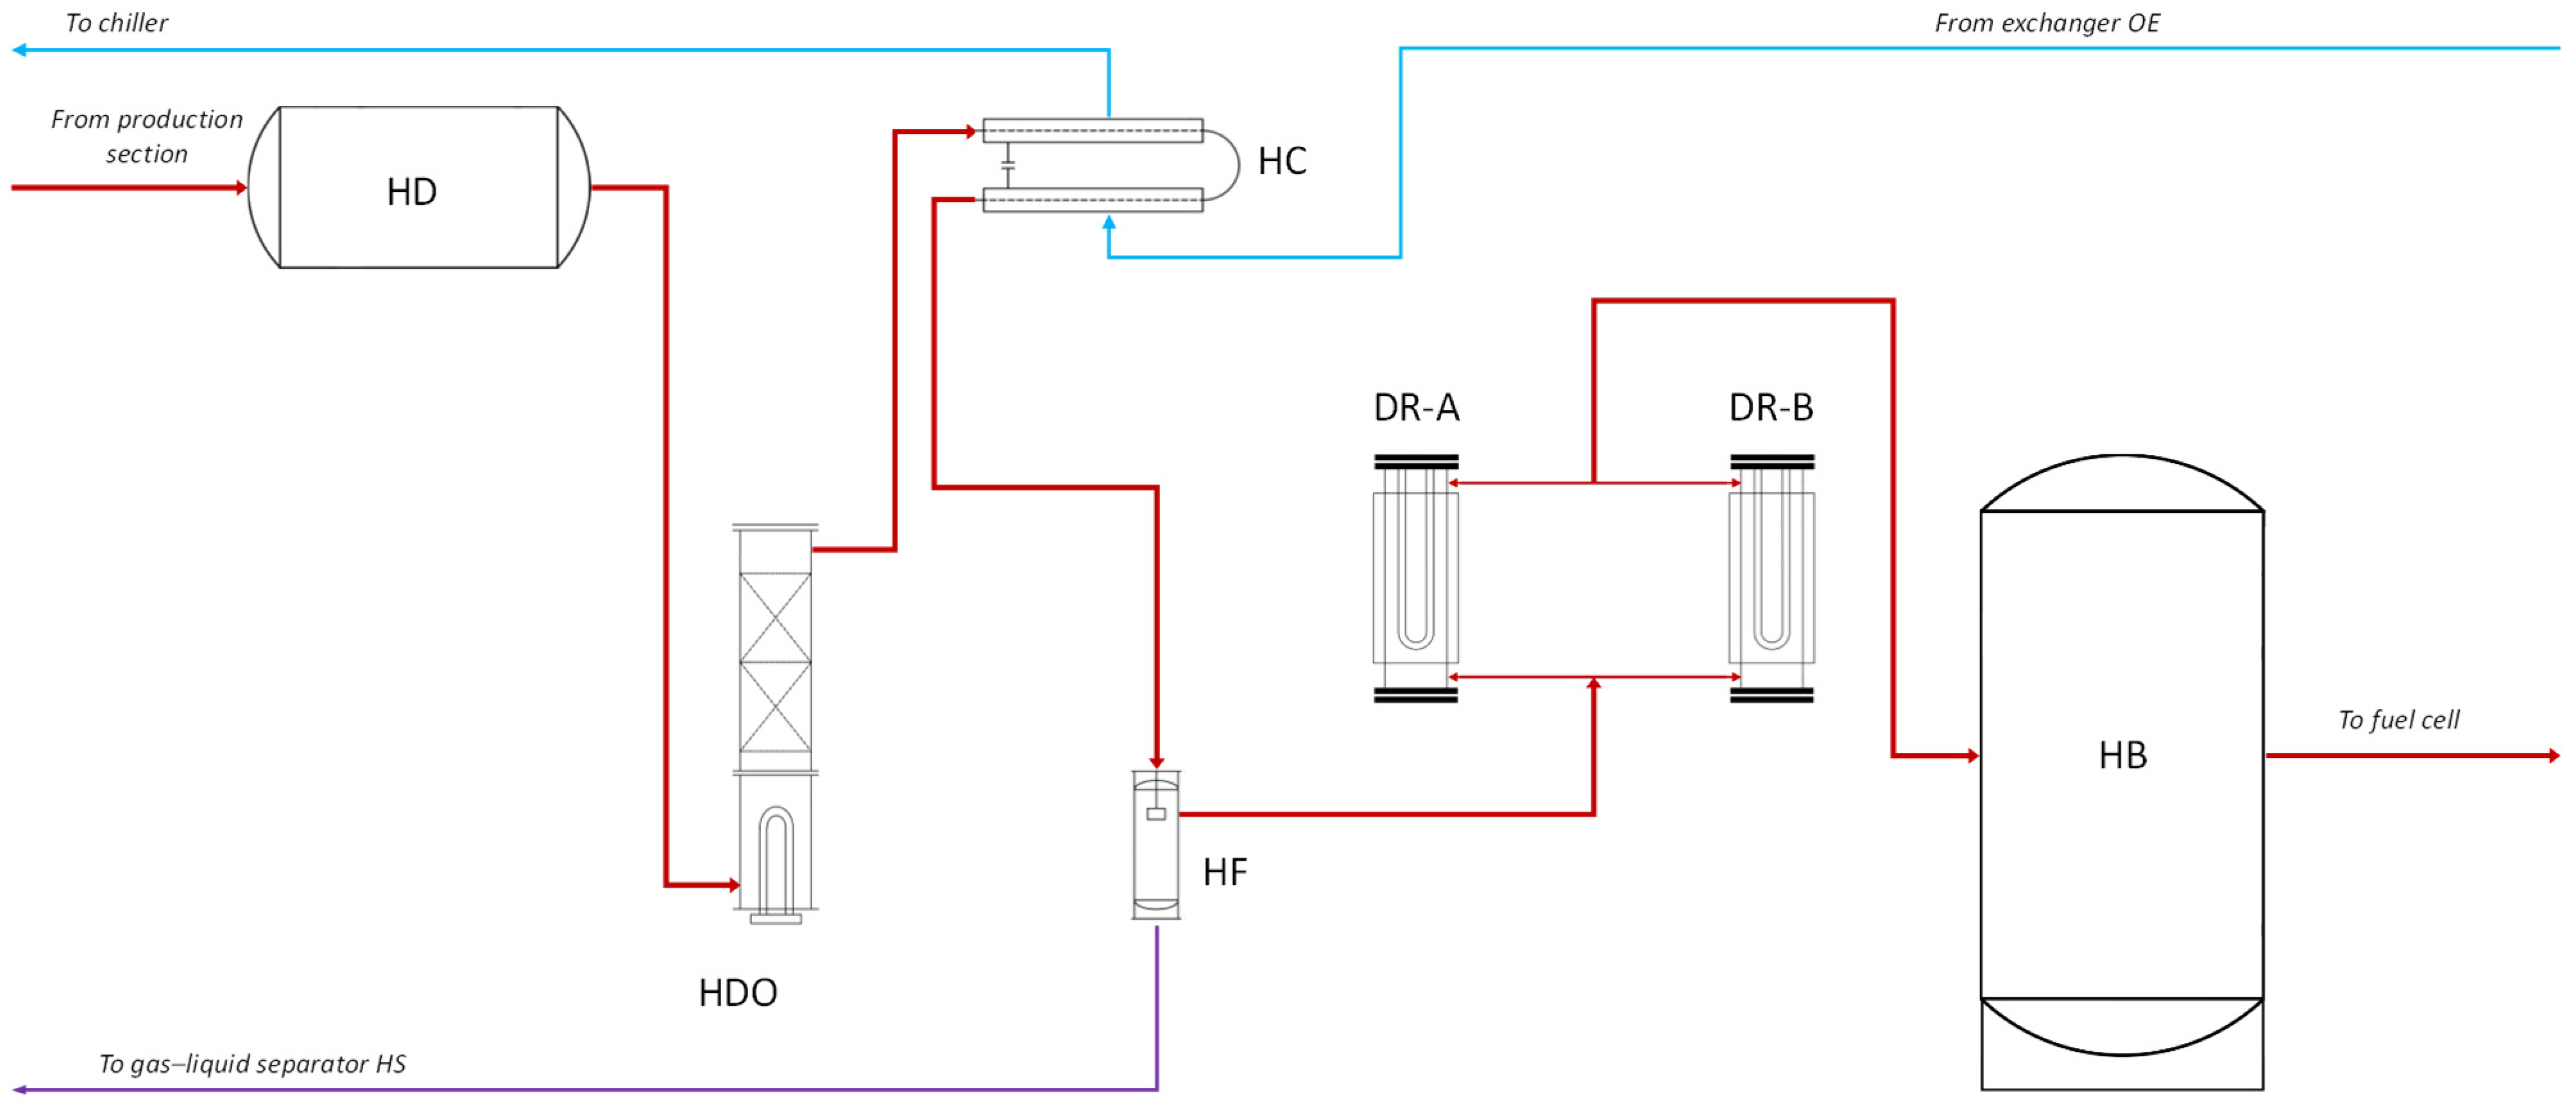
2.4. Purification Section
- Buffer tank (HD), a stainless-steel vessel where hydrogen is temporarily stored before the purification process.
- Catalytic deoxidation reactor (HDO), which removes residual oxygen by inducing a reaction with excess hydrogen to form water vapour.
- Condenser (HC), which cools and condenses the vapour generated during the deoxidation reaction.
- Separation filter (HF), which removes the condensed water using a coalescing filter.
- Drying units (DR-A and DR-B), which operate alternately to remove residual moisture from the gas stream.
- Storage tank (HB), which is a 0.70 m3 stainless steel tank used to collect the purified hydrogen.
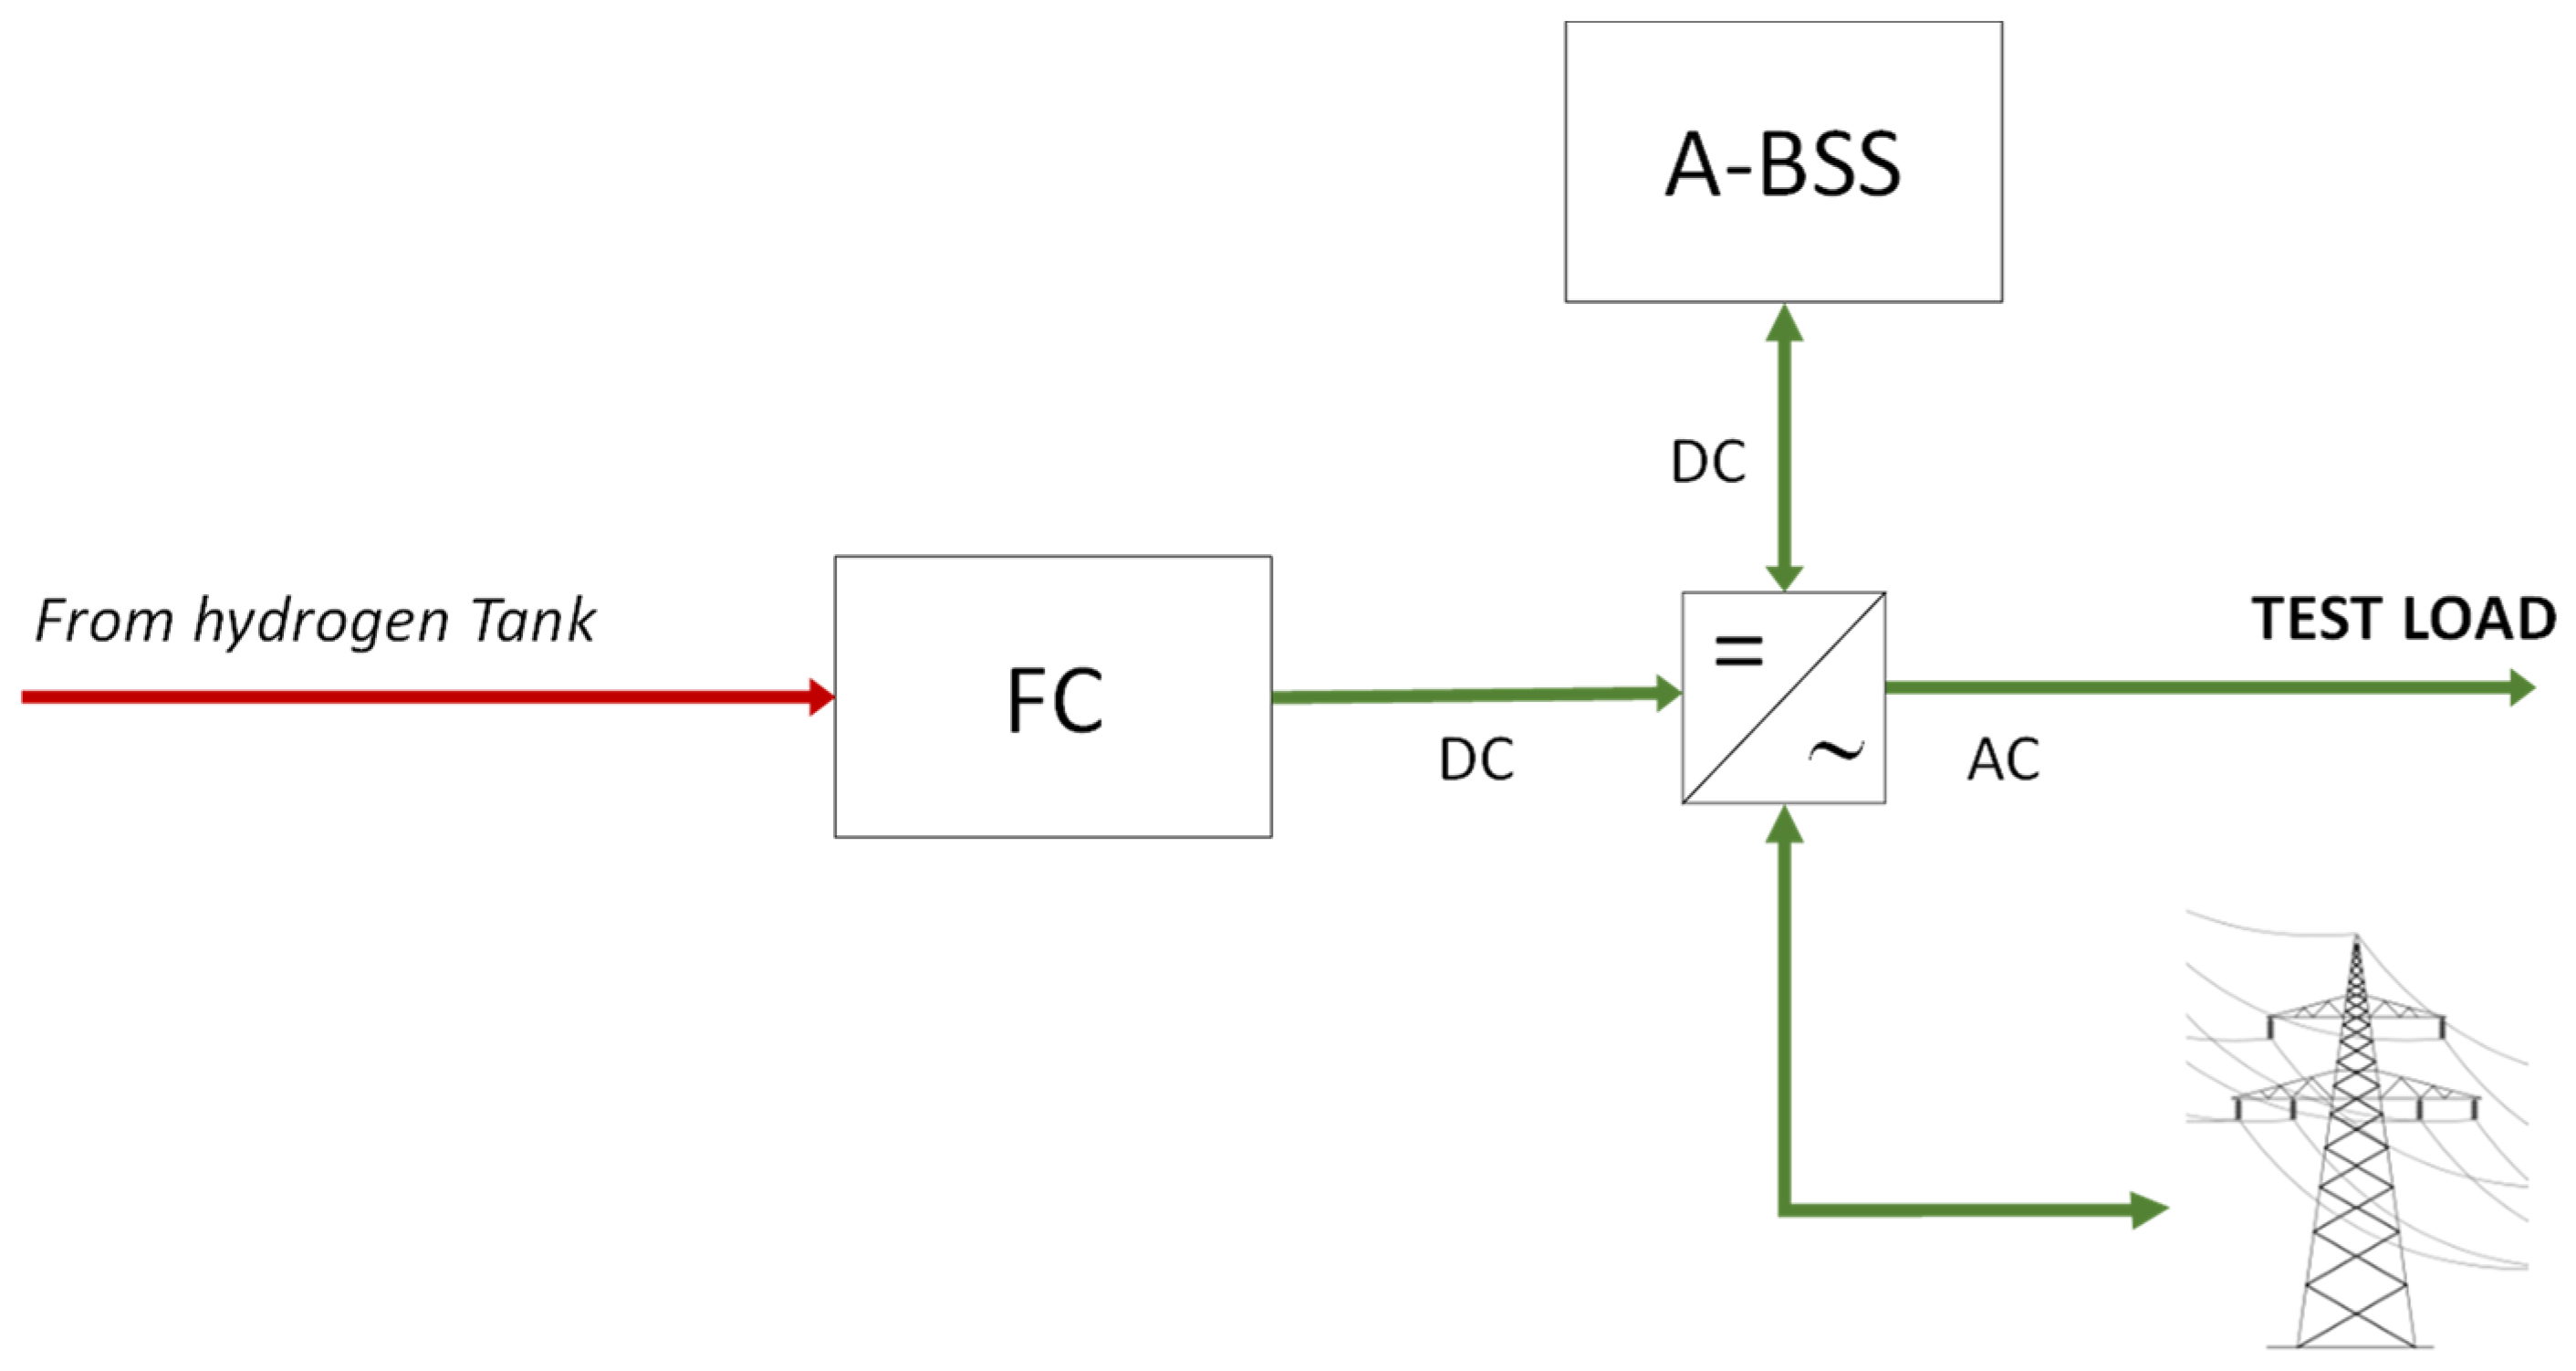
2.5. Reconversion Section
- fuel cell (FC), PEM type, with a nominal power output of 1.7 kW in direct current (DC);
- multifunction inverter—it manages both the conversion from DC to AC for loads and the charging of the auxiliary battery pack (A-BSS);
- Auxiliary battery storage system (A-BSS), with a nominal voltage of 48 V and a rated capacity of 368 Ah.
2.6. Control Section
- control buttons (Reset, Emergency Stop, Start);
- indicator lights for process supervision;
- alarm management and safety sequence control.
2.7. Monitoring Section
- Station for solar and infrared radiation measurement, equipped with 6 pyranometers and 6 pyrgeometers, positioned to measure radiation in three orthogonal directions;
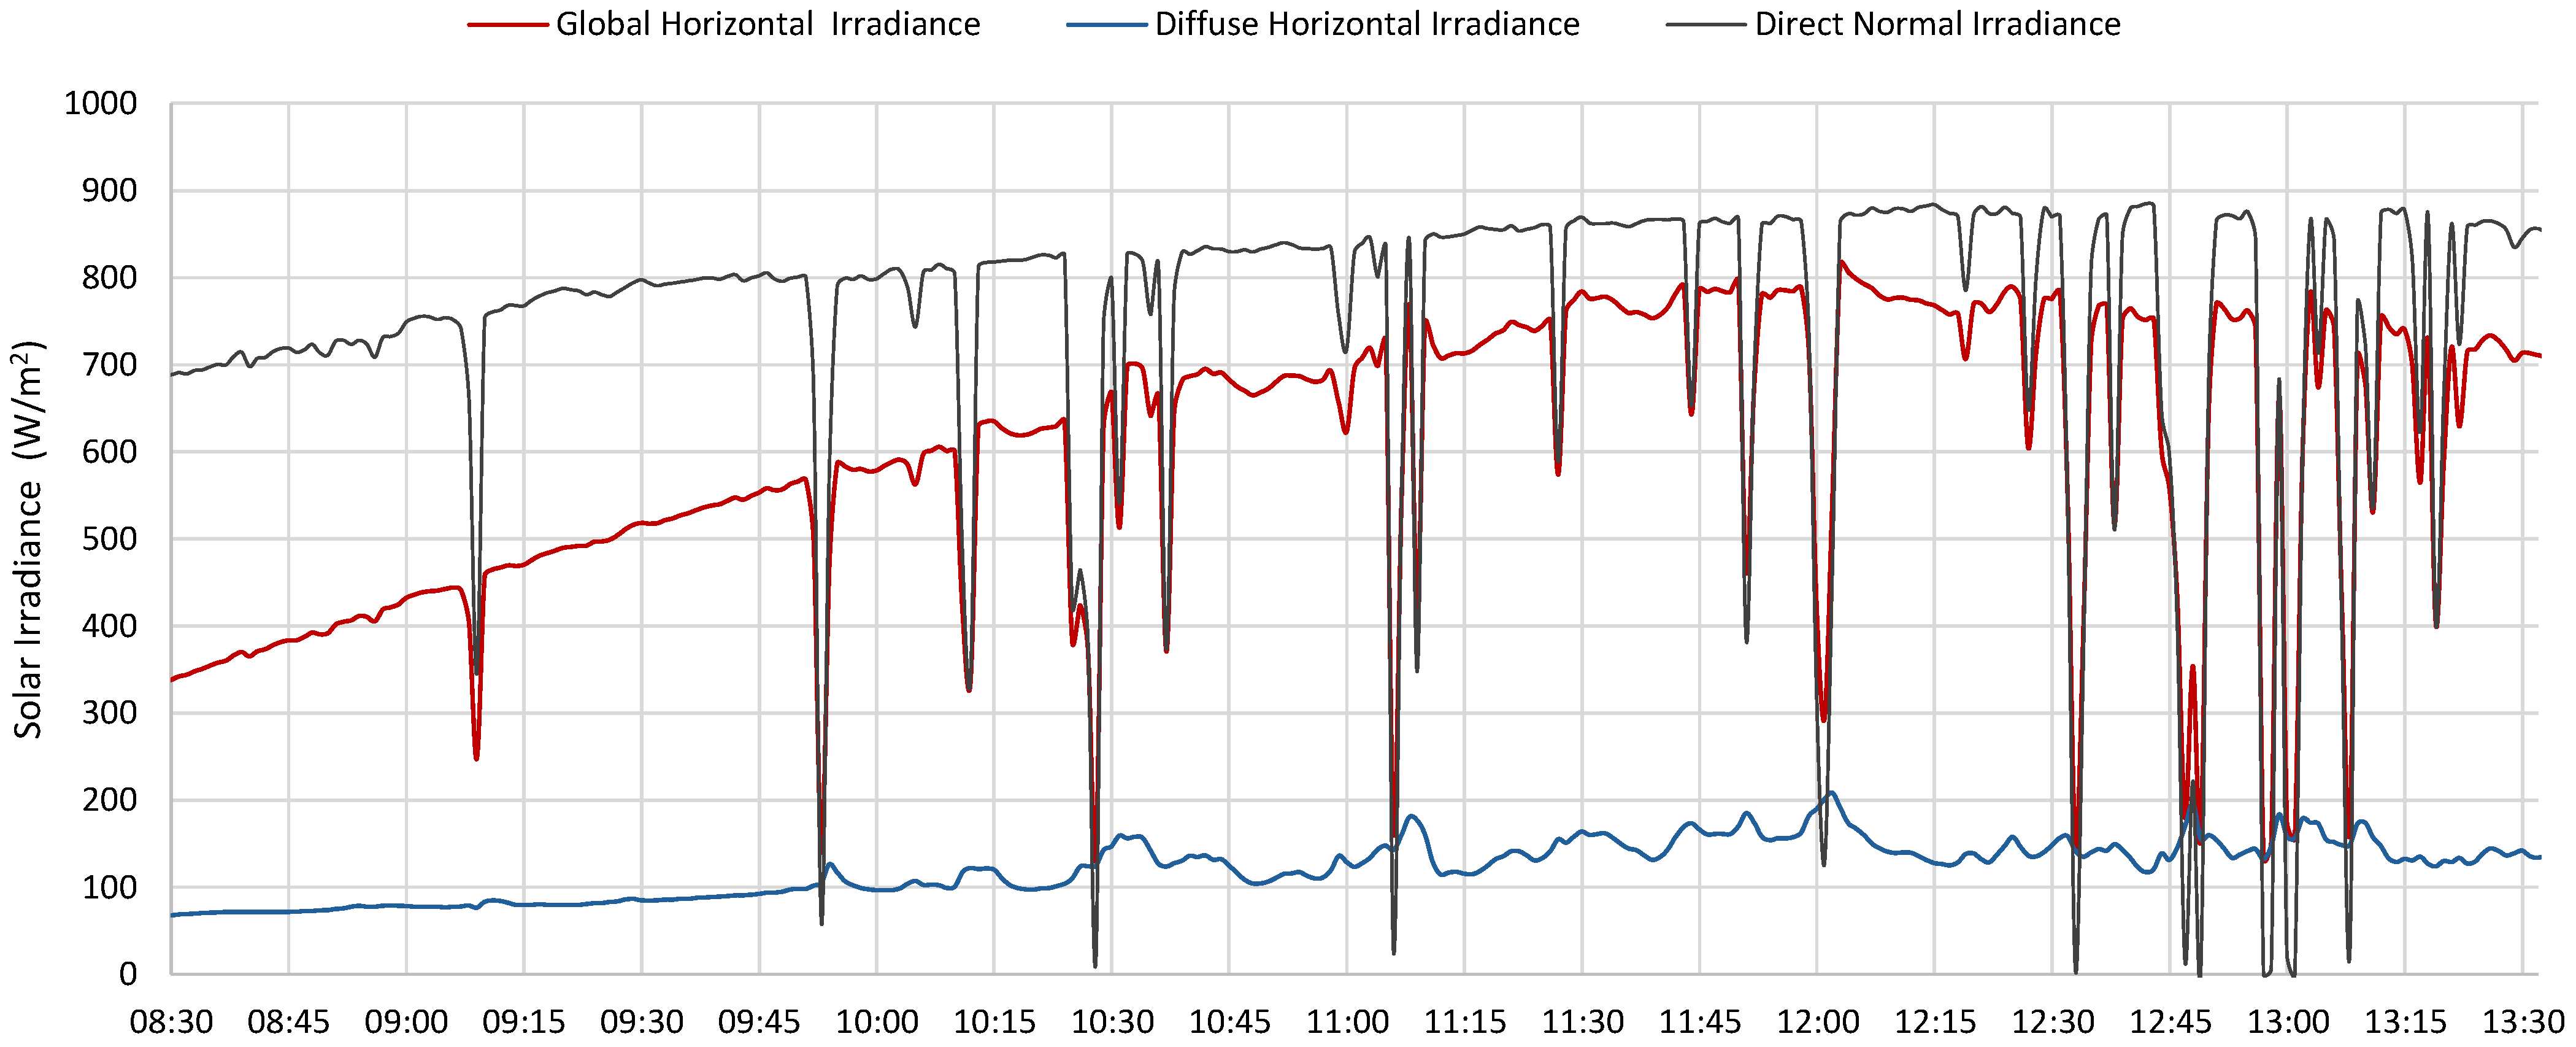
- Station for direct and diffuse radiation measurement, including high-precision instruments such as a pyrheliometer and a shaded pyranometer mounted on a solar tracker;
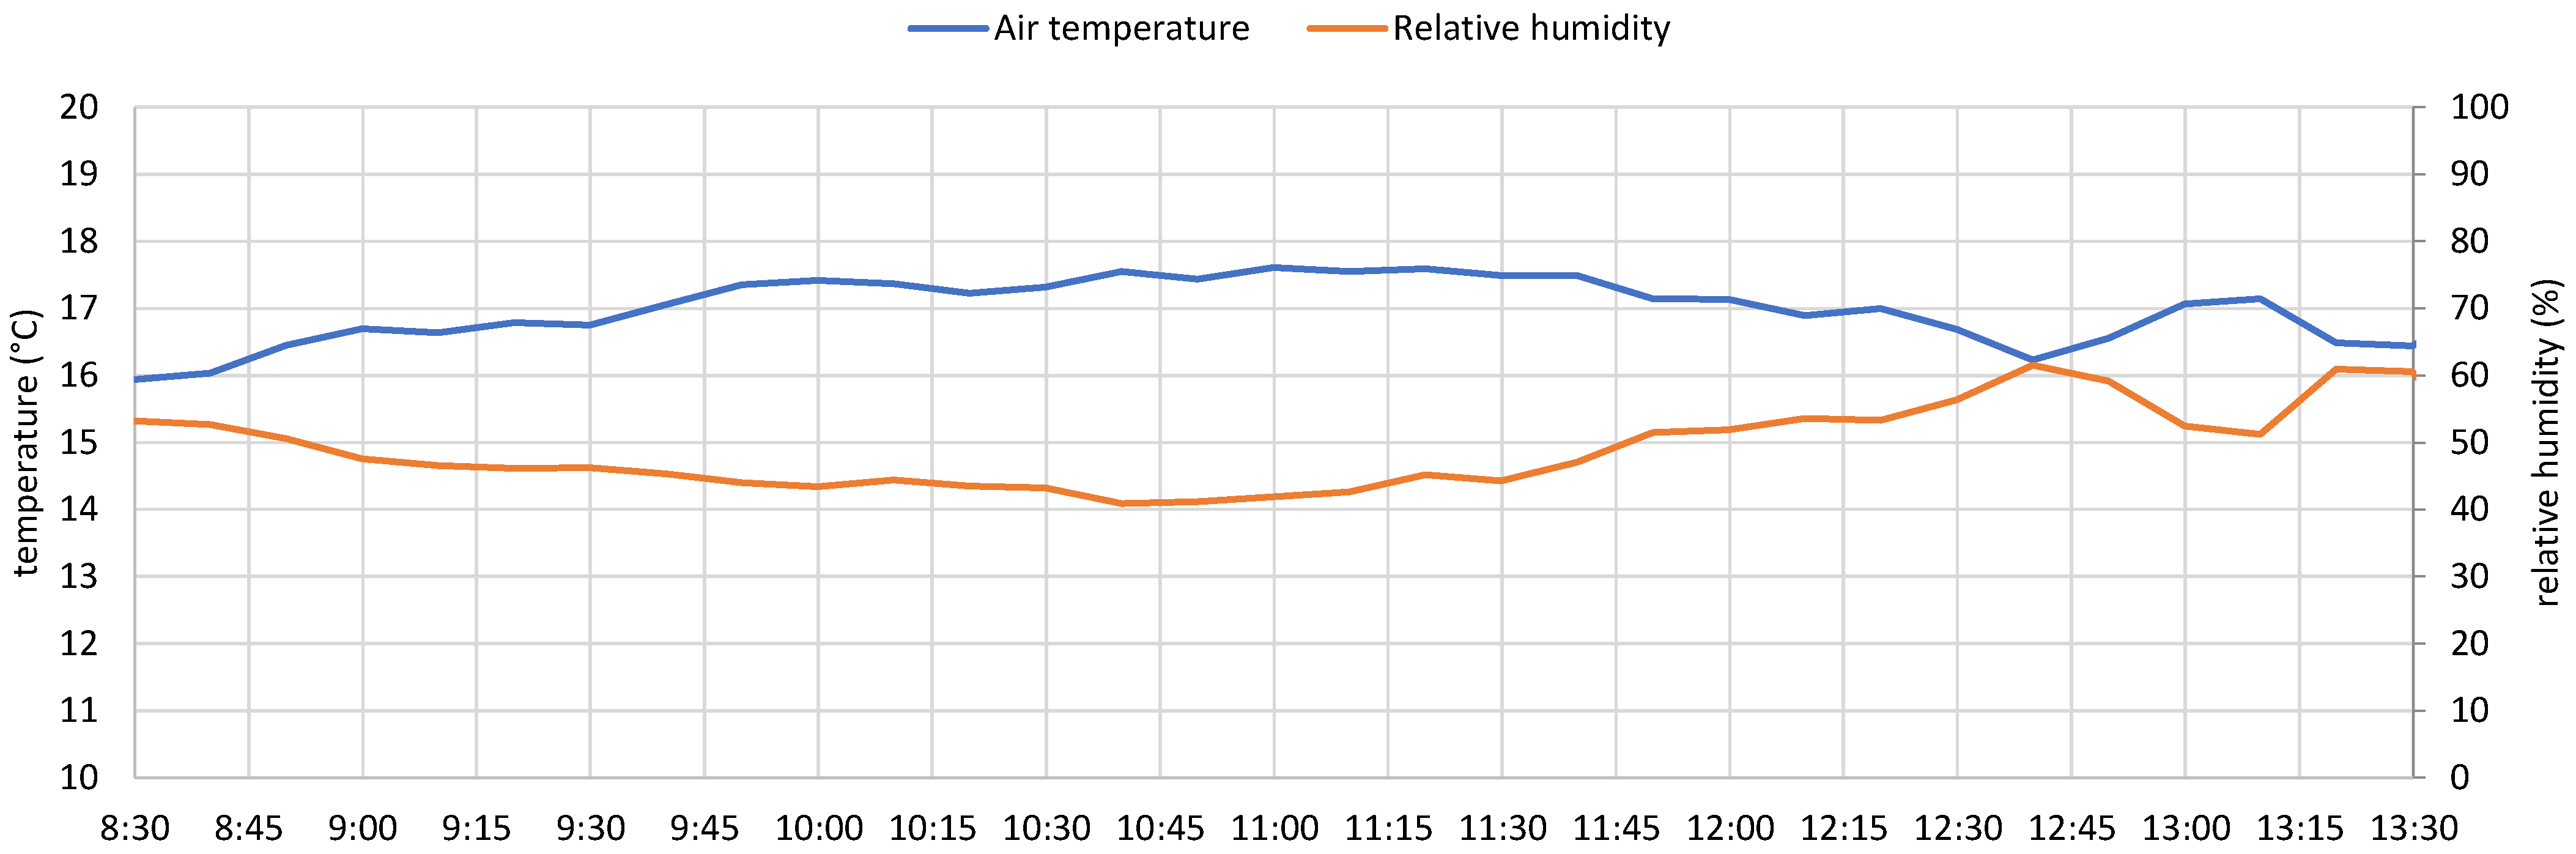
- Microclimatic station, measuring temperature, humidity, atmospheric pressure, wind speed, and wind direction;
- Photovoltaic monitoring system, involving a cloud interface for real-time visualization of the photovoltaic plant’s production and consumption data.
3. Operation of the Plant
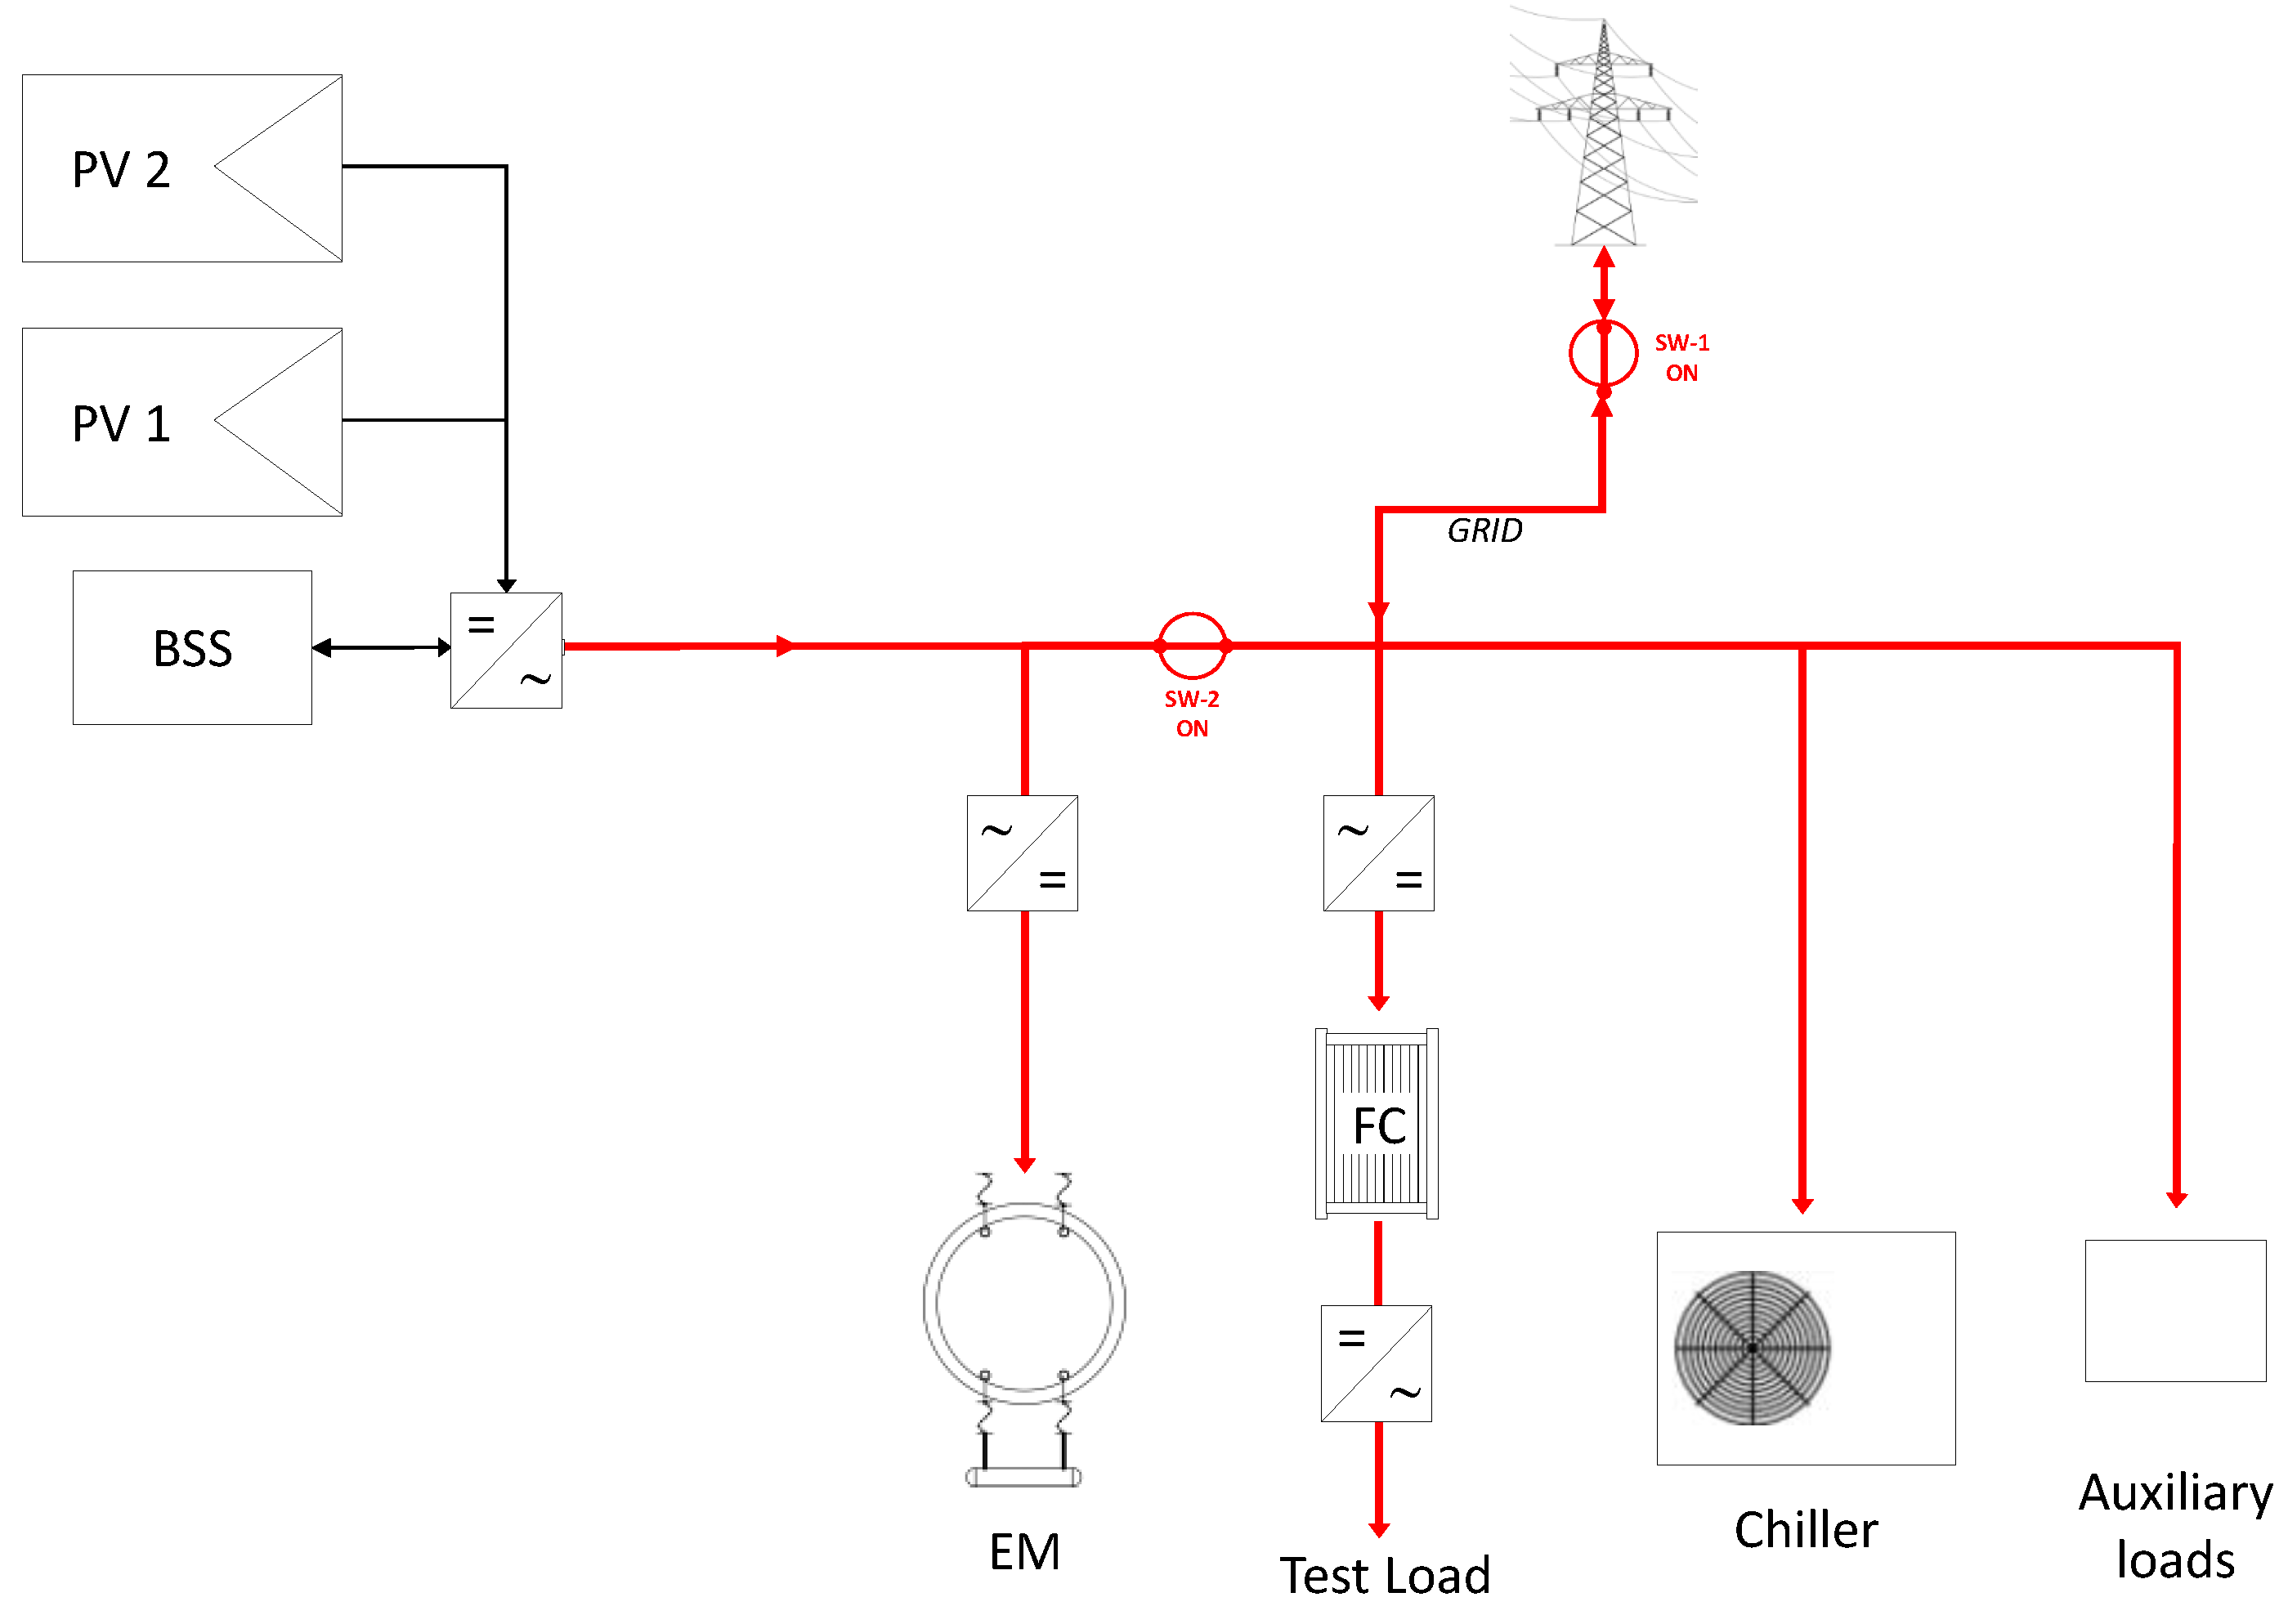
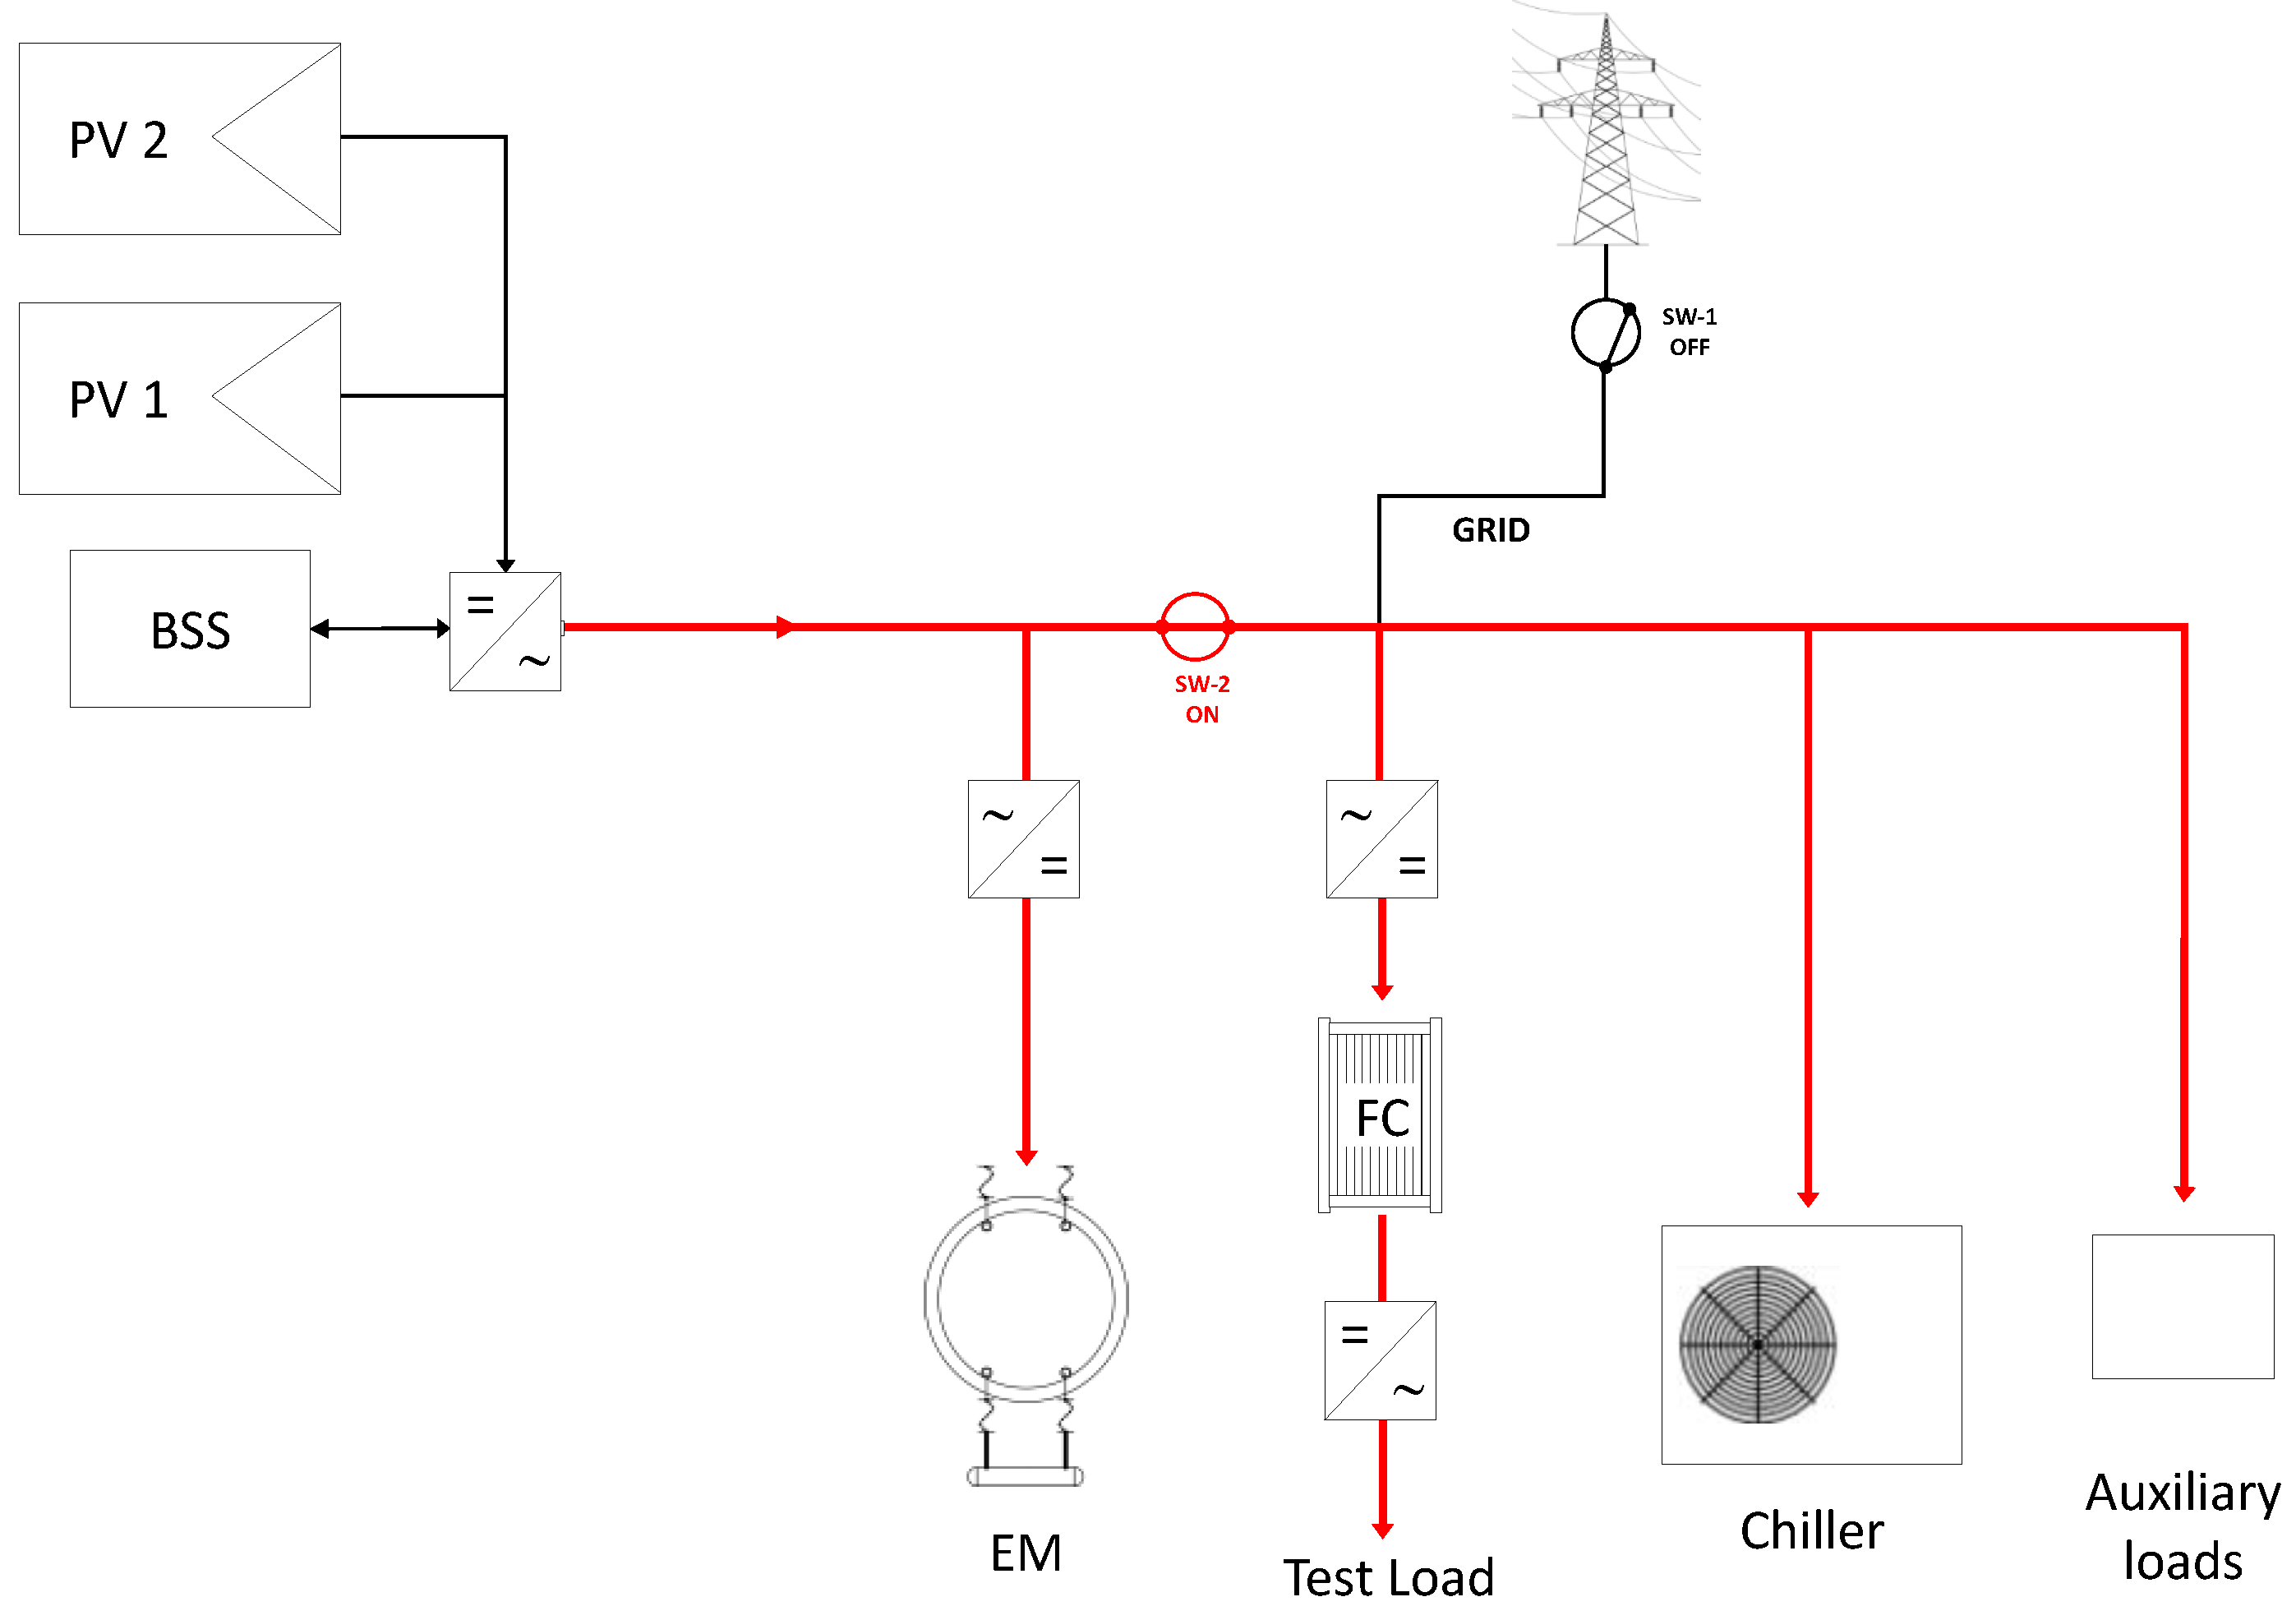
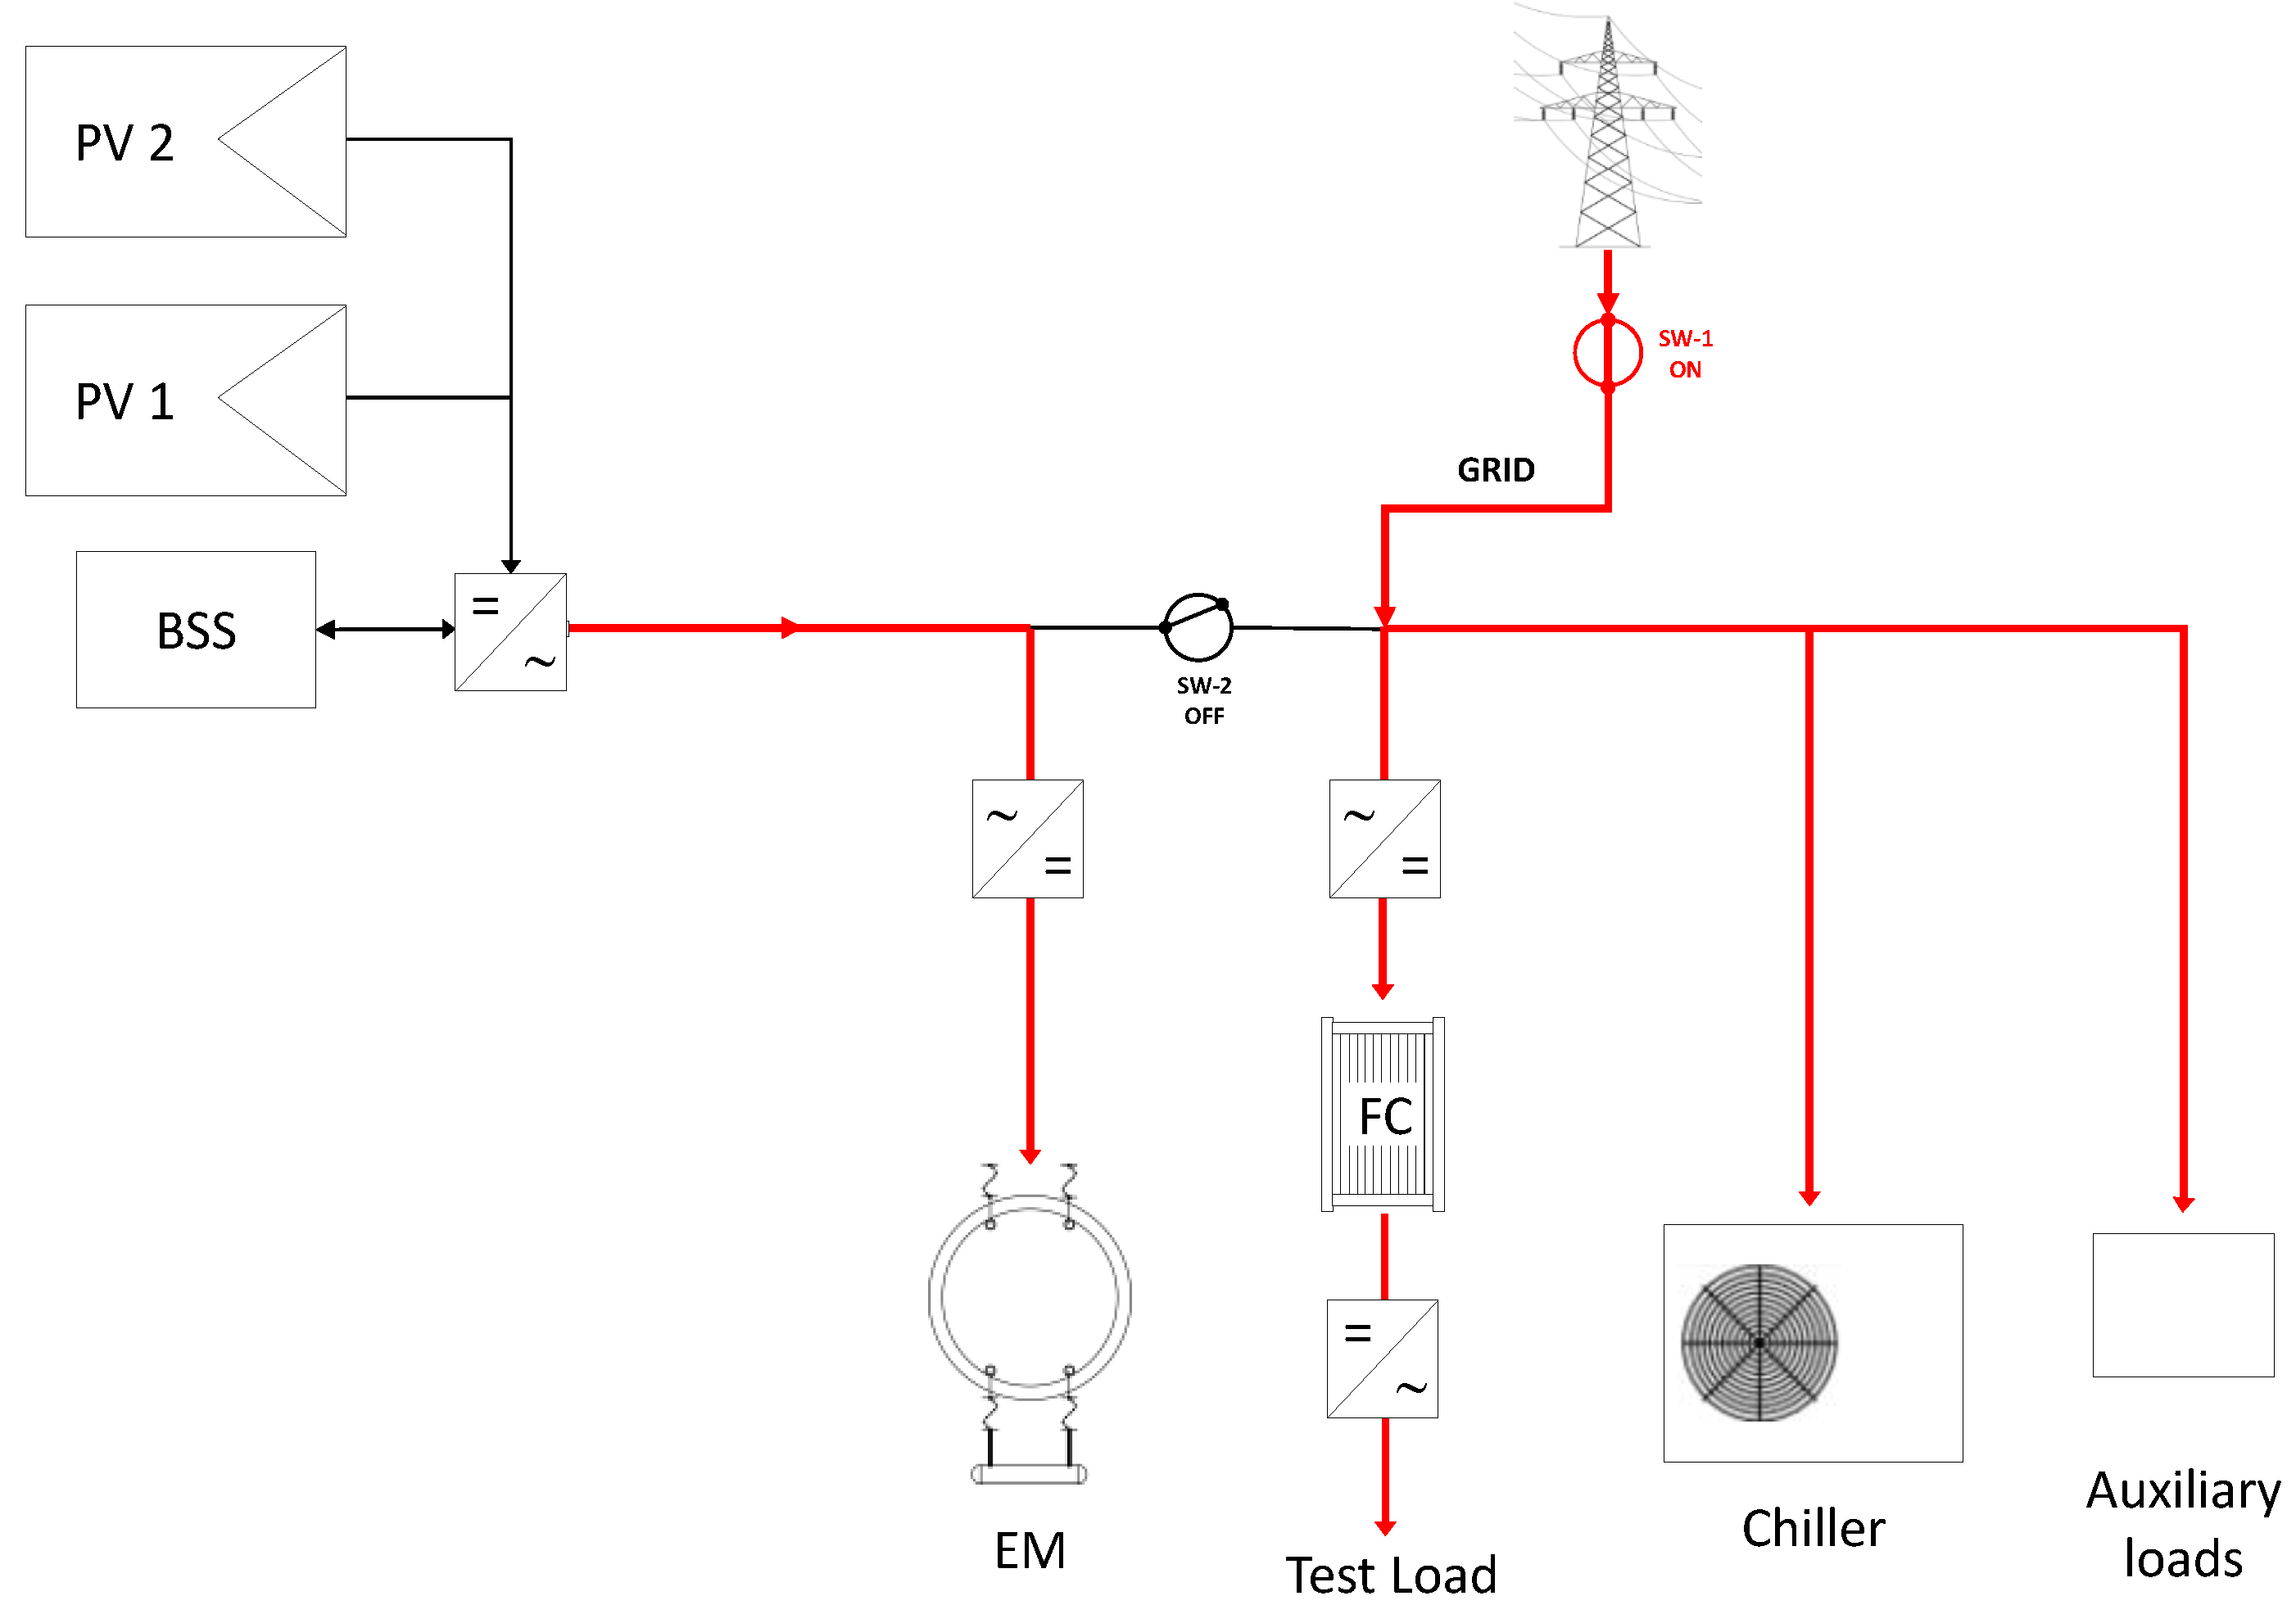
3.1. Operational Configurations
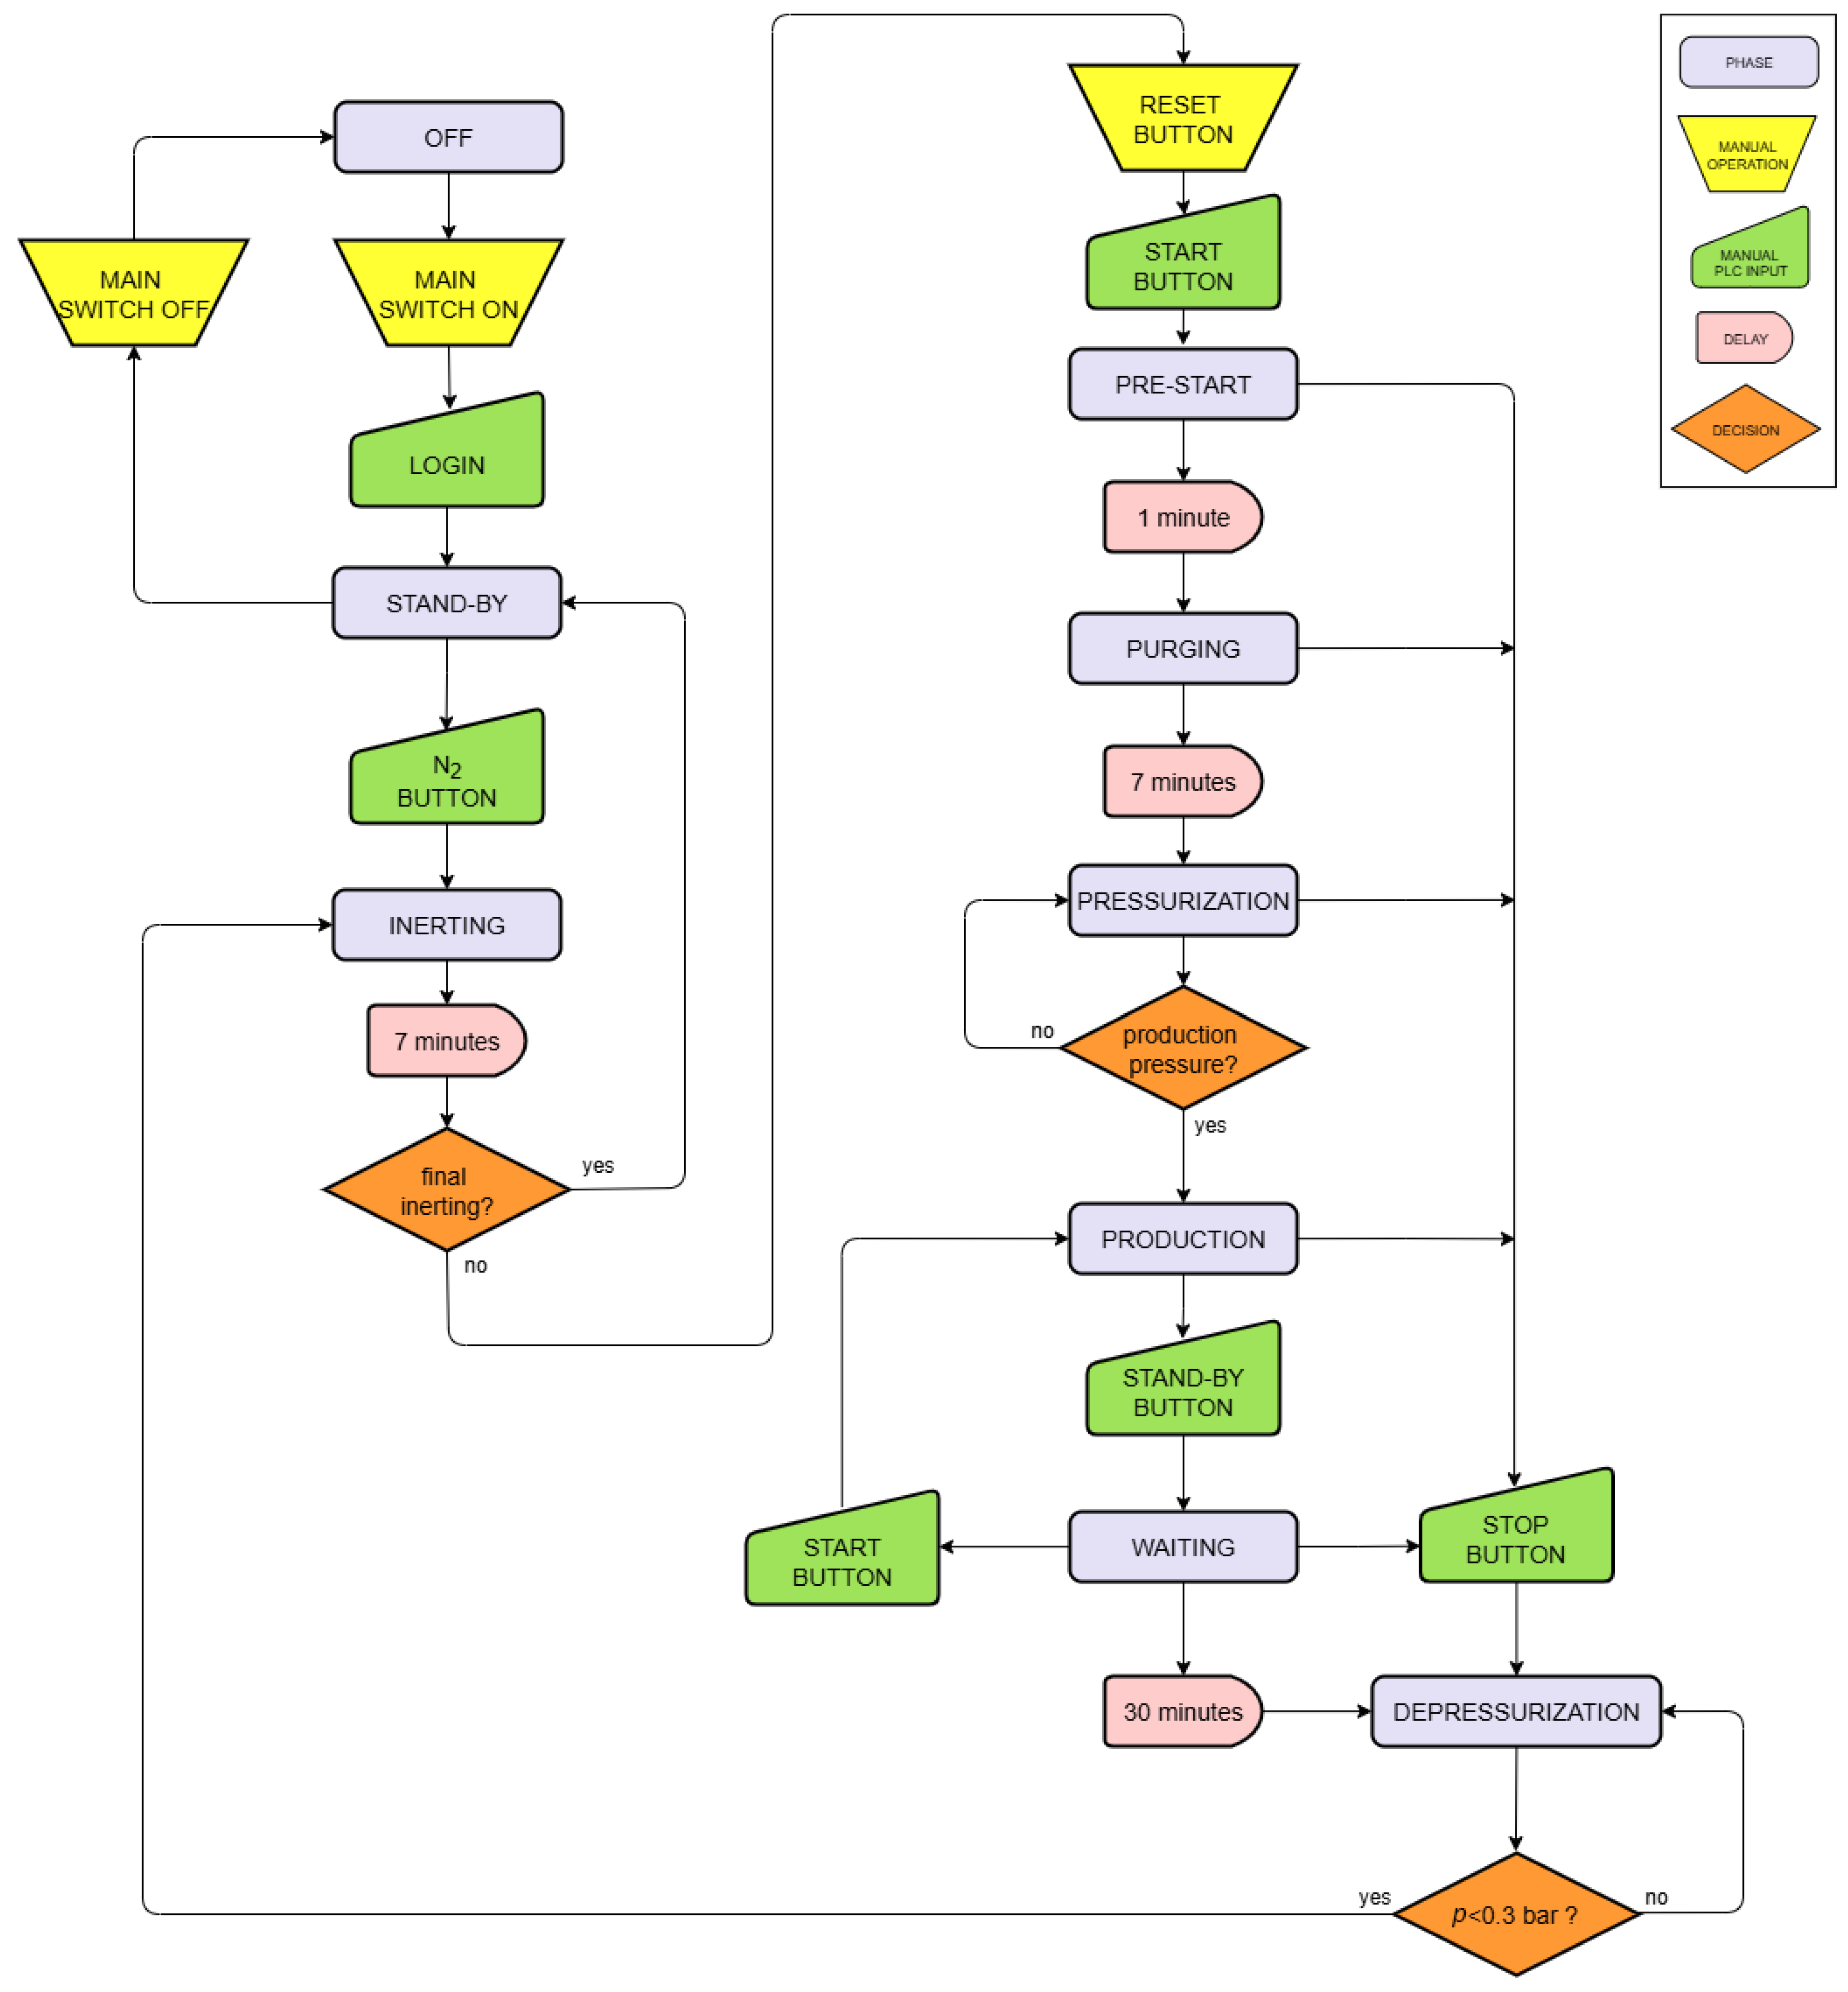
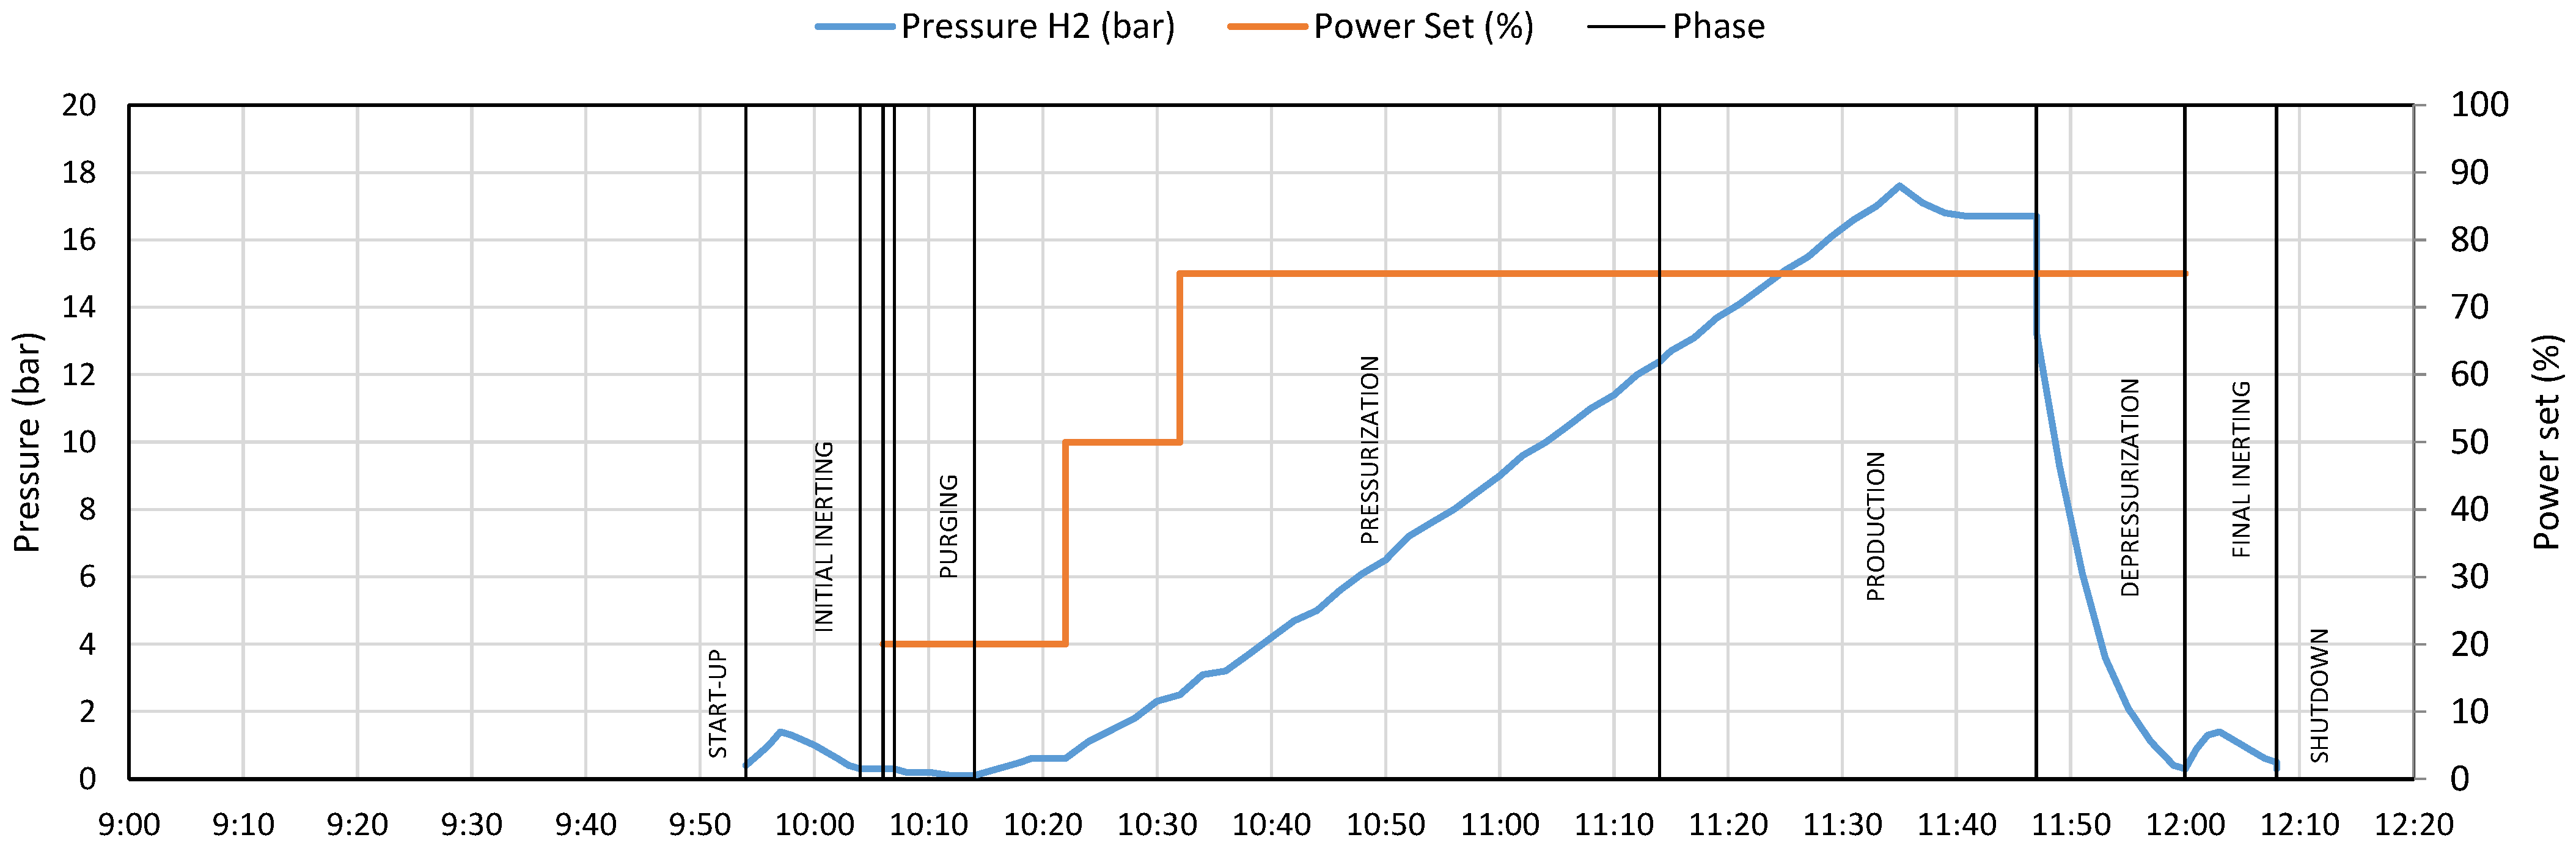
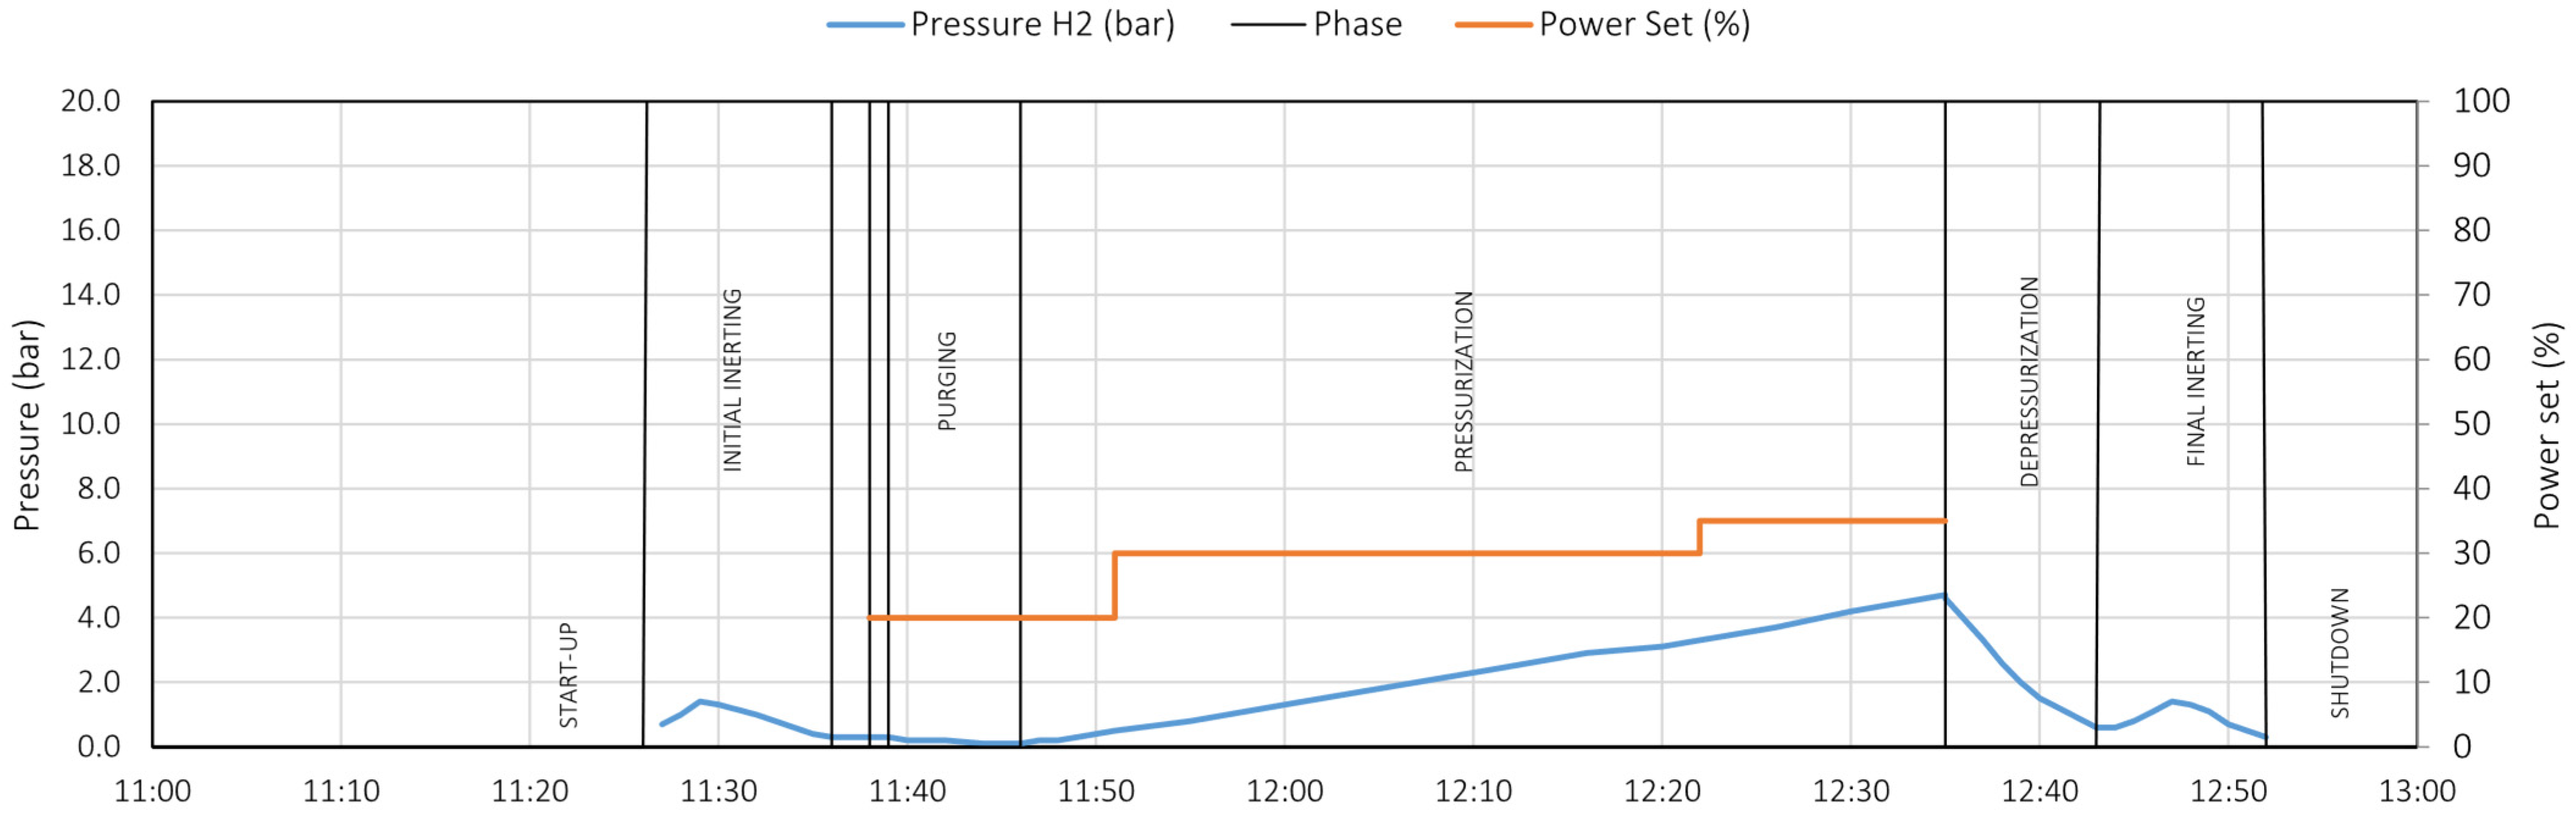
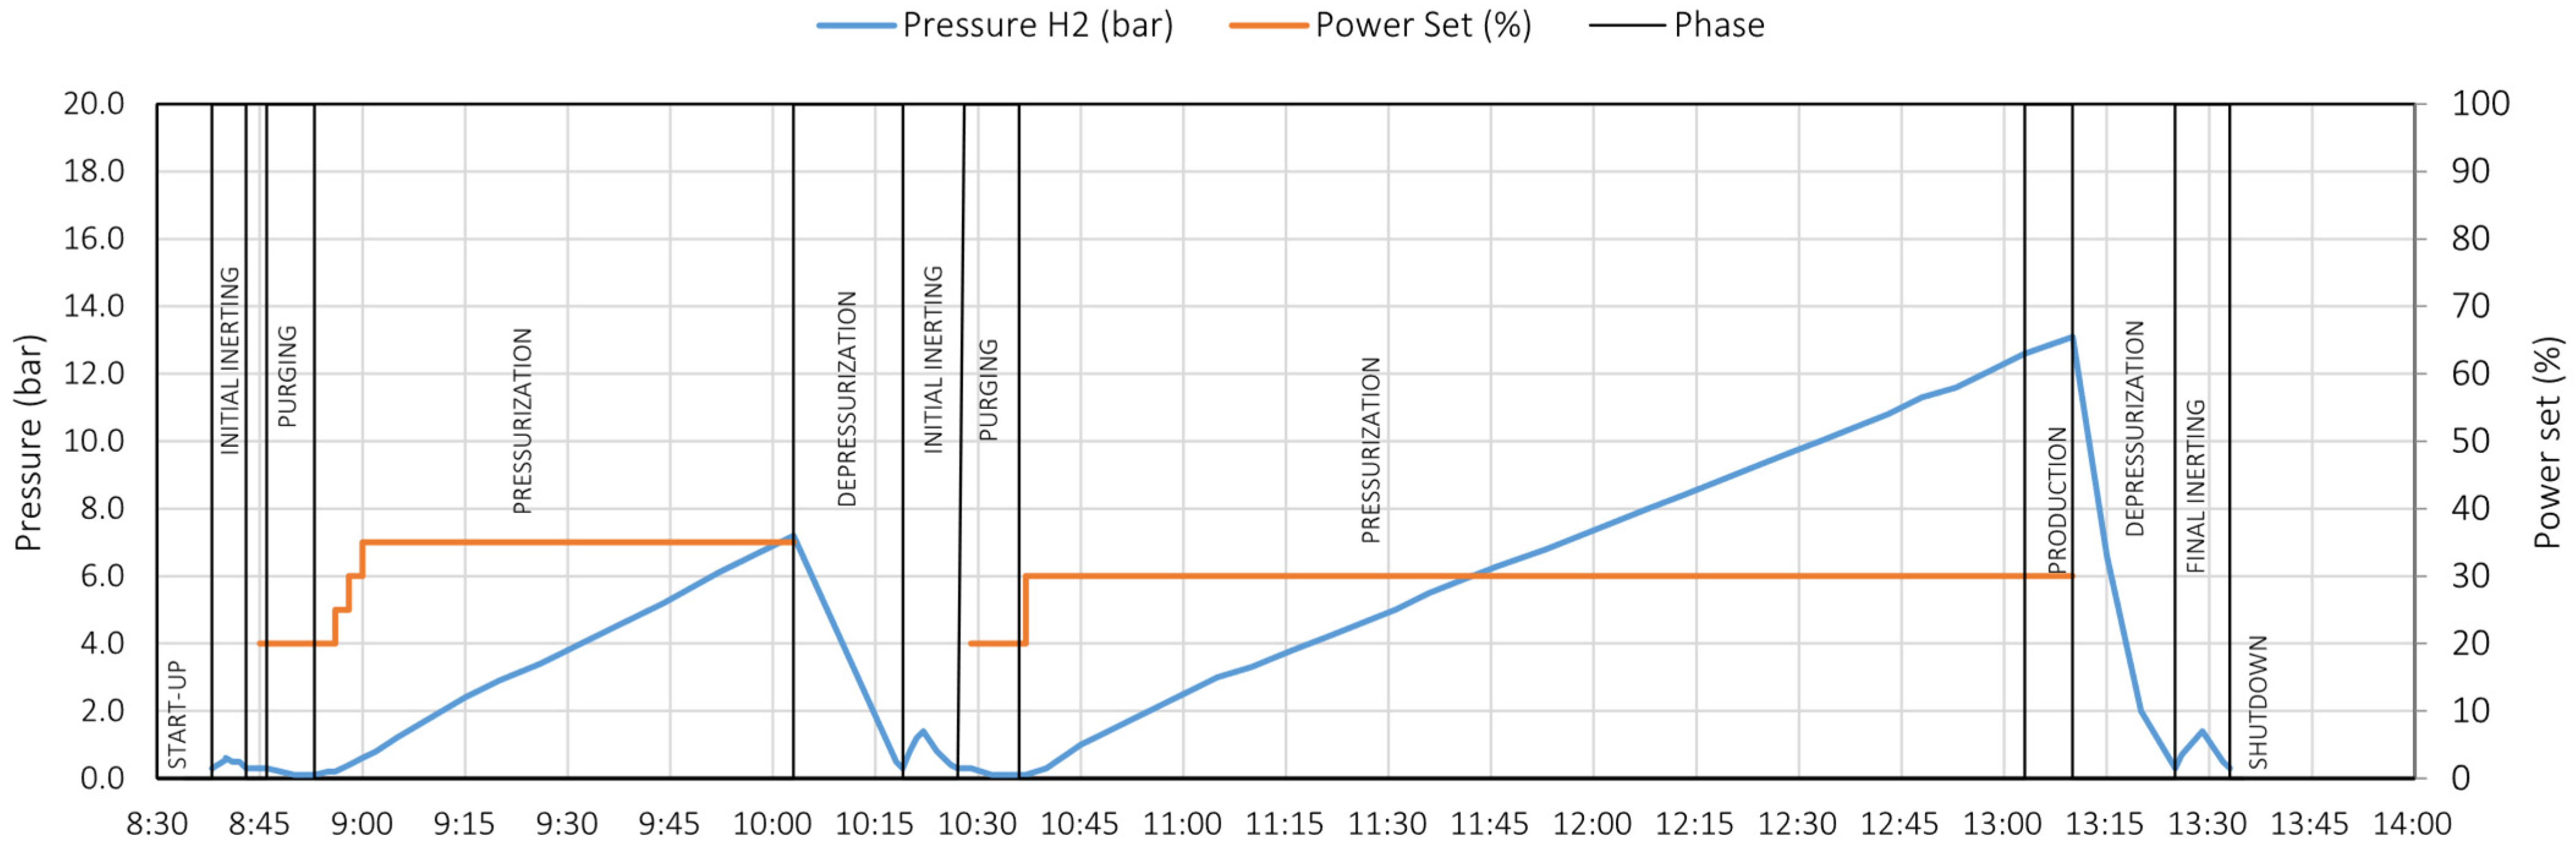
3.2. Operational Phases
- Start-up
- Initial inerting
- Standby
- Pre-start
- Purging
- Pressurization
- Production
- Depressurization
- Final inerting
- Shut-down
4. Experimental Analysis
- To experimentally assess the main parameters of the process and energy flows.
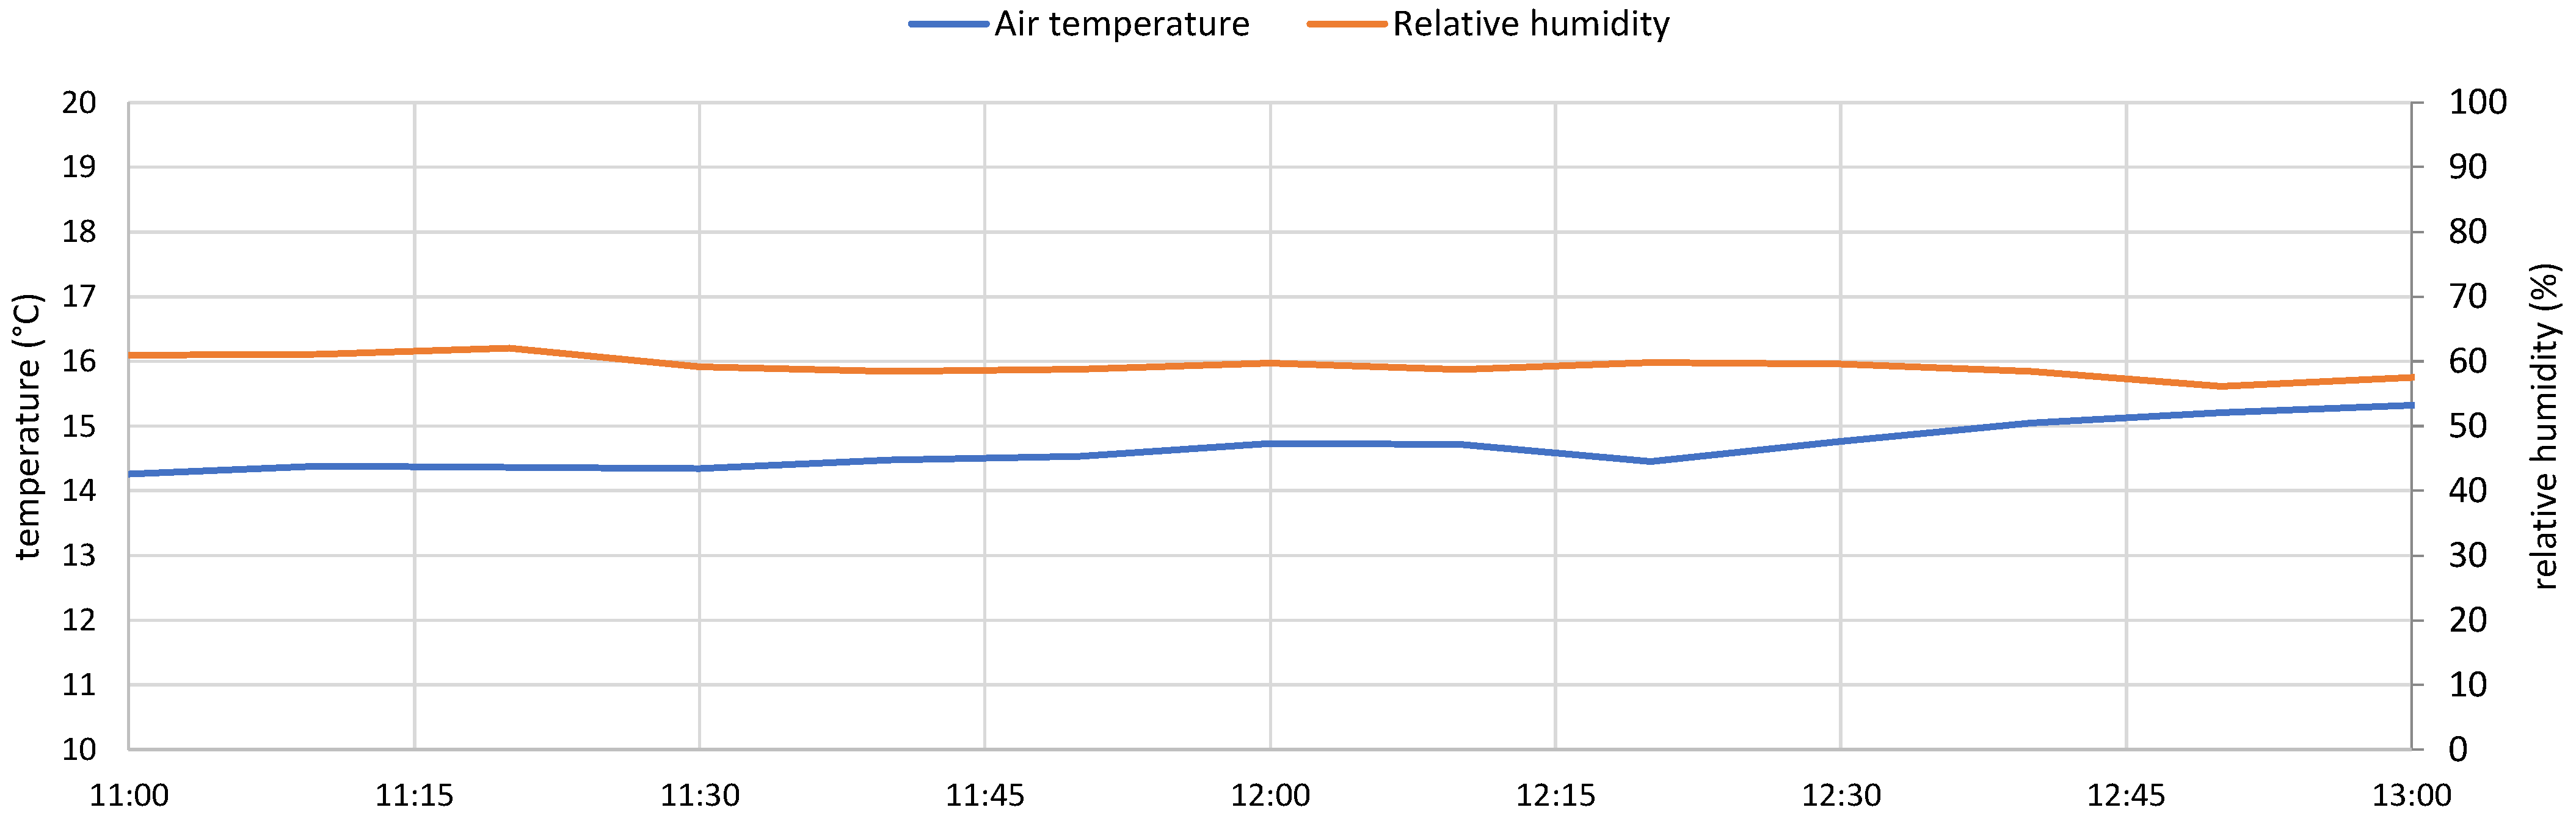
- To analyze the relationship between these flows and the site’s climatic conditions, with particular attention to solar radiation.
- To gather data useful for the future optimization of the system’s operation.
- To obtain data for the subsequent calibration of system simulation models.
- Experimental activities were carried out by continuously monitoring the most significant parameters during the various operational phases of the hydrogen production system.
- On-grid configuration;
- selective stand-alone configuration.
5. Results
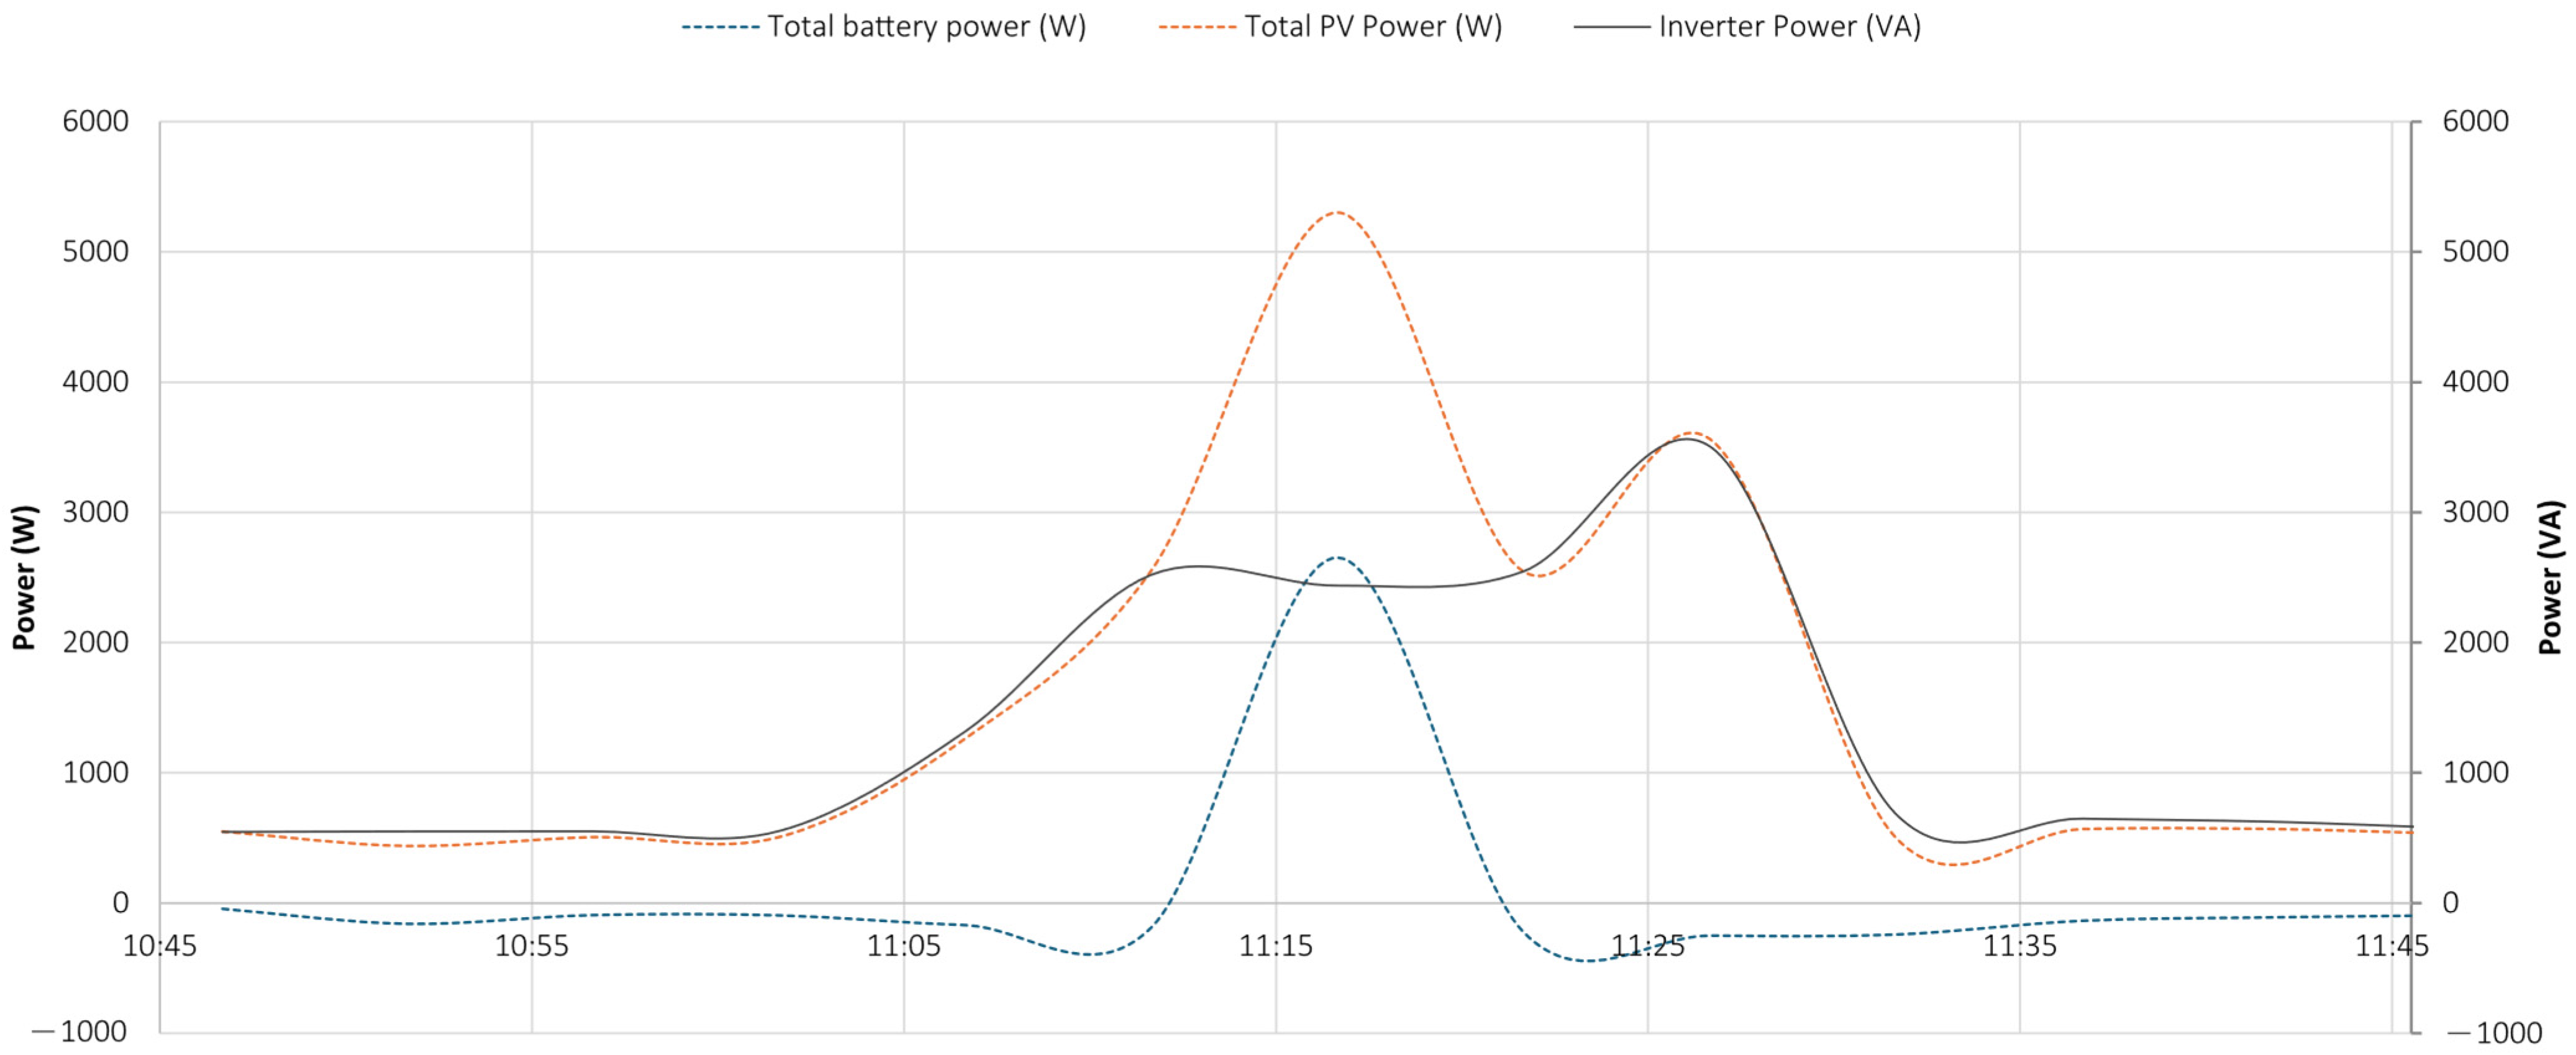
5.1. Test 1
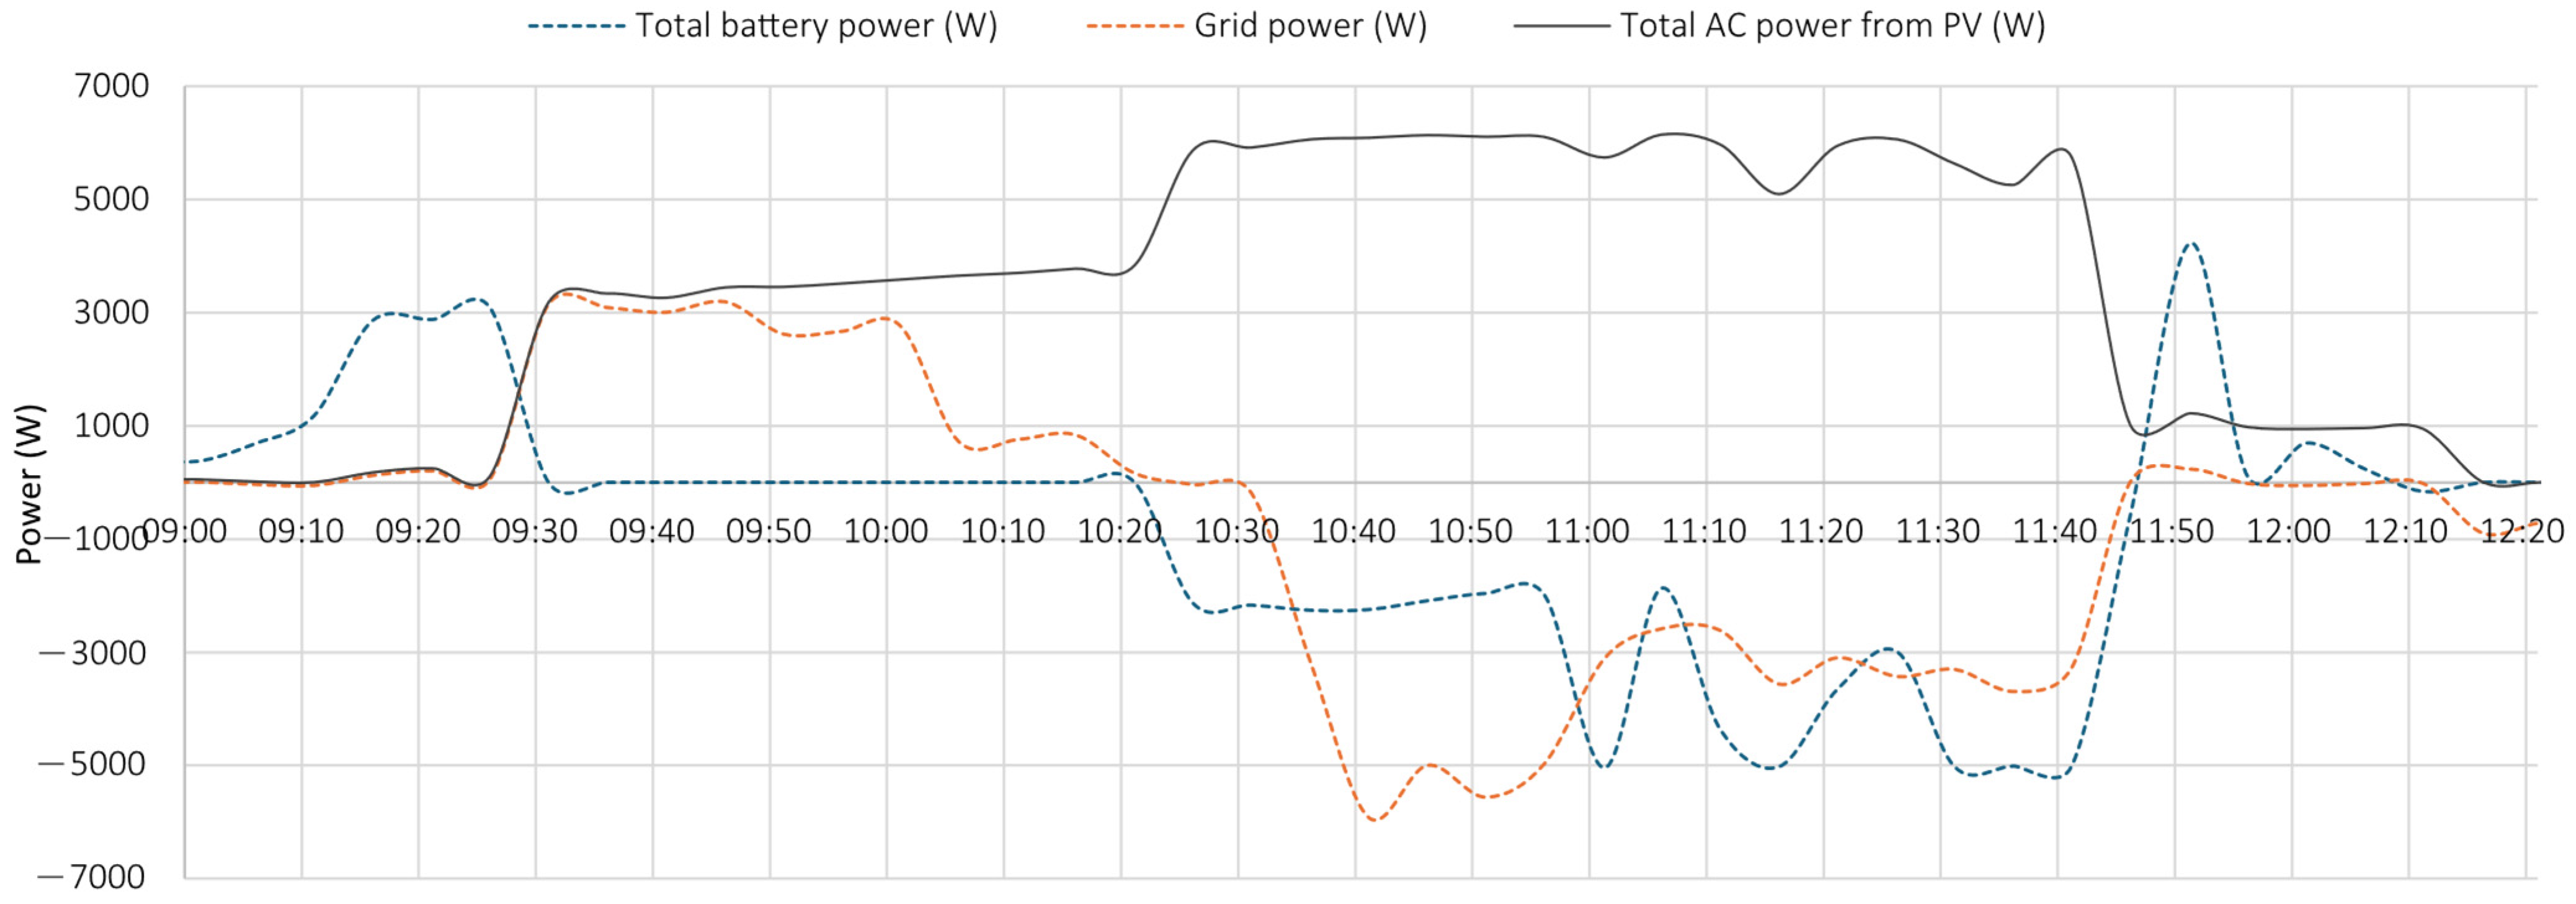
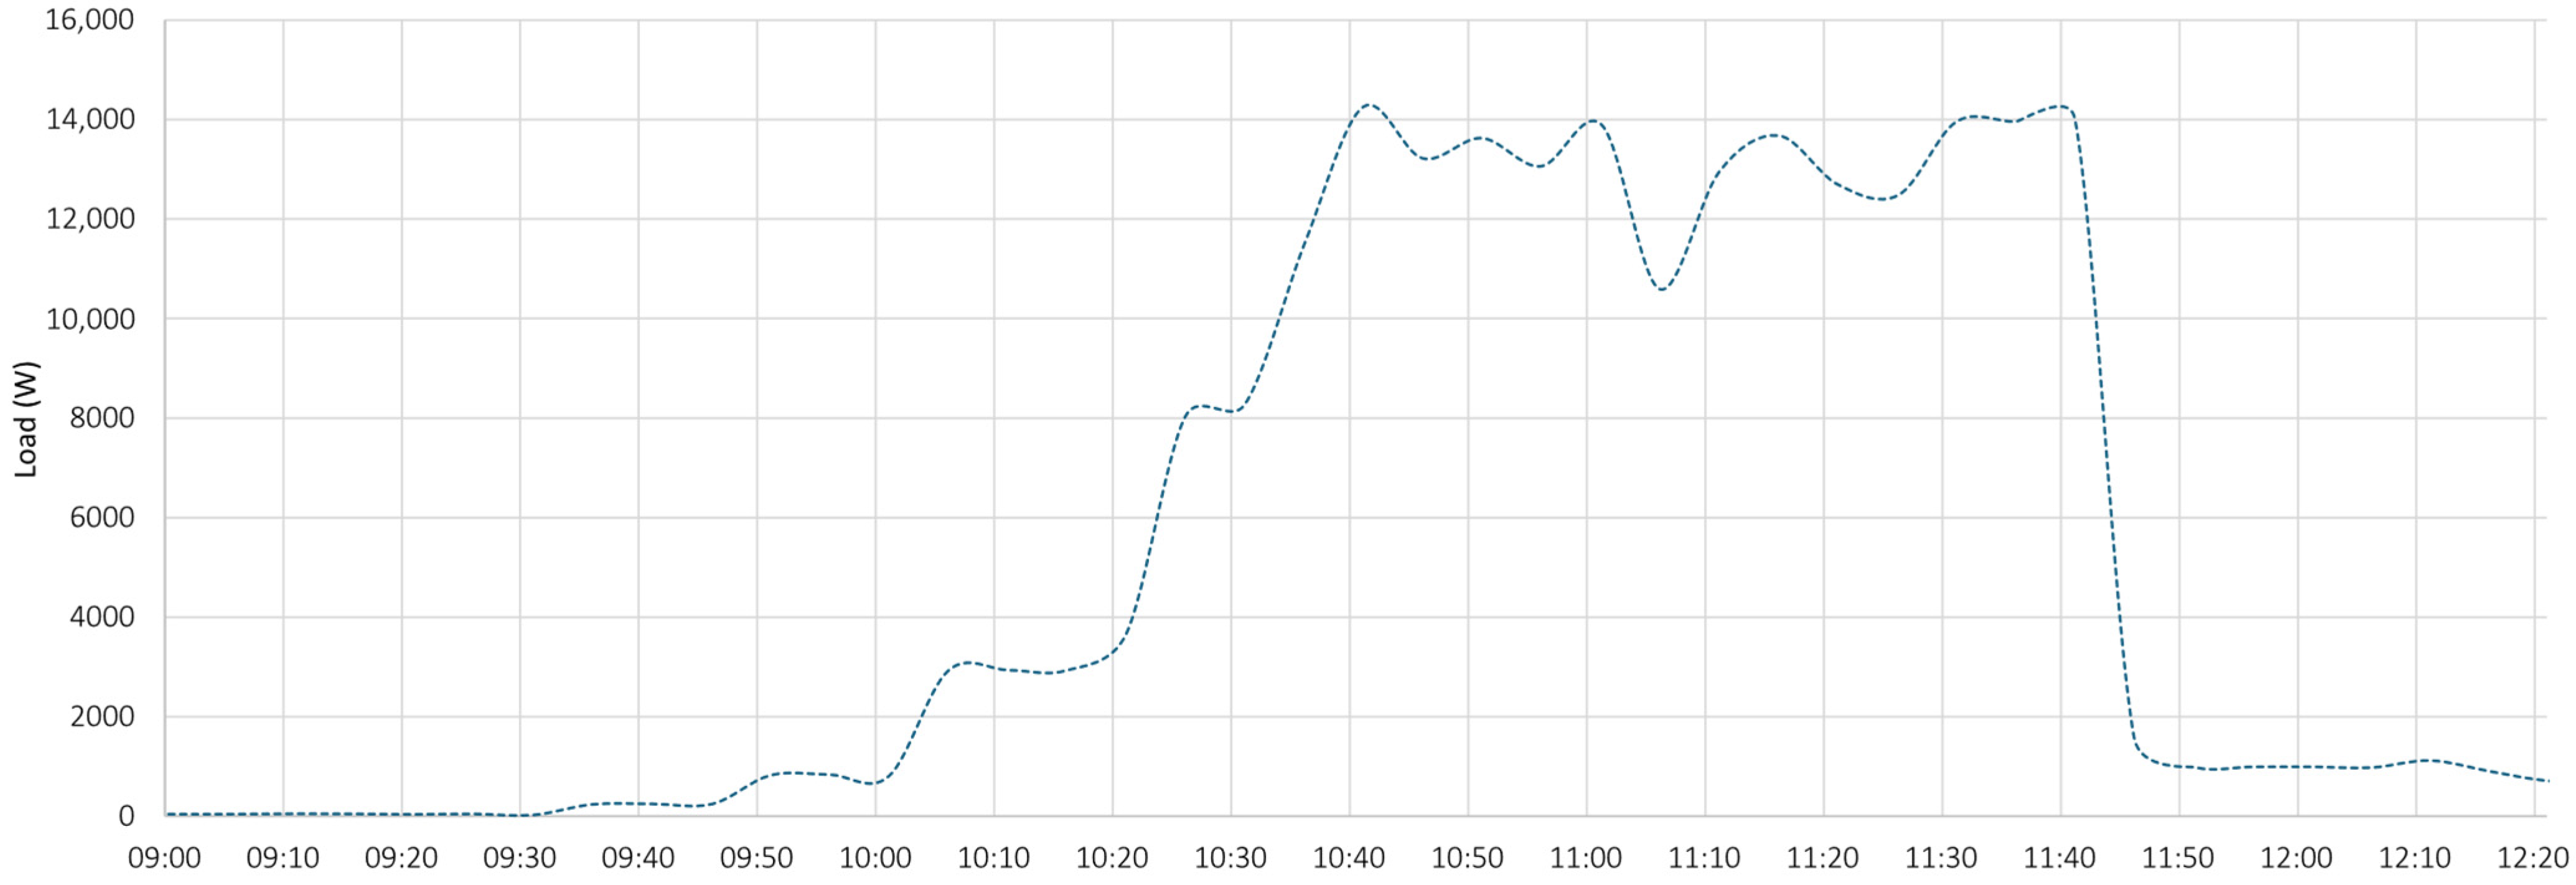
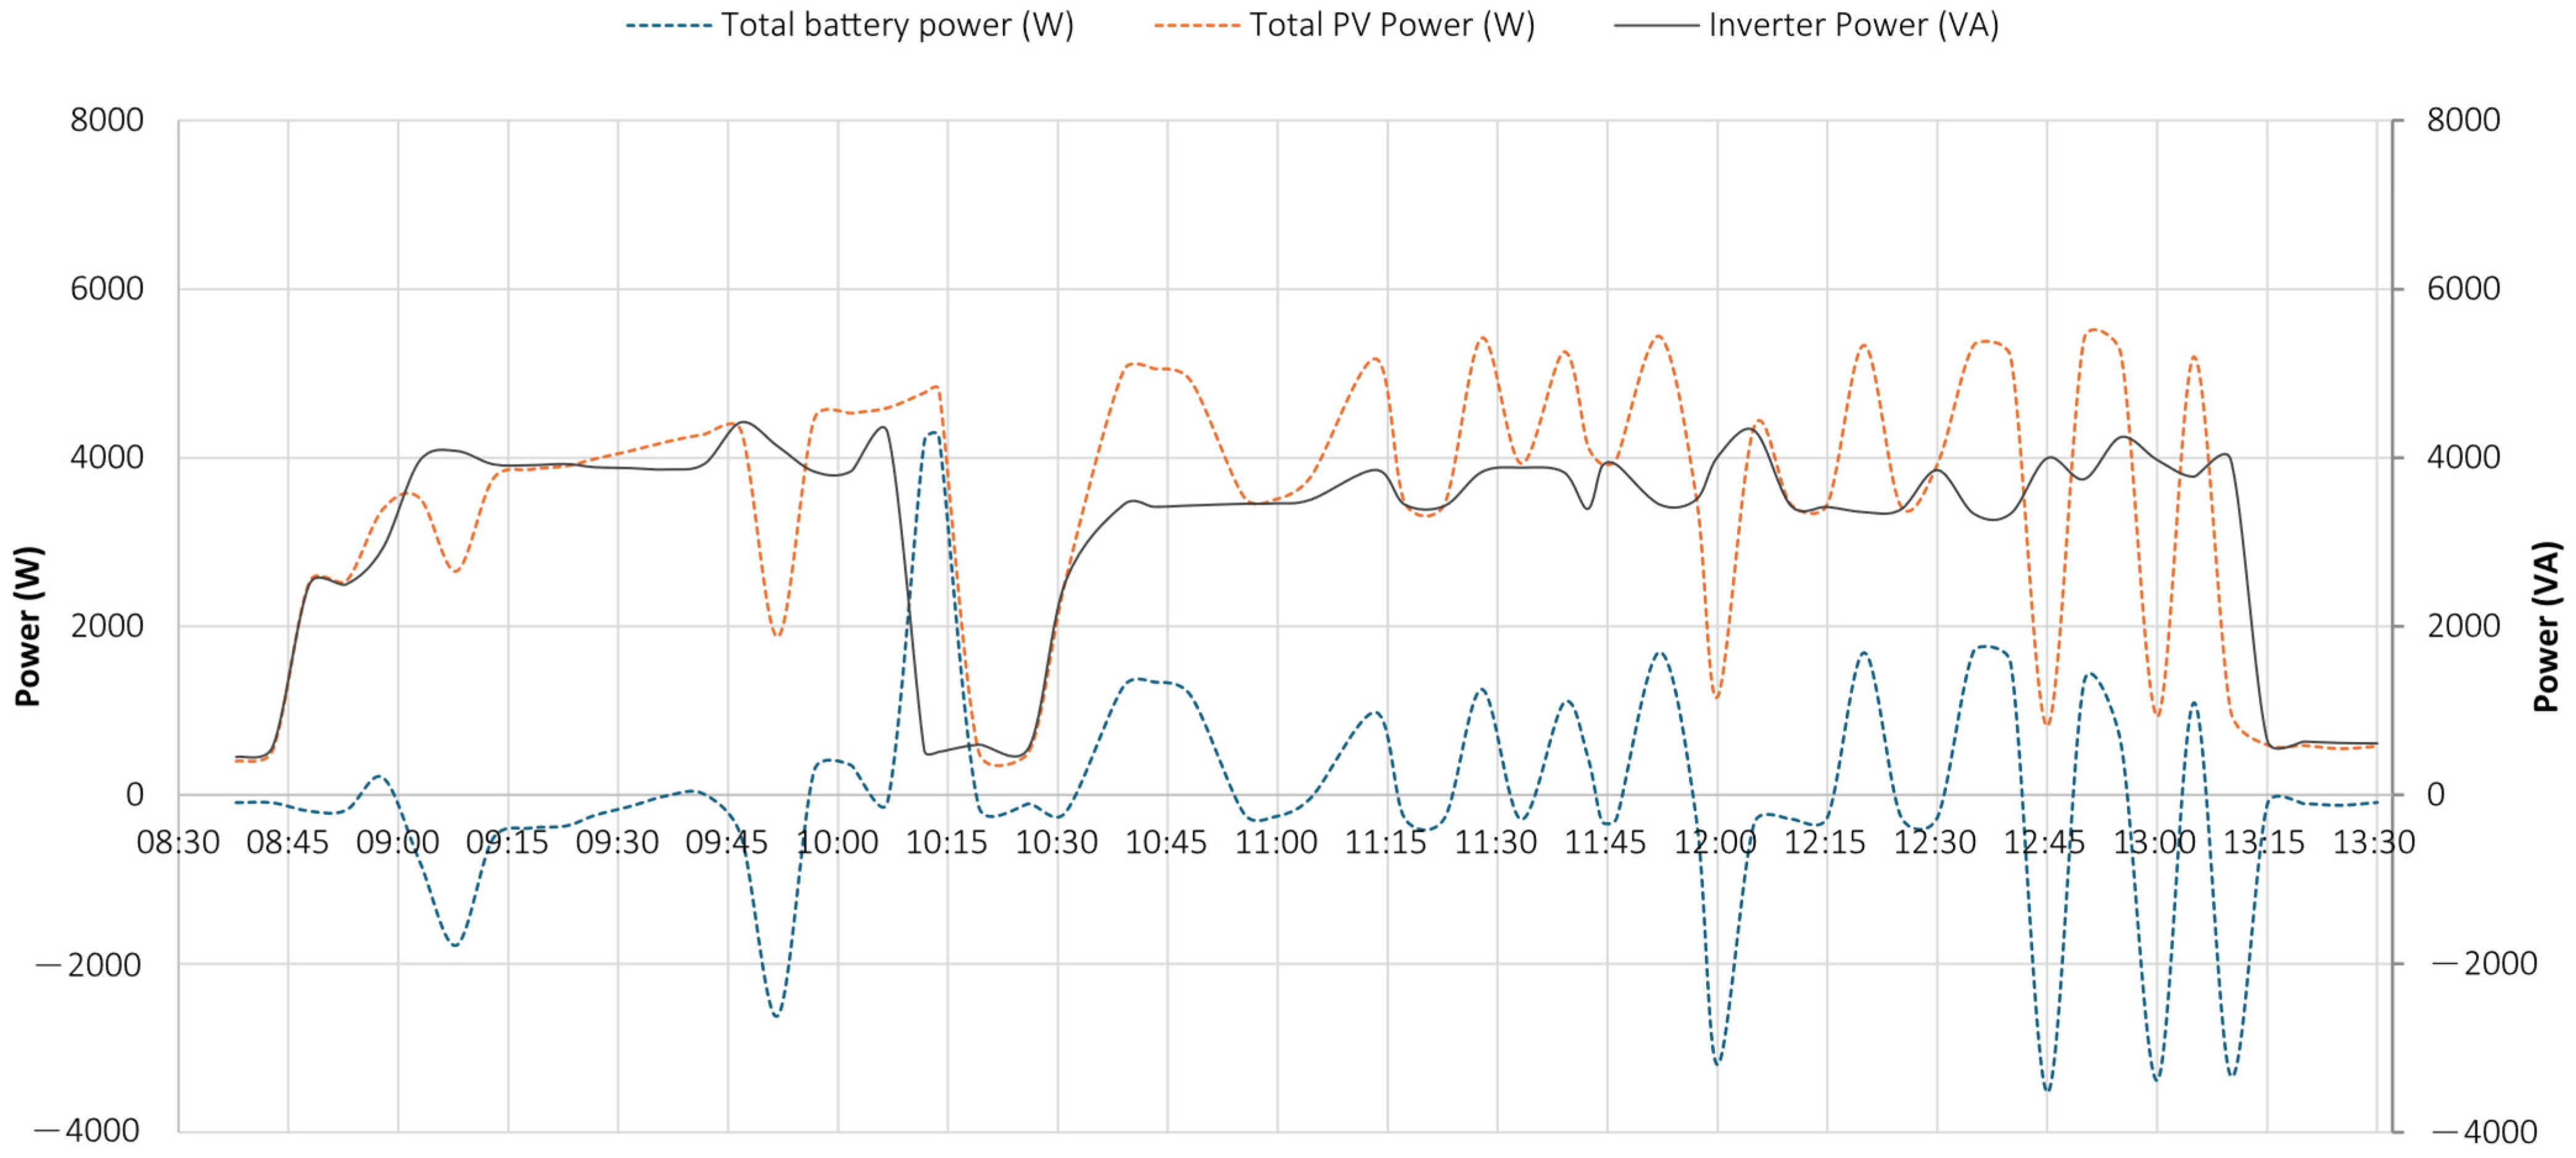
- the PV system operated near its peak output, delivering power to the load;
- the battery supplied additional power, as indicated by the negative values of the dashed blue curve, representing battery discharge;
- the grid also provided power, as demonstrated by the negative portion of the orange curve, particularly during the initial phase.
5.2. Test 2
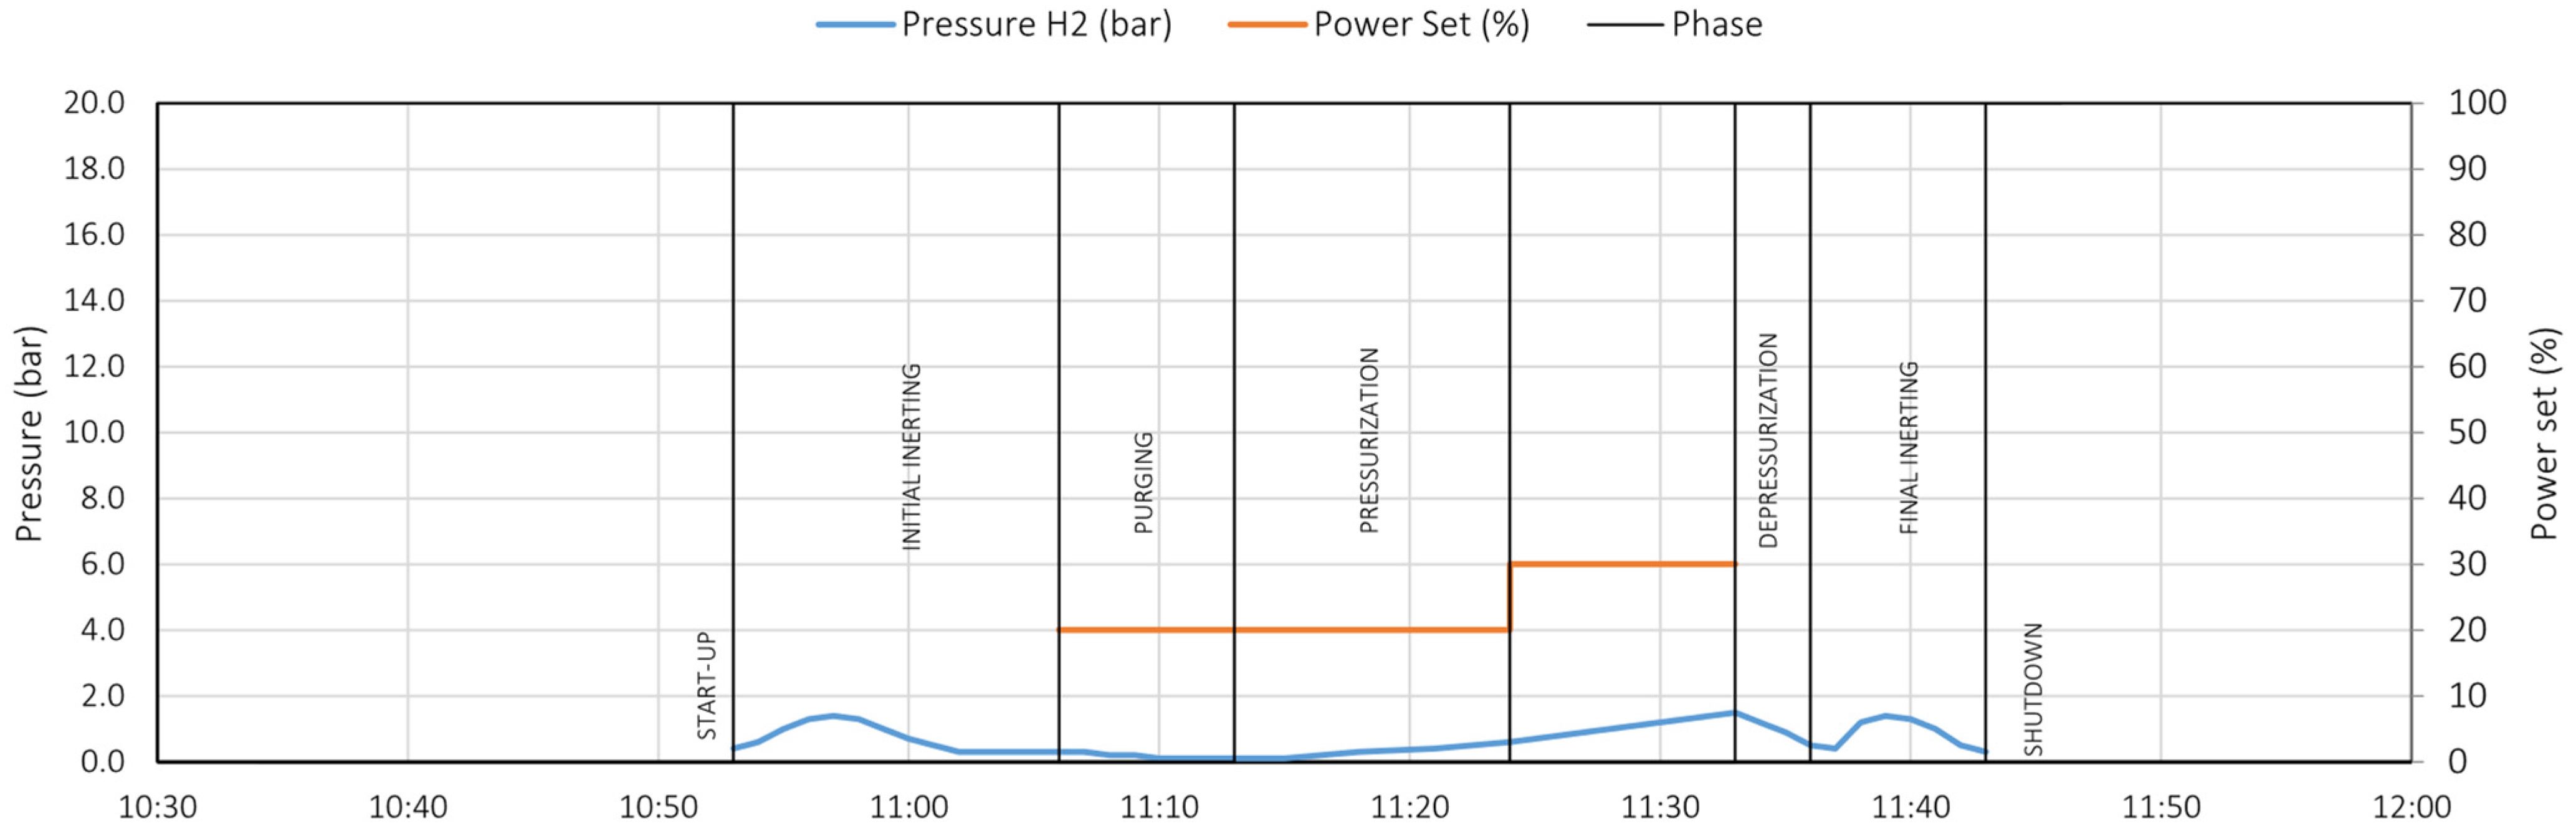
5.3. Test 3
5.4. Test 4
6. Discussion
6.1. Initial Inerting Phase
6.2. Pre-Start Phase
6.3. Purging Phase
6.4. Pressurization Phase
6.5. Depressurization Phase
6.6. Final Inerting Phase
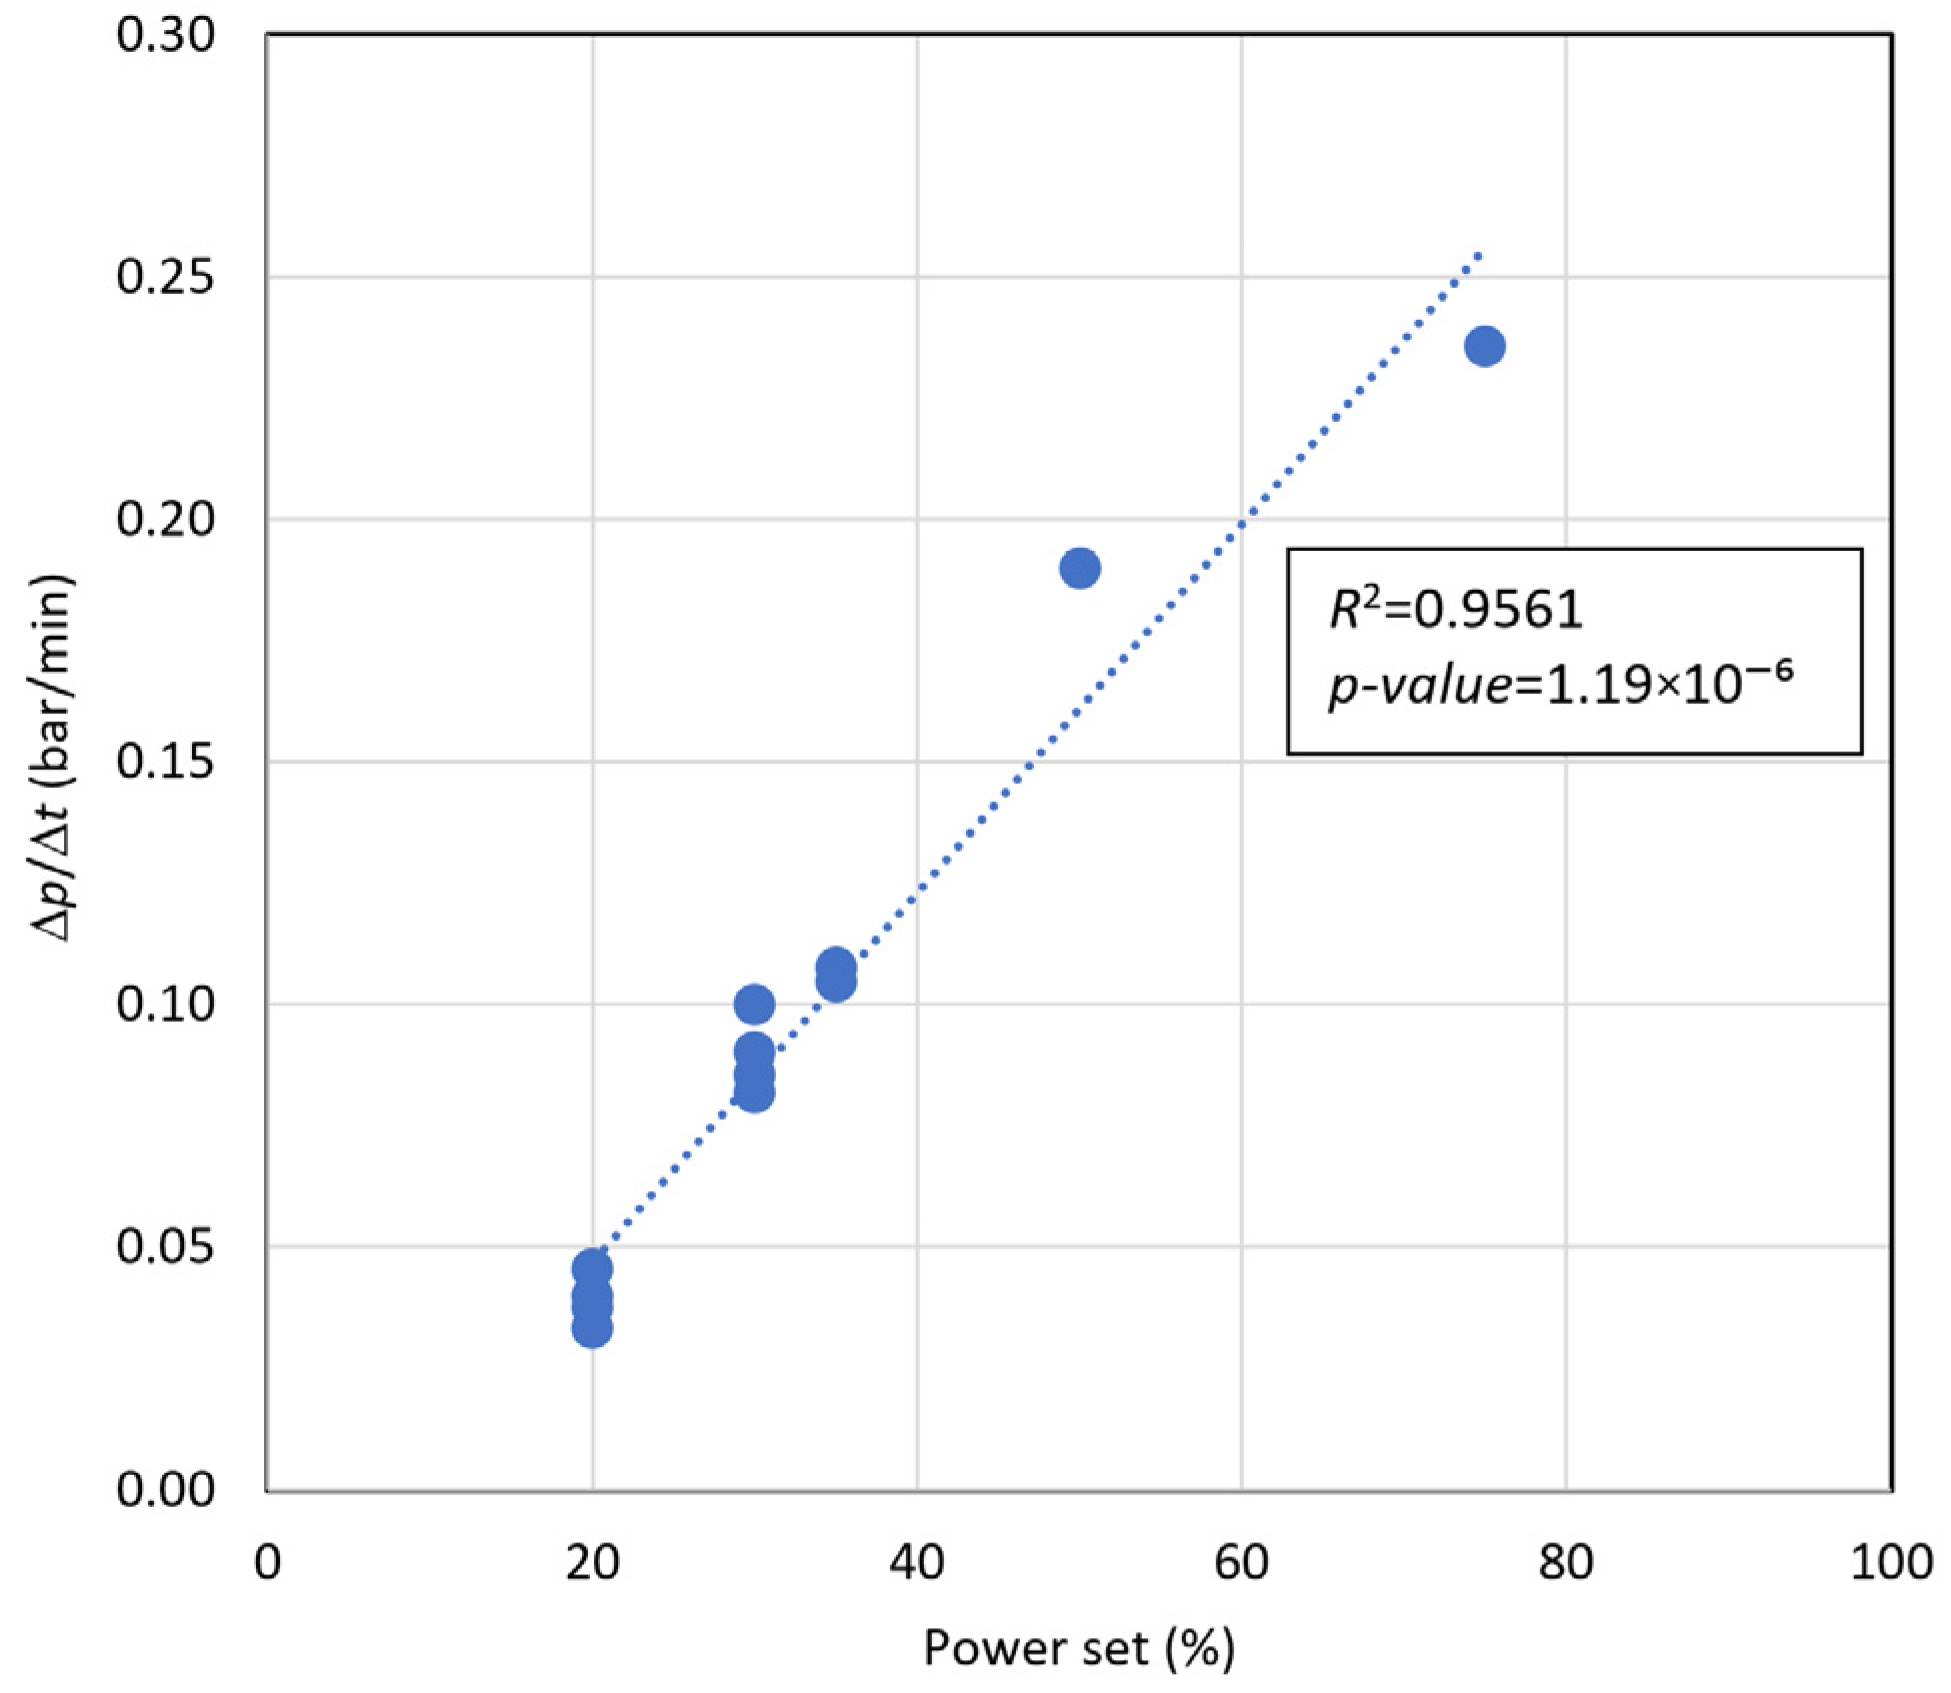
6.7. Correlations Between Data
- γ = Δp/Δt (bar/min) is the pressure variation over time;
- PS (%) is the power set.
7. Conclusions
- a phase-by-phase logic complying with the real system operation (e.g., purging, pressurization, depressurization);
- empirical correlations derived from experimental measurements;
- calibration and validation through dedicated test campaigns under different operational modes (on-grid and stand-alone).
Author Contributions
Funding
Data Availability Statement
Conflicts of Interest
Abbreviations
| A-BSS | Auxiliary battery storage system |
| AWE | Alkaline water electrolyser |
| BSS | Battery storage system |
| DR | Drying unit |
| EM | Electrolyser |
| FC | Fuel cell |
| HB | Hydrogen storage tank |
| HC | Condenser |
| HD | Hydrogen buffer tank |
| HDO | Catalytic deoxidation reactor |
| HE | Hydrogen heat exchanger |
| HF | Separation filter |
| HI | Hybrid inverter |
| HO | Oxygen collection tank |
| HS | Hydrogen gas–liquid separator |
| HV | Hydrogen collection tank |
| HW | Hydrogen bubbler |
| MPPT | Maximum Power Point Tracker |
| OE | Oxygen heat exchanger |
| OS | Oxygen gas–liquid separator |
| OW | Oxygen bubbler |
| PEM | Polymer electrolyte membrane |
| PLC | Programmable logic controller |
| PV | Photovoltaic array |
| PV1; PV2 | String 1 and 2 of the photovoltaic array |
| RES | Renewable energy sources |
| SOE | Solid oxide electrolyser |
| WT | Makeup water tank |
| WU | Demineralizer |
References
- Li, Y.; Liu, F.; Chen, K.; Liu, Y. Technical and Economic Analysis of a Hybrid PV/Wind Energy System for Hydrogen Refueling Stations. Energy 2024, 303, 131899. [Google Scholar] [CrossRef]
- Marino, C.; Nucara, A.; Pietrafesa, M.; Pudano, A. An Energy Self-Sufficient Public Building Using Integrated Renewable Sources and Hydrogen Storage. Energy 2013, 57, 95–105. [Google Scholar] [CrossRef]
- Maggio, G.; Nicita, A.; Squadrito, G. How the Hydrogen Production from RES Could Change Energy and Fuel Markets: A Review of Recent Literature. Int. J. Hydrogen Energy 2019, 44, 11371–11384. [Google Scholar] [CrossRef]
- Europian Union Regulation (EU). 2021/1119 of the European Parliament and of the Council of 30 June 2021 Establishing the Framework for Achieving Climate Neutrality and Amending Regulations (EC) No 401/2009 and (EU) 2018/1999 (“European Climate Law”). Off. J. Eur. Union L 2021, 243, 1–17. [Google Scholar]
- Guo, H.; Zhang, C.; Wang, J.; Wu, Z.; Wang, T.; Wang, P.; Qian, Y.; Zhang, G.; Yu, F. Design and Operation Schedule of RES Hydrogen Production System with Downstream Constraints. Int. J. Hydrogen Energy 2025, 102, 68–79. [Google Scholar] [CrossRef]
- Arsad, A.Z.; Hannan, M.A.; Al-Shetwi, A.Q.; Begum, R.A.; Hossain, M.J.; Ker, P.J.; Mahlia, T.I. Hydrogen Electrolyser Technologies and Their Modelling for Sustainable Energy Production: A Comprehensive Review and Suggestions. Int. J. Hydrogen Energy 2023, 48, 27841–27871. [Google Scholar] [CrossRef]
- Lazaroiu, G.; Gmal Osman, M.; Strejoiu, C.-V. Performance Evaluation of Renewable Energy Systems: Photovoltaic, Wind Turbine, Battery Bank, and Hydrogen Storage. Batteries 2023, 9, 468. [Google Scholar] [CrossRef]
- Kang, Z.; Liu, S. Research on Capacity Optimization Configuration of Renewable Energy Off Grid Hydrogen Production System Considering Collaborative Electrolysis. Energies 2024, 17, 1962. [Google Scholar] [CrossRef]
- Arunachalam, M.; Han, D.S. Efficient Solar-Powered PEM Electrolysis for Sustainable Hydrogen Production: An Integrated Approach. Emergent Mater. 2024, 7, 1401–1415. [Google Scholar] [CrossRef]
- HassanzadehFard, H.; Tooryan, F.; Collins, E.R.; Jin, S.; Ramezani, B. Design and Optimum Energy Management of a Hybrid Renewable Energy System Based on Efficient Various Hydrogen Production. Int. J. Hydrogen Energy 2020, 45, 30113–30128. [Google Scholar] [CrossRef]
- Bryan, J.; Meek, A.; Dana, S.; Islam Sakir, M.S.; Wang, H. Modeling and Design Optimization of Carbon-Free Hybrid Energy Systems with Thermal and Hydrogen Storage. Int. J. Hydrogen Energy 2023, 48, 39097–39111. [Google Scholar] [CrossRef]
- Gökçek, M.; Paltrinieri, N.; Liu, Y.; Badia, E.; Dokuz, A.Ş.; Erdoğmuş, A.; Urhan, B.B.; Yoldaş, Ö. Optimum Sizing of Hybrid Renewable Power Systems for On-Site Hydrogen Refuelling Stations: Case Studies from Türkiye and Spain. Int. J. Hydrogen Energy 2024, 59, 715–729. [Google Scholar] [CrossRef]
- Marino, C.; Nucara, A.; Panzera, M.F.; Pietrafesa, M.; Varano, V. Energetic and Economic Analysis of a Stand Alone Photovoltaic System with Hydrogen Storage. Renew. Energy 2019, 142, 316–329. [Google Scholar] [CrossRef]
- Hou, J.; Yang, M. (Eds.) Green Hydrogen Production by Water Electrolysis; CRC Press: Boca Raton, FL, USA, 2024; ISBN 9781040047569. [Google Scholar]
- da Rosa, A.V.; Ordóñez, J.C. (Eds.) Chapter 11—Hydrogen Storage. In Fundamentals of Renewable Energy Processes, 4th ed.; Academic Press: Oxford, UK, 2022; pp. 471–516. ISBN 978-0-12-816036-7. [Google Scholar]
- Carmo, M.; Stolten, D. Chapter 4—Energy Storage Using Hydrogen Produced From Excess Renewable Electricity: Power to Hydrogen. In Science and Engineering of Hydrogen-Based Energy Technologies; de Miranda, P.E.V., Ed.; Academic Press: Cambridge, MA, USA, 2019; pp. 165–199. ISBN 978-0-12-814251-6. [Google Scholar]
- Cirrincione, L.; Marino, C.; Nucara, A.; Panzera, M.F.; Pietrafesa, M.; Scaccianoce, G. Effect of the Accumulation Capacity on the Energy Performance of a Green Hydrogen Production Plant. In Proceedings of the 24th EEEIC International Conference on Environment and Electrical Engineering and 8th I and CPS Industrial and Commercial Power Systems Europe, EEEIC/I and CPS Europe 2024, Rome, Italy, 17–20 June 2024; pp. 1–6. [Google Scholar] [CrossRef]
- Coralli, A.; Sarruf, B.J.M.; de Miranda, P.E.V.; Osmieri, L.; Specchia, S.; Minh, N.Q. Chapter 2—Fuel Cells. In Science and Engineering of Hydrogen-Based Energy Technologies; de Miranda, P.E.V., Ed.; Academic Press: Cambridge, MA, USA, 2019; pp. 39–122. ISBN 978-0-12-814251-6. [Google Scholar]
- da Rosa, A.V.; Ordóñez, J.C. (Eds.) Chapter 9—Fuel Cells. In Fundamentals of Renewable Energy Processes, 4th ed.; Academic Press: Oxford, UK, 2022; pp. 317–417. ISBN 978-0-12-816036-7. [Google Scholar]
- Ríos, C.; Molina, P.; Martínez de León, C.; Brey, J.J. Simulation of the Optimal Plant Size to Produce Renewable Hydrogen Based on the Available Electricity. Int. J. Hydrogen Energy 2024, 52, 1325–1337. [Google Scholar] [CrossRef]
- Armijo, J.; Philibert, C. Flexible Production of Green Hydrogen and Ammonia from Variable Solar and Wind Energy: Case Study of Chile and Argentina. Int. J. Hydrogen Energy 2020, 45, 1541–1558. [Google Scholar] [CrossRef]
- Hussam, W.K.; Barhoumi, E.M.; Abdul-Niby, M.; Sheard, G.J. Techno-Economic Analysis and Optimization of Hydrogen Production from Renewable Hybrid Energy Systems: Shagaya Renewable Power Plant-Kuwait. Int. J. Hydrogen Energy 2024, 58, 56–68. [Google Scholar] [CrossRef]
- Dinh, V.N.; Leahy, P.; McKeogh, E.; Murphy, J.; Cummins, V. Development of a Viability Assessment Model for Hydrogen Production from Dedicated Offshore Wind Farms. Int. J. Hydrogen Energy 2021, 46, 24620–24631. [Google Scholar] [CrossRef]
- Carbone, R.; Marino, C.; Nucara, A.; Panzera, M.F.; Pietrafesa, M. Electric Load Influence on Performances of a Composite Plant for Hydrogen Production from RES and Its Conversion in Electricity. Sustainability 2019, 11, 6362. [Google Scholar] [CrossRef]
- Zou, P.; Lin, H.; Zhou, X.; Zou, Y.; Li, Y.; Yan, G.; Duan, X.; Cai, J. Control Strategies for Multi-Electrolyzer Alkaline Hydrogen Generation Systems Improving Renewable Energy Utilization and Electrolyzer Lifespan. Renew. Energy 2025, 253, 123628. [Google Scholar] [CrossRef]
- Jinyong, X.; Yi, Z.; Mengru, X.; Minghui, Z. Optimal Configuration Method of Hydrogen Energy System for Coordinated Operation of Multi-Type Electrolyzers for New Energy Consumption. Int. J. Hydrogen Energy 2025, 113, 564–574. [Google Scholar] [CrossRef]
- Bai, Z.; Hao, W.; Li, Q.; Yan, R.; Ding, B.; Shao, W.; Gao, L.; Jiang, T.; Wang, Y.; Wen, C. Enhancing Flexibility in Wind-Powered Hydrogen Production Systems through Coordinated Electrolyzer Operation. Adv. Appl. Energy, 2025, in press. [CrossRef]
- Raceanu, M.; Bizon, N.; Marinoiu, A.; Varlam, M. Design and Experimental Investigations of an Energy Storage System in Microgrids. In Microgrid Architectures, Control and Protection Methods; Tabatabaei, N.M., Kabalci, E., Bizon, N., Eds.; Springer International Publishing: Cham, Switzerland, 2020; pp. 207–232. ISBN 978-3-030-23723-3. [Google Scholar]
- Wagner, E.; Delp, E.; Mishra, R. Energy Storage with Highly-Efficient Electrolysis and Fuel Cells: Experimental Evaluation of Bifunctional Catalyst Structures. Top. Catal. 2023, 66, 546–559. [Google Scholar] [CrossRef]
- Patel, H.V.; Gorji, S.A.; Shahi, S.S.M.; Love, J.G. Implementation of a Lab-Scale Green Hydrogen Production System with Solar PV Emulator and Energy Storage System. In Proceedings of the 2021 11th International Conference on Power and Energy Systems, ICPES 2021, Shanghai, China, 18–20 December 2021; Institute of Electrical and Electronics Engineers Inc.: Piscataway, NJ, USA, 2021; pp. 201–208. [Google Scholar]
- Folgado, F.J.; Orellana, D.; González, I.; Calderón, A.J. Processes Supervision System for Green Hydrogen Production: Experimental Characterization and Data Acquisition of PEM Electrolyzer. Eng. Proc. 2022, 19, 36. [Google Scholar] [CrossRef]
- Raimondi, G.; Spazzafumo, G. Integrating Renewable Energy Communities and Italian UVAM Project through Renewable Hydrogen Chain. e-Prime-Adv. Electr. Eng. Electron. Energy 2024, 10, 100819. [Google Scholar] [CrossRef]
- Bagheri, B.; Kumagai, H.; Hashimoto, M.; Sugiyama, M. Techno-Economic Assessment of Green Hydrogen Production in Australia Using Off-Grid Hybrid Resources of Solar and Wind. Energies 2025, 18, 3285. [Google Scholar] [CrossRef]
- Westman, J.; Hadidi, R. Overload Mitigation for Grid-Forming Inverters in Islanded Microgrids with Synchronous Generators. Electr. Power Syst. Res. 2025, 239, 111231. [Google Scholar] [CrossRef]
- Serban, I. A Control Strategy for Microgrids: Seamless Transfer Based on a Leading Inverter with Supercapacitor Energy Storage System. Appl. Energy 2018, 221, 490–507. [Google Scholar] [CrossRef]
- AbdelAty, A.M.; Al-Durra, A.; Zeineldin, H.; El-Saadany, E.F. Improving Small-Signal Stability of Inverter-Based Microgrids Using Fractional-Order Control. Int. J. Electr. Power Energy Syst. 2024, 156, 109746. [Google Scholar] [CrossRef]
- Yorino, N.; Sekizaki, S.; Adachi, K.; Sasaki, Y.; Zoka, Y.; Bedawy, A.; Shimizu, T.; Amimoto, K. A Novel Design of Single-Phase Microgrid Based on Non-Interference Core Synchronous Inverters for Power System Stabilization. IET Gener. Transm. Distrib. 2023, 17, 2861–2875. [Google Scholar] [CrossRef]


| Mode | Power Supply | PV System | Battery | Grid |
|---|---|---|---|---|
| On grid | PV + Battery + Grid |
|
|
|
| Stand-alone | PV + Battery |
|
| not connected |
| Selective stand-alone | PV → Electrolyser Grid → Auxiliaries |
|
| delivers power to all the auxiliary devices |
| Test | System Configuration | Objective/Focus |
|---|---|---|
| 1 | On-grid | To verify system performance under high input power conditions. |
| 3 | Selective stand-alone | To analyze the effect of the increase in power level feeding the electrolyser |
| 4 | Selective stand-alone | To evaluate the system’s maximum continuous operating power when powered by the PV field |
| 5 | Selective stand-alone | To gather information on the duration of the initial and final inerting phases, purging, and depressurization |
| Phase | Start | End | Power Set (%) | |
|---|---|---|---|---|
| INERTIZATION | Stage 1 | 9:53 | 9:57 | |
| Stage 2 | 9:57 | 10:04 | ||
| STANDBY | 10:04 | 10:06 | ||
| PRE-START | 10:06 | 10:07 | 20 | |
| PURGING | 10:07 | 10:14 | 20 | |
| PRESSURIZATION | 10:14 | 10:22 | 20 | |
| 10:22 | 10:32 | 50 | ||
| 10:32 | 11:14 | 75 | ||
| PRODUCTION | 11:14 | 11:45 | 75 | |
| DEPRESSURIZATION | 11:45 | 11:59 | ||
| INERTIZATION | Stage 1 | 11:59 | 12:03 | |
| Stage 2 | 12:03 | 12:08 |
| Phase | Initial Pressure (bar) | Final Pressure (bar) | Duration (min) | Dp/Dt (bar/min) | |
|---|---|---|---|---|---|
| INERTIZATION | Stage 1 | 0.3 | 1.4 | 4 | 1.1 |
| Stage 2 | 1.4 | 0.3 | 7 | −1.1 | |
| STANDBY | 0.3 | 0.3 | 2 | 0.0 | |
| PRE-START | 0.3 | 0.3 | 1 | 0.0 | |
| PURGING | 0.3 | 0.1 | 7 | −0.2 | |
| PRESSURIZATION | 0.3 | 0.6 | 8 | 0.3 | |
| 0.6 | 2.5 | 10 | 1.9 | ||
| 2.5 | 12.4 | 42 | 9.9 | ||
| PRODUCTION | 12.4 | 16.7 | 31 | 4.3 | |
| DEPRESSURIZATION | 16.7 | 0.3 | 14 | −16.4 | |
| INERTIZATION | Stage 1 | 0.3 | 1.4 | 4 | 1.1 |
| Stage 2 | 1.4 | 0.3 | 5 | −1.1 |
| Phase | Start | End | Power Set (%) | |
|---|---|---|---|---|
| INERTIZATION | Stage 1 | 11:27 | 11:29 | |
| Stage 2 | 11:36 | 11:38 | ||
| STANDBY | 11:36 | 11:38 | ||
| PRE-START | 11:38 | 11:39 | 20 | |
| PURGING | 11:39 | 11:46 | 20 | |
| PRESSURIZATION | 11:46 | 11:51 | 20 | |
| 11:51 | 12:22 | 30 | ||
| 12:22 | 12:35 | 35 | ||
| DEPRESSURIZATION | 12:35 | 12:43 | ||
| INERTIZATION | Stage 1 | 12:43 | 12:47 | |
| Stage 2 | 12:47 | 12:52 |
| Phase | Initial Pressure (bar) | Final Pressure (bar) | Duration (min) | Dp/Dt (bar/min) | |
|---|---|---|---|---|---|
| INERTIZATION | Stage 1 | 0.7 | 1.4 | 2 | 0.7 |
| Stage 2 | 1.4 | 0.3 | 2 | −1.1 | |
| STANDBY | 0.3 | 0.3 | 2 | 0.0 | |
| PRE-START | 0.3 | 0.3 | 1 | 0.0 | |
| PURGING | 0.3 | 0.1 | 7 | −0.2 | |
| PRESSURIZATION | 0.1 | 0.5 | 5 | 0.4 | |
| 0.5 | 3.3 | 31 | 2.8 | ||
| 3.3 | 4.7 | 13 | 1.4 | ||
| DEPRESSURIZATION | 4.6 | 0.6 | 8 | −4.0 | |
| INERTIZATION | Stage 1 | 0.6 | 1.4 | 4 | 0.8 |
| Stage 2 | 1.4 | 0.3 | 5 | −1.1 |
| Phase | Start | End | Power Set (%) | |
|---|---|---|---|---|
| INERTIZATION | Stage 1 | 8:38 | 8:40 | |
| Stage 2 | 8:40 | 8:43 | ||
| STANDBY | 8:43 | 8:45 | ||
| PRE-START | 8:45 | 8:46 | 20 | |
| PURGING | 8:46 | 8:53 | 20 | |
| PRESSURIZATION | 8:53 | 8:56 | 20 | |
| 8:56 | 8:58 | 25 | ||
| 8:58 | 9:00 | 30 | ||
| 9:00 | 10:03 | 35 | ||
| DEPRESSURIZATION | 10:03 | 10:19 | ||
| INERTIZATION | Stage 1 | 10:19 | 10:22 | |
| Stage 2 | 10:22 | 10:27 | ||
| STANDBY | 10:27 | 10:28 | ||
| PRE-START | 10:28 | 10:29 | ||
| PURGING | 10:29 | 10:36 | ||
| PRESSURIZATION | 10:36 | 10:37 | 20 | |
| 10:37 | 13:03 | 30 | ||
| PRODUCTION | 13:03 | 13:10 | 30 | |
| DEPRESSURIZATION | 13:10 | 13:25 | ||
| INERTIZATION | Stage 1 | 13:25 | 13:29 | |
| Stage 2 | 13:29 | 13:33 |
| Phase | Initial Pressure (bar) | Final Pressure (bar) | Duration (min) | Dp/Dt (bar/min) | |
|---|---|---|---|---|---|
| INERTIZATION | Stage 1 | 0.3 | 0.6 | 2 | 0.3 |
| Stage 2 | 0.6 | 0.3 | 3 | −0.3 | |
| STANDBY | 0.3 | 0.3 | 2 | 0.0 | |
| PRE-START | 0.3 | 0.3 | 1 | 0.0 | |
| PURGING | 0.3 | 0.1 | 6 | −0.2 | |
| PRESSURIZATION | 0.1 | 0.2 | 3 | 0.1 | |
| 0.2 | 0.4 | 2 | 0.2 | ||
| 0.4 | 0.6 | 2 | 0.2 | ||
| DEPRESSURIZATION | 0.6 | 7.2 | 63 | 6.6 | |
| INERTIZATION | Stage 1 | 7.2 | 0.3 | 16 | −6.9 |
| Stage 2 | 0.3 | 1.4 | 3 | 1.1 | |
| STANDBY | 1.4 | 0.3 | 5 | −1.1 | |
| PRE-START | 0.3 | 0.3 | 1 | 0.0 | |
| PURGING | 0.3 | 0.3 | 1 | 0.0 | |
| PRESSURIZATION | 0.3 | 0.1 | 7 | −0.2 | |
| 0.1 | 0.1 | 1 | 0.0 | ||
| PRODUCTION | 0.1 | 12.6 | 146 | 12.5 | |
| DEPRESSURIZATION | 12.6 | 13.1 | 7 | 0.5 | |
| INERTIZATION | Stage 1 | 13.1 | 0.3 | 15 | −12.8 |
| Stage 2 | 0.3 | 1.4 | 4 | 1.1 |
| Phase | Start | End | Power Set (%) | |
|---|---|---|---|---|
| INERTIZATION | Stage 1 | 10:53 | 10:55 | |
| Stage 2 | 10:57 | 11:02 | ||
| STANDBY | 11:02 | 11:06 | ||
| PRE-START | 11:06 | 11:07 | ||
| PURGING | 11:07 | 11:13 | 20 | |
| PRESSURIZATION | 11:13 | 11:24 | 20 | |
| 11:24 | 11:33 | 30 | ||
| DEPRESSURIZATION | 11:33 | 11:36 | ||
| INERTIZATION | Stage 1 | 11:36 | 11:39 | |
| Stage 2 | 11:39 | 11:43 |
| Phase | Initial Pressure (bar) | Final Pressure (bar) | Duration (min) | Dp/Dt (bar/min) | |
|---|---|---|---|---|---|
| INERTIZATION | Stage 1 | 0.4 | 1.4 | 4 | 1.0 |
| Stage 2 | 1.4 | 0.3 | 5 | −1.1 | |
| STANDBY | 0.3 | 0.3 | 4 | 0.0 | |
| PRE-START | 0.3 | 0.3 | 1 | 0.0 | |
| PURGING | 0.3 | 0.1 | 6 | −0.2 | |
| PRESSURIZATION | 0.1 | 0.6 | 11 | 0.5 | |
| 0.6 | 1.5 | 11 | 0.9 | ||
| DEPRESSURIZATION | 1.5 | 0.5 | 3 | −1.0 | |
| INERTIZATION | Stage 1 | 0.5 | 1.4 | 3 | 0.9 |
| Stage 2 | 1.4 | 0.3 | 4 | −1.1 |
| Test | Duration (min) | Initial Pressure pi (bar) | Final Pressure pf (bar) | Δp/Δt (bar/min) |
|---|---|---|---|---|
| Stage 1 | ||||
| 1 | 4 | 0.3 | 1.4 | 0.275 |
| 2 | 2 | 0.3 | 1.4 | 0.550 |
| 3a | 2 | 0.3 | 1.4 | 0.550 |
| 3b | 3 | 0.3 | 1.4 | 0.300 |
| 4 | 4 | 0.3 | 1.4 | 0.275 |
| average | 3.0 | 0.413 | ||
| Stage 2 | ||||
| 1 | 7 | 1.4 | 0.3 | −0.157 |
| 2 | 2 | 1.4 | 0.3 | −0.550 |
| 3a | 3 | 1.4 | 0.3 | −0.367 |
| 3b | 5 | 1.4 | 0.3 | −0.220 |
| 4 | 5 | 1.4 | 0.3 | −0.220 |
| average | 4.3 | −0.324 |
| Test | Duration (min) | Initial Pressure pi (bar) | Final Pressure pf (bar) | Δp/Δt (bar/min) |
|---|---|---|---|---|
| 1 | 7 | 0.3 | 0.1 | −0.029 |
| 2 | 7 | 0.3 | 0.1 | −0.029 |
| 3a | 7 | 0.3 | 0.1 | −0.029 |
| 3b | 7 | 0.3 | 0.1 | −0.029 |
| 4 | 6 | 0.3 | 0.1 | −0.033 |
| average | 6.5 | −0.031 |
| Test | Duration (min) | Initial Pressure pi (bar) | Final Pressure pf (bar) | Δp/Δt (bar/min) |
|---|---|---|---|---|
| Power set 20% | ||||
| 1 | 8 | 0.3 | 0.6 | 0.038 |
| 2 | 5 | 0.3 | 0.5 | 0.040 |
| 3a | 3 | 0.1 | 0.2 | 0.033 |
| 3b | 1 | 0.1 | 0.1 | 0.000 |
| 4 | 11 | 0.1 | 0.6 | 0.045 |
| Average | 5.6 | 0.031 | ||
| Power set 30% | ||||
| 2 | 31 | 0.5 | 3.3 | 0.090 |
| 3a | 2 | 0.4 | 0.6 | 0.100 |
| 3b | 146 | 0.1 | 12.6 | 0.086 |
| 4 | 11 | 0.6 | 1.5 | 0.082 |
| Average | 47.5 | 0.089 | ||
| Power set 35% | ||||
| 2 | 13 | 3.3 | 4.7 | 0.108 |
| 3a | 63 | 0.6 | 7.2 | 0.105 |
| Average | 41.2 | 0.101 | ||
| Power set 50% | ||||
| 1 | 10 | 0.6 | 2.5 | 0.190 |
| Power set 75% | ||||
| 1 | 42 | 2.5 | 12.4 | 0.236 |
| Test | Duration (min) | Initial Pressure pi (bar) | Final Pressure pf (bar) | Δp/Δt (bar/min) |
|---|---|---|---|---|
| 1 | 14 | 16.7 | 0.3 | −1.171 |
| 2 | 8 | 4.6 | 0.6 | −0.500 |
| 3a | 16 | 7.2 | 0.3 | −0.431 |
| 3b | 15 | 13.1 | 0.3 | −0.853 |
| 4 | 3 | 1.5 | 0.5 | −0.333 |
| average | 11.2 | −0.658 |
| Test | Duration (min) | Initial Pressure pi (bar) | Final Pressure pf (bar) | Δp/Δt (bar/min) |
|---|---|---|---|---|
| Stage 1 | ||||
| 1 | 4 | 0.3 | 1.4 | 0.275 |
| 2 | 4 | 0.3 | 1.4 | 0.275 |
| 3a | 3 | 0.3 | 1.4 | 0.367 |
| 3b | 4 | 0.3 | 1.4 | 0.275 |
| 4 | 3 | 0.5 | 1.4 | 0.300 |
| average | 3.6 | 0.298 | ||
| Stage 2 | ||||
| 1 | 5 | 1.4 | 0.3 | −0.220 |
| 2 | 5 | 1.4 | 0.3 | −0.220 |
| 3a | 5 | 1.4 | 0.3 | |
| 3b | 4 | 1.4 | 0.3 | −0.275 |
| 4 | 4 | 1.4 | 0.3 | −0.275 |
| average | 4.6 | −0.248 |
Disclaimer/Publisher’s Note: The statements, opinions and data contained in all publications are solely those of the individual author(s) and contributor(s) and not of MDPI and/or the editor(s). MDPI and/or the editor(s) disclaim responsibility for any injury to people or property resulting from any ideas, methods, instructions or products referred to in the content. |
© 2025 by the authors. Licensee MDPI, Basel, Switzerland. This article is an open access article distributed under the terms and conditions of the Creative Commons Attribution (CC BY) license (https://creativecommons.org/licenses/by/4.0/).
Share and Cite
Bonaccorsi, L.; Carbone, R.; La Foresta, F.; Marino, C.; Nucara, A.; Pietrafesa, M.; Versaci, M. Operational Analysis of a Pilot-Scale Plant for Hydrogen Production via an Electrolyser Powered by a Photovoltaic System. Energies 2025, 18, 3949. https://doi.org/10.3390/en18153949
Bonaccorsi L, Carbone R, La Foresta F, Marino C, Nucara A, Pietrafesa M, Versaci M. Operational Analysis of a Pilot-Scale Plant for Hydrogen Production via an Electrolyser Powered by a Photovoltaic System. Energies. 2025; 18(15):3949. https://doi.org/10.3390/en18153949
Chicago/Turabian StyleBonaccorsi, Lucio, Rosario Carbone, Fabio La Foresta, Concettina Marino, Antonino Nucara, Matilde Pietrafesa, and Mario Versaci. 2025. "Operational Analysis of a Pilot-Scale Plant for Hydrogen Production via an Electrolyser Powered by a Photovoltaic System" Energies 18, no. 15: 3949. https://doi.org/10.3390/en18153949
APA StyleBonaccorsi, L., Carbone, R., La Foresta, F., Marino, C., Nucara, A., Pietrafesa, M., & Versaci, M. (2025). Operational Analysis of a Pilot-Scale Plant for Hydrogen Production via an Electrolyser Powered by a Photovoltaic System. Energies, 18(15), 3949. https://doi.org/10.3390/en18153949