
Enhancing Lithium Titanate Battery Charging: Investigating the Benefits of Open-Circuit Voltage Feedback


Abstract

1. Introduction
2. Materials and Methods
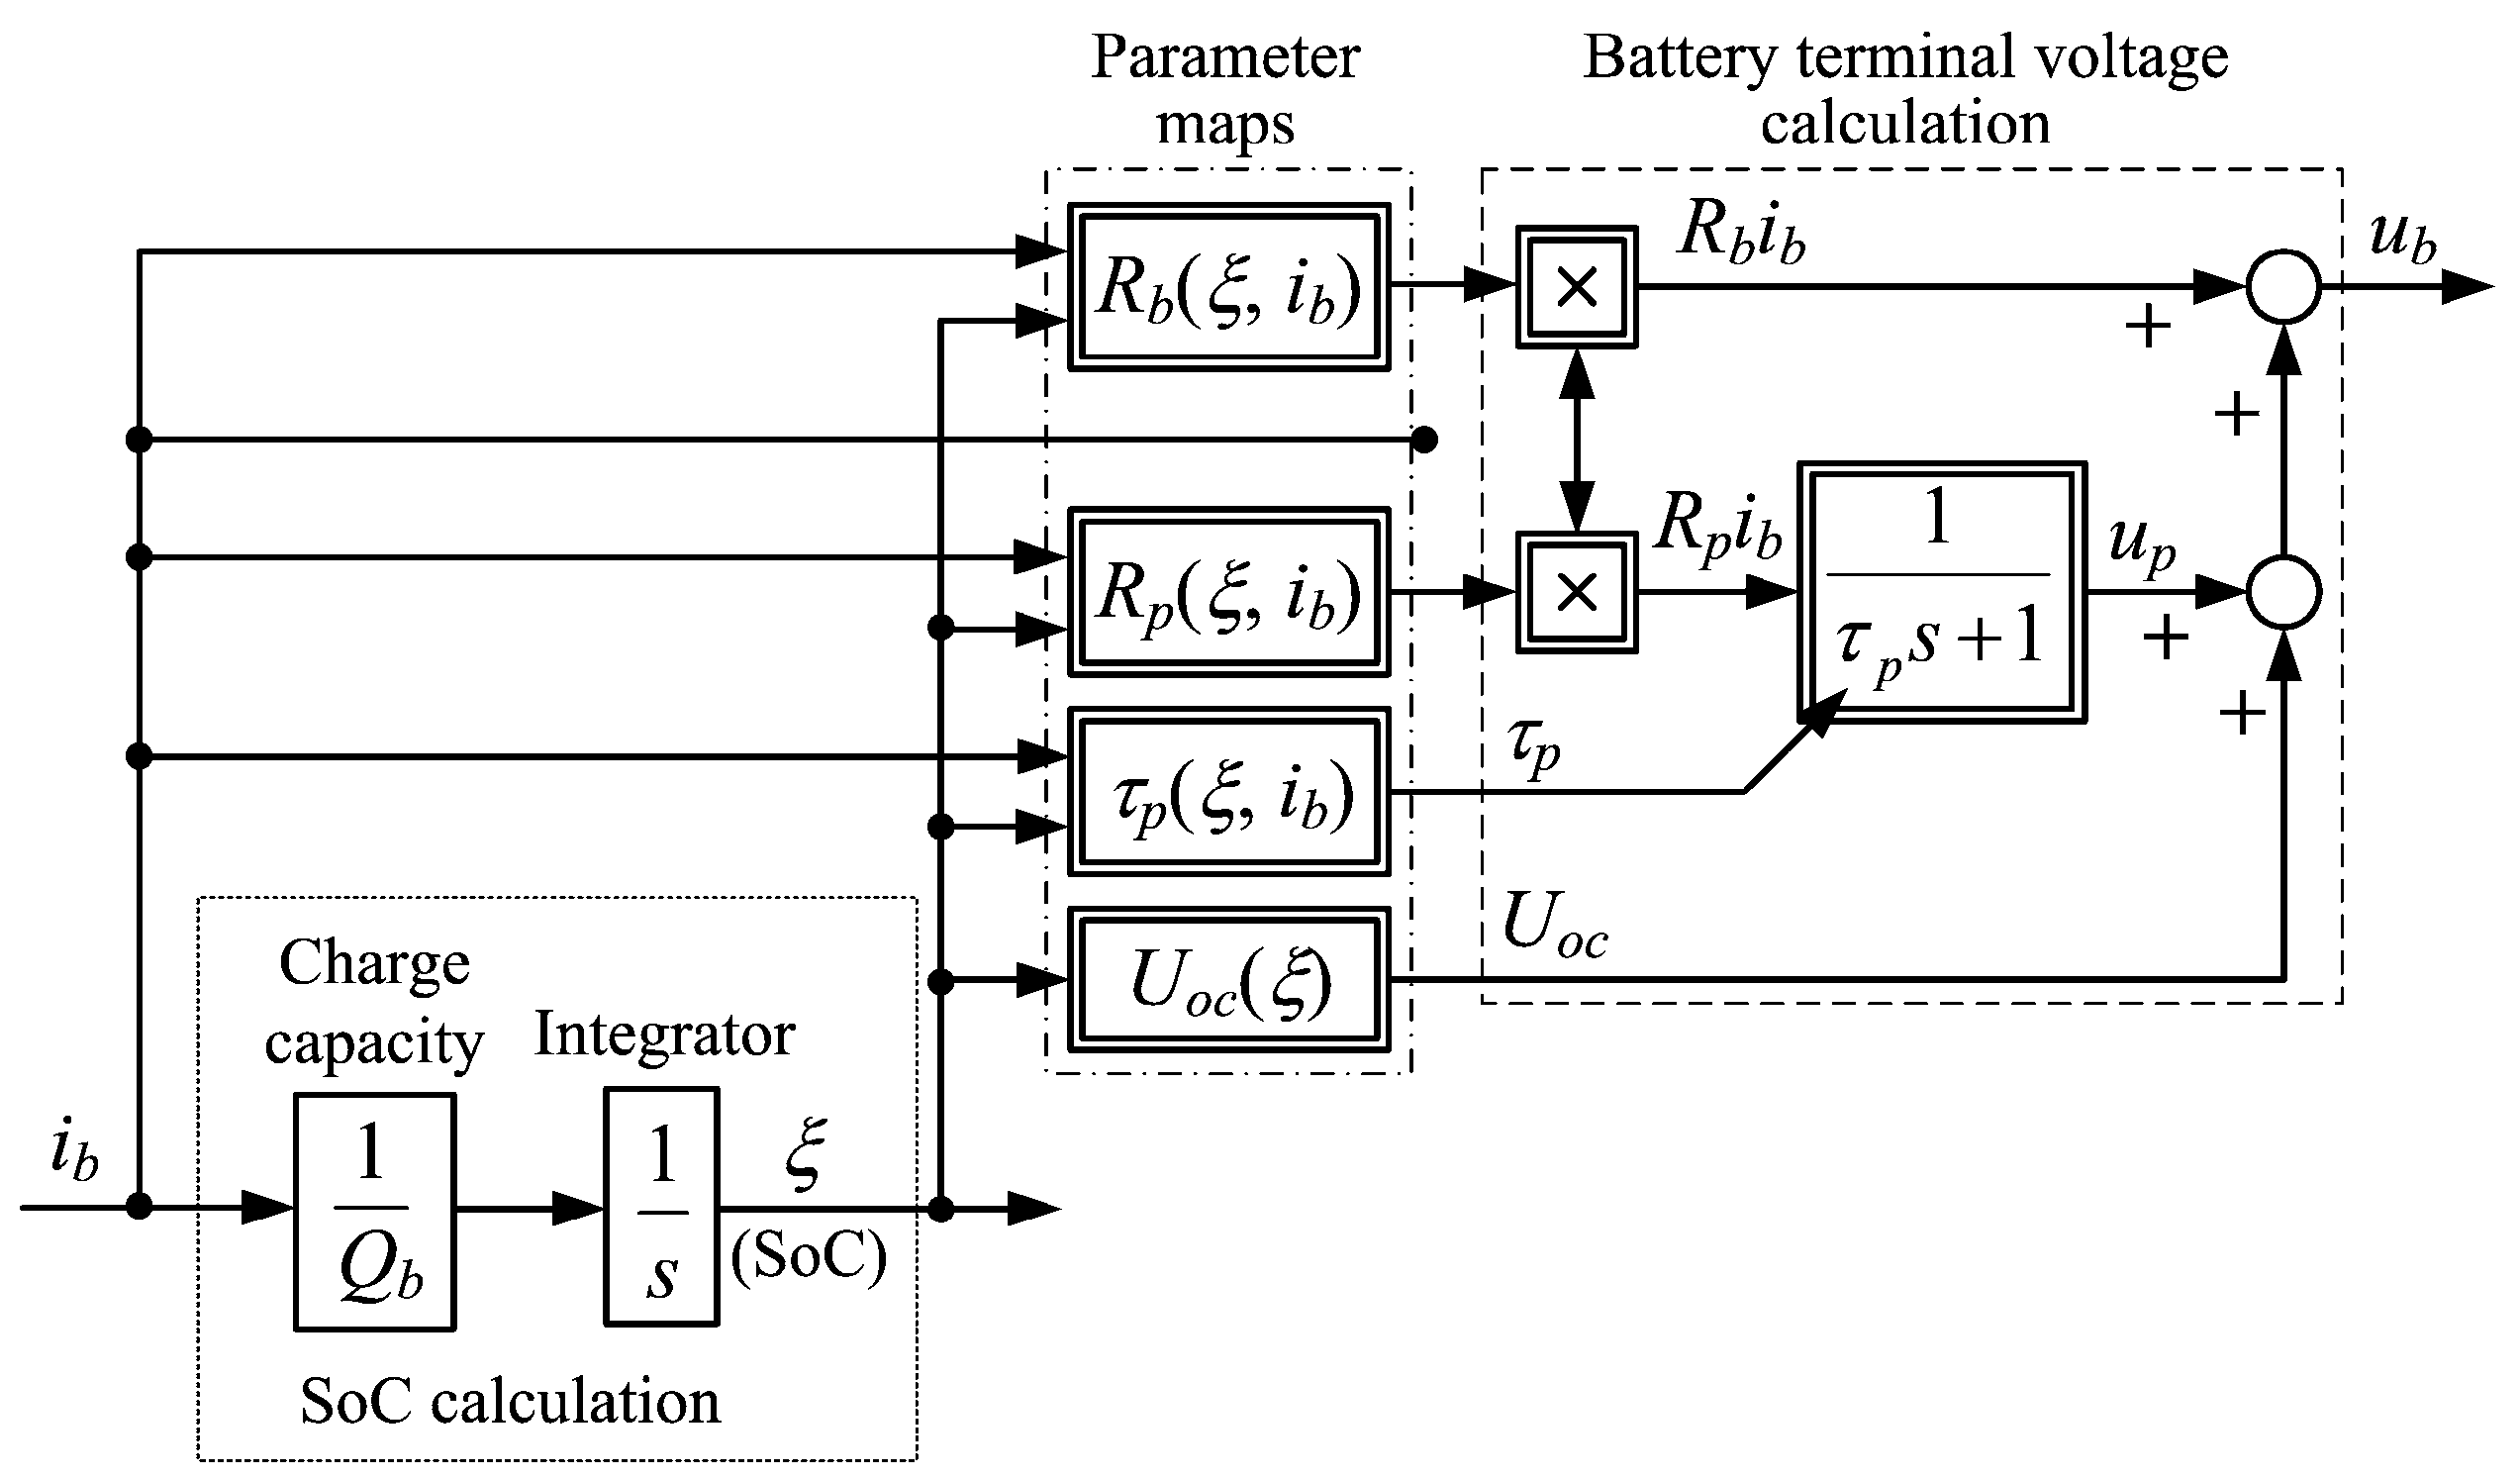
2.1. Battery Equivalent Circuit Model and Buck-Converter Low-Level Current Control Loop
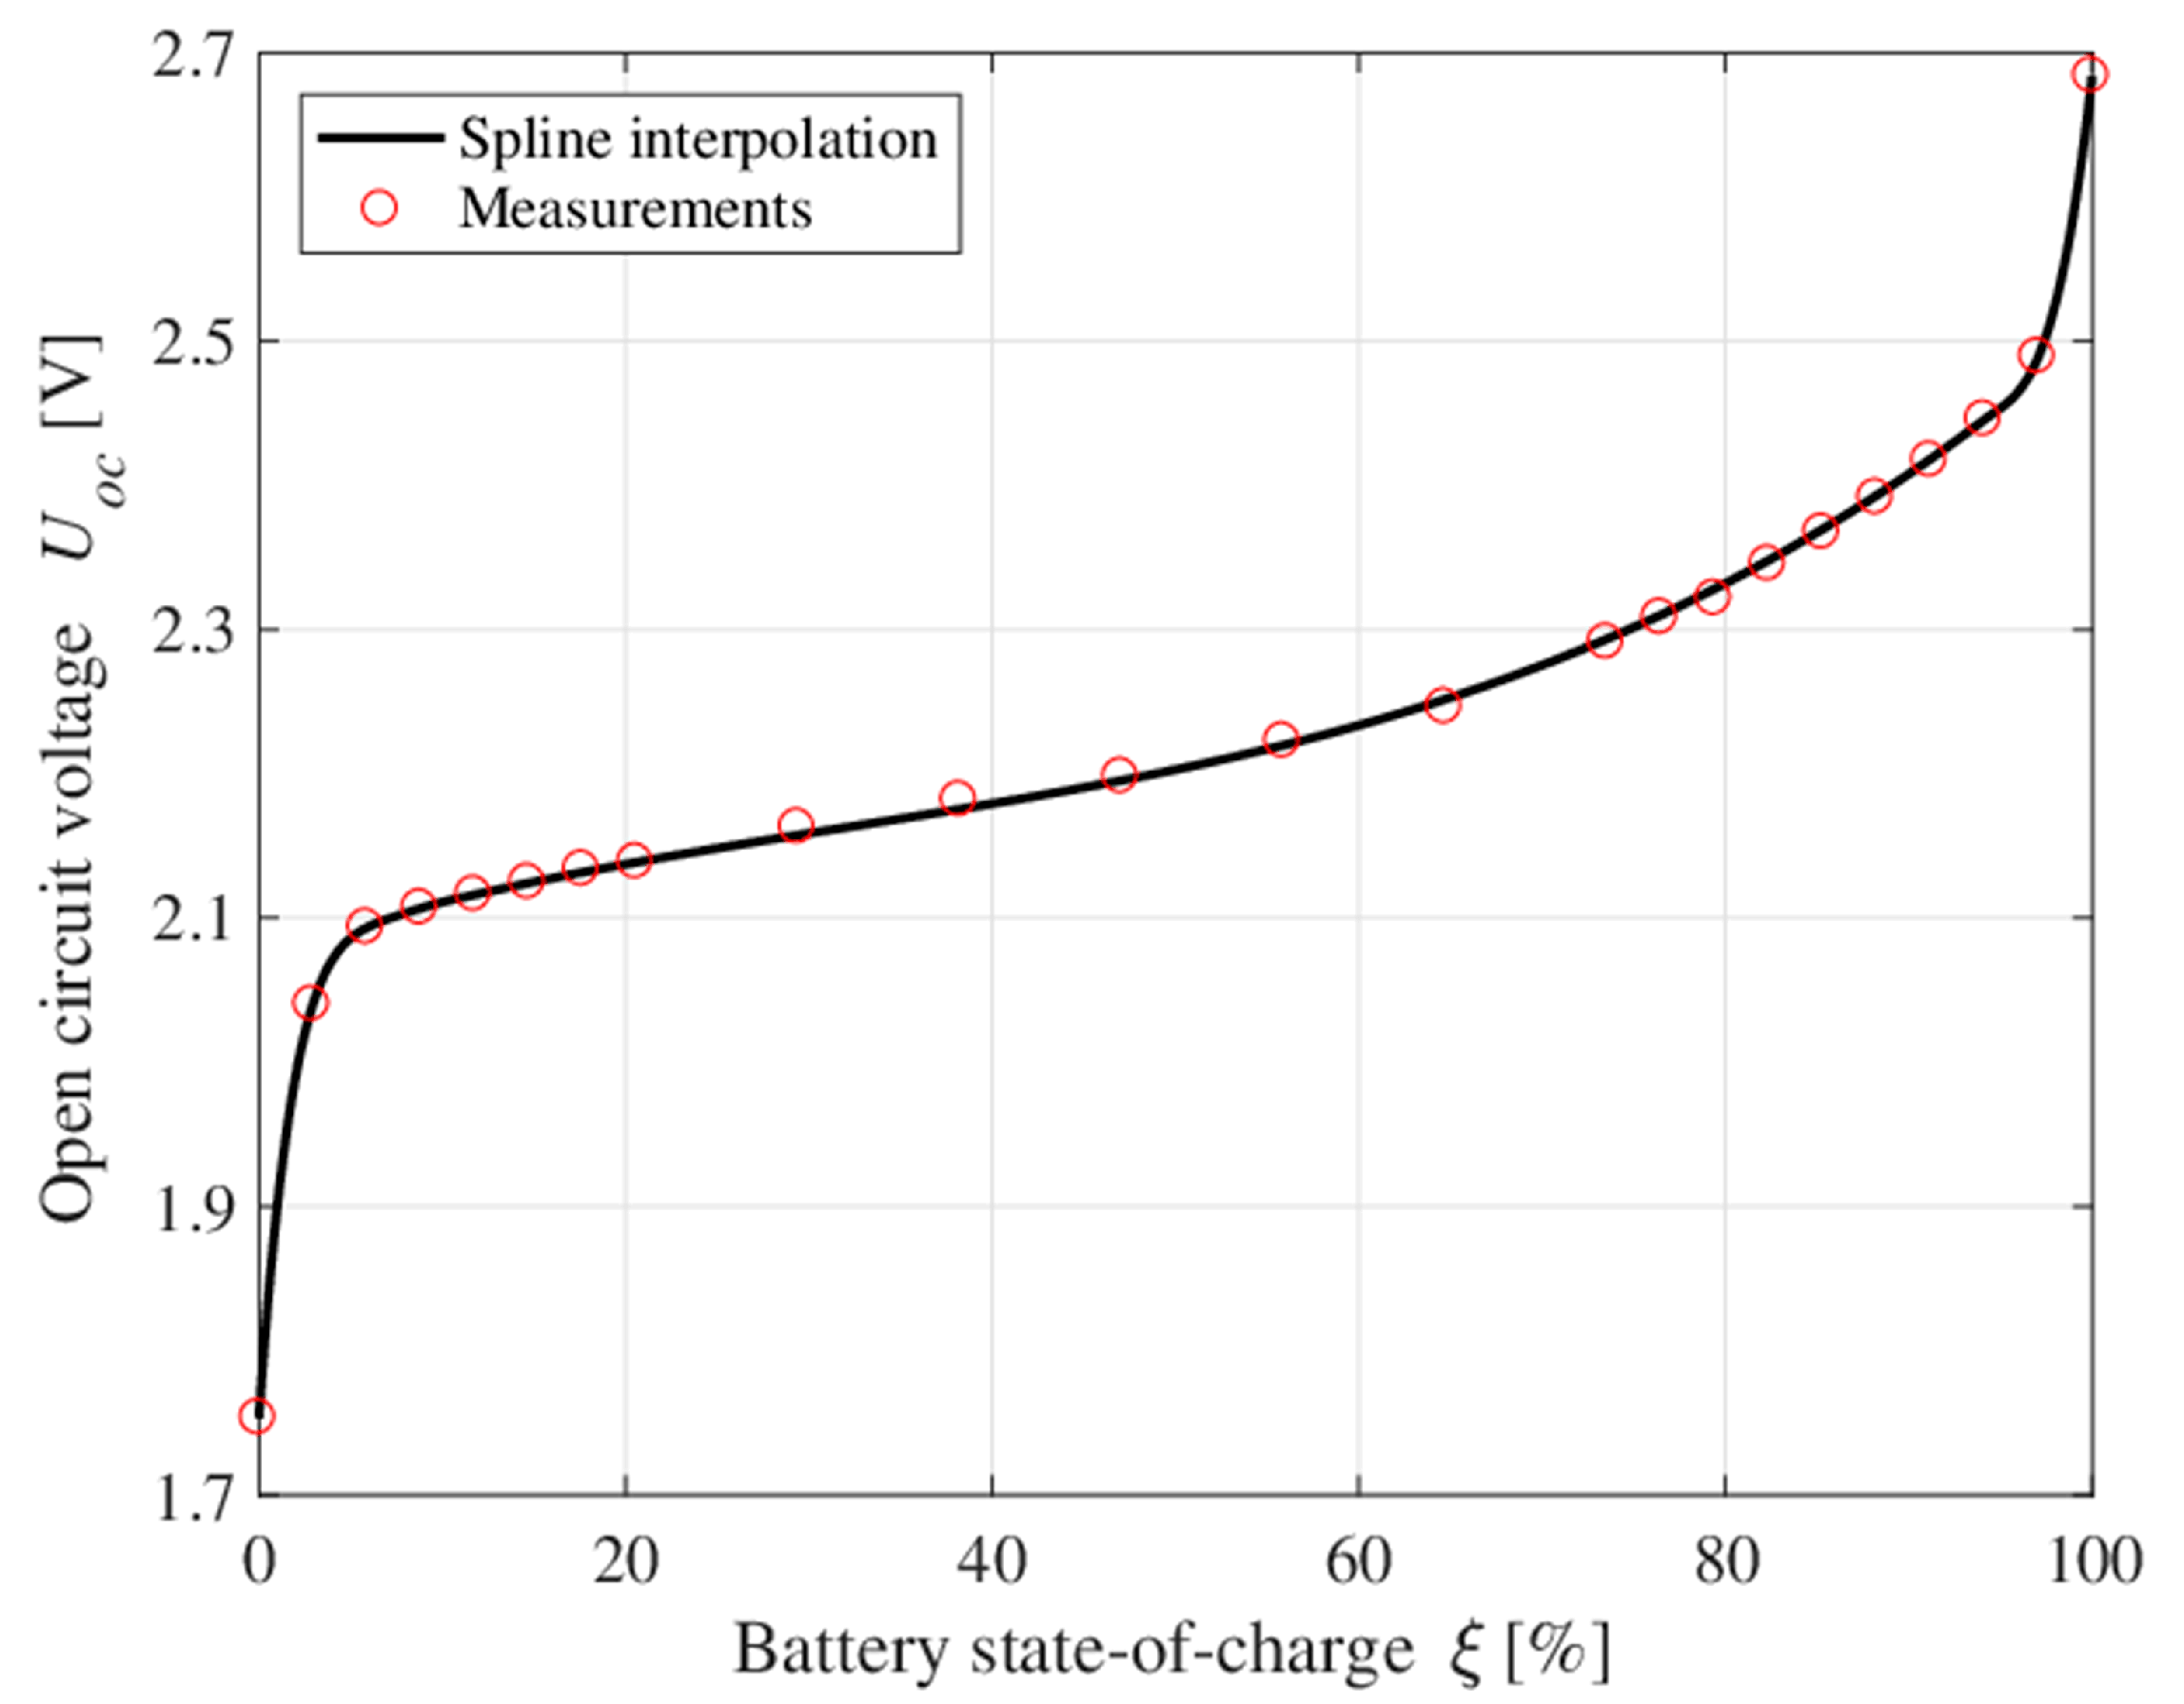
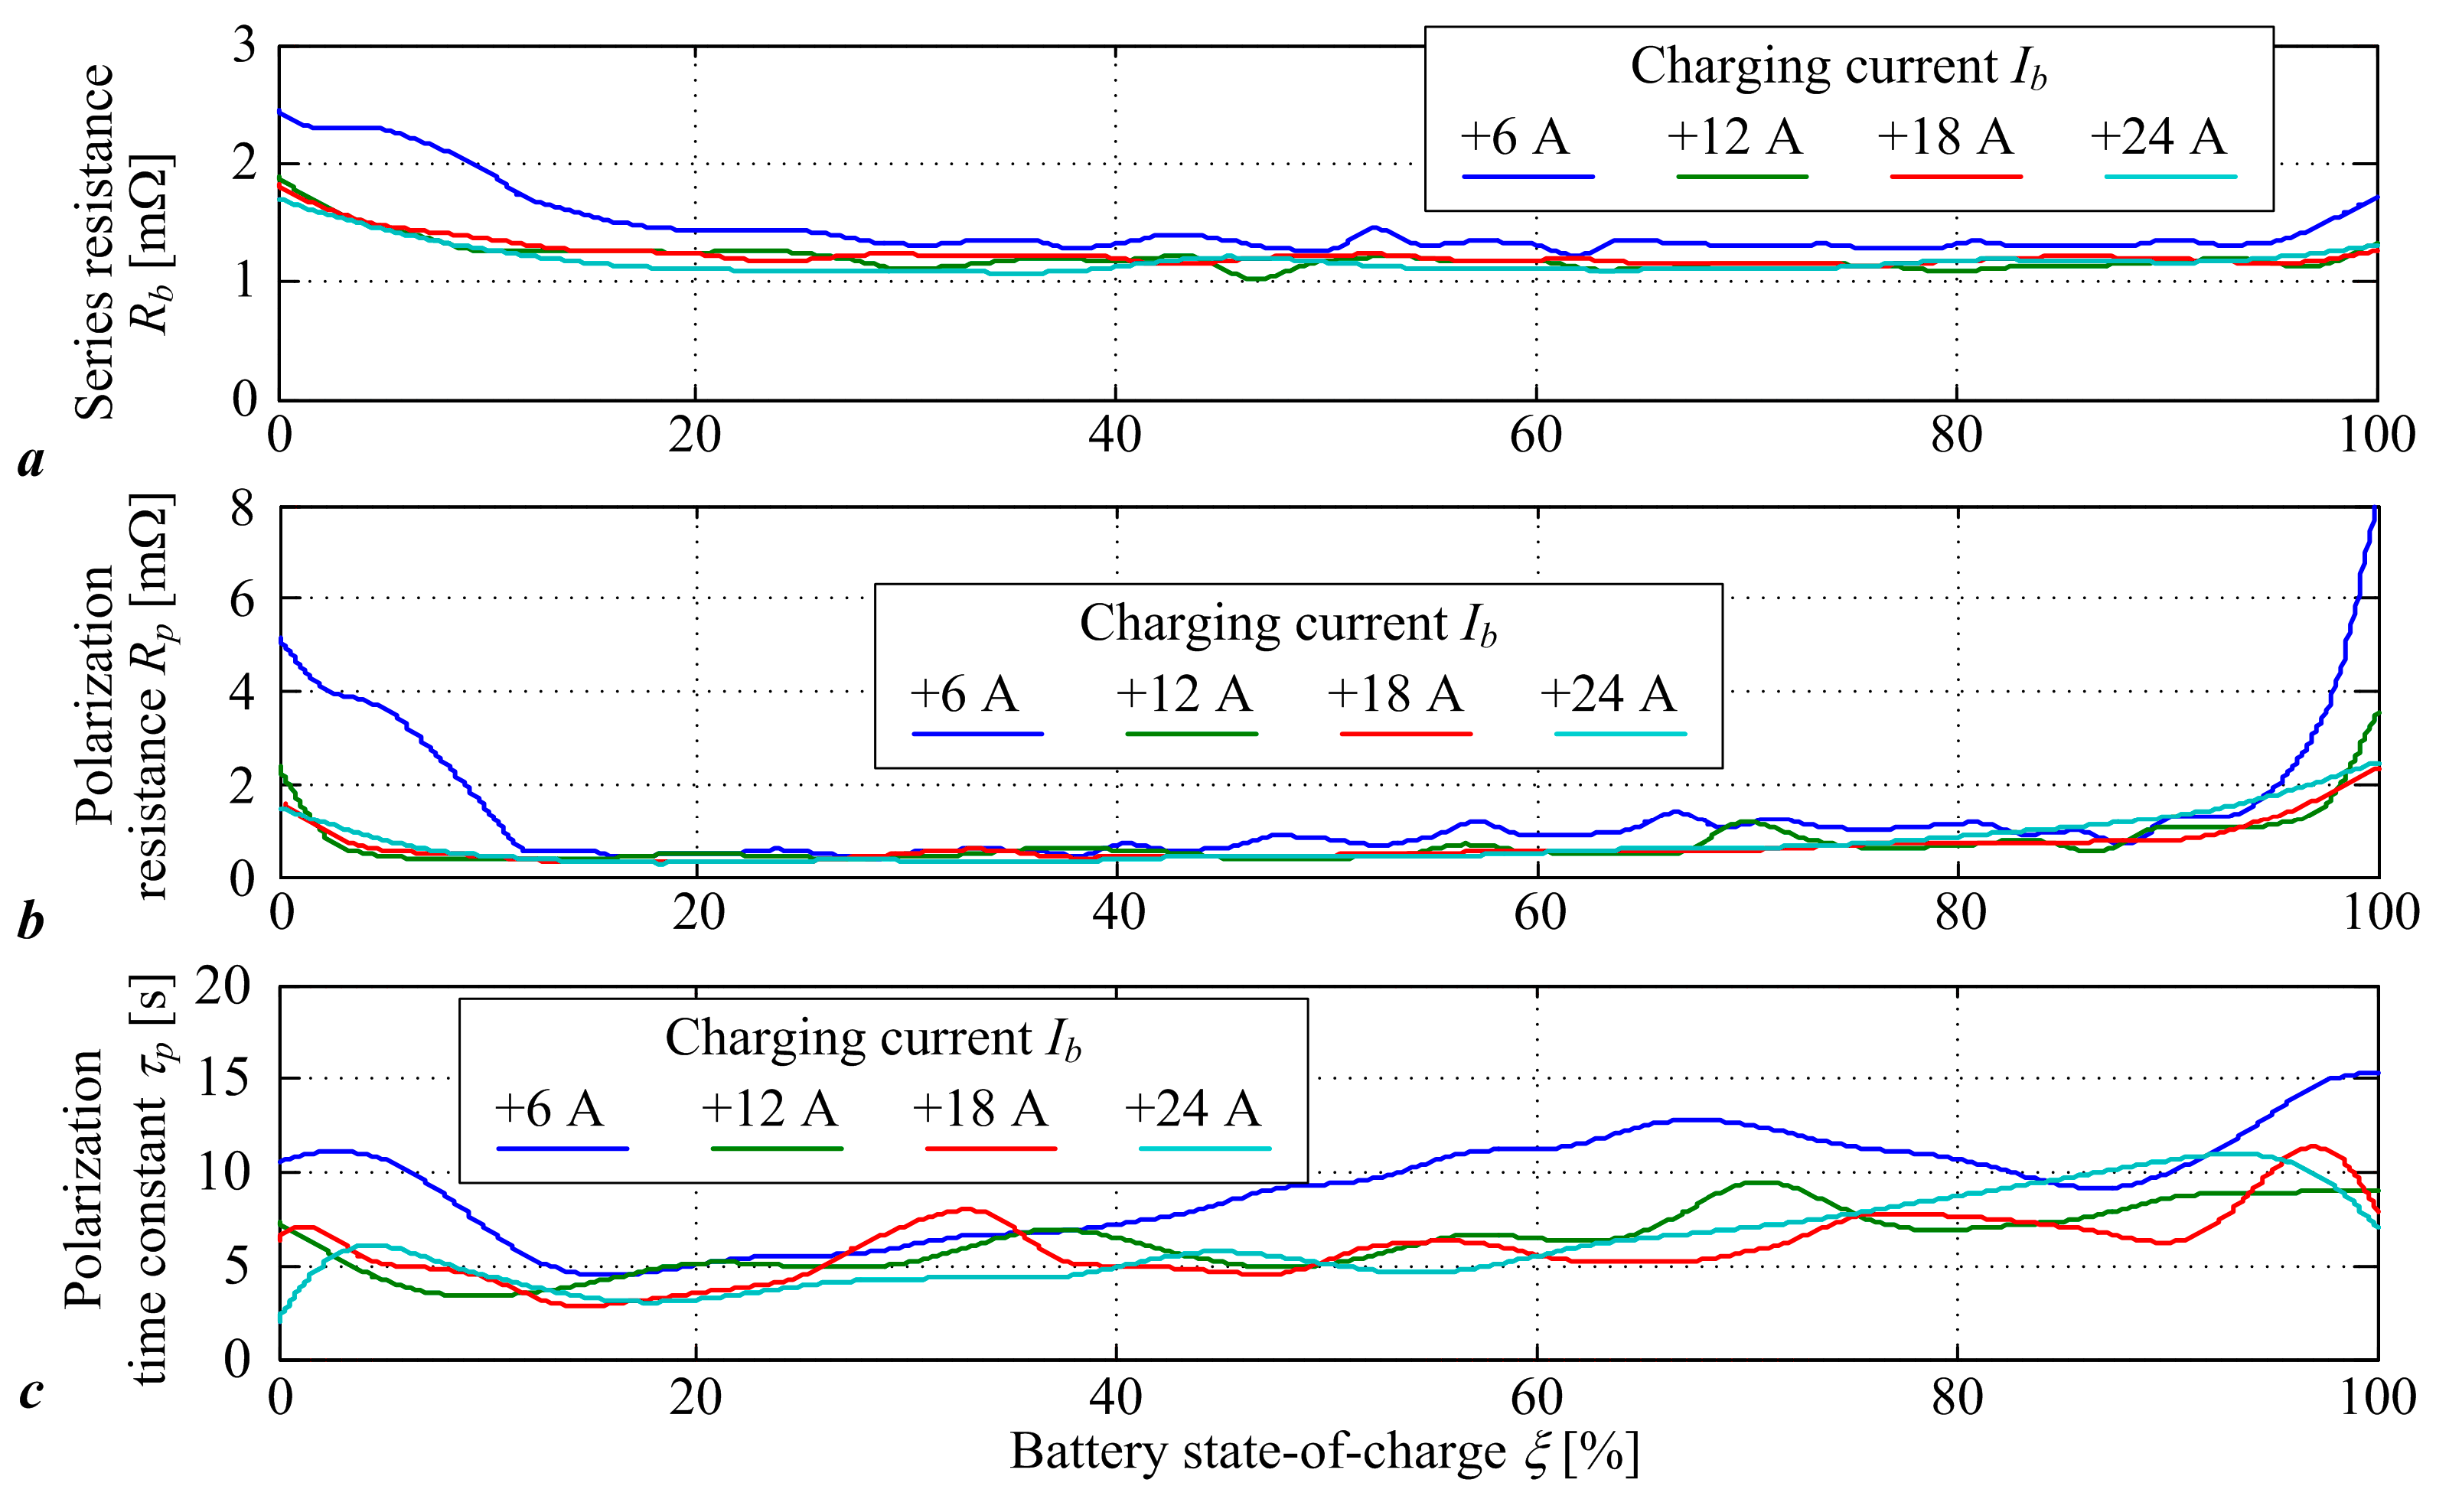
2.2. Battery Cell Model Parameters
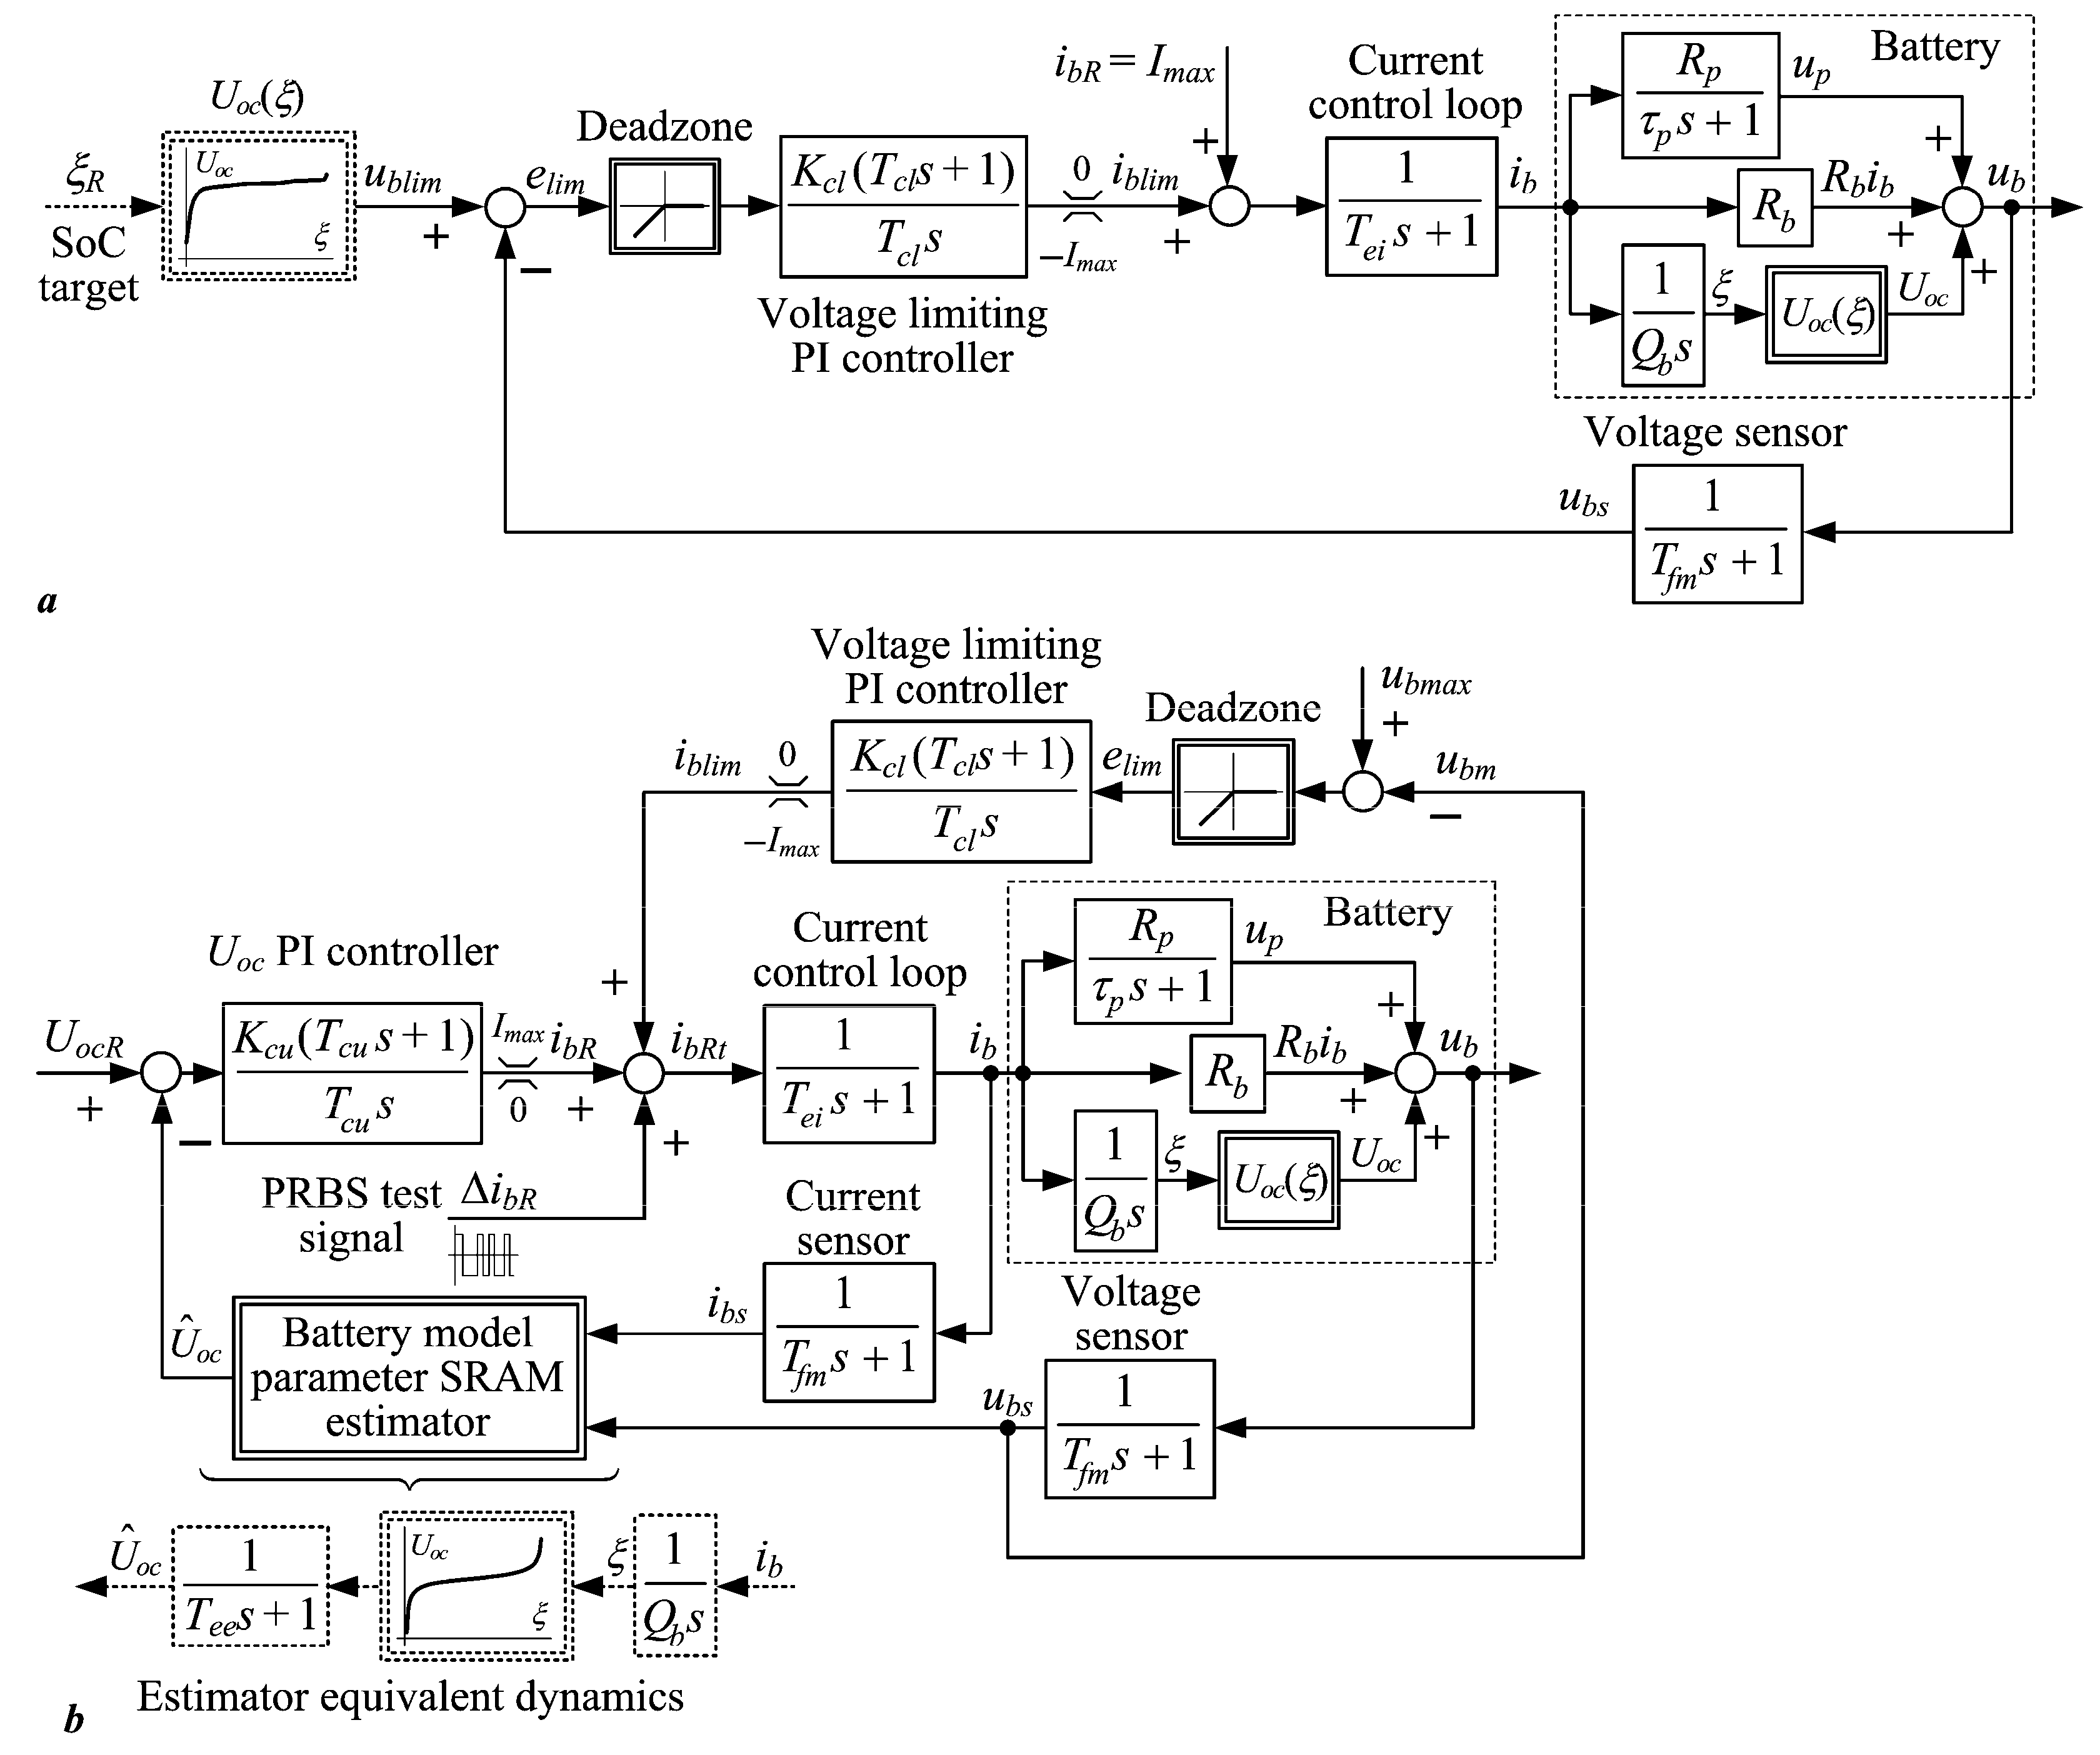
2.3. Battery Charging Control Systems Under Investigation
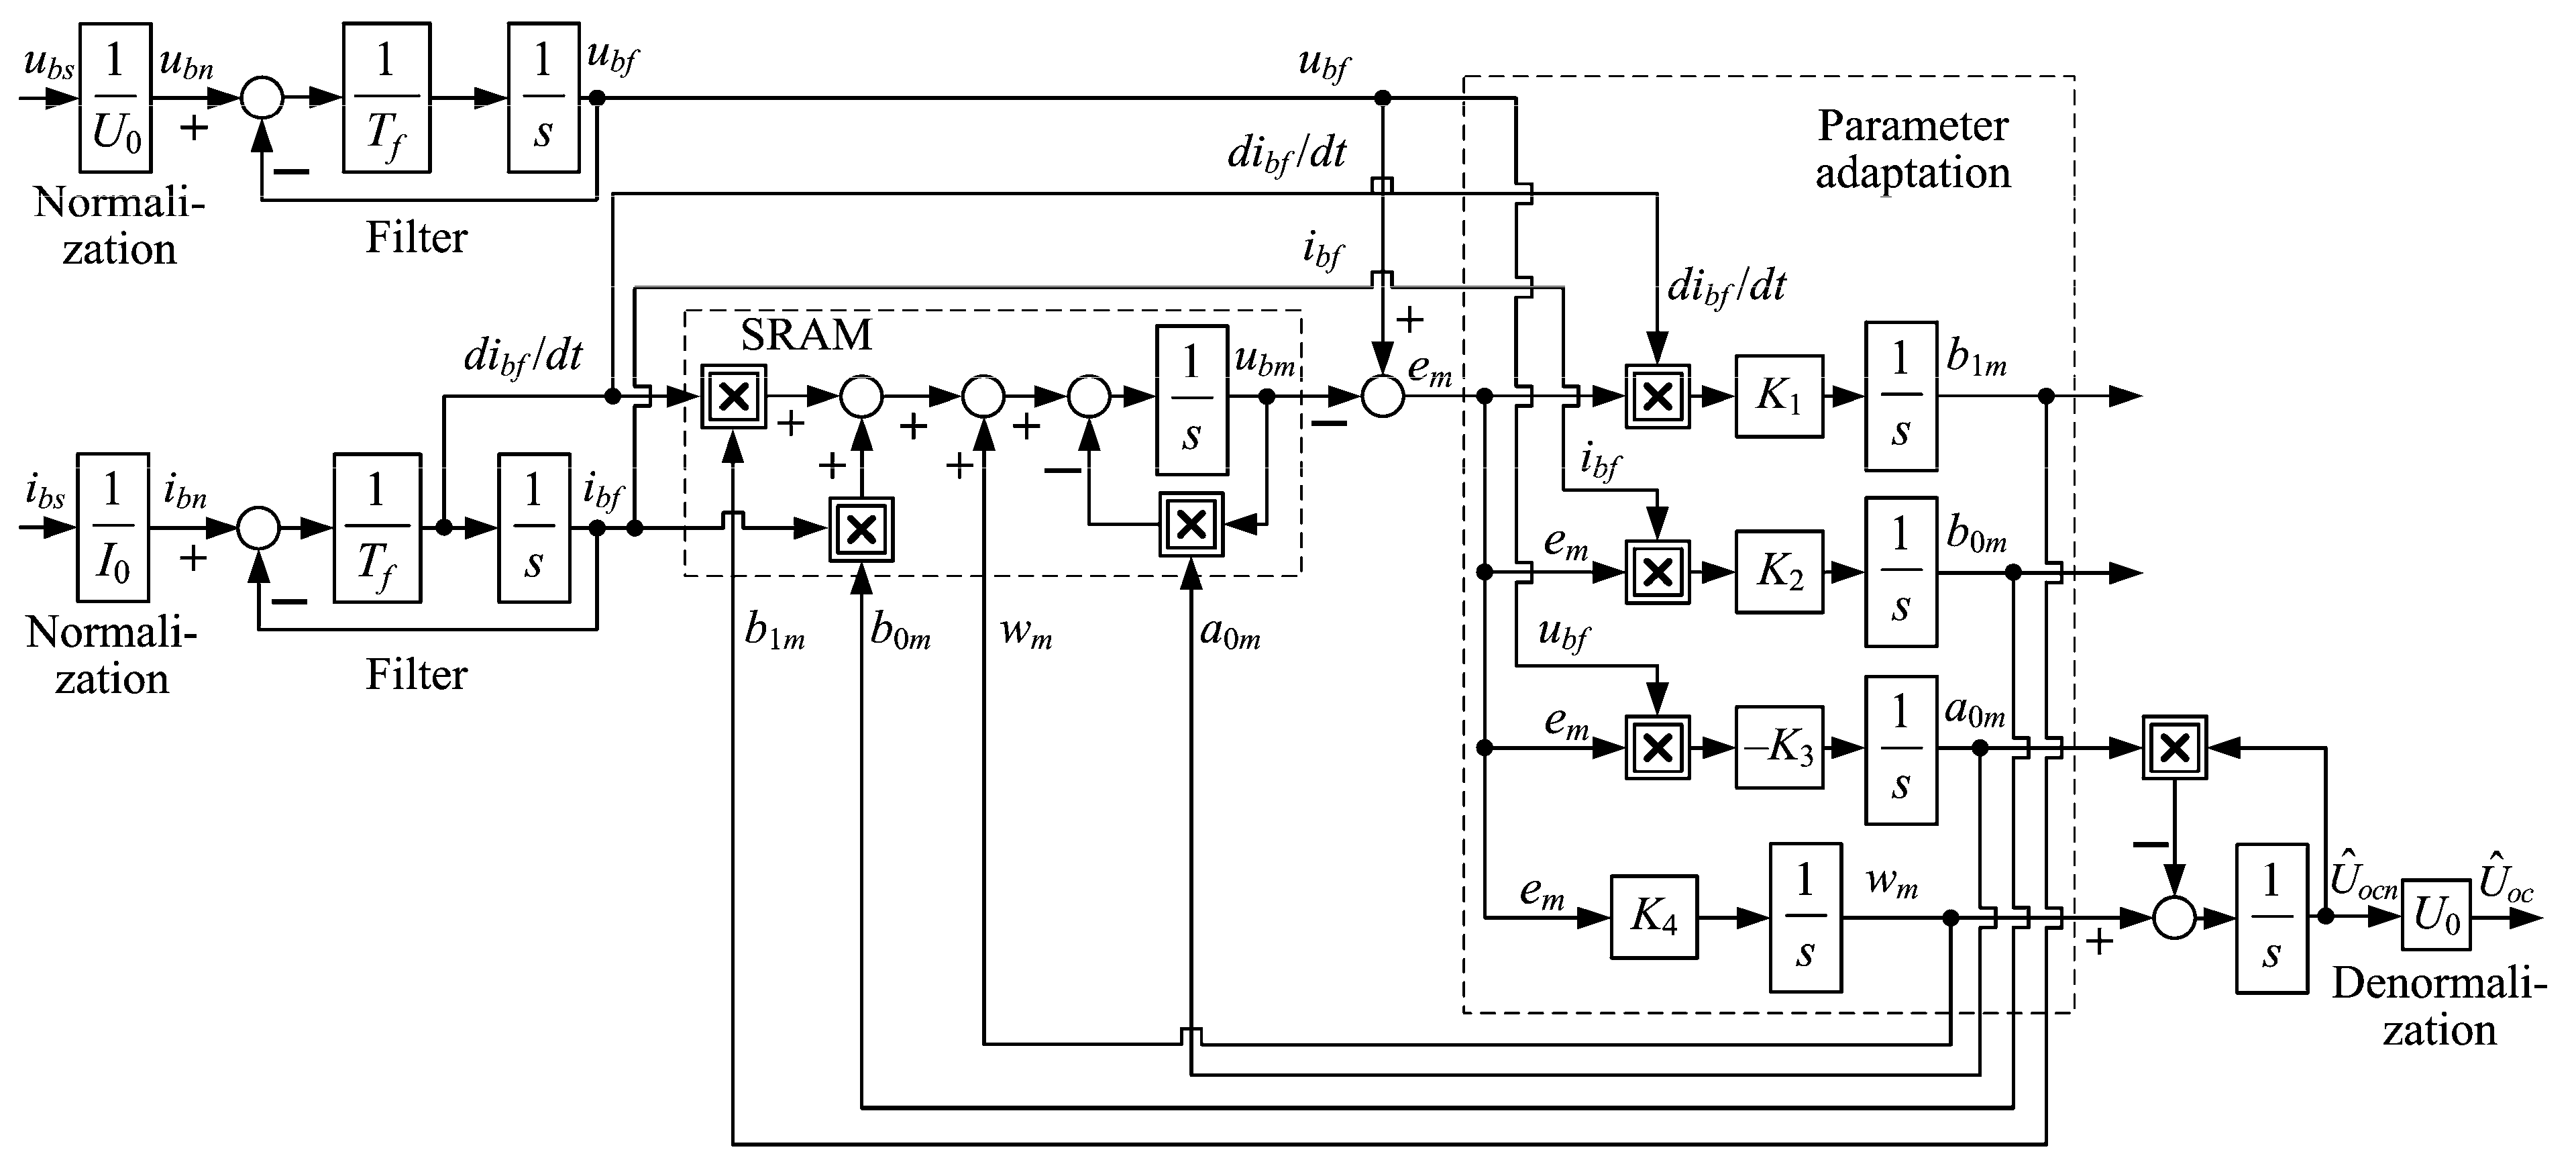
2.4. Open-Circuit Voltage Estimator
2.5. Feedback Controller Tuning
3. Results
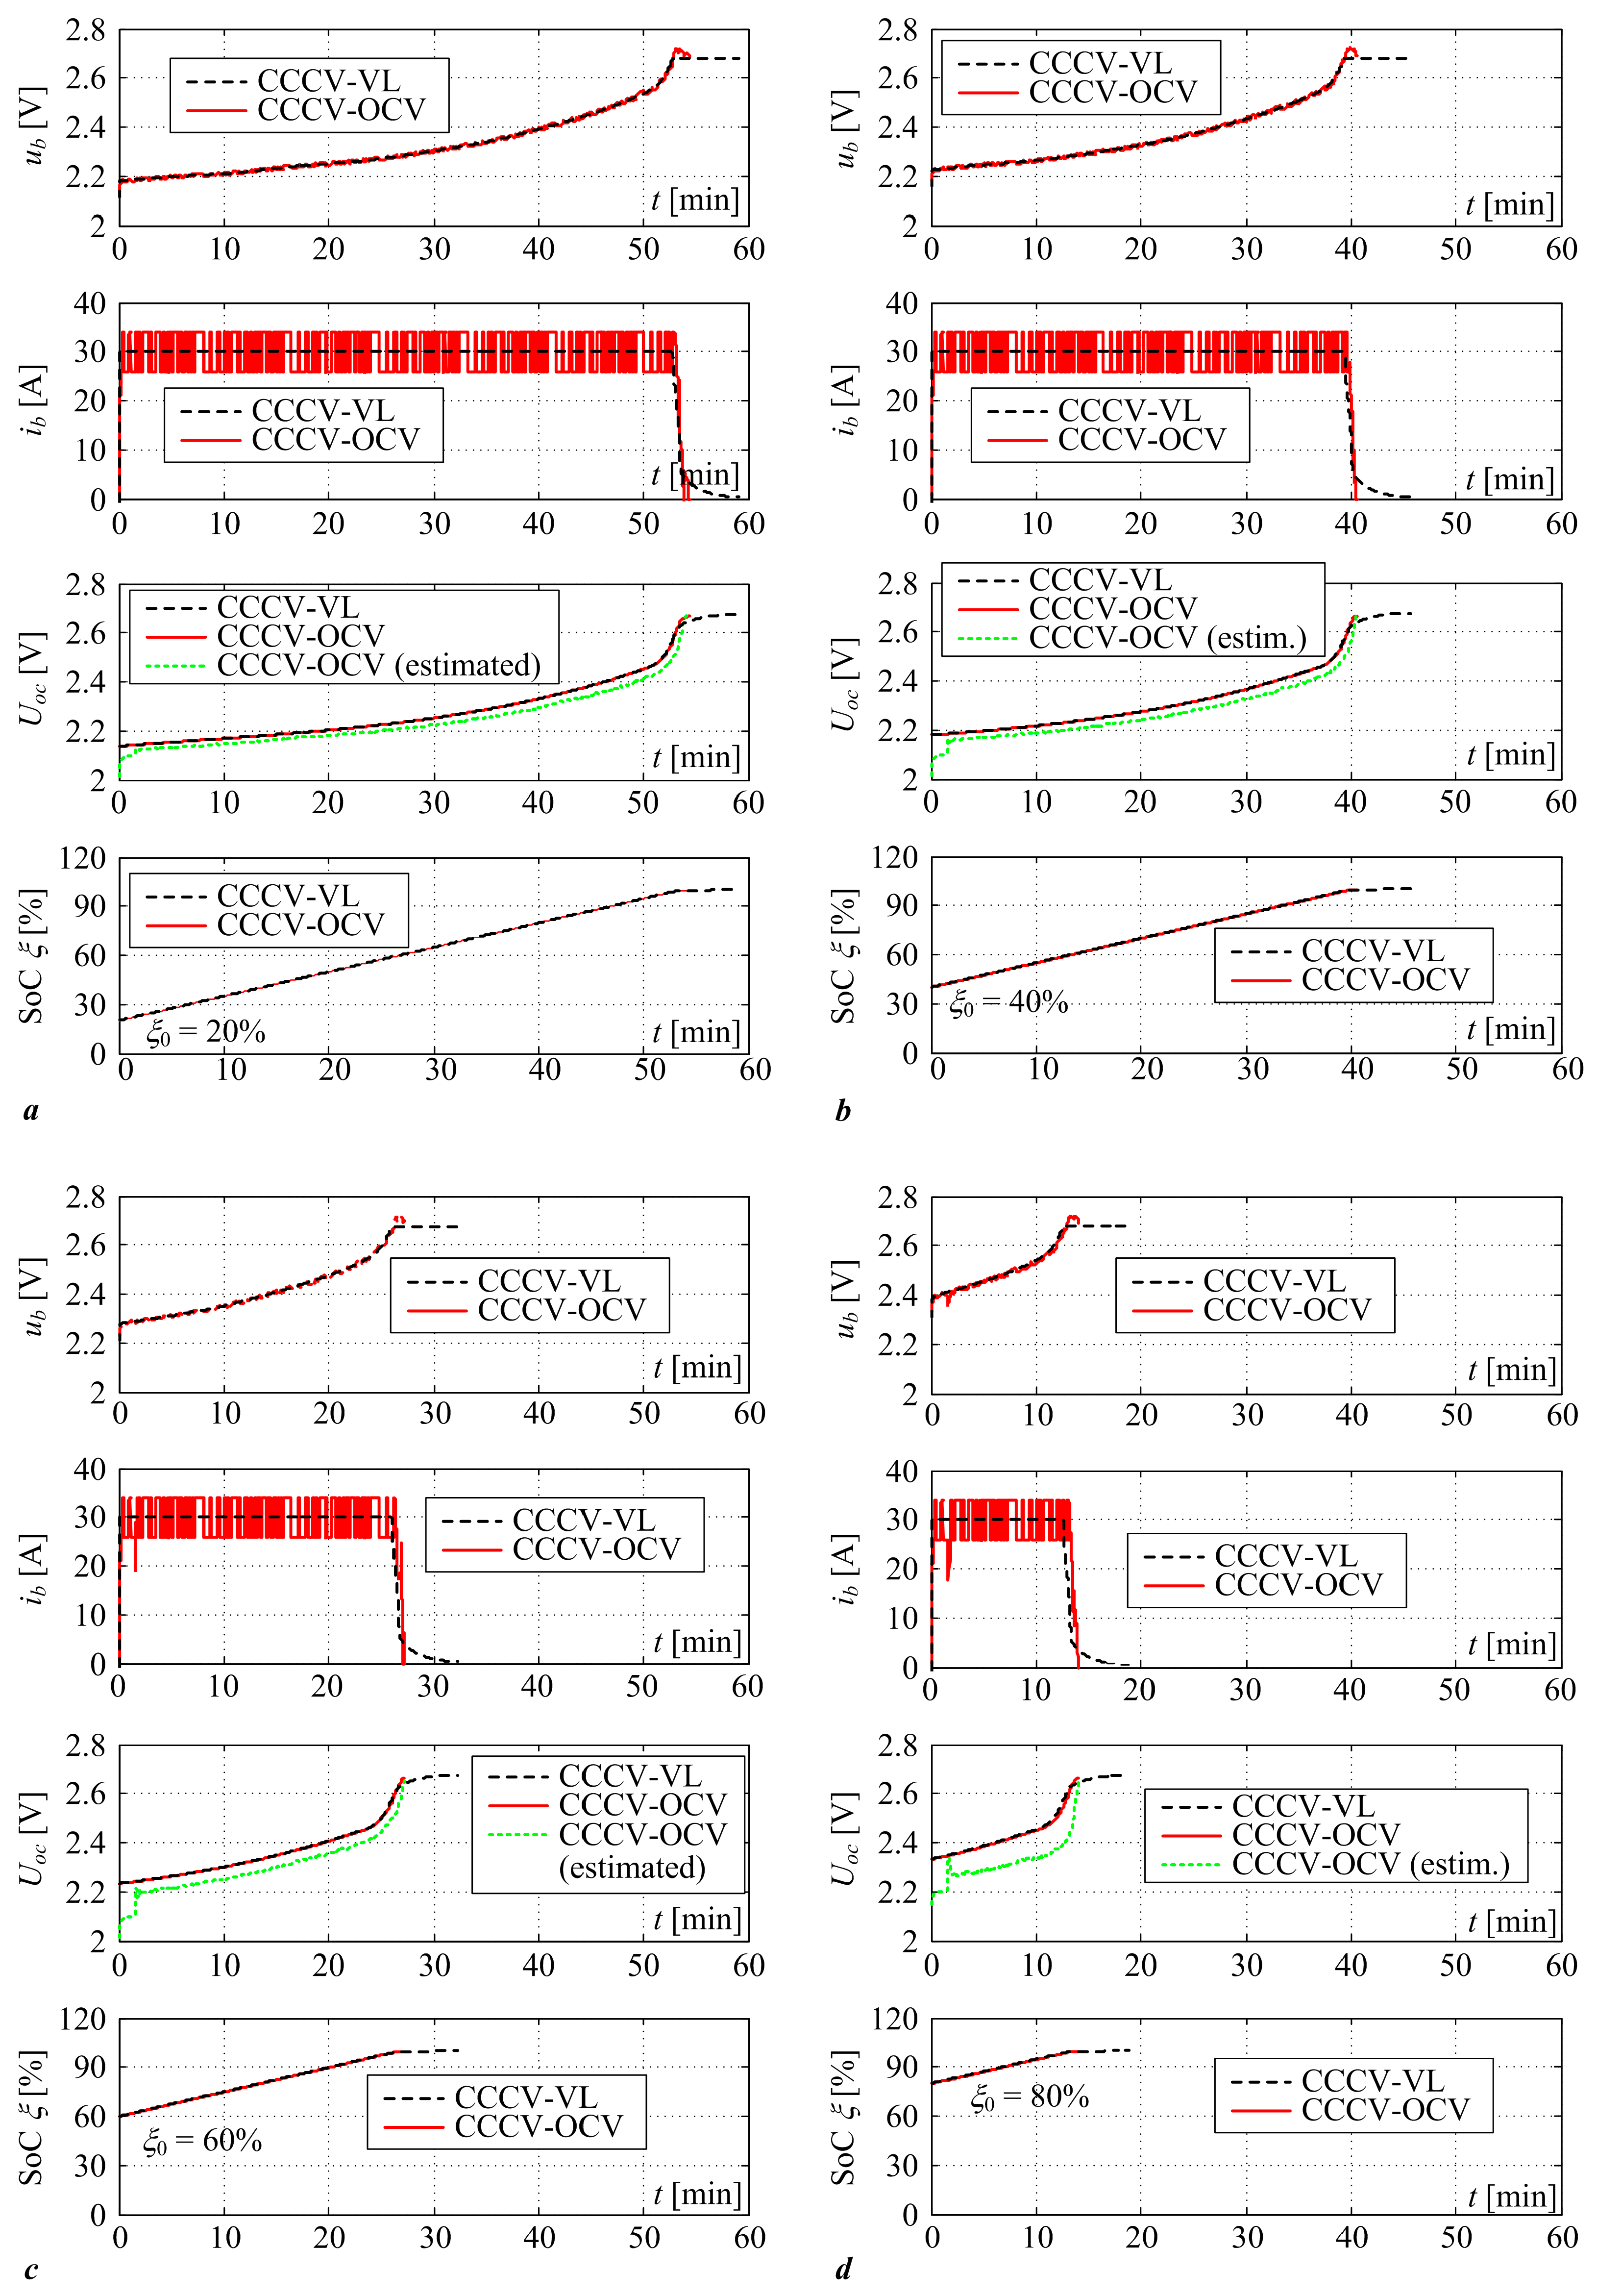
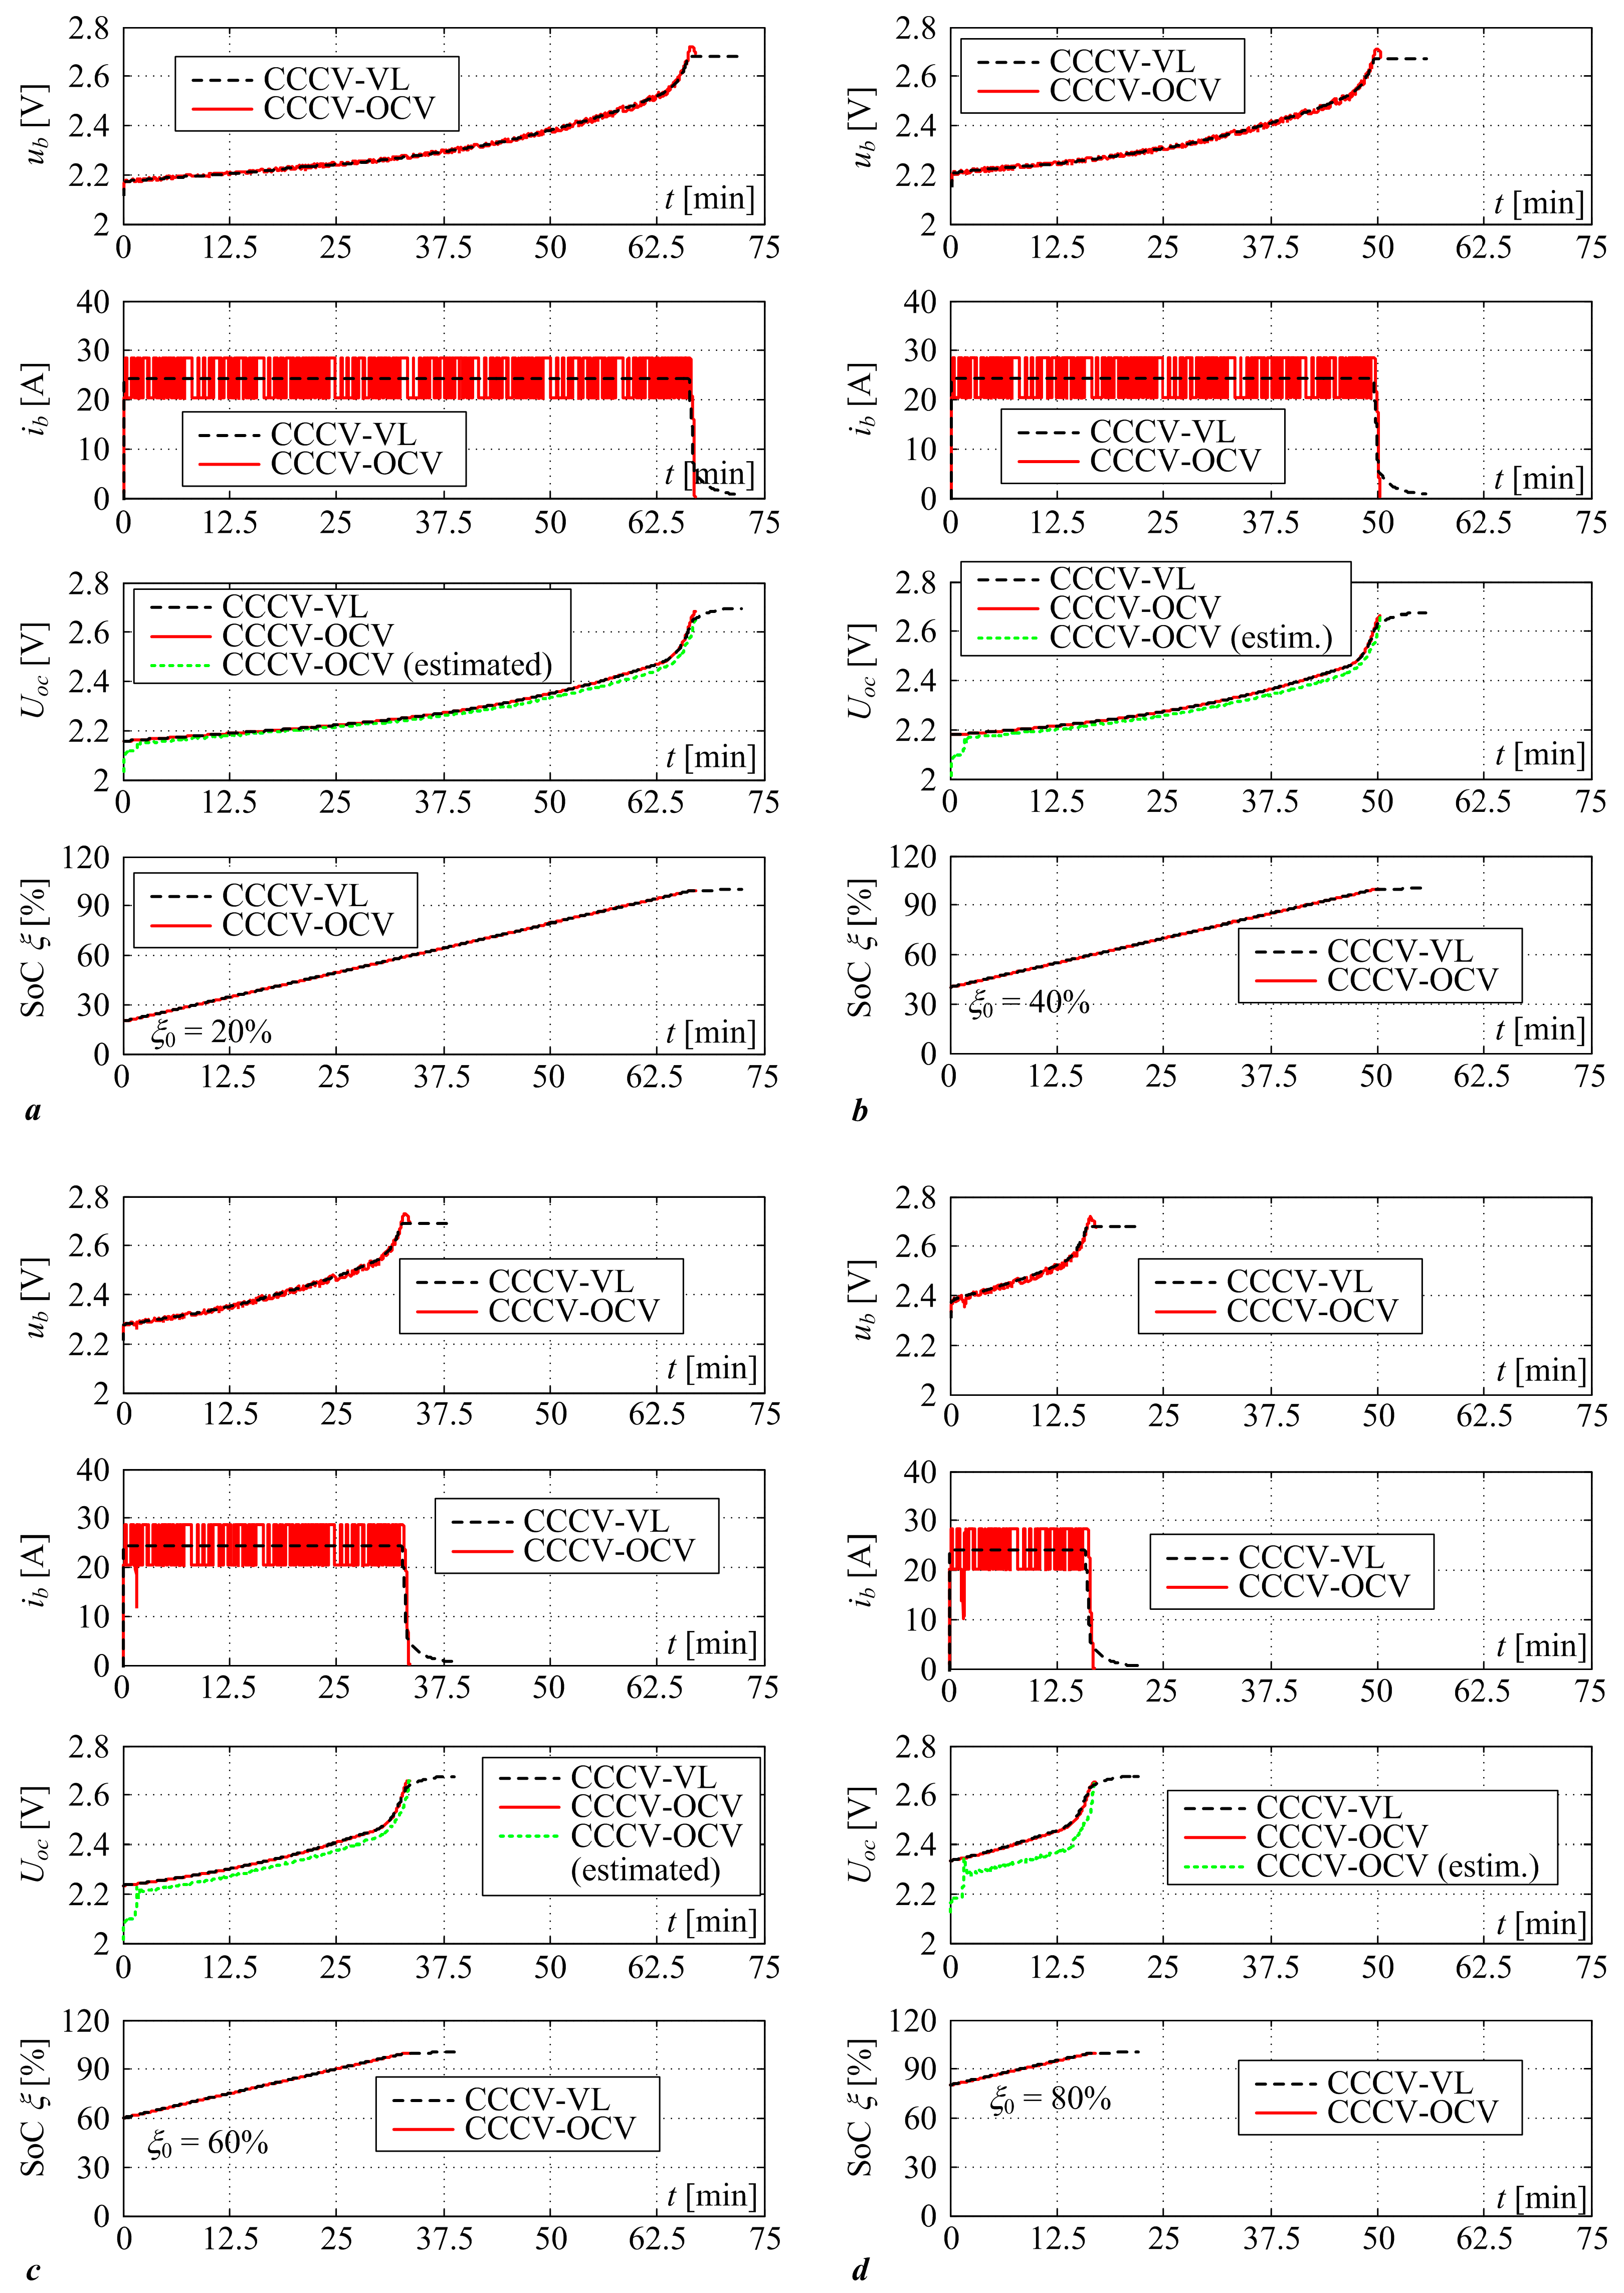
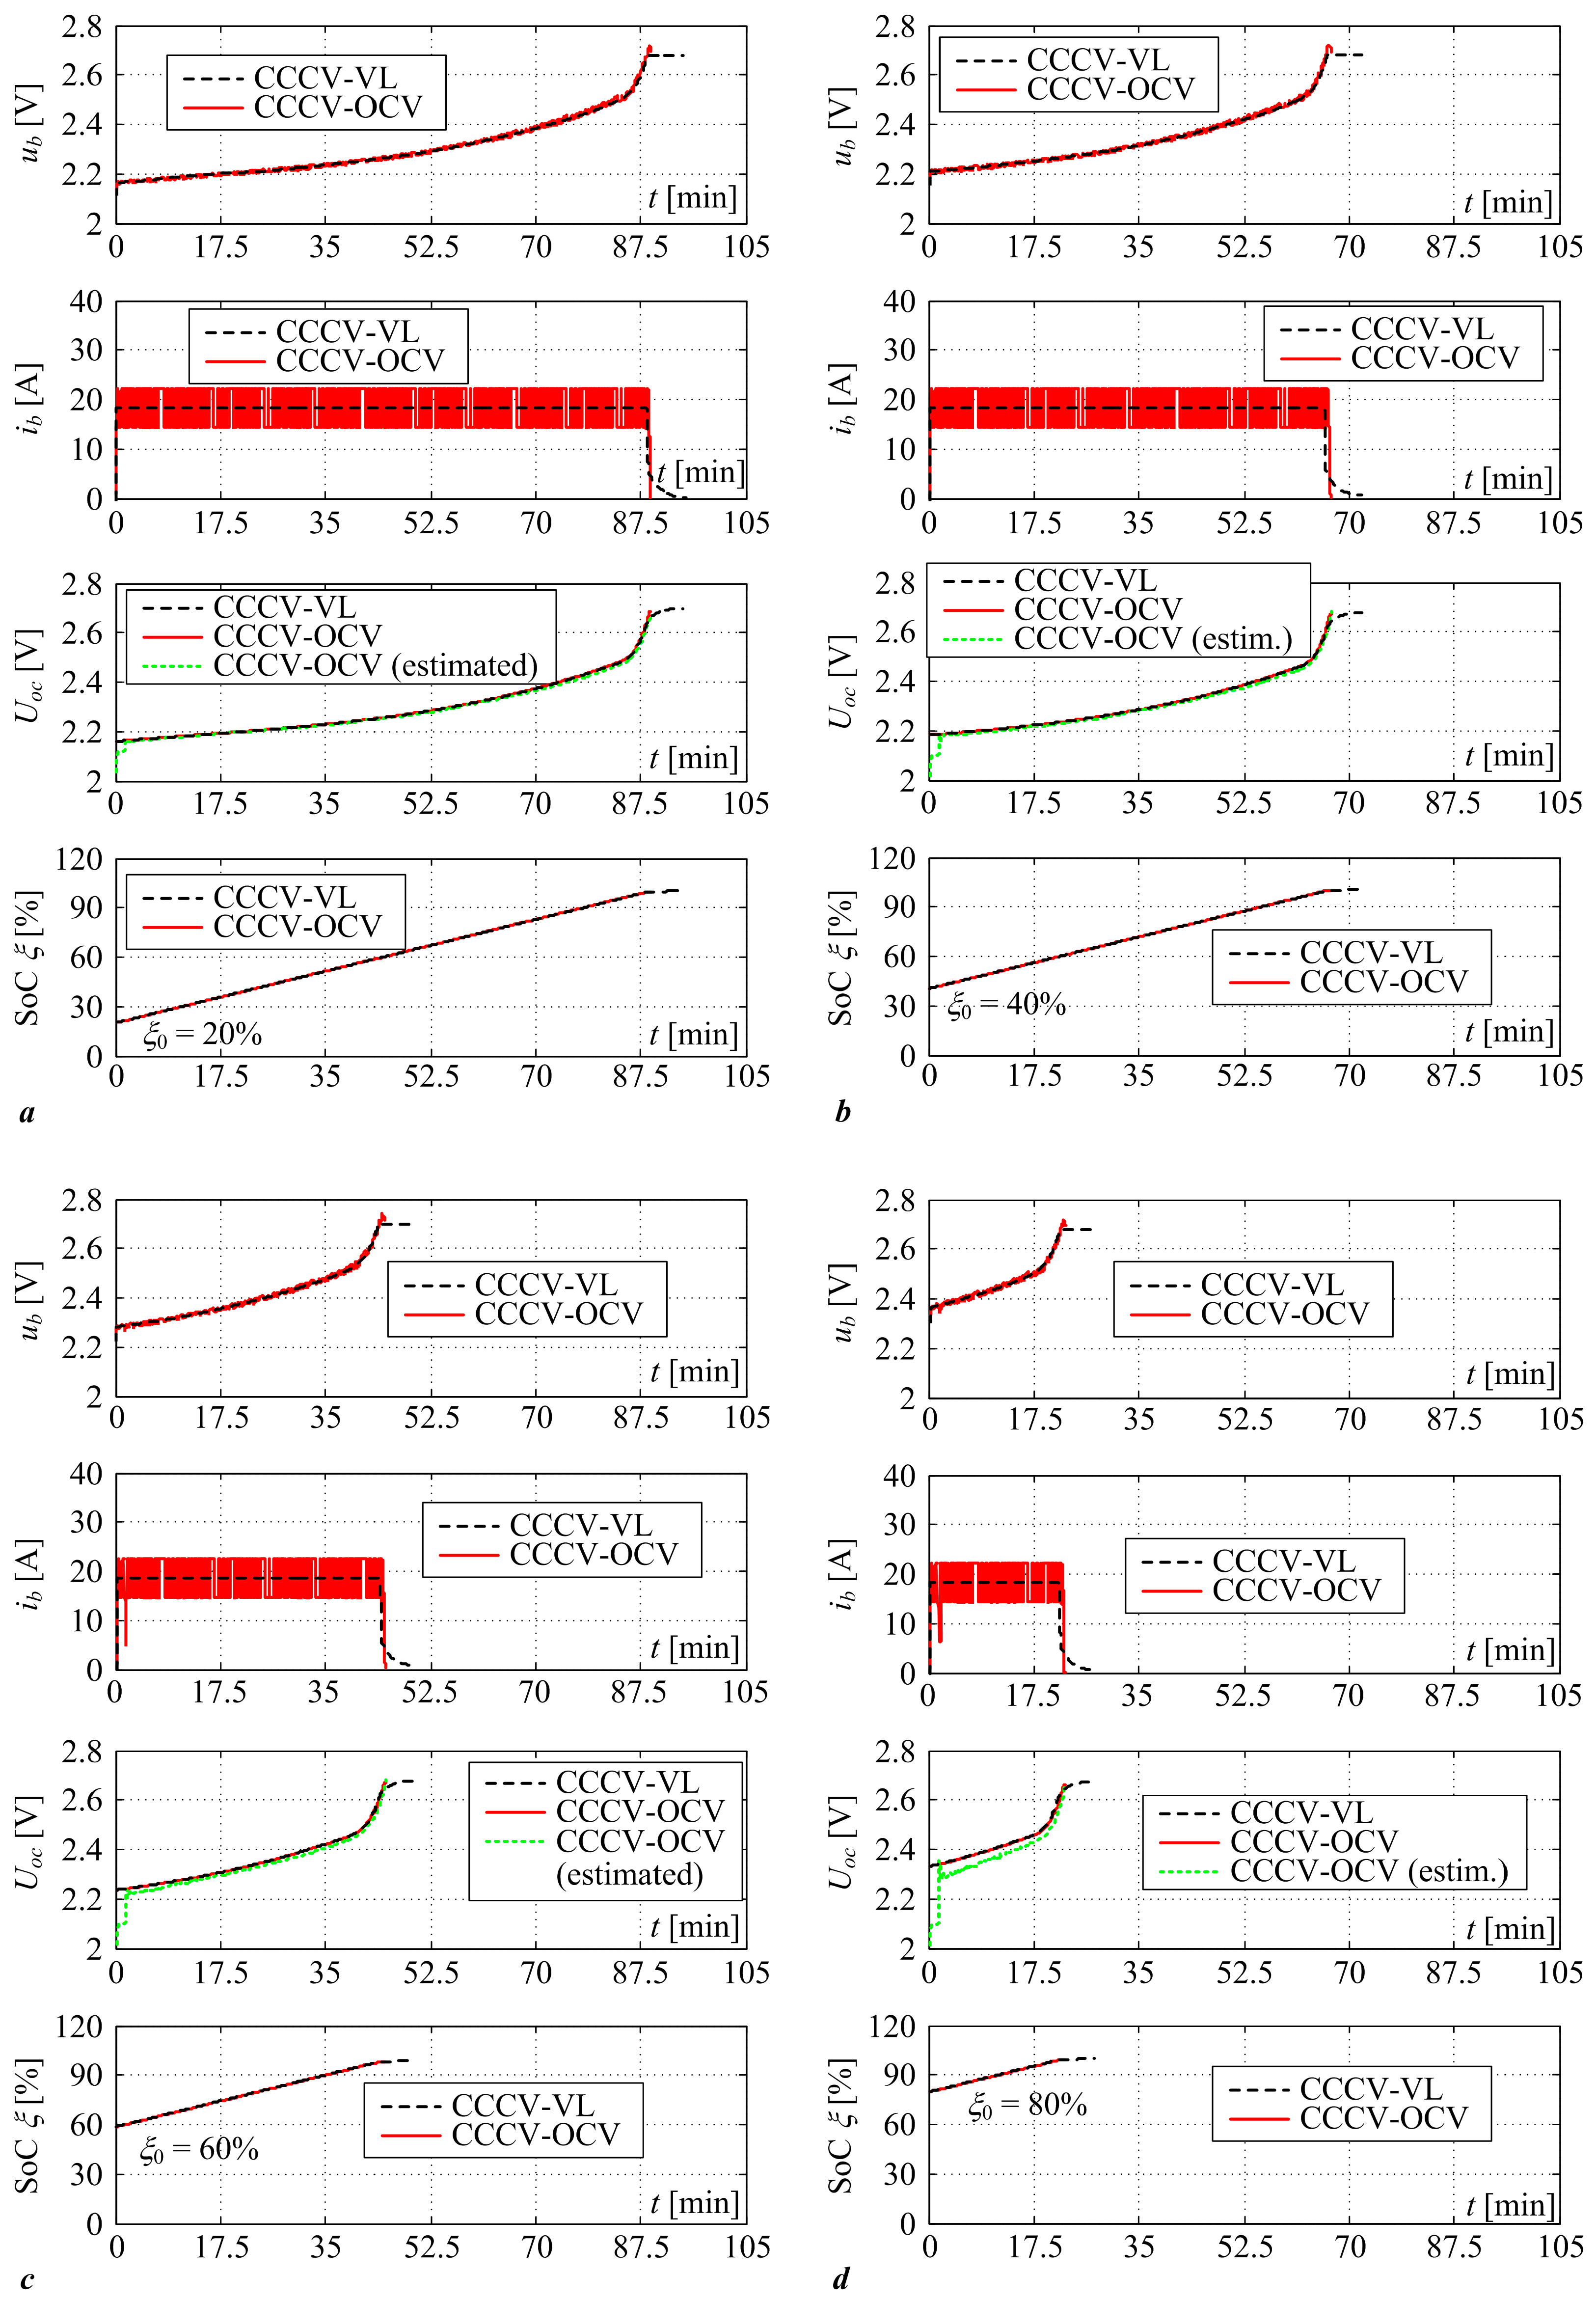
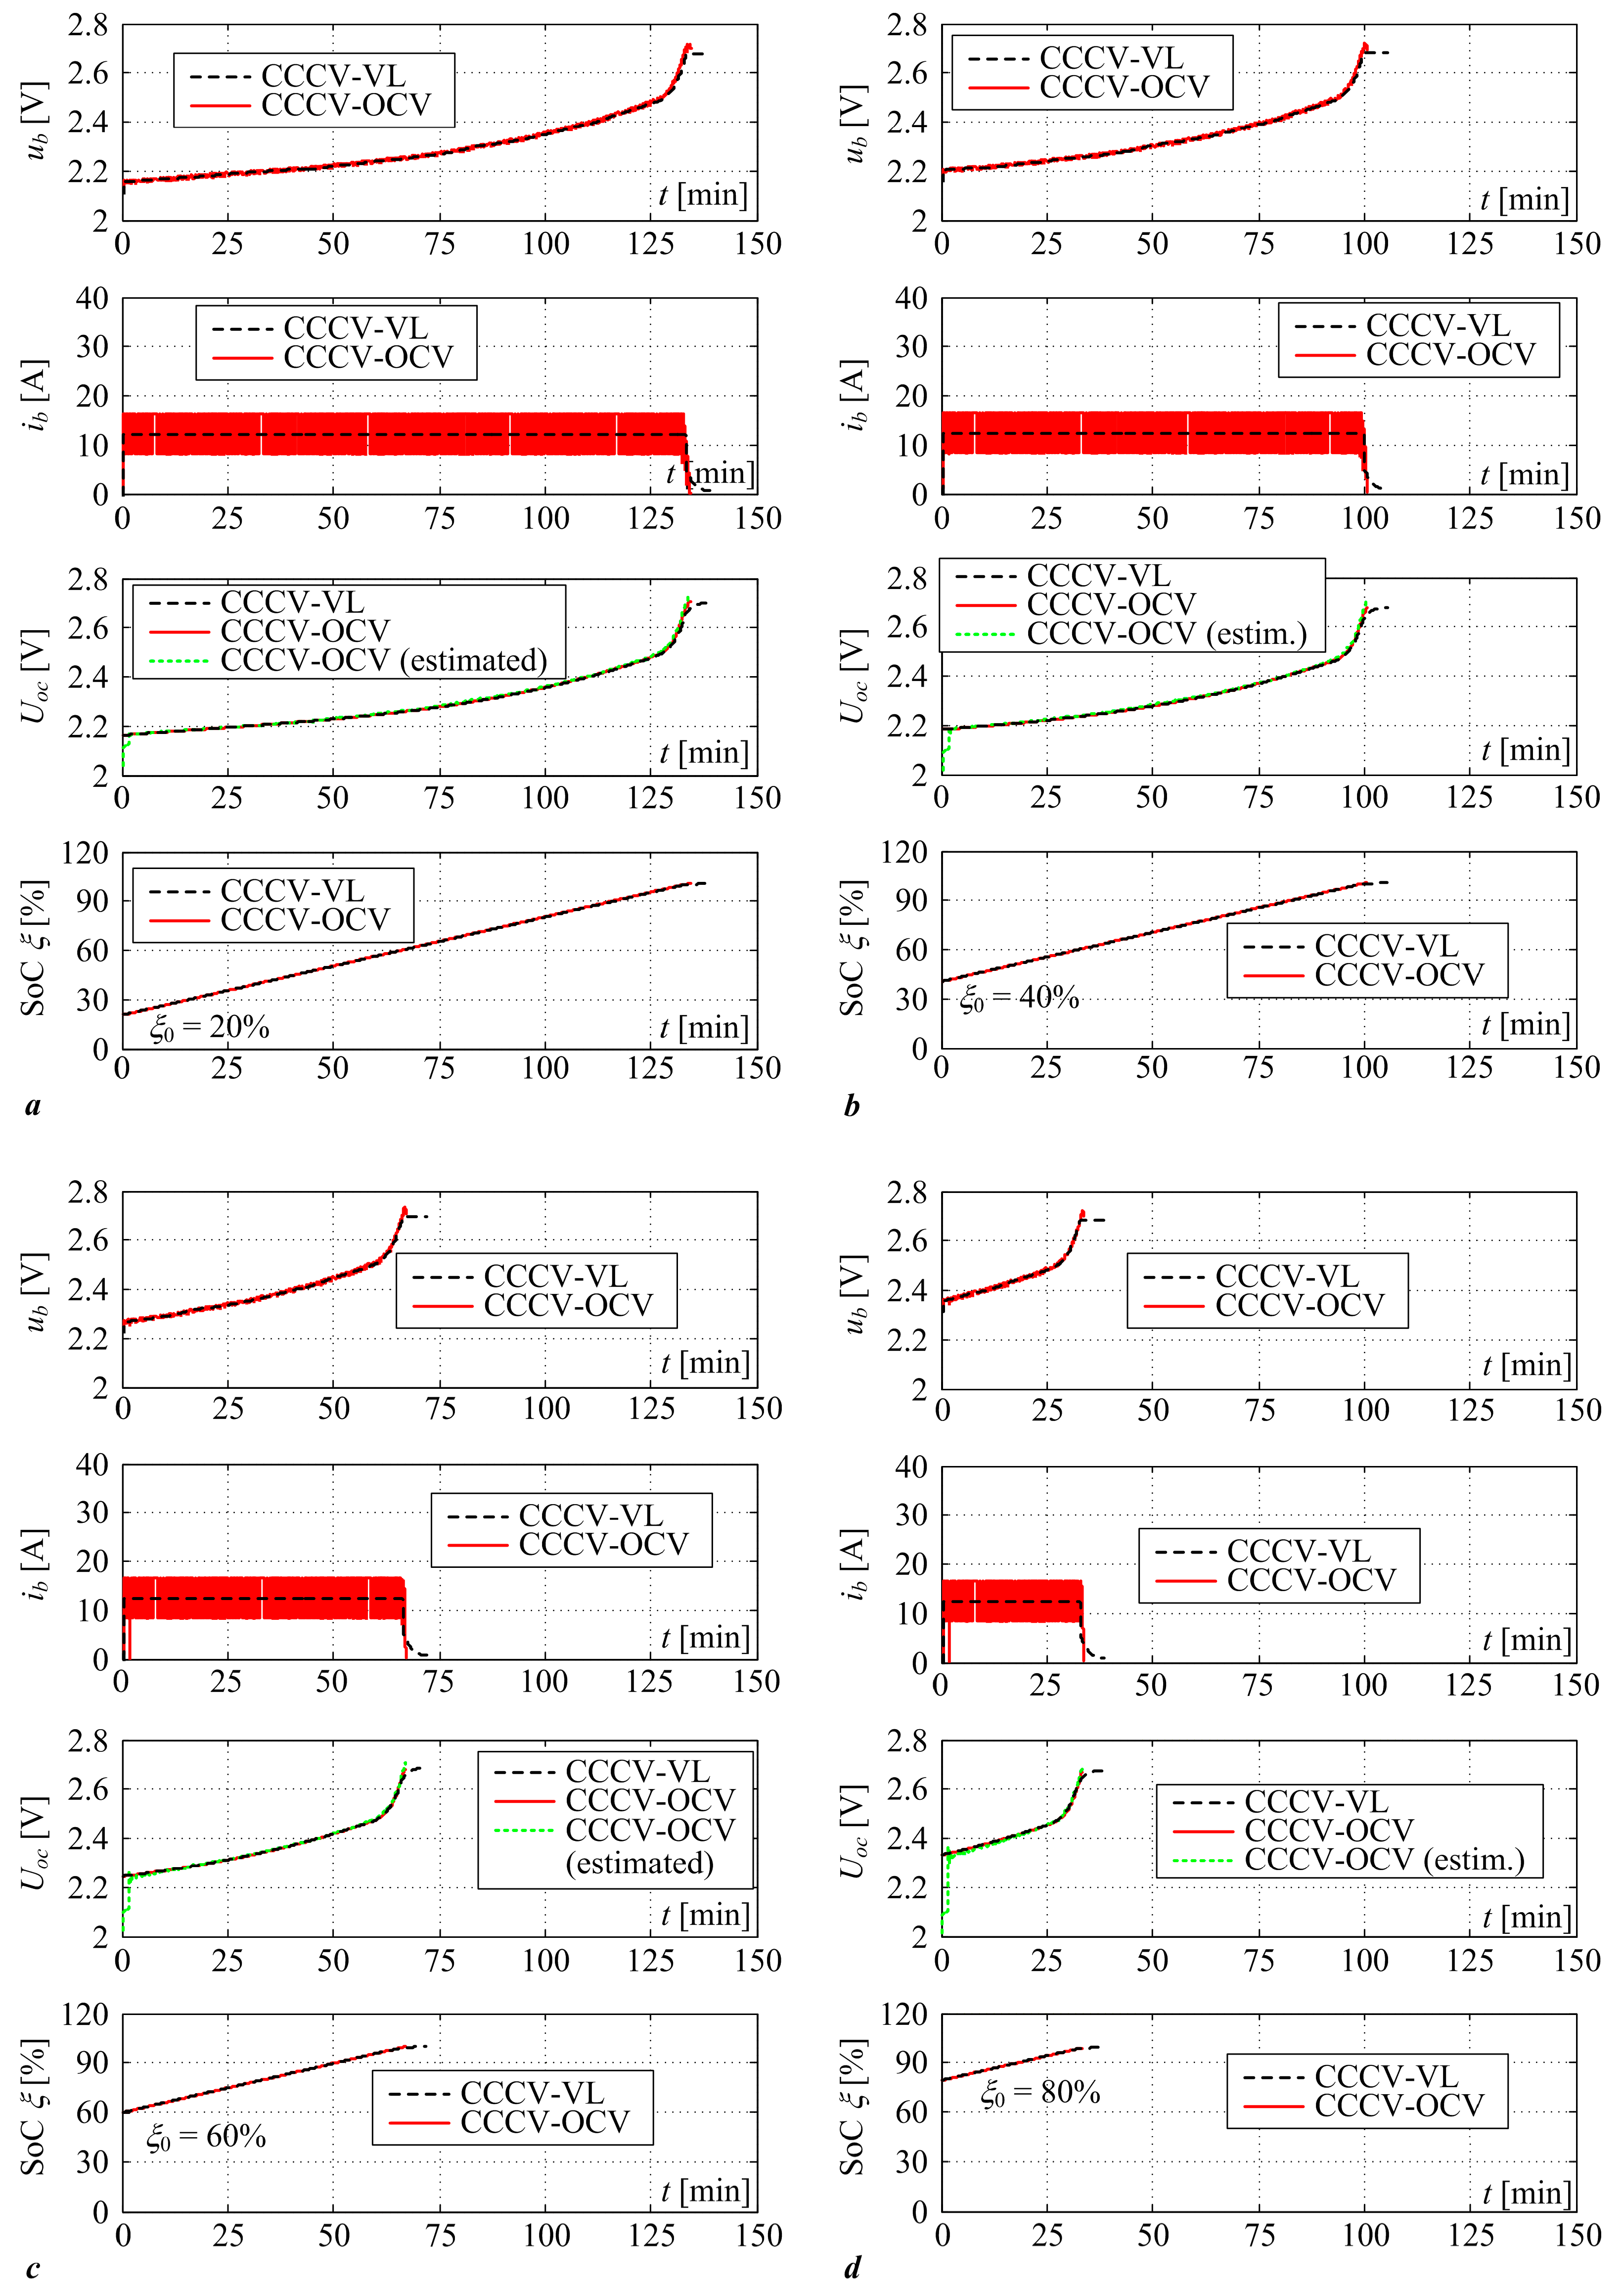
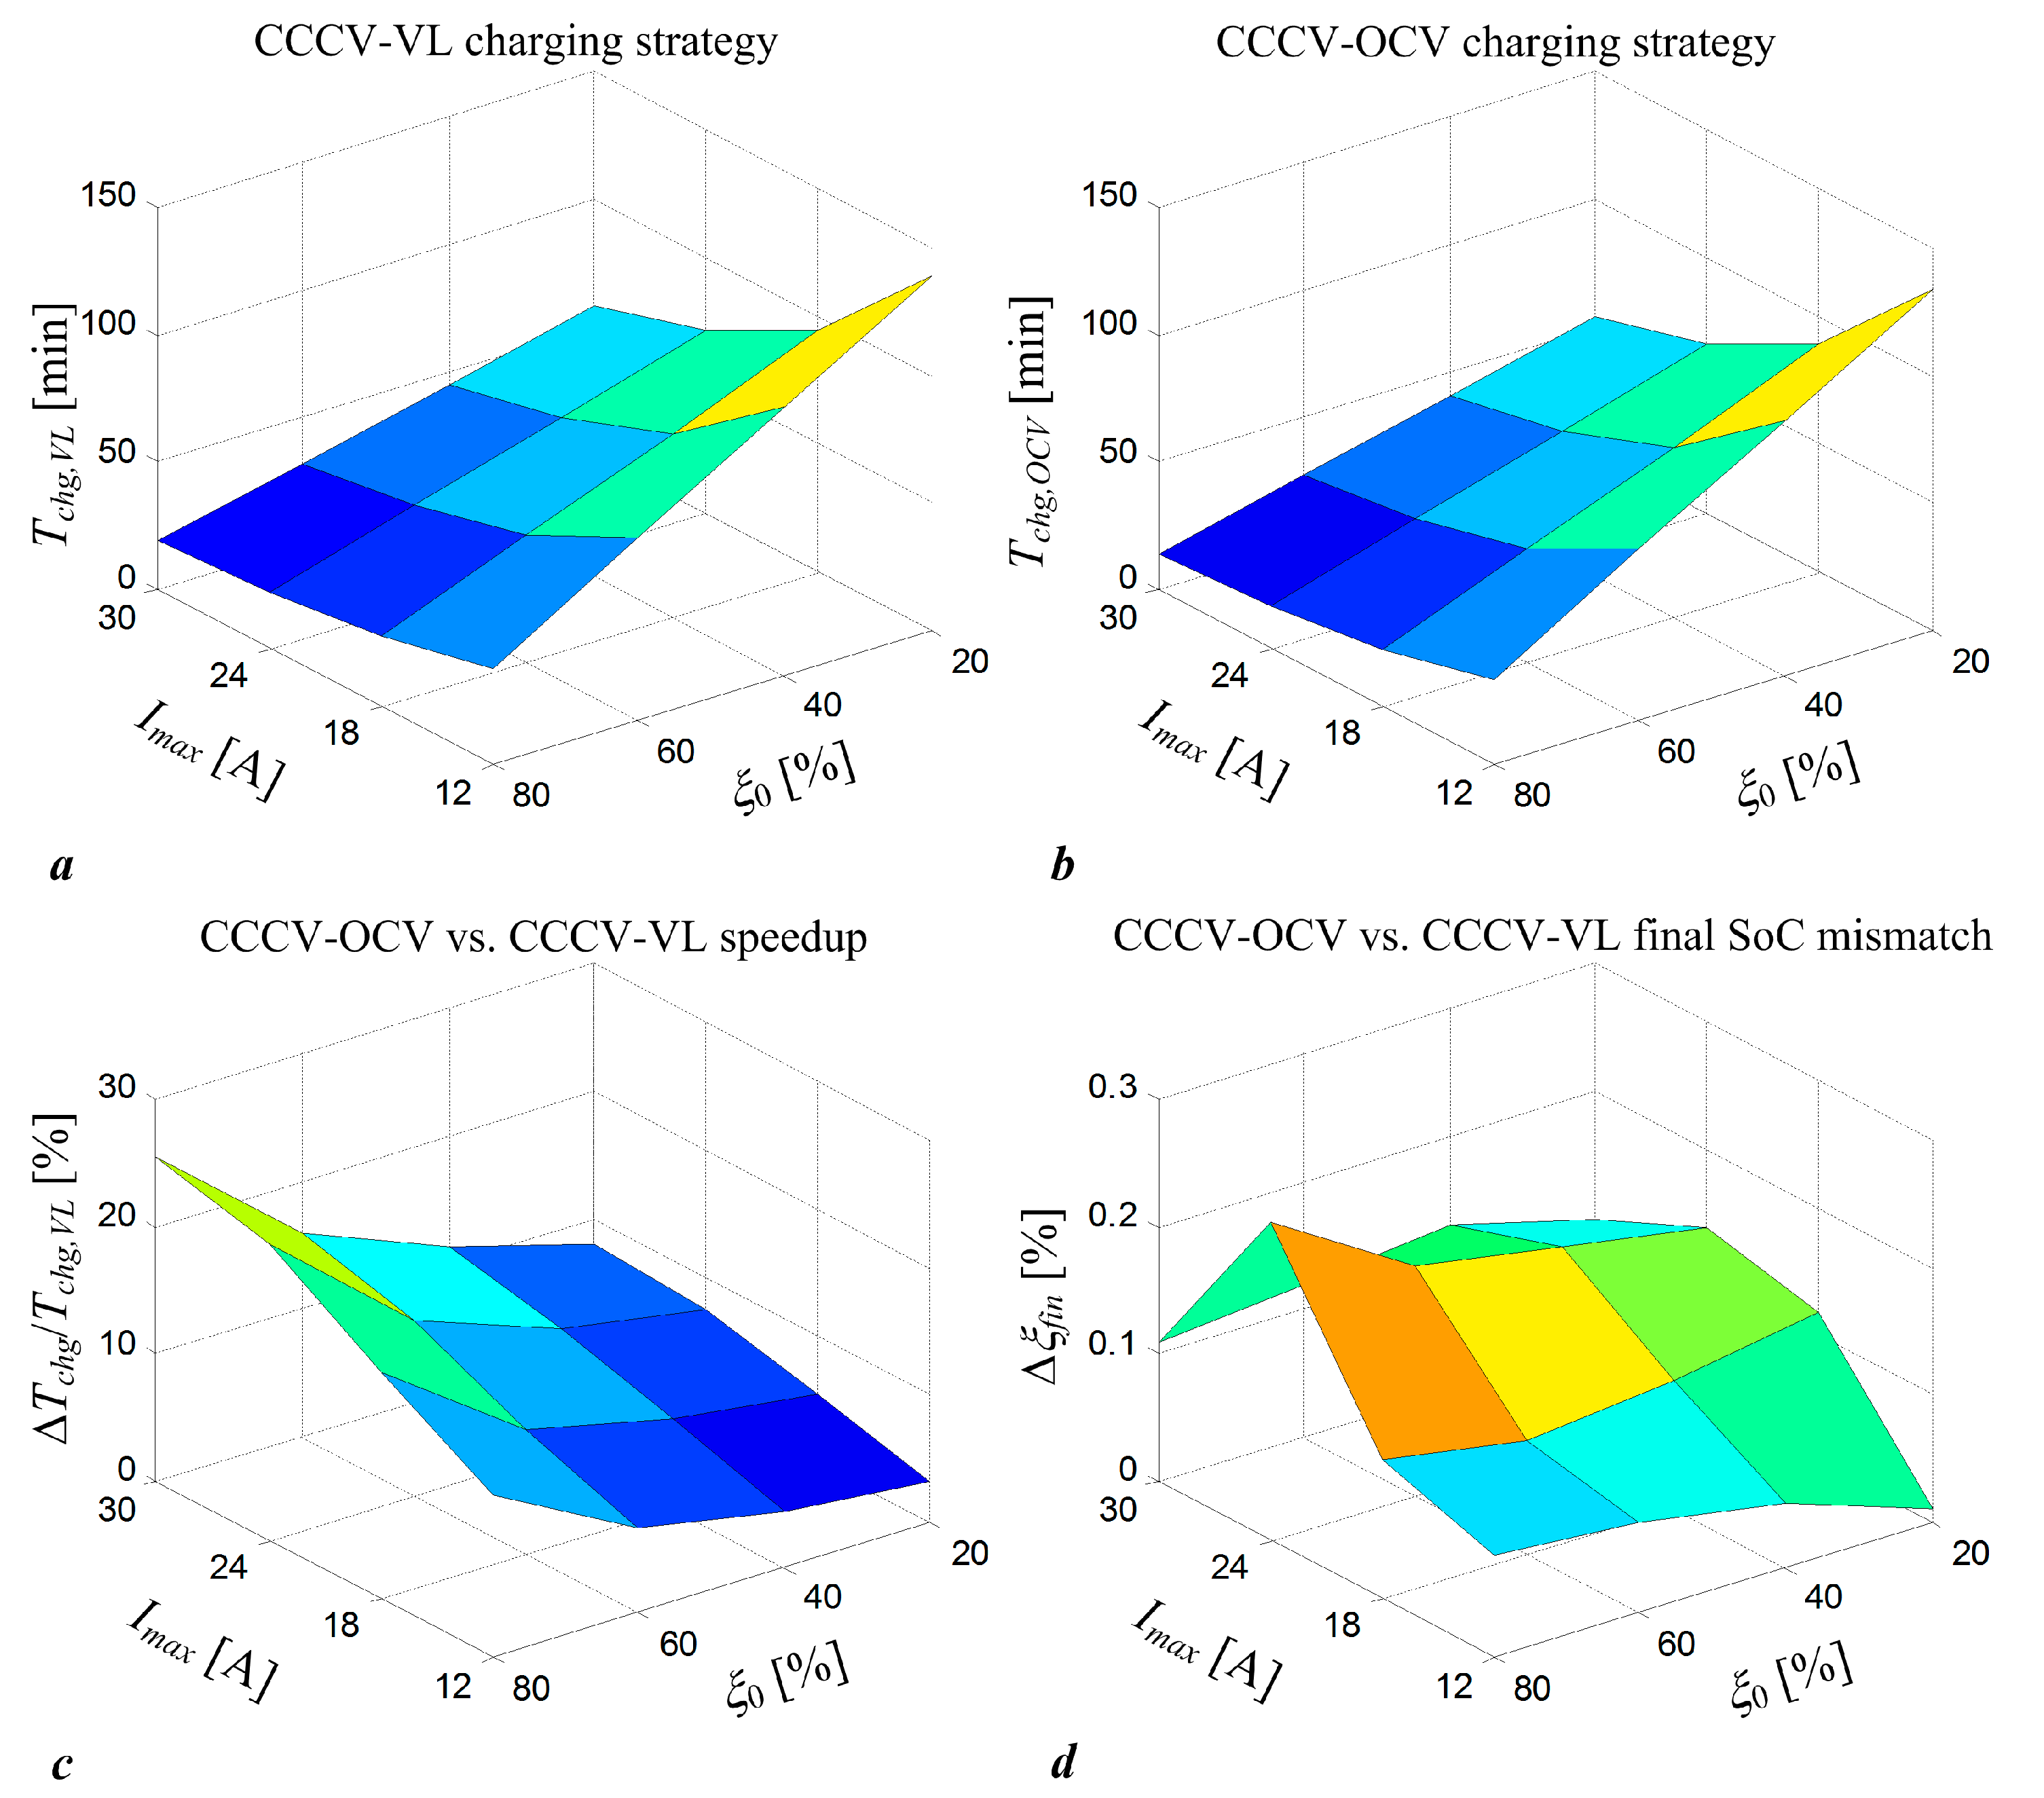
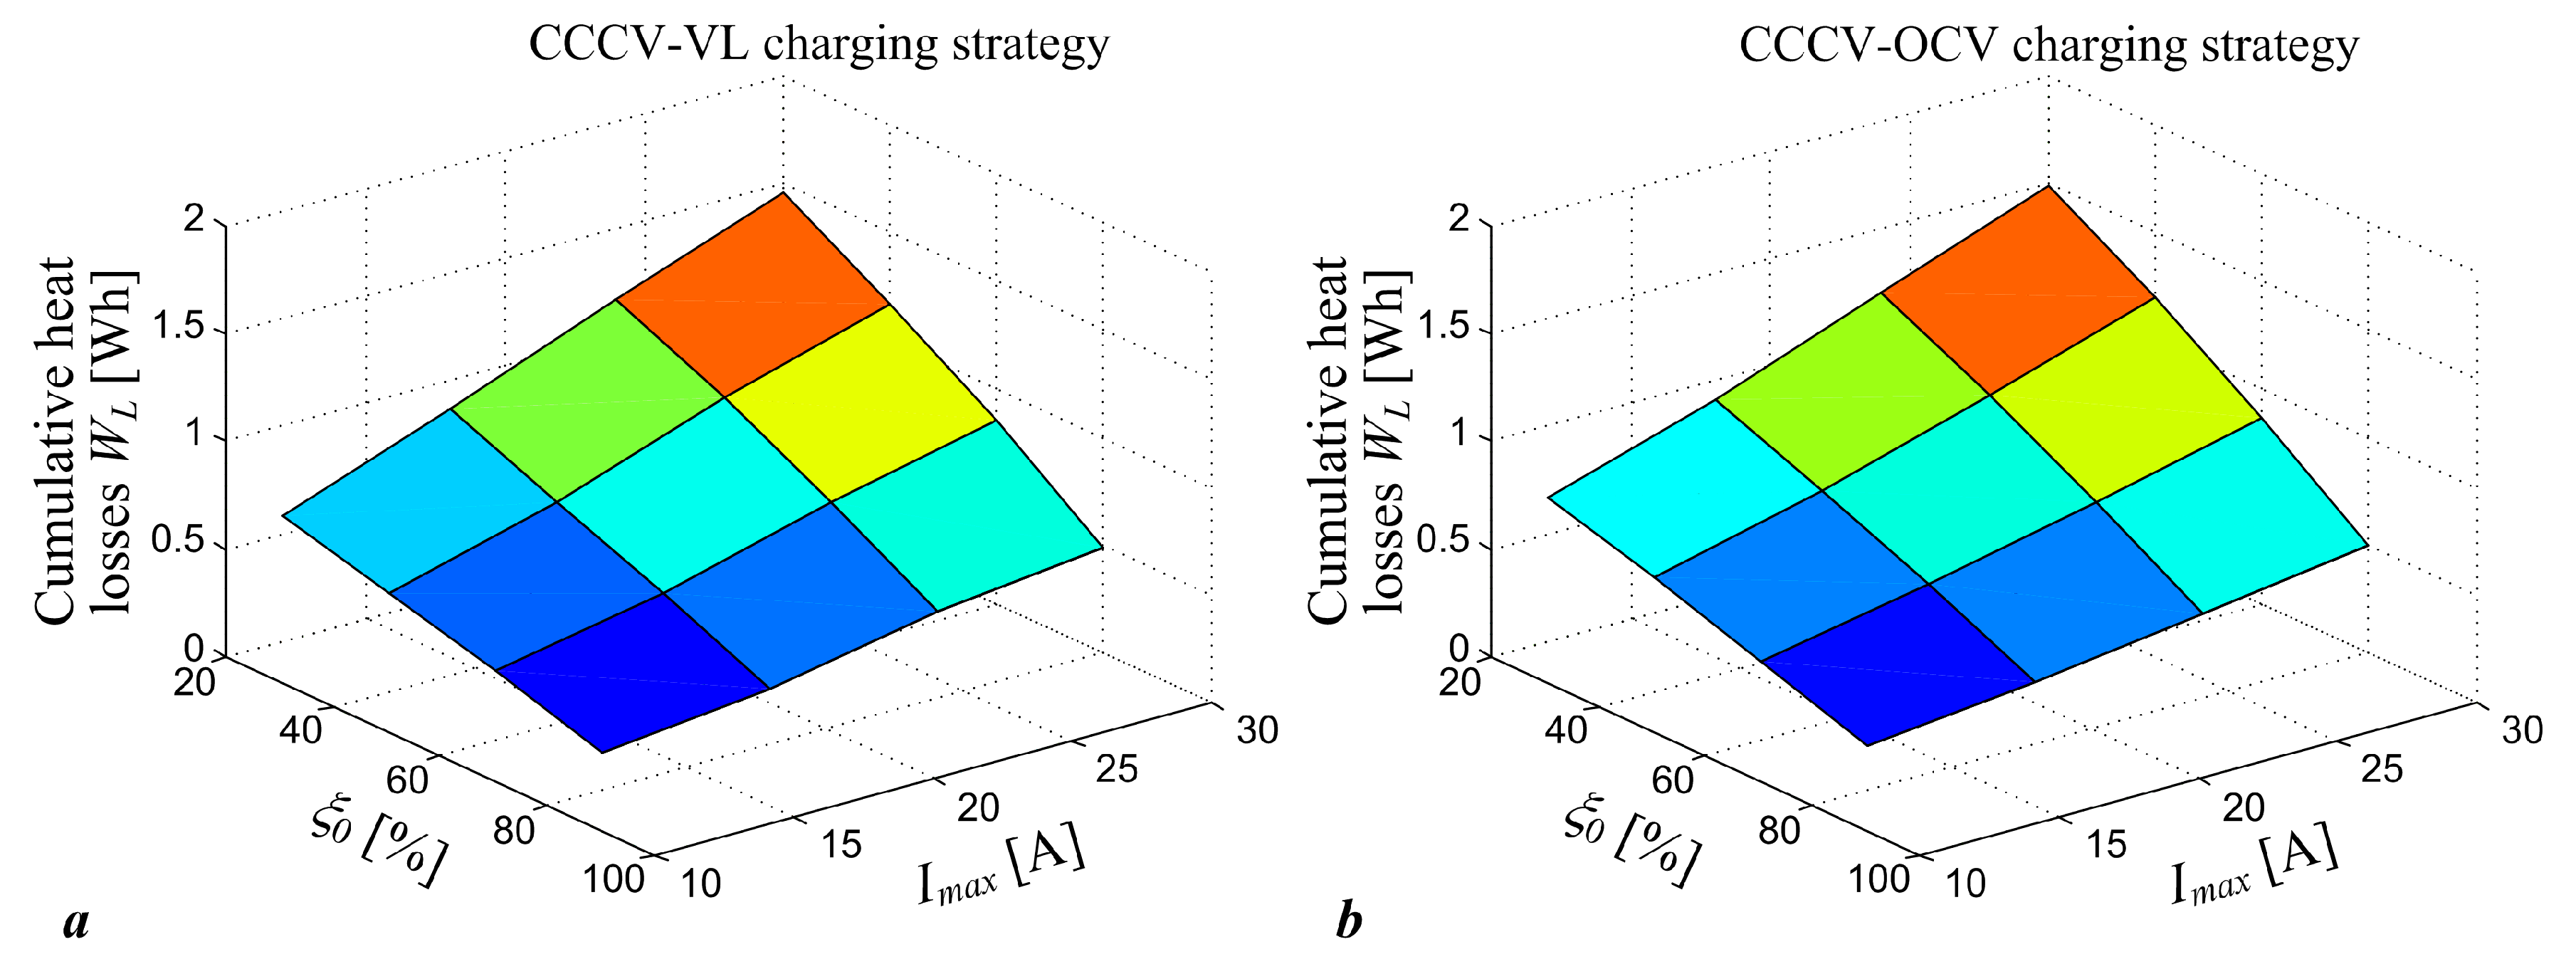
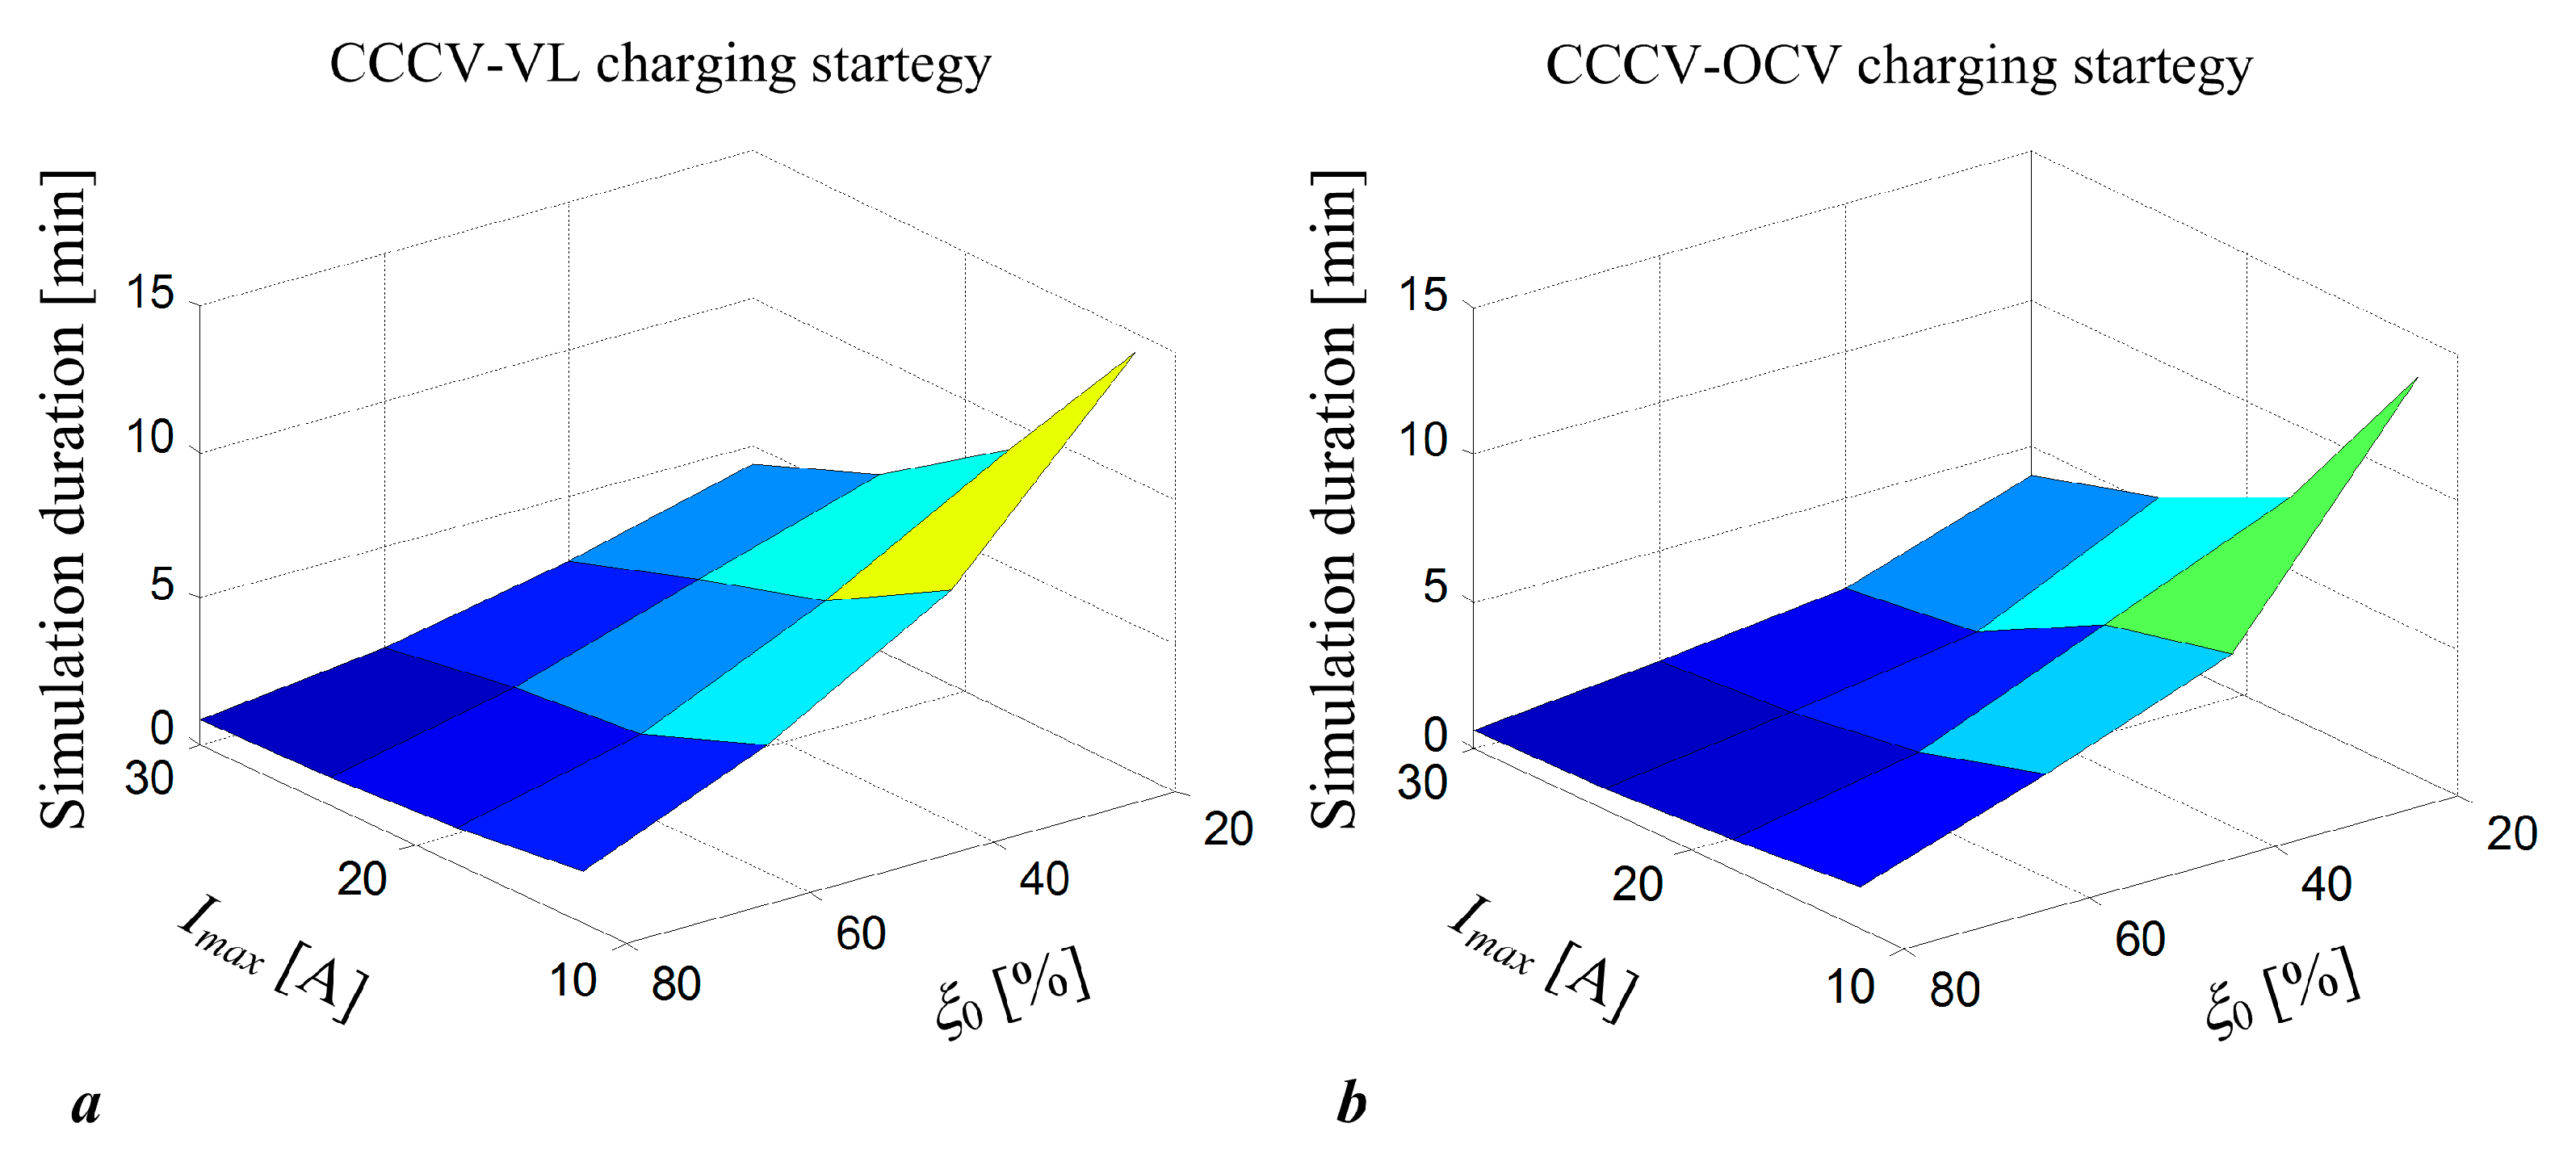
3.1. Results of Comparative Simulation Assessment of Proposed Strategies
3.2. Results of Experimental Verification
3.3. Discussion
4. Conclusions
Author Contributions
Funding
Data Availability Statement
Conflicts of Interest
Abbreviations and Symbols
| Ah | Ampere-hour (charge capacity unit) |
| C | Battery constant-current rating for the case of 1 h charge/discharge with respect to nominal battery capacity |
| CCCV | Constant-current/constant voltage (charging regime) |
| CCCV-VL | CCCV charging control with battery voltage limiting |
| CCCV-OCV | CCCV charging control with SoC reference and battery voltage limiting |
| DC | Direct current |
| DC/DC | Direct current to direct current (power conversion) |
| EKF | Extended Kalman filter |
| LiFePO4 | Lithium iron phosphate (battery cell technology) |
| LTO | Lithium titanate (battery cell technology) |
| PI | Proportional-integral (controller) |
| PRBS | Pseudo-random binary sequence |
| PWM | Pulse-width modulation |
| RAM | Random Access Memory |
| RMS | Root mean squared (circuit breaker tripping current value) |
| SoC | State-of-charge |
| SoH | State-of-health |
| SRAM | System Reference Adaptive Model |
| elim | Voltage-limiting PI controller control error input |
| em | SRAM model error |
| ib, ibs | Battery current and battery current measurement |
| ibR | Battery current reference from open circuit voltage controller |
| ibRt | Total battery current reference |
| iblim | Battery current limiting command |
| ibf | Filtered battery current as SRAM model input |
| Imax | Charging strategy upper current limit |
| Imin | Charging strategy lower current limit (end-of-charging threshold) |
| s | Laplace operator |
| Tchg | Charging time |
| Tchg,VL, Tchg,OCV | CCCV-VL and CCCV-OCV strategy charging time, respectively |
| ubfin | Battery terminal voltage final value after charging (with ib = 0) |
| ublim | Battery terminal voltage limit value |
| Uoc, | Battery open-circuit voltage and its estimate |
| ub, ubs | Battery terminal voltage and its measurement |
| ubf | Filtered battery voltage as SRAM estimator input |
| up | Battery polarization voltage |
| ∆ibR | PRBS test signal introduced in the battery current reference |
| ∆Tchg | Charging time difference between CCCV-VL and CCCV-OCV strategy |
| ∆ξfin | Final SoC mismatch between the CCCV-VL and CCCV-OCV strategy |
| ξ0 | Battery initial state-of-charge |
| ξfin | Battery final state-of-charge |
| ξfin,VL, ξfin,OCV | CCCV-VL and CCCV-OCV strategy final SoC values, respectively |
| a0*, b1*, b0* | Parameters of the battery equivalent circuit transfer function model |
| a0, b1, b0, w | Parameters of the normalized battery equivalent circuit model |
| a0m, b1m, b0m, wm | Battery model parameters within SRAM estimator |
| D2, …, Dn | Damping optimum characteristic ratios |
| D2l | Damping optimum characteristic ratio D2 in voltage PI controller design |
| D2u, D3u | Damping optimum characteristic ratios in OCV PI controller design |
| Kcl, Kcu | Proportional gains of PI controllers for voltage limiting and OCV |
| Tcl, Tcu | Integral time constants of PI controllers for voltage limiting and OCV |
| K1, K2, K3, K4 | Adaptation gains within the SRAM parameter estimator |
| Kuξ | Gradient of the OCV vs. SoC characteristic |
| Qb, Rb | Battery charge capacity and internal resistance |
| Rp, Cp | Battery polarization resistance and capacitance, respectively |
| Te | Equivalent closed-loop time constant (damping optimum criterion) |
| Tei | Equivalent time constant of the inner current control loop |
| Tel | Equivalent time constant of the voltage-limiting control system design |
| Teu | Equivalent time constant in open-circuit voltage control system design |
| Tfm | Current and voltage sensor time constant |
| Tf | Time constant of battery voltage and current SRAM model input filter |
| TΣu | Parasitic time constant in voltage-limiting/OCV PI controller designs |
| Uoc(ξ) | OCV vs. SoC characteristic in battery equivalent circuit model |
| ϑb | Battery temperature |
| τp | Battery polarization voltage time constant |
| ζ | Damping ratio |
| Estimated value | |
| D | Freewheeling diode within buck converter |
| Q | MOSFET switch within buck converter |
References
- Victoria, M.; Zhu, K.; Brown, T.; Andresen, G.B.; Greiner, M. The role of storage technologies throughout the decarbonisation of the sector-coupled European energy system. Energy Convers. Manag. 2019, 201, 111977. [Google Scholar] [CrossRef]
- Barone, G.; Buonomano, A.; Del Papa, G.; Maka, R.; Palombo, A. Approaching zero emissions in ports: Implementation of batteries and supercapacitors with smart energy management in hybrid ships. Energy Convers. Manag. 2024, 314, 118446. [Google Scholar] [CrossRef]
- Zhang, N.; Lu, Y.; Kadam, S.; Yu, Z. Investigation of the integrated fuel cell, battery, and heat pump energy systems. Energy Convers. Manag. 2023, 276, 116503. [Google Scholar] [CrossRef]
- Chen, Y.; Hu, Z. Computational Fluid Dynamic Modeling of Pack-Level Battery Thermal Management Systems in Electric Vehicles. Energies 2025, 18, 484. [Google Scholar] [CrossRef]
- Jin, L.; Rossi, M.; Monforti Ferrario, A.; Alberizzi, J.C.; Renzi, M.; Comodi, G. Integration of battery and hydrogen energy storage systems with small-scale hydropower plants in off-grid local energy communities. Energy Convers. Manag. 2023, 286, 117019. [Google Scholar] [CrossRef]
- Touré, I.; Payman, A.; Camara, M.B.; Dakyo, B. Control Strategy of a Multi-Source System Based on Batteries, Wind Turbines, and Electrolyzers for Hydrogen Production. Energies 2025, 18, 2825. [Google Scholar] [CrossRef]
- Quintana, J.A.; Bordons, C.; Esteban, S.; Delgado, J. Hybrid Powerplant Design and Energy Management for UAVs: Enhancing Autonomy and Reducing Operational Costs. Energies 2025, 18, 3101. [Google Scholar] [CrossRef]
- Campana, P.E.; Cioccolanti, L.; François, B.; Jurasz, J.; Zhang, Y.; Varini, M.; Stridh, B.; Yan, J. Li-ion batteries for peak shaving, price arbitrage, and photovoltaic self-consumption in commercial buildings: A Monte Carlo Analysis. Energy Convers. Manag. 2021, 234, 113889. [Google Scholar] [CrossRef]
- Menale, C.; Constà, S.; Sglavo, V.; Della Seta, L.; Bubbico, R. Experimental Investigation of Overdischarge Effects on Commercial Li-Ion Cells. Energies 2022, 15, 8440. [Google Scholar] [CrossRef]
- Sandhya, C.P.; John, B.; Gouri, C. Lithium titanate as anode material for lithium-ion cells: A review. Ionics 2014, 20, 601–620. [Google Scholar] [CrossRef]
- Zhao, L.; Pan, H.-L.; Hu, Y.-S.; Li, H.; Chen, L.-Q. Spinel lithium titanate (Li4Ti5O12) as novel anode material for room-temperature sodium-ion battery. Chin. Phys. B 2012, 21, 028201. [Google Scholar] [CrossRef]
- Zhang, X.; Peng, H.; Wang, H.; Ouyang, M. Hybrid lithium iron phosphate battery and lithium titanate battery systems for electric buses. IEEE Trans. Veh. Technol. 2018, 67, 956–965. [Google Scholar] [CrossRef]
- Atalay, S.; Sheikh, M.; Mariani, A.; Merla, Y.; Bower, E.; Widanage, W.D. Theory of battery ageing in a lithium-ion battery: Capacity fade, nonlinear ageing and lifetime prediction. J. Power Sources 2020, 478, 229026. [Google Scholar] [CrossRef]
- Nemeth, T.; Schröer, P.; Kuipers, M.; Sauer, D.U. Lithium titanate oxide battery cells for high-power automotive applications—Electro-thermal properties, aging behavior and cost considerations. J. Energy Storage 2020, 31, 101656. [Google Scholar] [CrossRef]
- Szumanowski, A.; Chang, Y. Battery management system based on battery nonlinear dynamics modeling. IEEE Trans. Veh. Technol. 2008, 57, 1425–1432. [Google Scholar] [CrossRef]
- Shabani, M.; Dahlquist, E.; Wallin, F.; Yan, J. Techno-economic impacts of battery performance models and control strategies on optimal design of a grid-connected PV system. Energy Convers. Manag. 2021, 245, 114617. [Google Scholar] [CrossRef]
- Katrašnik, T.; Mele, I.; Zelič, K. Multi-scale modelling of lithium-ion batteries: From transport phenomena to the outbreak of thermal runaway. Energy Convers. Manag. 2021, 236, 114036. [Google Scholar] [CrossRef]
- Wang, J.; Cao, B.; Chen, Q.; Wang, F. Combined state of charge estimator for electric vehicle battery pack. Control Eng. Pract. 2007, 15, 1569–1576. [Google Scholar] [CrossRef]
- Plett, G.L. Extended Kalman Filtering for Battery Management Systems of LiPB-based HEV Battery Packs—Part 3: State and Parameter Estimation. J. Power Sources 2004, 134, 262–277. [Google Scholar] [CrossRef]
- He, H.; Xiong, R.; Guo, H. Online estimation of model parameters and state-of-charge of LiFePO4 batteries in electric vehicles. Appl. Energy 2012, 89, 413–420. [Google Scholar] [CrossRef]
- Ceraolo, M.; Lutzemberger, G.; Huria, T. Experimentally-Determined Models for High-Power Lithium Batteries. In Proceedings of the 2011 SAE World Congress, Detroit, MI, USA, 12–14 April 2011. [Google Scholar] [CrossRef]
- Pavković, D.; Krznar, M.; Komljenović, A.; Hrgetić, M.; Zorc, D. Dual EKF-based State and Parameter Estimator for a LiFePO4 Battery Cell. J. Power Electron. 2017, 17, 398–410. [Google Scholar] [CrossRef]
- Mastali, M.; Vasquez-Arenas, J.; Fraser, R.; Fowler, M.; Afshar, S.; Stevens, M. Battery state of charge estimation using Kalman filtering. J. Power Sources 2013, 239, 294–307. [Google Scholar] [CrossRef]
- Kvaternik, K.; Pavković, D.; Kozhushko, Y.; Cipek, M. Extended Kalman Filter Design for State-of-Charge Estimation of a Lithium-Titanate Battery Cell. In Proceedings of the 2022 International Conference on Smart Systems and Technologies (SST), Osijek, Croatia, 19–21 October 2022; pp. 249–254. [Google Scholar] [CrossRef]
- Schröer, P.; Khoshbakht, E.; Nemeth, T.; Kuipers, M.; Zappen, M.; Sauer, D.U. Adaptive modeling in the frequency and time domain of high-power lithium titanate oxide cells in battery management systems. J. Energy Storage 2020, 32, 101966. [Google Scholar] [CrossRef]
- Pavković, D.; Komljenović, A.; Hrgetić, M.; Krznar, M. Experimental Characterization and Development of a SoC/SoH Estimator for a LiFePO4 Battery Cell. In Proceedings of the IEEE EUROCON 2015, Salamanca, Spain, 8–11 September 2015; pp. 397–402. [Google Scholar] [CrossRef]
- Pavković, D.; Kasać, J.; Krznar, M.; Cipek, M. Adaptive Constant-Current/Constant-Voltage Charging of a Battery Cell Based on Cell Open-Circuit Voltage Estimation. World Electr. Veh. J. 2023, 14, 155. [Google Scholar] [CrossRef]
- Rao, G.P.; Unbehauen, H. Identification of continuous-time systems. IEE Proc.-Control Theory Appl. 2006, 153, 185–220. [Google Scholar] [CrossRef]
- Tian, N.; Fang, H.; Wang, Y. Real-Time Optimal Lithium-Ion Battery Charging Based on Explicit Model Predictive Control. IEEE Trans. Ind. Inform. 2021, 17, 1318–1330. [Google Scholar] [CrossRef]
- Pozzi, A.; Barbierato, E.; Toti, D. Optimizing Battery Charging Using Neural Networks in the Presence of Unknown States and Parameters. Sensors 2023, 23, 4404. [Google Scholar] [CrossRef] [PubMed]
- Mousaei, A.; Naderi, Y.; Bayram, I.S. Advancing State of Charge Management in Electric Vehicles with Machine Learning: A Technological Review. IEEE Access 2024, 12, 43255–43283. [Google Scholar] [CrossRef]
- Lee, S.-H. Performance Evaluation of Machine Learning and Deep Learning-Based Models for Predicting Remaining Capacity of Lithium-Ion Batteries. Appl. Sci. 2023, 13, 9127. [Google Scholar] [CrossRef]
- Adaikkappan, M.; Sathiyamoorthy, N. Modeling, state of charge estimation, and charging of lithium-ion battery in electric vehicle: A review. Int. J. Energy Res. 2022, 46, 2141–2165. [Google Scholar] [CrossRef]
- Jenkins, B.; Krupadanam, A.; Annaswamy, A.M. Fast adaptive observers for battery management systems. IEEE Trans. Control Syst. Technol. 2019, 28, 776–789. [Google Scholar] [CrossRef]
- Pavković, D.; Premec, A.; Krznar, M.; Cipek, M. Current and voltage control system designs with EKF-based state-of-charge estimator for the purpose of LiFePO4 battery cell charging. Optim. Eng. 2022, 23, 2335–2363. [Google Scholar] [CrossRef]
- Ceraolo, M. New Dynamical Models of Lead-Acid Batteries. IEEE Trans. Power Syst. 2000, 15, 1184–1190. [Google Scholar] [CrossRef]
- ELERIX EX-30TK Extreme Power LTO Cell, VDA Size 173/100, Technical Specification. Available online: https://faktor.de/out/media/ELERIX-EX-T30K-QuickDatasheet.pdf (accessed on 22 July 2025).
- Pavković, D.; Kvaternik, K.; Cipek, M.; Krznar, M. State-of-charge estimator design and experimental verification for a lithium-titanate battery cell. Clean Technol. Environ. Policy 2025, 27, 1599–1615. [Google Scholar] [CrossRef]
- Schröder, D. Elektrische Antriebe—Regelung von Antriebssystemen, 3rd ed.; Springer: Berlin, Germany, 2007. [Google Scholar]
- Hussein, A.A.H.; Batarseh, I. A review of charging algorithms for Nickel and Lithium battery chargers. IEEE Trans. Veh. Technol. 2011, 60, 830–838. [Google Scholar] [CrossRef]
- Chen, M.; Rincón-Mora, G.A. Accurate, compact, and power-efficient Li-ion battery charger circuit. IEEE Trans. Circuits Syst. II Express Briefs 2006, 53, 1180–1184. [Google Scholar] [CrossRef]
- Naslin, P. Essentials of Optimal Control; Illife Books Ltd.: London, UK, 1968. [Google Scholar]
- Advantech Co., Ltd. PCL-812PG: 30 kS/s, 12-Bit, 16-ch ISA Multifunction Card. Available online: https://advdownload.advantech.com/productfile/Downloadfile/1-32BI8A/PCL-812PG_DS.pdf (accessed on 15 May 2025).
- SIGLENT Technologies Co., Ltd. SPS5000X DC Power Supplies, User Manual. Available online: https://www.siglent.eu/product/4776093/siglent-sps5041x-40v-30a-360w-1ch-switch-mode-power-supply (accessed on 15 May 2025).
- ON Semiconductor. RURG80100: Ultrafast Diode 80A/1000V, Data Sheet. Available online: https://www.onsemi.com/pdf/datasheet/rurg80100-d.pdf (accessed on 15 May 2025).
- PR Electronics A/S. Isolated Converter Type 3104 for Isolation and Conversion of Standard DC Signal. Available online: https://www.prelectronics.com/products/isolation/3100/isolated-converter-3104/ (accessed on 15 May 2025).


| Parameter | Value |
|---|---|
| Battery and current sensor time constant Tfm | 5 ms |
| LTO battery cell charge capacity Qb | 30 Ah |
| Battery charging current 1C rated value | 30 A |
| Charging strategy current maximum values Imax used in the simulation study | 30 A, 24 A, 18 A, 12 A (1C, 0.8C, 0.6C, 0.4C) |
| Charging strategy turn-off current Imin | 0.3 A (0.01C) |
| PRBS test signal peak-to-peak amplitude | 8 A (±4 A) |
| Battery state-of-charge initial conditions ξ0 | 20%, 40%, 60%, 80% |
| CCCV-VL battery terminal voltage limit ublim | 2.68 V |
| CCCV-OCV battery terminal voltage limit ubmax | 2.72 V |
| Battery OCV target value UocR | 2.68 V |
| Current control loop lag Tei | 21.8 ms |
| Voltage-limiting controller gain Kcl | 111.11 |
| Voltage-limiting controller time constant Tcl | 5.5 ms |
| OCV controller gain Kcu | 2870 |
| OCV controller time constant Tcu | 120 s |
| SRAM model adaptation gain K1 | 0.05 |
| SRAM model adaptation gain K2 | 0.05 |
| SRAM model adaptation gain K3 | 0.0001 |
| SRAM model adaptation gain K4 | 0.1 |
| SRAM model input filter time constant Tf | 1.0 s |
| ξ0 = 20% | ξ0 = 40% | ξ0 = 60% | ξ0 = 80% | |
|---|---|---|---|---|
| CCCV-VL with Imax = 30 A (1C) | Tchg = 59.12 min ξfin = 99.94% | Tchg = 45.72 min ξfin = 99.94% | Tchg = 32.32 min ξfin = 99.94% | Tchg = 18.92 min ξfin = 99.94% |
| CCCV-OCV with Imax = 30 A (1C) | Tchg = 54.38 min ξfin = 99.84% | Tchg = 40.52 min ξfin = 99.81% | Tchg = 27.17 min ξfin = 99.82% | Tchg = 14.08 min ξfin = 99.83% |
| CCCV-VL with Imax = 24 A (0.8C) | Tchg = 72.33 min ξfin = 99.94% | Tchg = 55.58 min ξfin = 99.94% | Tchg = 38.83 min ξfin = 99.94% | Tchg = 22.08 min ξfin = 99.94% |
| CCCV-OCV with Imax = 24 A (0.8C) | Tchg = 66.95 min ξfin = 99.80% | Tchg = 50.25 min ξfin = 99.78% | Tchg = 33.53 min ξfin = 99.76% | Tchg = 16.95 min ξfin = 99.69% |
| CCCV-VL with Imax = 18 A (0.6C) | Tchg = 94.37 min ξfin = 99.94% | Tchg = 72.04 min ξfin = 99.94% | Tchg = 49.71 min ξfin = 99.94% | Tchg = 27.37 min ξfin = 99.94% |
| CCCV-OCV with Imax = 18 A (0.6C) | Tchg = 89.18 min ξfin = 99.82% | Tchg = 66.87 min ξfin = 99.84% | Tchg = 44.85 min ξfin = 99.85% | Tchg = 22.52 min ξfin = 99.83% |
| CCCV-VL with Imax = 12 A (0.4C) | Tchg = 138.64 min ξfin = 99.94% | Tchg = 105.15 min ξfin = 99.94% | Tchg = 71.64 min ξfin = 99.94% | Tchg = 38.14 ξfin = 99.94% |
| CCCV-OCV with Imax = 12 A (0.4C) | Tchg = 134.12 min ξfin = 99.93% | Tchg = 100.52 min ξfin = 99.89% | Tchg = 66.92 min ξfin = 99.87% | Tchg = 33.32 min ξfin = 99.86% |
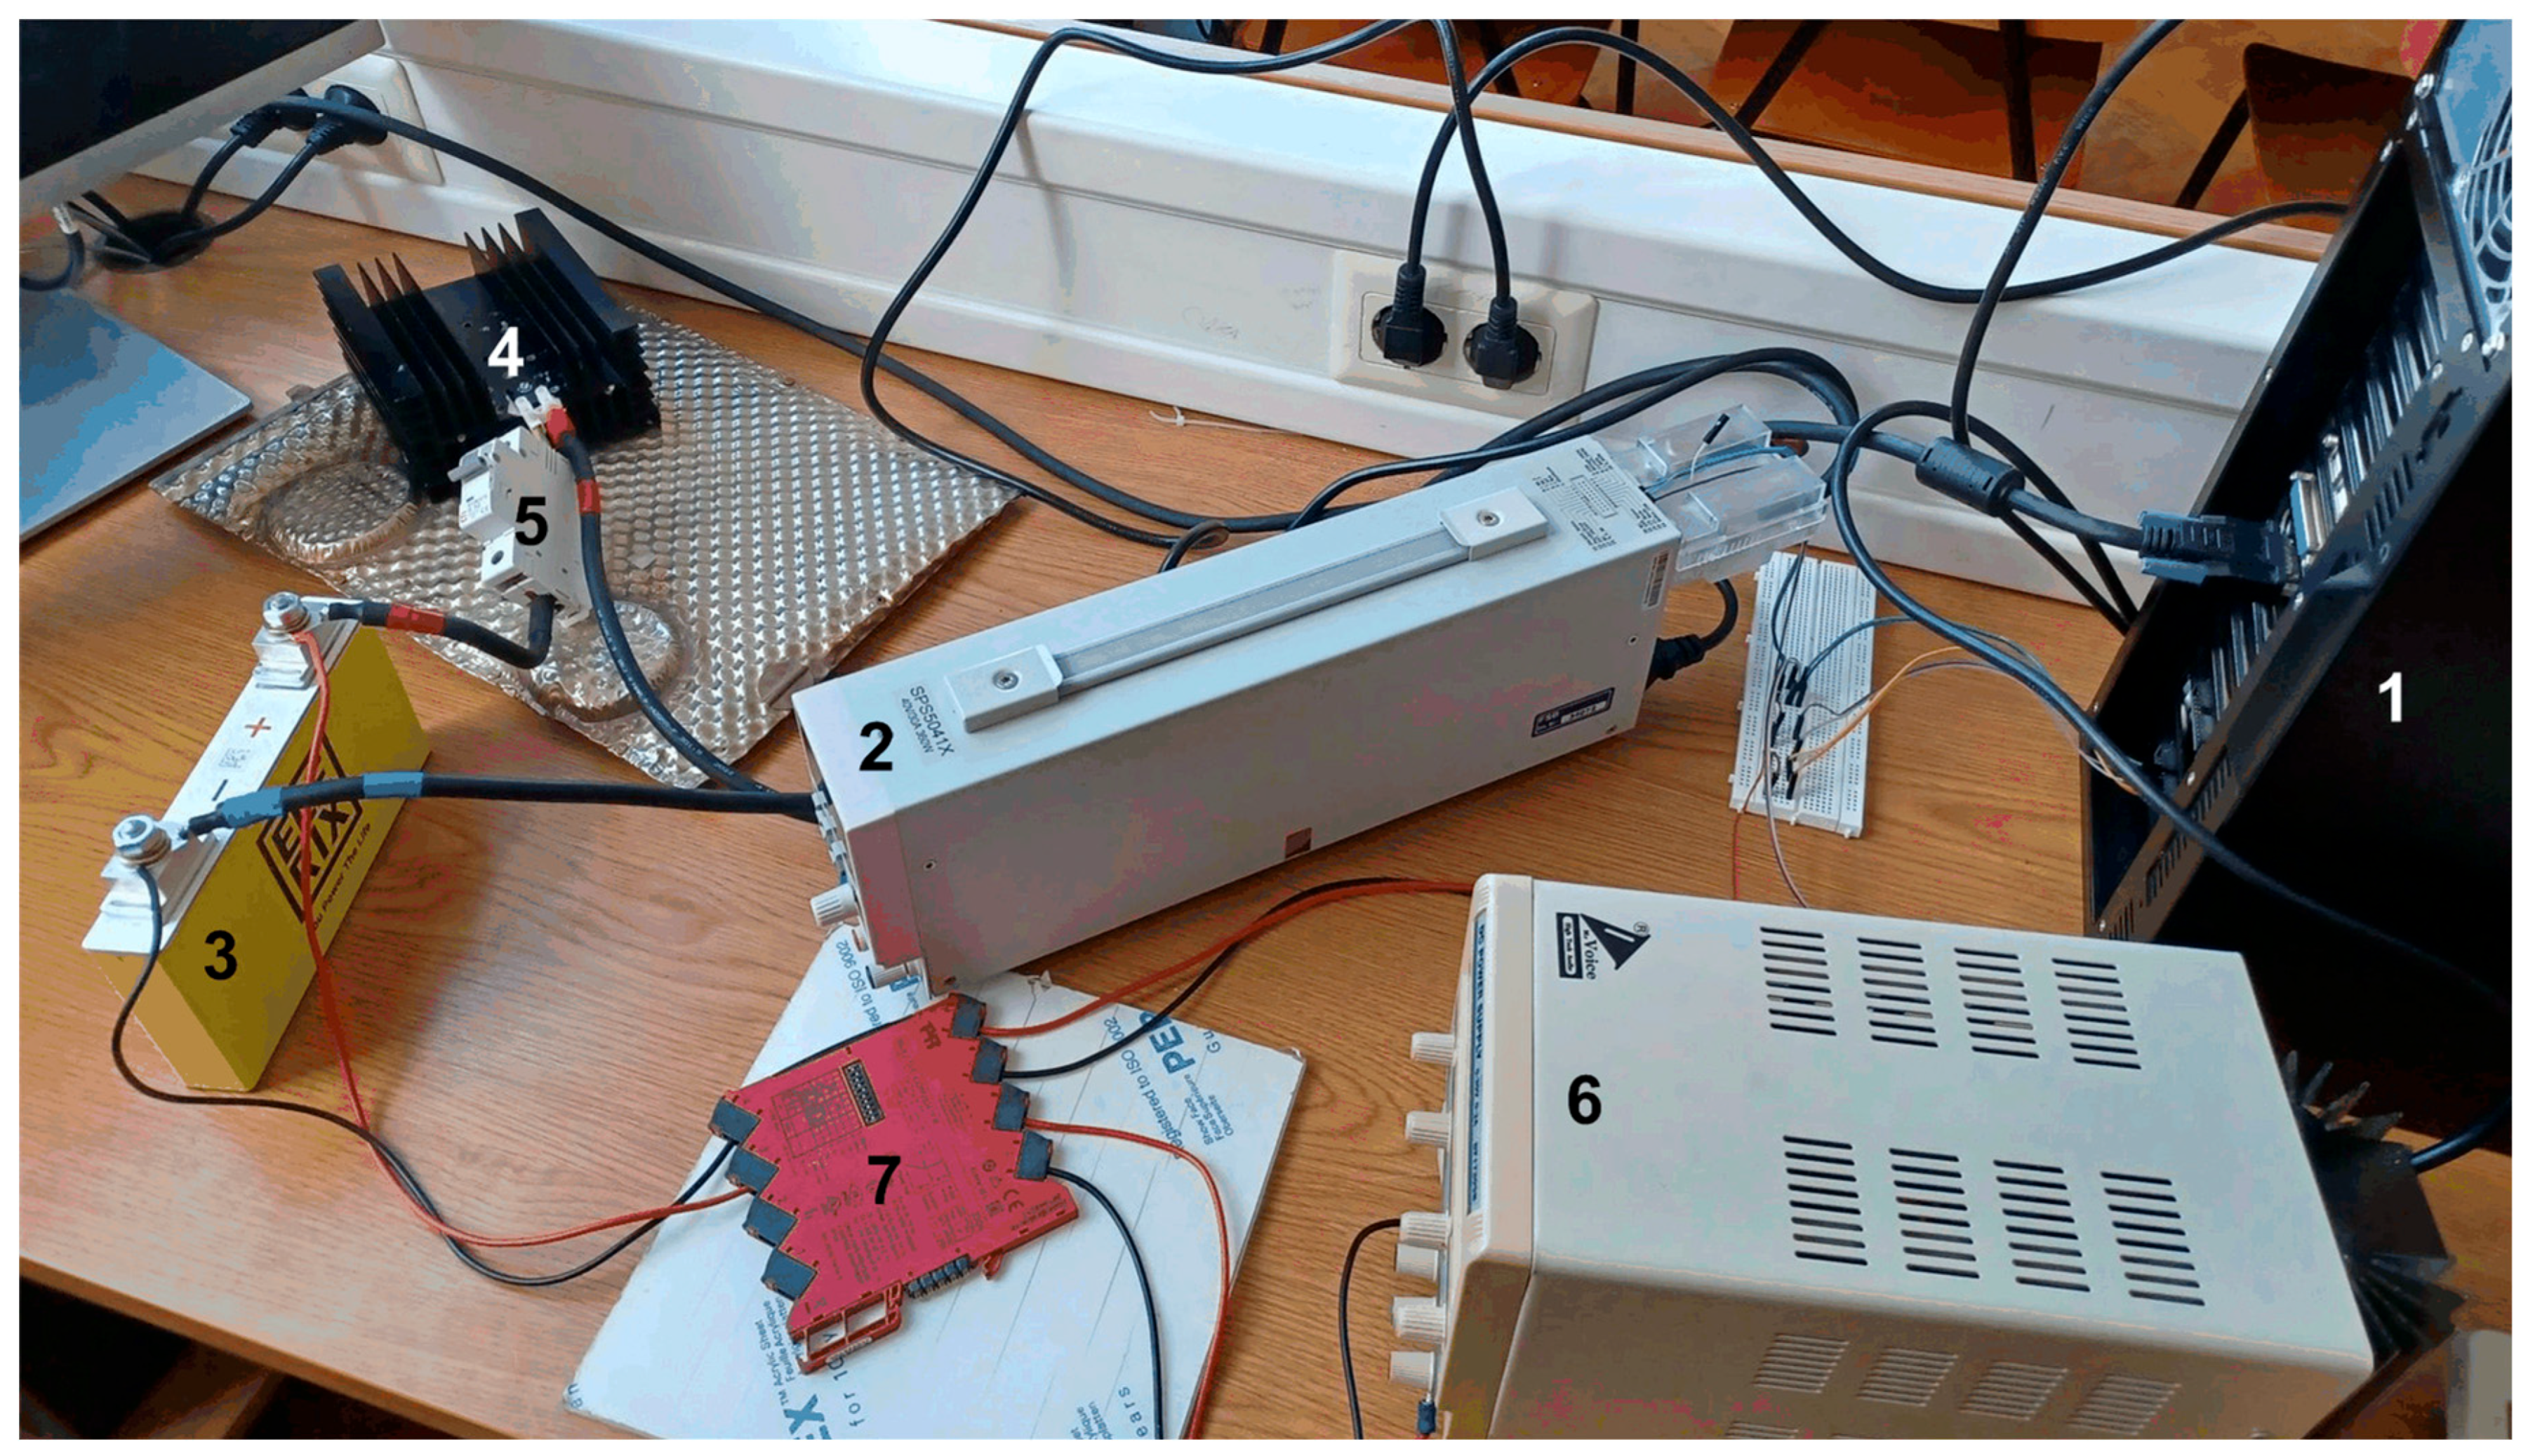
| No. | Description | Technical Specifications |
|---|---|---|
| 1 | Control computer with acquisition and control cards | Single-core Pentium 4 CPU (3 GHz clock frequency) and 4 GByte RAM used as control computer and for data acquisition. Acquisition and control cards: Advantech (Taipei, Taiwan) PCL 812 PG cards with 16 analogue input channels and 2 analogue output channels (12-bit resolution each) [43] |
| 2 | DC/DC power converter | SIGLENT (Shenzhen, China) SPS 5041X 30 A/40 V/360 W controllable/programmable DC power source used as current-controlled battery charging power converter [44] |
| 3 | Lithium titanate battery cell | ELERIX (Oldham, Manchester, UK) EX-30TK battery cell 30 Ah/2.4 V with 1C (nominal) charging rate of 30 A [37] |
| 4 | Reverse flow blocking diode | RURG80100 (80 A average rectified current/1000 V blocking voltage) used as reverse current blocking diode [45] |
| 5 | Circuit breaker | B 32 breaker type (medium speed/32 A RMS tripping current) |
| 6 | Auxiliary 24 Vdc power supply | Adjustable stabilized laboratory DC power source 0–30 V/0–3 A for supplying the isolation amplifier |
| 7 | Isolation amplifier | PR Electronics (Rønde, Denmark), Isolated Converter Type 3104 (0…5 V input/0…5 V output) [46], which is used to galvanically isolate the battery terminal current measurement |
| Initial Battery State | Final State CCCV-VL | Final State CCCV-OCV | CCCV-VL Charging Time Tchg,VL | CCCV-OCV Charging Time Tchg,OCV | Charging Speedup |
|---|---|---|---|---|---|
| ub0 = 2.072 V (ξ0 = 4.2%) | ubfin = 2.678 V (ξfin = 99.95%) | ubfin = 2.644 V (ξfin = 99.62%) | 111.08 min | 106.17 min | 4.42% |
| ub0 = 2.272 V (ξ0 = 69.5%) | ubfin = 2.674 V (ξfin = 99.91%) | ubfin = 2.667 V (ξfin = 99.85%) | 35.32 min | 31.28 min | 11.33% |
Disclaimer/Publisher’s Note: The statements, opinions and data contained in all publications are solely those of the individual author(s) and contributor(s) and not of MDPI and/or the editor(s). MDPI and/or the editor(s) disclaim responsibility for any injury to people or property resulting from any ideas, methods, instructions or products referred to in the content. |
© 2025 by the authors. Licensee MDPI, Basel, Switzerland. This article is an open access article distributed under the terms and conditions of the Creative Commons Attribution (CC BY) license (https://creativecommons.org/licenses/by/4.0/).
Share and Cite
Pavković, D.; Cipek, M.; Kvaternik, K.; Faiz, N.; Shambilova, A. Enhancing Lithium Titanate Battery Charging: Investigating the Benefits of Open-Circuit Voltage Feedback. Energies 2025, 18, 3946. https://doi.org/10.3390/en18153946
Pavković D, Cipek M, Kvaternik K, Faiz N, Shambilova A. Enhancing Lithium Titanate Battery Charging: Investigating the Benefits of Open-Circuit Voltage Feedback. Energies. 2025; 18(15):3946. https://doi.org/10.3390/en18153946
Chicago/Turabian StylePavković, Danijel, Mihael Cipek, Karlo Kvaternik, Nursultan Faiz, and Alua Shambilova. 2025. "Enhancing Lithium Titanate Battery Charging: Investigating the Benefits of Open-Circuit Voltage Feedback" Energies 18, no. 15: 3946. https://doi.org/10.3390/en18153946
APA StylePavković, D., Cipek, M., Kvaternik, K., Faiz, N., & Shambilova, A. (2025). Enhancing Lithium Titanate Battery Charging: Investigating the Benefits of Open-Circuit Voltage Feedback. Energies, 18(15), 3946. https://doi.org/10.3390/en18153946