Article

The Influence of Variable Operating Conditions and Components on the Performance of Centrifugal Compressors in Natural Gas Storage Reservoirs

1
Zhongyou Liaohe Engineering Co., Ltd., Panjin 124010, China
2
Liaohe Oilfield (Panjin) Gas Storage Co., Ltd., Panjin 124200, China
3
School of Energy and Power Engineering, Xi’an Jiaotong University, Xi’an 710049, China
*
Author to whom correspondence should be addressed.
Energies 2025, 18(15), 3930; https://doi.org/10.3390/en18153930
Submission received: 27 June 2025 / Revised: 13 July 2025 / Accepted: 21 July 2025 / Published: 23 July 2025

Abstract

The inlet operating conditions of centrifugal compressors in natural gas storage reservoirs, as well as the natural gas composition, continuously vary over time, significantly impacting compressor performance. To analyze the influence of these factors on centrifugal compressors, a method for converting the performance curves of centrifugal compressors under actual operating conditions has been established. This performance conversion process is implemented through a custom-developed program, which incorporates the polytropic index and exhaust temperature calculations. Verification results show that the conversion error of this method is within 2%. Based on the proposed performance prediction method for non-similar operating conditions, the effects of varying inlet temperatures, pressures, and natural gas compositions on compressor performance are investigated. It is observed that an increase in inlet temperature results in a decrease in compressor power and pressure ratio; an increase in inlet pressure leads to higher power consumption, while the pressure ratio varies with the flow rate at the operating point; and as the average molar mass of natural gas decreases, both the pressure ratio and power exhibit a certain degree of reduction.

1. Introduction

Natural gas has become an important clean energy source due to its high energy density, clean combustion products, and abundant resource reserves [1,2]. With the increasing demand for natural gas application and storage, natural gas energy storage technology has developed rapidly. Due to its advantages such as safety and environmental friendliness, large-scale underground natural gas storage reservoirs have become an important research field [3,4]. Centrifugal compressors play a critical role in natural gas storage reservoirs, as their performance directly impacts operational efficiency and safety [5]. The gas injection parameters of the storage reservoir, such as injection temperature and pressure, are subject to continuous variation due to environmental factors, leading to fluctuations in the performance of centrifugal compressors. Furthermore, the composition of natural gas within the reservoir evolves during the injection process, further influencing compressor performance [6].
Inlet temperature and inlet pressure are important operating parameters of centrifugal compressors. Different temperatures and pressures will cause changes in the performance of the compressor [7]. Navarro studied the operating characteristics of the scroll compressor under different temperatures and pressures to obtain the performance characteristics within its entire operating range [8]. Sun studied the influence of rapid changes in inlet temperature on the flow field of the axial flow compressor and explored the reasons for its stall [9]. The gas injection period of the storage reservoir is often as long as several months. During this period, the environmental temperature will continuously change over time and the compressor inlet pressure will also fluctuate, resulting in continuous changes in the operating conditions of the compressor during the gas injection period [10]. Therefore, for compressors in the storage reservoir it is very important to study the influence of inlet temperature and pressure changes.
The main component of natural gas in the storage reservoir is methane, and there will also be small amounts of ethane, propane, air components, etc. The mole fractions of each component will change during the gas injection period, causing changes in parameters such as the compression factor, specific heat capacity, and viscosity of the mixed gas, which further causes changes in the working capacity of the compressor [11,12]. Mahmood studied the influence of natural gas components on the performance of reciprocating compressors and found that the lower the molecular weight of the compressed natural gas, the greater the power consumption [13].
To investigate the influence of the aforementioned factors on compressor performance, a comparative analysis of the compressor’s performance under varying inlet pressures, temperatures, and natural gas compositions is required. Thus, a similarity-based conversion method must be employed to derive compressor performance curves under different conditions based on known performance curves. Common conversion methods include fully similar performance curve conversion and partially similar performance curve conversion [14,15,16]. Fully similar performance curve conversion relies on the principle of similarity, assuming identical fluid properties, geometric similarity, and kinematic states [17]. In contrast, the partially similar performance curve conversion method accounts for discrepancies between actual operating conditions and design conditions, allowing for performance curve adjustments within a certain range to accommodate different operational scenarios [18,19,20]. In natural gas storage reservoirs, compressors operate under partially similar conditions which are also subject to continuous variation [21]. Hence, the partially similar conversion method is recommended for adapting existing compressor performance curves.
This work studies the performance curve conversion method of centrifugal compressors under incompletely similar conditions, analyzes the performance changes in the compressors under variable components and variable inlet conditions through this method, and presents appropriate operation strategies.

2. Methods

The performance conversion of centrifugal compressors is carried out based on the principle of similarity theory. This method is the fundamental approach in the performance analysis and prediction of centrifugal compressors. Through complete similarity conversion, performance parameters under different working conditions can be uniformly compared and predicted. The approximate similarity conversion method is used to convert the performance curve, and comparison is made through the complete similarity conversion method.

2.1. Introduction to Similar Conversion Methods

Compressor performance conversion is carried out based on the similarity principle. The basis of the similarity principle lies in the assumption that for two compressors or the same compressor under different working conditions, their geometric dimensions are the same (geometric similarity), their fluid dynamic characteristics are similar (dynamic similarity), and their kinematic conditions are similar (kinematic similarity). Under these conditions, there is a certain proportional relationship between the performance parameters of the compressor [14].
The complete similarity conversion method is the most basic conversion method, and the main conversion equations are as follows:
Flow conversion is shown in Equation (1):
q v i n * = q v i n R * T * in R T in
where qvin* is the volume flow rate in the working condition to be determined, qvin is the volume flow rate in the known performance curve, R* is the gas constant in the working condition to be determined, R is the gas constant corresponding to the known performance curve, T*in is the inlet temperature in the working condition to be determined, and Tin is the inlet temperature in the known performance curve.
Rotational speed conversion is shown in Equation (2):
n * = n R * T * in R T in
where n* is the rotation speed in the working condition to be determined and n is the rotation speed in the known performance curve.
Power conversion is shown in Equation (3):
P * = P p * in R * T * in p in R T in
where P* is the power in the working condition to be determined, P is the power in the known performance curve, pin* is the inlet pressure in the working condition to be determined, and pin is the inlet pressure in the known performance curve.
For the compressor performance curve near-similar conversion method there are two types of situations: in the first situation the adiabatic indexes of the gases are equal and the characteristic Mach numbers are not equal; in the second situation the adiabatic indexes of the gases are not equal and the characteristic Mach numbers are not equal. For the natural gas storage reservoir compressors, the natural gas components will change with time and operating conditions, such as different natural gas sources, micro-chemical reactions, etc. These changes will cause the adiabatic index of the gas to change [22].
Therefore, this paper adopts the second-type near-similar conversion method.
The basic conversion equation of the second-type approximate conversion method is as follows:
Rotational speed conversion is shown in Equation (4):
n * = n m * ( m * 1 ) × m 1 m × Z i n * R * T i n * Z i n R T i n [ ( ε * ) ( m * 1 ) / m 1 ] [ ε ( m 1 ) / m 1 ]
where m and m* are the polytropic exponents before and after conversion, respectively, ε and ε* are the pressure ratios before and after conversion, respectively, and Zin and Zin* are the compressibility factors of the gas under the compressor inlet conditions before and after conversion, respectively.
Flow conversion is shown in Equation (5):
q vin * = q vin n * n [ 1 + 1 2 ( ε m * 1 m * 1 ) ] 1 m * 1 [ 1 + 1 2 ( ε m 1 m 1 ) ] 1 m 1
Power conversion is shown in Equation (6):
P * = ( n n ) 3 × Z × T i n × p i n * Z * × T i n * × p i n × P
The relationship of specific volume ratio is shown in Equation (7):
ε 1 m * = ε 1 m
Assume that the compression process is a polytropic process, and the following polytropic index calculation Equation (8) is obtained by combining the pressure ratio, compression factor, and temperature change:
m = ln ε ln ε ln ( Z out T out Z in T in )
where Zout is the gas compressibility factor under the compressor outlet conditions, and Tout is the temperature under the compressor outlet conditions.
The pressure ratio relationship can be derived as shown in Equation (9):
ε * = ε ( Z out * / Z in * ) ( T out * / T in * ) ( Z out / Z in ) ( T out / T in )
where Zout* is the compression factor of the gas at the compressor outlet after conversion, and Tout* is the compressor outlet temperature.
The above are the equations related to the second-class approximate similarity conversion. In engineering applications, the following problems will be encountered: firstly, this method includes rotational speed conversion, and the known performance curve cannot be directly converted to the condition to be determined. Secondly, during the actual conversion, the performance curve of the given condition is known, and the inlet pressure, temperature, compressibility factor, and other parameters of the given condition can be obtained. It is known that the conditions of the condition to be determined are the compressor inlet pressure, temperature, compressibility factor, and some aerodynamic parameters. If the performance conversion is to be carried out for the exhaust temperature of the known condition and the condition to be determined, then the polytropic exponent and other parameters should also be obtained. Therefore, in order to complete the performance conversion, we must first establish the exhaust temperature calculation method and the polytropic exponent calculation idea.

2.2. Conversion of Exhaust Temperature Curve

For the known working condition, the exhaust temperature is directly available by looking up the exhaust temperature curve, and the corresponding exhaust temperature can be obtained by looking up the flow rate and rotational speed. For the condition to be determined, in order to obtain the exhaust temperature in a certain working state, the most efficient approach is to reference the exhaust temperature curve. Therefore, through the conversion of the exhaust temperature curve, convert the exhaust temperature curve of the known working condition to the condition to be determined and then the exhaust temperature can be looked up.
The exhaust temperature is affected by many factors and is a function of the inlet temperature, inlet pressure, outlet pressure, etc. As shown in Equation (10):
T out = f ( T in , p in , p out )
The compressor outlet pressure is a function of rotational speed and flow rate. This is shown in Equation (11):
p out = g ( n , q )
Combining Equations (10) and (11), fit the exhaust temperature conversion equation according to the exhaust temperature curves under several known operating conditions. The fitting method is as follows: according to the known exhaust temperature curves under several operating conditions, within the same flow range, the exhaust temperature curves under the same rotation speed and different inlet conditions only have a vertical difference and their shapes are exactly the same. Therefore, only the vertical translation amount needs to be determined to complete the exhaust curve conversion. For two exhaust temperature curves under the same rotation speed and different inlet conditions, construct a fitting function. This is shown in Equation (12):
Δ t o u t = a 1 * Δ p i n + a 2 * Δ t i n + a 3 * n + a 4
where Δ t o u t is the difference in exhaust temperature under the same flow rate of the two curves, Δ p i n is the difference in inlet pressure, Δ t i n is the difference in inlet temperature, and n is the rotation speed. For the undetermined coefficient, substitute multiple groups of known exhaust temperature data to obtain the exhaust temperature curve conversion, which is shown as follows in Equation (13):
Δ t o u t = Δ p i n + Δ t i n 0.00113 n + 5.043
Through this equation, the exhaust temperature curves of two known working conditions are converted. Under the same pressure, the exhaust temperature curve with an inlet temperature of 30 °C is converted to an inlet temperature of 0 °C. The result is shown in Figure 1.
It can be seen that the exhaust temperature curves at the same rotation speed basically coincide, the conversion result is relatively accurate, and the conversion error does not exceed 0.5%. It is considered that this method can realize the conversion of the exhaust temperature performance curve.

2.3. Calculation Methods for Compression Factor and Polytropic Exponent

For the gas with a given composition, its compression factor is only related to pressure and temperature, and the compression factors Zin and Zout of the inlet and outlet gases under known operating conditions can be obtained by querying gas parameters (such as refprop) [23]. For the operating condition to be determined, given its inlet pressure pin*, inlet temperature Tin*, assuming outlet pressure pout*, rotation speed n*, volume flow rate qvin*, the pressure ratio ε* can be obtained from the pressure ratio equation, and the outlet temperature tout* can be obtained from the exhaust temperature curve. Then, the gas compression factors Zin* and Zout* under the operating condition to be determined can be obtained by querying gas parameters.
The polytropic exponent m under the known operating condition can be calculated by the polytropic exponent calculation equation. Combining the relationship between pressure ratio and specific volume ratio (Equation (7)) with the polytropic exponent calculation equation (Equation (8)), the pressure ratio ε1 and polytropic exponent m under the operating condition to be determined can be obtained.

2.4. Calculation Methods for Off-Design Performance Conversion

According to the basic equation of the second-type near-similarity conversion, a near-similarity performance conversion method for practical application is proposed. Its basic calculation process is as follows:
(1)
Give the outlet pressure performance curve, power performance curve, and exhaust temperature curve of a known operating condition. At the same time, give the inlet temperature tin, inlet pressure pin, rotation speed n, and flow rate q of the operating condition to be determined.
(2)
Assume the outlet pressure pout, which satisfies pout > pin.
(3)
Convert the exhaust temperature curve of the known operating condition to the operating condition to be determined through the exhaust temperature conversion equation fitted with the existing data.
(4)
Look up the exhaust temperature tout of the operating condition to be determined on the exhaust temperature curve through the given flow rate and rotation speed of the operating condition to be determined.
(5)
Calculate the outlet pressure of the known operating condition through the pressure conversion equation and calculate the exhaust pressure of the known operating condition through the temperature conversion equation.
(6)
Look up the import and export compression factors Zin, Zout, Zin*, and Zout* of the known operating condition and the operating condition to be determined in refprop through temperature and pressure.
(7)
Calculate the outlet pressure of the known operating condition again through the pressure conversion equation and calculate the polytropic exponents m and m* of the operating condition to be determined and the known operating condition through the polytropic exponent calculation equation.
(8)
Calculate the rotation speed n* and flow rate qvin* of the known operating condition through the rotation speed and flow rate conversion equations in (4) and (5).
(9)
Look up the outlet pressure pout* through the flow rate and rotation speed in the outlet pressure curve of the known operating condition.
(10)
Calculate the outlet pressure pout1 of the operating condition to be determined through the pressure conversion equation.
(11)
If pout1 is much different from the initially assumed pout, then use pout1 as the assumed outlet pressure to recalculate until the difference between the calculated outlet pressure and the assumed outlet pressure is less than a certain value.
(12)
At this time the calculated outlet pressure is the outlet pressure of the operating condition to be determined, and the ratio of the outlet pressure to the inlet pressure is the pressure ratio of the operating condition to be determined.
(13)
Calculate the rotation speed n* and flow rate qvin* of the known operating condition through the rotation speed and flow rate conversion equations, obtain the power P* of the known operating condition through the power curve, and obtain the power P of the operating condition to be determined through the power conversion equation.
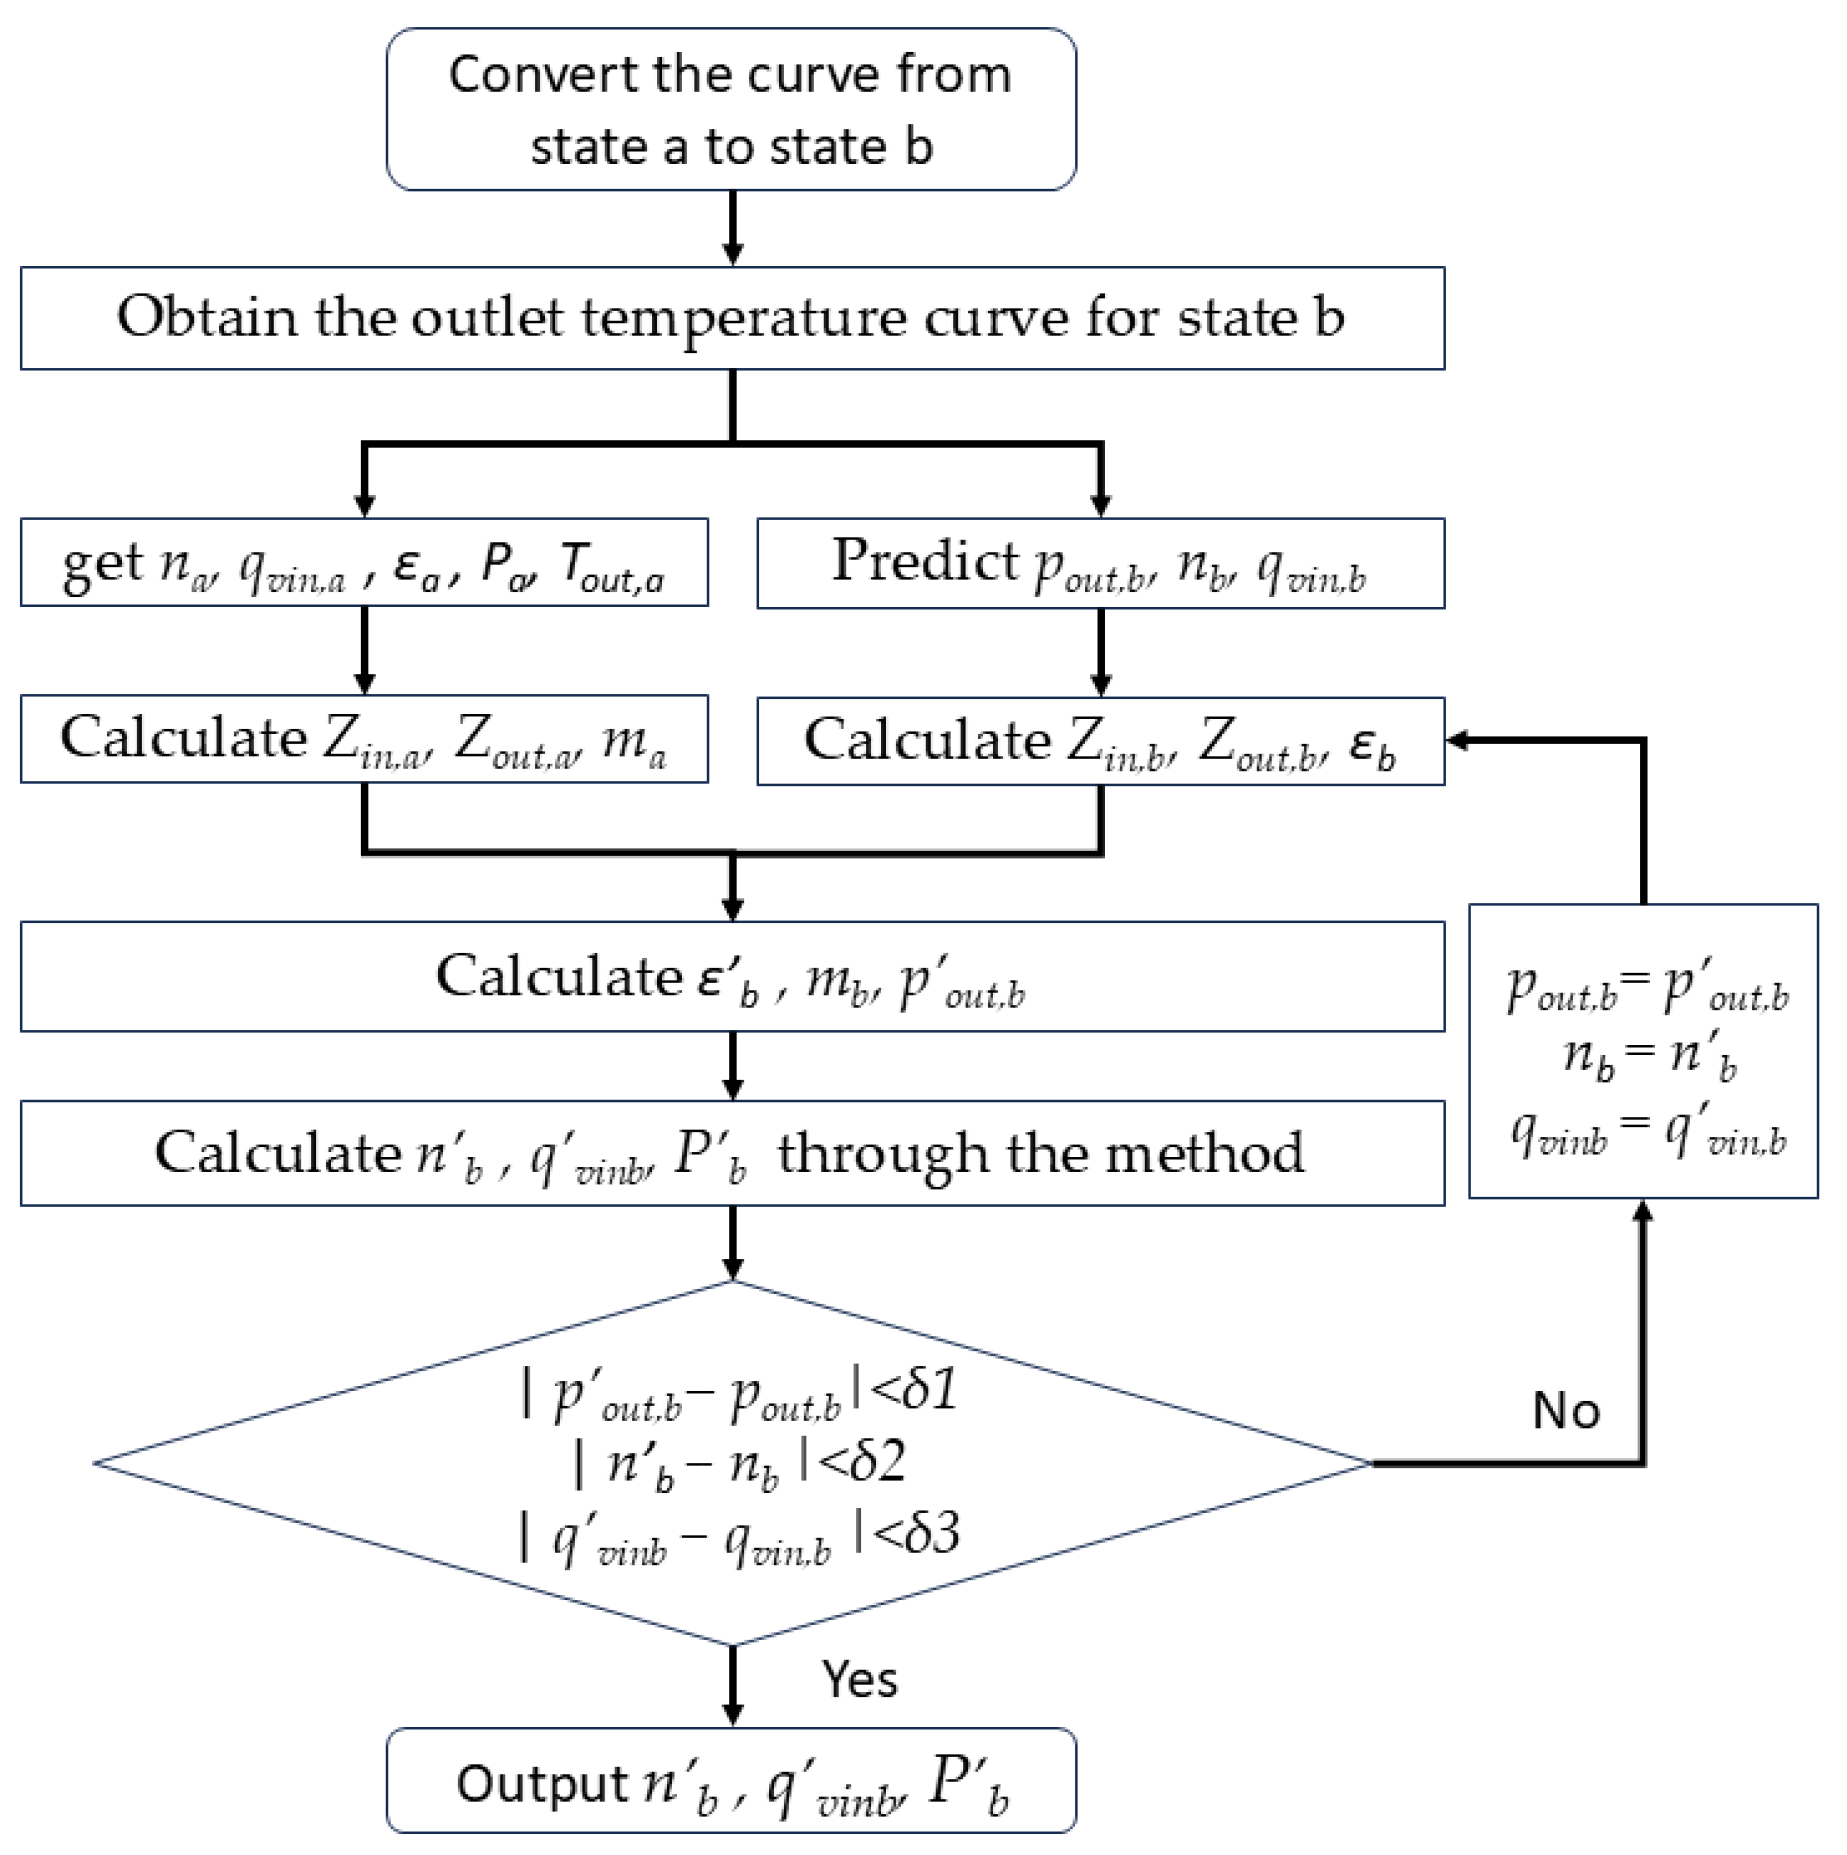
The brief conversion process is as shown in Figure 2.
Through the above methods performance conversion under specific operating conditions can be realized, that is, knowing some aerodynamic parameters (such as flow rate and rotation speed) under any inlet conditions, the remaining aerodynamic parameters (such as pressure ratio and power) can be calculated. To draw the performance curve under any operating condition, the rotation speed can be fixed, equal-interval flow rates can be taken, and the pressure ratio and power can be calculated, and by connecting them in sequence a performance curve at a certain rotation speed can be obtained. By repeating the above operations at several rotation speeds, a complete performance curve diagram can be obtained.
In order to achieve efficient batch calculation, we used Python 3.12 to write a program for implementing the performance conversion function.

2.5. Verify the Calculation Results

To verify the accuracy of the performance conversion method proposed in this paper, four operating conditions with known performance curve data are selected and the basic information is shown in Table 1.
Respectively, convert the performance curve of operating condition 1 to operating conditions 2, 3, and 4 through the second-type approximate similarity conversion method and the complete similarity conversion method, and analyze the accuracy of the method in the cases of variable temperature, variable pressure, and variable temperature–pressure conversion.
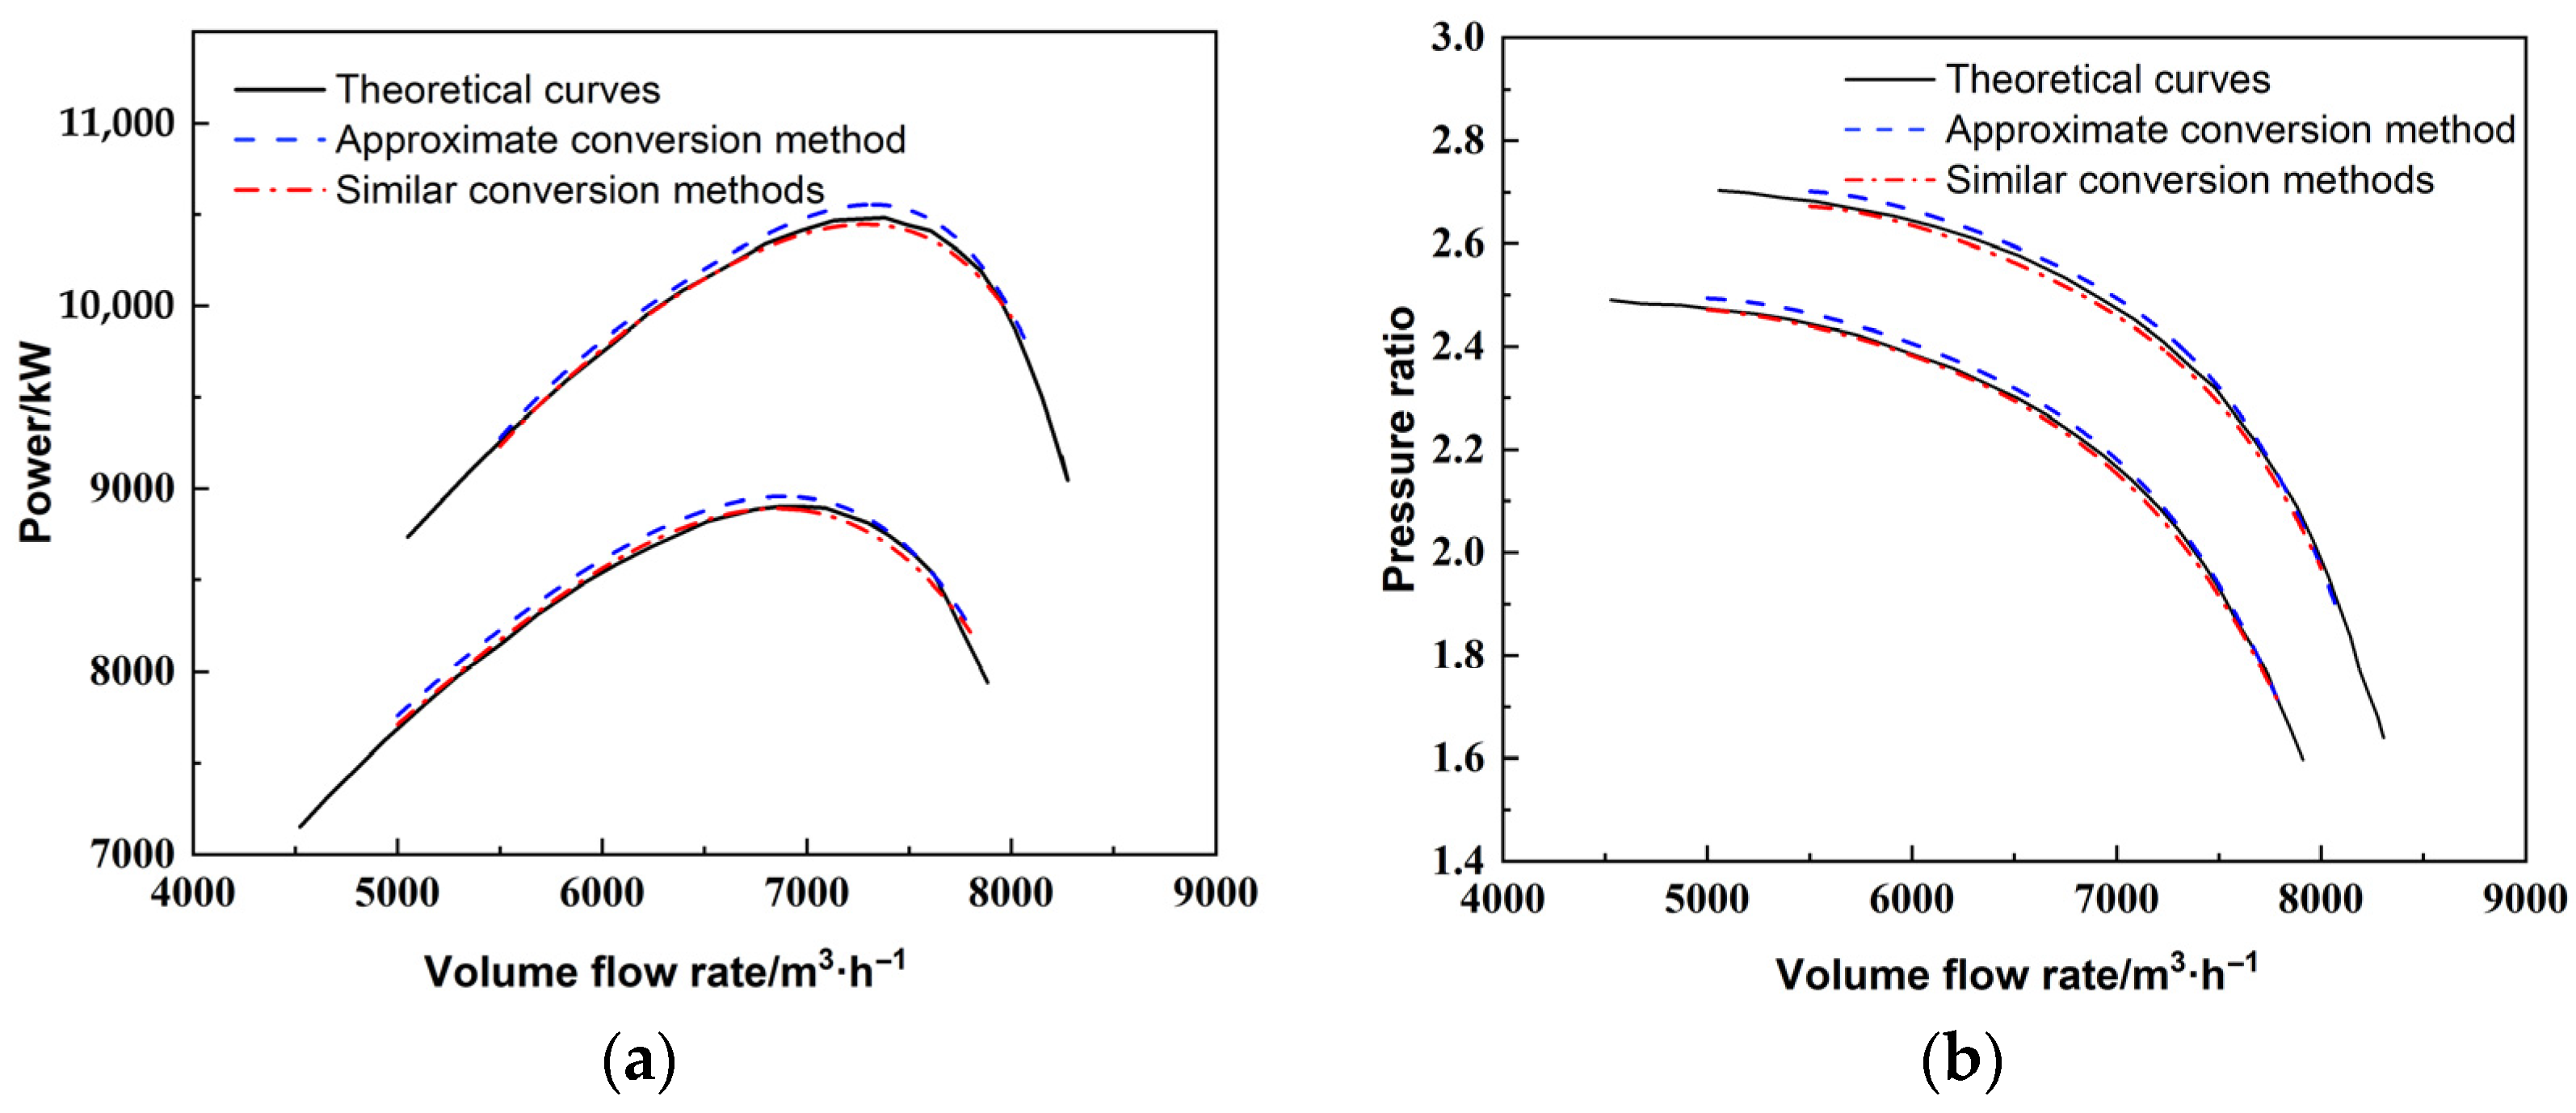
The result of variable temperature conversion (converting operating condition 1 to operating condition 2) is shown in Figure 3. The black line is the performance curve of operating condition 2, the red line is the performance curve of operating condition 2 obtained by converting the performance curve of operating condition 1 through the complete similarity conversion method, and the blue line is the performance curve of operating condition 2 obtained by converting the performance curve of operating condition 1 through the second-type approximate similarity conversion method. The conversion errors of the pressure ratio and power of the method used in this paper are all within 0.7%, so the conversion result can be considered good and is similar to the result of the similarity conversion method.
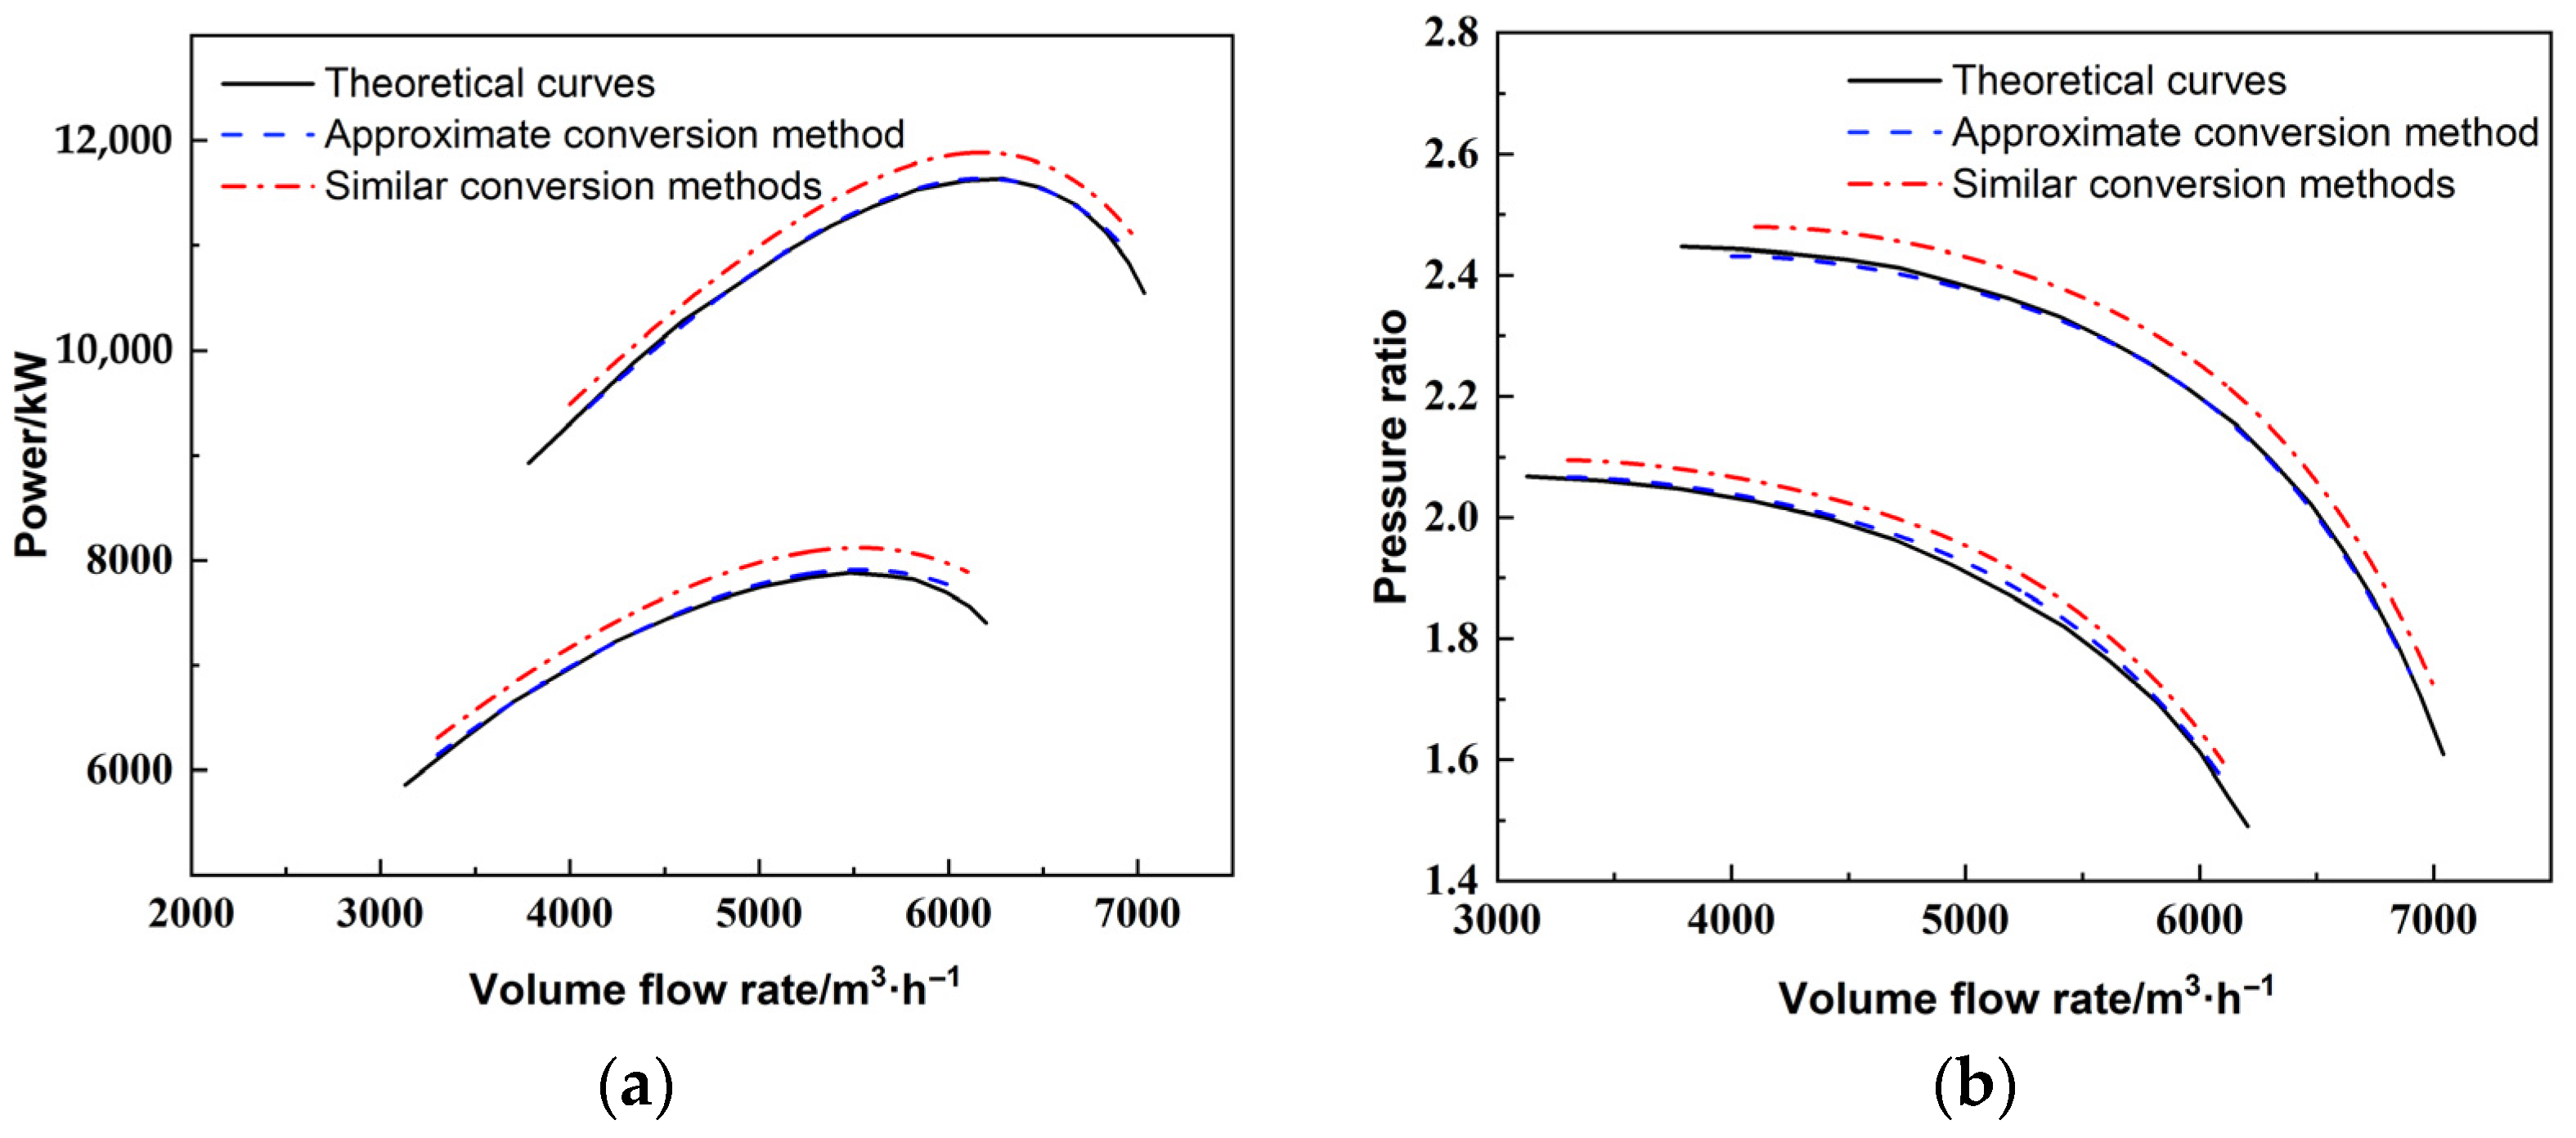
The result of variable pressure conversion (converting operating condition 1 to operating condition 3) is shown in Figure 4. The conversion errors of the pressure ratio and power of the second-type approximate conversion are all within 0.3%, while the conversion errors of the pressure ratio and power of the similarity conversion are close to 2%. Therefore, for the variable pressure operating condition, the effect of the second-type approximate conversion is significantly better than that of the similarity conversion.
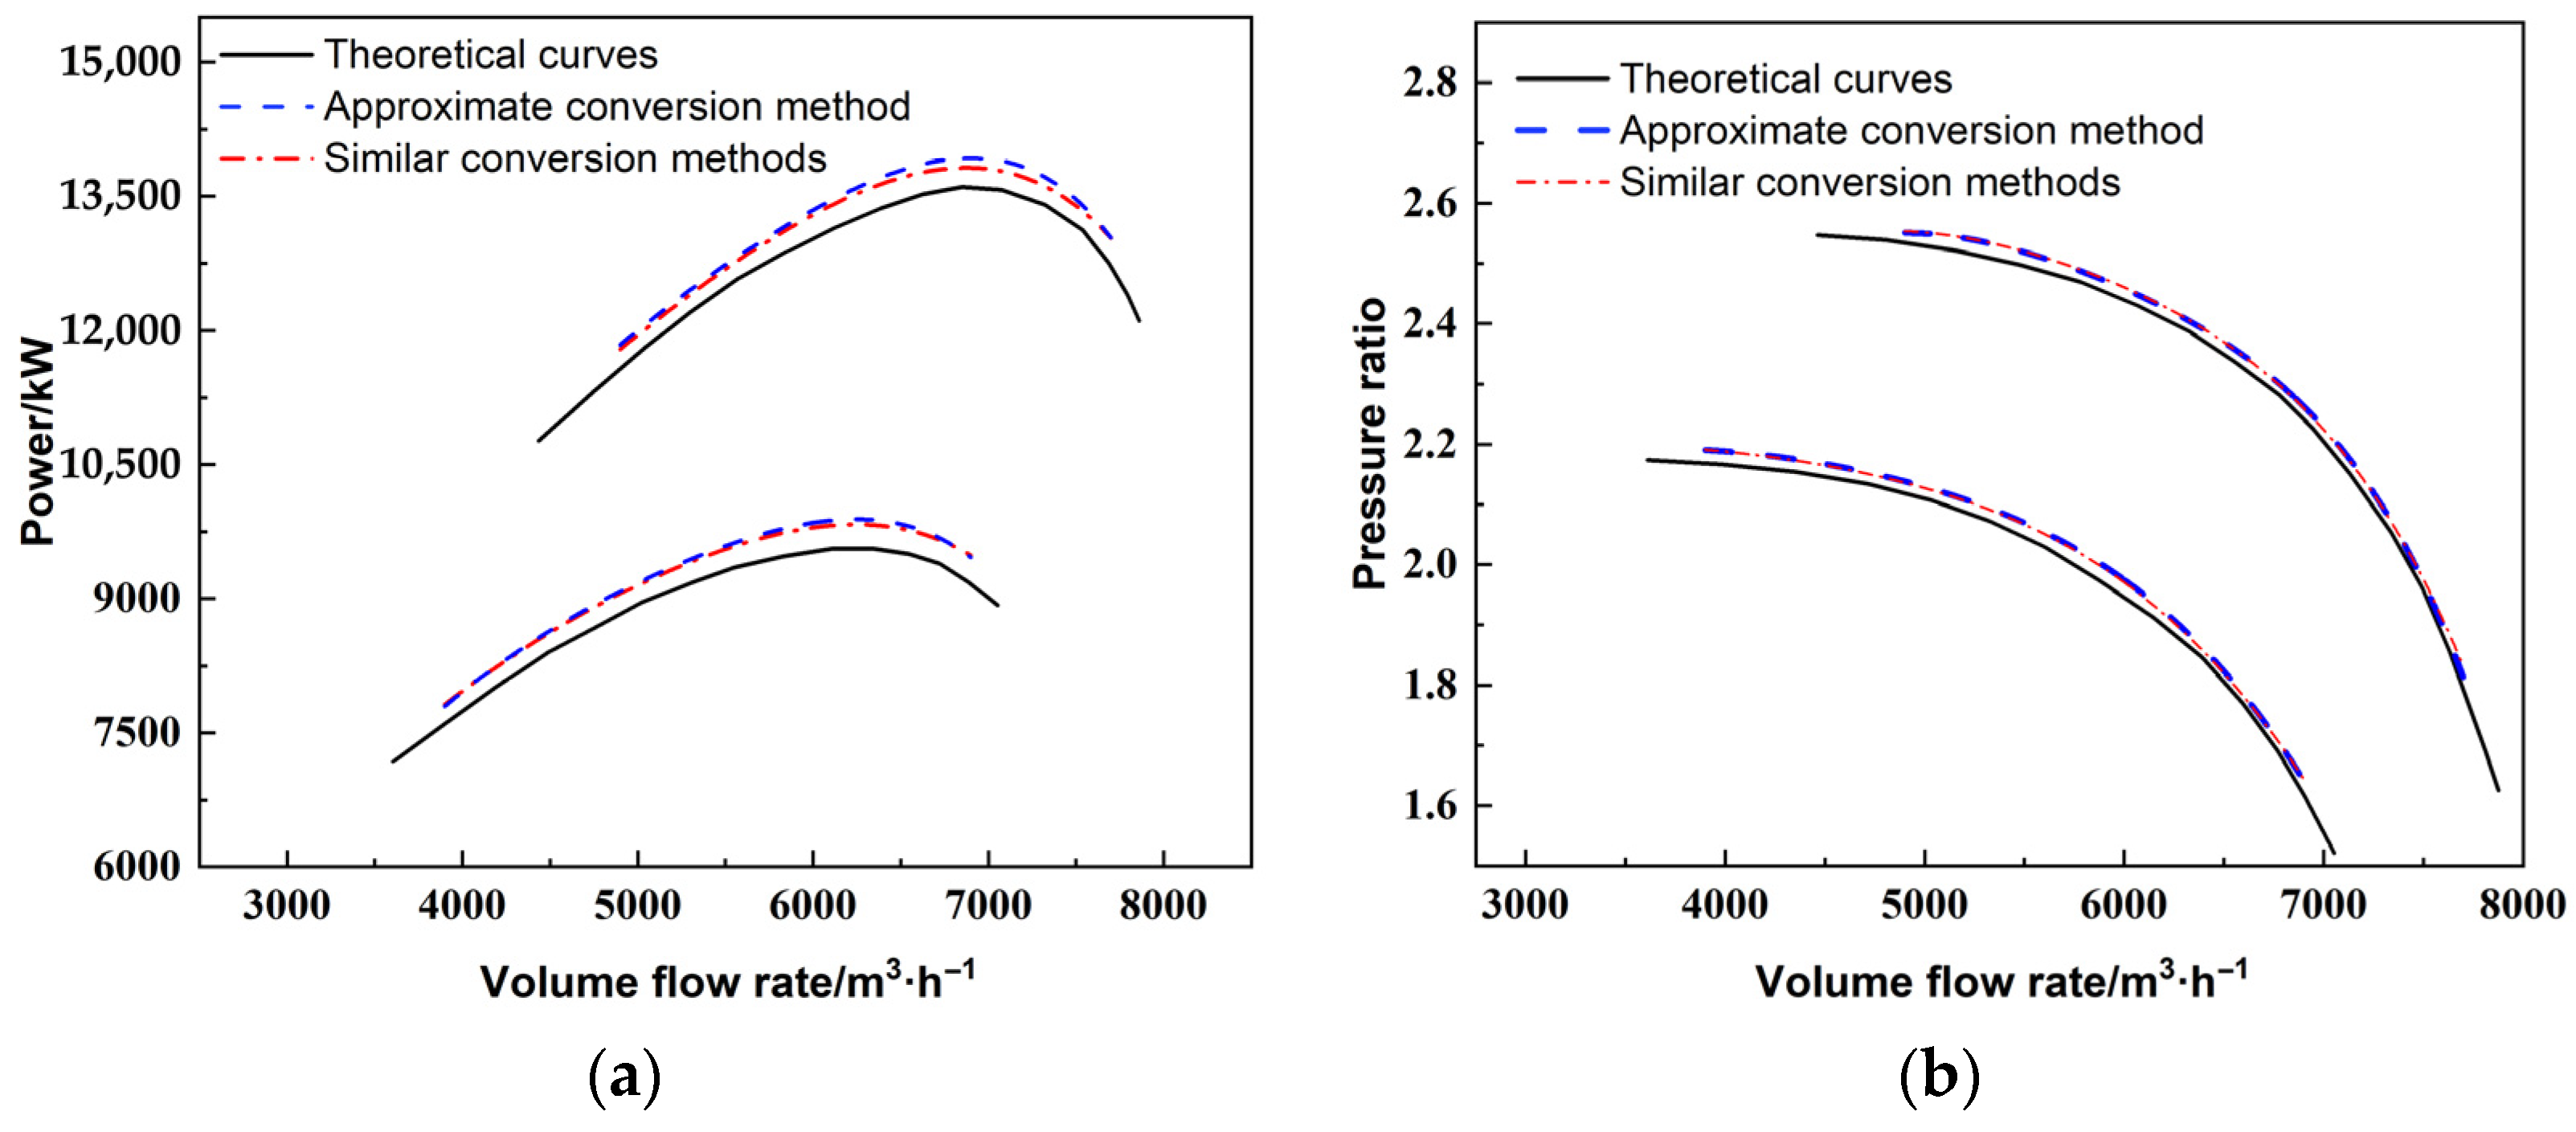
The conversion results in the variable pressure and temperature situation (converting operating condition 1 to operating condition 4) are shown in Figure 5. The results of the second-type approximate conversion are basically the same as those of the similarity conversion, and the conversion error of the pressure ratio is within 0.9% and that of the power is within 2%.
Generally speaking, the conversion accuracy of the second-type approximate similarity conversion method under variable pressure conditions is significantly higher than that of the complete similarity conversion method, and the difference between the two is not significant under other operating conditions. According to the conversion results in different situations, the performance conversion method used in this paper demonstrates clear advantages over the complete similarity conversion method.
In order to further verify the feasibility of the above method, some actual operation data from a gas storage compressor are collected and compared with the data of the performance curve obtained through conversion. The actual operation condition parameters are shown in Table 2.
Convert the performance curve of the gas storage compressor at 4.1 Mpa and 0 °C to the inlet conditions in Table 2. Obtain the pressure ratio and power in each working condition according to the rotation speed and flow rate and compare them with the actual operating data. Define the pressure ratio error and power error as Equations (14) and (15), which are as follows:
δ ε = | ε r e a l ε c o n v | ε r e a l × 100 %
δ P = | P r e a l P c o n v | P r e a l × 100 %
where εreal and Preal are the actual pressure ratio and power, εconv and Pconv are the converted pressure ratio and power, and δε and δP are the relative errors of the pressure ratio and power. The results are shown in Table 3. The pressure ratio errors are all less than 0.6%, and the maximum power error is 2.3. It can be considered that this method can be practically applied.
Analyze the sources of error as follows: (1) exhaust temperature calculation error; (2) polytropic index calculation error; (3) conversion process error. The exhaust temperature calculation error arises from the assumption that the specific heat ratio remains constant during the compression process. In fact, the specific heat ratio varies with temperature. This exhaust temperature error further leads to a polytropic index calculation error, which ultimately results in errors in the pressure ratio and power. A 3% deviation in exhaust temperature can cause approximately a 5% deviation in the polytropic index, thereby leading to power and pressure ratio calculation errors of about 1.5%. In the conversion process, convergence is determined using the absolute difference between the target parameters before and after the iteration, as shown in Figure 2. The values of δ1, δ2, and δ3 affect the speed and accuracy of the iteration. In this study, δ values are set to 1% of the assumed parameters. Therefore, the maximum error in the conversion process is 1%.

3. Results and Discussion

Through the performance curve conversion method developed previously, the centrifugal compressor pressure ratio curves and power curves under any inlet temperature, pressure, and working fluid composition can be obtained. By analyzing the performance curves under variable operating and composition conditions, the influence on the centrifugal compressor performance can be studied.

3.1. Research on Natural Gas Component Changes

The natural gas components in the gas storage reservoir will change with time and operating conditions, such as different natural gas sources, micro-chemical reactions, etc. These changes will cause the gas compressibility factor to change, which in turn will cause the aerodynamic performance and working characteristics of the compressor to change [11,24,25]. Studying the influence of natural gas component changes is crucial for the calculation of operating parameters and the adjustment of process equipment such as compressor units.
The actual natural gas components stored in a certain gas storage reservoir are shown in Table 4 as follows:
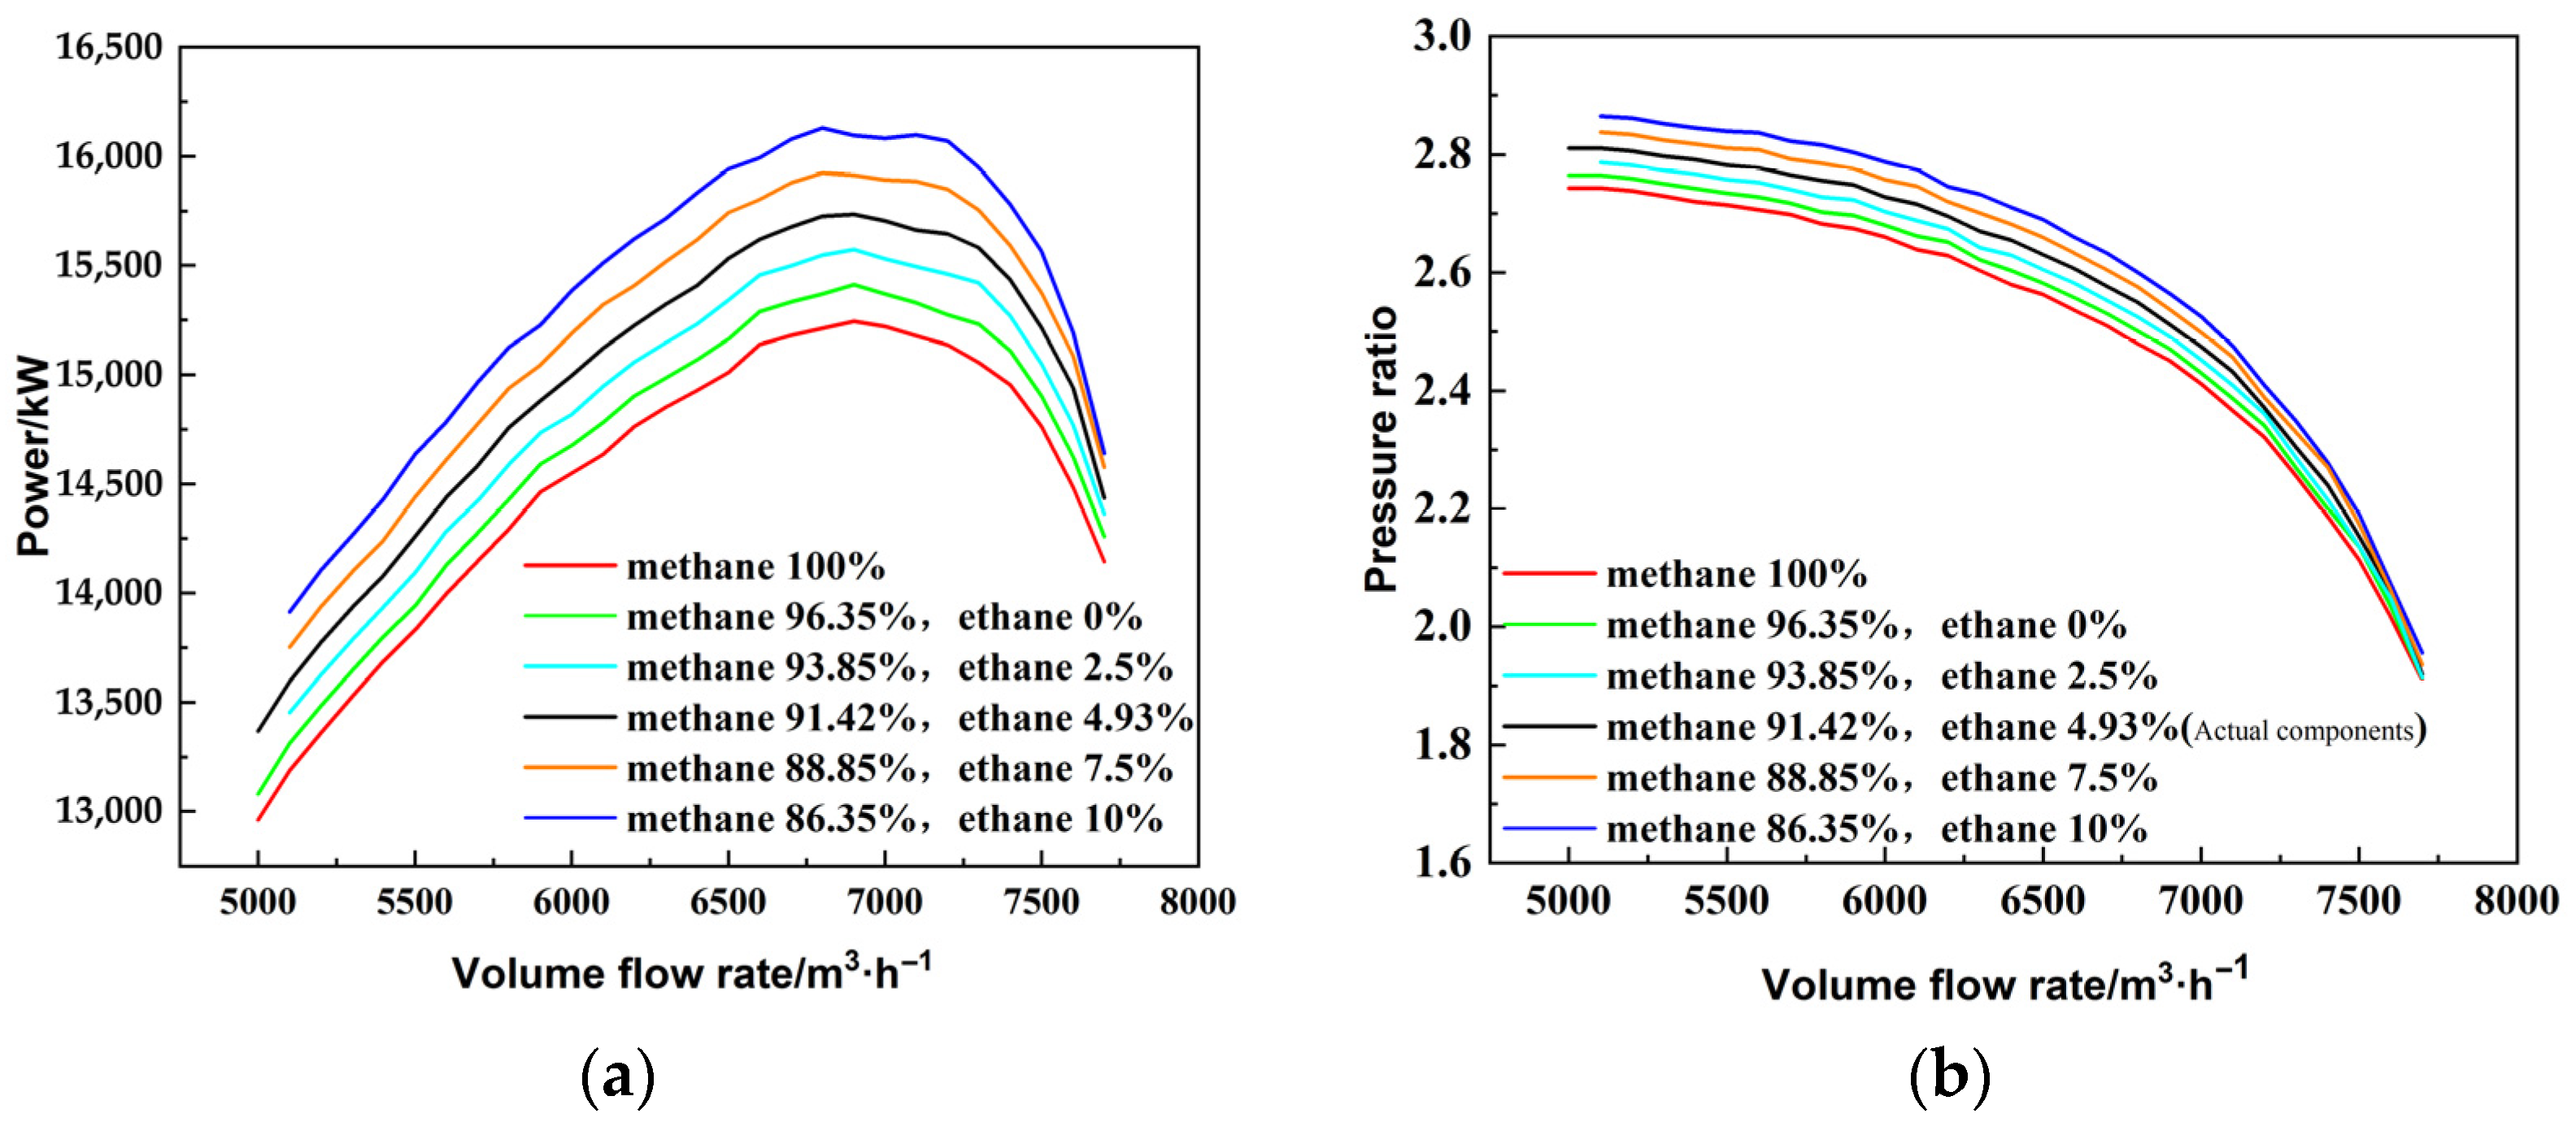
During the actual operation of the gas storage reservoir, its gas source is not fixed, and the components of different types of natural gas vary greatly. For example, in NIST1 natural gas, methane accounts for approximately 92% and ethane accounts for only 3%; in RG2 natural gas, methane accounts for approximately 73% and ethane accounts for as high as 13%. Generally, the proportion of ethane in natural gas components does not exceed 10%, so only the situation where the proportion of ethane is within 10% will be analyzed [26].
Figure 6a and Figure 6b are the compressor pressure ratio curves and power curves for different working fluid components under the same inlet conditions and the same rotational speeds, respectively. Here, the actual working fluid components, pure natural gas, and different methane–ethane ratios are selected for the study.
It can be seen that the change in gas components has a great impact on the compressor’s performance. As the average molar mass of the gas decreases, the compressor pressure ratio and power both decrease to a certain extent.
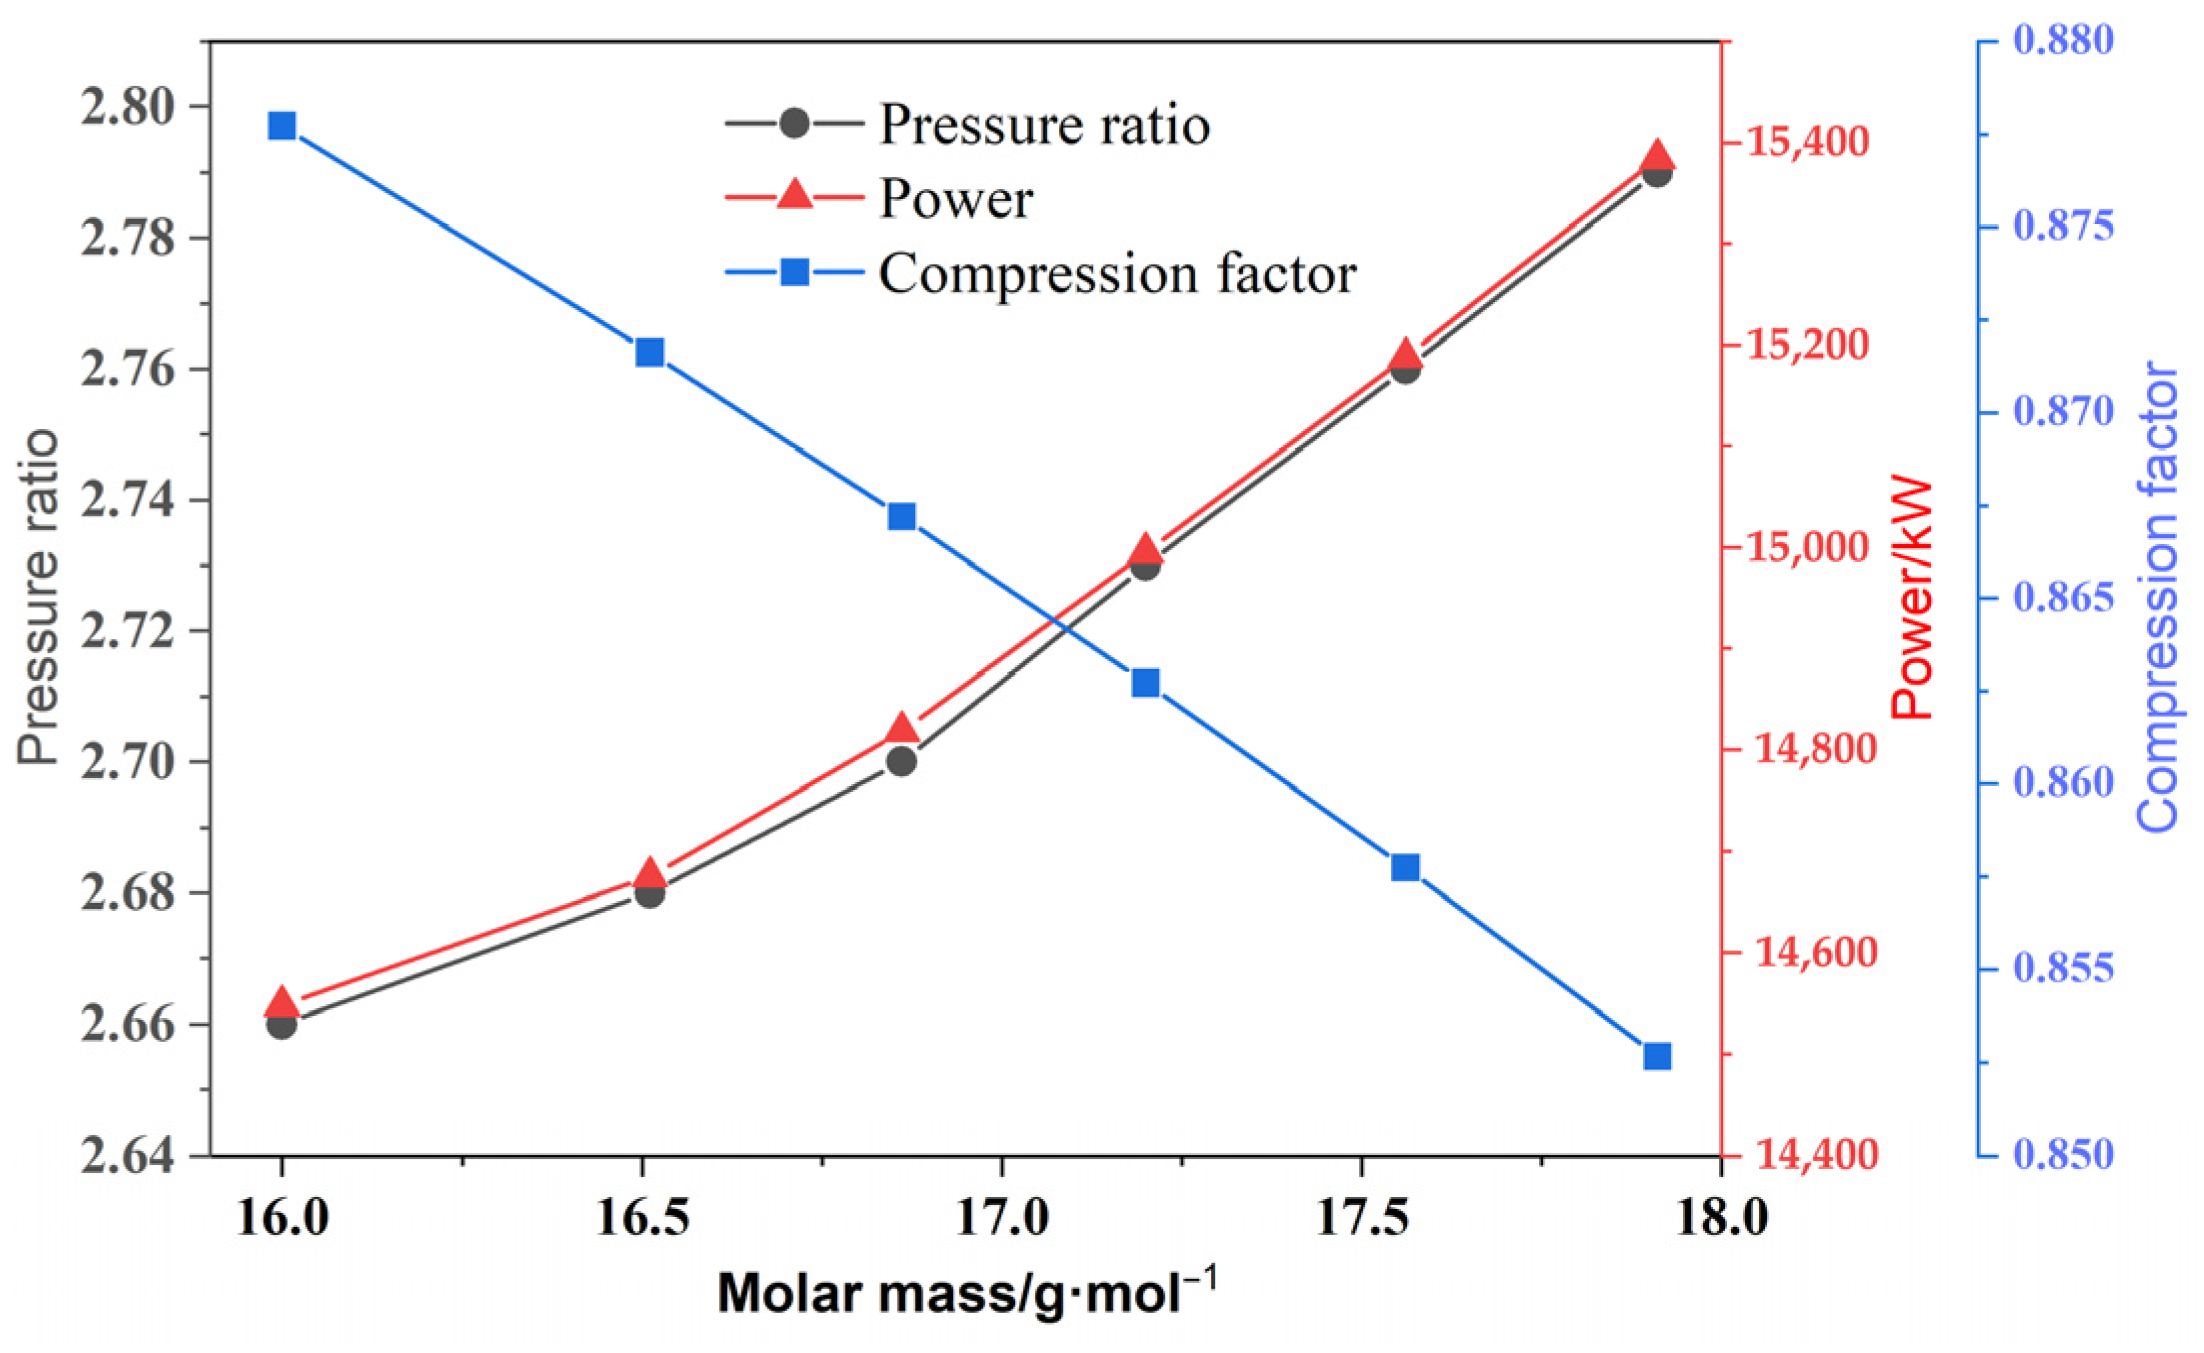
To further explore the influence mechanism of gas component changes on the compressor performance, calculate the compression factors of components under different molar masses, and select the working condition with a flow rate of 6000 m3/h for analysis, as shown in Figure 7. As the average molar mass of the mixed gas increases, the compression factor continuously decreases, and the gas is easier to compress, so the pressure ratio increases.

3.2. Research on the Change in Natural Gas Inlet Temperature

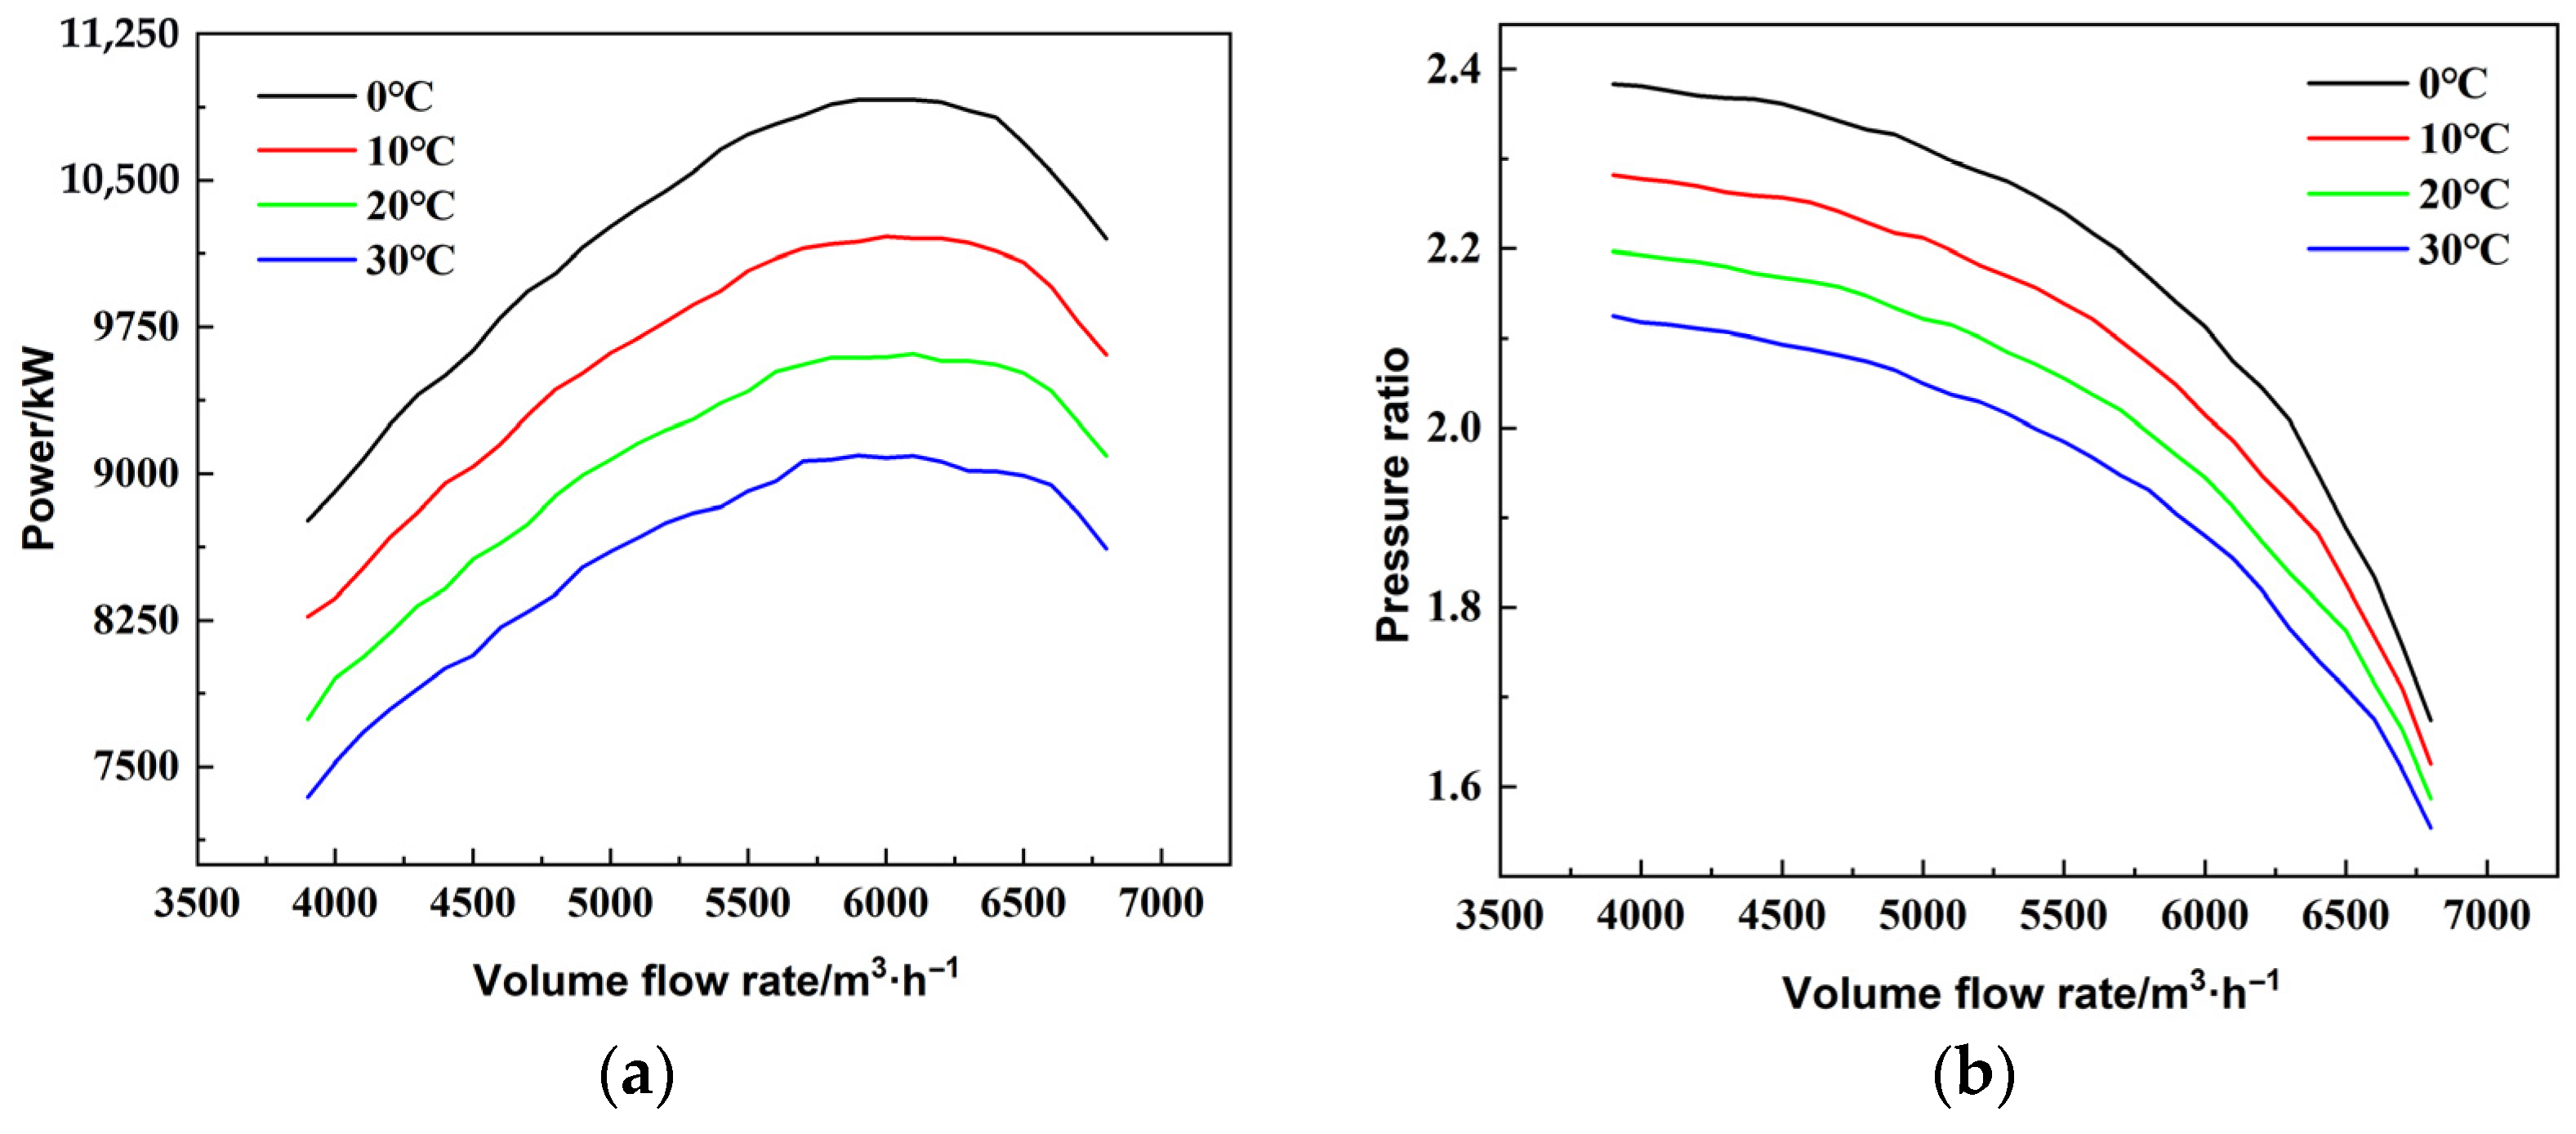
During the actual operation of the compressor, the inlet temperature will change with the seasons. For example, from spring to autumn, the inlet temperature of the compressor will gradually rise and then gradually fall. Research on the influence of inlet temperature change on the compressor has an important role in compressor performance evaluation and regulation [27,28]. Figure 8a and Figure 8b are the compressor pressure ratio curves and power curves at different inlet temperatures under the same inlet pressure and the same rotational speed, respectively.
It can be seen that when the compressor flow rate and rotational speed are constant, as the inlet temperature increases, the compressor power and pressure ratio decrease. And as the flow rate increases, the influence of the inlet temperature on the pressure ratio gradually decreases. Therefore, in the actual operation of the compressor, when the inlet temperature increases, in order to maintain the stability of the flow rate and pressure ratio, it can be achieved by increasing the rotational speed. For a gas storage compressor operating from spring to autumn, if the daily flow rate is stable and the pressure ratio requirement is stable, its rotation speed should be increased first and then decreased to cope with the impact of temperature changes.

3.3. Research on the Change in Natural Gas Inlet Pressure

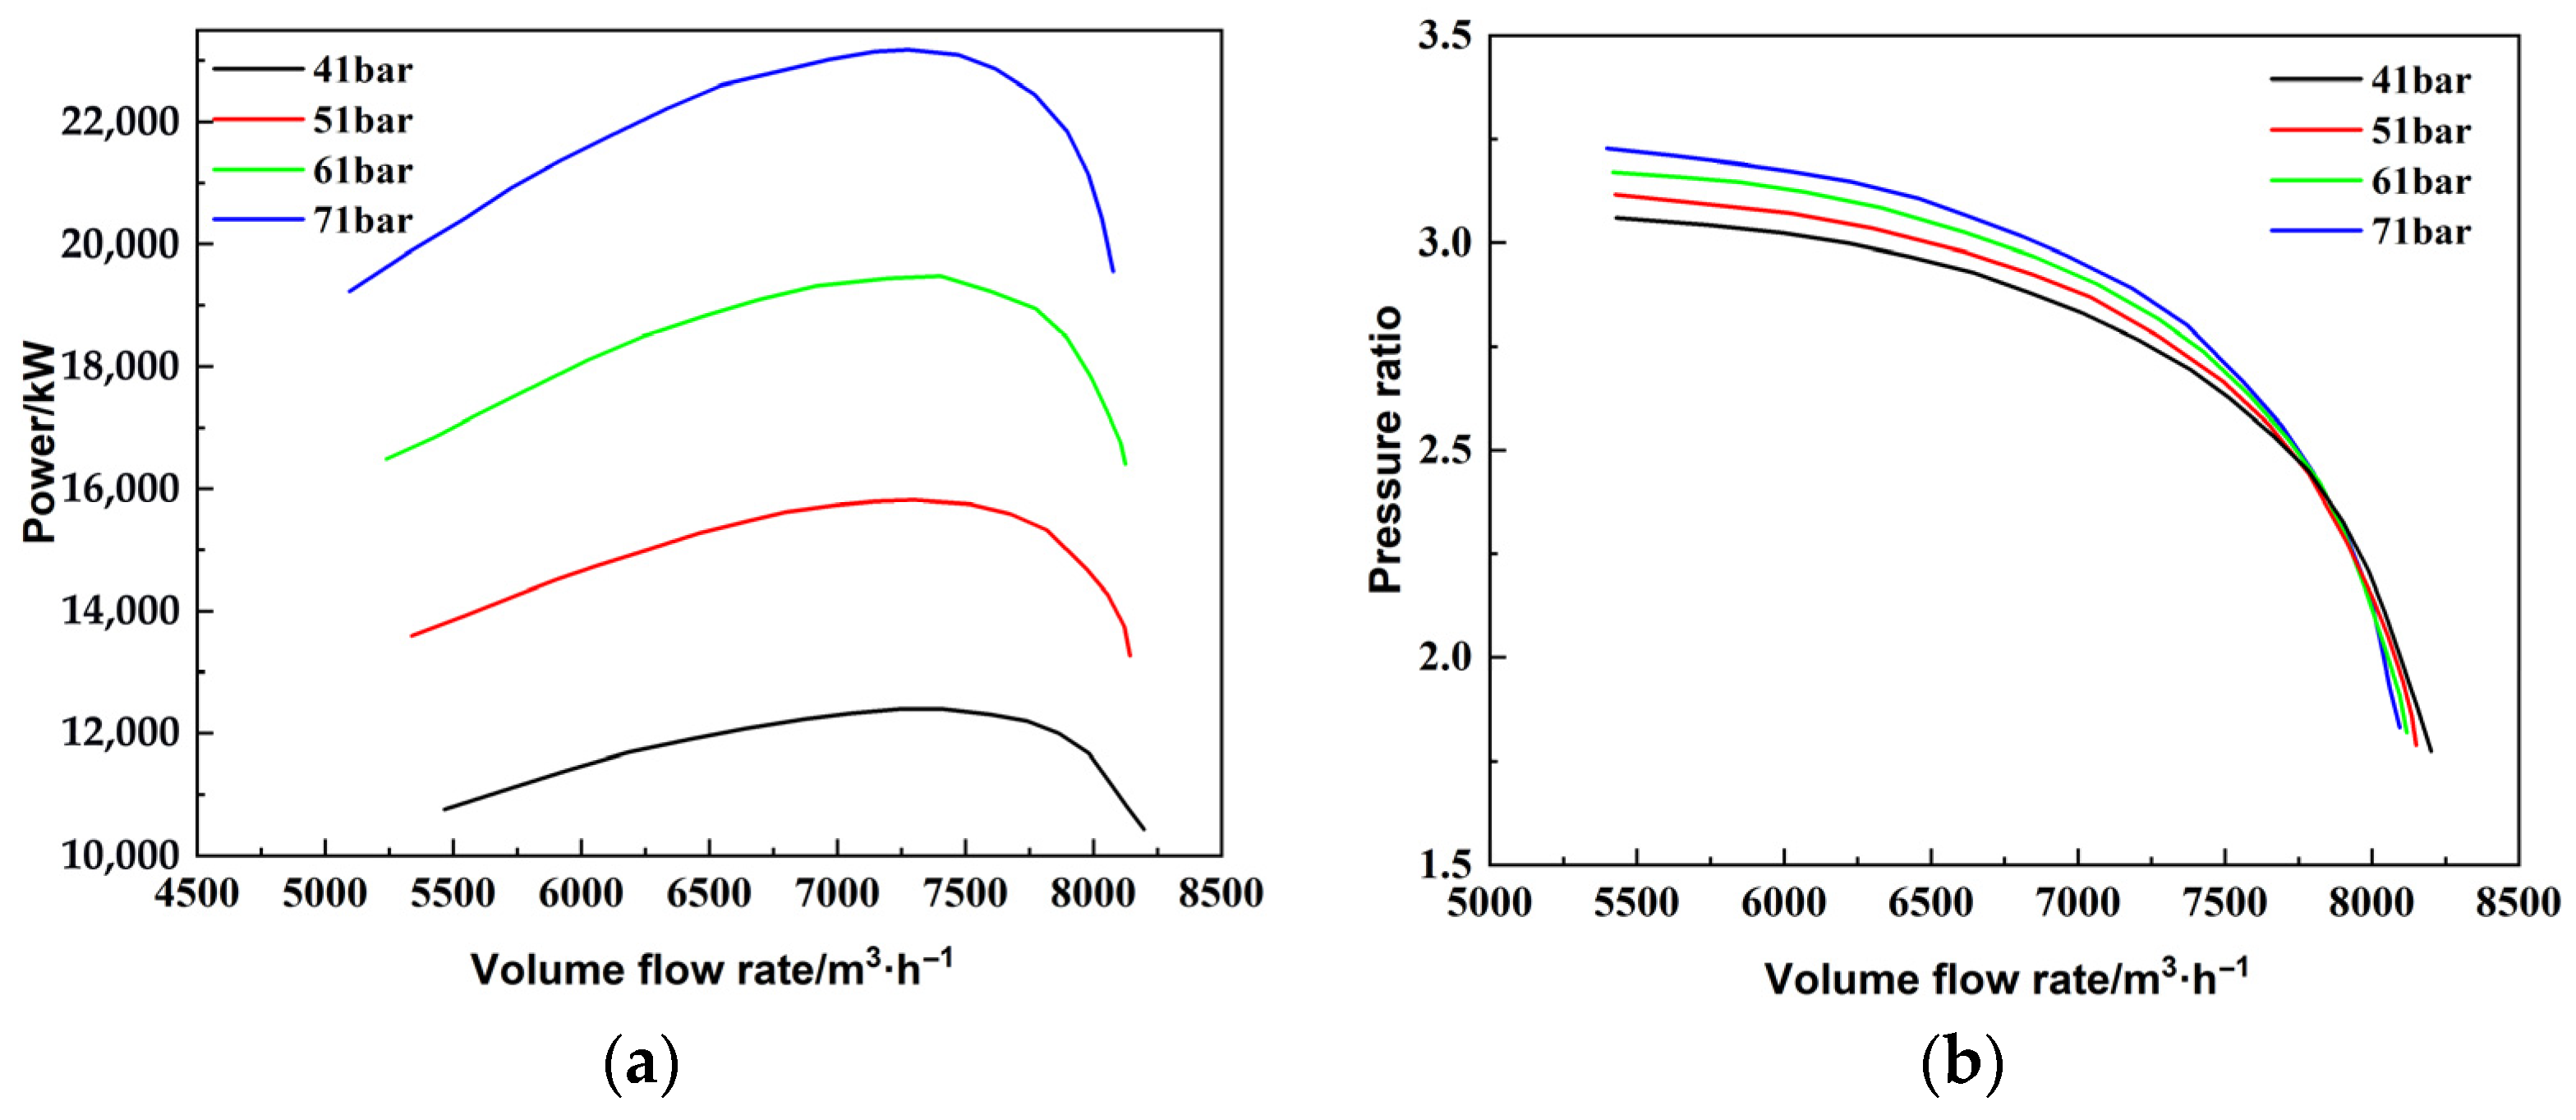
During the actual operation of the compressor the inlet pressure of the compressor will change continuously over time, and the change in inlet pressure will have a certain impact on the aerodynamic performance of the compressor [29]. By studying the performance changes under different inlet pressures, the best operating conditions can be found to maximize the efficiency and output power of the compressor. At the same time, it also helps to develop reasonable operation and maintenance strategies to avoid safety accidents caused by pressure fluctuations. In addition, through in-depth research, customized compressor design and operation schemes can be provided for different application scenarios to meet diversified needs. Figure 9a is the performance curve of the compressor pressure ratio under different pressures under the same temperature and rotational speed conditions, and Figure 9b is the performance curve of the compressor power under different pressures.
It can be seen that when the compressor flow rate and rotational speed are constant, as the inlet pressure increases, the compressor power increases, and the pressure ratio rises in the low-flow area and falls in the high-flow area. Therefore, during the actual operation of the compressor, when the inlet pressure increases, in order to maintain the stability of the flow rate and pressure ratio, it can be accomplished by reducing the rotational speed.

4. Conclusions

This work proposes a performance curve conversion process for centrifugal compressors under actual working conditions and writes programs to realize batch performance conversion and performance curve drawing. Compared with the existing conversion methods, this method takes into account the calculation method of the polytropic exponent m and designs the conversion method of the exhaust temperature curve. The feasibility of the conversion is verified by existing data, which proves that the method is feasible and has high precision. The pressure ratio conversion error is less than 0.9% and the power conversion error is less than 2%. Moreover, the conversion accuracy is higher for working conditions with variable pressure, and the conversion errors of pressure ratio and power are both less than 0.3%. Through this method, the centrifugal compressor can also be calculated with variable temperatures, variable pressures, and variable compositions. We study the variable operating conditions and components of the gas storage compressor by this method. When the flow rate and rotation speed are constant, the increase in inlet temperature will cause the decrease in compressor power and pressure ratio; the increase in inlet pressure will cause the increase in power, and the pressure will change according to the flow rate of the working condition point; and with the decrease in the average gas molar mass, both the pressure ratio and power will decrease to a certain extent. Through the research in this article, the performance of multi-stage centrifugal compressors in natural gas storage reservoirs can be evaluated and optimized more accurately, thereby improving the operation efficiency and safety of the storage reservoir.
This study also has certain limitations. The performance conversion method in this study assumes that the specific heat ratio of the gas remains constant. However, the specific heat ratio of the actual gas may vary under changing temperature and pressure conditions. This method also assumes geometric similarity of the equipment, but in practice, manufacturing errors or differences in surface roughness may exist, leading to dissimilar flow conditions.

Author Contributions

Conceptualization, H.C. and G.L.; methodology, H.Z. and N.W.; software, Y.S.; validation, H.C. and H.Z.; formal analysis, G.L. and L.Z.; investigation, H.C. and N.W.; resources, H.C. and L.Z.; data curation, S.W.; writing—original draft preparation, Y.S.; writing—review and editing, S.W.; visualization, Y.S.; supervision, L.L.; project administration, L.L.; funding acquisition, L.L. All authors have read and agreed to the published version of the manuscript.

Funding

This research was funded by Key Research and Development Program in Shaanxi Province of China (No. 2024PT-ZCK-68).

Data Availability Statement

The data that support the findings of this study are available within the article.

Conflicts of Interest

Authors Hua Chen, Gang Li, Ning Wang, Lifeng Zhou, and Hao Zhou were employed by the company Zhongyou Liaohe Engineering Co., Ltd. Author Shengping Wang was employed by the company Liaohe Oilfield (Panjin) Gas Storage Co., Ltd. The remaining authors declare that the research was conducted in the absence of any commercial or financial relationships that could be construed as a potential conflict of interest.

References

  1. Ma, X.; Wu, X.; Wu, Y.; Wang, Y. Energy system design of offshore natural gas hydrates mining platforms considering multi-period f loating wind farm optimization and production profile fluctuation. Energy 2023, 265, 126360. [Google Scholar] [CrossRef]
  2. Ma, T.B.; Chu, H.Y.; Li, J.W.; Zhang, J.X.; Gao, Y.B.; Zhu, W.Y.; Lee, W.J. Rate transient analysis for multilateral horizontal well in natural gas hydrate: Superposition principle and reciprocity. Int. J. Coal Sci. Technol 2024, 11, 70. [Google Scholar] [CrossRef]
  3. Weitemeyer, S.; Kleinhans, D.; Vogt, T.; Agert, C. Integration of renewable energy sources in future power systems: The role of storage. Renew. Energy 2015, 75, 14–20. [Google Scholar] [CrossRef]
  4. Ji, W.D.; Wan, J.F.; Li, J.C.; Chen, S.Z.; Ma, H.L.; Yu, H.B. Integration of large-scale underground energy storage technologies and renewable energy sources. Adv. Geo-Energy Res. 2024, 14, 81–85. [Google Scholar] [CrossRef]
  5. Lei, H. Opportunities and challenges to the construction of underground gas storages in China. Oil Gas Storage Transp. 2018, 37, 728–733. [Google Scholar]
  6. Marfatia, Z.; Li, X. Data-Driven Natural Gas Compressor Models for Gas Transport Network Optimization. Digit. Chem. Eng. 2022, 3, 100030. [Google Scholar] [CrossRef]
  7. Song, J.N.; Liu, G.B.; Gong, J.M.; Yang, Q.C.; Zhao, Y.Y.; Li, L.S. Simulation on performance and regulation strategy of centrifugal refrigeration compressor with gas bearings in water chiller. Appl. Therm. Eng. 2024, 236, 121650. [Google Scholar] [CrossRef]
  8. Navarro, E.; Redon, A.; Gonzalvez-Macia, J.; Martinez-Galvan, I.O.; Corberan, J.M. Characterization of a vapor injection scroll compressor as a function of low, intermediate and high pressures and temperature conditions. Int. J. Refrig. 2013, 36, 1821–1829. [Google Scholar] [CrossRef]
  9. Sun, D.K.; Shen, X.H.; Xu, D.K.; Ning, F.F.; Li, J.B.; Sun, X.F. Analysis of flow characteristics and flow stability on an axial compressor with inlet temperature ramp distortion. Aerosp. Sci. Technol. 2025, 164, 110457. [Google Scholar] [CrossRef]
  10. Chen, H.Y.; Shang, J.; Yi, L.; Zhao, B.H.; Liu, S.H.; Wang, J.Z.; Cui, L.; Wu, J.H. Investigations on control strategies for multi-stage cold compressors in superfluid helium system. Cryogenics 2025, 147, 104039. [Google Scholar] [CrossRef]
  11. Peng, Q.Q.; Bao, R.X.; Li, J.; Ren, J.; Tang, J.; Li, J.; Pan, Z.; Ma, G.; Gao, Y.; Kang, T.; et al. Centrifugal compressor performance prediction and dynamic simulation of natural gas hydrogen blended. Int. J. Hydrogen Energy 2024, 52, 872–893. [Google Scholar] [CrossRef]
  12. Wang, W.; Zhao, S.; Wang, X.F.; Xu, B.P.; Xu, R.D. Accurate and fast prediction of the viscosity of natural gascomponents based on the binary regression analysis method. J. Beijing Univ. Chem. Technol. 2017, 44, 13–19. [Google Scholar]
  13. Mahmood, F.G.; Amir, N.; Mahdi, D.D.; Hamid, R.R. Effects of natural gas compositions on CNG (compressed natural gas) reciprocating compressors performance. Energy 2015, 90, 1152–1162. [Google Scholar] [CrossRef]
  14. Wang, L.F.; Gu, B.; Wang, T. Fast Calculation Model of Fan Performance Based on Similarity Theory. Fluid Mach. 2012, 40, 24–28. [Google Scholar]
  15. Xie, J.X. Approximate Similarity Conversion of Performance Curves for Circulating Hydrogen Centrifugal Compressors in Hydrotreating Units. Compressor Technol. 2008, 30–32. [Google Scholar] [CrossRef]
  16. Qing, D.F. Performance Conversion and Application of Multistage Centrifugal Compressors under Partially Similar Conditions. Mod Mach. 2002, 2, 011. [Google Scholar]
  17. Wang, K.X.; Zuo, Z.T.; Liang, Q.; Guo, W.B.; Chen, H.S. Performance prediction methods for centrifugal compressors: A review. Energy Storage Sci. Technol. 2023, 12, 3435–3444. [Google Scholar]
  18. Wang, P.; Yang, F.; Sun, D.L.; Wang, L.Y.; Zuo, D. Performance conversion of centrifugal compressors based on predictor corrector method. Chin. Sci. Bull. 2018, 63, 571–578. [Google Scholar] [CrossRef]
  19. Miao, X.G.; Liu, L.; Wang, Z.Y.; Chen, X.M. Improved Error-Based Ensemble Learning Model for Compressor Performance Parameter Prediction. Energies 2024, 17, 2113. [Google Scholar] [CrossRef]
  20. Xu, P.C.; Zou, Z.P.; Yao, L.C. A unified performance conversion method for similar compressors working with different gases based on polytropic analysis and deep-learning improvement. Energy Convers. Manag. 2021, 247, 114747. [Google Scholar] [CrossRef]
  21. Jeong, H.; Ko, K.; Kim, J.; Kim, J.; Eom, S.; Na, S.; Choi, G. Evaluation of Prediction Model for Compressor Performance Using Artificial Neural Network Models and Reduced-Order Models. Energies 2024, 17, 3686. [Google Scholar] [CrossRef]
  22. Zhu, C.Y.; Qin, G.L.; Wu, R.L. Comparison of the Two Similar Con version of Centrifugal Compressor Based on Test. Chin. J. Turbomach. 2011, 53, 24–27. [Google Scholar]
  23. Xiong, Z.Y.; Liu, Y.H.; Cai, Y.J.; Zhang, W.C.; Wang, Z.Q.; Li, Z.L.; Peng, S.Y. Research on the effect of green hydrogen blending on natural gas centrifugal compressor performance. Renew. Energy 2025, 242, 122378. [Google Scholar] [CrossRef]
  24. Wu, F.; Jiang, J.B.; Peng, X.D.; Li, M.T.; Yu, M.F. Influence of natural gas composition and operating conditions on the phase change of dry gas seals for pipeline compressors. Int. J. Heat Fluid Flow 2025, 115, 109832. [Google Scholar] [CrossRef]
  25. Yan, J.; Wang, Y.T. Study of Performance Changes in Centrifugal Compressors Working in Different Refrigerants. Energies 2024, 17, 2784. [Google Scholar] [CrossRef]
  26. Magee, J.W.; Haynes, W.M.; Hiza, M.J. Isochoric (p, ρ, T) measurements for five natural gas mixtures from T =(225 to 350) K at pressures to 35 MPa. J. Chem. Thermodyn. 1997, 29, 1439–1454. [Google Scholar] [CrossRef]
  27. Li, J.C.; Fan, Y.; Wu, T.; Wu, T.; Zhang, Y.; Zhou, K. Investigation on the Compressibility Factor of Hydrogen-Doped Natural Gas Using GERG-2008 Equation of State. Energies 2025, 18, 53. [Google Scholar] [CrossRef]
  28. Zhang, Y.; Zhang, Q. Analysis of energy consumption for multi-stage compression considering the compression ratio and inlet temperature. Comput. Appl. Chem. 2018, 35, 711–718. [Google Scholar]
  29. Huang, D.Y.; Zhou, B.W.; Jiang, D.J.; Pan, J.X. Numerical study on the effect of the inlet pressure on centrifugal compressor performance. Tsinghua Sci. Technol. 2024, 64, 1666–1676. [Google Scholar]
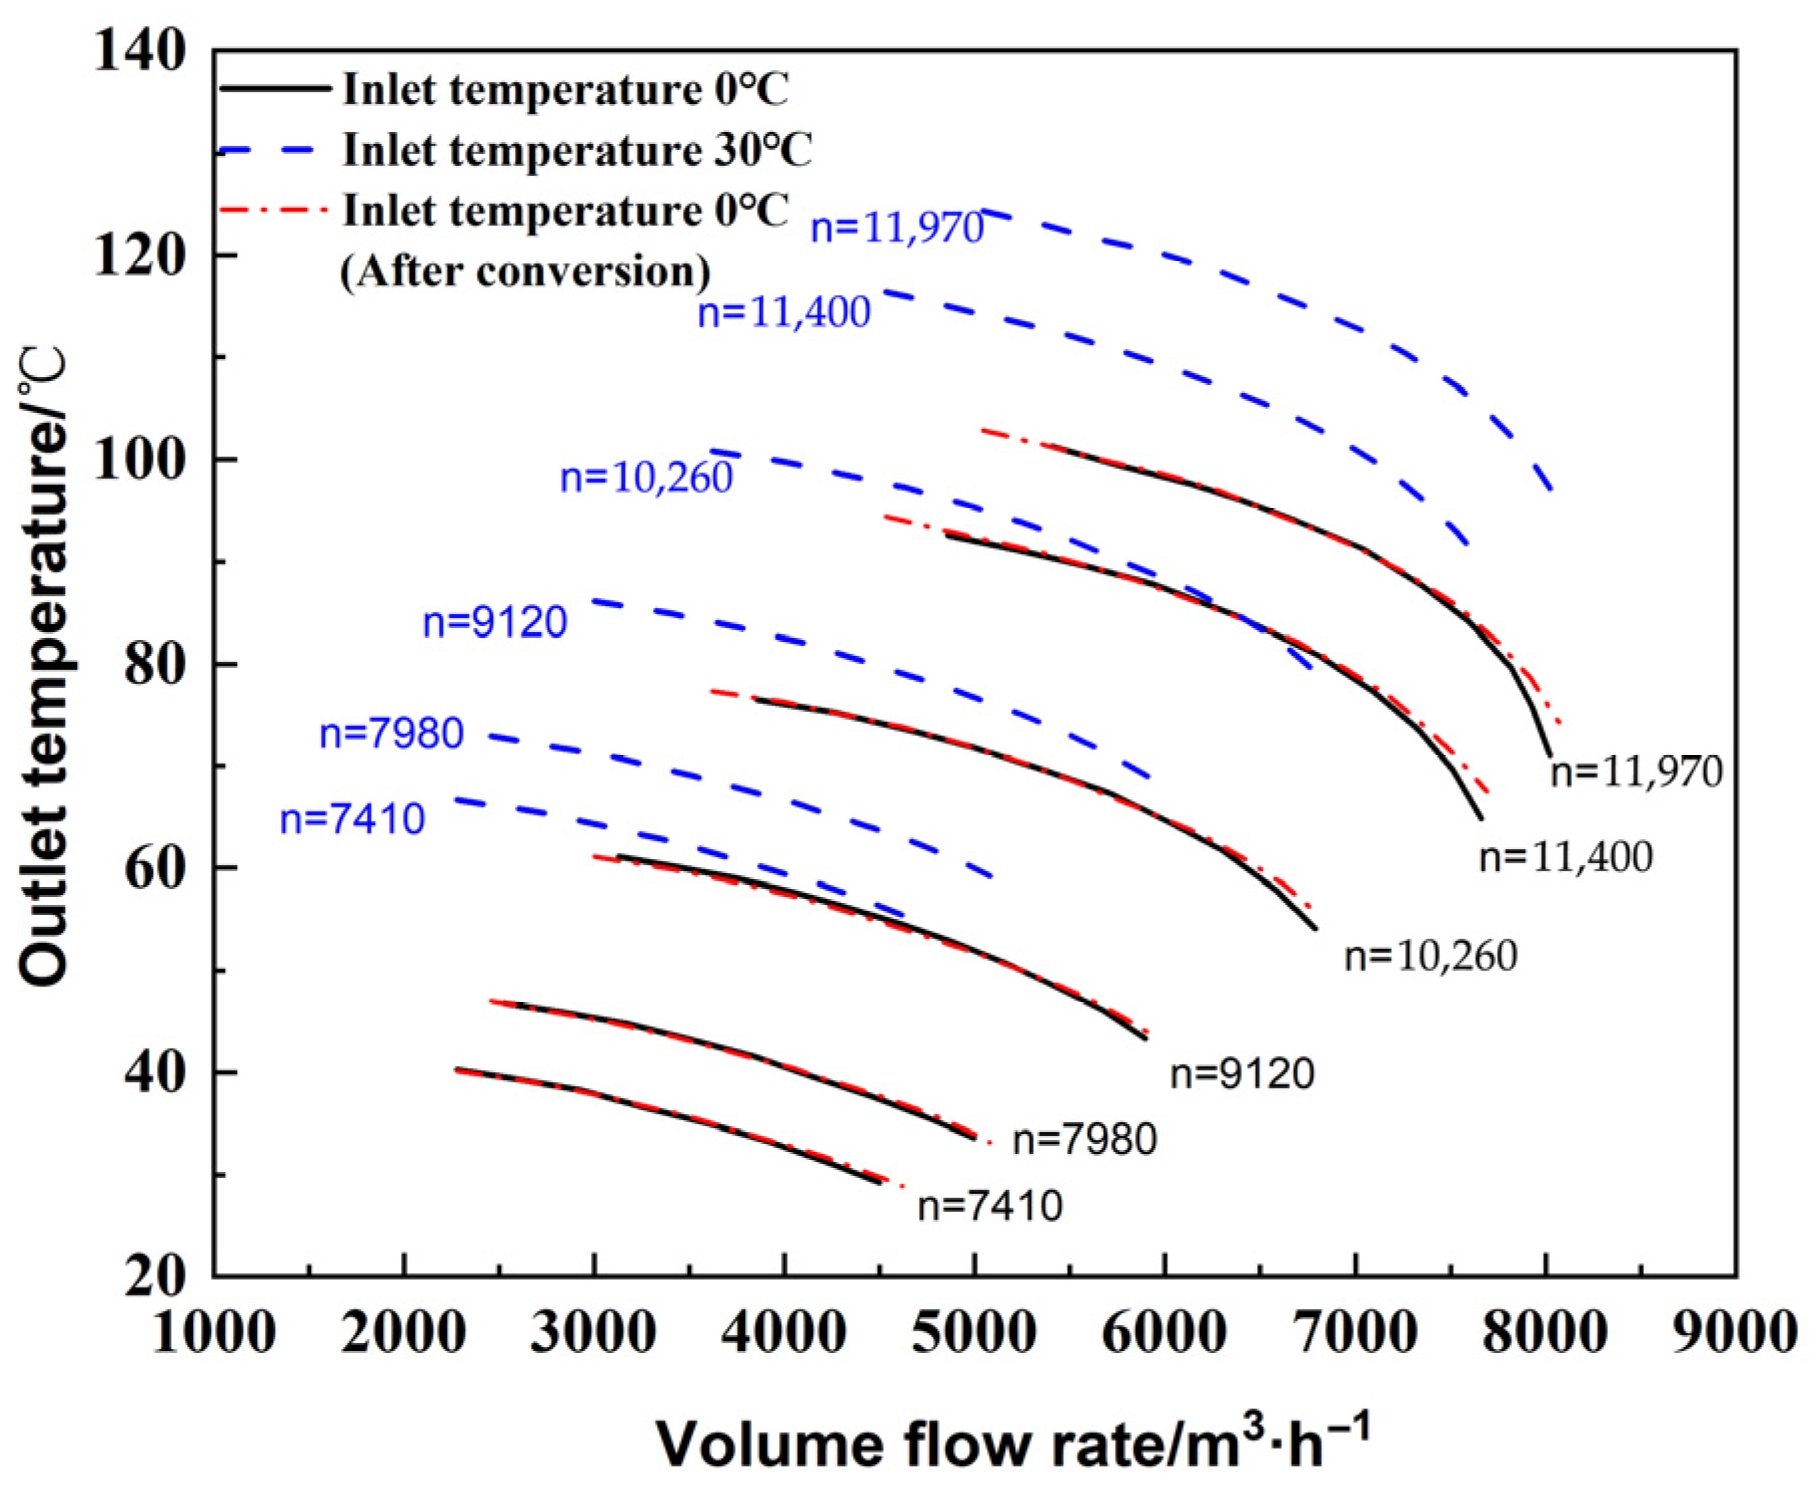
Figure 1. Verification of exhaust temperature curve conversion method. Black line: the curve at the inlet temperature of 0 °C; blue line: the curve at the inlet temperature of 30 °C; red line: the curve obtained by converting the blue line (30 °C) to the inlet temperature of 0 °C through the conversion method.
Energies 18 03930 g001
Figure 2. The performance curve conversion process.
Energies 18 03930 g002
Figure 3. Temperature conversion. ((a) Power curve; (b) pressure ratio curve).
Energies 18 03930 g003
Figure 4. Pressure conversion. ((a) Power curve; (b) pressure ratio curve).
Energies 18 03930 g004
Figure 5. Conversion of pressure and temperature. ((a) Power curve; (b) pressure ratio curve).
Energies 18 03930 g005
Figure 6. Impact of natural gas component variation on compressorperformance. ((a) Power curve; (b) pressure ratio curve).
Energies 18 03930 g006
Figure 7. The influence mechanism of component changes.
Energies 18 03930 g007
Figure 8. Impact of import temperature changes on compressor performance. ((a) Power curve; (b) pressure ratio curve).
Energies 18 03930 g008
Figure 9. Impact of changes in import pressure on compressor performance. ((a) Power curve; (b) pressure ratio curve).
Energies 18 03930 g009
Table 1. Verification of basic parameters for working conditions.
Operating ConditionsInlet Temperature/°CInlet Pressure/MPa
104.1
2304.1
306.1
4306.1
Table 2. Actual operating data of gas storage compressor.
Operating
Conditions
Inlet
Pressure/MPa
Inlet
Temperature/°C
Outlet
Pressure/MPa
Rotate Speed/rpmVolume Flow Rate/103·m3·h−1
15.948.49.167523281.9
26.829.510.647410316.6
36.8212.210.827645337.4
46.9414.811.598007348.5
56.914.911.978238346.8
Table 3. The comparison between the conversion results and the operating data errors.
Operating ConditionsActual Power/kWConverted Power/kWδP/%Actual Pressure RatioConverted Pressure Ratioδε/%
1466747120.961.5421.5470.32
2516750482.31.5601.5530.45
3562557141.61.5861.5950.57
4641764891.11.6701.6760.36
5691767782.01.7351.7390.23
Table 4. Actual natural gas components.
ComponentMolar Score/%
methane91.42
ethane4.93
propane0.96
butane0.41
C5+0.24
nitrogen1.63
carbon dioxide0.12
oxygen0.29
Disclaimer/Publisher’s Note: The statements, opinions and data contained in all publications are solely those of the individual author(s) and contributor(s) and not of MDPI and/or the editor(s). MDPI and/or the editor(s) disclaim responsibility for any injury to people or property resulting from any ideas, methods, instructions or products referred to in the content.