Article

Impact Analysis of Price Cap on Bidding Strategies of VPP Considering Imbalance Penalty Structures

1
Department of Electrical and Computer Engineering, Seoul National University, Seoul 08826, Republic of Korea
2
Power System Economics Laboratory, Department of Electrical Engineering, Jeju National University, 102 Jejudaehak-ro, Jeju 62343, Republic of Korea
*
Author to whom correspondence should be addressed.
Energies 2025, 18(15), 3927; https://doi.org/10.3390/en18153927
Submission received: 30 June 2025 / Revised: 18 July 2025 / Accepted: 22 July 2025 / Published: 23 July 2025
(This article belongs to the Section C: Energy Economics and Policy)

Abstract

Virtual power plants (VPPs) enable the efficient participation of distributed renewable energy resources in electricity markets by aggregating them. However, the profitability of VPPs is challenged by market volatility and regulatory constraints, such as price caps and imbalance penalties. This study examines the joint impact of varying price cap levels and imbalance penalty structures on the bidding strategies and revenues of VPPs. A stochastic optimization model was developed, where a three-stage scenario tree was utilized to capture the uncertainty in electricity prices and renewable generation output. Simulations were performed under various market conditions using real-world price and generation data from the Korean electricity market. The analysis reveals that higher price cap coefficients lead to greater revenue and more segmented bidding strategies, especially under asymmetric penalty structures. Segment-wise analysis of bid price–quantity pairs shows that over-bidding is preferred under upward-only penalty schemes, while under-bidding is preferred under downward-only ones. Notably, revenue improvement tapers off beyond a price cap coefficient of 0.8, which indicates that there exists an optimal threshold for regulatory design. The findings of this study suggest the need for coordination between price caps and imbalance penalties to maintain market efficiency while supporting renewable energy integration. The proposed framework also offers practical insights for market operators and policymakers seeking to balance profitability, adaptability, and stability in VPP-integrated electricity markets.

1. Introduction

Virtual power plants (VPPs) have emerged as an effective market mechanism, enabling small-scale energy sources, particularly renewable energy sources (RESs), to participate in electricity markets as a unified entity [1]. By aggregating distributed energy resources, VPPs enhance market efficiency and grid flexibility [2]. Reflecting this growing importance, the global VPP market is projected to expand from USD 5.01 billion in 2024 to USD 16.65 billion by 2030, representing a compound annual growth rate of 22.3% [3]. This growth is primarily driven by ongoing grid modernization, increased the integration of RES, and the adoption of demand response solutions.
However, the growing integration of RESs introduces new challenges to market operations, particularly regarding imbalances between bid quantities and actual generation. Unlike conventional power generation, RES is characterized by inherent variability, making accurate power bidding inherently difficult. To address this discrepancy, regulatory frameworks have implemented imbalance penalties to secure the accountability of market participants, including VPPs [4,5]. These penalties aim to minimize deviations between scheduled bids and actual generation, thereby supporting stable market operations.
One promising solution to manage these imbalances is the integration of energy storage systems (ESSs) into VPPs. For instance, Xiang et al. proposed an improved robust optimization model for demand-side management in distributed generation systems [6]. By leveraging the standby power of ESSs, their method effectively addresses output fluctuations, thereby reducing operational costs and enhancing system reliability. Similarly, Zare et al. demonstrated that incorporating ESSs within VPPs can minimize power curtailment and total system costs—including emissions and pollution penalties—while also accounting for the operational costs of unit synchronization and shutdowns [7].
Nevertheless, while imbalance penalties promote discipline, overly stringent penalties may inadvertently discourage participation, especially for RES-based VPPs that face greater forecasting uncertainty. This can raise financial risk and reduce system flexibility.
In this context, bidding strategies become critical for VPPs seeking to balance revenue optimization with regulatory compliance [8,9,10]. Market participants must navigate a complex landscape characterized by price volatility, generation uncertainty, and imbalance penalties. Among the key regulatory tools influencing bidding behavior is the price cap, which is implemented to mitigate extreme price fluctuations and protect consumers [11]. Like energy policy instruments, such as feed-in tariffs, quotas, and tenders, contribute positively to the expansion of RESs [12], higher price caps enhance bidding flexibility for VPPs, lead to an increase in their revenue, and thereby have a positive impact on the expansion of RESs. Conversely, while lower price caps contribute to price stability, they may constrain revenue opportunities of VPPs. In high-risk environments, particularly those dominated by RESs, a strict price cap may hinder cost recovery. Consequently, achieving a well-calibrated balance between price cap stringency and market efficiency is essential for ensuring both system stability and financial viability of VPP operations.
This study aims to investigate the impact of varying price cap levels on the bidding strategies of VPPs under different imbalance penalty structures. By exploring the interaction between price caps, imbalance penalties, and bidding behaviors, an optimal price cap level is identified that balances market stability with the economic viability of VPPs. The findings of this analysis are expected to offer actionable insights for policymakers and market designers striving to enhance the operational efficiency of VPPs in RES-integrated electricity markets.
The key contributions of this study are as follows. First, the combined effects of price cap levels and imbalance penalty structures on VPP bidding behavior are examined for an integrated analysis of regulatory impacts. Then, it is explored how these regulatory elements shape bid strategies, the distribution of awarded bid prices, and ultimately, VPP revenue under different market conditions. Second, a detailed segment-level analysis is conducted to reveal how price cap coefficients influence the number and granularity of bid price–quantity pairs. The analysis highlights how bidding strategies differ across penalty structures, offering nuanced insights into market behavior. Lastly, a stochastic optimization model is developed and applied using real-world market and generation data. This model generates practical insights into how regulatory settings influence strategic decisions, and it supports policy recommendations aimed at enhancing both market efficiency and VPP profitability.
The remainder of this paper is organized as follows. Section 2 reviews previous studies dealing with the characteristics of price caps. In Section 3, we describe the penalty structures and introduce a stochastic optimization model with the objective of maximizing the revenue of a VPP. Section 4 presents simulation results that demonstrate the effects of the price cap on the bidding strategies and associated variation in the revenue of a VPP. Section 5 provides an in-depth discussion and policy recommendations based on the findings of this study, followed by concluding remarks in Section 6.

2. Literature Review

A price cap serves as a fundamental regulatory mechanism in electricity markets, aimed at mitigating extreme price fluctuations and ensuring market stability. While a price cap helps curb market power and protect consumers from price spikes, it also introduces complexities into the bidding strategies of market participants [13].
Numerous studies have examined how price cap influences market behavior. Joskow et al. [14] analyzed the strategic bidding behaviors of generators under price cap regulation in a wholesale electricity market. Their findings reveal that a price cap may inadvertently distort market dynamics by influencing producers’ supply decisions, although it offers short-term consumer protection. Generators possessing market power may respond by reducing supply strategically, thereby keeping prices within favorable ranges defined by the cap. In contrast, in unregulated markets, producers can adjust output more flexibly in response to real-time prices.
Similarly, Vossler et al. [15] conducted an experimental analysis on soft price caps and found that such mechanisms tend to encourage more conservative bidding strategies. As a result, market prices become less responsive to changes in generation costs and demand. While soft caps enhance market stability and competitiveness, they may also suppress the incentives for peak generators, potentially affecting long-term supply adequacy.
Beyond bidding behavior, the broader economic implications of price cap, including its effects on efficiency, profitability, and investment, have also been extensively studied. Moshrefi et al. [16] highlighted the dual nature of price cap: while it increases market competition by lowering equilibrium prices, it may also diminish profitability and, consequently, the willingness of participants to remain in the market. Their study indicates that, although competitive bidding is encouraged, too stringent price cap could prompt exits from the market or reductions in generation capacity, ultimately threatening the adequacy and reliability of power supply.
Rioux et al. [17] extended this discussion by illustrating how a price cap can introduce significant market distortions. When generators are unable to freely set prices based on cost structures and market conditions, true supply costs may be undervalued, distorting price signals. This distortion tends to favor coal-fired power plants, which benefit from relatively stable cost structures. In contrast, RESs, which are inherently variable and harder to forecast, are disproportionately disadvantaged in price-capped markets. The risk of not being fairly compensated reduces the economic viability of RESs, deterring investment in RESs and potentially limiting their long-term penetration. Furthermore, price cap weakens the system flexibility by muting price signals necessary for demand response, energy storage systems, and VPPs to respond profitably during peak demand periods.
Berbey-Burgos et al. [18] evaluated the impact of Spain’s price cap policy on the revenue of a 110 MWe solar power tower plant with 10 h thermal energy storage TES located in Seville. Their findings reveal that, in the absence of the price cap, the plant’s revenue would have increased by 30 million euros, representing a 49.6% gain. The study underscores how price cap policies distort market signals, rendering strategies such as dispatch optimization during peak-price periods significantly less effective.
Briggs et al. [19] took a long-term perspective, emphasizing that price caps not only act as short-term tools but also influence investment signals. When caps are set below the social marginal cost, they can suppress price signals necessary for attracting investment in new generation capacity. Sirin et al. [20] examined the implementation of a temporary price cap in the Turkish electricity market and found that, although the cap reduced total market welfare, it had minimal impact on key operational indicators such as market-clearing prices and generation volumes. Notably, participants adjusted their bids downward to avoid triggering the cap, which increased competitiveness but also introduced further distortions during periods of high demand volatility.
Across these studies, a recurring theme emerges: price caps can successfully curb market power and enhance competition, yet they often involve trade-offs between market efficiency, profitability, and investment incentives. Price cap tends to lower market-clearing prices and reshape bidding behavior, occasionally resulting in strategic supply withholding or altered bidding tactics to remain within regulatory constraints.
Despite the depth of existing literature, most prior research has focused primarily on the effects of price caps under standard market conditions, often overlooking the critical role of imbalance penalty structures. Moreover, few studies have conducted a detailed analysis of VPP bidding strategies at the level of individual bid segments, limiting insights into how regulatory mechanisms shape granular decision-making.
Thus, this study seeks to bridge the existing gap by analyzing how various imbalance penalty structures interact with price cap levels to influence VPP bidding behaviors. Unlike earlier works that primarily focus on price formation and producer incentives, this research investigates the joint impacts of price caps and imbalance penalties on both bid prices and bid quantities, providing a comprehensive perspective on bidding behavior in VPP operation.

3. Imbalance Penalty and Optimization Model

3.1. Imbalance Penalty Structures

Imbalance penalties are essential regulatory tools used to incentivize accurate forecasting and adherence to scheduled generation commitments in electricity markets. These penalties are generally classified into symmetric and asymmetric structures, depending on how they address deviations from scheduled generation quantities [21]. In a symmetric penalty structure, often referred to as a bidirectional penalty scheme (SPS-BPS), penalties are imposed uniformly regardless of whether the actual generation at time t, P a c t t , exceeds or falls short of the awarded power, Q d a t , in the day-ahead market. The deviation at time t, denoted as P d e v t , is calculated as the absolute difference between actual and scheduled generation as noted in Equation (1). This structure ensures that any deviation—positive or negative—incurs a financial cost, thus encouraging participants to improve their forecasting accuracy and market discipline.
P d e v t = P a c t t Q d a t
In contrast, an asymmetric penalty structure (APS) differentiates penalties based on the direction of the deviation. When the actual generation exceeds the scheduled bid, the deviation is classified as an upward deviation, and a penalty is imposed under the upward penalty scheme (APS-UPS), represented in Equation (2). Conversely, when the actual generation falls below the scheduled quantity, it constitutes a downward deviation and incurs a penalty under the downward penalty scheme (APS-DPS), given by Equation (3).
P d e v t = m a x P a c t t Q d a t , 0
P d e v t = m a x P a w d t Q d a t , 0
Once a deviation type is determined, the actual penalty amount at time t, P p e n t , is computed by subtracting a tolerance threshold, P t o l , from the deviation magnitude as noted in Equation (4). This threshold serves as a buffer to prevent disproportionately severe penalties, considering the variability of power sources.
P p e n t = m a x P d e v t P t o l , 0
Finally, the total penalty cost is then obtained by incorporating a penalty cost rate at time t, λ p e n t , as in Equation (5). To effectively discourage large deviations, λ p e n t is set higher than the day-ahead system marginal price. This progressive penalty mechanism ensures that larger deviations incur higher costs, thereby reinforcing the motivation for market participants—especially VPPs with renewable energy portfolios—to improve their forecasting and bidding strategies.
C p e n t = λ p e n t P p e n t

3.2. Optimization Model for Bidding Strategy

The optimization model for determining a bidding strategy can be formulated as a stochastic programming problem aimed at maximizing the expected profit of a VPP. Stochastic programming is widely used in the literature for establishing optimal bidding strategies for VPPs, as it effectively captures uncertainties in market prices and generation output [22,23,24]. To effectively capture market volatility and generation uncertainty, the model in this study utilizes a three-stage scenario tree, where randomness in both electricity prices and renewable generation output is systematically incorporated.
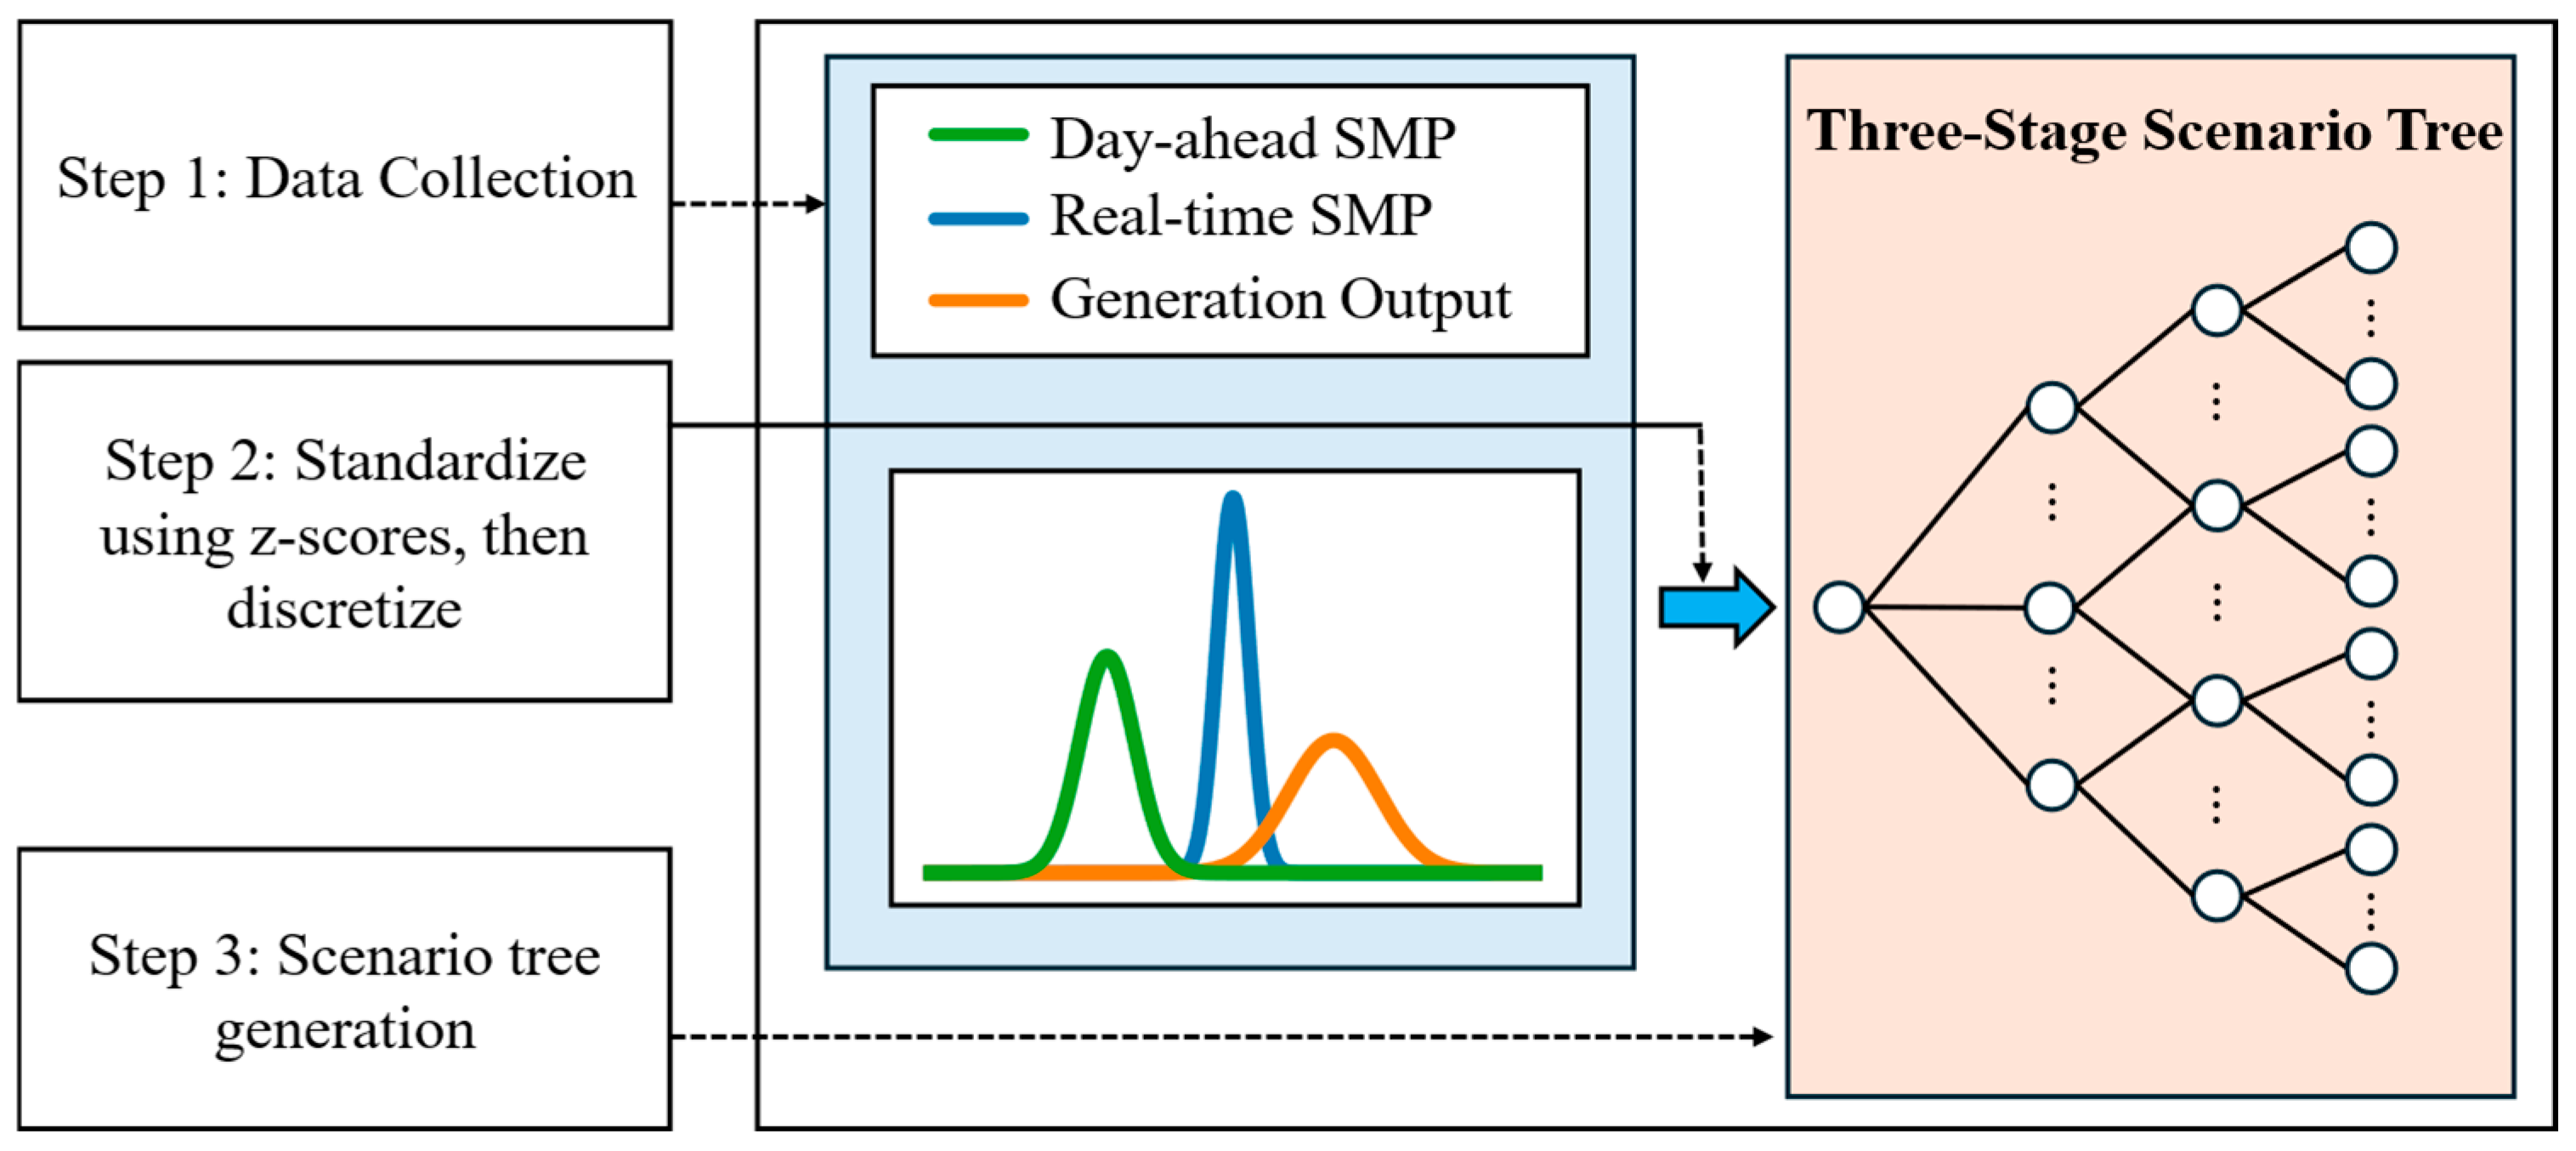
  • Stage 1 represents the day-ahead market, where the VPP submits its bidding quantities based on forecasts of electricity prices and expected generation levels.
  • Stage 2 captures the real-time market conditions, which may deviate from initial forecasts due to the fluctuation of prices and loads.
  • Stage 3 accounts for the actual generation outcome, influenced by inherent variability in RESs.
To construct realistic scenarios, historical system marginal prices (SMPs) and generation data are analyzed to compute mean values and standard deviations. These parameters are then used to generate normally distributed probability distributions for each random variable. The distributions are discretized using the z-score method, producing seven discrete levels ranging from 3 to + 3 of the standard deviation. This method is applied separately to day-ahead SMPs, real-time SMPs, and generation output. In particular, a real-time market scenario is generated from a normal distribution, where the mean is set to the predicted value of the day-ahead market scenario and the standard deviation is reduced as forecasting accuracy improves as the prediction horizon shortens. Thus, the generation process for real-time market is conditional on the scenario selected in the day-ahead market. Consequently, this process yields a three-stage scenario tree with 343 scenarios (i.e., 7 3 = 343 ), effectively capturing a wide spectrum of market and generation outcomes (Figure 1).
The objective of the optimization model is to maximize the expected total profit of the VPP operator over all considered scenarios. This profit comprises revenues from the day-ahead and real-time electricity markets, income from renewable energy certificates (RECs), and the costs associated with imbalance penalties. The objective function is formulated as shown in Equation (6).
m a x   α , β , γ R d a t + R r t t + R r e c t C p e n t π p r o b t , α , β , γ
where R d a t and R r t t represent the revenues earned in the day-ahead and real-time markets at time t, respectively, and R r e c t denotes the revenue from RECs. The term π p r o b t , α , β , γ refers to the joint probability of scenario ( α , β , γ ) at time t, reflecting uncertainty in day-ahead SMPs ( α ), real-time SMPs ( β ), and generation output ( γ ).
The optimization model assumes that VPP participants can only submit bids in the day-ahead market, while they are allowed in the real-time market to make adjustments in power delivery or perform strategic curtailment for reducing imbalance penalty exposure.
Each component of the VPP’s revenue is calculated as shown in Equations (7)–(9). The day-ahead market price at time t under scenario α is denoted as λ d a t , α , and the real-time market price under scenario ( α , β ) is represented by λ r t t , α , β . The price of REC is assumed to be constant across all scenarios and is denoted by λ r e c . The imbalance penalty cost is computed using the formulation in Equation (5), with the distinction that it is now evaluated over all scenario combinations to reflect stochastic variability in prices and generation.
The day-ahead market revenue is computed using Equation (7), reflecting the product of scheduled bids and day-ahead prices. The real-time market revenue, derived from deviations between actual and scheduled generation, is calculated as in Equation (8). Lastly, the REC revenue, based on the actual generation delivered in each scenario, is determined according to Equation (9).
R d a t = α Q d a t , α λ d a t , α
R r t t = α , β , γ P a c t t , α , β , γ Q d a t , α λ r t t , α , β
R r e c t = α , β , γ P a c t t , α , β , γ λ r e c
VPPs are allowed to submit up to ten bid price–quantity pairs in the day-ahead market. These bids must be arranged in a non-decreasing order, both in terms of price and quantity, to reflect standard market bidding protocols. This requirement is expressed in Equations (10) and (11):
ρ b i d , 1 t ρ b i d , 2 t ρ b i d , 9 t ρ b i d , 10 t
Q b i d , 1 t Q b i d , 2 t Q b i d , 9 t Q b i d , 10 t
where ρ b i d , i t and Q b i d , i t are the bid price and the bid quantity for the i t h segment at time t, respectively.
To eliminate redundant or non-meaningful bids, additional constraints are imposed to ensure consistency between price and quantity levels. Specifically, if two consecutive bids have identical prices, they must also have identical quantities, and vice versa. These logical conditions are enforced through Equations (12) and (13):
ρ b i d , i t =   ρ b i d , i + 1 t Q b i d , i t =   Q b i d , i + 1 t             i { 1 , , 9 }
Q b i d , i t = Q b i d , i + 1 t ρ b i d , i t = ρ b i d , i + 1 t             i { 1 , , 9 }
Furthermore, to allow an explicit evaluation of regulatory constraints on bidding behavior, bid prices are bounded by a price floor ρ f l o o r t and a price cap ρ c a p t at time t, as shown in Equation (14). Similarly, bid quantities are constrained between the VPP’s minimum and maximum generation capacities, denoted as Q m i n and Q m a x , respectively, to ensure operational feasibility, as expressed in Equation (15).
ρ f l o o r t   ρ b i d , i t     ρ c a p t
Q m i n   Q b i d , i t     Q m a x
To examine the effect of the price cap constraint on bidding strategies, the price cap, ρ c a p t , is defined using a scaling coefficient, ε c a p , referred to as the price cap coefficient. This coefficient is applied to the maximum day-ahead SMP across all scenarios α , as expressed in Equation (16). This formulation facilitates a sensitivity analysis of how the price cap influences optimal bidding behavior.
ρ c a p t =   ( max α λ d a t , α ) · ε c a p
To incorporate penalty avoidance strategies into the optimization framework, the model integrates a power curtailment mechanism that enables VPPs to dynamically adjust their real-time generation levels in response to potential imbalance penalties. This mechanism allows VPPs to curtail a portion of the available power when necessary, thereby mitigating financial risks arising from generation uncertainties. The actual power output is calculated as the difference between the available power and the curtailed amount, as shown in Equation (17). The curtailment is bounded to ensure that it remains non-negative and does not exceed the available generation capacity, as expressed in Equation (18).
P a c t t , α , β , γ = P a v a t , α , β , γ P c u r t , α , β , γ
0 P c u r t , α , β , γ P a v a t , α , β , γ
The day-ahead awarded quantity Q d a t , α for scenario α at time t is determined by selecting the bid segment k whose bid price, ρ b i d , k t , is the highest among the bid prices less than or equal to λ d a t , α . This relationship is expressed as show in Equation (19).
Q d a t , α = Q b i d , k t                 w h e r e             k = m a x i ρ b i d , i t λ d a t , α
Similarly, the corresponding awarded bid price, ρ d a t , α , is determined as the bid price of the same segment k, as shown in Equation (20).
ρ d a t , α = ρ b i d , k t                 w h e r e             k = m a x i ρ b i d , i t λ d a t , α
This formulation ensures consistency between the awarded price and quantity in the day-ahead market based on the scenario-specific clearing price.
To ensure tractability and computational efficiency, the model is formulated as a linear programming (LP) problem. Nonlinear components are linearized using two methods: the Big-M method is applied to linearize the conditional logic embedded in the bid structure constraints of Equations (12) and (13), and piecewise linear approximation is employed to handle the quadratic terms in the imbalance penalty cost function in Equation (5). Through these linearization techniques, the model maintains its ability to capture key operational behaviors and regulatory constraints while remaining solvable with standard LP solvers.

4. Case Studies

4.1. Simulation Environments

To evaluate the impact of price caps and imbalance penalties on the bidding strategies of VPPs, a simulation study was conducted using real market data. Specifically, SMP data for both the day-ahead and real-time markets were collected from the Korea Power Exchange (KPX) database, covering the period from March to June 2024. They are classified according to the time range into the prices during morning, noon, and night, and then depicted as probability density functions (PDFs) as shown in Figure 2.
For the generation input, the model incorporated the actual output profile of a wind turbine-based VPP located in Jeju, Korea, recorded on 17 March 2024. Like SMP, the generation data are also represented as PDFs during the morning, noon, and night as presented in Figure 3.
The purpose of choosing three representative periods of (i) morning, (ii) noon, and (iii) night is to capture the variability in market conditions and renewable generation. In more specific terms, these periods, respectively, represent (i) low generation and low demand, (ii) high generation and high demand, and (iii) moderate generation and moderate demand. For example, Figure 2 shows that the variance of the real-time SMP during noon is significantly higher than that of the day-ahead SMP, highlighting increased market volatility due to high generation and demand. Meanwhile, Figure 3 shows that the variance in generation is the lowest in the morning with minimal wind output, and the greatest at noon with high generation levels.
To simulate these uncertainties, the collected SMP and generation data were used to construct normal distributions for each scenario. Following the methodology outlined in Section 3.2, the z-score transformation was applied to discretize these distributions into a scenario tree, enabling stochastic optimization under realistic market dynamics.
In addition, REC price data for the same period were collected. Given relatively small fluctuations observed in REC prices, the REC price was treated as a constant parameter in the optimization model. The key model parameters used in this study are summarized in Table 1.
This study employs a fixed penalty rate structure to analyze how price caps influence VPP bidding behavior. When the penalty rate is modeled as a linear function, the total penalty cost increases proportionally with the size of the deviation. In such cases, a higher penalty rate amplifies the overall pressure on revenue outcomes. However, it is the direction of the deviation—whether upward or downward—that plays a more critical role in shaping optimal bidding strategies under different imbalance penalty structures [5]. Therefore, in order to isolate and clearly examine the directional effects of imbalance penalties without conflating them with varying penalty magnitudes, a fixed penalty rate is adopted as the baseline in this study. The default penalty configuration is provided in Table 1, while additional simulations using higher penalty rates are presented in Section 4.2 to assess the sensitivity of VPP revenues to different penalty severities.
The model was implemented and solved using the IBM ILOG CPLEX optimizer, which identified the optimal bidding strategy that maximizes the VPP’s expected profit while considering price caps, imbalance penalties, and uncertainties in both electricity prices and generation.

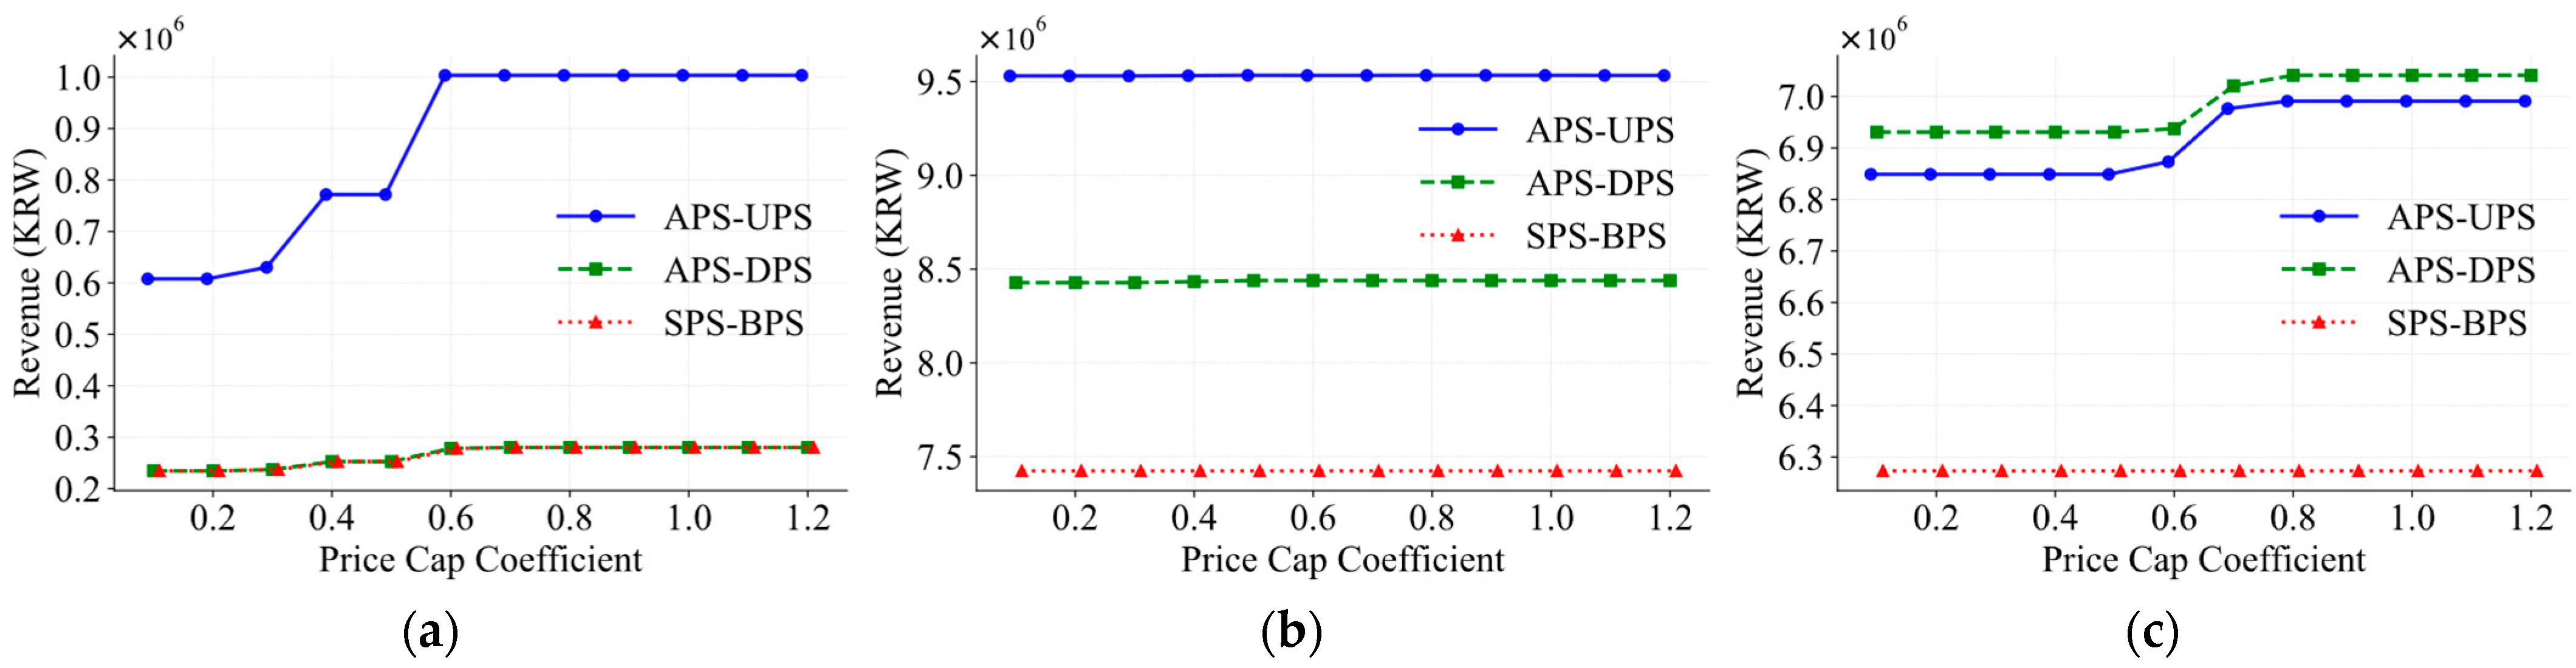
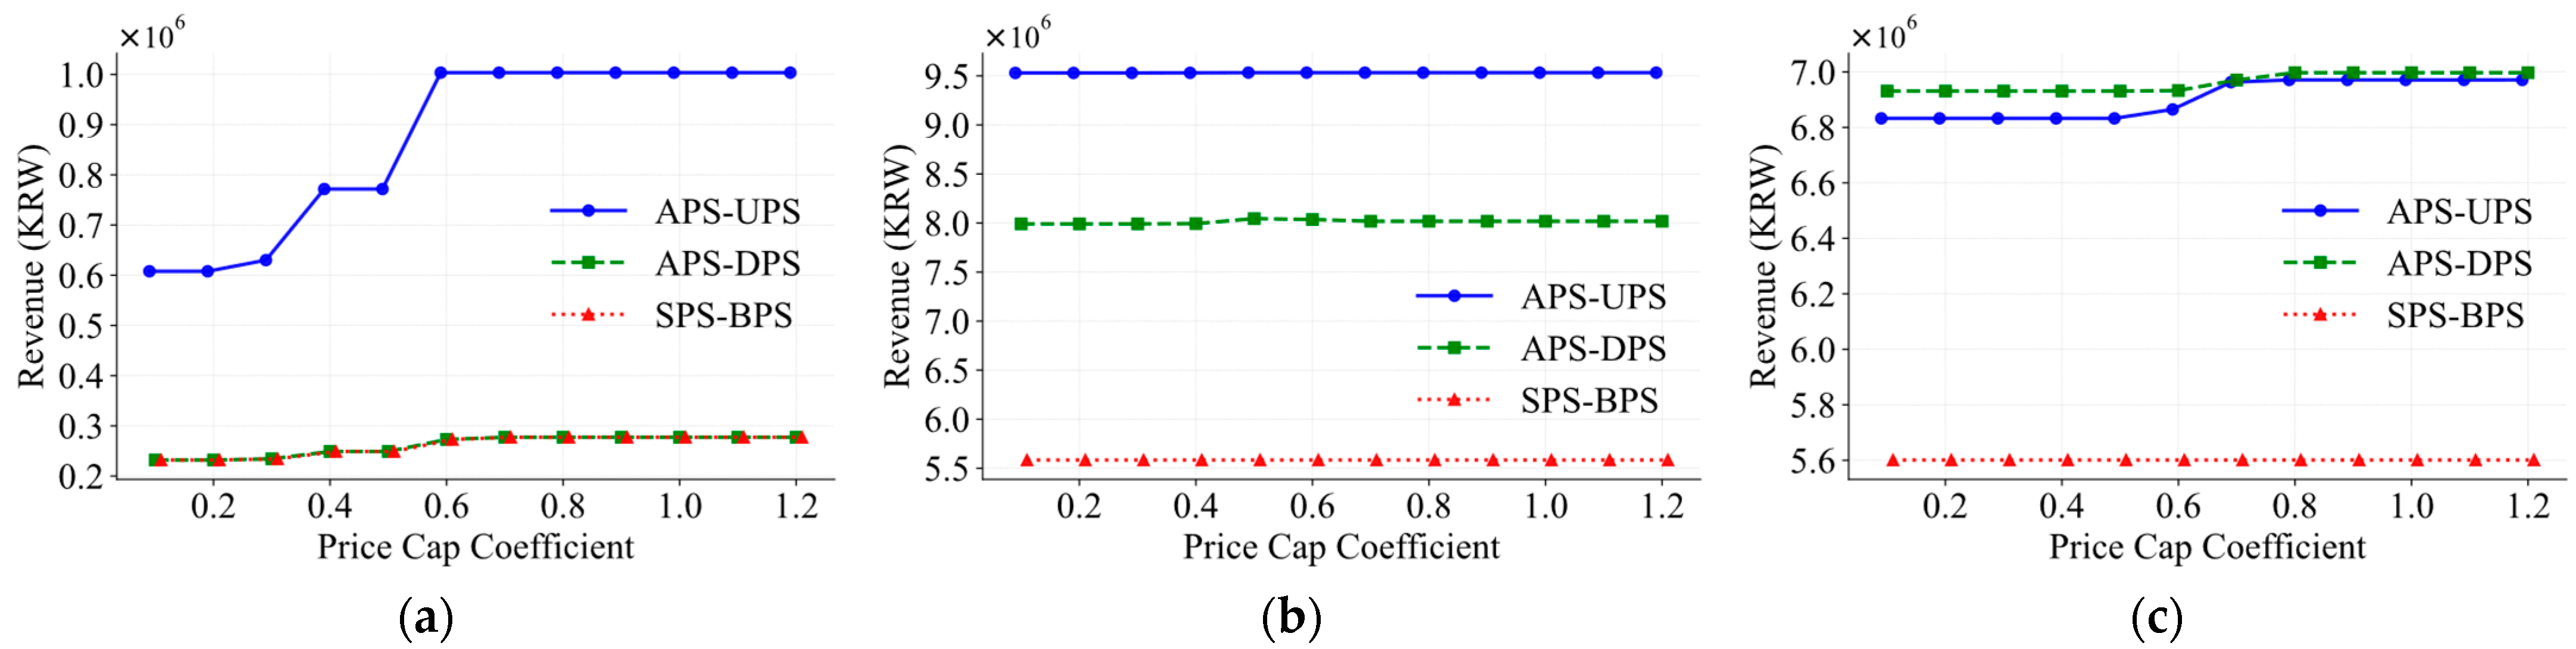
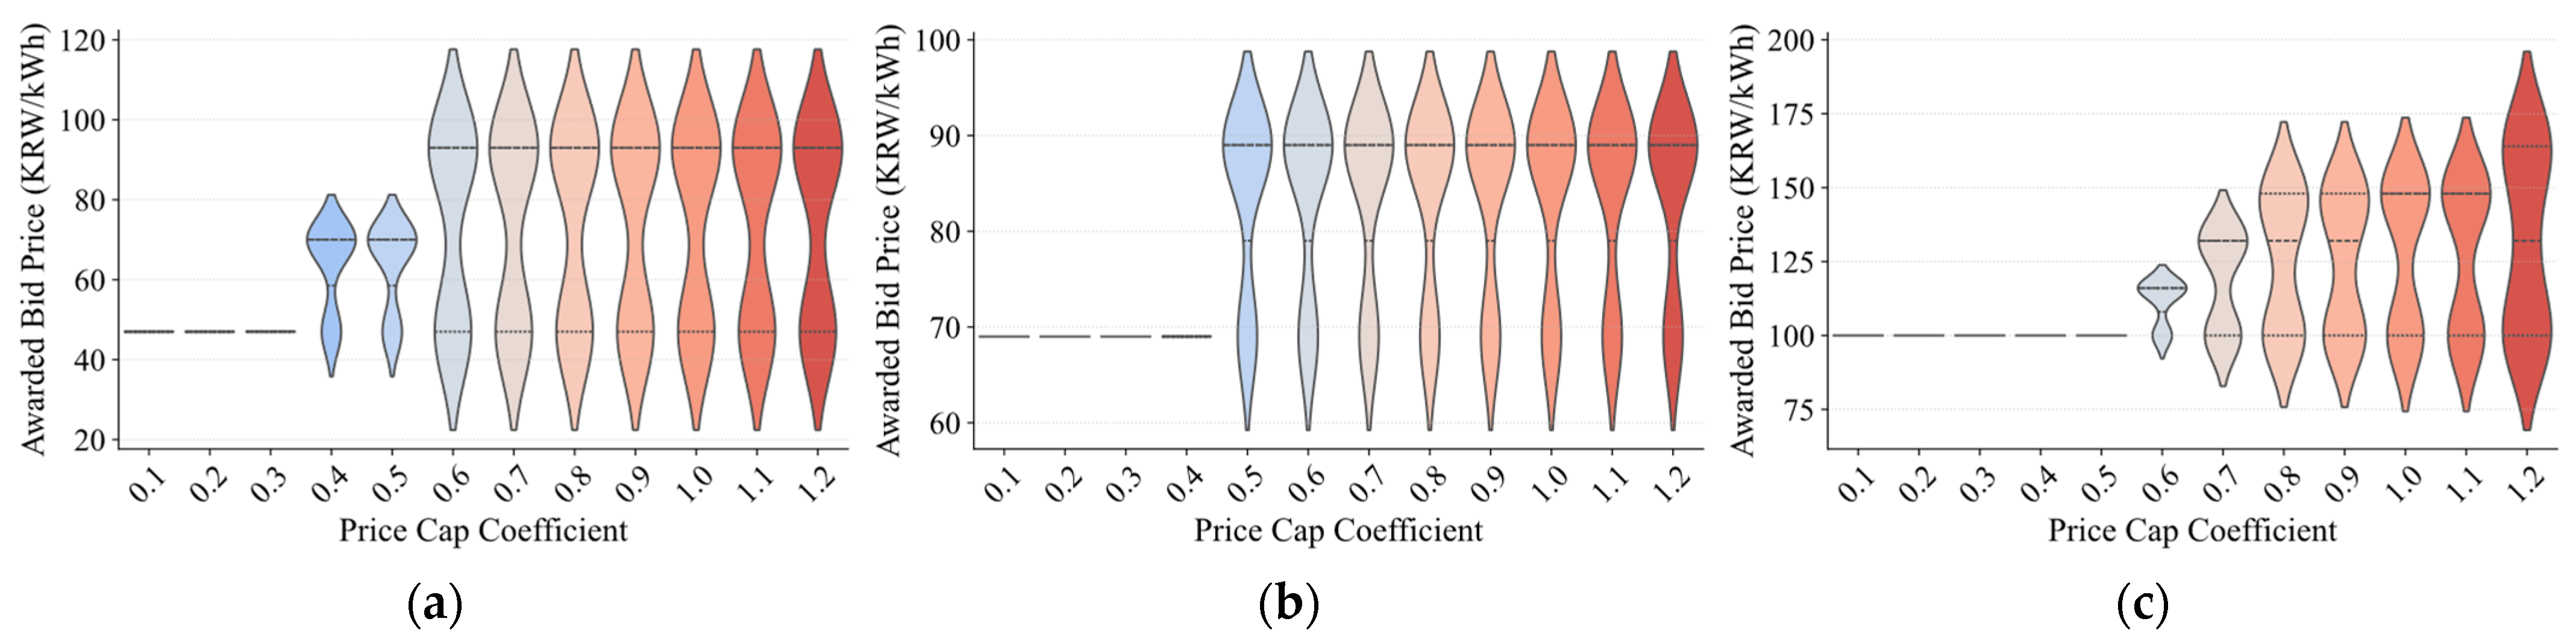
4.2. Simulation Results

The impact of price caps on the profitability of VPPs was analyzed by comparing revenue outcomes across various levels of the price cap coefficient, as illustrated in Figure 4. The baseline price cap was defined as the expected value of the day-ahead SMP, and multiple scaling coefficients were applied to assess how changes in the price cap affect the revenue. The results reveal that total revenue also increases as the price cap coefficient increases. This effect is particularly evident in the morning and evening periods, during which the difference between the day-ahead and real-time SMPs remains relatively small. Under these conditions, higher price caps provide greater bidding flexibility, enabling the VPP to respond more strategically to the market conditions and thereby improve profitability.
In contrast, the minimal sensitivity to changes in the price cap is observed in the noon case. This is because the day-ahead SMP tends to exceed the real-time SMP during this period, leading to less complex and more conservative bidding behavior. As a result, adjustments to the price cap have a diminished impact on revenue.
The analysis also demonstrates that revenue varies significantly depending on the imbalance penalty structure. The symmetric penalty structure (SPS-BPS), which imposes penalties for both upward and downward deviations, consistently results in lower profitability. In contrast, the asymmetric penalty structures (APS-UPS and APS-DPS) allow more targeted risk management and bidding flexibility, leading to higher revenue outcomes. Moreover, the influence of the price cap coefficient is more pronounced when total revenue is higher, which means that asymmetric structures are more sensitive to changes in price cap levels, exhibiting greater revenue variability.
The variation in revenue growth rates across different periods can be attributed to SMP volatility. In the morning, when SMP fluctuations are relatively mild, revenue increases gradually and becomes more noticeable once the price cap coefficient reaches around 0.6. In the case of night, where SMP variability is more significant, the revenue increase is sharper and more pronounced at higher cap levels—again, most notably around the 0.6 mark. These findings suggest that when price volatility is high, a larger price cap is required to fully leverage bidding flexibility and enhance VPP profitability.
Importantly, across all scenarios and penalty structures, the results show that increasing the price cap coefficient beyond 0.8 does not lead to additional revenue gains. This suggests that a saturation or an optimal point of the price cap should exist, beyond which the price cap no longer constrains bidding behavior or affects profitability.
Figure 5 presents a similar analysis to Figure 4, but under a more severe imbalance penalty rate, where λ p e n t , α = λ d a t , α × 2.0 . The increased penalty rate leads to an overall reduction in revenue across all scenarios, with the SPS-BPS structure being most affected due to its bidirectional penalty exposure. However, the general shape of the revenue curves remains consistent with those in Figure 4. This suggests that while penalty cost rates directly impact overall revenue, they do not significantly alter the influence of the price cap coefficient on revenue trends. In other words, price cap effects are structurally robust, even under varying penalty severities.
Figure 6 explores the impact of increased generation uncertainty by doubling the standard deviation of generation forecast errors. As uncertainty rises, total VPP revenue declines due to higher deviation risks. In the morning period, however, the revenue remains relatively stable compared to Figure 5, since the generation output is already low and thus less sensitive to variability. In contrast, the noon and night scenarios experience steeper revenue declines, particularly under symmetric penalty settings. For instance, the revenue associated with the SPS-BPS structure decreases by 31.06% at noon and 14.09% at night compared to the baseline in Figure 4.
Furthermore, as generation uncertainty increases, so does the risk of underbidding in the day-ahead market due to heightened real-time market volatility. This shift in risk profile enhances the profitability of over-bidding strategies—as adopted under APS-UPS—relative to the underbidding tendency of APS-DPS. As a result, the revenue difference between these two strategies widens significantly. At noon, the revenue gap increases by 51.86%, whereas at night, it narrows by 39.29%, both relative to the baseline in Figure 4.
Despite these changes in profitability and risk exposure, the overall revenue trends with respect to price cap coefficients remain stable, even under heightened uncertainty. This reaffirms the earlier finding that price cap effects are consistently robust across a wide range of regulatory and operational conditions, including different penalty structures and uncertainty levels.
Figure 7 shows violin plots illustrating the distribution of awarded bid prices under varying price cap coefficients for the APS-UPS structure in the three representative cases of morning, noon, and night. They show the patterns that closely mirror the revenue trends observed in Figure 4, with further insight into the strategic diversity of bids as price cap constraints are relaxed.
In the morning scenario (Figure 7a), the awarded bid prices remain clustered within a narrow range up to the price cap coefficient of around 0.5. Beyond this point, particularly from 0.6 onward, the distribution widens significantly, indicating an increase in bidding variability. This aligns with the earlier observation that revenue also begins to increase sharply from this threshold, suggesting that a more relaxed price cap enables greater strategic flexibility in the bid.
In the noon scenario (Figure 7b), although overall revenue remains relatively stable across all the price cap levels as seen in Figure 4, the awarded bid price distributions still shift noticeably. The narrow and uniform distribution observed under lower price caps expands significantly from the coefficient of 0.5 and above, even though profitability does not show dramatic improvement. This suggests that, while the price cap has a limited effect on revenue during this period, it still influences the diversity of bidding strategies, leading to risk mitigation under higher market uncertainty.
In the night scenario (Figure 7c), the distribution remains stable up to the price cap coefficient of 0.6, after which it widens considerably. The increased spread in awarded bid prices from this point onwards reflects a similar shift as seen in the morning case, that is, the enhanced flexibility in strategic bidding behavior as the price cap constraint loosens. Notably, although the revenue growth levels off beyond the coefficient of 0.8, the distribution of awarded prices continues to broaden. This indicates that adjustments to the price cap still influence market dynamics by expanding the feasible range of competitive bidding strategies even when profit gains become marginal.
Taken together, these results highlight that the price cap coefficient not only affects revenue potential but also shapes the bidding behavior of VPPs. Even in cases where revenue remains unchanged (as in the noon case), a higher price cap fosters greater diversity in awarded bid prices, reinforcing its role as a key regulatory means for balancing market flexibility and control.
As inferred from the previous results, the price cap coefficient exerts a direct influence on VPP bidding strategies. Figure 8, Figure 9 and Figure 10 illustrate how bidding behavior evolves across different values of the price cap coefficient under the three imbalance penalty structures in the night case.
Figure 8 presents the results for the APS-UPS structure, which typically encourages over-bidding strategies. Due to the design of the upward-only penalty mechanism, VPPs are incentivized to submit larger bid quantities, leading to higher awarded volumes compared to other structures. In contrast, Figure 9, corresponding to the APS-DPS structure, displays a tendency toward under-bidding, as participants seek to avoid penalties for downward deviations by bidding conservatively. Figure 10 under the SPS-BPS structure demonstrates intermediate behavior of VPPs trying to find the balance between the two extremes observed in APS-UPS and APS-DPS.
Across all three penalty structures, a consistent trend is observed: as the price cap coefficient increases, the number of bid segments increases. This means more diversified bidding strategies or a higher degree of flexibility. The increased segmentation enables VPPs to optimize their offers more precisely in response to dynamic market signals, ultimately enhancing revenue potential.
Additionally, a key distinction emerges between asymmetric and symmetric penalty structures. In the APS, as the price cap coefficient increases, substantial shifts in bid quantities occur within the specific segments that critically impact bidding outcomes. This indicates the highly responsive strategic behavior of VPPs. In contrast, under the SPS structure, the changes in bid quantities within those critical segments remain relatively modest while the number of segments may still increase. This comparison analysis highlights how the effects of price cap manifest differently depending on the penalty structure, suggesting that regulatory design must consider these interactions carefully to strike a balance between market stability and participant incentives.

5. Discussion

The results of this study highlight how market design elements—specifically, price caps and imbalance penalty structures—play a critical role in shaping the bidding strategies and profitability of VPPs. Key findings reveal that higher price cap coefficients consistently lead to increased revenue and a greater diversity of bid segmentation, which translates into more strategic and flexible bidding behaviors of VPPs. This trend is particularly evident under asymmetric penalty structures, such as APS-UPS, where the intention to avoid downward penalties encourages aggressive bidding tactics.
The comparison of APS-UPS, APS-DPS, and SPS-BPS structures demonstrates that the interaction between price cap and penalty type significantly influences market outcomes. APS-UPS promotes over-bidding to hedge against upward deviation penalty, whereas APS-DPS fosters under-bidding behavior, limiting exposure to the penalty for underperformance. The SPS-BPS structure leads to more conservative and stable bidding behavior at the expense of reduced potential revenue.
Although imbalance penalty structures differ across electricity markets, the findings of this study remain broadly applicable, as also noted by Song et al. [21]. For instance, South Korea’s Jeju Island adopted an APS-UPS structure that penalizes excess generation—a policy aligned with its high renewable energy penetration and limited transmission flexibility. Spain implemented an APS-DPS scheme that penalizes only under-generation. In contrast, many European countries, including the United Kingdom and Germany, predominantly employ symmetric structures like SPS-BPS to promote balanced bidding behavior and ensure system reliability. Despite these regulatory differences, our unified stochastic optimization model incorporates all three representative penalty types, enabling consistent and comparative assessments across varying policy contexts. This modeling flexibility broadens the relevance and potential applicability of our findings to electricity markets with diverse regulatory goals and infrastructure conditions.
A particularly noteworthy insight is the saturation effect observed in both revenue and bidding complexity at around a price cap coefficient of ε c a p = 0.8. Beyond this threshold, increasing the cap further offers little additional profitability and unnecessarily expands the range of bidding prices—potentially complicating market operations and increasing uncertainty in clearing prices. This finding indicates a natural regulatory boundary where marginal returns begin to diminish.
Importantly, the price cap effect remains structurally consistent even under stress conditions such as elevated generation uncertainty and higher penalty rates. While such conditions reduce absolute revenues, they do not fundamentally alter how VPPs adapt their bidding strategies in response to changes in price cap levels. This robustness suggests that price caps can serve as a stable and predictable regulatory tool, even in the face of operational volatility.
From a regulatory perspective, these findings underscore the importance of aligning price cap policies with the characteristics of the underlying imbalance penalty structure. For instance, symmetric penalty frameworks may require more conservative price cap levels to prevent systemic risk, whereas asymmetric schemes can accommodate more flexible caps—since significant shifts in bid quantities tend to occur within specific segments that critically influence bidding outcomes.
Regulators must balance profit incentives for market participants with the need to maintain market efficiency and grid reliability. To this end, several policy recommendations can be derived from this study:
  • Implement an adaptive price cap mechanism that adjusts dynamically in response to real-time indicators such as market volatility, generation uncertainty, and overall grid conditions. This can enhance market responsiveness while maintaining regulatory control.
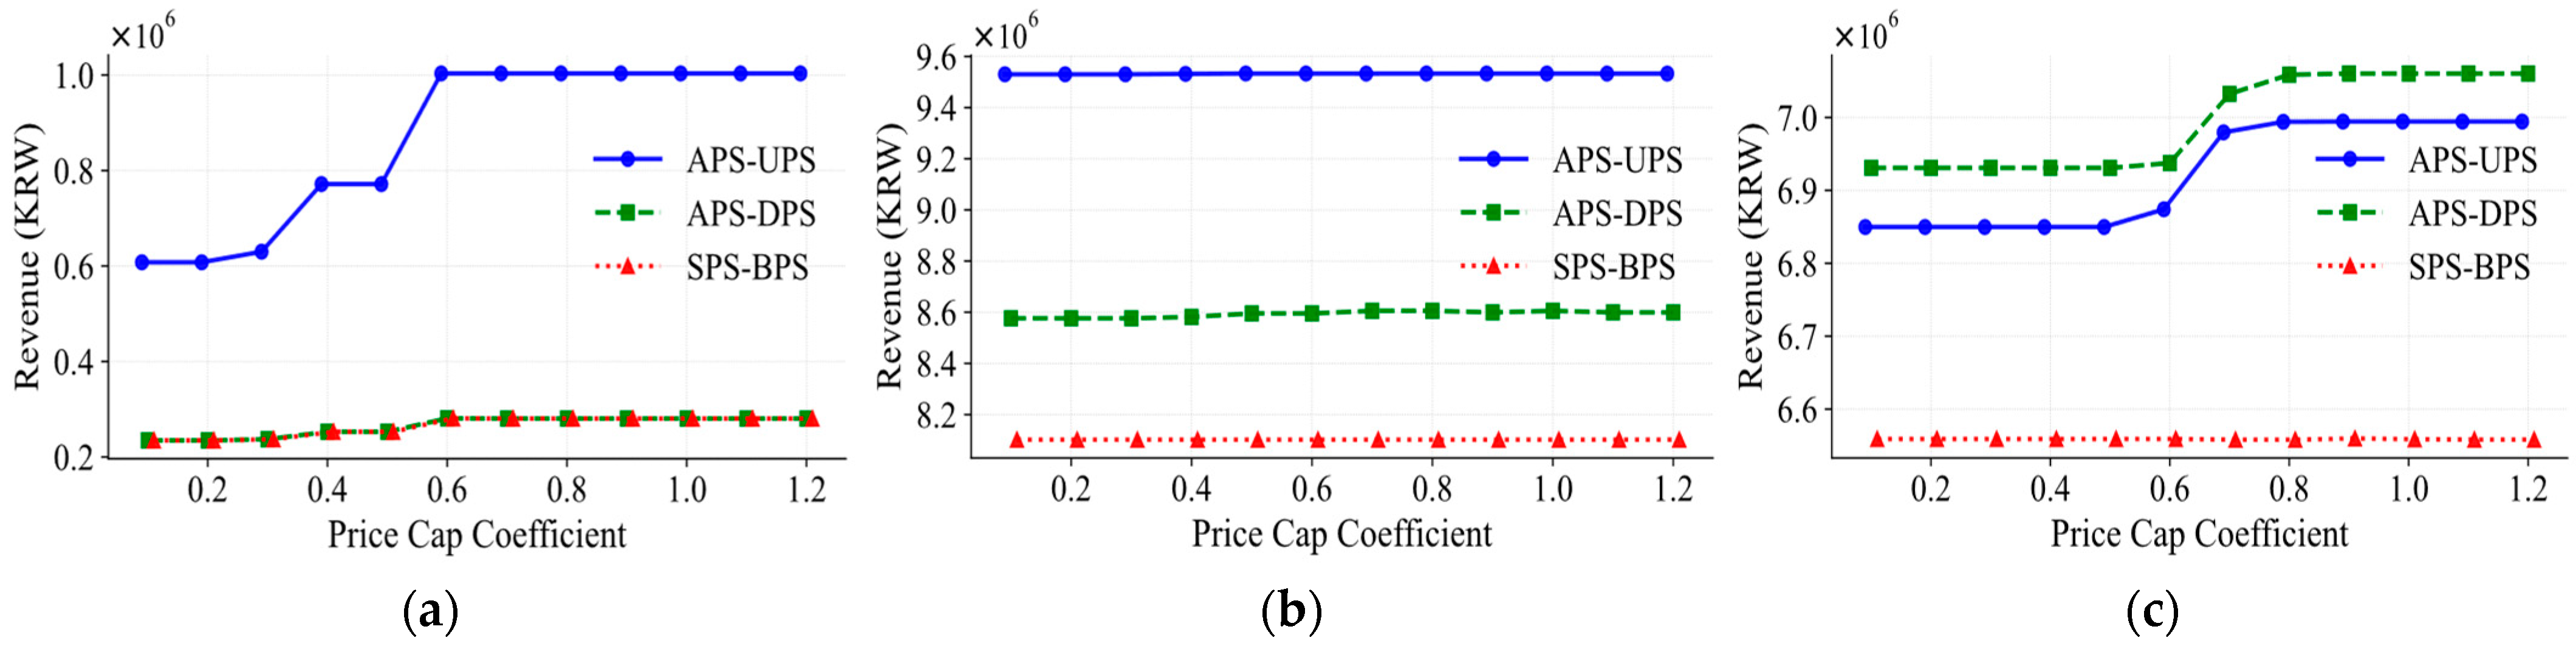
  • Recognize the existence of a saturation threshold in price cap levels. As shown in this study, beyond a certain coefficient, increases in the price cap yield diminishing returns in profitability while unnecessarily expanding the range of bidding prices—potentially complicating market operations.
  • Acknowledge that factors such as generation uncertainty and penalty rates do influence participant revenue, but the effect of the price cap remains structurally robust across these conditions. This stability supports the use of price caps as a consistent regulatory tool.
  • Consider adopting a hybrid penalty structure that incorporates both symmetric and asymmetric elements. Such a design can mitigate the risks of imbalances while preserving strategic flexibility and profit potential for VPPs and other market actors.
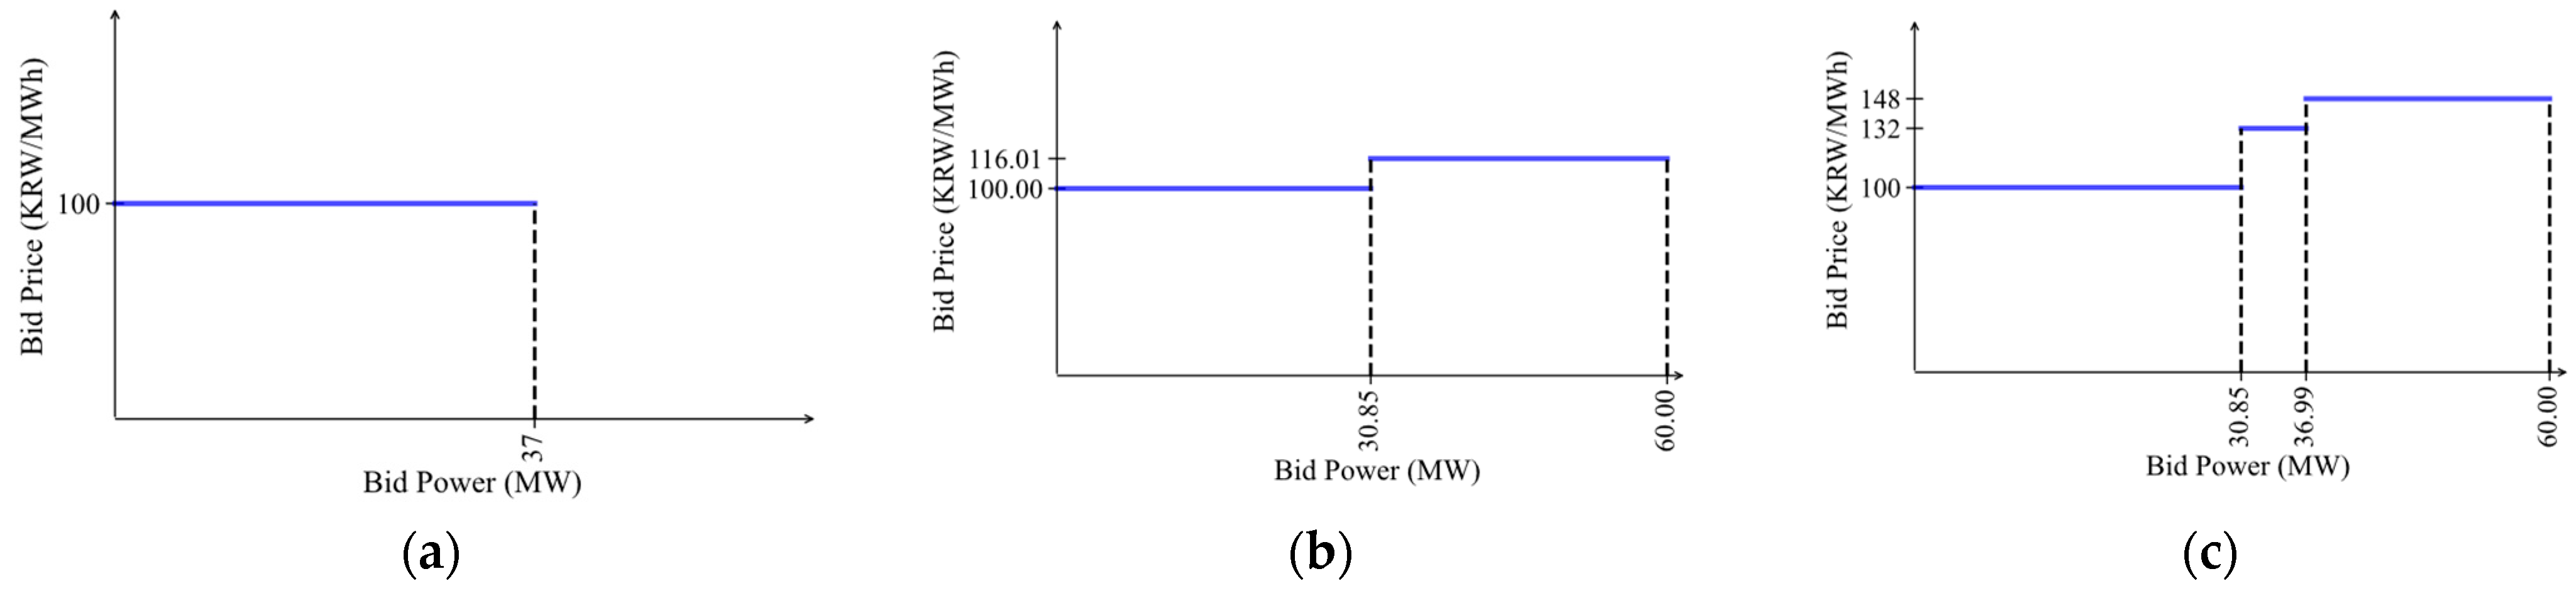
  • Utilize bidding behavior diagnostics—such as segmentation density and bid price dispersion—as real-time indicators of market stress, participant flexibility, or potential regulatory inefficiencies. These metrics can provide early signals of how participants adapt their strategies in response to market constraints and policy changes.
Ultimately, this study confirms that thoughtful calibration of both price cap levels and penalty structures is crucial for maintaining a competitive, efficient, and resilient electricity market—particularly as VPPs take on a larger role in renewable-integrated grids. These insights provide a valuable foundation for developing market rules that both accommodate renewable uncertainty and incentivize economically sound bidding behavior.

6. Conclusions

In this study, we investigated the impact of price cap and imbalance penalty structures on the bidding strategies and profitability of VPPs in a renewable-integrated electricity market. A stochastic optimization model was developed to simulate VPP operations under realistic market scenarios, incorporating variability in generation, day-ahead prices, and real-time prices. Through scenario-based simulations, the model explored how different combinations of regulatory parameters influence both revenue outcomes and strategic bidding behavior of VPPs.
The results demonstrate that the price cap plays a crucial role in determining the revenue of VPPs. Increasing the cap level enhances bidding flexibility, leading to more granular bid segmentations and higher profitability, particularly under asymmetric penalty structures. However, the effect of the price cap is nonlinear, with revenue saturating around the price cap coefficient of 0.8. This corresponds to a regulatory threshold beyond which further relaxation of the price cap yields diminishing returns.
The imbalance penalty structure significantly shapes bidding strategies. The APS-UPS structure promotes aggressive over-bidding, while APS-DPS leads to conservative under-bidding. In the SPS-BPS framework, VPPs prefer the intermediate behavior in bidding. These differences underscore the importance of regulatory alignment between the price cap policy and the penalty mechanism. Notably, even when the price cap does not strongly influence revenue, particularly as seen in the noon scenario, it still affects the diversity and complexity of bidding strategies, which means its broader market impact.
From a regulatory standpoint, several implications arise. First, price caps should be calibrated adaptively, taking into account market volatility and renewable integration levels. Second, while generation uncertainty and penalty rates influence revenue, the structural effect of price caps remains robust, making them a reliable regulatory instrument. Lastly, bidding pattern diagnostics—such as segmentation density and bid price dispersion—can serve as real-time indicators of market inefficiencies or overly rigid policy constraints.
Future research can build upon this model by incorporating energy storage systems, multi-agent bidding interactions, or dynamic penalty schemes based on forecast accuracy. As the role of VPPs expands within modern power systems, such enhanced modeling will be critical for supporting the development of resilient, flexible, and economically sustainable electricity markets.

Author Contributions

Conceptualization, Y.S. and Y.J.; methodology, Y.S. and Y.J.; formal analysis, Y.S. and Y.J.; writing—original draft preparation, Y.S., Y.Y. and Y.J.; writing—review and editing, Y.J.; visualization, Y.S.; supervision, Y.J.; funding acquisition, Y.J. All authors have read and agreed to the published version of the manuscript.

Funding

This research was supported by the 2025 scientific promotion program funded by Jeju National University.

Data Availability Statement

The data supporting the findings of this study, including power generation profiles, are not publicly available due to privacy restrictions and agreements with data providers. Reasonable requests for access to anonymized or aggregated data may be considered by the corresponding author, subject to institutional and legal constraints.

Conflicts of Interest

The authors declare no conflicts of interest. The funders had no role in the design of the study; in the collection, analyses, or interpretation of data; in the writing of the manuscript; or in the decision to publish the results.

References

  1. Gao, H.; Jin, T.; Feng, C.; Li, C.; Chen, Q.; Kang, C. Review of virtual power plant operations: Resource coordination and multidimensional interaction. Appl. Energy 2024, 357, 122284. [Google Scholar] [CrossRef]
  2. Shahinzadeh, H.; Moradi, J.; Pourmirza, Z.; Kabalci, E.; Benbouzid, M.; Muyeen, S.M. Optimal operation of distributed flexible generation sources incorporating VPP framework in market environment considering uncertainties. In Proceedings of the 2022 IEEE Kansas Power and Energy Conference (KPEC), Manhattan, KS, USA, 25–26 April 2022. [Google Scholar] [CrossRef]
  3. Fortune Business Insights. Virtual Power Plant Market Size, Share & COVID-19 Impact Analysis, by Technology (Demand Response, Distributed Generation, Mixed Asset), by End-User (Industrial, Commercial, Residential), Regional Forecasts 2024–2032. Available online: https://www.fortunebusinessinsights.com/industry-reports/virtual-power-plant-market-101669 (accessed on 1 June 2025).
  4. Algarvio, H.; Couto, A.; Estanqueiro, A. A Double Pricing and Penalties “Separated” Imbalance Settlement Mechanism to Incentive Self Balancing of Market Parties. In Proceedings of the 2024 20th International Conference on the European Energy Market (EEM), Istanbul, Türkiye, 3–7 June 2024; pp. 1–6. [Google Scholar] [CrossRef]
  5. Song, Y.; Chae, M.; Chu, Y.; Yoon, Y.; Jin, Y. Impact of Penalty Structures on Virtual Power Plants in a Day-Ahead Electricity Market. Energies 2024, 17, 6042. [Google Scholar] [CrossRef]
  6. Yang, C.; Du, X.; Xu, D.; Tang, J.; Lin, X.; Xie, K.; Li, W. Optimal bidding strategy of renewable-based virtual power plant in the day-ahead market. Int. J. Electr. Power Energy Syst. 2023, 144, 108557. [Google Scholar] [CrossRef]
  7. Xiang, D.; He, K.; Zhang, G.; Zhang, S.; Chen, Y.; Zhao, L.; Zheng, H. Optimizing VPP Operations: A Novel Robust Demand-Side Management Approach with Energy Storage System. In Proceedings of the 2023 IEEE International Conference on Energy Internet (ICEI), Shenyang, China, 20–22 October 2023. [Google Scholar] [CrossRef]
  8. Zare, A.; Shafiyi, M.A. The Impact of Energy Storage System on the Flexible Operation of the Renewable-Based Virtual Power Plant. In Proceedings of the 2024 11th Iranian Conference on Renewable Energy and Distributed Generation (ICREDG), Yazd, Iran, 6–7 March 2024. [Google Scholar] [CrossRef]
  9. Li, W. The Virtual Power Plant Bidding Strategy Model based on Multi-stage Semi-anticipativity Distributionally Robust Optimization. Electr. Power Syst. Res. 2024, 237, 111015. [Google Scholar] [CrossRef]
  10. Song, C.; Jing, X. Bidding strategy for virtual power plants with the day-ahead and balancing markets using distributionally robust optimization approach. Energy Rep. 2023, 9, 637–644. [Google Scholar] [CrossRef]
  11. Jeitschko, T.D.; Kim, S.J.; Pal, P. Curbing price fluctuations in cap-and-trade auctions under changing demand expectations. Energy Econ. 2024, 139, 107804. [Google Scholar] [CrossRef]
  12. Kilinc-Ata, N.; Proskuryakova, L.N. The contribution of energy policies to green energy transition in the Asia-Pacific region. Renew. Energy 2024, 237, 121797. [Google Scholar] [CrossRef]
  13. Wilson, J.F. Scarcity, market power, and price caps in wholesale electric power markets. Electr. J. 2000, 13, 33–46. [Google Scholar] [CrossRef]
  14. Joskow, P.; Tirole, J. Reliability and Competitive Electricity Markets. RAND J. Econ. 2007, 38, 60–84. [Google Scholar] [CrossRef]
  15. Vossler, C.A.; Mount, T.D.; Thomas, R.J.; Zimmerman, R.D. An experimental investigation of soft price caps in uniform price auction markets for wholesale electricity. J. Regul. Econ. 2009, 36, 44–59. [Google Scholar] [CrossRef]
  16. Moshrefi, H.; Ebrahimnejad, A.; Mohaghegh, M. Strategic Bidding in Price-Capped Uniform Price Electricity Auctions. Available online: https://papers.ssrn.com/sol3/papers.cfm?abstract_id=4706221 (accessed on 1 June 2025).
  17. Rioux, B.; Galkin, P.; Murphy, F.; Pierru, A. How do price caps in China’s electricity sector impact the economics of coal, power and wind? Potential gains from reforms. Energy J. 2017, 38 (Suppl. S1), 63–76. [Google Scholar] [CrossRef]
  18. Berbey-Burgos, M.; Pardillos-Pobo, D.; Laporte-Azcué, M.; González-Gómez, P.Á.; Santana, D. Impact of Price Cap Policy on Concentrating Solar Power Plant Revenue in Electricity Markets. In Proceedings of the 2024 20th International Conference on the European Energy Market (EEM), Istanbul, Turkiye, 10–12 June 2024. [Google Scholar] [CrossRef]
  19. Briggs, R.J.; Kleit, A. Resource adequacy reliability and the impacts of capacity subsidies in competitive electricity markets. Energy Econ. 2013, 40, 297–305. [Google Scholar] [CrossRef]
  20. Sirin, S.M.; Erten, I. Price spikes, temporary price caps, and welfare effects of regulatory interventions on wholesale electricity markets. Energy Policy 2022, 163, 112816. [Google Scholar] [CrossRef]
  21. Song, Y.; Chu, Y.; Yoon, Y.; Jin, Y. Virtual Power Plant Bidding Strategies in Pay-as-Bid and Pay-as-Clear Markets: Analysis of Imbalance Penalties and Market Operations. Energies 2025, 18, 1383. [Google Scholar] [CrossRef]
  22. Shinde, P.; Kouveliotis-Lysikatos, I.; Amelin, M. Multistage stochastic programming for vpp trading in continuous intraday electricity markets. IEEE Trans. Sustain. Energy 2022, 13, 1037–1048. [Google Scholar] [CrossRef]
  23. Laitinen, L. Optimal Offering Strategy for a Base Station Virtual Power Plant via Stochastic Programming. Master’s Thesis, Aalto University, Espoo, Finland, November 2024. [Google Scholar]
  24. Chen, Y.; Niu, Y.; Qu, C.; Du, M.; Liu, P. A pricing strategy based on bi-level stochastic optimization for virtual power plant trading in multi-market: Energy, ancillary services and carbon trading market. Electr. Power Syst. Res. 2024, 231, 110371. [Google Scholar] [CrossRef]
Figure 1. Scenario generation process for the three-stage stochastic model.
Energies 18 03927 g001
Figure 2. SMP data: (a) morning; (b) noon; (c) night.
Energies 18 03927 g002
Figure 3. Generation data: (a) morning; (b) moon; (c) night.
Energies 18 03927 g003
Figure 4. Impact of price cap coefficient on VPP revenue under different imbalance penalty structures: (a) morning; (b) noon; (c) night. Curves in the subfigures represent different penalty structures: APS-UPS, APS-DPS, and SPS-BPS.
Energies 18 03927 g004
Figure 5. Impact of price cap coefficient on VPP revenue under increased penalty cost rate λ p e n t , α = λ d a t , α × 2.0 : (a) morning; (b) noon; (c) night. Curves represent APS-UPS, APS-DPS, and SPS-BPS structures.
Energies 18 03927 g005
Figure 6. Impact of price cap coefficient on VPP revenue under increased generation uncertainty (doubled standard deviation of generation forecast errors): (a) morning; (b) noon; (c) night. Curves represent APS-UPS, APS-DPS, and SPS-BPS structures.
Energies 18 03927 g006
Figure 7. Distribution of awarded bid prices under the APS-UPS penalty structure across different price cap coefficients: (a) morning; (b) noon; (c) night.
Energies 18 03927 g007
Figure 8. Bidding strategy outcomes under APS-UPS structure in the night case: (a) ε c a p = 0.1 ; (b) ε c a p = 0.6 ; (c) ε c a p = 0.9.
Energies 18 03927 g008
Figure 9. Bidding strategy outcomes under APS-DPS structure in the night case: (a) ε c a p = 0.1 ; (b) ε c a p = 0.6 ; (c) ε c a p = 0.9 .
Energies 18 03927 g009
Figure 10. Bidding strategy outcomes under SPS-BPS structure in the night case: (a) ε c a p = 0.1 ; (b) ε c a p = 0.6 ; (c) ε c a p = 0.9 .
Energies 18 03927 g010
Table 1. Summary of parameters used in optimization model.
ParameterValue/Expression
P t o l Q m a x × 0.1
λ p e n t , α λ d a t , α × 1.2
λ r e c 76 [KRW/kWh]
Q m a x 60 [MW]
Q m i n 0 [MW]
ρ f l o o r t min α λ d a t , α
ε c a p [0.1–1.2]
Disclaimer/Publisher’s Note: The statements, opinions and data contained in all publications are solely those of the individual author(s) and contributor(s) and not of MDPI and/or the editor(s). MDPI and/or the editor(s) disclaim responsibility for any injury to people or property resulting from any ideas, methods, instructions or products referred to in the content.

