Article

Investigating the Influence of PWM-Driven Cascaded H-Bridges Multilevel Inverter on Interior Permanent Magnet Synchronous Motor Power Losses

Department of Engineering, University of Palermo, Viale delle Scienze, Parco d’Orleans, 90128 Palermo, Italy
*
Author to whom correspondence should be addressed.
Energies 2025, 18(15), 3911; https://doi.org/10.3390/en18153911
Submission received: 3 June 2025 / Revised: 17 July 2025 / Accepted: 19 July 2025 / Published: 22 July 2025

Abstract

This paper presents an accurate analysis of the power losses of an interior permanent magnet synchronous motor fed by a cascaded H-bridge multilevel inverter. The main goal of this study is to investigate the impact of the cascaded h-bridge inverter, multicarrier PWM strategies, and inverter switching frequency on the synchronous motor power losses. With this aim in mind, a detailed frequency domain power analysis was carried out on motor power losses at different operating points in the frequency–torque plane. Motor power losses were further categorized into fundamental and harmonic power losses. This evaluation involved driving the power converter using six distinct multicarrier PWM strategies at four different switching frequencies. Additionally, a comparison was conducted with a conventional two-level PWM inverter to quantify the reduction in motor power losses. The experimental results show that the cascaded h-bridge inverter guarantees a notable increase in the motor efficiency, up to 7%, and losses in segregation at the fundamental frequency, if compared to the standard two-level PWM inverter, especially at low speed and with partial-load conditions. Such results mark out the cascaded H-bridge inverter as a valuable choice, also with regard to low-voltage drive applications.

1. Introduction

Global electricity consumption is rapidly increasing, mainly due to the growing electrification of transportation and the widespread adoption of electric drives in the automotive and industrial sectors. Notably, electric drives are a major end-consumer of electricity in this context, accounting for close to 50% of global consumption [1,2]. Two-level Voltage Source Inverters (2L-VSIs) power the majority of adjustable-speed drives, providing benefits like soft-starting capabilities, energy saving during partial load operations, and precise speed and torque control [3]. Conventional two-level Voltage Source Inverters (2L-VSIs) are typically controlled with Pulse-Width Modulation (PWM) algorithms. While PWM offers many advantages, it introduces additional power losses compared to a Sinusoidal grid supply. These losses stem from harmonic voltage content, which decreases motor and, consequently, overall drive efficiency [4]. Furthermore, PWM operation contributes to increased vibrations and noise [5], commonly directly related to harmonic power losses.
Driven by the need to curb harmful emissions, both researchers and industries are intensely focused on reducing electric motor power losses. This involves deploying innovative control algorithms and the implementation of new hardware solutions [6]. Concurrently, regulatory bodies have introduced stricter international standards [7,8,9] that elevate minimum efficiency benchmarks for electric drives and establish new energy efficiency classifications for motors, Complete Drive Modules (CDMs), and Power Drive Systems (PDSs) to achieve energy savings. As a result, motor efficiency standards are only going to become tougher, pushing down power losses within motors and across entire power drive systems. Within this framework, Multilevel Inverters (MIs) are emerging as a leading technology for mitigating motor power losses. MIs have recently attracted significant interest in medium and high power/voltage applications due to their exceptional characteristics, including reduced voltage stress and losses in individual semiconductor devices, improved power quality, fault-tolerant capability, and lower electromagnetic interference [10,11,12,13]. Furthermore, with the growing adoption of higher DC-link voltages in electric vehicles, MIs offer a viable and efficient alternative to traditional 2L-VSIs, providing benefits like reduced current, increased power density, and faster charging [13,14,15,16]. However, MIs are still predominantly found in medium-voltage rather than low-voltage electric drives, primarily due to their higher cost compared to conventional two-level inverters.
Considering that motor power losses account for more than 70% of the entire drive power losses [17], it is essential to study the influence of MI topology, modulation strategy, and switching frequency on these power losses.
Several studies in the literature address the prediction of iron losses caused by inverter voltage harmonics in Permanent Magnet Synchronous Motor (PMSM) drives. It has been demonstrated through mathematical and numerical models [18,19,20] that harmonic power losses typically account for 5% to 30% of the total motor power losses. However, the experimental assessment of these losses proves to be a more challenging task. Various techniques for the direct determination of harmonic losses in PWM-driven electric motor drives have been developed, with the Segregation Losses (SL) approach being the most popular [21,22]. Alternatively, harmonic losses can be determined as the difference between the total electric power absorbed by the motor when it is fed by a PWM inverter and by a pure Sinusoidal voltage supply [23].
The vast majority of papers dealing with harmonic power losses are focused on machines powered by conventional PWM-operated 2L-VSIs [24,25,26,27,28], with only a handful of papers dealing with the issues associated with MIs [29,30,31,32] and it is necessary to consider that Mis’ harmonic behavior strongly depends on the adopted Multi Carrier PWM (MC-PWM) strategy. An evaluation of harmonic losses for an induction motor fed by a Cascaded H-Bridge Multilevel Inverter (CHBMI) has been presented and discussed in [29], considering three different modulation strategies under no-load operations. Thus, the main limitation of the study is related to the fact that the harmonic power losses’ behavior is not investigated in motor load operations and their impact on total motor power losses is not evaluated. The effect of different converter topologies on the iron losses of non-oriented electrical steel at various switching frequencies has been explored in [30]. Specifically, this analysis utilizes two-level inverters alongside three and five-level T-type MI configurations. Noteworthy is the observation that the five-level inverter, even at low carrier frequencies, exhibits lower iron losses compared to the other inverters. However, this analysis is limited to evaluating iron losses only under no-load conditions. The effect of MIs on power losses of wound-field synchronous machine cores has been investigated in [31], with a focus on iron losses and an emphasis on the favorable influence of inverter voltage levels’ number in reducing these losses compared to traditional two-level solutions. Also, in this case, the study is limited to evaluating motor iron losses and does not report an analysis of total motor harmonic power losses. An investigation on power losses of a 60 kW Interior Permanent Magnet Synchronous Motor (IPMSM), driven by a 100 kVA seven-level multilevel inverter, has been discussed in [32]. Although interesting results are reported in terms of additional copper and iron power losses, only one motor working point is accurately analyzed in terms of total power losses and additional harmonic power losses. Moreover, the study considers only one modulation strategy with an equivalent switching frequency of 8 kHz.
The state-of-the-art research discussed so far highlights the absence of accurate and extensive power losses analysis of interior permanent magnet synchronous motors fed by multilevel inverters by considering different modulation strategies and switching frequency values. Given the lack of thorough investigation about harmonic power losses on CHBMI-fed IPMSM drives, this paper aims to offer a detailed experimental analysis of the impacts of inverter topology, MC-PWM strategies, load level, and switching frequency. CHBMI has garnered significant interest in the field of medium-voltage industrial electrical drives as it is one of the most efficient MI topologies in the range of 4.16–13.8 kV [11]. Furthermore, it is also well suited for e-mobility applications because it integrates easily with battery packs and allows for easily increasing the total DC link voltage without increasing the voltage stress on switching devices [16]. In this study, with the aim of assessing the impact of modulation strategies and switching frequency on IPMSM power losses, a five-level CHBMI configuration was selected, driven by six different MC-PWM strategies, namely Phase Disposition (PD), Phase Shifted (PS), and Suppressed Carrier Arrangement (SCA) with Sinusoidal (S) and Switching Frequency Optimal (SFO) modulation signals. Moreover, four different switching frequencies (ranging from 4 kHz to 16 kHz with 4 kHz steps) are considered. A frequency domain power analysis approach is adopted to determine fundamental and harmonic power losses from measured total power losses [33]. Furthermore, to quantify the IPMSM efficiency improvement derived from the use of CHBMI, a comparison with a conventional 2L-VSI driven by standard PWM strategies has been accomplished under identical operating conditions. To accurately identify PMSM loss maps, sixteen IPMSM Working Points (WPs) were defined in the torque-frequency plane at a switching frequency value of 4 kHz, while nine IPMSM WPs were selected for the analysis of the switching frequency impact. The proposed measurement procedure facilitates the following goal: avoiding the time-consuming procedure usually employed to evaluate each of the harmonic power losses’ quantity, i.e., harmonic copper and iron power losses, by determining the total motor harmonic motor power losses. Thus, this procedure can be applied for experimental validation purposes of harmonic power losses’ mathematical models; the evaluation of motor power losses and their segregation in 16 motor WPs allows for simplifying benchmark efficiency analysis in the speed–torque plane, and these WPs reflect the typical working conditions of the main industrial applications; the segregation power losses procedure allows for the identification of an additional margin of energy saving opportunities obtainable with different power inverter topologies with respect to conventional two-level inverters and by adopting devoted motor control algorithms.
The paper is structured as follows: Section 2 describes the field-oriented control and MC-PWM strategies adopted for the IPMSM and CHBMI control; Section 3 describes the harmonic power analysis approach adopted for segregating IPMSM power losses; Section 4 presents the test setup, including motor, converter, and measurement instrumentation descriptions; and Section 5 describes the experimental investigations conducted and discusses the corresponding results. Finally, Section 6 presents the study’s conclusions.

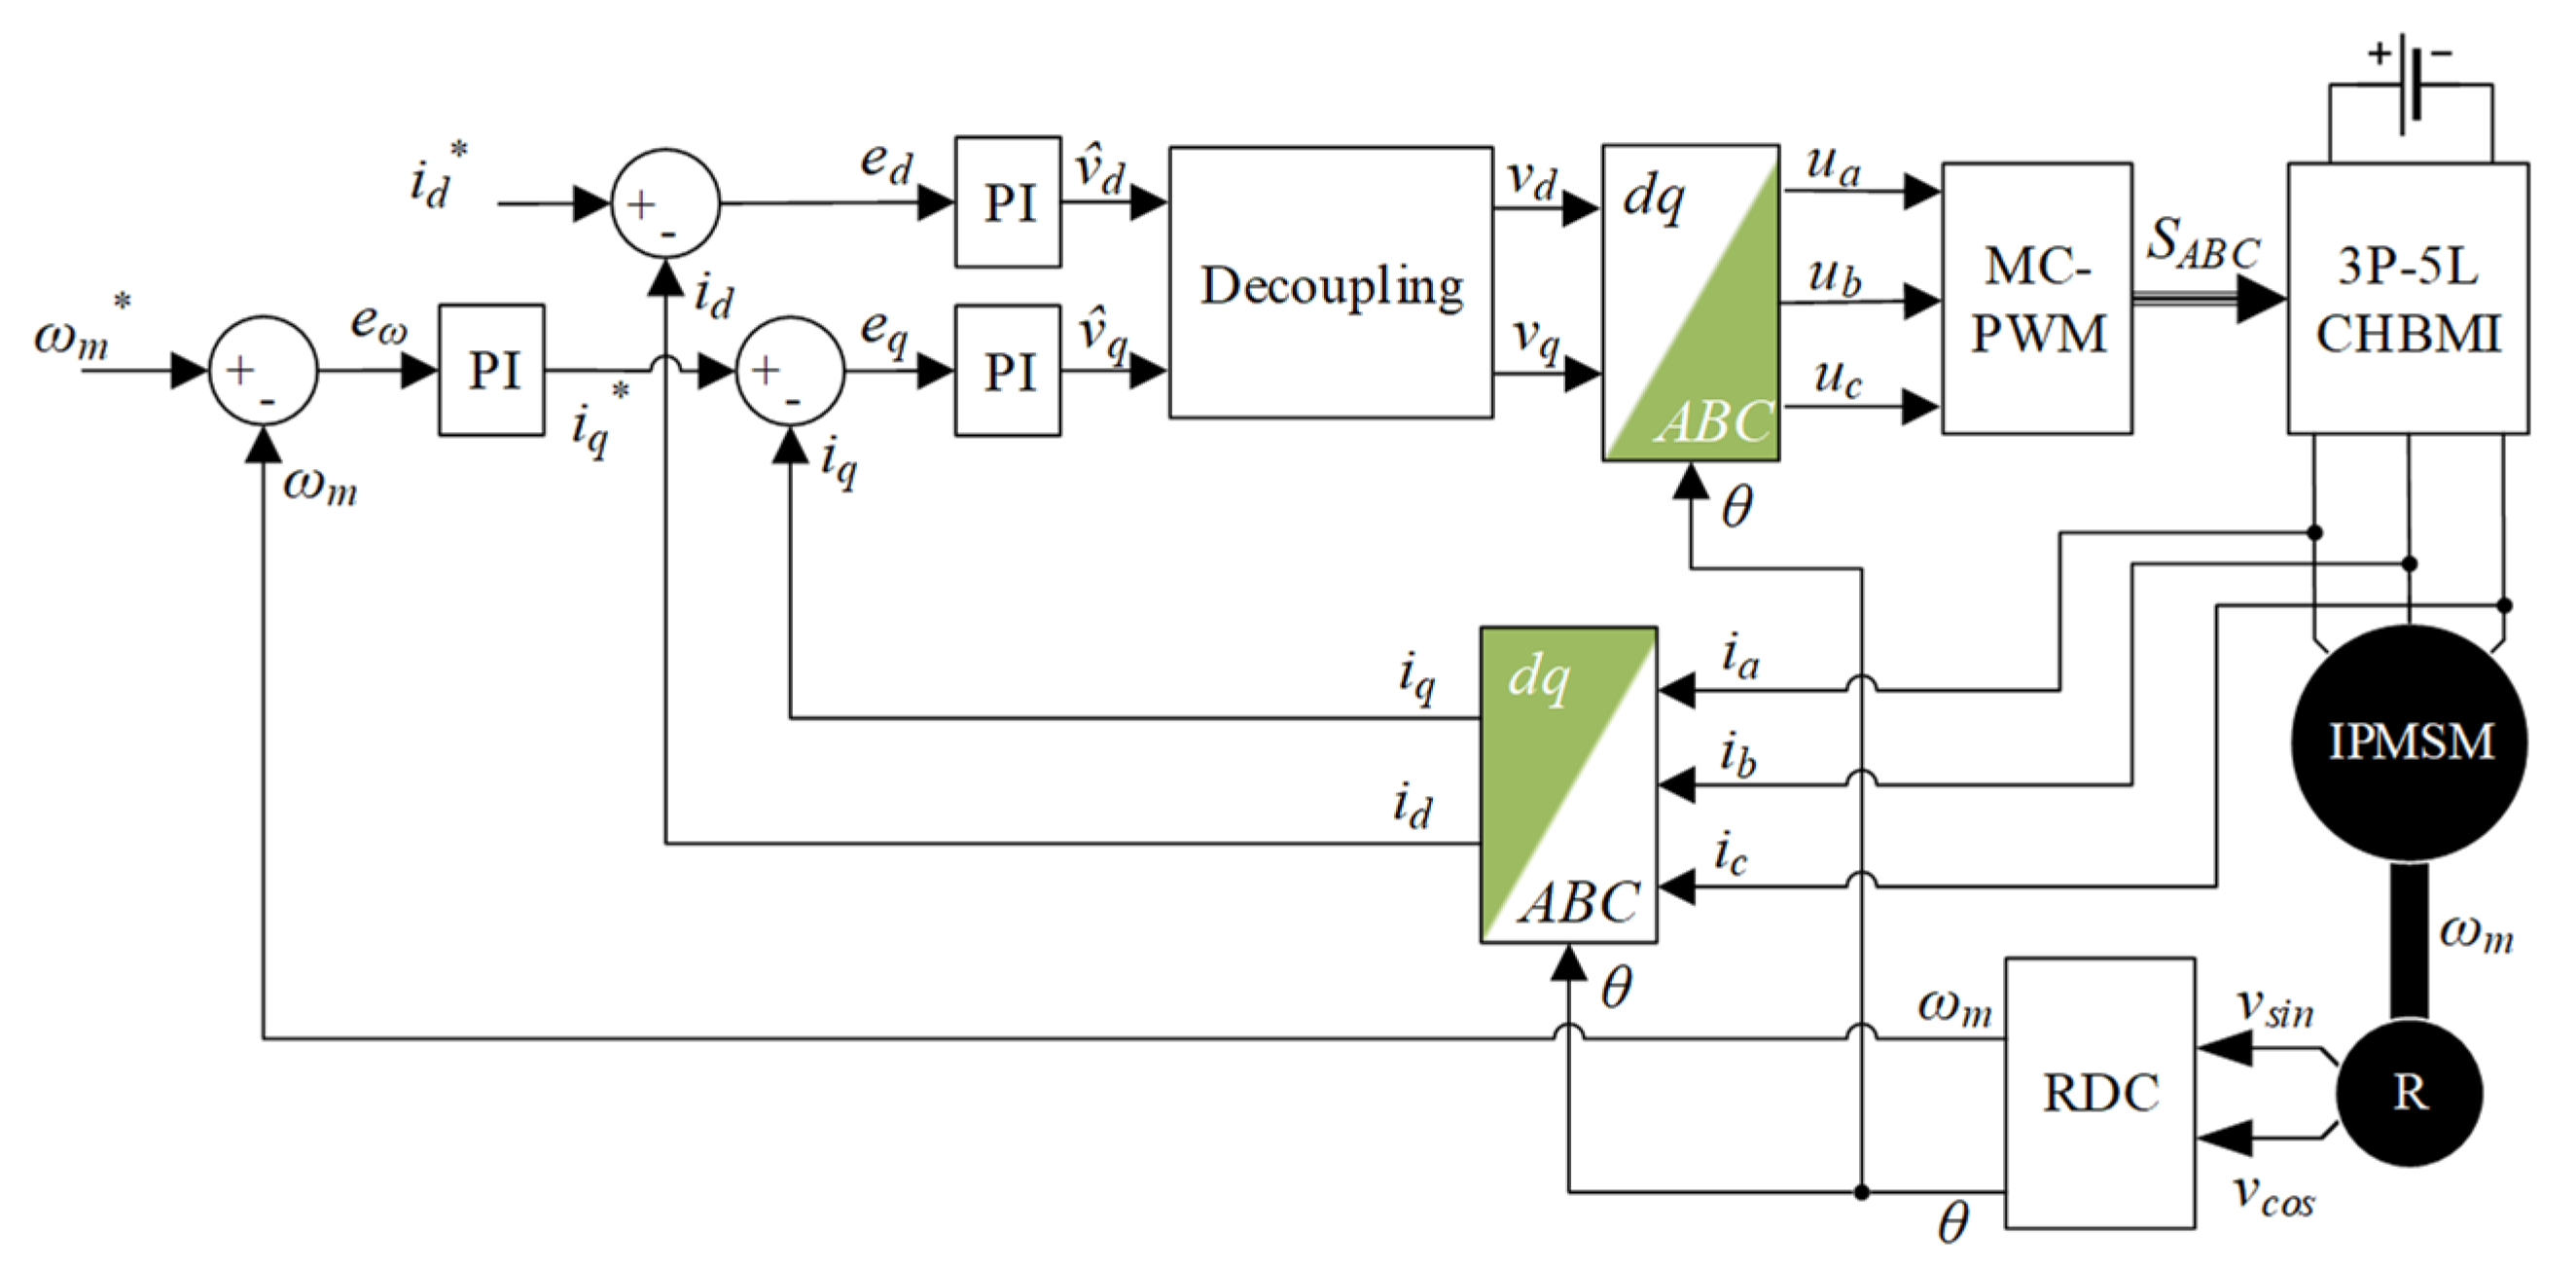
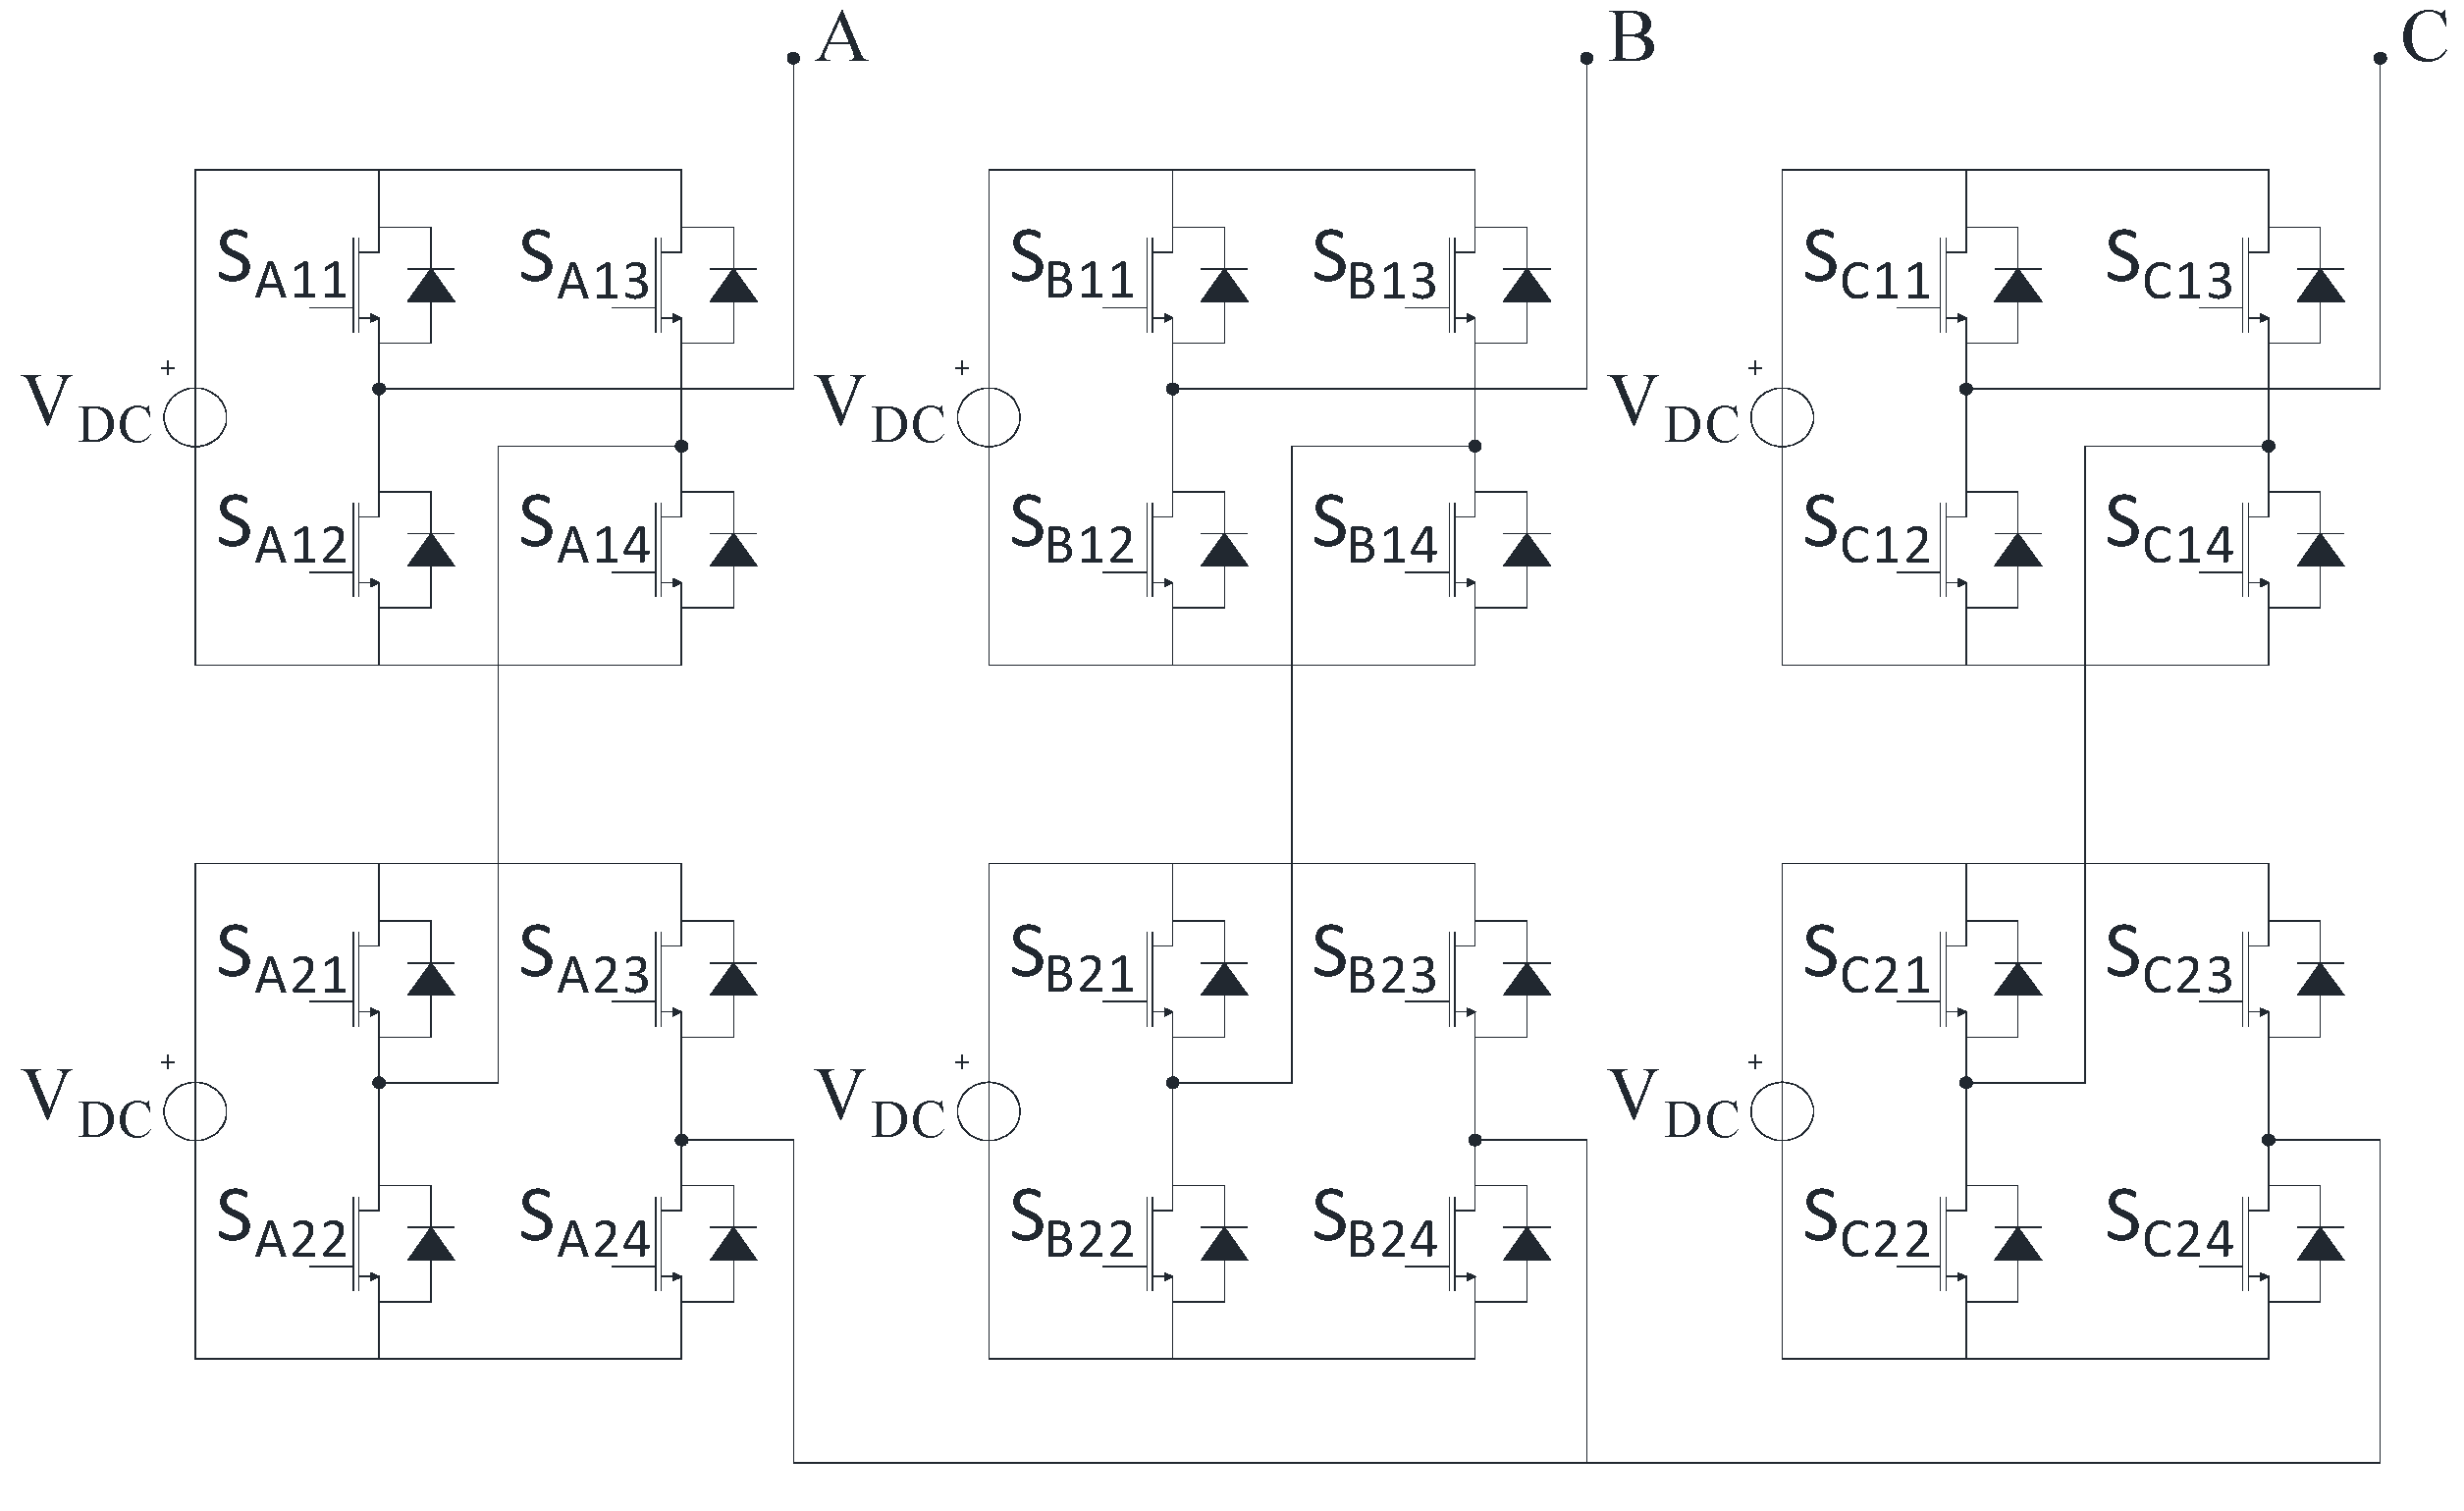
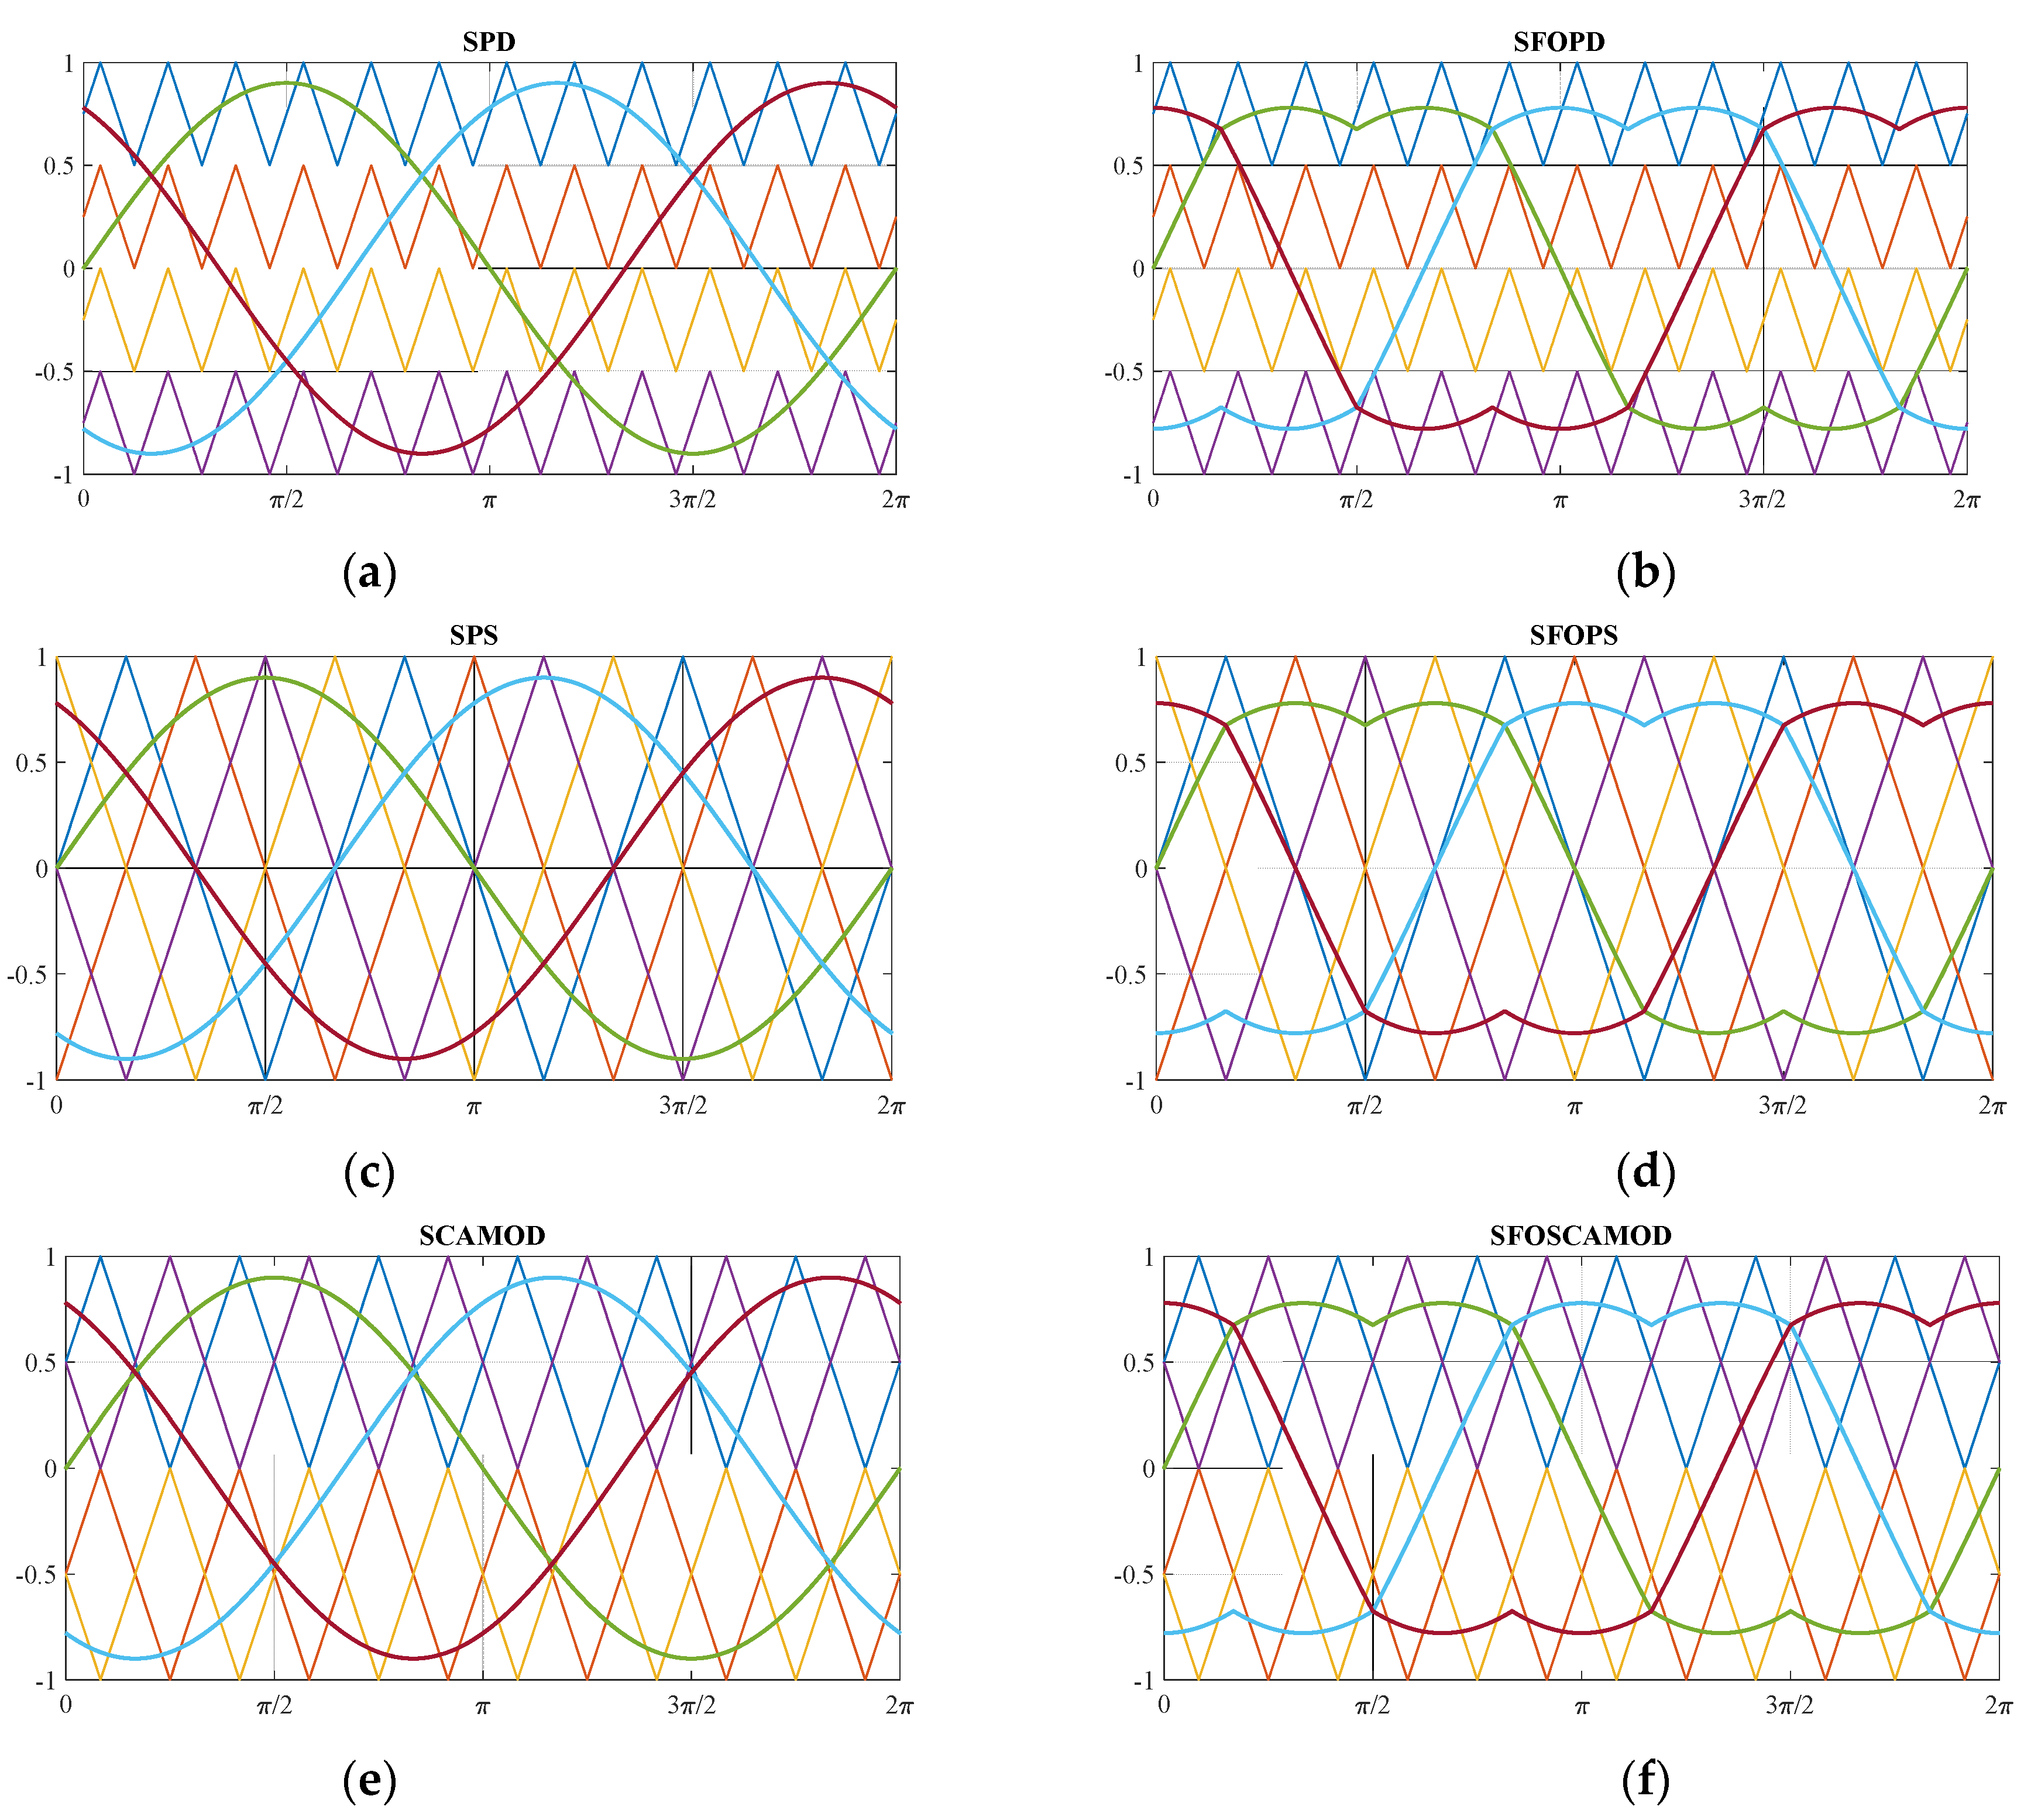
2. Field-Oriented Control and Multicarrier Pulse Width Modulation Strategies

To assess the power losses of the IPMSM under steady-state conditions, a Field-Oriented Control (FOC) strategy has been utilized for motor control. The corresponding block diagram is illustrated in Figure 1. The implemented FOC comprises an outer closed-loop for speed and inner closed-loops for dq-axis currents, all governed by digital PI controllers. In this application, IPMSM flux weakening is excluded, keeping the id current at zero. The IPMSM is fed by a 3P-5L-CHBMI, whose circuit diagram is reported in Figure 2. It is a MI topology characterized by several H-Bridge (HB) modules connected in a cascaded fashion. Each HB module can be controlled independently and it can provide a number of voltage levels equal to three.
Thus, the number of voltage levels nl of a generic CHBMI depends on the number of cascaded HB modules per phase nHB, according to the following relation:
n l = 2 n H B + 1
Generally, the performance of the whole electric drive depends not only on the adopted control strategy but also on the adopted modulation schemes, which strongly influence the voltage pulse pattern produced by the CHBMI. In this context, MC-PWM strategies are adopted since they are the most common choice in industrial applications due to their simplicity of implementation and reduced voltage and current harmonic distortion. Gate control signals are generated through the comparison between the modulating signals and the triangular carrier signals. The ratio between the modulating and triangular signals’ amplitudes is named the amplitude modulation index M and it is defined as follows:
m a , C H B M I = V 1 n H B V d c
where VDC is the DC link voltage of each HB module. The number of modulating signals depends on the number of phases m, and the number of carriers nc depends on the number of MI phase voltage levels nl, according to the relation
n c = n l 1
By replacing (1) in (3), it is possible to link the number of required carriers to the number of CHBMI modules per phase, as follows:
n c = 2 n H B
Thus, for a five-level converter, four carrier signals are required. GCSs are generated through the comparison of modulating signals and carrier triangular signals.
MC-PWM strategies are classified into Level Shifted (LS) and Phase Shifted (PS).
In the LS-PWM strategy, carriers are characterized by the same peak-to-peak amplitude, a mutual amplitude shift such that no carriers superpositions occur, and a mutual phase shift. Depending on the mutual phase shift, LS-PWM can be classified as
  • Phase Disposition (PD): all carriers are in phase;
  • Phase Opposition Disposition (POD): carriers are in phase two-by-two;
  • Alternative Phase Opposition Disposition (APOD): adjacent carriers are in phase opposition.
LS-PWM strategies present the same harmonic distribution in the frequency domain. In detail, voltage harmonics are centered around the switching frequency and its integer multiples, according to the following relation:
f h = k f s w
where fh is the frequency at which each group of voltage harmonics is centered, and k = 1, 2, 3… For this reason, only the PD-PWM is considered in this study, and its modulation scheme is reported in Figure 3a,b. It must be underlined that the distribution of harmonics in the frequency domain does not depend on the number of inverter voltage levels. Moreover, the carriers’ mutual level shift implies an uneven power distribution among the HB modules, depending on the carriers assigned to each HB and depending on the amplitude modulation index M. This implies that the thermal stress of each device depends on the carrier assigned to each leg.
For the PS-PWM strategy, carriers are characterized by the same peak-to-peak amplitude, the same average value equal to zero, and a mutual phase shift that depends on the number of cascaded HB modules per phase nHB. The phase φi to assign to the ith reference carrier is computed with the following relation:
φ i = ( i 1 ) π n H B
It can be noted that each HB in the same phase is controlled with a classical Unipolar PWM strategy, whose GCSs are phase-shifted by φi. As a consequence, all the HB modules on the same phase lead the same active power independently of the CHBMI working conditions, allowing a uniform utilization (thus a uniform thermal stress) of each HB module and DC sources. Phase voltage harmonics are centered around multiples of switching frequency fsw as a function of the number of inverter voltage levels nl, according to the following relation:
f h = k ( n l 1 ) f s w
In a three-phase five-level CHBMI, harmonics are centered around 4fsw and its multiples. It follows that, for fixed carriers’ frequency, PS-PWM guarantees an easier voltage and current harmonic filtering, due to the harmonic shift in the high-frequency range, but it causes higher switching losses.
SCAMOD is a hybrid scheme between LS and PS, characterized by stacked couples of carriers that have the same peak-to-peak amplitude and a mutual phase shift equal to 180°. The SCA modulation scheme for a three-phase five-level CHBMI is reported in [34]. Output voltage harmonics are centered around multiples of the switching frequency, according to the following relation:
f h = k 2 f s w
It must be underlined that SCA modulation produces a shift over the spectrum that does not depend on the number of voltage levels or, equivalently, on the cascaded HB modules per phase. Moreover, SCAMOD produces an even power distribution among HB cells only when the number of cascaded HB modules nHB is strictly lower than three. Therefore, each switching device is thermally stressed in all equivalently only when nHB is strictly lower than three.
Regarding the modulating signals, Sinusoidal (S) and Switching Frequency Optimal (SFO) are commonly adopted in grid-connected and electric drive applications, respectively. In detail, SFO modulating signals ua*, ub*, and uc* are obtained from the Sinusoidal modulating signals ua, ub, and uc according to the following relation:
u a * = u a u o f f s e t u b * = u b u o f f s e t u c * = u c u o f f s e t
where uoffset is a triangular waveform whose fundamental frequency is equal to three times the Sinusoidal modulating signals frequency. It can be obtained as follows:
u o f f s e t = max u a , u b , u c + min u a , u b , u c 3
According to [13], the SFO modulation signals allow for obtaining the same overall harmonic content of an SVM and the modulation index can be extended up to 1.15. Sinusoidal modulating signals, offset signal, and SFO modulating signals are shown in Figure 3a,c,e and Figure 3b,d,f, respectively.
Table 1 summarizes the main features of each discussed modulation scheme, its impact on the inverter phase voltages VN, the line-to-line voltages VLL, and the load voltages Vn and power-balancing capability.
Finally, in order to assess the benefits of the CHBMI inverter on the IPMSM power losses and efficiency, a comparison with a 2L-VSI controlled with a standard PWM-based FOC was carried out in this study. For accurate comparison purposes, tests were performed by setting the DC-link voltage of 2L-VSI equal to twice the total DC-link voltage of CHBMI. In this way, both converter topologies worked with the same modulation index values for a given fundamental harmonic voltage amplitude. The amplitude modulations index for the PWM-controlled 2L-VSI is equal to
m a , 2 L I = V 1 V D C / 2

3. Harmonic Power Analysis
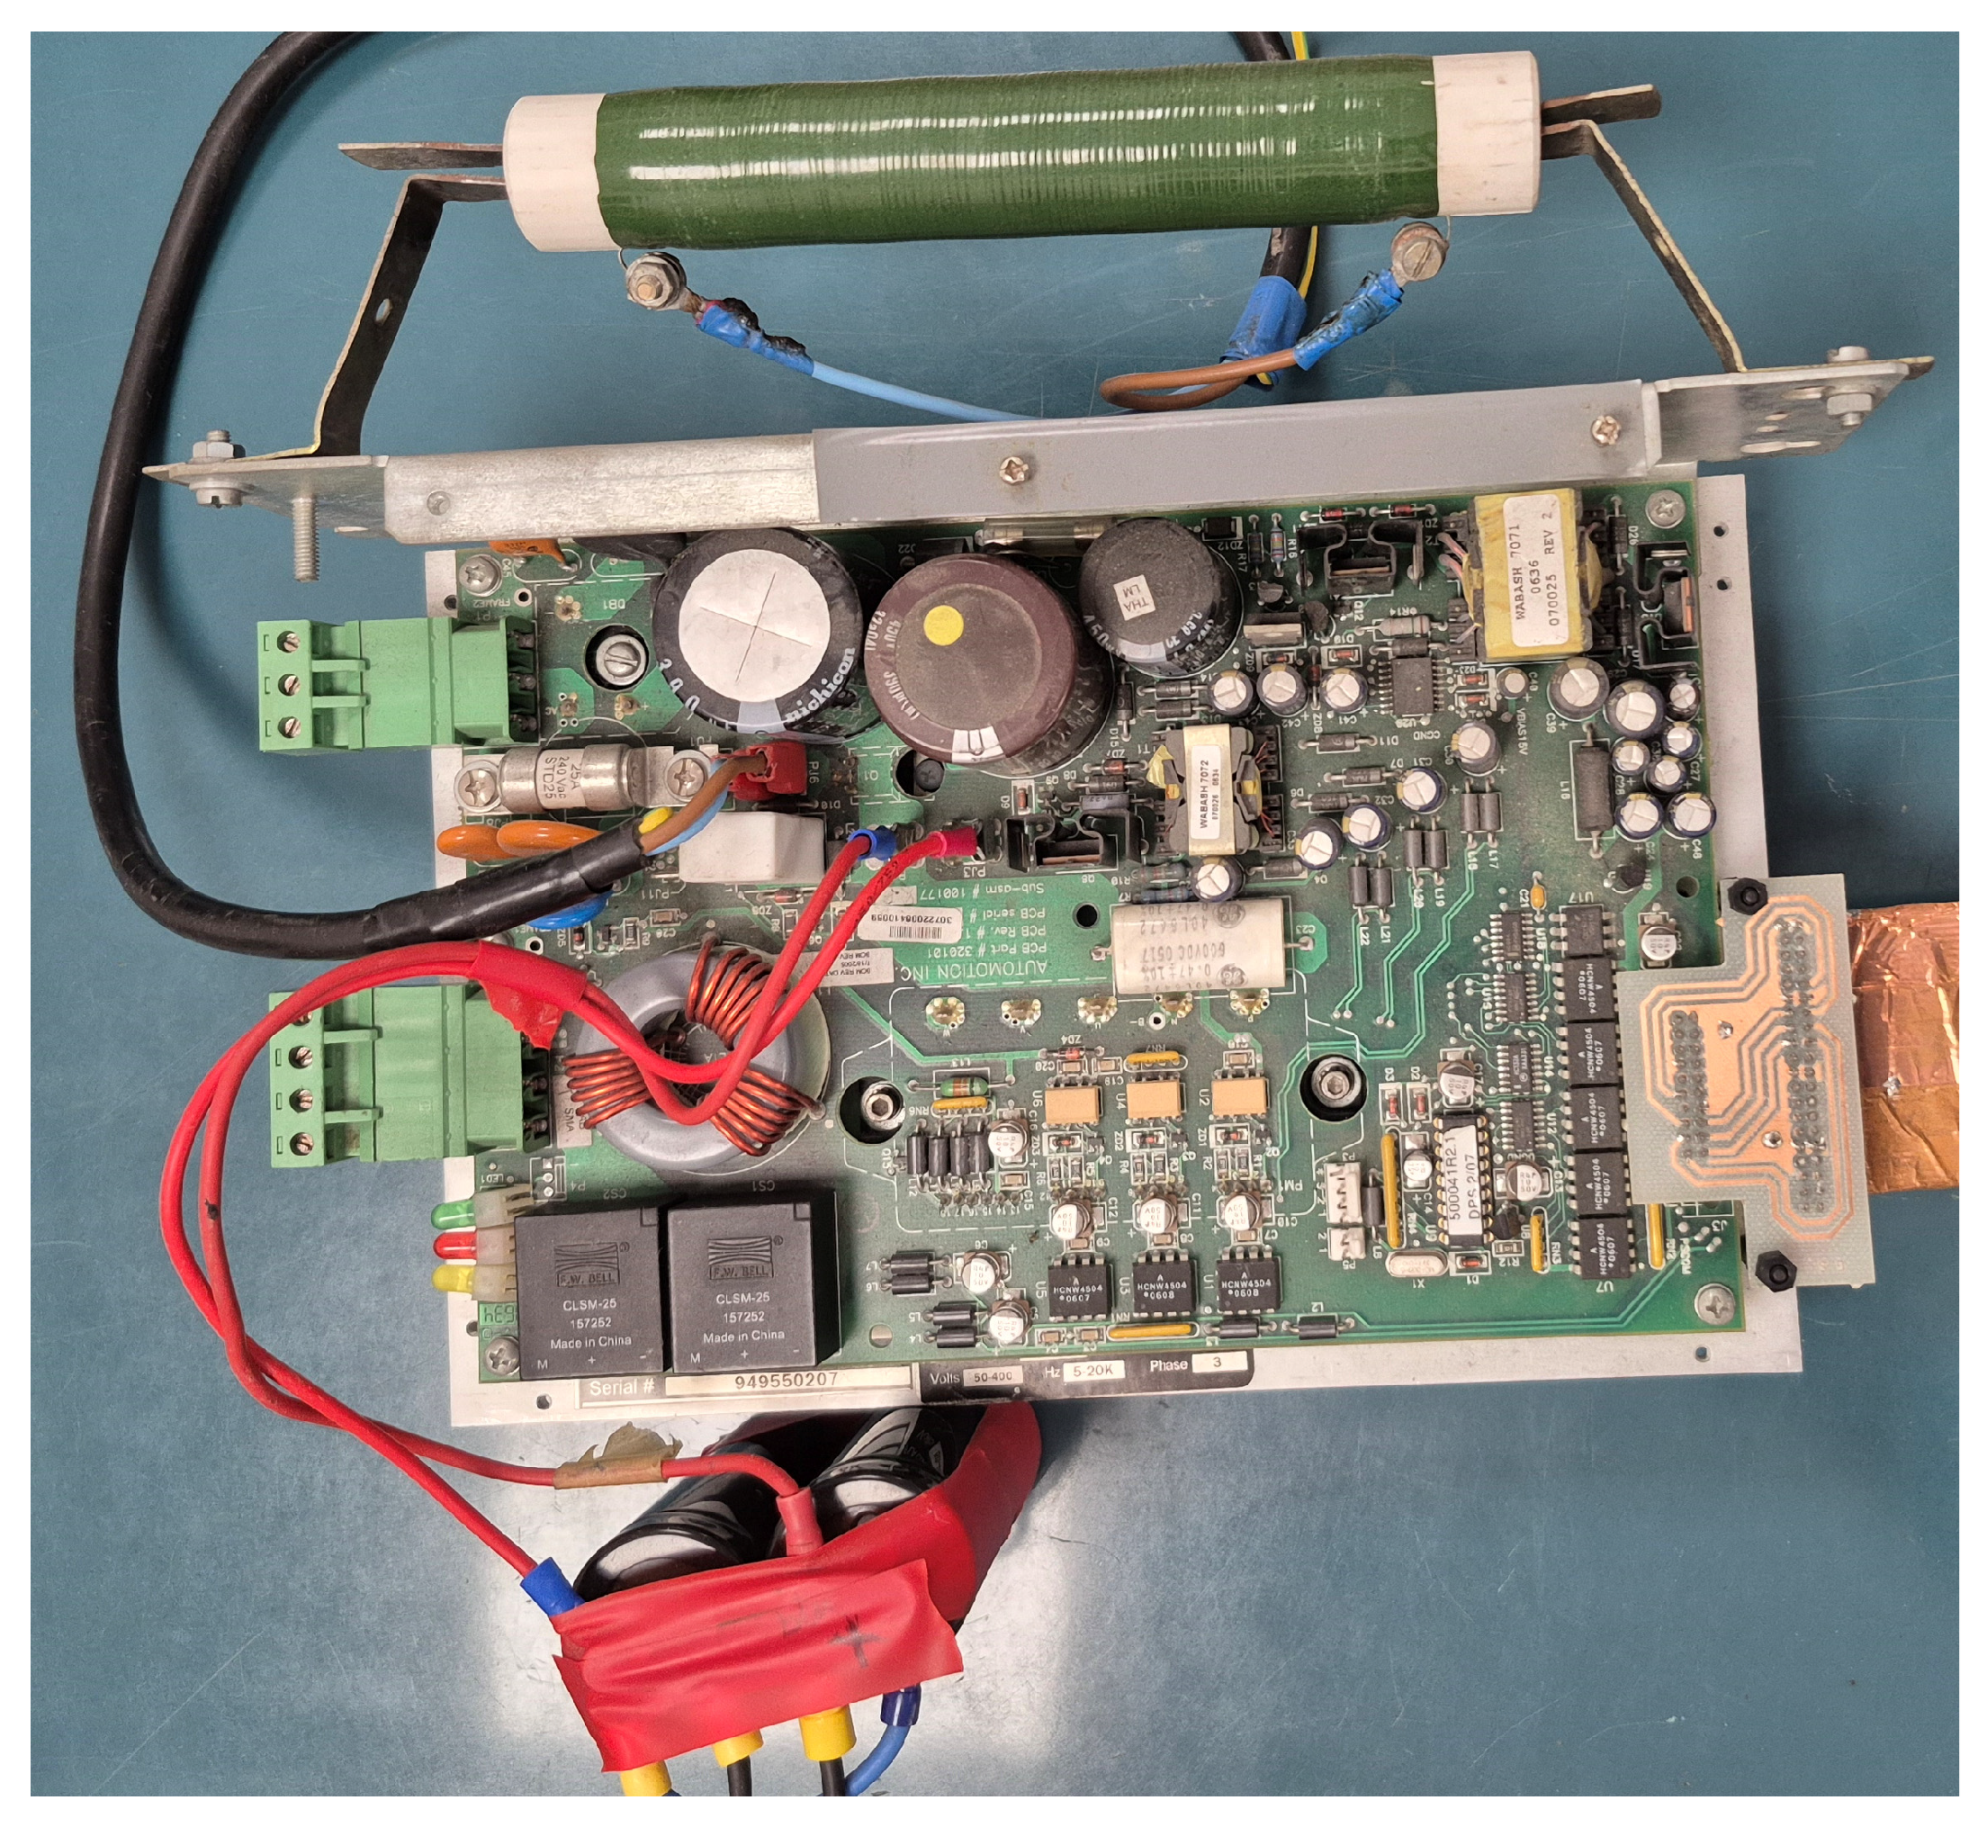
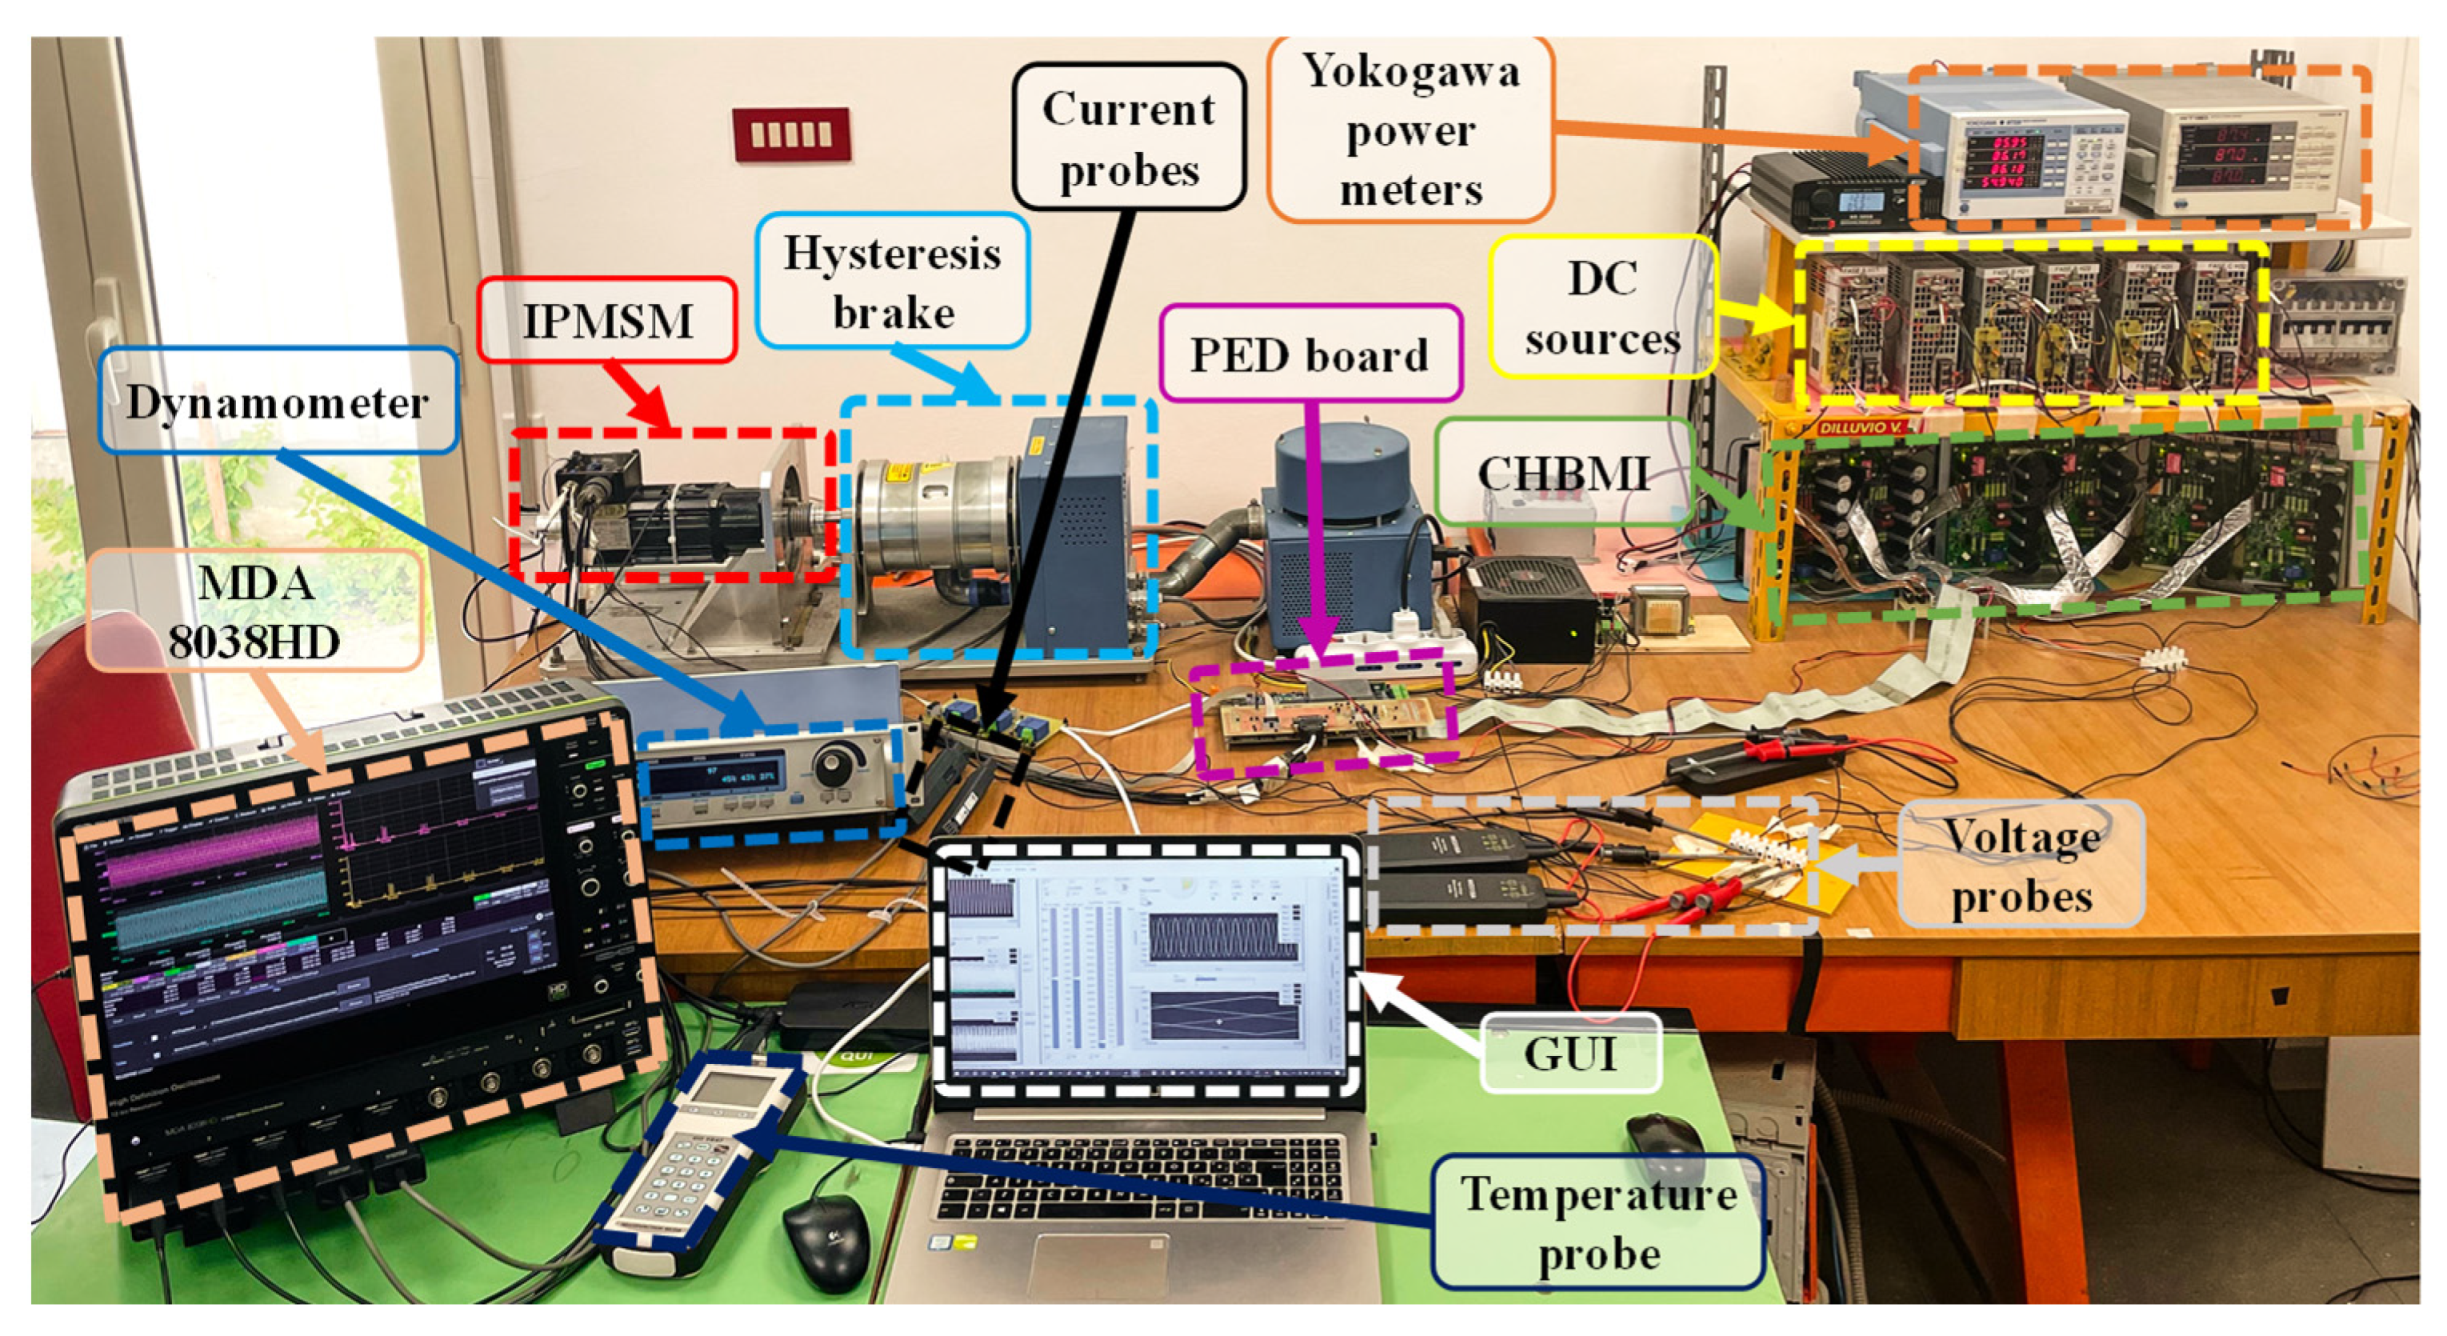
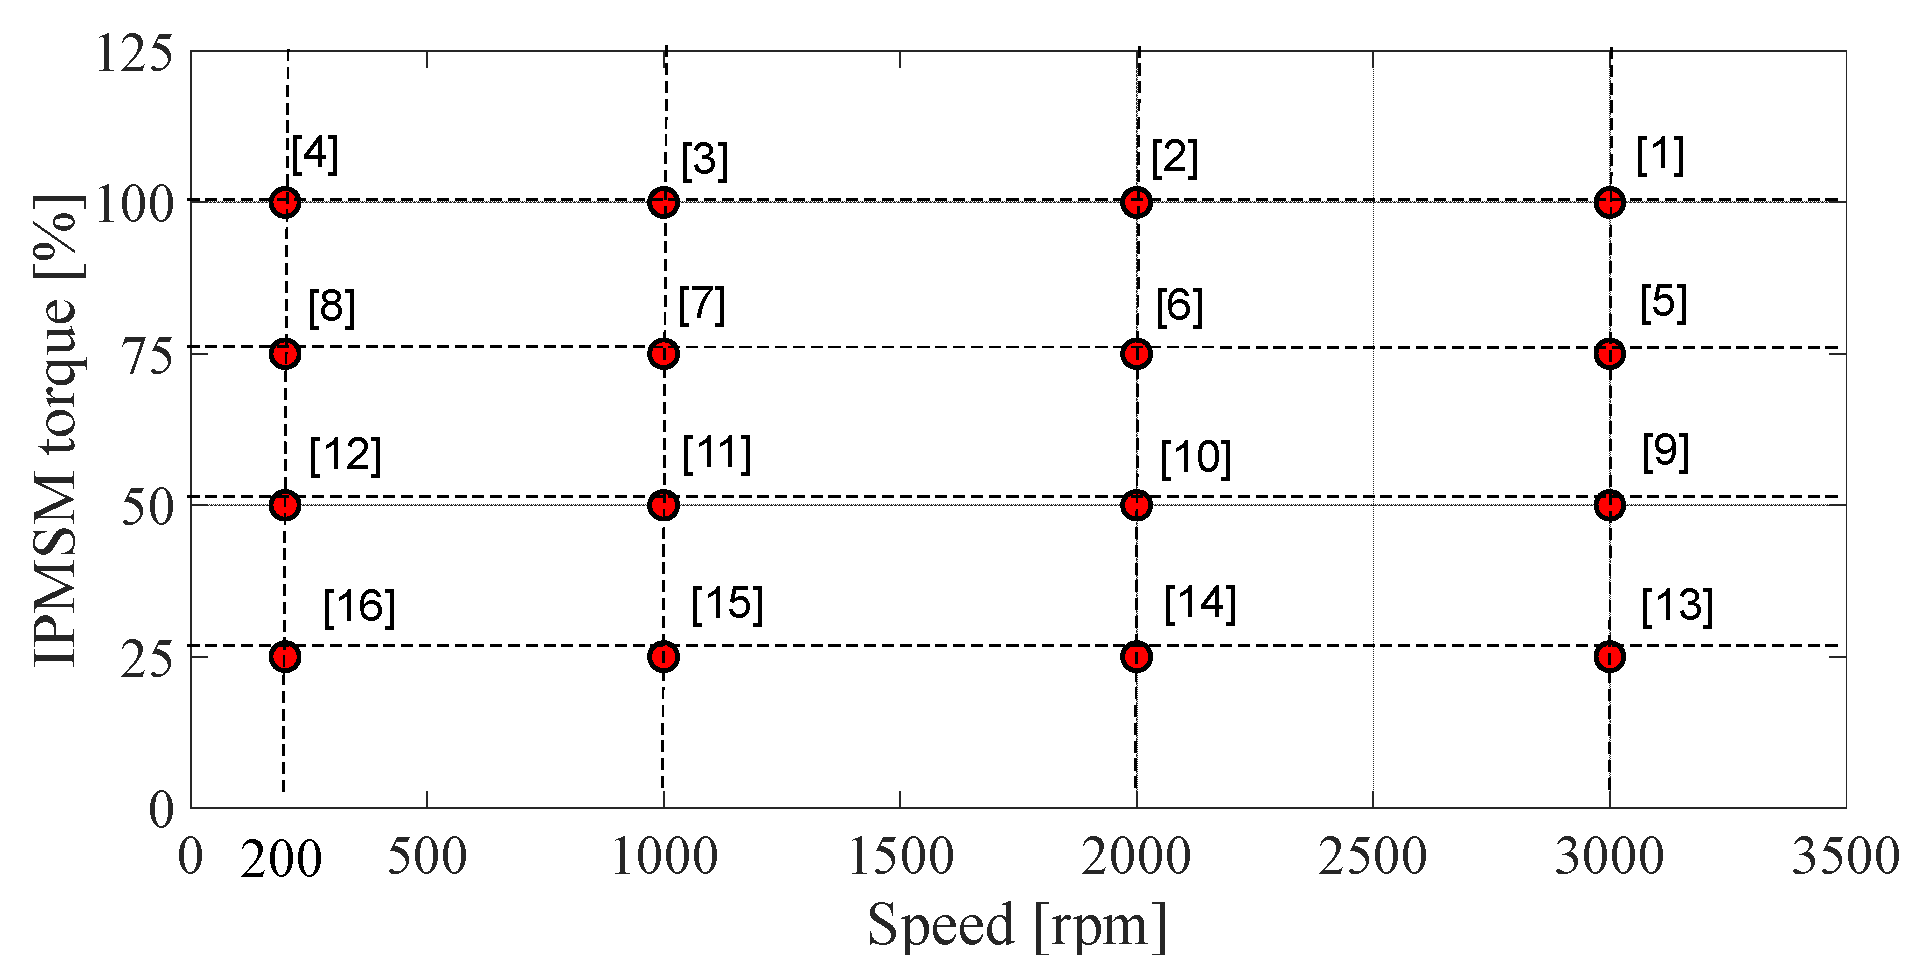
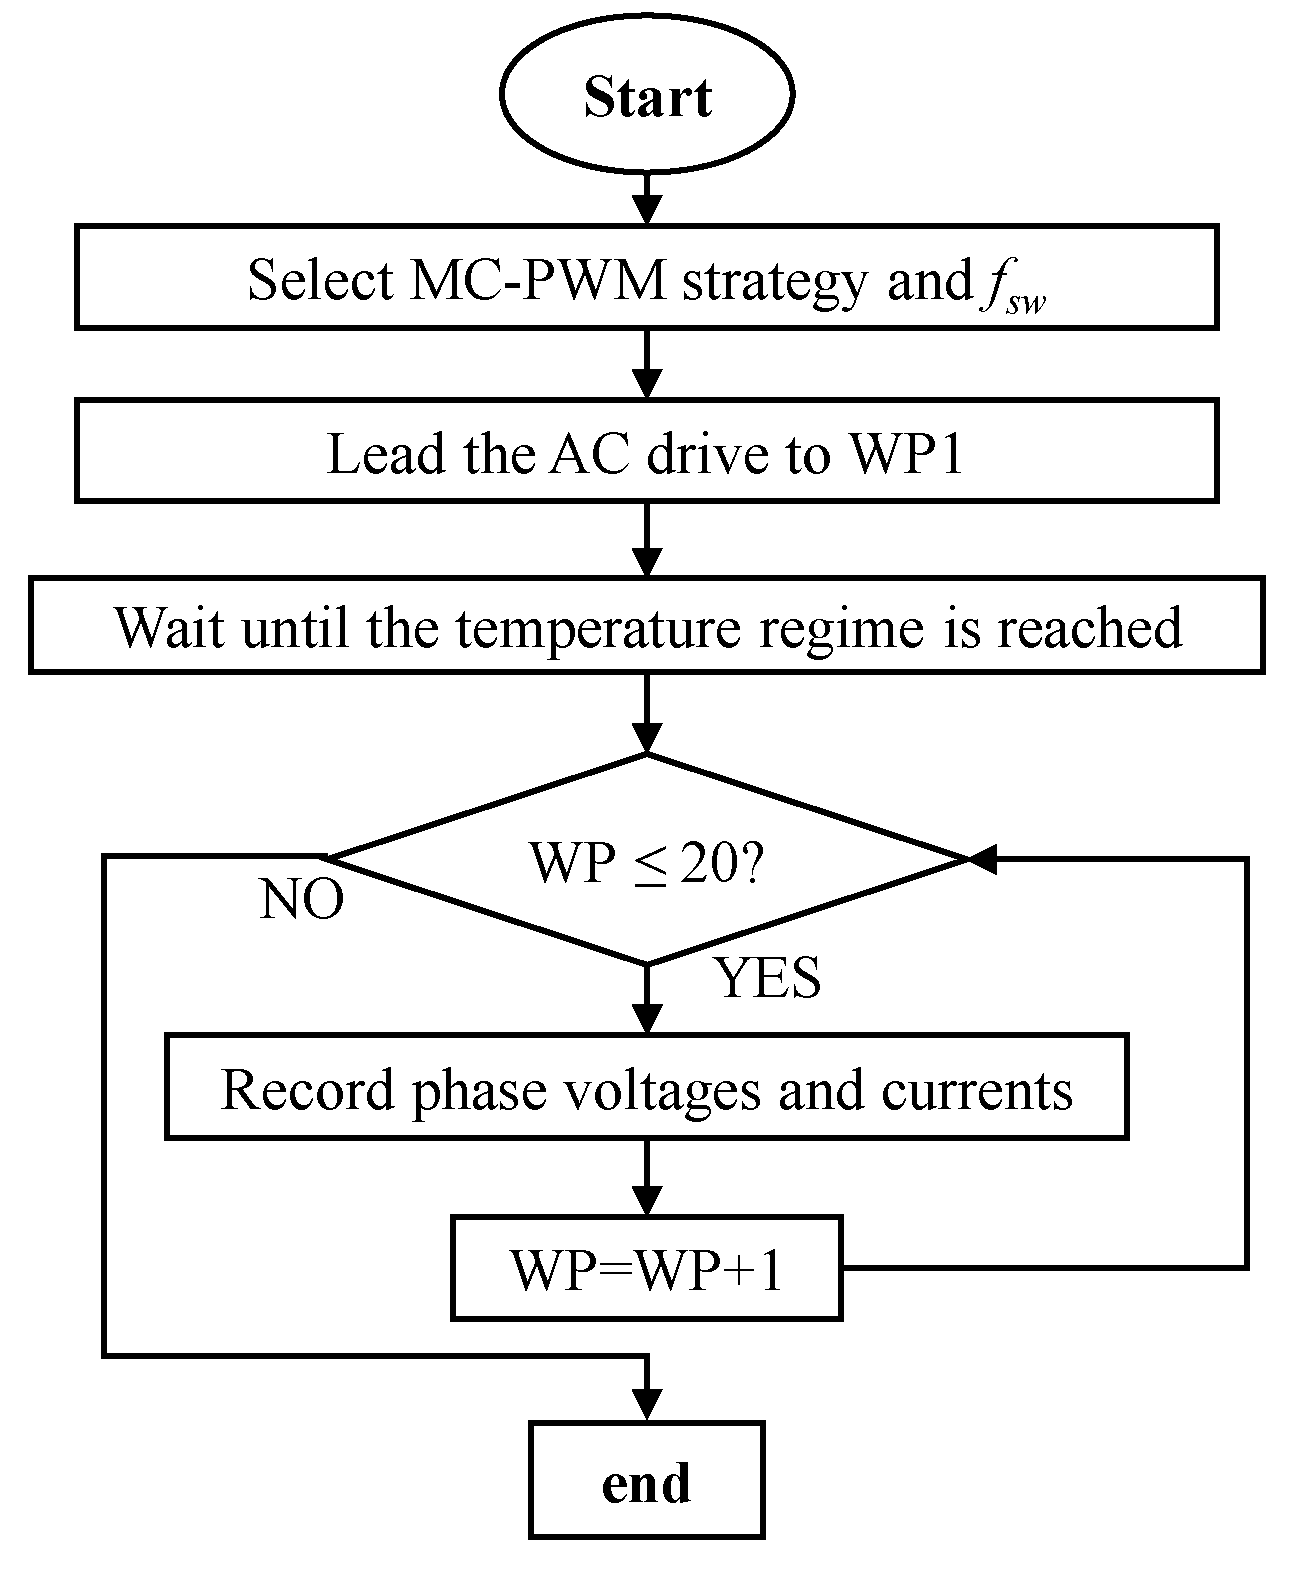
Generally, the key energy indicators in a motor system are the efficiency and the power losses evaluated as
η [ % ] = P m P e l 100
Δ P = P e l P m
where Pm is the output mechanical power of the motor and Pel is the input electrical active power.
The motor power losses include several power losses components related to both fundamental voltage and current quantities and voltage and current harmonic quantities introduced by the MC-PWM strategy. In detail, voltage and current harmonic quantities provide additional ohmic and iron power losses, respectively. In this sense, several works in the scientific literature analyze and propose mathematical modeling for copper and iron harmonic power losses’ estimation with analytical and finite element approaches [35,36,37,38]. By way of example, the ohmic losses due to the current harmonics can be calculated according to [38] by
Δ P c u h a r m = h 1 3 R I h 2
where R represents the winding phase resistance and Ih the RMS value of the current harmonic quantity. Moreover, according to [38], the voltage harmonics cause harmonic iron power losses and, at high frequencies, the eddy current power losses are dominant due to the quadratic frequency dependence with respect to hysteresis iron power losses. Thus, a good approximation can be applied to the total iron losses due to the voltage harmonics and can be evaluated by taking into account the difference between the square of the total converter output voltage rms value Vrms and the square of the converter output fundamental voltage V1 with the following relation:
Δ P F e h a r m h 1 P F e h = k w m f e h 1 V h 2 = k w m f e V r m s 2 V 1 2
where Pfe-h is the iron power losses produced at harmonic frequency fh, kw is the equivalent eddy current coefficient, mfe is the iron mass, and Vh is the RMS value of the voltage harmonic quantity. The estimation or experimental determination of each power losses quantity, related to fundamental and harmonic voltage and current quantities, requires complex procedures and mathematical modeling by resulting in a very time-consuming procedure. Since the goal of the work is to perform an accurate evaluation of total harmonic motor power losses, the harmonic power analysis approach is considered [33], which avoids the highly time-consuming procedure [17]. In this way, an extensive and detailed experimental analysis of motor power losses for several MC-PWM strategies and different switching frequency values can be carried out.
Typically, the active input power Pel of an AC motor is calculated in the time domain as the average of the instantaneous power over one electrical period. In a discrete system, voltage and current samples are collected within an observation window Tw at a sampling frequency fs. Then, Pel is computed as follows:
P e l = 1 N s k = 0 N s 1 v k i k
Here, Ns denotes the total number of acquired samples, while vk and ik represent the kth voltage and current samples, respectively. Alternatively, Pel can be calculated in the frequency domain using the Discrete Fourier Transform (DFT), as shown below:
P e l = P D C + h > 0 F N V h I h cos φ h
where PDC is the DC power component, Vh and Ih are the RMS values of the h-order harmonic of voltage and current, and φh is the respective phase displacement. h is the harmonic order, and FN is the Nyquist frequency. It is important to note that h is a rational number, rather than an integer number, in order to consider also voltages and currents’ sub-harmonics and inter-harmonics. It also depends on the observation window Tw, while the Nyquist frequency FN depends on the sampling frequency fs. In detail, sub-harmonics and inter-harmonics could be generated by several phenomena, such as speed and current oscillations due to non-optimal control action, motor nonlinearities [39], and the non-integer value of the frequency modulation index [40], i.e., the ratio between the switching frequency (constant in this application) and fundamental frequency values correlated to the mechanical speed. According to (17), the active power arises from pairs of isofrequential voltage and current harmonics. By evaluating the active power absorbed by each phase, the total input active power of a three-phase electrical motor Pel,tot can be computed as follows:
P e l , t o t = P e l , A + P e l , B + P e l , C
The DFT approach is adopted since it allows for splitting the overall active power into the fundamental power P1, which includes only fundamental voltages and currents components (h = 1), and into the harmonic power Ph, which includes the remaining voltages’ and currents’ harmonic components (h > 0, h ≠ 1), as follows:
P e l , t o t = P 1 + P h
With the assumption that high-frequency harmonics have a negligible effect on torque production, the motor total power losses ΔPtot, along with its relative fundamental power losses ΔP1, and harmonic power losses ΔPh, can be calculated as
Δ P t o t = P e l t o t P m
Δ P 1 = P 1 P m
Δ P h = P h = Δ P t o t Δ P 1 = P e l t o t P 1
where Pm is the motor mechanical output power. Furthermore, power losses can also be expressed in percent of the total power losses ΔPtot as follows:
Δ P 1 [ % ] = Δ P 1 Δ P t o t 100
Δ P h a r m [ % ] = Δ P h Δ P t o t 100
Given the previous discussion, it is evident that careful consideration must be given to the measurement setup. Specifically, the observation window Tw should be appropriately selected to both ensure synchronous sampling, i.e., an integer number of voltage and current waveform periods must be captured to prevent spectral leakage, and to guarantee a sufficient frequency resolution to distinguish subharmonic and interharmonic components [41,42]. Additionally, the sampling frequency must be suitably chosen to allow analysis over a wide frequency range. Thus, by using an observation time of 1 s and a sampling frequency of 1 MHz, a Nyquist frequency of 500 kHz and a frequency resolution of 1 Hz were obtained. This setup also ensured synchronous sampling, allowing for the acquisition of an integer number of current and voltage waveform periods, which effectively renders the leakage spectrum phenomenon negligible.

4. Test Setup

For experimental investigation purposes, a motor drive composed of a three-phase IPMSM prototype fed by a three-phase five-level MOSFET-based CHBMI prototype was assembled at the Sustainable Energy Saving Laboratory (SDESLab) of the University of Palermo. Table 2 summarizes the main technical data of the MOSFET IRFB4115PBF employed in the CHBMI. The CHBMI is powered by six DC power supplies RSO-2400, whose datasheet is reported in [43]. Furthermore, a commercial 2L-VSI model DPS 30 A prototype (Figure 4) was employed for comparative purposes, and its main data are reported in Table 3. Figure 5 illustrates the test bench designed for the accurate measurement of IPMSM power losses. The IPMSM prototype is a six-pole motor with interior SmCo PMs, whose nameplate data are summarized in Table 4, and its main electrical and magnetic parameters are detailed in [44].
A Teledyne LeCroy MDA 8038HD oscilloscope, equipped with HVD3106A high-voltage differential probes, a CP030A high-sensitivity current probe, and a DCS025 deskew calibration source (for power angle error reduction), was employed for the accurate measurement of the IPMSM input active power.
The manufacturer guarantees a 1% accuracy in active power measurements across the system full bandwidth. A Magtrol HD-715-8NA hysteresis brake is used as a mechanical load to perform tests at different work conditions, and it is equipped with a DSP6001 dynamometer that allows setting the load torque value. Moreover, it provides torque and speed measurement signals that can be used for mechanical power determination. The related accuracies are 0.01% for reading for speed measurement and 1.3 × 10⁻² N m for torque measurement (0.2% of range). The accuracy data are satisfactory for motor power losses and efficiency determination and for comparative purposes [45,46]. These signals were acquired with the MDA 8038HD oscilloscope. To detect the thermal equilibrium of IPMSM during load operations, a Delta Ohm temperature probe model DO 9847 was employed.
The FOC algorithm was deployed on a System on Module (SOM) sbRIO 9651, which includes an ARM Cortex-A9 processor and an Artix7 FPGA, both programmable using the LabVIEW graphical language. The implementation of the FOC strategy adopted in this work, both on the hardware and software side, has been discussed in [47,48]. In detail, it allows for varying through the Graphical User Interface (GUI) all the main modulation parameters, i.e., the modulation scheme and switching frequency.
To perform an accurate IPMSM loss maps identification, 16 IPMSM working conditions (IPMSM WPs) were considered, as shown in Figure 6. The WPs of the IPMSM are delineated within the frequency/speed-load torque plane at 25%, 50%, 75%, and 100% of the rated torque. This characterization was achieved by employing supply fundamental frequencies of 10 Hz, 50 Hz, 100 Hz, and 150 Hz. The defined working area represents an extension of the working area prescribed in the IEC 60034-2-3 [49], which regulates methodologies for accurate inverter-fed AC motors power losses and efficiency determination. The IEC 60034-2-3 WPs were introduced to obtain a good agreement of the power loss results for common industrial applications with a minimum number of measurement points. In detail, WPs 4-5-6-7-8-11-12-13-16 were added with respect to the IEC 60034-2-3 prescriptions. Such a choice was carried out to guarantee a fine power losses detection, especially at low switching-frequency values. For each WP considered, the IPMSM total losses were identified and segregated into fundamental power losses and harmonic power losses by applying the frequency domain approach described in the previous section. The IPMSM power losses maps identification was carried out with the defined sixteen WPs at a switching frequency value equal to 4 kHz. All the experimental investigations were carried out with IPMSM at thermal equilibrium according to standard prescriptions [9,49]. In detail, all the acquisitions were performed after the motor reached the thermal equilibrium at the first working point (rate of motor temperature change is 1 K or less per half hour) and in quick succession to minimize the motor temperature changes moving from one standardized working point to the others.
Since achieving IPMSM thermal equilibrium is a very time-consuming task, the IPMSM power losses maps’ identification at other switching frequency values (8, 12 and 16 kHz) was carried out by considering only nine WPs by excluding the WPs 4-5-6-7-8-12-16. Indeed, only two extra WPs, i.e., WP 11-13, were considered with respect to IEC 60034-2-3. However, since the considered standard suggests only 7 WPs, discarding WPs 4-5-6-7-8-12-16 for switching frequencies higher than 4 kHz allows for considering the minimum number of WPs prescribed by the adopted standard. Thus, it can be stated that the WPs considered allowing the good agreement of the power losses results for common industrial applications. Finally, the measurement process employed to acquire voltage and current quantities is summarized in Figure 7.

5. Experimental Results and Analysis

As described in the previous section, experimental investigations have been carried out for each considered modulation strategy under steady-state conditions and thermal equilibrium. Therefore, a huge amount of data was acquired and analyzed. By way of example, Figure 8 shows the acquired voltages and currents of the IPMSM under WP2 (speed n = 2000 rpm, load torque T = 1.8 Nm) at fsw= 4 kHz, when SPWM, SPD, SPS, and SSCA modulations are employed.
For each modulation strategy, the FFT of motor current was also measured and shown in Figure 8c,f,h,i by confirming the harmonic behavior described in Section 2. By DFT methodology, the cumulative percentage values of input active power for the IPMSM were estimated and shown in the frequency domain, Figure 9. Specifically, upon a closer examination of the current spectrum corresponding to each modulation strategy and the associated input cumulative power trend, it becomes apparent that the discrete changes in input cumulative power align precisely with the harmonic groups of the relative switching frequencies. As expected, the input active power associated with the harmonic quantity cannot be neglected in the case of conventional SPWM modulated 2L-VSI, amounting to about 3%. Contrary to this, in the case of CHBMI, over 99.5% of the IPMSM input active power is centered around the fundamental frequency. Consequently, the contribution of harmonic active power is effectively constrained and it can also be detected and evaluated. A detailed IPMSM power losses analysis with fsw equal to 4 kHz and the correlated switching frequency impact on IPMSM power losses is discussed in the next subsections.

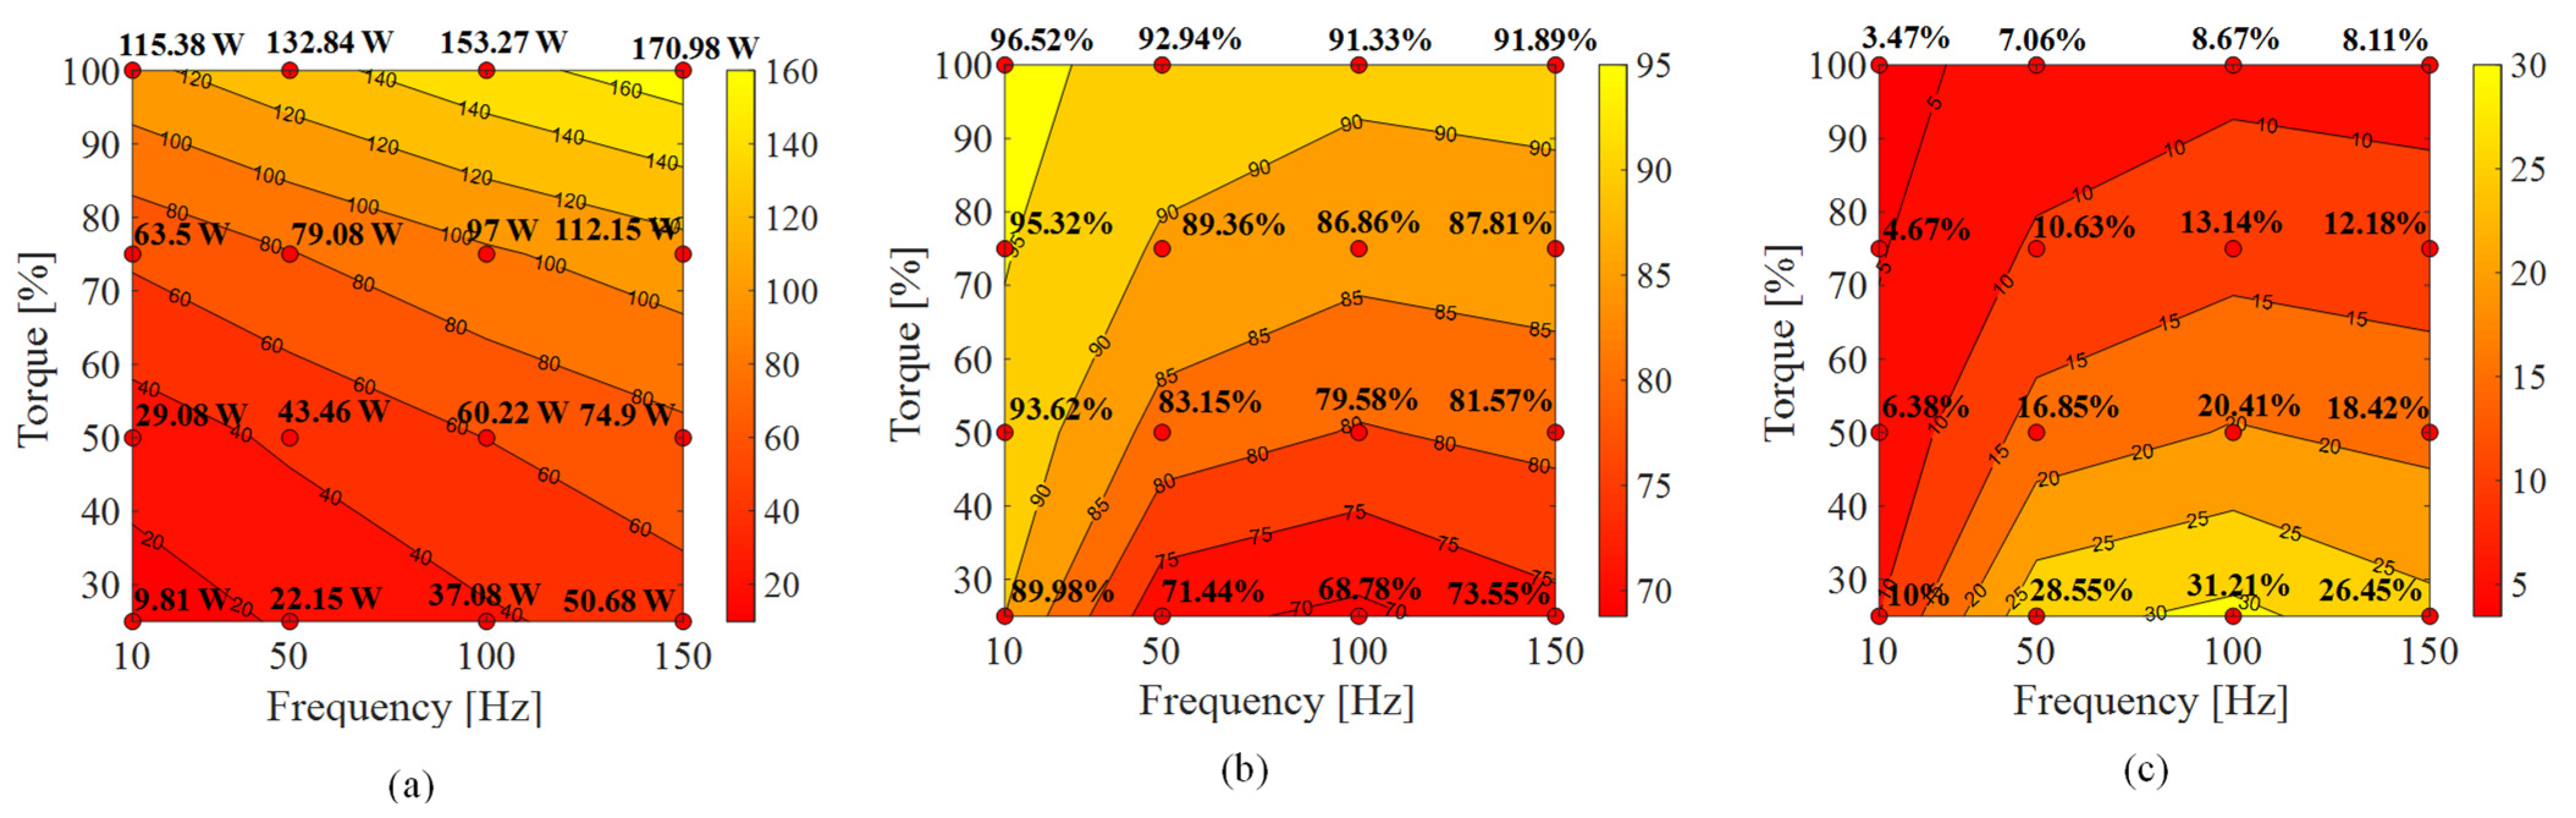
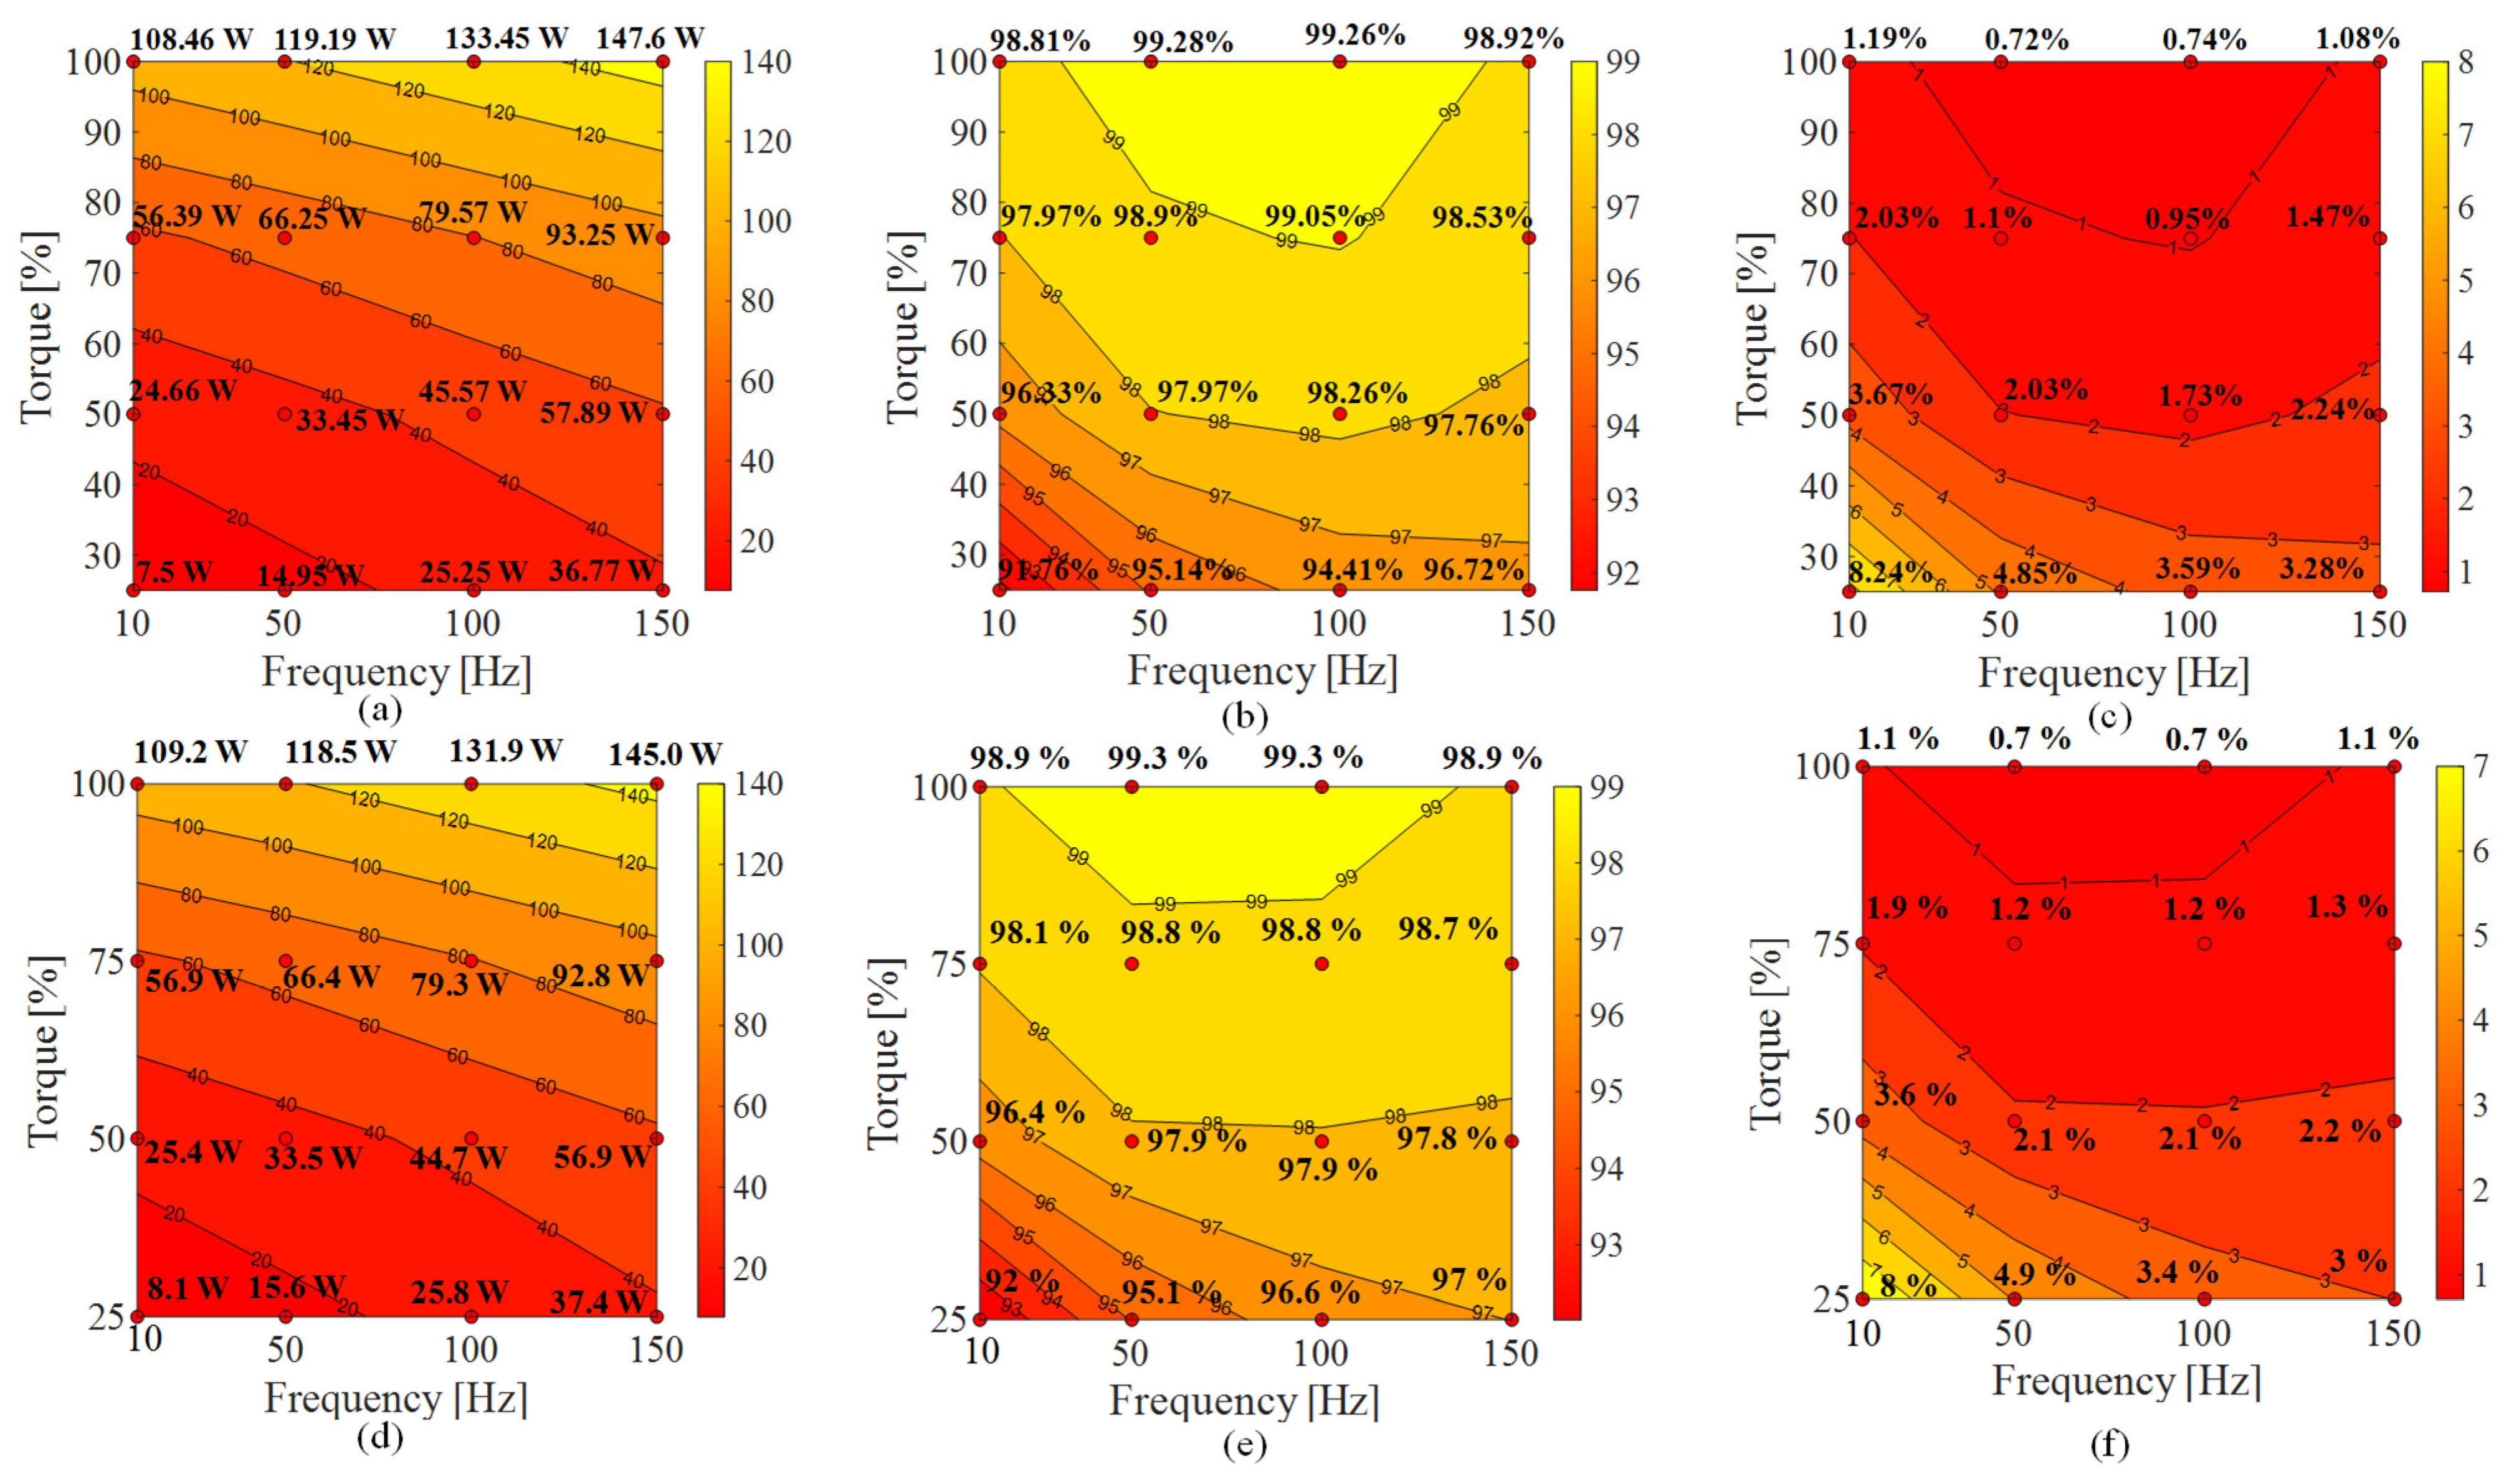
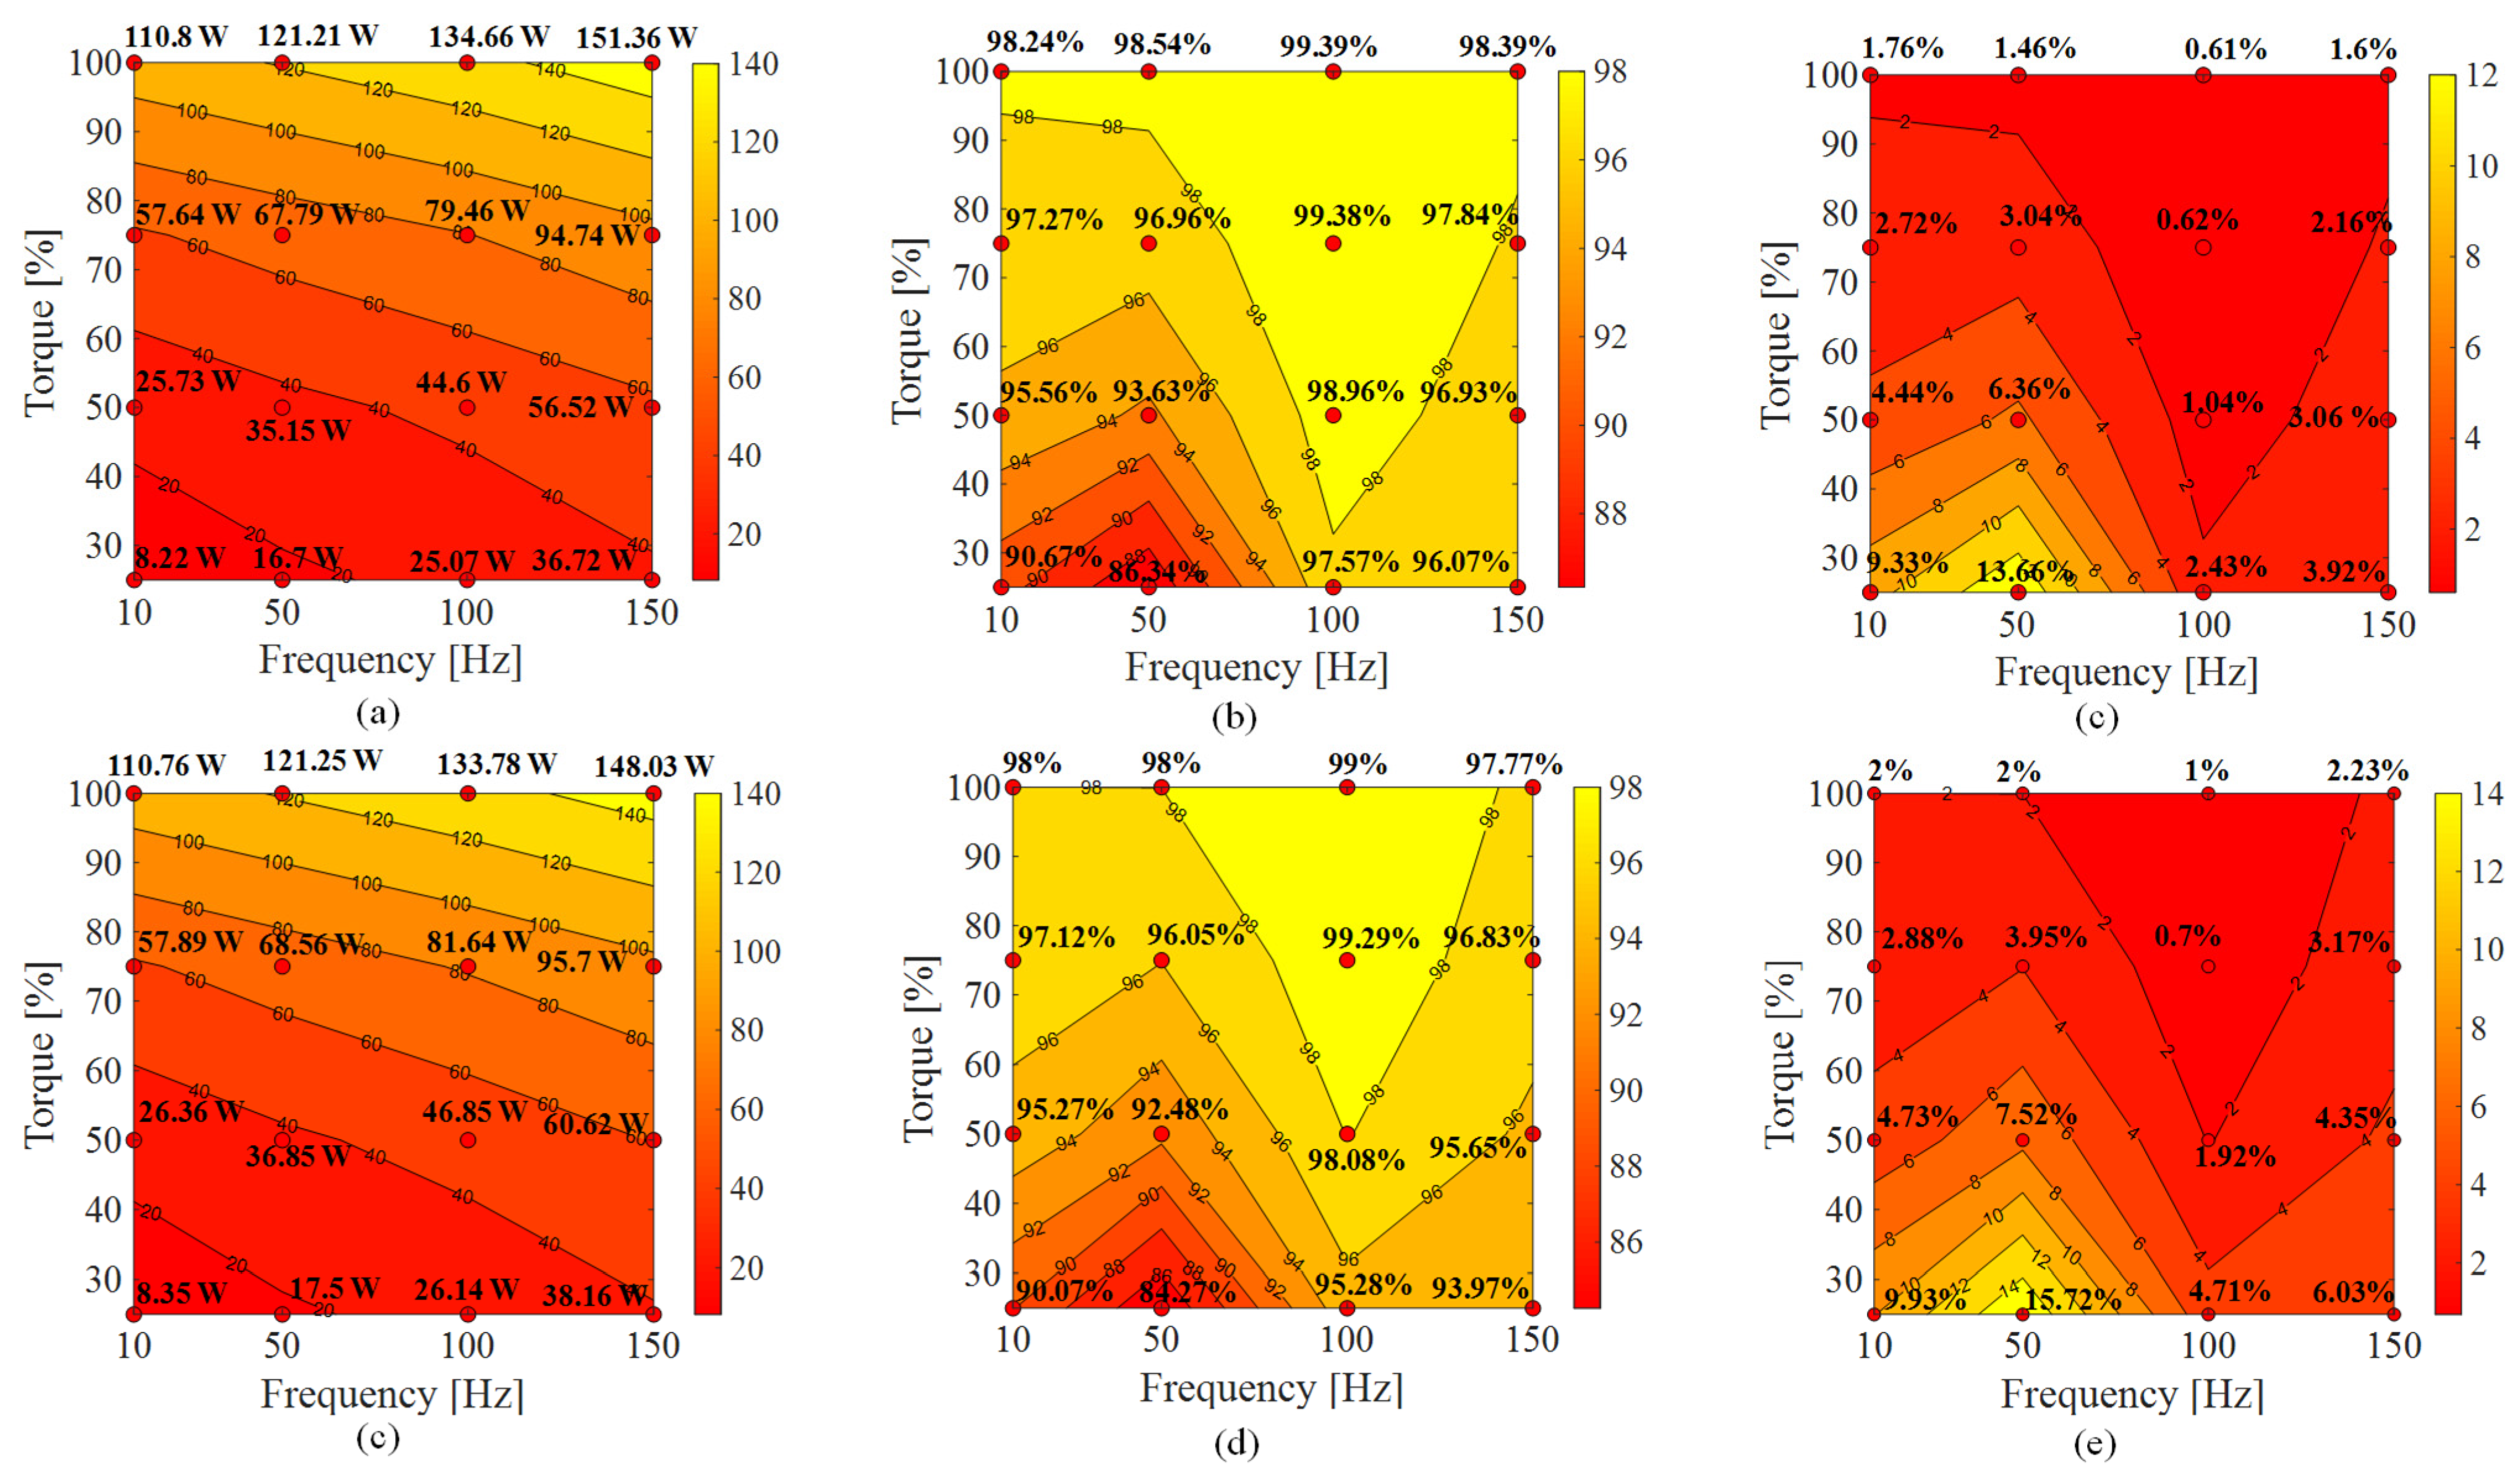
5.1. Power Losses Segregation Analysis at 4 kHz

To provide a general overview of IPMSM performance, the IPMSM efficiency was detected with each modulation strategy, as reported in Table 5. To ensure the repeatability of the results obtained, power loss and efficiency measurements of the IPMSM were conducted multiple times, revealing no appreciable discrepancies. It is possible to observe a significant efficiency improvement achieved by CHBMI with respect to 2L-VSI in almost all considered WPs. Specifically, the efficiency improvement of the IPMSM ranges from 2.5% to 7%, and this margin of improvement increases as the load torque decreases for fixed mechanical speed. This behavior can be attributed to additional harmonic power losses, which are significantly reduced in the case of CHBMI power supply, and their percentage value with respect to the total motor power losses is higher at low IPMSM working conditions, where the power losses values are reduced. For PD CHBMI modulation, the SFO modulation signal improves IPMSM efficiency by 0.5%. A higher efficiency in the IPMSM was observed when Sinusoidal modulation signals are employed for both PS and SCA modulation schemes, showcasing a maximum efficiency difference of 0.5% and 1%, respectively.
Comparing the efficiency obtained with MC-PWM strategies, it can be noted that SFOPD-PWM guarantees the maximum efficiency almost in every WP, and SPS-PWM provides slightly lower or comparable efficiency values. This behavior can be attributed mainly to the additional harmonic iron power losses that are a function of the harmonic frequency of the voltage spectrum. In detail, as reported in Table 1, the PD-PWM provides voltage harmonics centered around the switching frequency and its integer multiples, whereas the PS-PWM provides voltage harmonics centered around four times the switching frequency and its integer multiples in the case of five-level CHBMI.
The IPMSM total power losses and percentage power losses associated with fundamental and harmonic components maps over the adopted working range are reported in Figure 10, Figure 11, Figure 12 and Figure 13a–c for traditional 2L-PWM, SPD-PWM, SPS-PWM, and SCAMOD, with a switching frequency equal to 4 kHz. As expected, a significantly different IPMSM power losses distribution was detected for 2L-VSI and CHBMI supply. For both inverters, the IPMSM percentage harmonic power losses increase as the mechanical speed or fundamental frequency decreases, but significantly higher values were detected with 2L-VSI, justifying the efficiency behavior previously described and discussed. In detail, the IPMSM percentage harmonic power losses reach values around 30% with 2L-VSI, and thus, they are not negligible at any WP. Instead, the IPMSM percentage harmonic power losses reach values lower than 10% with CHBMI controlled by PD and PS modulation strategies and slightly higher values with SCA modulation strategies. Furthermore, at high-load torque operating conditions, the harmonic power losses present a very reduced amplitude and, as a result, are significantly limited. Therefore, percentage harmonic power losses related to CHBMI are extremely low (always lower than 10% in almost WPs) due to the reduced voltage and current harmonic contents. This study reveals that in all analyzed operating points, and for every considered MC-PWM modulation strategy of a CHBMI supply, over 90% of the IPMSM power losses originate from fundamental quantities.

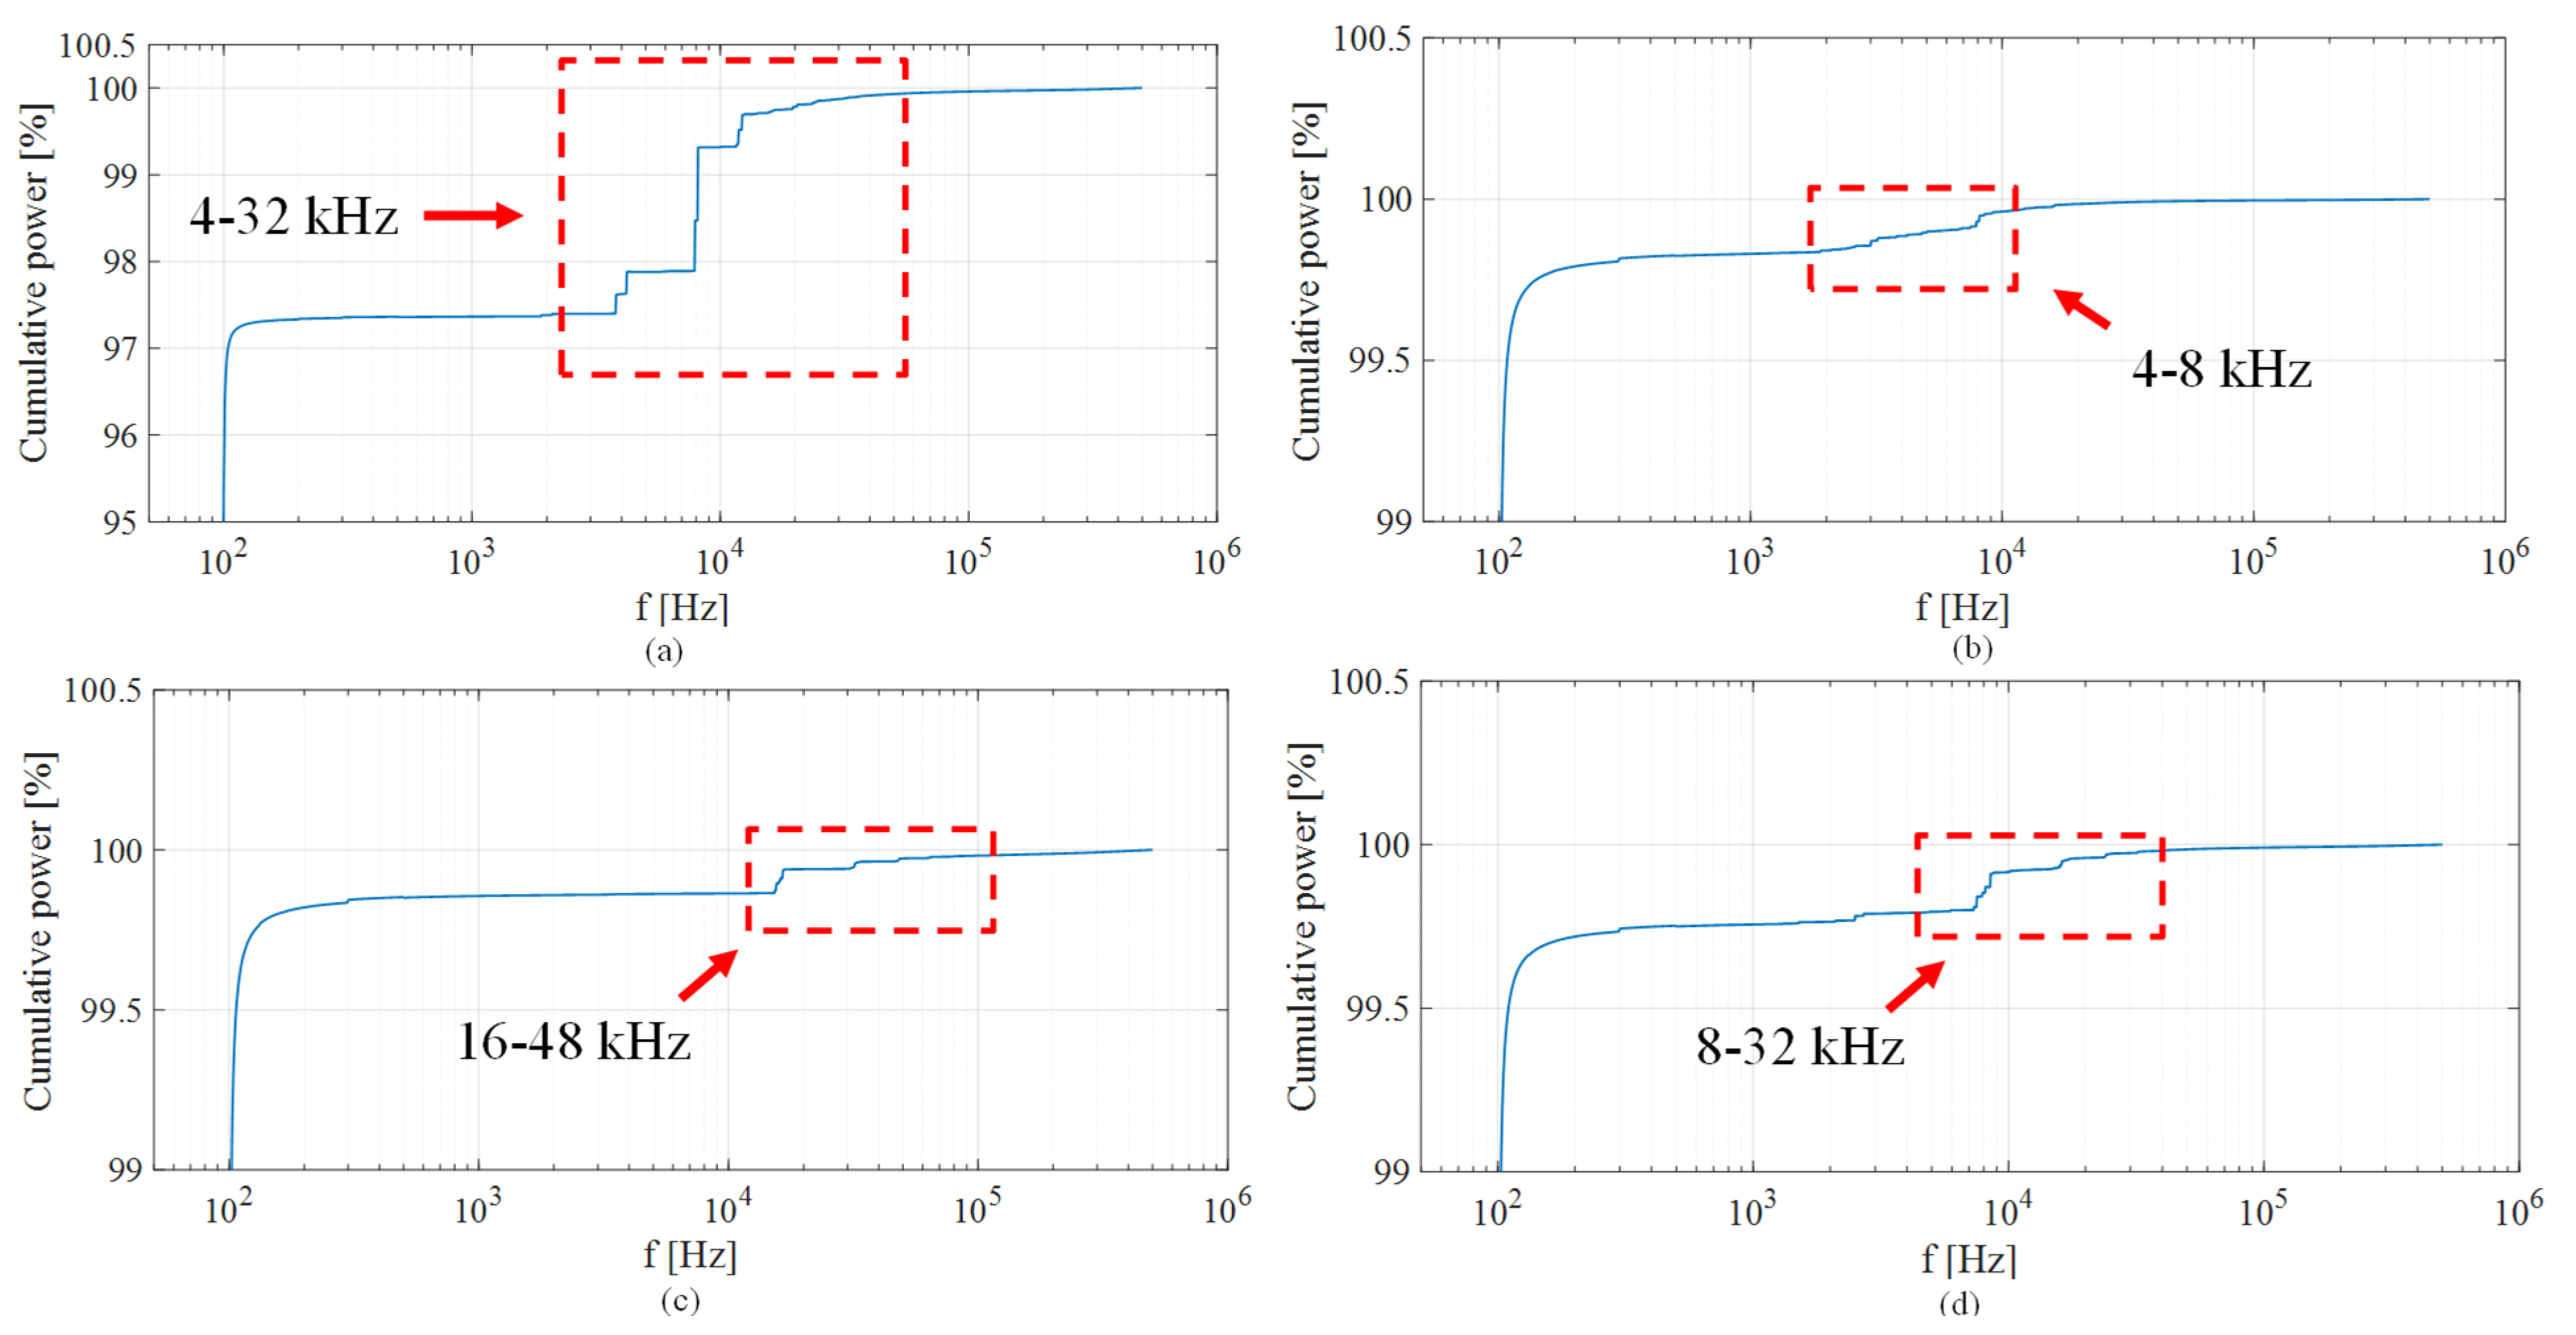
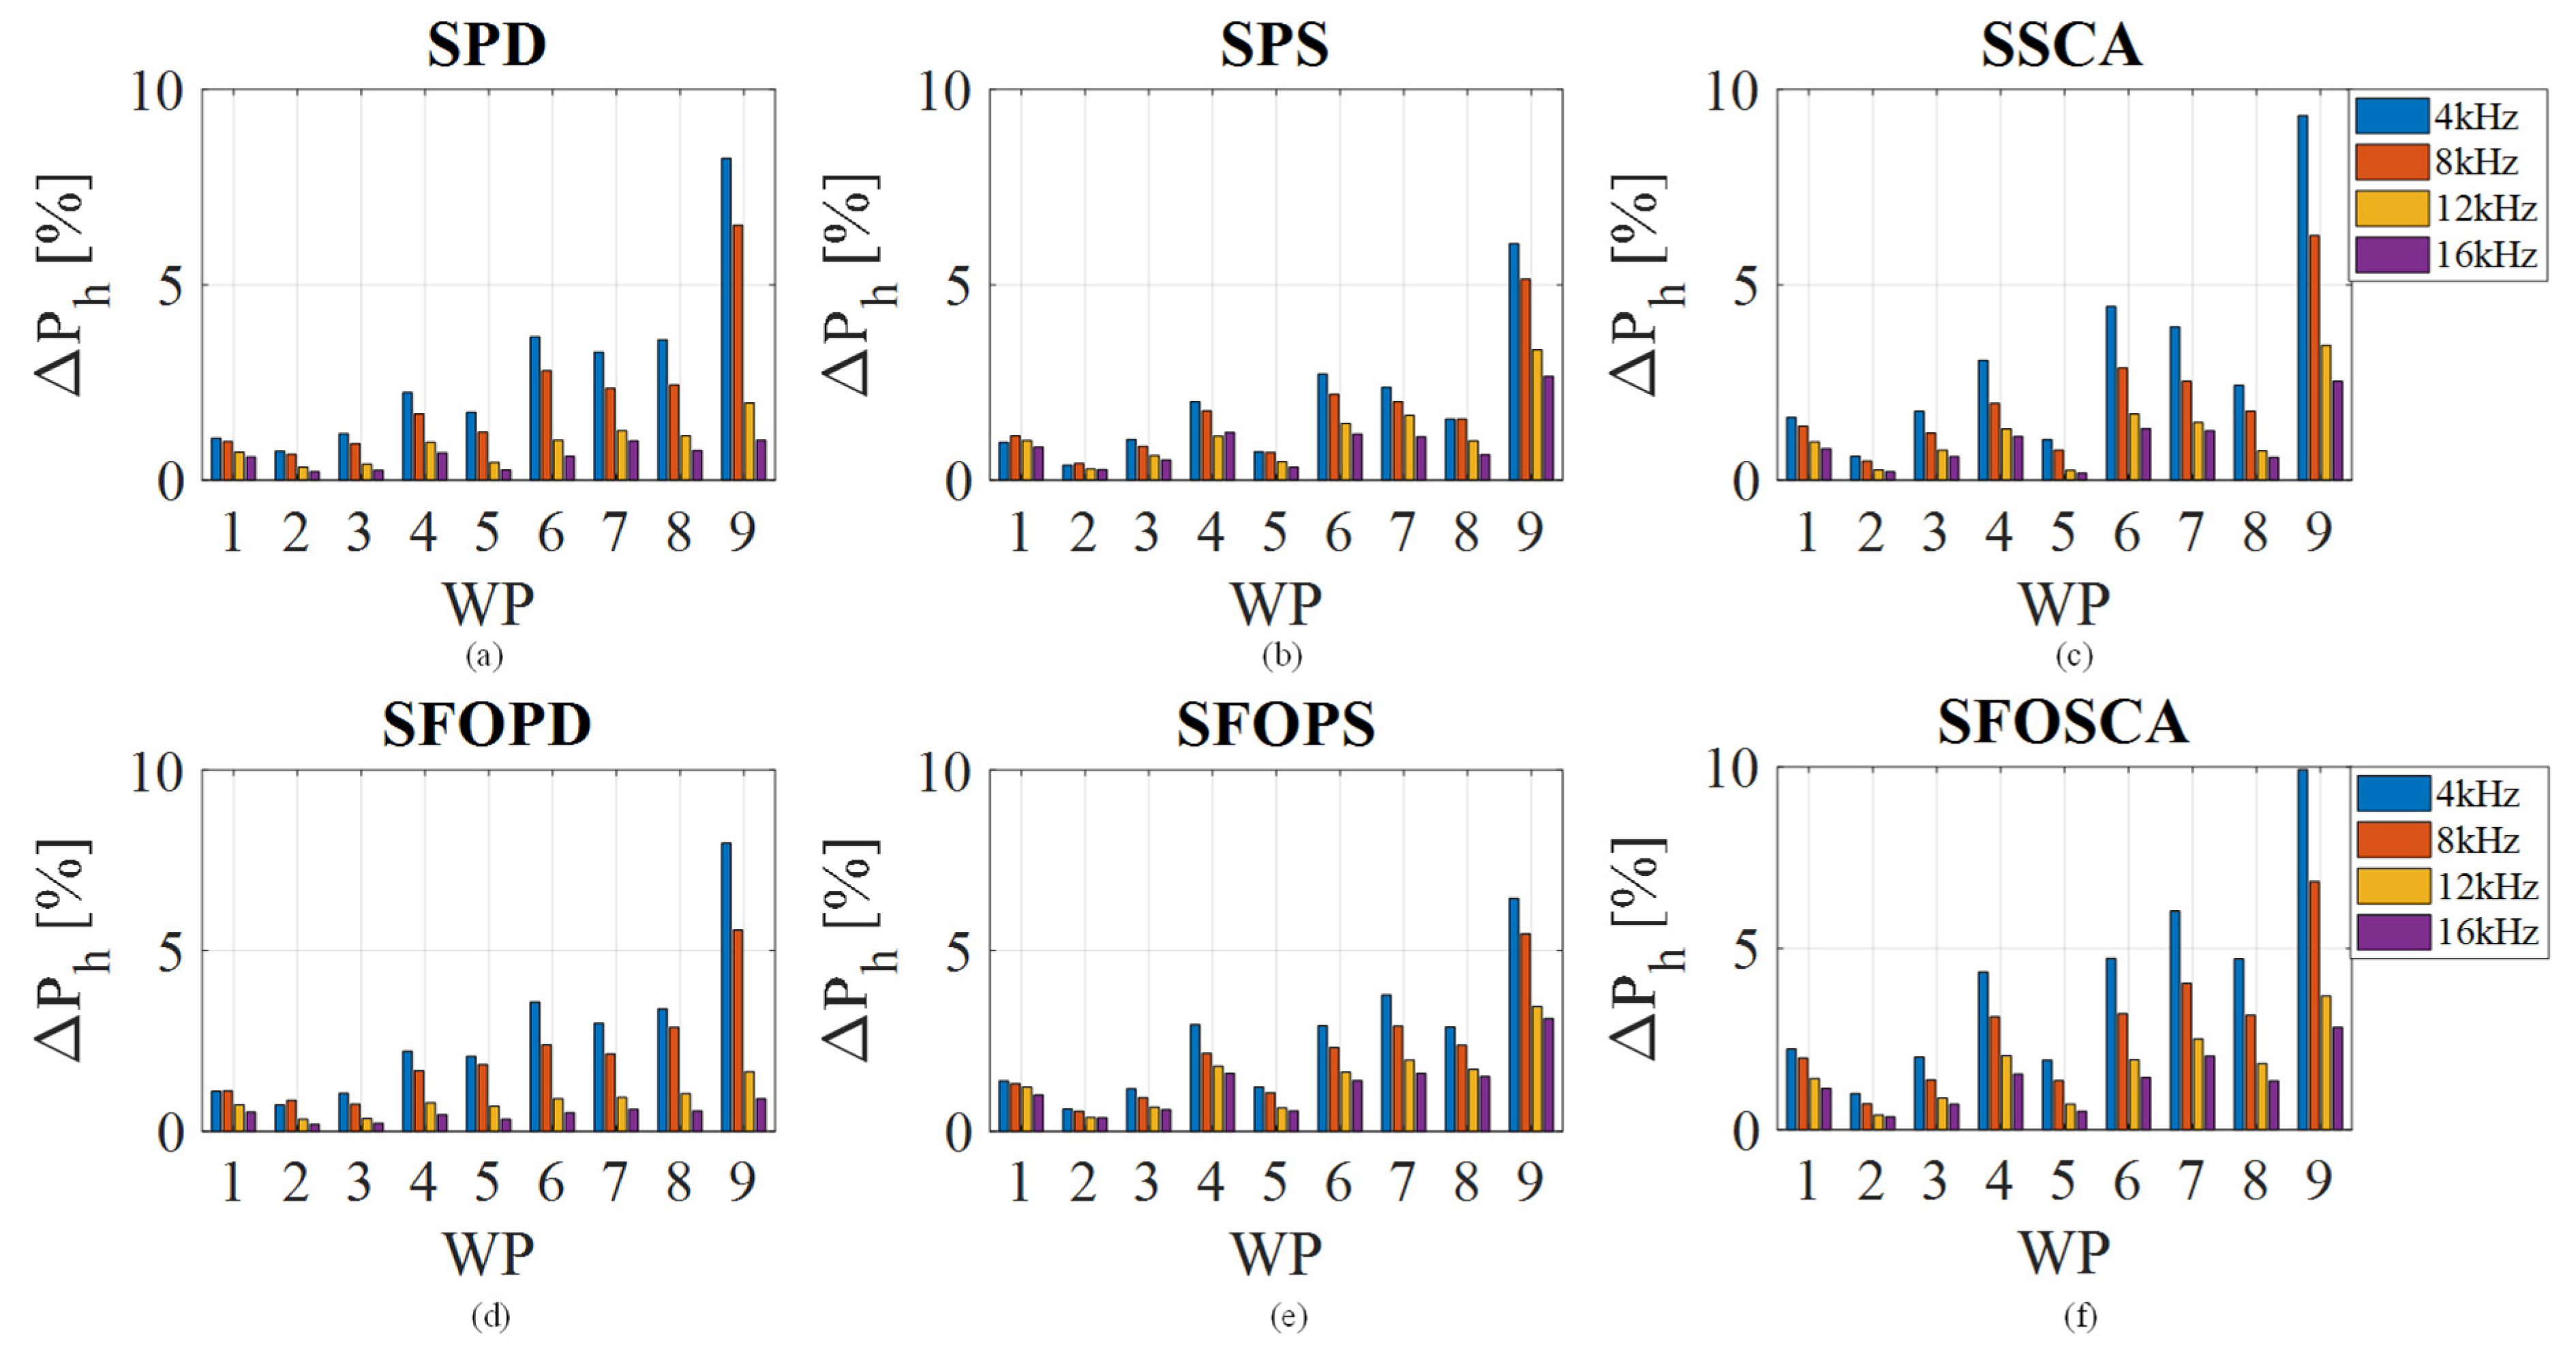
5.2. Switching Frequency Impact Analysis

This subsection presents the analysis of the switching frequency impact on IPMSM power losses. In detail, since the IPMSM power losses detected with 2L-VSI were higher for all considered switching frequency values, only the IPMSM power losses detected with CHBMI were analyzed. The IPMSM total power losses, percentage fundamental power losses, and percentage harmonic power losses detected for each switching frequency value are reported in Figure 14, Figure 15 and Figure 16, respectively. Regarding total power losses, Figure 14 shows a total power losses reduction when the switching frequency increases. Such a result is valid for every considered WP and for every MC-PWM strategy, especially at high-load IPMSM operations. Such a behavior can be justified by considering that a higher switching frequency guarantees a lower current ripple, which mainly influences the copper losses. In detail, moving from 4 kHz to 8 kHz, a considerable losses reduction is identified. Moreover, in almost all the WPs considered in this analysis, SFO determines a slight increase in the power losses compared to a Sinusoidal modulation signal for PS and SCA modulations for each switching frequency considered, as observed in the previous analysis at 4 kHz.
The detected total power losses’ behavior as a function of switching frequency is correlated to a different power losses distribution, which can be noticed in Figure 15 and Figure 16. It is shown that the higher the switching frequency, the more the power losses move at the fundamental frequency. Even in this case, this increasing trend is independent of the considered WP or MC-PWM strategy. However, it can be noted that the percentage fundamental power losses increase slope is strongly correlated to the considered WP and it is particularly evident at low-speed and low-torque conditions. By way of example, the percentage fundamental power losses increases from 93% to 98% at WP9 when the switching frequency increases from 4 kHz to 16 kHz. However, fundamental power losses are always higher than 90%. Such a result is guaranteed by the very low voltage and current harmonic distortion that a CHBMI is able to provide. In the case of fsw being equal to 16 kHz, the values vary from a minimum of 97% to a maximum of 99.8% in all WPs considered and for all MC-PWM strategies. In a complementary way, a reduction in IPMSM percentage harmonic power losses values is observed in Figure 16 with increasing switching frequency. In detail, at a switching frequency higher than 8 kHz, the harmonic power losses are lower than 5% over the whole working area, independently of the considered MC-PWM strategy, and lower than 3% for a switching frequency equal to 16 kHz. The percentage variations described are more significant at IPMSM low-load operations, where IPMSM harmonic power losses present non-negligible amplitudes. Moreover, among all considered MC-PWM strategies, the most significant reduction of motor harmonic power losses is obtained with the PD modulation scheme. Table 6 summarizes the maximum IPMSM percentage harmonic power losses values detected in the motor working area for each modulation strategy and each switching frequency value considered in this analysis. Obviously, the maximum IPMSM percentage fundamental power losses values are the complementary values with respect to those reported in Table 6.
The experimental investigation of the IPMSM drive fed by CHBMI power losses reveals that the predominant portion of IPMSM power losses originates from the fundamental electrical components. Furthermore, while an elevated switching frequency leads to a reduction in motor percentage harmonic power losses, it inherently results in increased CHBMI power losses. Additionally, it is necessary to highlight that the motor power losses are a function only of the input motor voltage pulse pattern. However, it is necessary to underline that in an electric drive, most of the power losses are concentrated in the motor, as reported in the introduction section, and new SiC and GaN power devices enable inverter operations at higher switching frequency with enhanced efficiency [50,51,52]. Therefore, this analysis reveals substantial opportunities for enhancing the overall performance of IPMSM drives fed by CHBMI in terms of power-loss reduction, particularly when compared to conventional 2L-VSI-fed IPMSM drives. This is because current IPMSM control algorithms primarily target fundamental quantities, making only the fundamental power losses both controllable and readily reducible. From an energy-saving point of view, the study conducted shows that the use of MIs also in low-voltage drive applications can provide a significant power losses reduction that, in long-term operation, can justify the additional cost required with respect to conventional 2L-VSI by ensuring optimal power quality, fault-tolerant capability, and lower electromagnetic interference. Indeed, according to [53], system losses affect not only the operational costs related to energy consumption but also have a direct impact on the overall capital expenditures. In detail, losses occurring in the machine and inverter influence the physical size, design complexity, and ultimately the cost of both components. Moreover, the additional energy losses that must be supplied from the grid through the transformer, rectifier, cables, and other associated hardware not only increase the losses in these components but also lead to greater size and cost requirements. Finally, these extra losses place further demands on the cooling system, resulting in added expenses for air conditioning, ductwork, chillers, and supporting infrastructure.

6. Conclusions

This paper presents an experimental analysis aimed at evaluating the influence of key characteristics of CHBMI on power losses in interior permanent magnet synchronous motors. The analysis included an examination of the impact of different multi-carrier PWM strategies on motor power losses, as well as the effect of varying switching frequency. To accurately distinguish fundamental and harmonic power losses, a frequency domain analysis was conducted on the total power losses measured experimentally across the entire speed–torque operating range. In addition to thoroughly analyzing the motor power losses obtained with a CHBMI, a comparison was made with those obtained using a conventional two-level inverter. The use of CHBMI resulted in higher efficiency across all considered operating points. Since over 70% of total power losses in an electric drive originate from the motor, the results suggest that such losses can be significantly mitigated by employing CHBMI with appropriate MC-PWM strategies. Consequently, significant energy savings can be realized in the long-term operation of IPMSM drives through the adoption of CHBMIs, potentially justifying their application even in low-voltage drives. Moreover, the analysis carried out opens up the possibility for new future research that will be focused on other topologies of multilevel inverters employed in industrial drives, such as three-phase three-level multilevel inverters or current source inverters, and other modulation strategies employed in these applications, such as selective harmonic elimination or harmonic mitigation strategies. This kind of research will enable the experimental identification of the physical behavior of main AC motors and power converters, in terms of power losses, and measurement frameworks for their accurate detection.

Author Contributions

Conceptualization, C.N. and A.O.D.T.; Methodology, C.N., G.S. (Gioacchino Scaglione) and G.S. (Giuseppe Schettino); Software, G.S. (Gioacchino Scaglione) and G.S. (Giuseppe Schettino); Validation, C.N. and G.S. (Gioacchino Scaglione); Formal analysis, C.S.; Investigation, C.N. and G.S. (Gioacchino Scaglione); Resources, G.S. (Giuseppe Schettino) and R.M.; Data curation, C.N. and F.V.; Writing—original draft, C.N., G.S. (Gioacchino Scaglione) and G.S. (Giuseppe Schettino); Writing—review & editing, A.O.D.T., F.V. and C.S.; Visualization, G.S. (Gioacchino Scaglione) and A.O.D.T.; Supervision, A.O.D.T., F.V., C.S. and R.M.; Project administration, R.M.; Funding acquisition, R.M. All authors have read and agreed to the published version of the manuscript.

Funding

This work was supported in part by the European Union—NextGenerationEU-National Sustainable Mobility Center CN00000023, Italian Ministry of University and Research Decree n. 1033—17/06/2022, Spoke 3, 12, CUP B73C22000760001, and in part by the Prin 2022-Settore/Ambito di intervento: PE7 Enhanced Energy-Saving Powertrains for Freight E-Transportation (ESPFET) under Grant PRJ-0962-CUP B53D23002440006. The authors would like to acknowledge that this work was carried out in the following laboratories: the Sustainable Development and Energy Saving Laboratory (SDESLab), Rapid Prototyping Lab (RPLab), and Laboratory of Electrical Application (LEAP) at the Department of Engineering, Building no.9, University of Palermo, Italy.

Data Availability Statement

No new data were created or analyzed in this study. Data sharing is not applicable to this article.

Conflicts of Interest

The authors declare no conflicts of interest.

References

  1. Fong, J.; Ferreira, F.J.T.E.; Silva, A.M.; de Almeida, A.T. IEC61800-9 System Standards as a Tool to Boost the Efficiency of Electric Motor Driven Systems Worldwide. Inventions 2020, 5, 20. [Google Scholar] [CrossRef]
  2. Aarniovuori, L.; Karkkainen, H.; Anuchin, A.; Pyrhonen, J.J.; Lindh, P.; Cao, W. Voltage-Source Converter Energy Efficiency Classification in Accordance With IEC 61800-9-2. IEEE Trans. Ind. Electron. 2019, 67, 8242–8251. [Google Scholar] [CrossRef]
  3. Afonso, J.L.; Tanta, M.; Pinto, J.G.O.; Monteiro, L.F.C.; Machado, L.; Sousa, T.J.C.; Monteiro, V. A Review on Power Electronics Technologies for Power Quality Improvement. Energies 2021, 14, 8585. [Google Scholar] [CrossRef]
  4. Rens, J.; Vandenbossche, L.; Dorez, O. Iron Loss Modelling of Electrical Traction Motors for Improved Prediction of Higher Harmonic Losses. World Electr. Veh. J. 2020, 11, 24. [Google Scholar] [CrossRef]
  5. Ibrahim, I.; Mohammadi, M.H.; Ghorbanian, V.; Lowther, D.A. Effect of Pulsewidth Modulation on Electromagnetic Noise of Interior Permanent Magnet Synchronous Motor Drives. IEEE Trans. Magn. 2019, 55, 7500805. [Google Scholar] [CrossRef]
  6. Guo, Y.; Yu, Y.; Lu, H.; Lei, G.; Zhu, J. Enhancing Performance of Permanent Magnet Motor Drives through Equivalent Circuit Models Considering Core Loss. Energies 2024, 17, 1837. [Google Scholar] [CrossRef]
  7. Rotating Electrical Machines—Part 30-2: Efficiency Classes of Variable Speed AC Motors (IE-Code); IEC TS 60034-30-2; IEC: Geneva, Switzerland, 2021.
  8. IEC 61800-9-1; Adjustable Speed Electrical Power Drive Systems—Part 9-1: Ecodesign for Power Drive Systems, Motor Starters, Power Electronics and Their Driven Applications—General Requirements for Setting Energy Efficiency Standards for Power Driven Equipment Using the Extended Product Approach (EPA) and Semi Analytic Model (SAM). IEC: Geneva, Switzerland, 2017.
  9. IEC 61800-9-2; Adjustable Speed Electrical Power Drive Systems—Part 9-2: Ecodesign for Power Drive Systems, Motor Starters, Power Electronics & Their Driven Applications—Energy Efficiency Indicators for Power Drive Systems and Motor Starters. IEC: Geneva, Switzerland, 2017.
  10. Barros, L.A.M.; Martins, A.P.; Pinto, J.G. A Comprehensive Review on Modular Multilevel Converters, Submodule Topologies, and Modulation Techniques. Energies 2022, 15, 1078. [Google Scholar] [CrossRef]
  11. Abu-Rub, H.; Holtz, J.; Rodriguez, J.; Baoming, G. Medium-Voltage Multilevel Converters—State of the Art, Challenges, and Requirements in Industrial Applications. IEEE Trans. Ind. Electron. 2010, 57, 2581–2596. [Google Scholar] [CrossRef]
  12. Scaglione, G.; Nevoloso, C.; Schettino, G.; Di Tommaso, A.O.; Miceli, R. A Novel Multiobjective Finite Control Set Model Predictive Control for IPMSM Drive Fed by a Five-Level Cascaded H-Bridge Inverter. IEEE J. Emerg. Sel. Top. Power Electron. 2024, 12, 1959–1973. [Google Scholar] [CrossRef]
  13. Choudhury, S.; Bajaj, M.; Dash, T.; Kamel, S.; Jurado, F. Multilevel Inverter: A Survey on Classical and Advanced Topologies, Control Schemes, Applications to Power System and Future Prospects. Energies 2021, 14, 5773. [Google Scholar] [CrossRef]
  14. Poorfakhraei, A.; Narimani, M.; Emadi, A. A Review of Modulation and Control Techniques for Multilevel Inverters in Traction Applications. IEEE Access 2021, 9, 24187–24204. [Google Scholar] [CrossRef]
  15. Ronanki, D.; Williamson, S.S. Modular Multilevel Converters for Transportation Electrification: Challenges and Opportunities. IEEE Trans. Transp. Electrif. 2018, 4, 399–407. [Google Scholar] [CrossRef]
  16. Chang, F.; Ilina, O.; Lienkamp, M.; Voss, L. Improving the Overall Efficiency of Automotive Inverters Using a Multilevel Converter Composed of Low Voltage Si mosfets. IEEE Trans. Power Electron. 2019, 34, 3586–3602. [Google Scholar] [CrossRef]
  17. Karkkainen, H.; Aarniovuori, L.; Makkonen, S.; Niemela, M.; Pyrhonen, J. Determination of High-Frequency Harmonic Power in Converter-Fed Motors. In Proceedings of the 2022 International Conference on Electrical Machines (ICEM), Valencia, Spain, 5–8 September 2022; pp. 394–400. [Google Scholar]
  18. Miyama, Y.; Hazeyama, M.; Hanioka, S.; Watanabe, N.; Daikoku, A.; Inoue, M. PWM Carrier Harmonic Iron Loss Reduction Technique of Permanent-Magnet Motors for Electric Vehicles. IEEE Trans. Ind. Appl. 2016, 52, 2865–2871. [Google Scholar] [CrossRef]
  19. Balamurali, A.; Kundu, A.; Li, Z.; Kar, N.C. Improved Harmonic Iron Loss and Stator Current Vector Determination for Maximum Efficiency Control of PMSM in EV Applications. IEEE Trans. Ind. Appl. 2021, 57, 363–373. [Google Scholar] [CrossRef]
  20. Liu, L.; Ba, X.; Guo, Y.; Lei, G.; Sun, X.; Zhu, J. Improved Iron Loss Prediction Models for Interior PMSMs Considering Coupling Effects of Multiphysics Factors. IEEE Trans. Transp. Electrification 2023, 9, 416–427. [Google Scholar] [CrossRef]
  21. Agamloh, E.B.; Cavagnino, A.; Vaschetto, S. Standard Efficiency Determination of Induction Motors With a PWM Inverter Source. IEEE Trans. Ind. Appl. 2019, 55, 398–406. [Google Scholar] [CrossRef]
  22. Yogal, N.; Lehrmann, C.; Henke, M. Determination of the Measurement Uncertainty of Direct and Indirect Efficiency Measurement Methods in Permanent Magnet Synchronous Machines. In Proceedings of the 2018 XIII International Conference on Electrical Machines (ICEM), Alexandroupoli, Greece, 1–3 September 2018; pp. 1149–1156. [Google Scholar]
  23. Jiang, M.; Tian, J.; Goh, H.H.; Yi, J.; Li, S.; Zhang, D.; Wu, T. Experimental study on the influence of high frequency PWM harmonics on the losses of induction motor. Energy Rep. 2022, 8, 332–342. [Google Scholar] [CrossRef]
  24. Yamazaki, K.; Fukushima, Y.; Sato, M. Loss Analysis of Permanent-Magnet Motors With Concentrated Windings—Variation of Magnet Eddy-Current Loss Due to Stator and Rotor Shapes. IEEE Trans. Ind. Appl. 2009, 45, 1334–1342. [Google Scholar] [CrossRef]
  25. van der Geest, M.; Polinder, H.; Ferreira, J.A. Influence of PWM switching frequency on the losses in PM machines. In Proceedings of the 2014 International Conference on Electrical Machines (ICEM), Berlin, Germany, 2–5 September 2014; pp. 1243–1247. [Google Scholar]
  26. Chen, P.; Tang, R.; Tong, W.; Han, X.; Jia, J.; Zhu, X. Analysis of losses of permanent magnet synchronous motor with PWM supply. In Proceedings of the 2014 17th International Conference on Electrical Machines and Systems (ICEMS), Hangzhou, China, 22–25 October 2014; pp. 1119–1124. [Google Scholar]
  27. Stempfle, M.; Han, Y.; Woelfle, J.; Troester, N.; Roth-Stielow, J. Influence of Different Switching Frequencies and Modulation Techniques on IPMSM and Inverter Losses Optimizing the Overall Drive Train Efficiency. In Proceedings of the PCIM Europe 2017; International Exhibition and Conference for Power Electronics, Intelligent Motion, Renewable Energy and Energy Management, Nuremberg, Germany, 16–18 May 2017; pp. 1–5. [Google Scholar]
  28. Tong, W.; Wang, Y.; Sun, R.; Wu, S.; Jia, J. Simulation and Experimental Study on No-Load Loss Distributions of an IPM Motor Under the Conditions of Both Sinusoidal Supply and Converter Supply. IEEE Trans. Magn. 2018, 54, 8110306. [Google Scholar] [CrossRef]
  29. Hothongkham, P.; Kinnares, V. Investigation into Harmonic Losses in a PWM Multilevel cascaded H-Bridge Inverter Fed Induction Motor. In Proceedings of the 2007 7th International Conference on Power Electronics and Drive Systems, Bangkok, Thailand, 27–30 November 2007; pp. 1043–1048. [Google Scholar]
  30. Salem, A.; Abdallh, A.A.-E.; De Belie, F.; Dupré, L.; Melkebeek, J. A Comparative Study of the Effect of Different Converter Topologies on the Iron Loss of Nonoriented Electrical Steel. IEEE Trans. Magn. 2014, 50, 6000804. [Google Scholar] [CrossRef]
  31. Rasilo, P.; Salem, A.; Abouelyazied, A.; De Belie, F.; Dupré, L.; Melkebeek, J.A.; Abdallh, A. Effect of Multilevel Inverter Supply on Core Losses in Magnetic Materials and Electrical Machines. IEEE Trans. Energy Convers. 2015, 30, 736–744. [Google Scholar] [CrossRef]
  32. Rollbuhler, C.; Stefanski, L.; Gretzinger, S.; Kolb, J.; Hiller, M.; Doppelbauer, M. Measurement of inverter caused losses in permanent magnet synchronous machines using a modular multiphase multilevel converter. In Proceedings of the 2019 10th International Conference on Power Electronics and ECCE Asia (ICPE 2019)—ECCE Asia, Busan, Republic of Korea, 27–31 May 2019; pp. 1239–1245. [Google Scholar]
  33. Aarniovuori, L.; Kärkkäinen, H.; Niemelä, M.; Pyrhönen, J. PWM-Induced Harmonic Power in 75 kW IM Drive System. In Proceedings of the 2020 22nd European Conference on Power Electronics and Applications (EPE’20 ECCE Europe), Lyon, France, 7–11 September 2020; pp. P.1–P.9. [Google Scholar]
  34. Busacca, A.; Di Tommaso, A.O.; Miceli, R.; Nevoloso, C.; Schettino, G.; Scaglione, G.; Viola, F.; Colak, I. Switching Frequency Effects on the Efficiency and Harmonic Distortion in a Three-Phase Five-Level CHBMI Prototype with Multicarrier PWM Schemes: Experimental Analysis. Energies 2022, 15, 586. [Google Scholar] [CrossRef]
  35. Sarigiannidis, A.G.; Kladas, A.G. Switching Frequency Impact on Permanent Magnet Motors Drive System for Electric Actuation Applications. IEEE Trans. Magn. 2015, 51, 8202204. [Google Scholar] [CrossRef]
  36. Chang, L.; Alvi, M.; Lee, W.; Kim, J.; Jahns, T.M. Efficiency Optimization of PWM-Induced Power Losses in Traction Drive Systems With IPM Machines Using Wide Bandgap-Based Inverters. IEEE Trans. Ind. Appl. 2022, 58, 5635–5649. [Google Scholar] [CrossRef]
  37. Tornello, L.D.; Vaschetto, S.; Agamloh, E.B.; Scelba, G.; De Donato, G.; Cavagnino, A. Investigating PWM-Induced Iron Losses: Measurements and Estimation Models up to 350 kHz Switching Frequency. IEEE Open J. Ind. Appl. 2024, 5, 338–355. [Google Scholar] [CrossRef]
  38. Kremser, A. Calculation and measurement of motor and converter losses according to IEC 61800-9-2 ED2. Forsch. Ingenieurwesen 2024, 88, 45. [Google Scholar] [CrossRef]
  39. Gnaciński, P.; Hallmann, D.; Pepliński, M.; Jankowski, P. The effects of voltage subharmonics on cage induction machine. Int. J. Electr. Power Energy Syst. 2019, 111, 125–131. [Google Scholar] [CrossRef]
  40. Sahoo, S.K.; Bhattacharya, T. Phase-Shifted Carrier-Based Synchronized Sinusoidal PWM Techniques for a Cascaded H-Bridge Multilevel Inverter. IEEE Trans. Power Electron. 2018, 33, 513–524. [Google Scholar] [CrossRef]
  41. Yu, Y.; Zhao, W.; Chen, L.; Wang, Q.; Huang, S. Power measurement accuracy analysis in the presence of interharmonics. Measurement 2020, 154, 107484. [Google Scholar] [CrossRef]
  42. Arranz-Gimon, A.; Zorita-Lamadrid, A.; Morinigo-Sotelo, D.; Fernandez-Cavero, V.; Duque-Perez, O. Harmonic measurement and analysis system for characterization of adjustable speed drives. Int. J. Electr. Power Energy Syst. 2024, 162, 110217. [Google Scholar] [CrossRef]
  43. Available online: https://www.meanwell.com/Upload/PDF/RSP-2400/RSP-2400-SPEC.PDF (accessed on 18 July 2025).
  44. Caruso, M.; Di Tommaso, A.; Miceli, R.; Nevoloso, C.; Spataro, C.; Viola, F. Characterization of the parameters of interior permanent magnet synchronous motors for a loss model algorithm. Measurement 2017, 106, 196–202. [Google Scholar] [CrossRef]
  45. Aarniovuori, L.; Karkkainen, H.; Niemela, M.; Pyrhonen, J. Measurement Accuracy Requirements for the Efficiency Classification of Converters and Motors. In Proceedings of the 2019 21st European Conference on Power Electronics and Applications (EPE ‘19 ECCE Europe), Genova, Italy, 3–5 September 2019; pp. P.1–P.10. [Google Scholar]
  46. Caruso, M.; Di Tommaso, A.O.; Lisciandrello, G.; Mastromauro, R.A.; Miceli, R.; Nevoloso, C.; Spataro, C.; Trapanese, M. A General and Accurate Measurement Procedure for the Detection of Power Losses Variations in Permanent Magnet Synchronous Motor Drives. Energies 2020, 13, 5770. [Google Scholar] [CrossRef]
  47. Di Tommaso, A.O.; Miceli, R.; Nevoloso, C.; Scaglione, G.; Schettino, G.; Cecati, C.; Del Pizzo, A. Field Oriented Control of IPMSM Fed by Multilevel Cascaded H-Bridges Inverter with NI-SOM sbRIO-9651 FPGA controller. In Proceedings of the 2022 International Symposium on Power Electronics, Electrical Drives, Automation and Motion (SPEEDAM), Sorrento, Italy, 22–24 June 2022; pp. 88–93. [Google Scholar]
  48. Di Tommaso, A.O.; Miceli, R.; Nevoloso, C.; Scaglione, G.; Schettino, G.; Buccella, C.; Cecati, C. A Simple Software-based Resolver To Digital Conversion System. In Proceedings of the IECON 2022—48th Annual Conference of the IEEE Industrial Electronics Society, Brussels, Belgium, 17–20 October 2022; pp. 1–6. [Google Scholar]
  49. IEC 60034-2-3; Rotating Electrical Machines Part 2-3: Specific Test Methods for Determining the Losses and Efficiency of Converter-Fed AC Machines. IEC: Geneva, Switzerland, 2024.
  50. Gurpinar, E.; Castellazzi, A. Single-Phase T-Type Inverter Performance Benchmark Using Si IGBTs, SiC MOSFETs, and GaN HEMTs. IEEE Trans. Power Electron. 2016, 31, 7148–7160. [Google Scholar] [CrossRef]
  51. Mecke, R. Multilevel Inverter with New Wide-Bandgap SiC and GaN Power Switches. In Proceedings of the 2021 IEEE 15th International Conference on Compatibility, Power Electronics and Power Engineering (CPE-POWERENG), Florence, Italy, 14–16 July 2021; pp. 1–6. [Google Scholar]
  52. Zahwan, N.S.H.M.; Hasan, K.N.M.; Bin Zakaria, Z.A. Performance Analysis of SiC and GaN-Based Traction Inverter in Electric Vehicle Drive System. In Proceedings of the 2024 IEEE Sustainable Power and Energy Conference (iSPEC), Kuching, Sarawak, Malaysia, 24–27 November 2024; pp. 681–686. [Google Scholar]
  53. Geyer, T.; Spudic, V.; van der Merwe, W.; Guidi, E. Model Predictive Pulse Pattern Control of Medium-Voltage Neutral-Point-Clamped Inverter Drives. In Proceedings of the 2018 IEEE Energy Conversion Congress and Exposition (ECCE), Portland, OR, USA, 23–27 September 2018; pp. 5047–5054. [Google Scholar]
Figure 1. Field-Oriented Control block scheme.
Energies 18 03911 g001
Figure 2. Cascaded H-bridge multilevel inverter circuit diagram.
Energies 18 03911 g002
Figure 3. Multicarrier pulse width modulation strategies adopted: (a) Sinusoidal Phase Disposition (SPD), (b) Switching Frequency Optimal Phase Disposition (SFOPD), (c) Sinusoidal Phase Shifted (SPS), (d) Switching Frequency Optimal Phase Shifted (SFOPS), (e) Sinusoidal Suppressed Carrier Arrangement modulation (SSCAMOD), (f) Switching Frequency Optimal Suppressed Carrier Arrangement Modulation (SFOSCAMOD).
Energies 18 03911 g003
Figure 4. Commercial three-phase two-level inverter DPS 30-A.
Energies 18 03911 g004
Figure 5. Test bench.
Energies 18 03911 g005
Figure 6. Working points for the IPMSM under test.
Energies 18 03911 g006
Figure 7. Measurement process flow chart.
Energies 18 03911 g007
Figure 8. Comparison between phase voltages, phase currents, and current spectra obtained with traditional 2L-PWM (ac), SPD-PWM (df), SPS-PWM (gi), and SSCAMOD (jl) at WP2.
Energies 18 03911 g008aEnergies 18 03911 g008b
Figure 9. Comparison between IPMSM input cumulative active power obtained with traditional 2L-PWM (a), SPD-PWM (b), SPS-PWM (c), and SSCAMOD (d) at WP2.
Energies 18 03911 g009
Figure 10. IPMSM power losses detected with SPWM-driven 2L-VSI: (a) total, (b) fundamental expressed in percentage values, and (c) harmonic expressed in percentage values.
Energies 18 03911 g010
Figure 11. IPMSM power losses detected with SPD: (a) total, (b) fundamental expressed in percentage values, and (c) harmonic expressed in percentage values; IPMSM power losses detected with SFOPD: (d) total, (e) fundamental expressed in percentage values, and (f) harmonic expressed in percentage values.
Energies 18 03911 g011
Figure 12. IPMSM power losses detected with SPS: (a) total, (b) fundamental expressed in percentage values, and (c) harmonic expressed in percentage values; IPMSM power losses detected with SFOPS: (d) total, (e) fundamental expressed in percentage values, and (f) harmonic expressed in percentage values.
Energies 18 03911 g012
Figure 13. IPMSM power losses detected with SSCA: (a) total, (b) fundamental expressed in percentage values, and (c) harmonic expressed in percentage values; IPMSM power losses detected with SFOSCA: (d) total, (e) fundamental expressed in percentage value, and (f) harmonic expressed in percentage value.
Energies 18 03911 g013
Figure 14. IPMSM total power losses detected for each working point and switching frequency: (a) SPD, (b) SPS, (c) SSCA, (d) SFOPD, (e) SFOPS, (f) SFOSCA.
Energies 18 03911 g014
Figure 15. IPMSM percentage fundamental power losses detected for each working point and each switching frequency: (a) SPD, (b) SPS, (c )SSCA, (d) SFOPD, (e) SFOPS, (f) SFOSCA.
Energies 18 03911 g015
Figure 16. IPMSM percentage harmonic power losses detected for each working point and each switching frequency: (a) SPD, (b) SPS, (c) SSCA, (d) SFOPD, (e) SFOPS, (f) SFOSCA.
Energies 18 03911 g016
Table 1. Main phase voltage, line–line voltage, and load voltage waveforms features for every considered MC-PWM strategy.
Typef with Maximum Harmonic AmplitudeNumber of Voltage LevelsInstantaneous Maximum Value of VnPower-Balancing Capability
VNVLLS Modulating SignalsSFO Modulating Signals
PDfsw597/3 Vdc7/3 VdcNo
PS4 fsw592 Vdc8/3 VdcYes
SCAMOD2 fsw592 Vdc8/3 VdcYes
Table 2. CHBMI MOSFET-based-IRFB4115PBF data.
QuantitySymbolValue
VoltageVdss150 V
ResistanceRdSon9.3 mΩ
CurrentID104 A
Turn on delayTDon18 ns
Rise timeTR73ns
Turn off delayTDoff41 ns
Fall timeTF39ns
Reverse recoveryTRR86 ns
H-bridge DC-link voltageVDC55 V
Switching frequencyfsw2–100 kHz
Table 3. DPS 30-A inverter data.
QuantitySymbolValue
Input voltageVin240 V
DC-link voltageVDC320 V
Minimum input voltageVinmin70 V
Phase current peakIpeak30 A
Switching frequencyfsw2–20 kHz
Table 4. IPMSM rated data.
QuantitySymbolValue
Nominal voltageVn132 V
Nominal currentIn3.6 A
Nominal speedn4000 rpm
Maximum speednmax6000 rpm
Pole pairsP3
Nr. of phasesM3
Rated torqueTemn1.8 Nm
Peak torqueTemmax7.2 Nm
Table 5. IPMSM efficiency at fsw = 4 kHz.
η[%]
2L-VSO3P-5LCHBMI
WPPWMSPDSFOPDSPSSFOPSSSCASFOSCA
176.879.179.679.479.278.979.2
271.173.774.174.173.973.773.8
358.761.161.461.361.160.960.9
424.625.625.725.725.625.425.4
579.181.882.181.981.681.781.6
674.577.978.178.177.678.177.6
764.167.86867.967.467.667.3
830.132.933.233.232.732.932.9
979.182.783.283.183.183.382.3
1075.880.380.880.780.880.980.1
1168.473.473.873.473.272.871.9
1239.342.442.642.842.642.341.7
1373.678.879.178.97979.478.7
1471.878.278.578.478.47978.3
15687575.174.274.273.872.9
164953.653.9545453.453
Table 6. Maximum IPMSM percentage harmonic power losses values detected.
ΔPh [%]4 kHz8 kHz12 kHz16 kHz
SPD<8%<7%<3%<2%
SFOPD<7%<6%<3%<2%
SPS<6%<6%<4%<3%
SFOPS<7%<6%<4%<3%
SSCA<10%<7%<4%<3%
SFOSCA<10%<8%<4%<3%
Disclaimer/Publisher’s Note: The statements, opinions and data contained in all publications are solely those of the individual author(s) and contributor(s) and not of MDPI and/or the editor(s). MDPI and/or the editor(s) disclaim responsibility for any injury to people or property resulting from any ideas, methods, instructions or products referred to in the content.

