Article

Assessment of Grid-Tied Renewable Energy Systems’ Voltage Support Capability Under Various Reactive Power Compensation Devices

1
Guizhou Power Grid Co., Ltd., Guiyang 550002, China
2
Guodian Nari Nanjing Control System Co., Ltd., Nanjing 210008, China
3
School of Automation, Nanjing University of Posts and Telecommunications, Nanjing 210023, China
*
Author to whom correspondence should be addressed.
Energies 2025, 18(14), 3880; https://doi.org/10.3390/en18143880
Submission received: 20 June 2025 / Revised: 12 July 2025 / Accepted: 16 July 2025 / Published: 21 July 2025

Abstract

The weak grid strength in regions with large-scale renewable energy integration has emerged as a universal challenge, limiting the further expansion of renewable energy development. Currently, the short-circuit ratio (SCR) is widely used to quantify the relative strength between AC systems and renewable energy. To address this issue, this study first analyzes and compares how different reactive power compensation methods enhance the SCR. It then proposes calculation frameworks for both the SCR and critical short-circuit ratio (CSCR) in renewable energy grid-connected systems integrated with reactive power compensation. Furthermore, based on these formulations, a quantitative evaluation methodology for voltage support strength is developed to systematically assess the improvement effects of various compensation approaches on grid strength. Finally, case studies verify that reactive power compensation provided by synchronous condensers effectively strengthens grid strength and facilitates the safe expansion of the renewable energy integration scale.

1. Introduction

The power system is progressively evolving into a “double high” system, characterized by a significant increase in renewable energy sources and a high percentage of electrically powered devices, as China’s energy consumption shifts toward greener and low-carbon alternatives [1]. As the installed capacity of renewable energy continues to expand and the share of traditional thermal power decreases, the composition and operational modes of the power system have undergone substantial changes [2]. This transformation has resulted in a narrowing of the short-circuit current control margin for equipment operating at various voltage levels [3].
Only a few sizable power plants comprise the transmission end, while the majority of emerging energy sources, such as solar and wind, are located in remote areas [4]. These are AC systems at the transmission end with relatively weak strength due to their limited network structure, insufficient AC–DC support, and inadequate short-circuit capacity [5]. When the receiving system experiences a failure, it can lead to power surges, temporary overvoltages, and commutation errors in the DC network at the sending end [6]. Voltage instability, which has an immediate impact on both active and reactive power, along with other issues, may arise if a short-circuit fault occurs at the transmitting end of the network [7]. The strength of the network can be enhanced, and electrical stability ensured, by installing appropriate reactive power compensation devices at the converter station [8]. In the centralized grid connection generated by renewable energy, the SCR values fluctuate under different operating conditions of the system. The CSCR is the SCR at the critical stability of the system, indicating the lower limit value of the SCR during stable operation. In other words, the SCR value at the critical stability state is equivalent to the CSCR value. The greater the difference between the SCR and CSCR, the more stable the system becomes. By comparing these values, it is possible to assess the stability and safety of the developed renewable energy input system under the rated operating conditions [9]. This evaluation facilitates the optimization of the capacity of reactive power compensation devices [10].
Reference [11] evaluated the strength of power grids with high levels of inverter resource penetration by analyzing the short-circuit ratio (SCR). Reference [12] developed a small-signal model for grid-connected inverters, configuring them to operate at a leading power factor and assessing the system’s operational status through variations in the short-circuit ratio. Reference [13] examined the stability of virtual synchronous machine grid-connected converters by characterizing the strength of AC systems based on the short-circuit ratio. Reference [14] utilized power-voltage curves to assess the constraints of single inverter terminal voltage while determining the minimum short-circuit ratio for an infinite bus system. Most current research tends to overlook the impact of reactive power-compensating devices, focusing instead on the evaluation of the SCR ratio in multi-infeed transmission networks.
Given the aforementioned issues, this study proposes a quantitative assessment method to calculate the short-circuit ratio (SCR) control margin of renewable energy power plants based on the computation of the SCR and CSCR of multiple renewable energy stations. This method, grounded in the direct current (DC) SCR, serves as the baseline for the constant capacity index. It selects the configuration with the lowest cost that meets the voltage strength requirements of the grid as the optimal setup for reactive power compensation devices [15], thereby guiding the operational management and planning of the renewable energy grids. First, the specific contributions of three reactive power compensation devices—the synchronous condenser, static var generator (SVG), and static var compensator (SVC)—to the system’s voltage strength are thoroughly investigated. Using the SCR calculation model, the distinct methods by which each device enhances voltage support capacity under the same node configuration are compared in detail. Next, the short-circuit capacity of renewable energy grid-connected buses, the maximum reactive power compensation capacity, and the SCR of multiple stations with reactive power compensation are accurately calculated step by step. Subsequently, the underlying mechanisms by which these devices influence the SCR are analyzed in depth. The network’s maximum transmission power is used to concurrently calculate the station’s CSCR with precise reactive power adjustments. Then, the SCR control margin, derived from the difference between the SCR and CSCR, is computed to objectively evaluate the voltage stability of the new energy feed-in system. Finally, the enhanced contributions of the three devices to voltage stability are examined by quantifying the SCR control margin, and case studies are employed to comprehensively assess the actual performance of different devices. The results indicate that incorporating a synchronous condenser significantly improves the system’s overall voltage support capability in practical scenarios.

2. Voltage Support Strength Enhancement Mechanisms in Renewable Grid-Connected Systems Under Diverse Compensation Devices

Currently, a popular method for reactive power compensation aimed at enhancing the weak grid system of energy clusters and improving the voltage support capability of newly developed energy network-connected systems involves the installation of static var compensators (SVCs), static synchronous generators (SVGs), and synchronous condensers [16]. Each reactive power adjustment strategy operates through a distinct mechanism, thereby strengthening the system’s voltage support capability [17]. The next section will examine the impact of these three devices on the voltage stability of the network [18]. The short-circuit ratio (SCR) calculation model will be employed to compare the methods for enhancing the voltage support strength of each device within the same node configuration [19].

2.1. Static Var Compensator Enhancement Mechanism

Static var compensators (SVCs) are widely used compensation devices, and large-capacity power electronic devices have been extensively employed for reactive power compensation in power systems in recent years [20]. An SVC thyristor-controlled reactor (TCR) and a thyristor-controlled switching capacitor (TSC) often make up an SVC. The thyristor’s conduction angle α can be adjusted to modify the equivalent impedance of a TCR and TSC. By injecting or absorbing reactive current into or out of the system, the SVC helps maintain system voltage and suppress oscillations, allowing it to quickly adapt to changes in the system during failures [21].
The reactive power output will adjust under variations in the bus voltage at the installation location, according to the SVC’s operating principle. The equivalent impedance of TCR can be smoothly regulated by varying the thyristor’s conduction angle α . The conduction angle and the equivalent susceptance value of TCR are related in the following way:
B e q = α sin α π X L
In the formula, B e q is the equivalent electronegativity, α is the conduction angle, and  X L is the sensor reactance. The inductive reactive power value injected into the grid by TCR is
Q T C R = B e q U 2
In the formula, U is the bus voltage at the SVC installation location.
TSCs are equivalent to capacitors that can be quickly switched, and the inductive reactive power injected into the system by each set of capacitors is
Q T S C = ω C U 2
In the formula, ω C is the impedance value of the capacitor.
The inductive reactive power injected into the system by the SVC is
Q SVC = U 2 ( ω C α sin α π X L )
In the formula, C is the filter capacitor, X L is the reactance of the filter, ω is the voltage angular frequency, and  α is the conduction angle of the thyristor.
Analyzing the impact of SVC input on system voltage intensity from the perspective of the short-circuit ratio index, after configuring the SVC at node x of the new energy field station, it is considered a shunt-connected capacitor and included in the admittance matrix. When the SVC is connected to node x, it is equivalent to a parallel variable capacitor BSVC. Therefore, the short-circuit capacity of node x is
S ac , x = U N E e q , x Y x x
In the formula, U N is the nominal voltage at the grid connection point; E eq , x is the equivalent potential of the grid point x; Z i i is the self-impedance of the grid-connected busbar of the new energy station x; and Y x x is the self-admittance of the grid-connected busbar of the new energy station x.
Among them, the self-admittance Y x x of node x after connecting the SVC is the following:
Y x x = G x x + j ( B x x + B SVC )
In the formula, B SVC is the SVC susceptance; G x x is the self-conductance of the grid-connected bus of the new energy station x; and B x x is the self-susceptance of the grid-connected bus of the new energy station x.
The above formula can be converted into
S a c , x = U N E e q , x G x x 2 + ( B x x + B S V C ) 2
M R S C R x = S a c , x P N , x
In the formula, P N , x is the rated capacity of the new energy grid connection point x.
Following the calculation of the short-circuit ratio, it can be inferred that the value MRSCR will increase in conjunction with the rise in the Y x x modulus once node x is configured with the SVC. This adjustment elevates the system’s SCR value, thereby enhancing the voltage support level and strengthening the system’s resilience to voltage fluctuations. The short-circuit ratio (SCR) characterizes the voltage support strength of the renewable power grid. A high SCR indicates both the robustness of the network and the system’s ability to maintain voltage stability. By activating the capacitor bank, the system’s SCR can be increased, thus improving the overall voltage stability of the system.

2.2. Static Var Generator Enhancement Mechanism

One of the key components of Flexible AC Transmission Systems (FACTS) is the static var generator (SVG). The SVG offers several advantages, including its compact size, rapid response time, and wide operating range [22]. It can detect fluctuations in the reactive power of renewable energy systems with high sensitivity and promptly compensate for these changes [23]. In addition to reactive power compensation, the SVG effectively suppresses harmonic currents, reduces network losses, and enhances power quality. It also plays a crucial role in controlling system voltage fluctuations and improving overall system robustness [24]. Due to these benefits, SVGs have been extensively studied and widely implemented [25].
The power demand of the load and the system’s capacity to supply power to that load define the transient voltage stability of the developed renewable power system. The Thévenin equivalent system, as illustrated in Figure 1, offers a straightforward way to understand this concept.
In Figure 1, E and Z e represent the equivalent potential and impedance on the system side, respectively; U l is the voltage of the load node; Z l and I l represent load impedance and load current, respectively; I SVG is the compensating current for the SVG; and I eq is the equivalent load current after SVG connection.
Based on the derivation of the Thévenin equivalent circuit shown in the figure above, when the SVG is not connected to the system, the expressions for active and reactive power in the parallel line can be calculated, and the voltage at the load node can be determined as follows:
U l = E 2 2 P l R e Q l X e ± ( P l R e + Q l X e E 2 2 ) 2 Z e 2 ( P l 2 + Q l 2 ) 1 2
In a steady state, the modulus of the load impedance, | Z l | , is greater than the modulus of the system’s equivalent impedance, | Z e | . Assuming that the load’s power factor remains constant throughout the transient process, the load increases its power by reducing its equivalent impedance, causing its impedance modulus to decrease from a larger value to a smaller one. The system ultimately operates at the intersection of the upper and lower halves of the PV curve, resulting in a unique voltage solution when | Z l | = | Z e | . At this load node, the voltage is in a critically stable state. However, at this point, the voltage becomes unstable if | Z l | continues to decrease.
After the system is integrated into the static var generator (SVG), based on the principle of circuit equivalence, the SVG, supported by capacitors on the DC side, can be considered an adjustable capacitor C SVG . When observing from the load node, the SVG and load impedance can be represented as an equivalent impedance Z eq . The relationship between the current I eq flowing through Z eq , the SVG compensation current I SVG , and the load current I l is as follows:
I ˙ eq = I ˙ l I ˙ SVG
The equivalent impedance Z eq of the load node after incorporating the SVG can be obtained from the current relationship, and the expression is
Z eq = X l X SVG j R l X SVG R l + j ( X l X SVG )
In the equation, X SVG is the equivalent reactance of the SVG.
The partial derivative of X SVG for | Z eq | 2 is obtained as follows:
Z eq 2 X SVG = 2 X SVG ( R l 2 + X l 2 ) [ R l 2 + X l 2 X l X SVG ] [ R l 2 + ( X l X SVG ) 2 ] 2
Because there is R l X l in the high-voltage transmission system, it can be assumed that R l 0 , and the above formula can be simplified as
Z eq 2 X SVG = 2 X SVG ( X l 2 ) [ X l 2 X l X SVG ] ( X l X SVG ) 4
During the system’s temporary operation, as the equivalent capacitance C SVG of the static var generator (SVG) increases, the corresponding reactance X SVG decreases. Furthermore, since I l > I SVG , it can be inferred from the monotonicity of the function that the magnitude | Z eq | of the compensated equivalent load impedance increases as X SVG decreases, thereby enhancing the system’s dynamic voltage stability.
After the SVG is configured at the node x of the renewable energy station, it is treated as a separate current source and included in the short-circuit ratio calculation. This analysis evaluates the impact of the SVG input on system voltage levels from the perspective of short-circuit ratio indicators. The short-circuit capability at the node x is
S ac , x = U N E e q , x Y x x
In the formula, U N represents the nominal voltage at the grid connection point; E eq , x denotes the equivalent potential of grid point x; Z i i indicates the self-impedance of the grid-connected busbar at the new energy station x; and Y x x signifies the self-admittance of the grid-connected busbar at the new energy station x.
Among them, the node x is connected to the SVG, and the equivalent admittance Y x x is
Y x x = G x x + j ( B x x + Q SVG U N E e q , x )
In the formula, G x x represents the self-conductivity of the grid-connected busbar of the new energy station x, B x x denotes the self-electrification of the grid-connected busbar of the new energy station x, and Q SVG indicates the injected reactive power.
The above formula can be changed into the following by replacing it in the short-circuit capacity calculation formula:
S ac , x = U N E e q , x G x x 2 + B x x + Q SVG U N E e q , x 2
For the sake of convenience in calculations, and assuming that different DC systems do not interfere with one another, the formula for calculating the SCR ratio of the x-th node in the new energy system after the SVG layout can be derived as follows:
M R S C R x = S a c , x P N , x
The rated capacity of the grid connection point x for new energy is denoted by P N , x in the formula.
After analyzing the calculation of the SCR, it can be concluded that after configuring the SVG at the node x, the value of the MRSCR increases as the modulus | Y x x | increases. This change results in a higher SCR ratio, thereby enhancing the system’s resistance to voltage fluctuations and improving the voltage support level. The SCR ratio is a key indicator of voltage support strength; a higher SCR ratio signifies a stronger network and greater capacity for maintaining voltage stability. By implementing the SVG, the system’s SCR ratio can be elevated, which contributes to improved voltage stability.

2.3. Synchronous Condenser Enhancement Mechanism

Synchronous condensers were first utilized as reactive power compensation devices for the electrical grid around the turn of the 20th century. However, more advanced reactive power compensation technologies have progressively replaced them. Many countries and regions have reintroduced condensers due to their unique advantages in enhancing frequency and inertia support [26]. The conversion of decommissioned thermal power units into condensers has also gained significance as a means to ensure grid stability [27]. Synchronous condensers are rotating devices capable of compensating for dynamic reactive power [28]. Their effective reactive power output characteristics can bolster the system’s inertia and short-circuit capacity as well as maintain the system voltage and improve the overall system stability [29]. Consequently, synchronous condensers with specific capacities are often installed near renewable energy sources in engineering applications [30].
As shown in Figure 2, after the development of the renewable energy station, node x configured with a condenser can be considered to have a grounding branch with impedance Z x S C added to it.
According to the principle of the additional branch method, it can be deduced that the impedance value between node i and node j will change accordingly:
Z i j = Z i j Z x i Z x j Z x x + Z x S C
The AC and DC axis voltages are represented by u q and u d , respectively, while the currents are denoted by I q and I d . Z x i refers to the element in the x-th row and i-th column of the equivalent impedance matrix of the AC power grid at the energy grid-connected busbar. Similarly, Z x j represents the element in the x-th row and j-th column of the same impedance matrix. Z x x indicates the self-impedance of the grid-connected busbar at energy station x. Lastly, Z i j denotes the element in the i-th row and j-th column of the equivalent impedance matrix of the AC power grid at the grid-connected busbar.
After node x is configured with the synchronous condenser, the equivalent impedance matrix of the system will show a decrease in all its elements. The node most affected is node x, which is integrated with the synchronous condenser; specifically, Z x x experiences the most significant reduction.
By thoroughly integrating the short circuit ratio calculation method and assuming that the voltage phase angle between each station is similar, as well as that the voltage at each node is close to the rated value, the SCR calculation formula for the i-th branch after the capacitor arrangement can be derived as follows:
M R S C R = U N , i 2 j = 1 n Z i j P j
The rated voltage of energy station i’s grid-connected busbar is denoted as U N , i , and the active power produced by the station is represented by P i . The term Z i j refers to the i-th row and j-th column element of the equivalent impedance matrix of the AC power grid at the energy grid-linked busbar, while P j denotes the active power produced by energy station j.
After node x is integrated into the synchronous condenser, it can be determined through the SCR ratio calculation that the MRSCR incorporated into the condenser node is significantly influenced by the modulus value | Z i j | . Specifically, the value of MRSCR increases as the | Z i j | modulus decreases. This enhancement improves the SCR ratio of the network, thereby bolstering its resistance to voltage fluctuations and elevating the voltage support level. A high SCR ratio indicates the network’s strength and its capacity to maintain voltage stability. Conversely, a low SCR ratio suggests instability within the system and indicates a weak network. Consequently, the condenser is activated in the event of a system failure, which can raise the system’s SCR ratio and improve overall stability.
It is evident from the SCR ratio calculation process outlined above that the availability of various reactive power compensation techniques will influence the SCR ratio calculation at each grid-connected point. This, in turn, will affect the voltage-sustaining capacity of each grid-dependent point. The SVC is considered to be the admittance matrix of the bus in parallel with the bus, which explains why the compensation effect of the synchronous condenser is superior to that of the SVC. Among these, the inputs from the SVC and synchronous condenser primarily impact the short-circuit capacity at every point in the system by modifying the network’s admittance matrix. However, the integration of the synchronous condenser directly affects the self-admittance at the access node’s location. The input from the SVG is primarily utilized as a separate power source to contribute to the calculation of the short-circuit ratio, thereby enhancing the reactive power at the system nodes.
This section establishes the computational and physical models of various reactive power adjustment devices connected to the developed renewable energy station. It also compares the effects of reactive power compensation and the support capacity of different types of reactive power compensation devices on network voltage. Theoretically, the condenser is shown to be the most effective option for adaptive power compensation. To enhance the SCR index and improve transmission efficiency, the new energy station is equipped with a distributed condenser.

3. Quantitative Assessment of Voltage Support Strength in Grid-Connected Renewable Energy Stations

Conventional power supply systems lack damping support and inertia, connecting to the network as grid-following current sources. Consequently, they are unable to actively respond to variations in grid voltage and frequency [31]. As a result, conventional AC systems must maintain their connections through voltage and frequency regulation with the strength of the AC system—relative to its electrical equipment—primarily determining the overall system’s stability [32]. Currently, significant amounts of developed renewable energy are integrated into the network via power electronic inverters [33]. Numerous researchers have examined the capacity of energy grid-dependent systems and proposed the concepts of voltage support strength and frequency support strength to characterize these systems’ robustness [34]. Among these, frequency support strength, typically assessed using indicators such as the frequency change rate and the inertia constant, reflects the dampening effect of frequency fluctuations caused by system disturbances [35]. Voltage support strength, on the other hand, is generally evaluated through indicators like the SCR and the impedance ratio, illustrating the system’s ability to maintain stable voltages following disruptions under specific initial operational conditions.
The CSCR ratio algorithm ensures a consistent integration of calculation methods and criteria for determining system strength, serving as a crucial reference for evaluating developed renewable energy input systems. The concept of system voltage support strength, while abstract, is grounded in the classification of system strengths and weaknesses [36]. By utilizing the critical short-circuit ratio as a reference point and establishing a coordinate system based on the short-circuit ratio index, this approach effectively assesses the stability of the developed renewable energy input system [37].

3.1. Short-Circuit Ratio Index for Voltage Support Strength of Renewable Energy Power Stations Under Reactive Power Compensation

Increasing the amount of reactive power support at the receiving end is a standard method for enhancing the receiving system’s ability to maintain voltage stability [38]. Parallel static capacitors are commonly employed as reactive power sources due to their capacity to optimize the network’s energy distribution [39]. When the system operates steadily, the internal reactive power consumption is balanced with the reactive power supplied by the reactive power source [40]. However, the reactive electrical energy produced by parallel capacitors diminishes in conjunction with the voltage drop caused by a fault in the receiving electrical network [41]. In certain emergency scenarios, parallel capacitors can adversely affect system voltage stability. In these instances, dynamic power compensation mechanisms are necessary to enhance voltage stability, as parallel capacitors are not suitable for the network’s transient operating conditions.
The equivalent model of the renewable energy grid connection system, considering reactive power compensation devices, is shown in Figure 3.
The short-circuit capacity of the grid-connected bus in the power station with a reactive power capacity, taking into account the effect of the paralleled reactive power adjustment capacity Q s , i on the DC converter bus, is
S v c , i = U N E e q , i Z i i Q s , i
where E eq , i is the equivalent potential of node i, and  U N is the nominal voltage at the junction point. The developed renewable energy station i’s networked bus has a reactive power capacity of Q s , i and a self-impedance of Z i i .
The reactive electricity compensation device SCR ratio for developed renewable energy single stations is
S C R i = S v c , i P N , i
where P N , i is the rated capacity of the developed renewable energy station in network i; and S vc , i is the short-circuited capacity of the grid-connected connector bar of the renewably constructed power plant with the SVC reactive power compensation device.
The DC landing locations in a multi-infeed DC system are comparable, and interference between multiple DC systems is possible. When evaluating the planning scheme of a multi-infeed DC system using only the SCR, the findings are often biased toward more ideal conditions. This paper utilizes the short-circuit capacity and reactive power compensation capacity of renewable energy grid-connected busbars to calculate the short-circuit ratio of various developed renewable energy systems in which the generators are equipped with reactive power compensation devices.
Based on the Thévenin equivalent impedance, the node voltage is
U ˙ S , 1 U ˙ S , 2 U ˙ S , i U ˙ S , n = Z 11 Z 12 Z 1 i Z 1 n Z 21 Z 22 Z 2 i Z 2 n Z i 1 Z i 2 Z i i Z i n Z n 1 Z n 2 Z n i Z n n I ˙ S , 1 I ˙ S , 2 I ˙ S , i I ˙ S , n
U S , i in the formula represents the station’s grid-tied transit voltage; at the renewably installed power grid-connected busbar, Z i j is the i-th row and j-th column member of the AC power grid’s equivalent impedance matrix; I S , i injects current into the renewably constructed power AC network; and Z i i is the self-impedance of the electrically linked busbar.
The short-circuiting potential of the electrically linked bus in renewably constructed energy plants with reactive power adjustment equipment is evaluated in light of the effect of parallel dynamic power adjustment capabilities Q s , i on the DC converter bus:
S v c , i = U ˙ N , i I ˙ s , i * Q s , i = U ˙ N , i U ˙ S , i * Z i i Q s , i
* represents the conjugate operation in the formula. I S , i is the short-circuiting current at the grid-connected bus bar of the renewably constructed energy station; U N , i is the rated voltage of the renewably constructed power station’s networked bus; Q s , i is the reactive power adjustment capability;  U S , i is the grid bus voltage connected to the renewably constructed power plant; and Z i i is a representation of the self-impedance of the electrically connected bus of the station i.
Reactive power offset for the device short-circuiting ratio of a renewably constructed energy multi-station:
M R S C R i = S v c , i S S , i + j = 1 , j i n ε i j S S , j
S S , i and S S , j are the real seeming strength of the renewably generated energy injected into the i and j grid-tied bus terminals of renewably constructed energy; and S vc , i is the short-circuiting capacity of the electrically linked bus bar of the renewably constructed energy station with reactive power compensation devices.
In the above formula, ε i j is an indicator for measuring the voltage coupling relationship at the receiving end between multi-feed systems, which is used to characterize the interaction intensity between converter stations in multi-feed transmission systems:
ε i j = Z i j U i * Z i i U j *
The following formula can be derived from the renewably constructed power production station’s electrically linked bus’s short-circuiting capacity:
M R S C R i = U ˙ N , i U ˙ S , i * / Z i i Q s , i U ˙ S , i * I ˙ S , i + j = 1 , j i n Z i j Z i i U ˙ S , i * I ˙ S , j
U N , i is the rated voltage of the renewably constructed energy station i’s electrically linked bus bar; U S , i is the electricity station i’s grid-connected bus voltage; Z i i is the electricity station i’s grid-connected bus’s self-impedance; I S , i and I S , j inject current into the AC system for units i and j; Q s , i is the reactive electricity adjustment capability; and Z i j is the equivalent impedance between the grid-connected bus lines of stations i and j.

3.2. Calculation Method of CSCR for Renewable Power Stations with Reactive Compensators

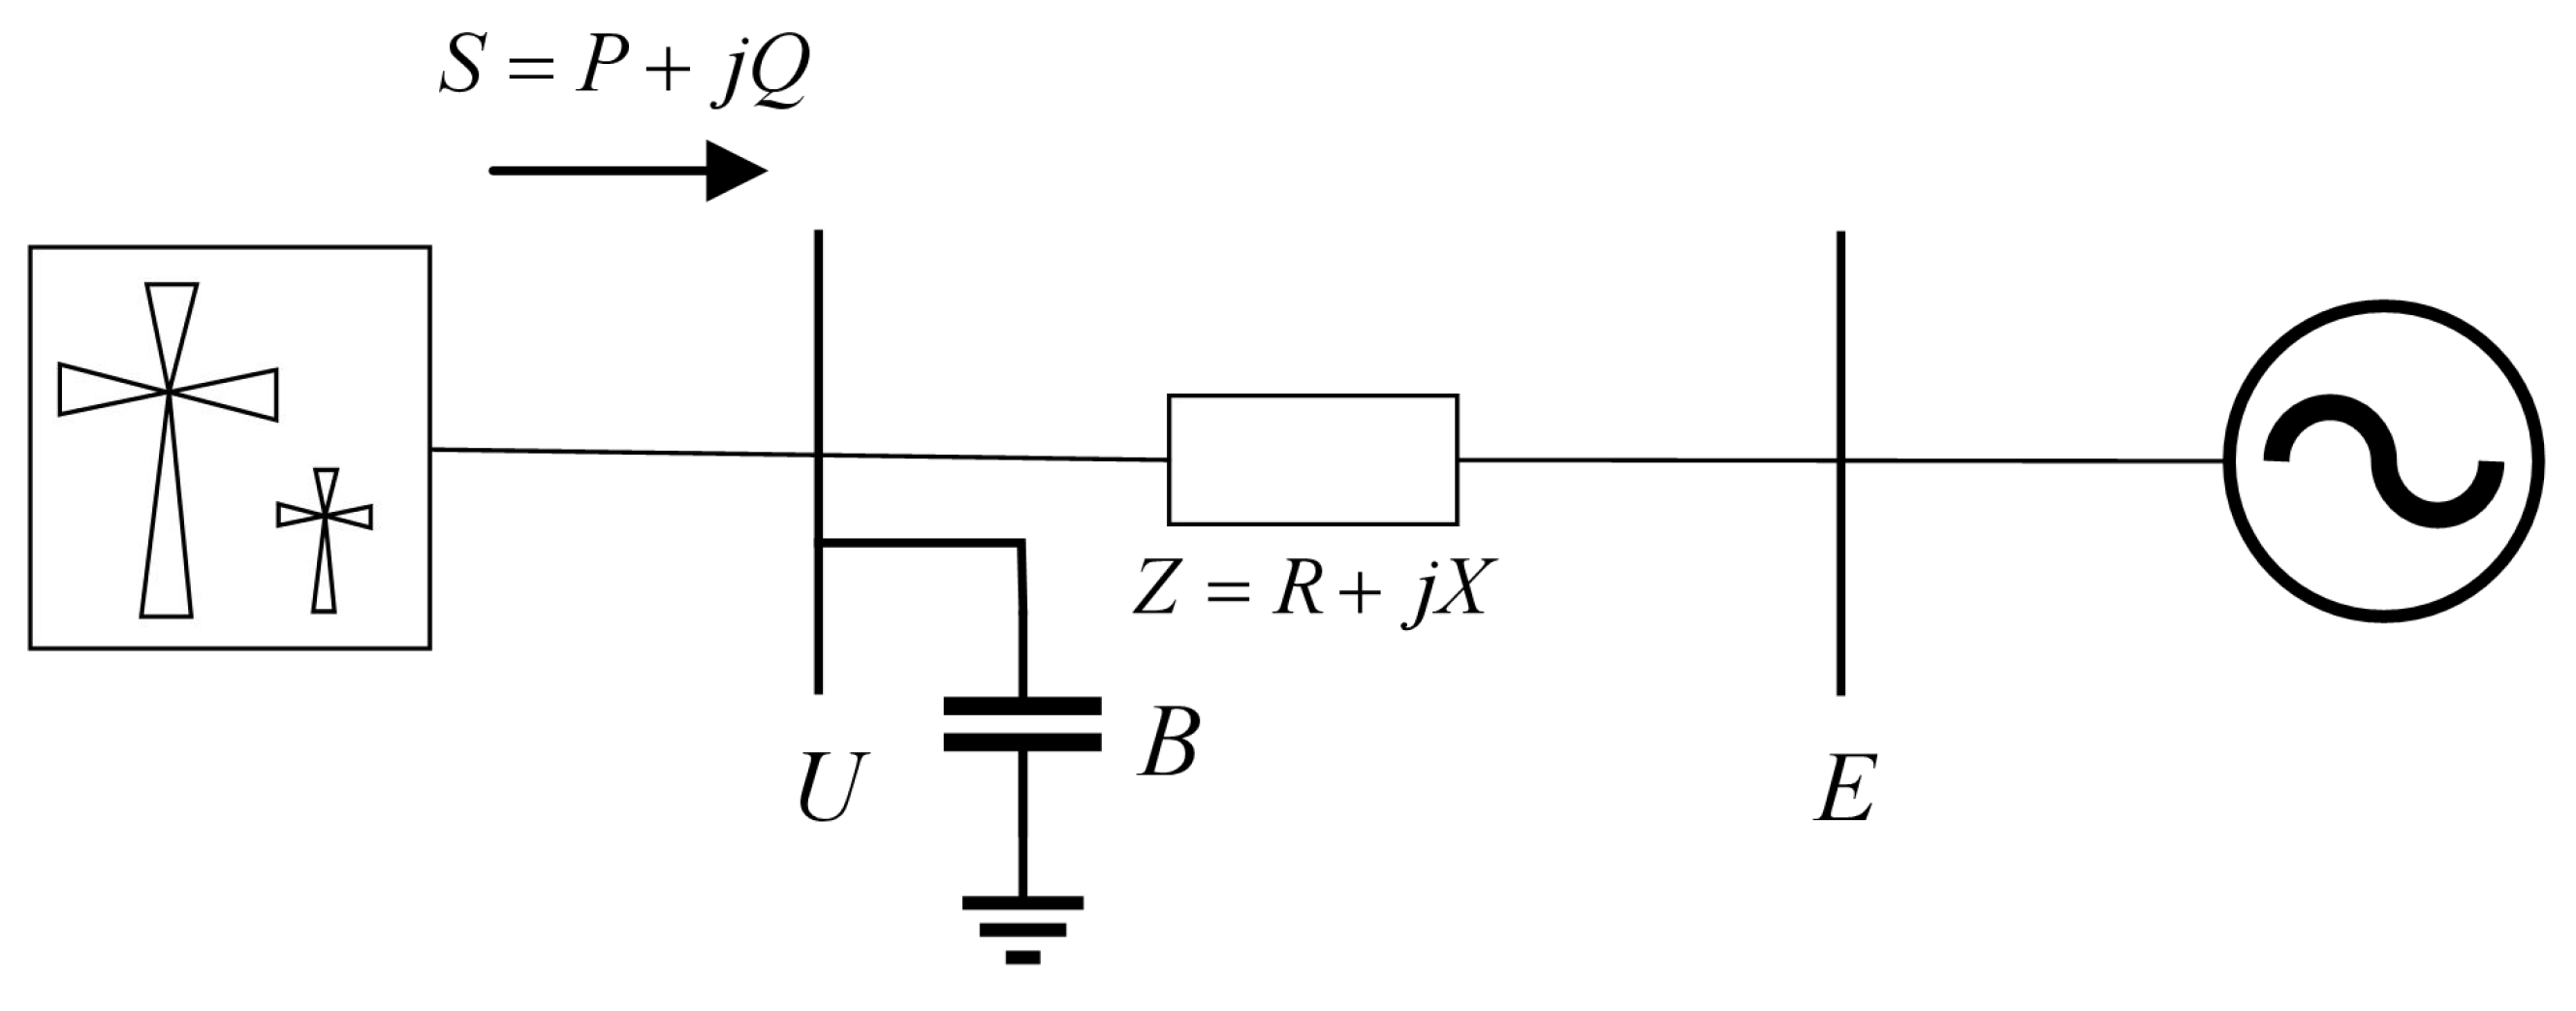
Static steady voltage and the SCR ratio are interconnected through the CSCR ratio. The criterion for evaluating the stability of static voltage is the maximum transmission power. As the transmission power increases, the operating point shifts from the upper half of the P-V curve to the lower half, reaching the highest possible transmission energy at the curve’s inflection point [42]. At this moment, the system is in a critically stable condition, and the CSCR ratio corresponds to the SCR ratio. Figure 4 illustrates a comparable circuit for the reactive electrical compensating device, which is designed to enhance the voltage performance of the developed renewable energy grid-connected network [43].
This section focuses on the ultimate reactive power output capability of various reactive power compensation devices, rather than their dynamic adjustment characteristics during real-time operation, such as response speed, adjustment accuracy, and output strategies under different operating conditions. The primary reason for this approach is that when evaluating the robustness of the system—specifically, its voltage support capability in response to extreme faults or significant disturbances—the maximum reactive power that a compensation device can provide directly reflects its potential to support the system when the voltage is on the verge of instability. At the same time, to achieve a unified analysis and comparison of different types of reactive power compensation devices, it is essential to consider the following: whether a static var compensator (SVC) relies on the phase control of thyristors, a static var generator (SVG) utilizes fully controlled power electronic devices for commutation and reactive power regulation, or a synchronous condenser depends on the electromagnetic characteristics of rotating motors to provide reactive power. The model must eliminate the differences arising from specific technical details and establish a standardized quantitative benchmark. Consequently, the limiting effect of all devices is characterized by their maximum reactive power capacity, denoted as Q s , i , which is further transformed into equivalent susceptance B and integrated into the system model.
Q s , i = U 2 B
The reactive electricity compensating point voltage is denoted by U, the reactive electricity compensating capacities by Q s , i , and the capacitance to ground by B.
A quadratic equation of the connecting point’s voltage can be derived from the system’s highest transfer capacity:
U 4 β U 2 [ E 2 + 2 ( P R + Q X γ ) ] + S 2 Z 2 = 0
U = E 1 + 2 λ s ± Δ s 2 [ 1 B X 2 + B 2 R 2 ]
Δ s = 1 + 4 λ s 4 μ s 2
Among them, λ s = P R + Q X Q B Z 2 E 2 , μ s = P X Q R P B Z 2 E 2 , γ = Q B Z 2 , and β = 1 2 B X + B 2 Z 2 . Reactive power compensated calculation factors are represented by γ and β in the formula, while λ s and μ s are calculation factors.
When equation Δ s = 0 is satisfied, the network’s maximal capacity for transmission is
P S max = R ( E 2 + 2 Q X 2 γ ) + E Z E 2 + 4 Q X 4 γ β 2 X B Z 2 2
U Bcri = E 2 + 2 ( P R + Q X γ ) 2 β
R is the resistance of the grid-connected bus of the renewably constructed energy plant station, and E is its potential. Q represents the reactive power of the energy grid-tied nodes, X represents the reactance at the energy plant station’s grid-connected bus, γ and β represent the reactive power adjustment calculation factors, and B represents the ground capacitance.
Consequently, the following is the derivation of the renewable energy station’s CSCR ratio with reactive power compensation equipment.
C S C R i = S a c P S max + j Q
The formula defines P S max as the maximum transmission power of the developed renewable electrically linked system and S ac as the grid-tied short-circuiting capacity of the renewably constructed energy plant.

3.3. Quantitative Analysis of Voltage Support Strength in Grid-Tied Renewable Energy Stations

The stability of renewable energy feeding systems can be quantitatively assessed by calculating the SCR margin for renewable energy stations equipped with reactive power adjustment devices. This assessment is based on the difference between the SCR ratio and the CSCR ratio. The stability margin of the SCR is evaluated by the relative magnitude of the difference between the SCR and the CSCR. The stability margin for a single-station system is denoted as η SCR , while the stability margin for a multi-station system is represented by η MRSCR .
Taking into account a reactive voltage adjustment device, the renewably constructed power individual station’s short-circuiting margin is
η S C R = S C R i C S C R i C S C R i × 100 % = S v c , i S a c , i | P S m a x + j Q i | P N , i P N , i × 100 %
Q i is the equivalent of reactivity that the additional energy transmits to the AC system, and j is an imaginary number in the formula. The nominal capacity of the renewably generated electricity at the connecting point i is denoted by P N , i .
At the reactive voltage compensation device’s grid connection point, take into account the SCR ratio margin of several renewable electricity stations:
η MRSCR = MRSCR i CSC R i CSC R i × 100 % = S vc , i S ac , i | P Smax + j Q i | S S , i + j = 1 j i n ε i j S S , j S S , i + j = 1 j i n ε i j S S , j × 100 %
Q i is the equivalent reactive power that the renewably constructed energy sends to the AC framework; S vc , i is the short-circuiting capacity of the electrically linked bus of the installed energy station with a reactive power mitigation device; j is an imaginary number; and S ac , i is the short-circuiting capacity of the electrically linked bus line of the installed power station i. The symbols S S , i and S S , j , respectively, represent the actual apparent power of new energy injected into the electrically linked bus nodes i and j.
The stability of the system is determined by comparing the SCR and CSCR ratios. The network’s safety margin before reaching critical stability is indicated by the difference between the SCR and CSCR ratios.
  • When SCR i < CSC R i , or  η SCR < 0 , the developed renewable power grid-connected system for the single-feed system is unstable. The stability margin η SCR increases with system instability; a system is in a stable condition when SCR i > CSCR i , which means η SCR > 0 . The stability margin increases with system security.
  • In the case of the new energy multi-feed system, when MRSCR i < CSC R i , meaning that η MRSCR < 0 , the system is unstable; the more unstable the system, the larger the stability margin η MRSCR ; when MRSCR i > CSC R i , meaning that η MRSCR > 0 , the system is stable; the more stable the system, the larger the stability margin η MRSCR .

4. Example Analysis

4.1. Stability Assessment of the System After Reactive Power Compensation

Construct a PSD-BPA-based model, determine a system’s maximal power generation using the continuous power flow method, and create simulation examples of the system operating at various reactive power adjustment capacities. To quantitatively assess the viability and efficacy of the voltage support strength of the developed renewable energy feeding system, confirm the SCR ratio margin of renewably constructed energy stations with reactive voltage compensation devices, which is determined by the difference between the SCR ratio index and the CSCR ratio.
In the example of a single feed-in system, the parameter R is set to 0, the equivalent impedance of the AC system is Z = 0.2 j / pu , the short-circuit capacity is S ac = 5 / pu , the reactive power is Q = 0.4 / pu , the P V corresponds to the active power of the system P = 2.06 / pu , and the operating voltage U = 0.66 / pu . Figure 5 displays the outcomes of calculating various SCR ratio indicators for the system’s critical steady state under varying compensated reactive power levels.
Reactive power compensation increases the maximum transmission power P max when calculating the SCR ratio index in a single feed-in network. The ratio of the SCR capacity to the maximum power transfer is the formula used to calculate the CSCR. The shift in the system’s maximum transmission power is the primary cause of the decline in the CSCR. Simultaneously, the rapid decrease in the CSCR encourages the improvement of the SCR ratio control margin η SCR , enhances the system’s ability to operate steadily in a steady state, and broadens the acceptance of incoming energy.
The interaction among various renewable energy sources is illustrated through the example of a multi-infeed plant. The AC system adheres to this equivalency, as shown in Table 1, which presents the relevant parameters. After assessing the renewable energy capacity at grid connection points 2 and 3, the P V curve for grid connection point 1 at a reactive power level of Q = 0 indicates an active power P of 2.5 pu and an operating voltage U of 0.707 pu .
The changes in the parameters related to the SCR ratio of each grid connection point after compensating for different reactive power capacities are shown in Table 2, and the changes in the SCR ratio control margin are shown in Figure 6.
Due to the identical impedance of branches 2 and 3, as well as their equal grid-connected capacity, the multi-infeed equivalent model indicates that when the reactive power output, impedance parameters, and grid-connected capacity of the two infeed points are relatively symmetrical, their SCR ratio and CSCR ratio parameters will also be consistent. The computation results demonstrate that when compensation equipment is added, the CSCR decreases while the η MRSCR increases. The new energy station access system remains stable when η MRSCR > 0 . The greater the stability margin η MRSCR of the system, the higher the transmitted power capacity it can accommodate. There are prerequisites for appropriately expanding the new energy input scale.

4.2. Comparative Analysis of Renewably Constructed Energy System Stability Under Different Reactive Power Compensation Devices

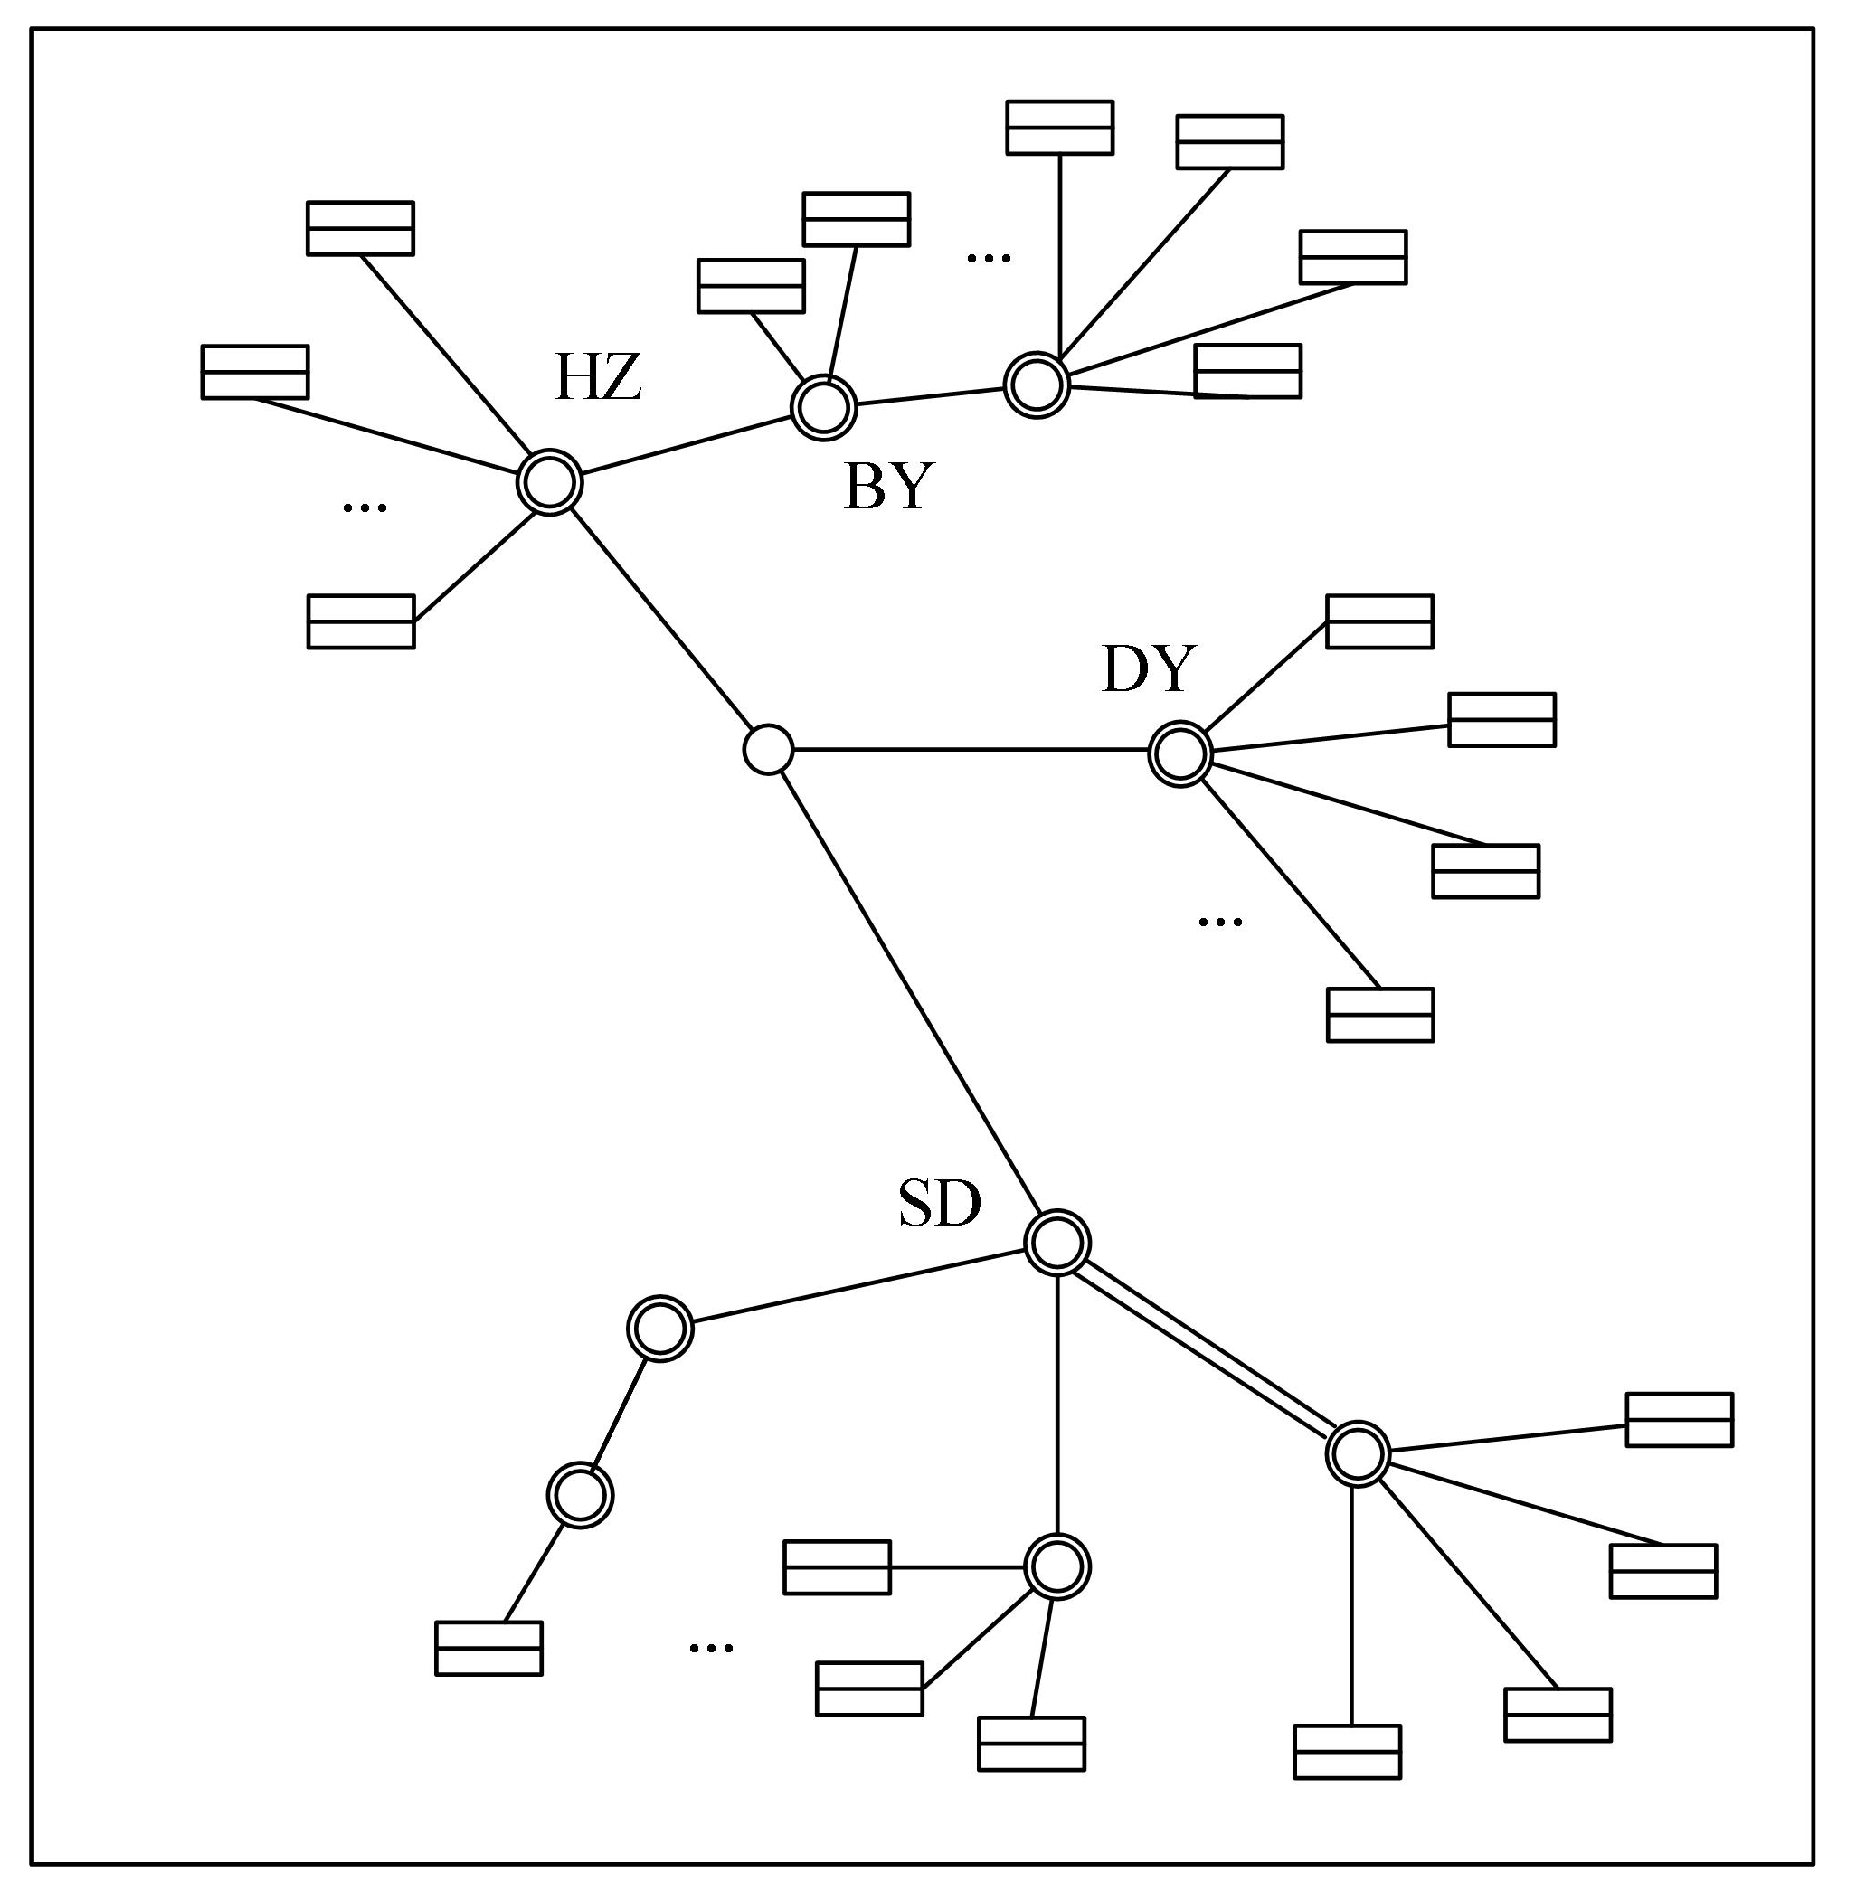
Increasing the electrical intensity of renewable energy grid-connected points is the most effective method for enhancing the voltage performance of newly installed energy grid systems and increasing the electricity consumption capacity of weak current grid systems. This section examines the impact of various reactive power compensation systems on the power consumption generated by renewable energy stations. The engineering example system is illustrated in Figure 7. There are 81 renewable energy stations in the energy collection area, which are aggregated into four 500 kV substations and transmitted through a 1050 kV high-voltage station via UHV DC. The total installed capacity of new energy is approximately 12,000 MW, of which the installed capacity of wind power is about 8500 MW and the installed capacity of photovoltaics is 3500 MW. The grid structure of each DC access point in the receiving end of the AC/DC hybrid power grid is depicted in Figure 7.
To quantitatively evaluate the impact of these devices on the strength of the system’s electrical network, an assessment of the improvement effects of various reactive electrical adjustment devices on the MRSCR was conducted using an experimental energy collection and transmission system as a model. It is important to note that the reactive electrical output of the SVC is 10% of its installed capacity when configured for compensation. When the SVG is configured, its reactive electrical output also equals 10% of the active electrical output of the supply. The reactive power output of the synchronous compensator is approximately 80% of its installed capacity when operational. Table 3 presents several sets of MRSCR index data for various reactive power compensation devices, while Figure 8 illustrates the effects of these devices on the improvement in the MRSCR.
The analysis of the computational results indicates that the SCR ratio at the newly constructed grid-tied node can be improved by utilizing three reactive electrical compensation devices. Among these, the SVC exhibits the smallest increase in the MRSCR because it adjusts each node’s short-circuit capacity. The increase rate varies from 1% to 10% with the majority of cases falling below 5%. In the MRSCR computation, the SVG is represented as a single current source. The increase in MRSCR ranges from 5% to 15% with SVG compensation slightly exceeding that of SVC. Access to the synchronous condenser reduces both the mutual and self-impedances of the node, thereby directly enhancing the MRSCR value. Consequently, the impact of the synchronous condenser on MRSCR enhancement is the most significant. The newly constructed renewable energy power plant, connected to the collection unit with the distributed synchronous condenser, has experienced an improvement of over 35% to 69%.
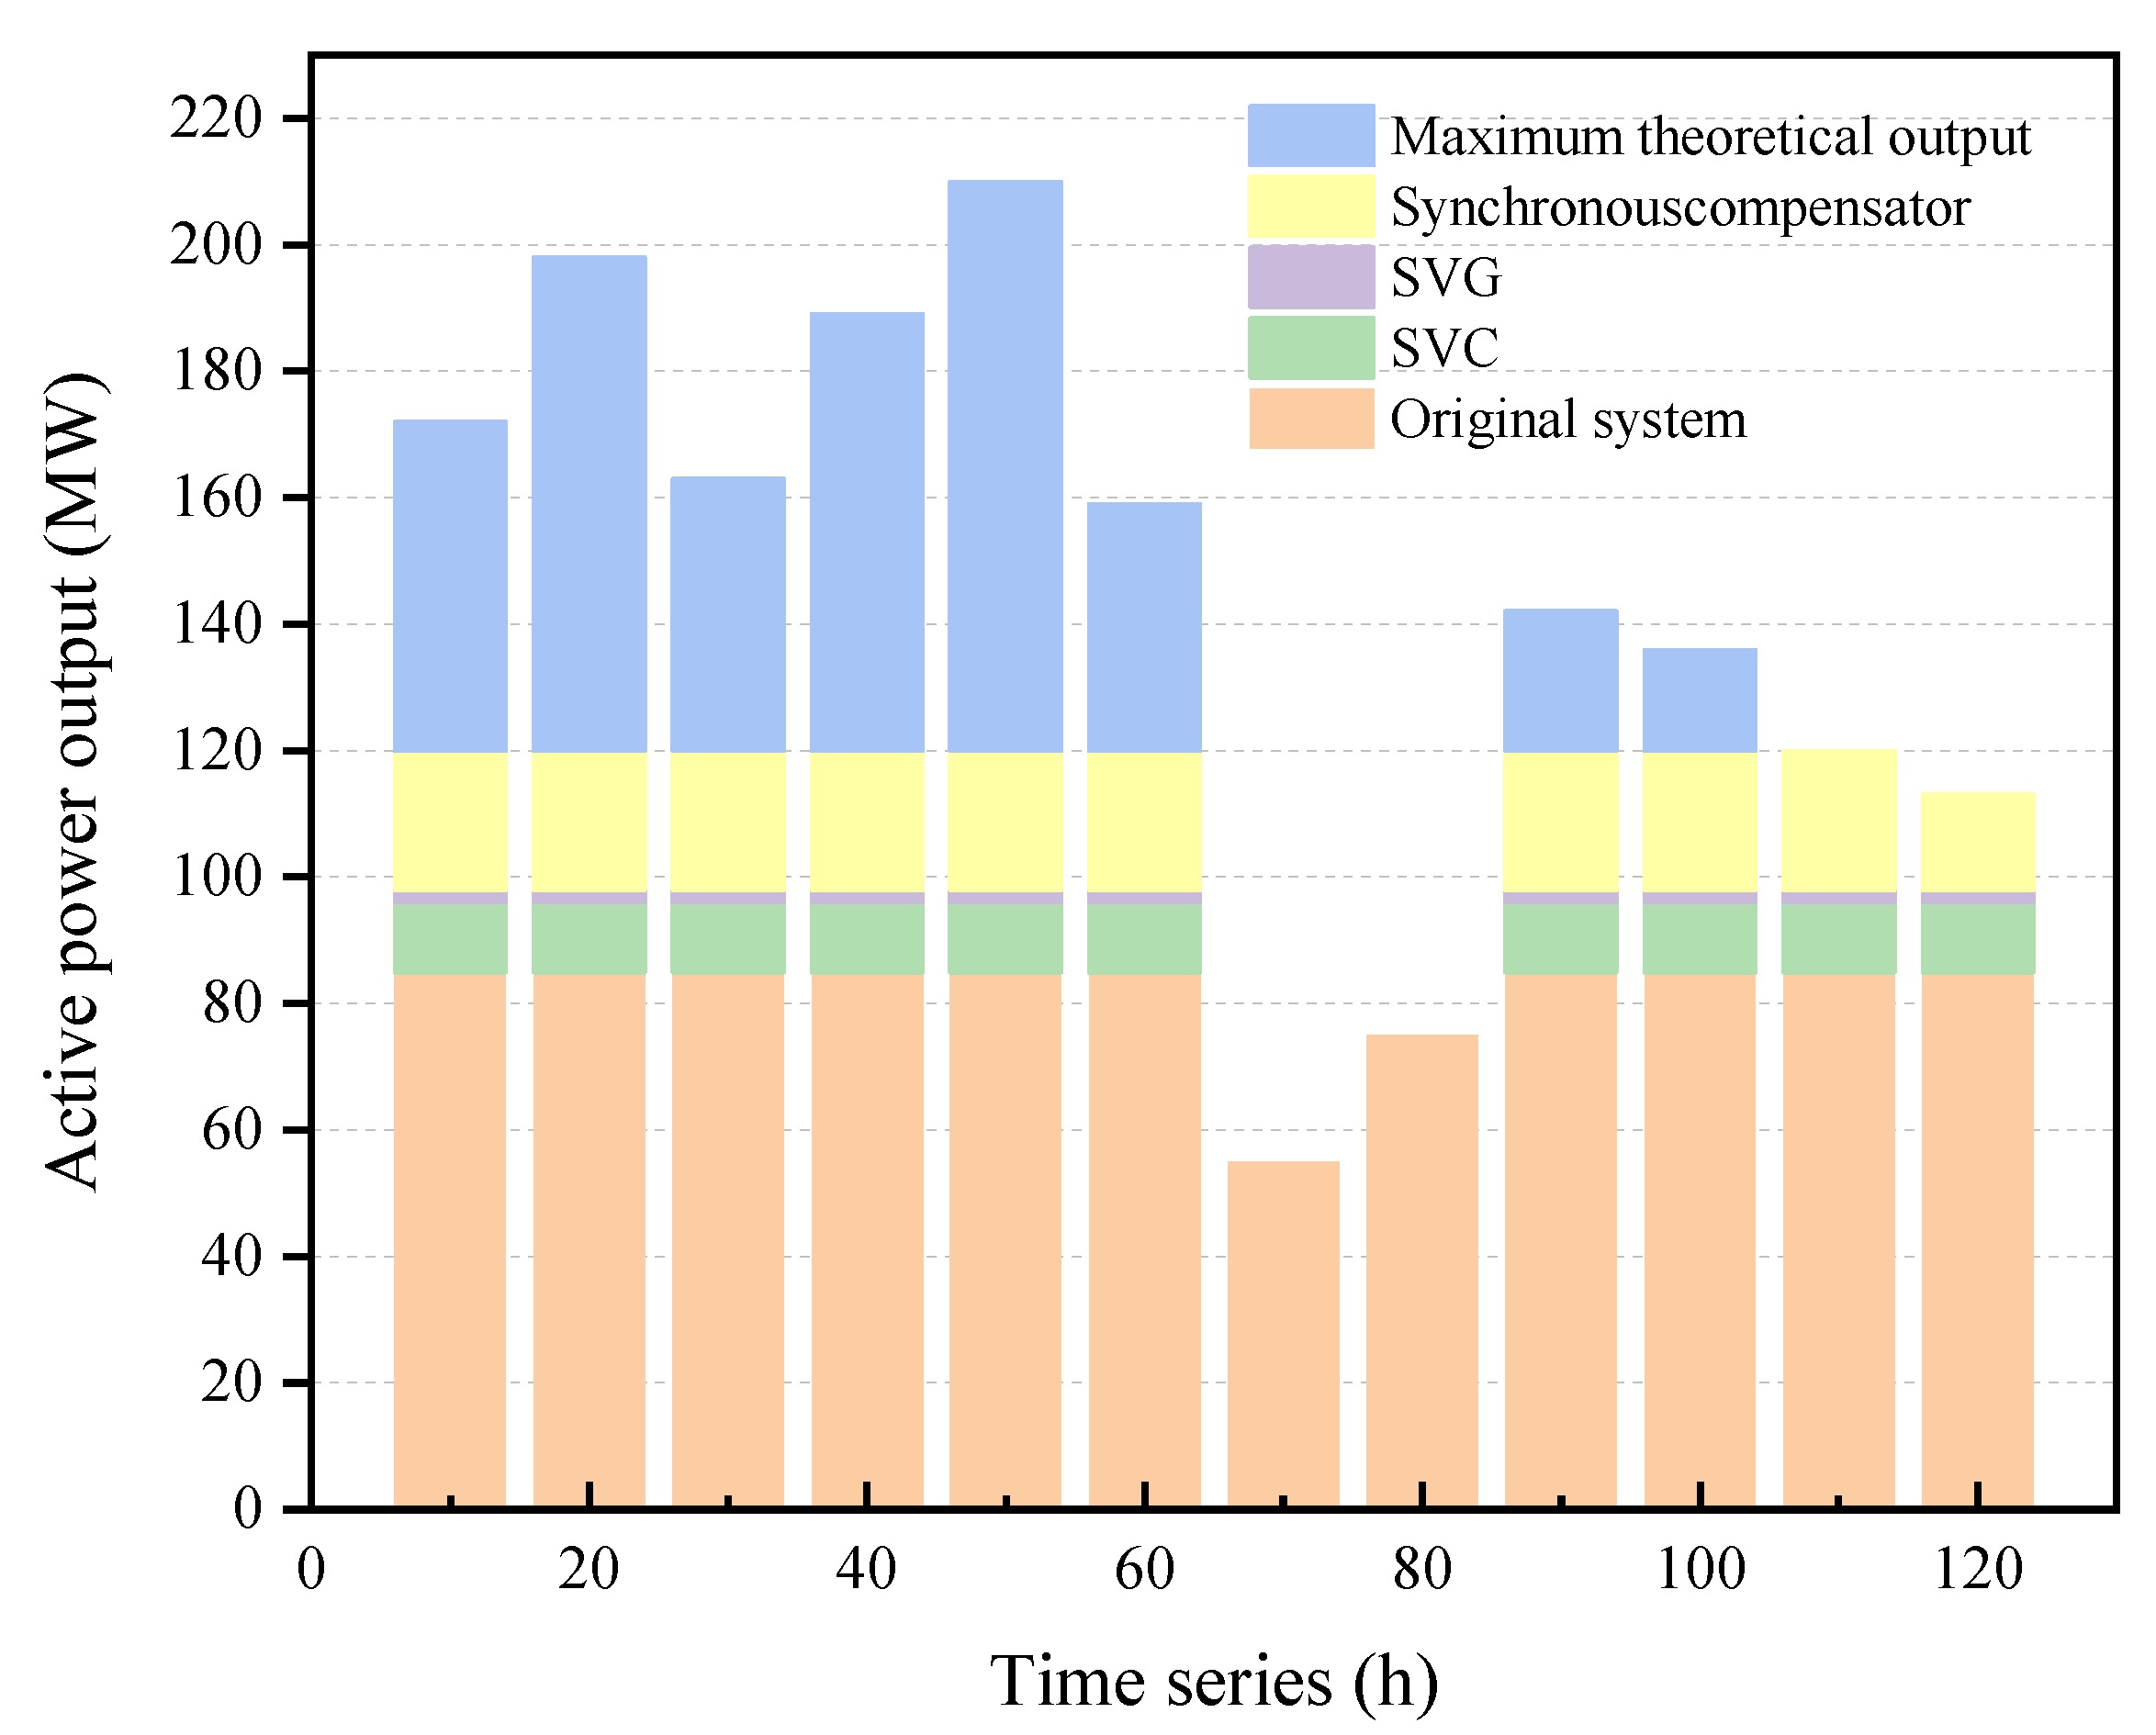
Enhancing the strength of the electrical grid connection point constructed for renewable energy is the most effective way to increase the renewable energy capacity of the weakened grid system. This section also examines the impact of various reactive power compensation devices on the SCR and energy consumption capacity of the renewable power station. The results from the renewable energy station 1, along with the theoretical maximum output curve for this station, are illustrated in Figure 9. This allows for a quantitative analysis of how each reactive power compensating device contributes to enhancing the energy consumption capacity of the renewable energy station. Strengthening the newly built electrical grid connection point remains the most effective method for improving the renewable energy consumption capabilities of the weak network system. Additionally, this section explores how different reactive electrical adjustment mechanisms influence the SCR ratio and energy capacity utilization of the recently constructed power plant. To further analyze the impact of each reactive power adjustment device on the enhancement of the renewable power station’s consumption capacity, the results are presented in Figure 9, based on the findings from renewable energy station 1 and the assumed maximum output curve for this station.
Calculate the maximum active power output limit values for each renewable energy station in the system under various reactive power compensation measures. By comparing the maximum output limit values of energy stations with different reactive power compensation devices, we can quantitatively analyze the impact of these devices on the improvement of renewable energy consumption. As shown in Figure 9, after implementing reactive power compensation using SVCs, SVGs, and synchronous compensators, the output levels of renewable energy stations have all improved compared to the output limits without any measures. The SVG reactive power compensation method demonstrates a more significant effect on enhancing the consumption capacity of renewable energy stations than the SVC method. When the synchronous compensator is employed, the output limit of the station shows the most substantial improvement. In the figure, the area above the output of the reactive power compensation device and below the theoretical maximum output at a specific time scale represents the renewable energy consumption constrained by the weak strength of the grid connection point system. It is evident from the figure that the area enclosed by the synchronous compensator is the smallest, indicating that the output limit after configuring the synchronous compensator is closer to the maximum theoretical output of the station. Therefore, the configuration of synchronous phase regulators has the most pronounced effect on enhancing the new energy consumption capacity of the station.

5. Conclusions

This study proposes a qualitative assessment method that evaluates various reactive electrical compensation devices for the SCR ratio control margin of a renewable energy plant. By starting with the CSCR ratio and constructing a coordinate system using the SCR ratio index, it is possible to effectively assess the stability of the developed renewable energy feed-in system. The main conclusions are as follows:
  • Reactive power compensation is analyzed, and equations for the appropriate SCR and CSCR are derived while fully accounting for the impact of actual operating factors. Based on the SCR calculation procedure, the specific effects of each reactive power compensation technique on SCR computation are examined in detail. Subsequently, the influence of each reactive power compensation method on the increased energy consumption capacity is thoroughly explored. A reliability margin is introduced to quantitatively assess the system’s security levels comprehensively. Example results verify the accuracy and practical effectiveness of the proposed methods.
  • The example results clearly demonstrate that all three reactive power compensation devices influence voltage support capacity. Among them, the synchronous condenser has the most significant impact on voltage support strength; it directly modifies the self-admittance of the access point, thereby effectively increasing the node’s MRSCR value substantially.
  • The stability margin of the short-circuit ratio (SCR) is a crucial indicator for assessing the capacity of power systems to integrate renewable energy. It defines the additional capacity that can be accommodated by renewable energy sources while ensuring the stable operation of the system. This surplus capacity is directly related to the increase in the system’s transferable power capacity. The higher the stability margin, the greater the amount of renewable energy that the system can transmit through the transmission network without exceeding stability limits. Consequently, the stability margin of the SCR not only provides a quantitative basis for evaluating the acceptance capacity of existing systems for renewable energy but also serves as an important reference for engineering practices. This includes determining the appropriate scale for new energy grid connections during the planning phase, optimizing grid topology, and configuring reactive power compensation.

Author Contributions

Conceptualization, J.F. and X.Z.; Methodology, M.L. and Q.M.; Software, J.C. and D.S.; Validation, Q.M., X.Z. and J.D.; Formal analysis, J.C.; Investigation, M.L.; Resources, J.F. and H.W.; Data curation, J.D. and H.W.; Writing—original draft, D.S. and J.C.; Writing—review and editing, Q.M., M.L. and X.Z.; Visualization, J.F. and H.W.; Supervision, D.S.; Project administration, D.S. All authors have read and agreed to the published version of the manuscript.

Funding

This research received no external funding.

Data Availability Statement

The original contributions presented in the study are included in the article. Further enquiries can be directed to the corresponding author.

Conflicts of Interest

Authors Jie Cao, Mingshun Liu, Qinfeng Ma and Junqiu Fan were employed by Guizhou Power Grid Co., Ltd. Author Dongkuo Song was employed by Guodian Nari Nanjing Control System Co., Ltd. The remaining authors declare that the research was conducted in the absence of any commercial or financial relationships that could be construed as a potential conflict of interest.

References

  1. Shi, Z.; Wang, W.; Huang, Y.; Li, P.; Dong, L. Simultaneous optimization of renewable energy and energy storage capacity with the hierarchical control. CSEE J. Power Energy Syst. 2022, 8, 95–104. [Google Scholar]
  2. Echevarria, A.; Rivera-Matos, Y.; Irshad, N.; Gregory, C.; Castro-Sitiriche, M.J.; King, R.R.; Miller, C.A. Unleashing Sociotechnical Imaginaries to Advance Just and Sustainable Energy Transitions: The Case of Solar Energy in Puerto Rico. IEEE Trans. Technol. Soc. 2023, 4, 255–268. [Google Scholar] [CrossRef]
  3. Ye, C.; Jiang, K.; Liu, D.; Zhang, C.; Zhang, D.; Liu, Z. Emergency Control Strategy for High Proportion Renewable Power System Considering the Frequency Aggregation Response of Multi-Type Power Generations. IEEE Access 2024, 12, 188325–188335. [Google Scholar] [CrossRef]
  4. Han, P.; Li, P.; Xie, X.; Zhang, J. Coordinated Optimization of Power Rating and Capacity of Battery Storage Energy System with Large-Scale Renewable Energy. In Proceedings of the 2022 IEEE 6th Conference on Energy Internet and Energy System Integration (EI2), Chengdu, China, 11–13 November 2022; pp. 189–193. [Google Scholar]
  5. Huang, Y.; Wang, Y.; Li, C.; Zhao, H.; Wu, Q. Physics Insight of the Inertia of Power Systems and Methods to Provide Inertial Response. CSEE J. Power Energy Syst. 2022, 8, 559–568. [Google Scholar] [CrossRef]
  6. Hossain, M.I.; Hamanah, W.M.; Alam, M.S.; Shafiullah, M.; Abido, M.A. Fault Ride Through and Intermittency Improvement of Renewable Energy Integrated MMC-HVDC System Employing Flywheel Energy Storage. IEEE Access 2023, 11, 50528–50546. [Google Scholar] [CrossRef]
  7. Li, X.; Wang, S. Energy management and operational control methods for grid battery energy storage systems. CSEE J. Power Energy Syst. 2021, 7, 1026–1040. [Google Scholar]
  8. Lai, J.; Chen, M.; Dai, X.; Zhao, N. Energy Management Strategy Adopting Power Transfer Device Considering Power Quality Improvement and Regenerative Braking Energy Utilization for Double-Modes Traction System. CPSS Trans. Power Electron. Appl. 2022, 7, 103–111. [Google Scholar] [CrossRef]
  9. Yu, L.; Xu, S.; Sun, H.; Zhao, B.; Wu, G.; Zhou, X. Multiple Renewable Short-Circuit Ratio for Assessing Weak System Strength with Inverter-Based Resources. CSEE J. Power Energy Syst. 2024, 10, 2271–2282. [Google Scholar]
  10. Wang, G.; Xin, H.; Wu, D.; Li, Z.; Ju, P. Grid Strength Assessment for Inhomogeneous Multi-infeed HVDC Systems via Generalized Short Circuit Ratio. J. Mod. Power Syst. Clean Energy 2023, 11, 1370–1374. [Google Scholar] [CrossRef]
  11. Bennett, M.; Nassif, A.; Rahmatian, M.; Liu, Y.; Jiang, Z.; Gevorgian, V.; Fan, X.; Elizondo, M. Grid Strength Assessment for High Levels of Inverter-based Resources in the Puerto Rico Power System. In Proceedings of the 2023 IEEE PES Innovative Smart Grid Technologies Latin America (ISGT-LA), San Juan, PR, USA, 6–9 November 2023. [Google Scholar]
  12. Bryant, J.S.; McGrath, B.; Meegahapola, L.; Sokolowski, P. Small-Signal Stability Analysis of Voltage Source Inverters Operating under Low Short-Circuit Ratios. In Proceedings of the 2021 IEEE Madrid PowerTech, Madrid, Spain, 28 June–2 July 2021. [Google Scholar]
  13. Darbandi, A.F.; Sinkar, A.; Gole, A. Effect of Short-Circuit Ratio and Current Limiting on the Stability of a Virtual Synchronous Machine Type Gridforming Converter. In Proceedings of the 17th International Conference on AC and DC Power Transmission (ACDC 2021), Online, 7 July–8 December 2021. [Google Scholar]
  14. Yamada, Y.; Tsusaka, A.; Nanahara, T.; Yukita, K. A Study on Short-Circuit-Ratio for an Inverter-Based Resource with Power-Voltage Curves. IEEE Trans. Power Syst. 2024, 39, 6076–6086. [Google Scholar] [CrossRef]
  15. Lee, G.-S.; Hwang, P.-I.; Moon, S.-I. Reactive Power Control of Hybrid Multi-Terminal HVDC Systems Considering the Interaction Between the AC Network and Multiple LCCs. IEEE Trans. Power Syst. 2021, 36, 4562–4574. [Google Scholar] [CrossRef]
  16. Wang, Y.; Wang, L.; Jiang, Q. Impact of Synchronous Condenser on Sub/Super-Synchronous Oscillations in Wind Farms. IEEE Trans. Power Deliv. 2021, 36, 2075–2084. [Google Scholar] [CrossRef]
  17. Wang, H.; Chen, Q.; Zhang, L.; Yin, X.; Zhang, Z.; Wei, H.; Chen, X. Research and Engineering Practice of Var-Voltage Control in Primary and Distribution Networks Considering the Reactive Power Regulation Capability of Distributed PV Systems. Energies 2025, 18, 2135. [Google Scholar] [CrossRef]
  18. Wei, L.; Yang, B.; Lu, S. A VSG Power Decoupling Control with Integrated Voltage Compensation Schemes. Energies 2025, 18, 1878. [Google Scholar] [CrossRef]
  19. Ch, S.S.; Hredzak, B.; Farhangi, M.; Prasad, R.; Kumar, D.M.; Fagiolini, A.; Di Benedetto, M.; Mudaliar, H.K.; Cirrincione, M. Adaptive Control of Grid-Following Inverter-Based Resources Under Low Network Short Circuit Ratio. IEEE Trans. Ind. Appl. 2025, 61, 1828–1838. [Google Scholar]
  20. Gong, C.; Sou, W.-K.; Lam, C.-S. H∞ optimal control design of static var compensator coupling hybrid active power filter based on harmonic state-space modeling. CPSS Trans. Power Electron. Appl. 2021, 6, 227–234. [Google Scholar] [CrossRef]
  21. Chakraborty, S.; Mukhopadhyay, S.; Biswas, S.K. Coordination of D-STATCOM & SVC for Dynamic VAR Compensation and Voltage Stabilization of an AC Grid Interconnected to a DC Microgrid. IEEE Trans. Ind. Appl. 2022, 58, 634–644. [Google Scholar]
  22. Gao, H.; Huang, Z.; Diao, R.; Zhang, J.; Hou, B.; Wu, C.; Sun, F.; Lan, T. A Machine Learning-Based SVG Parameter Identification Framework Using Hardware-in-the-Loop Testbed. IEEE Trans. Power Syst. 2024, 39, 6849–6860. [Google Scholar] [CrossRef]
  23. Gao, H.; Diao, R.; Huang, Z.; Zhong, Y.; Mao, Y.; Tang, W. Parameter Identification of SVG Using Multilayer Coarse-to-Fine Grid Searching and Particle Swarm Optimization. IEEE Access 2022, 10, 77137–77146. [Google Scholar] [CrossRef]
  24. Tian, X.; Chi, Y.; Li, Y.; Tang, H.; Liu, C.; Su, Y. Coordinated damping optimization control of sub-synchronous oscillation for DFIG and SVG. CSEE J. Power Energy Syst. 2021, 7, 140–149. [Google Scholar]
  25. Ren, L.; Wang, F.; Shi, Y.; Gao, L. Coupling Effect Analysis and Design Principle of Repetitive Control Based Hybrid Controller for SVG with Enhanced Harmonic Current Mitigation. IEEE J. Emerg. Sel. Top. Power Electron. 2022, 10, 5659–5669. [Google Scholar] [CrossRef]
  26. Nair, A.R.; Patel, S.; Kamalasadan, S.; Smith, M.; Siddiqui, S. Parametrically Optimized Synchronous Condenser Coordinated Control Framework to Enhance Bulk Grid Stability with Renewables. IEEE Trans. Ind. Appl. 2024, 60, 5737–5750. [Google Scholar] [CrossRef]
  27. Tan, J.; Xue, R.; Tan, H.; Zhang, T.; Zhao, Y.; Zhao, B.; Wu, S.; Zhai, Y.; Dang, H. Design and Experimental Investigations on the Helium Circulating Cooling System Operating at Around 20 K for a 300-kvar Class HTS Dynamic Synchronous Condenser. IEEE Trans. Appl. Supercond. 2022, 32, 1–5. [Google Scholar] [CrossRef]
  28. Hadavi, S.; Mansour, M.Z.; Bahrani, B. Optimal Allocation and Sizing of Synchronous Condensers in Weak Grids with Increased Penetration of Wind and Solar Farms. IEEE J. Emerg. Sel. Top. Circuits Syst. 2021, 11, 199–209. [Google Scholar] [CrossRef]
  29. Sanni, S.O.; Mohammed, O.O.; Chakraborty, S.; Abdullateef, A.I.; Otuoze, A.O.; Ikotun, O.; Agyekum, E.B. On the Choice of System Strength Metrics for the Allocation and Sizing of Synchronous Condensers in Power Grids. IEEE Access 2025, 13, 83781–83793. [Google Scholar] [CrossRef]
  30. Liu, X.; Xin, H.; Zheng, D.; Chen, D.; Tu, J. Transient Stability of Synchronous Condenser Co-Located with Renewable Power Plants. IEEE Trans. Power Syst. 2024, 39, 2030–2041. [Google Scholar] [CrossRef]
  31. Han, C.; Shang, L.; Su, S.; Dong, X.; Wang, B.; Bai, H.; Li, W. Grid Synchronization Control for Grid-Connected Voltage Source Converters Based on Voltage Dynamics of DC-Link Capacitor. J. Mod. Power Syst. Clean Energy 2024, 12, 1678–1689. [Google Scholar] [CrossRef]
  32. Liu, T.; Wang, P.; Ma, J.; Zhang, R.; Wang, S.; Wu, Z.; Wang, R. Presynchronization Control for Grid-Connected Inverters Without Grid Voltage Sensors. IEEE Trans. Power Electron. 2023, 38, 2833–2838. [Google Scholar] [CrossRef]
  33. Vaidya, S.; Prasad, K.; Kilby, J. The Role of Multilevel Inverters in Mitigating Harmonics and Improving Power Quality in Renewable-Powered Smart Grids: A Comprehensive Review. Energies 2025, 18, 2065. [Google Scholar] [CrossRef]
  34. Wang, Z.; Zeng, X.; Li, Z.; Yu, K.; Wu, C.; Jiang, Z.; Zhuo, C. An Active Voltage-Type Grounding Fault Protection Method for Medium-Voltage Distribution Networks with Neutral Point Voltage Flexible Regulation. IEEE Trans. Power Deliv. 2024, 39, 1538–1548. [Google Scholar] [CrossRef]
  35. Miao, W.; Xu, Q.; Lam, K.H.; Pong, P.W.T.; Poor, H.V. DC Arc-Fault Detection Based on Empirical Mode Decomposition of Arc Signatures and Support Vector Machine. IEEE Sensors J. 2021, 21, 7024–7033. [Google Scholar] [CrossRef]
  36. Wang, G.; Huang, Y.; Xu, Z. Voltage Stiffness for Strength Evaluation of VSC-Penetrated Power Systems. IEEE Trans. Power Syst. 2024, 39, 6119–6122. [Google Scholar] [CrossRef]
  37. Yu, L.; Sun, H.; Xu, S.; Zhao, B.; Zhang, J. A Critical System Strength Evaluation of a Power System with High Penetration of Renewable Energy Generations. CSEE J. Power Energy Syst. 2022, 8, 710–720. [Google Scholar]
  38. Abbass, M.J.; Lis, R.; Rebizant, W. Advanced Voltage Stability Assessment in Renewable-Powered Islanded Microgrids Using Machine Learning Models. Energies 2025, 18, 2047. [Google Scholar] [CrossRef]
  39. Sadek, S.M.; Omran, W.A.; Hassan, M.A.M.; Talaat, H.E.A. Data Driven Stochastic Energy Management for Isolated Microgrids Based on Generative Adversarial Networks Considering Reactive Power Capabilities of Distributed Energy Resources and Reactive Power Costs. IEEE Access 2021, 9, 5397–5411. [Google Scholar] [CrossRef]
  40. Feng, N.; Feng, Y.; Su, Y.; Zhang, Y.; Niu, T. Dynamic Reactive Power Optimization Strategy for AC/DC Hybrid Power Grid Considering Different Wind Power Penetration Levels. IEEE Access 2024, 12, 187471–187482. [Google Scholar] [CrossRef]
  41. Liang, W.; Liu, Y.; Peng, J. A Day and Night Operational Quasi-Z Source Multilevel Grid-Tied PV Power System to Achieve Active and Reactive Power Control. IEEE Trans. Power Electron. 2021, 36, 474–492. [Google Scholar] [CrossRef]
  42. Al Farisi, F.K.; Fan, Z.-K.; Lian, K.-L. Comparative Study of White Shark Optimization and Combined Meta-Heuristic Algorithm for Enhanced MPPT in Photovoltaic Systems. Energies 2025, 18, 2110. [Google Scholar] [CrossRef]
  43. Wang, B.; Tian, Z.; Yang, H.; Li, C.; Xu, X.; Zhu, S.; Du, E.; Zhang, N. Collaborative Planning of Source–Grid–Load–Storage Considering Wind and Photovoltaic Support Capabilities. Energies 2025, 18, 2045. [Google Scholar] [CrossRef]
Figure 1. The Thévenin equivalent system for the SVG access system.
Energies 18 03880 g001
Figure 2. Influence of synchronous condenser access on node impedance matrix.
Energies 18 03880 g002
Figure 3. Equivalent circuit diagram of a reactive power compensation device connected to a renewable energy grid connection system.
Energies 18 03880 g003
Figure 4. Equivalent model of renewable energy station with reactive power compensation device.
Energies 18 03880 g004
Figure 5. Short-circuit ratio related indicators of single feed-in system.
Energies 18 03880 g005
Figure 6. SCR ratio related indicators for multi feed-in systems.
Energies 18 03880 g006
Figure 7. Actual grid structure of a certain confluence station in the power grid.
Energies 18 03880 g007
Figure 8. Comparison of the effects of different reactive power compensation devices on MRSCR improvement.
Energies 18 03880 g008
Figure 9. Output effect of field station under different reactive power compensation devices.
Energies 18 03880 g009
Table 1. Multiple input case parameters.
AC System ImpedanceBranch 1Branch 2Branch 3
0.3 j 0.12 j 0.8 j 0.8 j
Table 2. SCR index of multi-feed-in system under different reactive power compensation capacities.
Q s , i / pu NodeMRSCRCSCR η MRSCR
Q s , i = 0 12.0852.0551.46%
21.8931.8910.11%
31.8931.8910.11%
Q s , i = 0.2 12.0081.8528.42%
21.8171.8030.78%
31.8171.8030.78%
Q s , i = 0.4 11.9111.66314.91%
21.7231.6971.53%
31.7231.6971.53%
Table 3. Comparison of MRSCR indexes of each station under different reactive power compensation devices.
Renewable Energy Power PlantOriginal SystemSVCSVGSynchronous Compensator
SD1.8061.8511.9512.474
DY1.8801.9482.1283.005
HZ1.9812.0412.1373.126
BY1.8741.9092.0723.183
Disclaimer/Publisher’s Note: The statements, opinions and data contained in all publications are solely those of the individual author(s) and contributor(s) and not of MDPI and/or the editor(s). MDPI and/or the editor(s) disclaim responsibility for any injury to people or property resulting from any ideas, methods, instructions or products referred to in the content.