1. Introduction
Fast-switching inverter-fed drive systems have introduced new stress mechanisms for high-voltage rotating-machine insulation. The high switching frequencies and steep voltage rise times (dv/dt > 10 kV/μs) produced by modern PWM inverters lead to intense transient over-voltages and non-uniform field distributions across winding insulation [
1,
2]. Steep voltage variations (high (dv/dt)) impose significant electrical stress on the insulation systems of rotating machines, accelerating the aging process and increasing the likelihood of premature insulation failure. This elevated stress contributes to insulation degradation, reduces the operational reliability of the machine, and heightens maintenance demands [
3].
In addition, the combined effect of various stresses accelerates the degradation of the insulation system. Failure analysis indicates that stator insulation issues contribute to machine failures in approximately 37% to 56% of cases. This failure rate increases when thermal and mechanical stress, in conjunction with electrical stress, are introduced during the manufacturing process and operation of the machine [
4,
5,
6,
7,
8].
To assess the condition and suitability of the insulation materials used for coils in drive-fed induction motors, the related standards establish specific requirements [
9]. However, the test sample proposed in the draft version of the standard only evaluates the slot section or the straight part of the coil, neglecting the overhang area, which may fail to account for critical stress points in real-world applications. Despite this limitation, this sample has been used in almost all previous studies. This overhang section experiences significant mechanical stress during the bending process in manufacturing, which can impact insulation performance and durability. In addition, the standard assumes a comparable aging rate between sinusoidal and repetitive impulse stresses; thus, a sinusoidal voltage waveform can be used instead of a repetitive impulse waveform to assess the endurance of turn insulation [
9]. Several studies have demonstrated that the characteristics of voltage waveforms, particularly the pulse rise time and thermal impact, have a significant effect on the lifetime of insulation systems. In investigations involving mica-based turn insulation subjected to various electrical stress conditions [
10,
11,
12,
13], the results consistently indicate a pronounced reduction in insulation lifetime with faster voltage rise times. This suggests that insulation materials are highly sensitive to steep voltage transients (high (dv/dt)).
Furthermore, it has been observed that not only the waveform shape but also the frequency of the applied voltage plays a critical role in determining the insulation degradation rates. These effects are evident across different types of waveforms and operating conditions [
9,
10,
11,
12,
13,
14,
15,
16]. Reference [
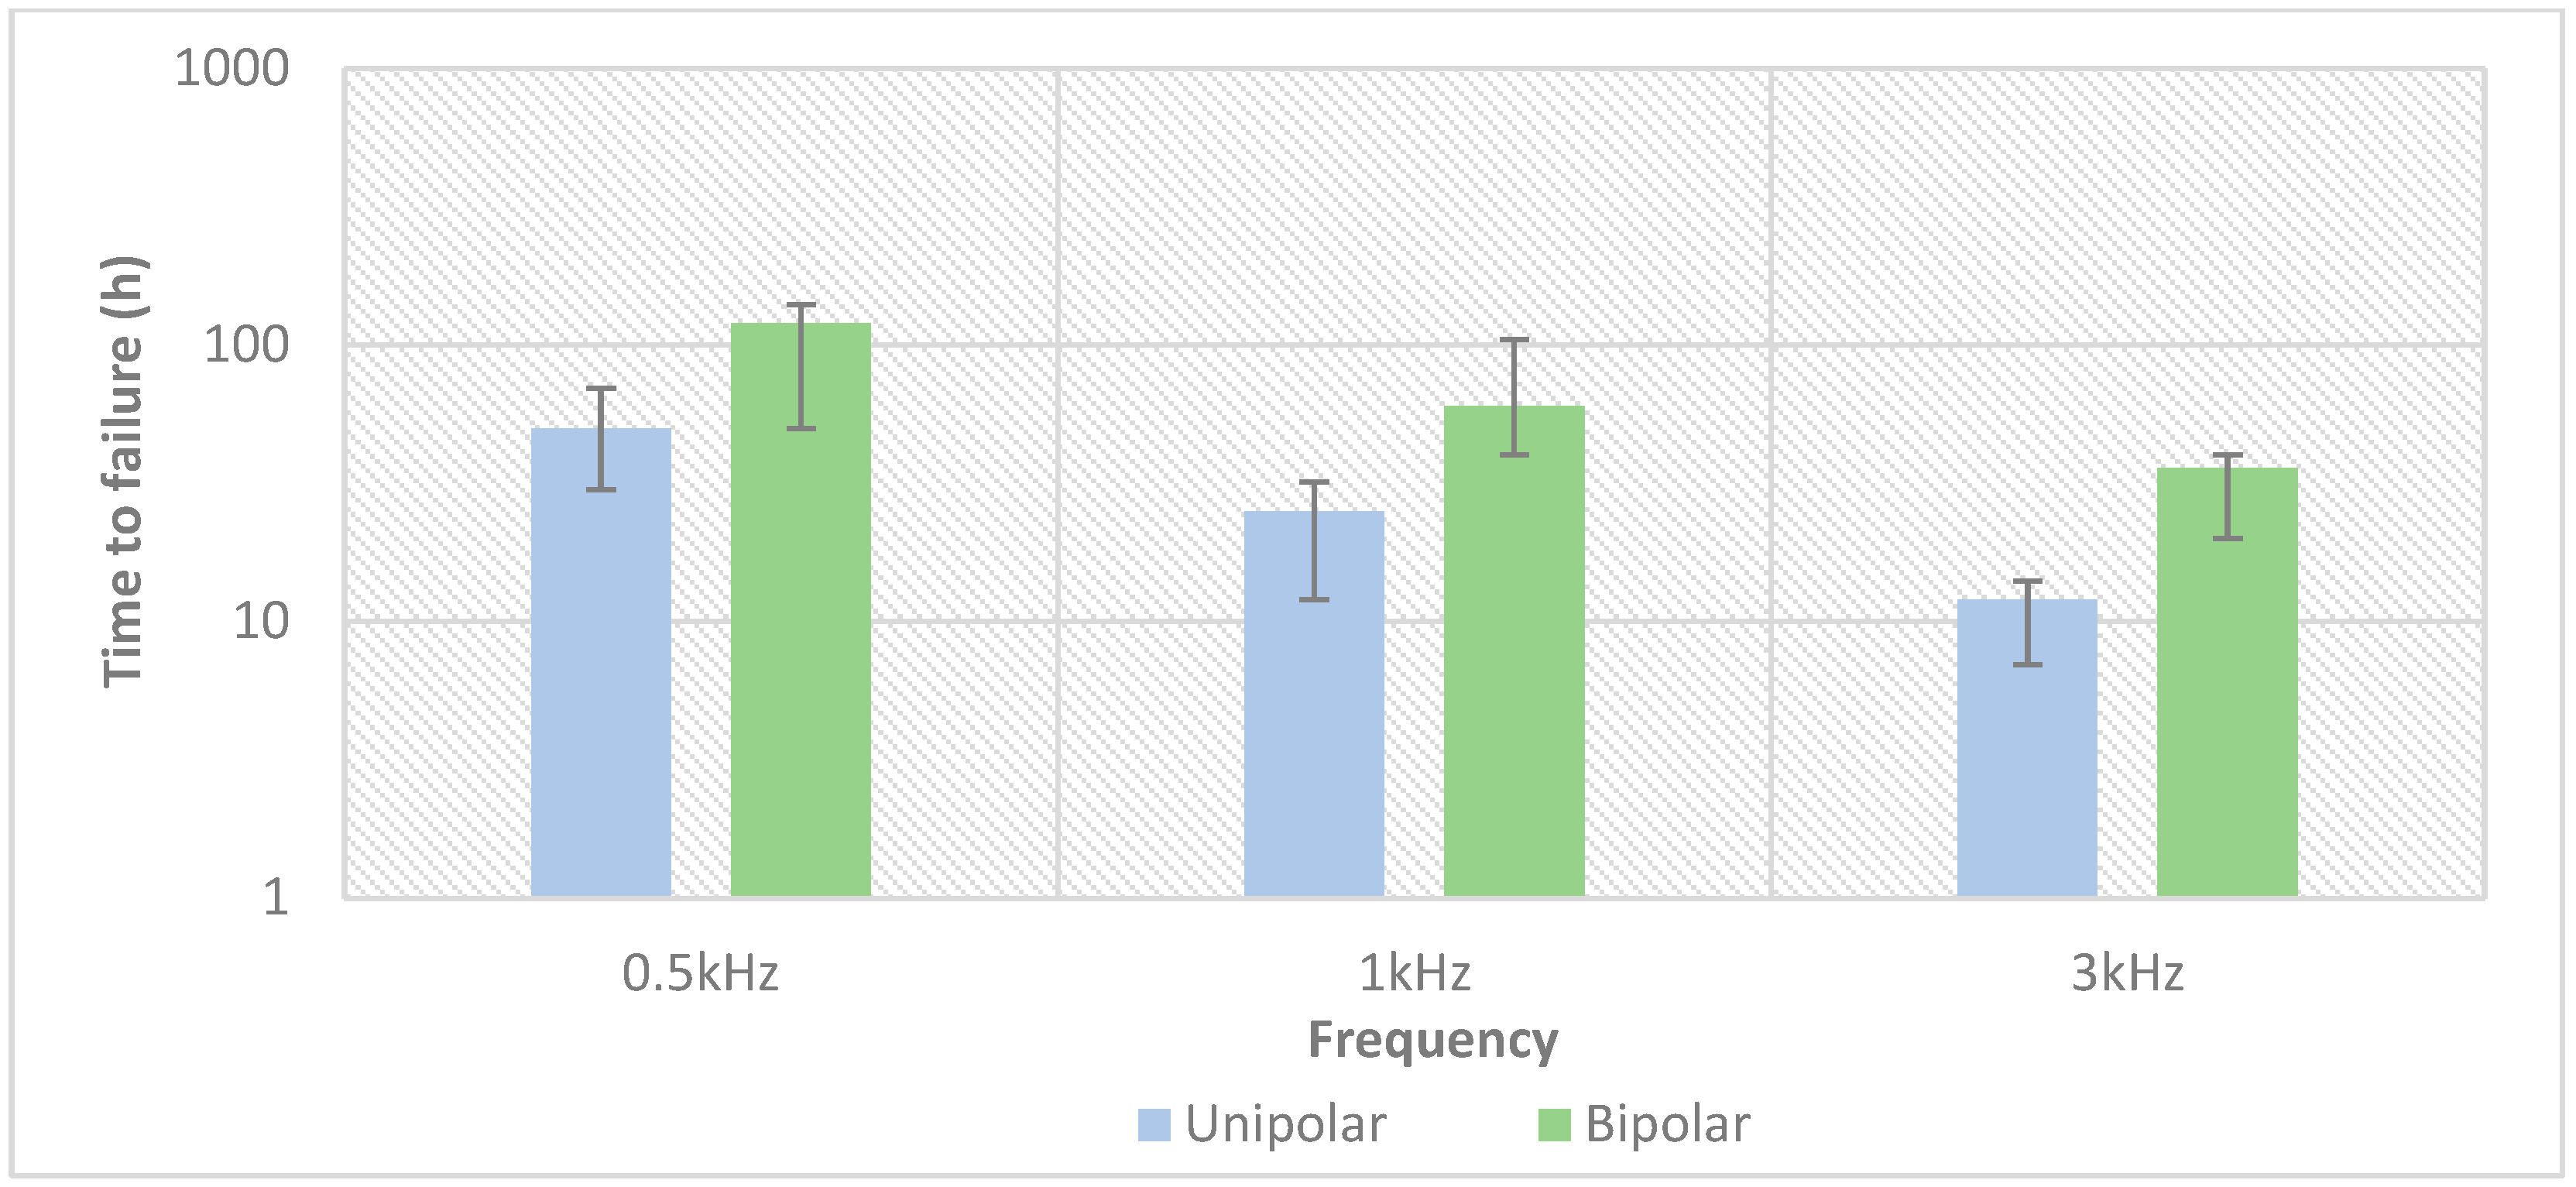
14] illustrates that an inverse linear correlation was observed between increasing frequency and decreasing times-to-failure, as shown in
Figure 1. While [
16] highlighted that the aging behavior of turn insulation remains comparable under both 1 kHz and 4 kHz stress conditions; this suggests that within this frequency range, the degradation mechanisms are similar despite variations in the applied frequency.
The insulation lifetime under unipolar electrical stress was consistently shorter than under bipolar stress, indicating that unipolar pulsed stress induces more severe degradation mechanisms (
Figure 1). The insulation was tested under square waveform conditions with the same peak-to-peak applied voltage of 4 kV and a rise time of 300 ns [
14]. Conversely, other studies [
17,
18] reported a slight reduction in lifetime under bipolar square impulses compared to unipolar ones, suggesting that the influence of pulse polarity on insulation degradation is not universal. This variation may be attributed to differences in pulse characteristics, test conditions, and the voltage parameter used, specifically, whether the peak or peak-to-peak voltage was applied.
In Reference [
17], the turn insulation samples focused on the straight part only, similar to most previous studies. The results showed a shorter lifetime under a 50% duty cycle compared to a 15% duty cycle, despite the higher cumulative electrical stress time observed at 50%. This indicates that the relationship between duty cycle and insulation lifetime is not strictly inverse; rather, it depends on the magnitude of duty cycle variation and the effective electrical stress duration. The insulation degradation appears to be primarily influenced by on-time stress, with off-time having minimal effect.
Extensive research has been conducted to investigate the detrimental effects of various waveform parameters, such as rise time and frequency, on turn-to-turn insulation in the straight sections of coils. However, many studies have found that the overhang area also plays a significant role in insulation breakdown voltage under a power frequency sinusoidal waveform, with its impact largely influenced by the bending radius, especially when the radius is small [
19]. This is primarily because the bending area of any insulation system experiences a higher electric field compared to a straight section, leading to increased electrical stress [
20,
21]. Additionally, partial discharge (PD) activity in this region is more pronounced, further accelerating insulation degradation [
22,
23].
The bending area presents a higher risk of failure compared to the straight part of the coil, significantly influencing the overall reliability and lifespan of the insulation system. In addition to electrical stress, the bending area of the coil undergoes substantial mechanical stress during manufacturing, particularly during the winding, bending, and shaping processes. The combination of mechanical and electrical stress heightens the risk of insulation degradation in this region. Thermal aging exacerbates the degradation process by intensifying the impact of stressors on the insulation material due to elevated temperatures. This combined stress hastens insulation deterioration, shortening its lifespan and raising the risk of failure [
24,
25,
26,
27].
Almost all previous studies that focused on the effect of new stresses due to inverter output and how this affects the insulation lifetime of rotating machines have primarily concentrated on coil samples taken from straight sections of the winding and on twisted pairs, in accordance with standard testing practices. However, two notable investigations by the same research group [
28,
29] extended this focus to coil samples containing bent sections and consistently demonstrated significantly shorter lifespans compared to samples from straight segments. These studies included detailed analyses using a corona scope to assess partial discharge (PD) activity.
A key observation was that, under comparable peak-to-peak voltage levels, PD density remained relatively constant across samples subjected to pulse voltage, whereas a marked increase in PD activity was detected in the curved sections under sinusoidal excitation. This suggests that pulse voltage produces a more uniform distribution of electrical stress along the turn insulation, while sinusoidal voltage tends to concentrate electrical stress in localized regions, particularly at bends. It is important to note, however, that these studies utilized only a single, constant pulse waveform for comparison against sinusoidal excitation. As such, they did not explore the effects of varying pulse characteristics—such as the rise time, pulse width, or frequency—on insulation degradation, leaving a gap in the understanding of the full impact of realistic pulse conditions on insulation performance.
This study investigates the endurance of insulation systems under realistic operating conditions by applying various electrical stress profiles to samples also subjected to mechanical stress. The experimental setup utilizes a practical test specimen incorporating strand (turn) insulation representative of the “Type II insulation” used in high-voltage rotating machines. This insulation system is enhanced with a specialized layer designed to withstand partial discharge activity. The samples are exposed to new electrical stresses characterized by high (dv/dt) values (greater than 10 kV/µs), with systematically varied rise times, pulse widths, polarities, and frequencies, to comprehensively evaluate the insulation’s lifetime behavior.
2. Accelerated Lifetime Testing
Accelerated life endurance tests are typically conducted under a constant test voltage to determine insulation lifetimes, which are then used to establish lifetime curves based on predictive models and to derive design stress levels for a given failure probability [
30,
31]. To speed up material comparisons and obtain statistically meaningful extrapolations of lifetime curves, increasing the test voltage and frequency can significantly reduce testing time [
6,
31]. According to IEC 60034-18-42 [
9], the qualification of Type II insulation systems’ main wall and turn insulation systems is through voltage endurance at room temperature or a higher temperature. The empirical relationship of electrical aging for lifetime curves might be described by
With (
U) as the breakdown voltage (peak value), the time-to-failure (
) depends on the applied voltage, and the constant (
K), known as the location parameter, depends on the electrode geometry, the space between electrodes, the voltage waveform, and the insulating material properties. The slope of the characteristic curves is described by the electrical lifetime exponent (
), sometimes referred to as the voltage endurance coefficient (VEC), which is a parameter of the electrical aging process and thus also depends on the material [
32]. In the case of pulse stress, it seems more appropriate to use the number-of-pulses-to-failure (
N) as a more direct parameter of testing instead of time-to-failure. In this approach, the number of pulses inherently accounts for the test frequency, providing a more precise evaluation of insulation aging. This relationship is expressed by
where (
) is a constant that denotes the number of pulses per cycle, where (
= 1) corresponds to unipolar voltage pulses, (
= 2) applies to bipolar voltage pulses, and (
f) is the applied pulse frequency. By substituting this into Equation (1), the lifetime in terms of the number of pulses is expressed by
with the constant
KF =
K·(
·
f)
1/n.
2.1. Test Sample
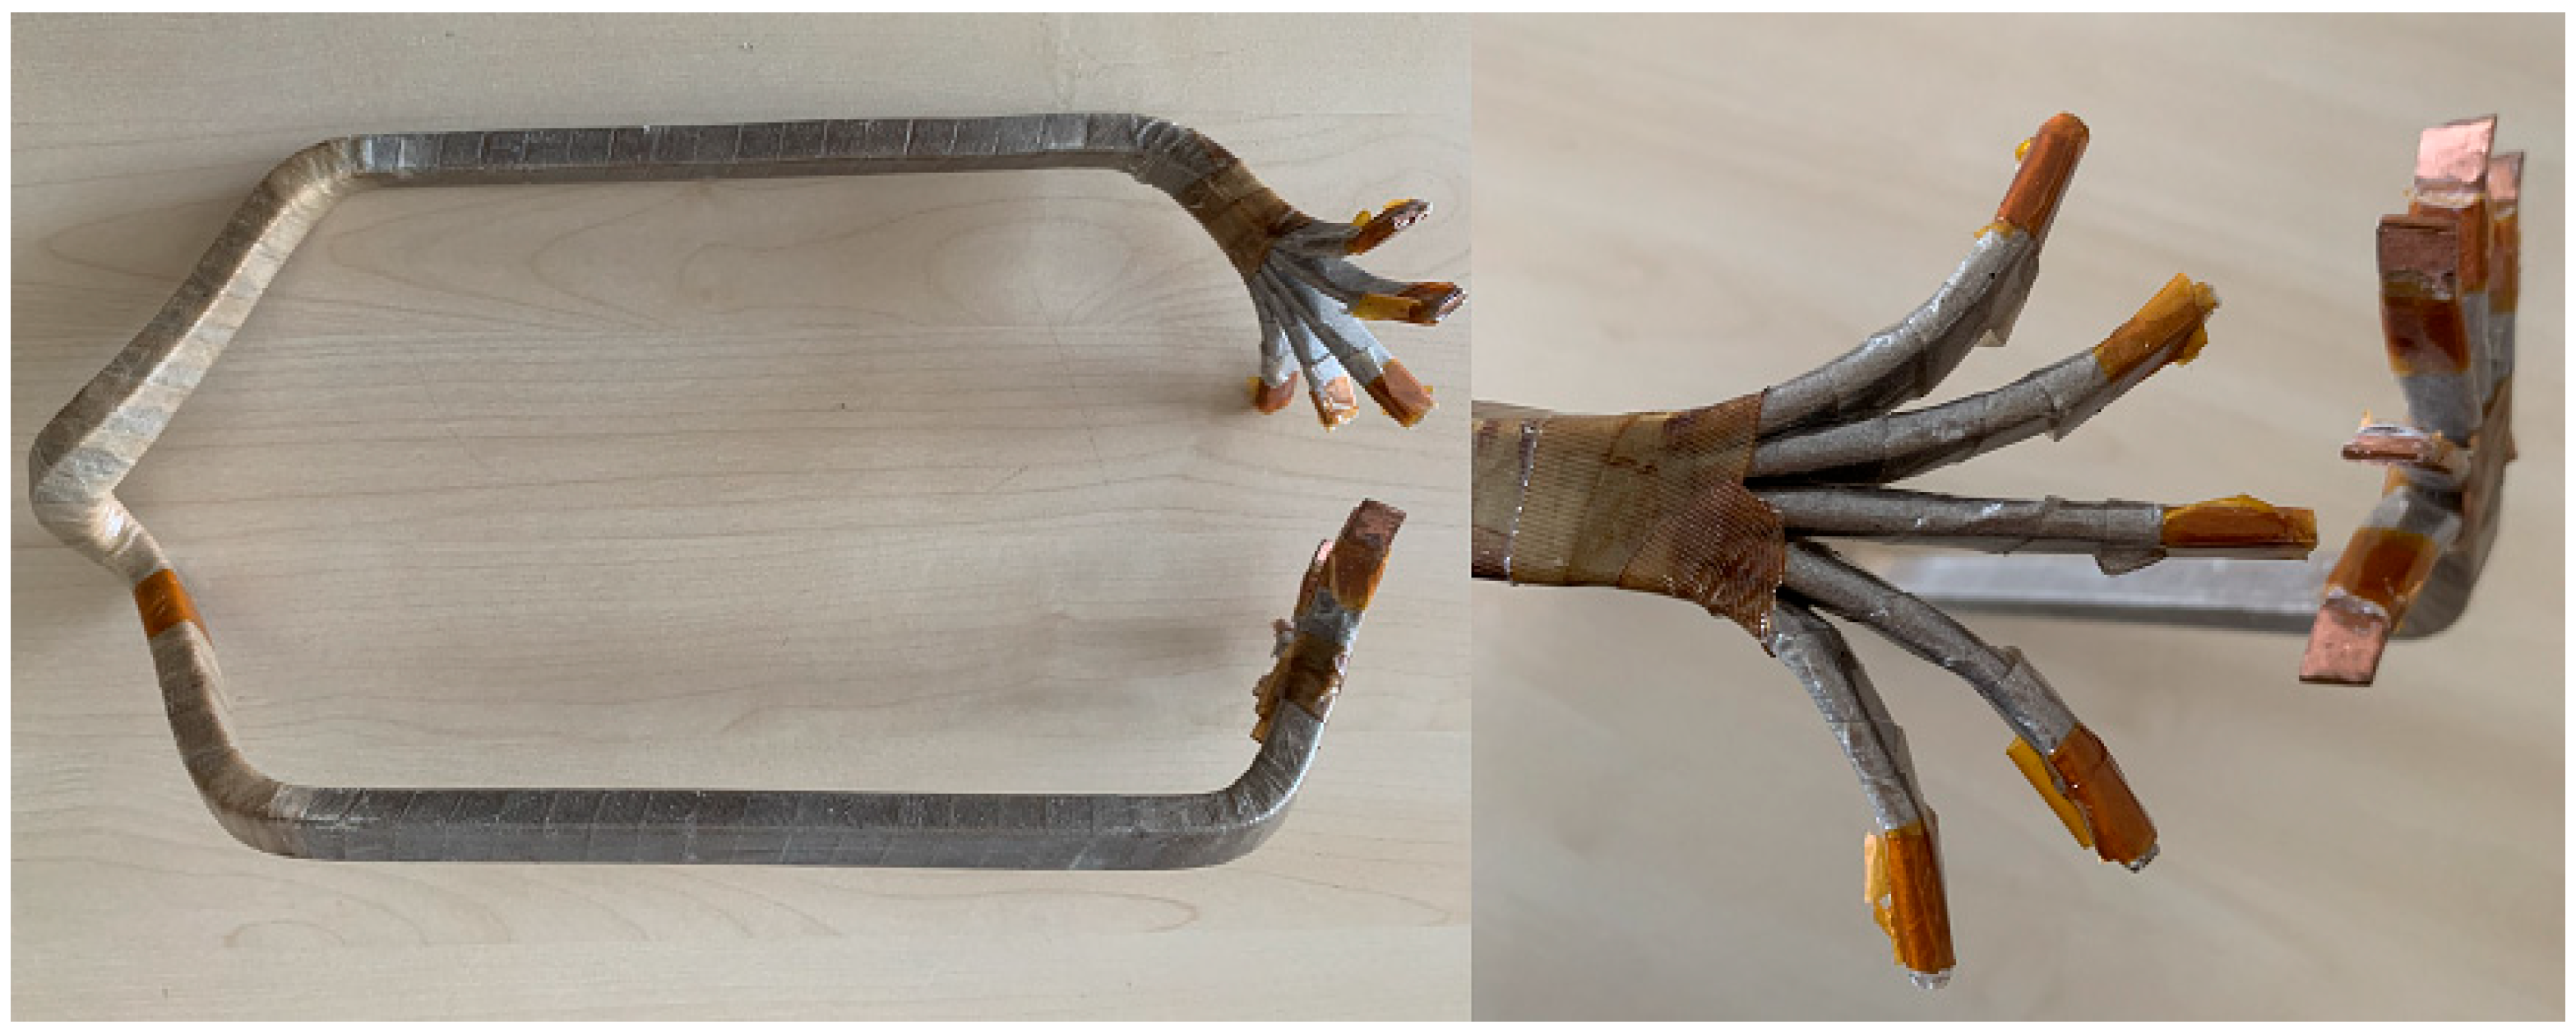
To overcome the limitations of standardized test samples, an alternative test sample was designed to replicate the practical conditions and stress experienced by turn insulation in high-voltage rotating machines. A coil segment directly sourced from the production line was selected as the test specimen. Modifications were made by removing the overhang portion and separating the individual strands to expose the turn insulation. This revised sample configuration accurately replicates real-world stress conditions, particularly in curved and mechanically formed winding regions. These samples were fabricated from coils, as illustrated in
Figure 2, and subsequently transformed into “test sample” specimens by removing the connecting ends and spreading the strands to achieve the desired configuration.
The turn insulation consists of thin, overlapping polyimide tapes that are vacuum pressure impregnated (VPI) with silicon-based resin and cured following standardized manufacturing procedures. Each sample comprises five insulated strands, encapsulated by the main insulation tape. The samples have a length of approximately 88 cm, a width of 1 cm, a copper bar thickness of 2.5 mm, and an insulation thickness of 0.2 mm. Additionally, the turn insulation incorporates an extra layer of Kapton tape, which enhances resistance to partial discharge (PD), thereby improving the overall insulation performance. The concept of “higher resistance” refers to a higher voltage endurance coefficient compared to non-PD-resistant materials. This PD resistance helps mitigate the treeing process caused by partial discharge activity [
33,
34], as evidenced by the values of (
).
2.2. Test Equipment and Setup
To evaluate the breakdown characteristics of turn insulation, accelerated aging was conducted using two types of high-voltage pulses.
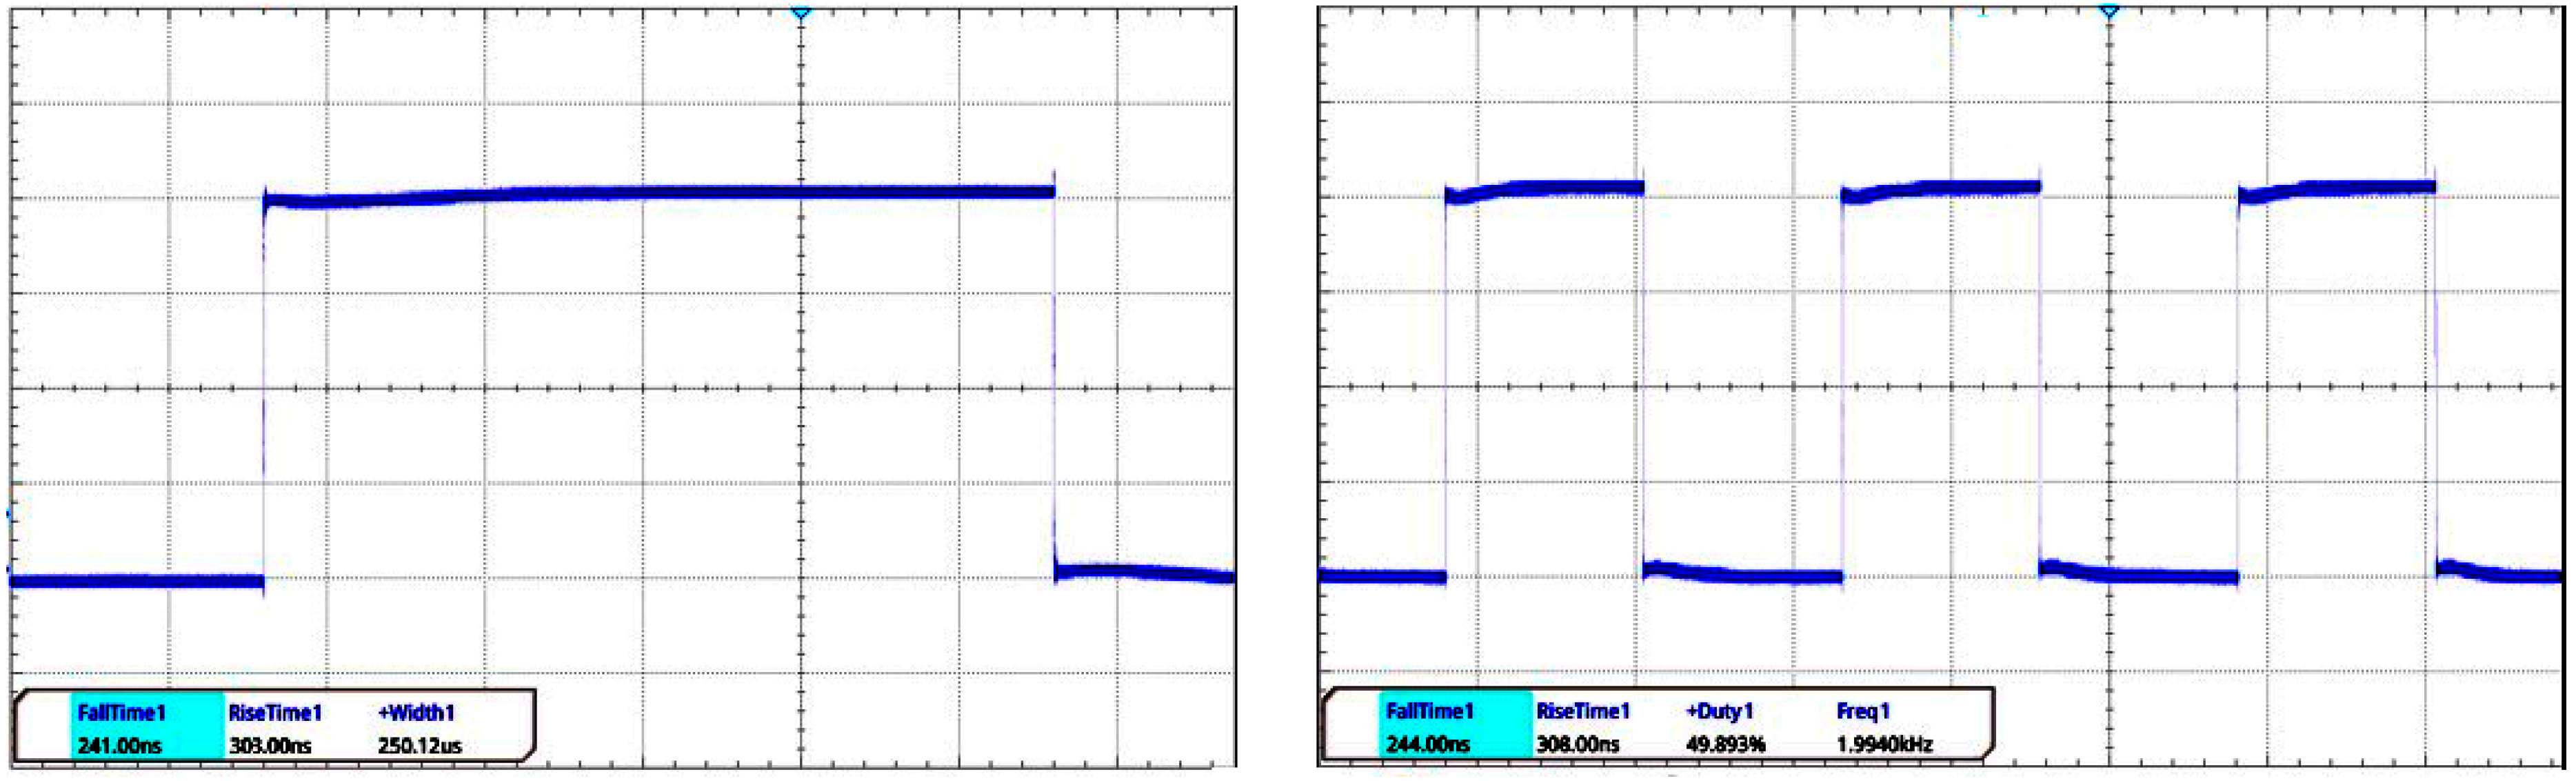
First Pulse Generator (DEI-PVX 4110 by Directed Energy Inc. (DEI), San Rafael, CA, USA): Both unipolar and bipolar voltage pulses could be provided. A built-in pulse counter records the total number of applied pulses during testing. The pulses were characterized by a rise time of 300 ns, pulse widths of 250 μs and 0.6 μs for both unipolar and bipolar configurations, a voltage slew rate (dv/dt) of approximately 12 kV/μs, and a repetition rate of 2 kHz (
Figure 3). Such pulses simulate both long-duration voltage stress and fast transients.
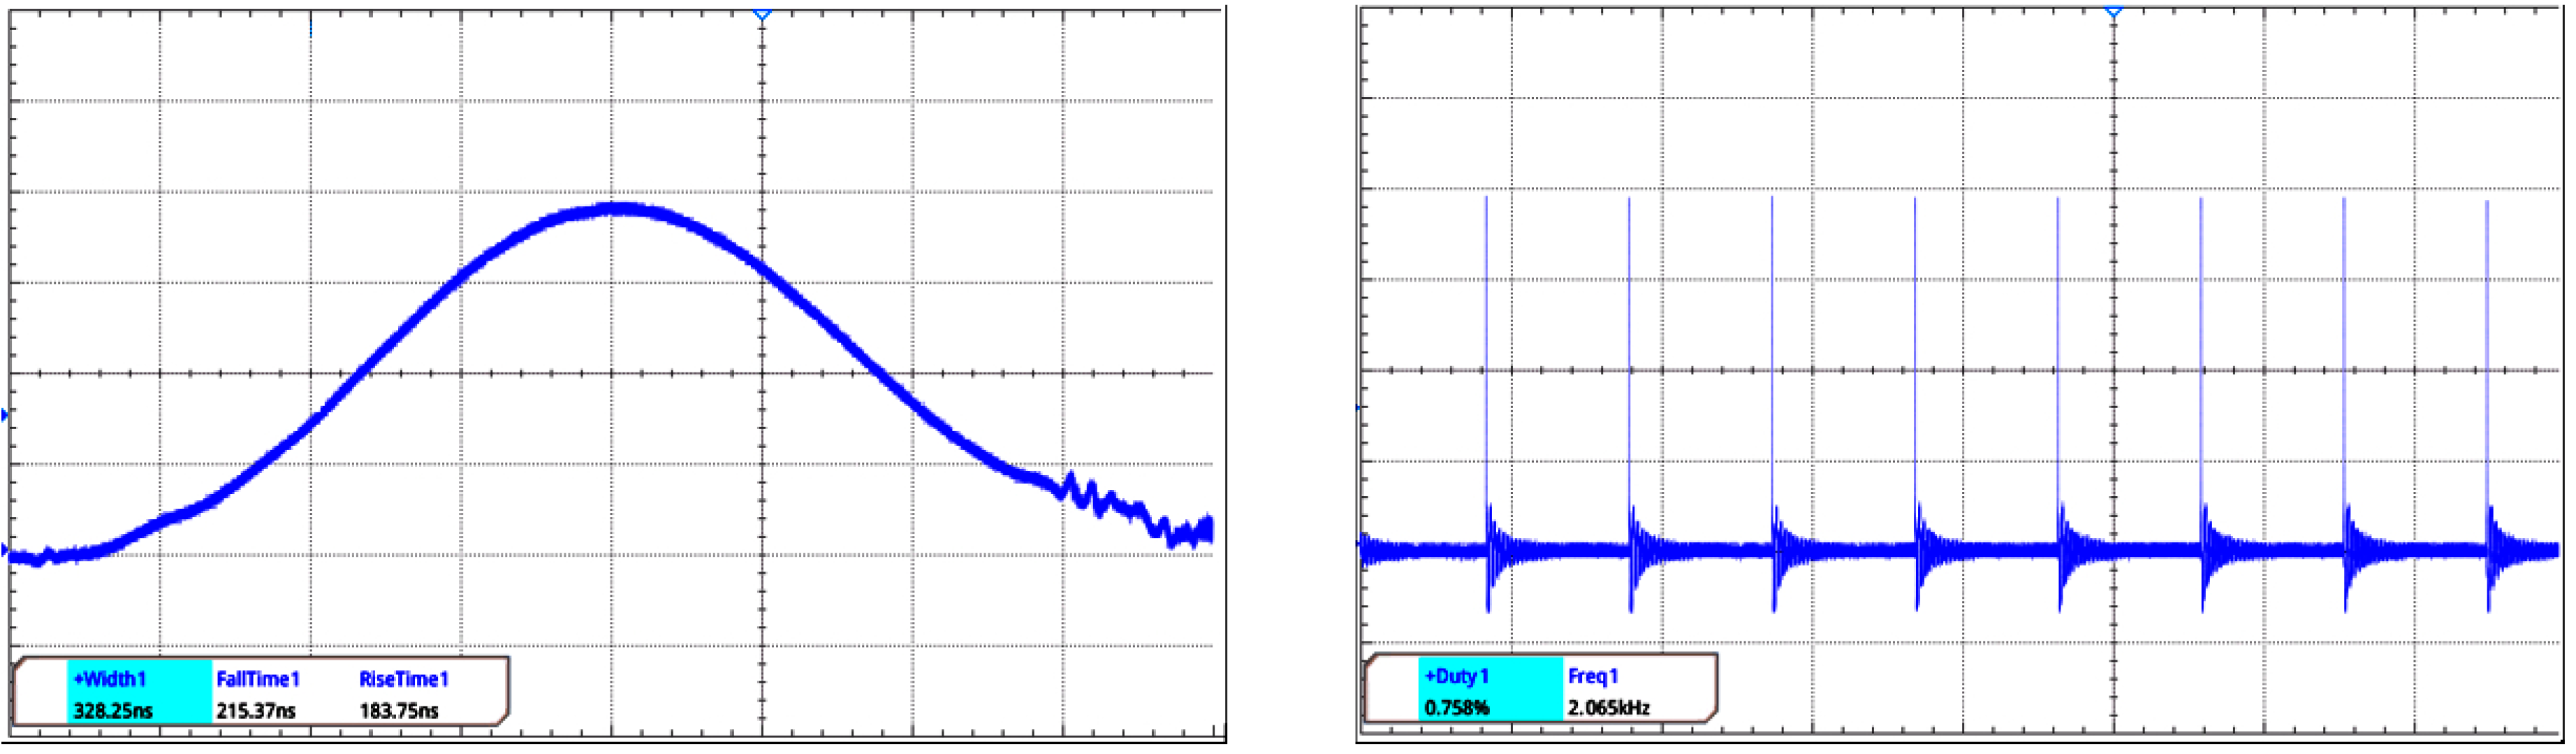
The second pulse generator (TPuls_3 by GBS Elektronik GmbH, Radeberg, Germany) provided only unipolar voltage pulses. Even here, a pulse counter records the time-to-failure. The pulses were characterized by a rise time of 185 ns, pulse widths of 0.33 μs at FWHM (Full Width at Half Maximum) and 0.6 μs at base width, repetition rates of 2 kHz and 5 kHz, and a voltage slew rate (dv/dt) of approximately 20 kV/μs (
Figure 4). Such pulses simulate fast transient over-voltage and represent the electrical stress imposed by high-speed switching events in modern pulse-width modulation (PWM)-driven inverter systems, which can impose significant dielectric stress on turn-to-turn insulation, particularly due to wave propagation phenomena and reflections along the winding that intensify local electric field strengths.
Pulse-types A, B, and D were generated using Generator I, while Pulse-type C (at 2 and 5 kHz) was produced with Generator II. Detailed waveform characteristics and test conditions for each pulse type are summarized in
Table 1. The application of voltage pulses with varying pulse widths in combination with power-frequency sinusoidal voltages enables a thorough evaluation of turn insulation performance under realistic and accelerated stress conditions. The short-duration pulses (0.33 µs and 0.6 µs) replicate inverter-induced fast transients, while the longer pulse (250 µs) simulates sustained voltage stress. When combined with a 50 Hz sinusoidal waveform, this methodology effectively reproduces the operational environment of converter-fed machines.
Additionally, the Partial Discharge Inception Voltage (PDIV) was measured under 50 Hz conditions in accordance with the related standard [
35]. For all tested samples, the average value of PDIV was determined to be approximately 1.7 kV (±20%). The test voltages applied for the estimation of lifetime curves ranged from 1.8 to 2.7 times the measured PDIV (3 to 4.5 kV). Therefore, it can be assumed that all breakdown events occur after the onset of partial discharge activity. This testing approach aligns with the expected behavior of Type II insulation systems, which are designed to withstand such conditions.
3. Results and Discussion
The statistical analysis in this study is limited by the small number of failure events—usually six or sometimes as low as four, as shown in
Table 1—due to the high cost and limited availability of test samples. Despite the reduced dataset, the results remain statistically robust, falling within the 90% confidence interval.
3.1. Impact of Frequency
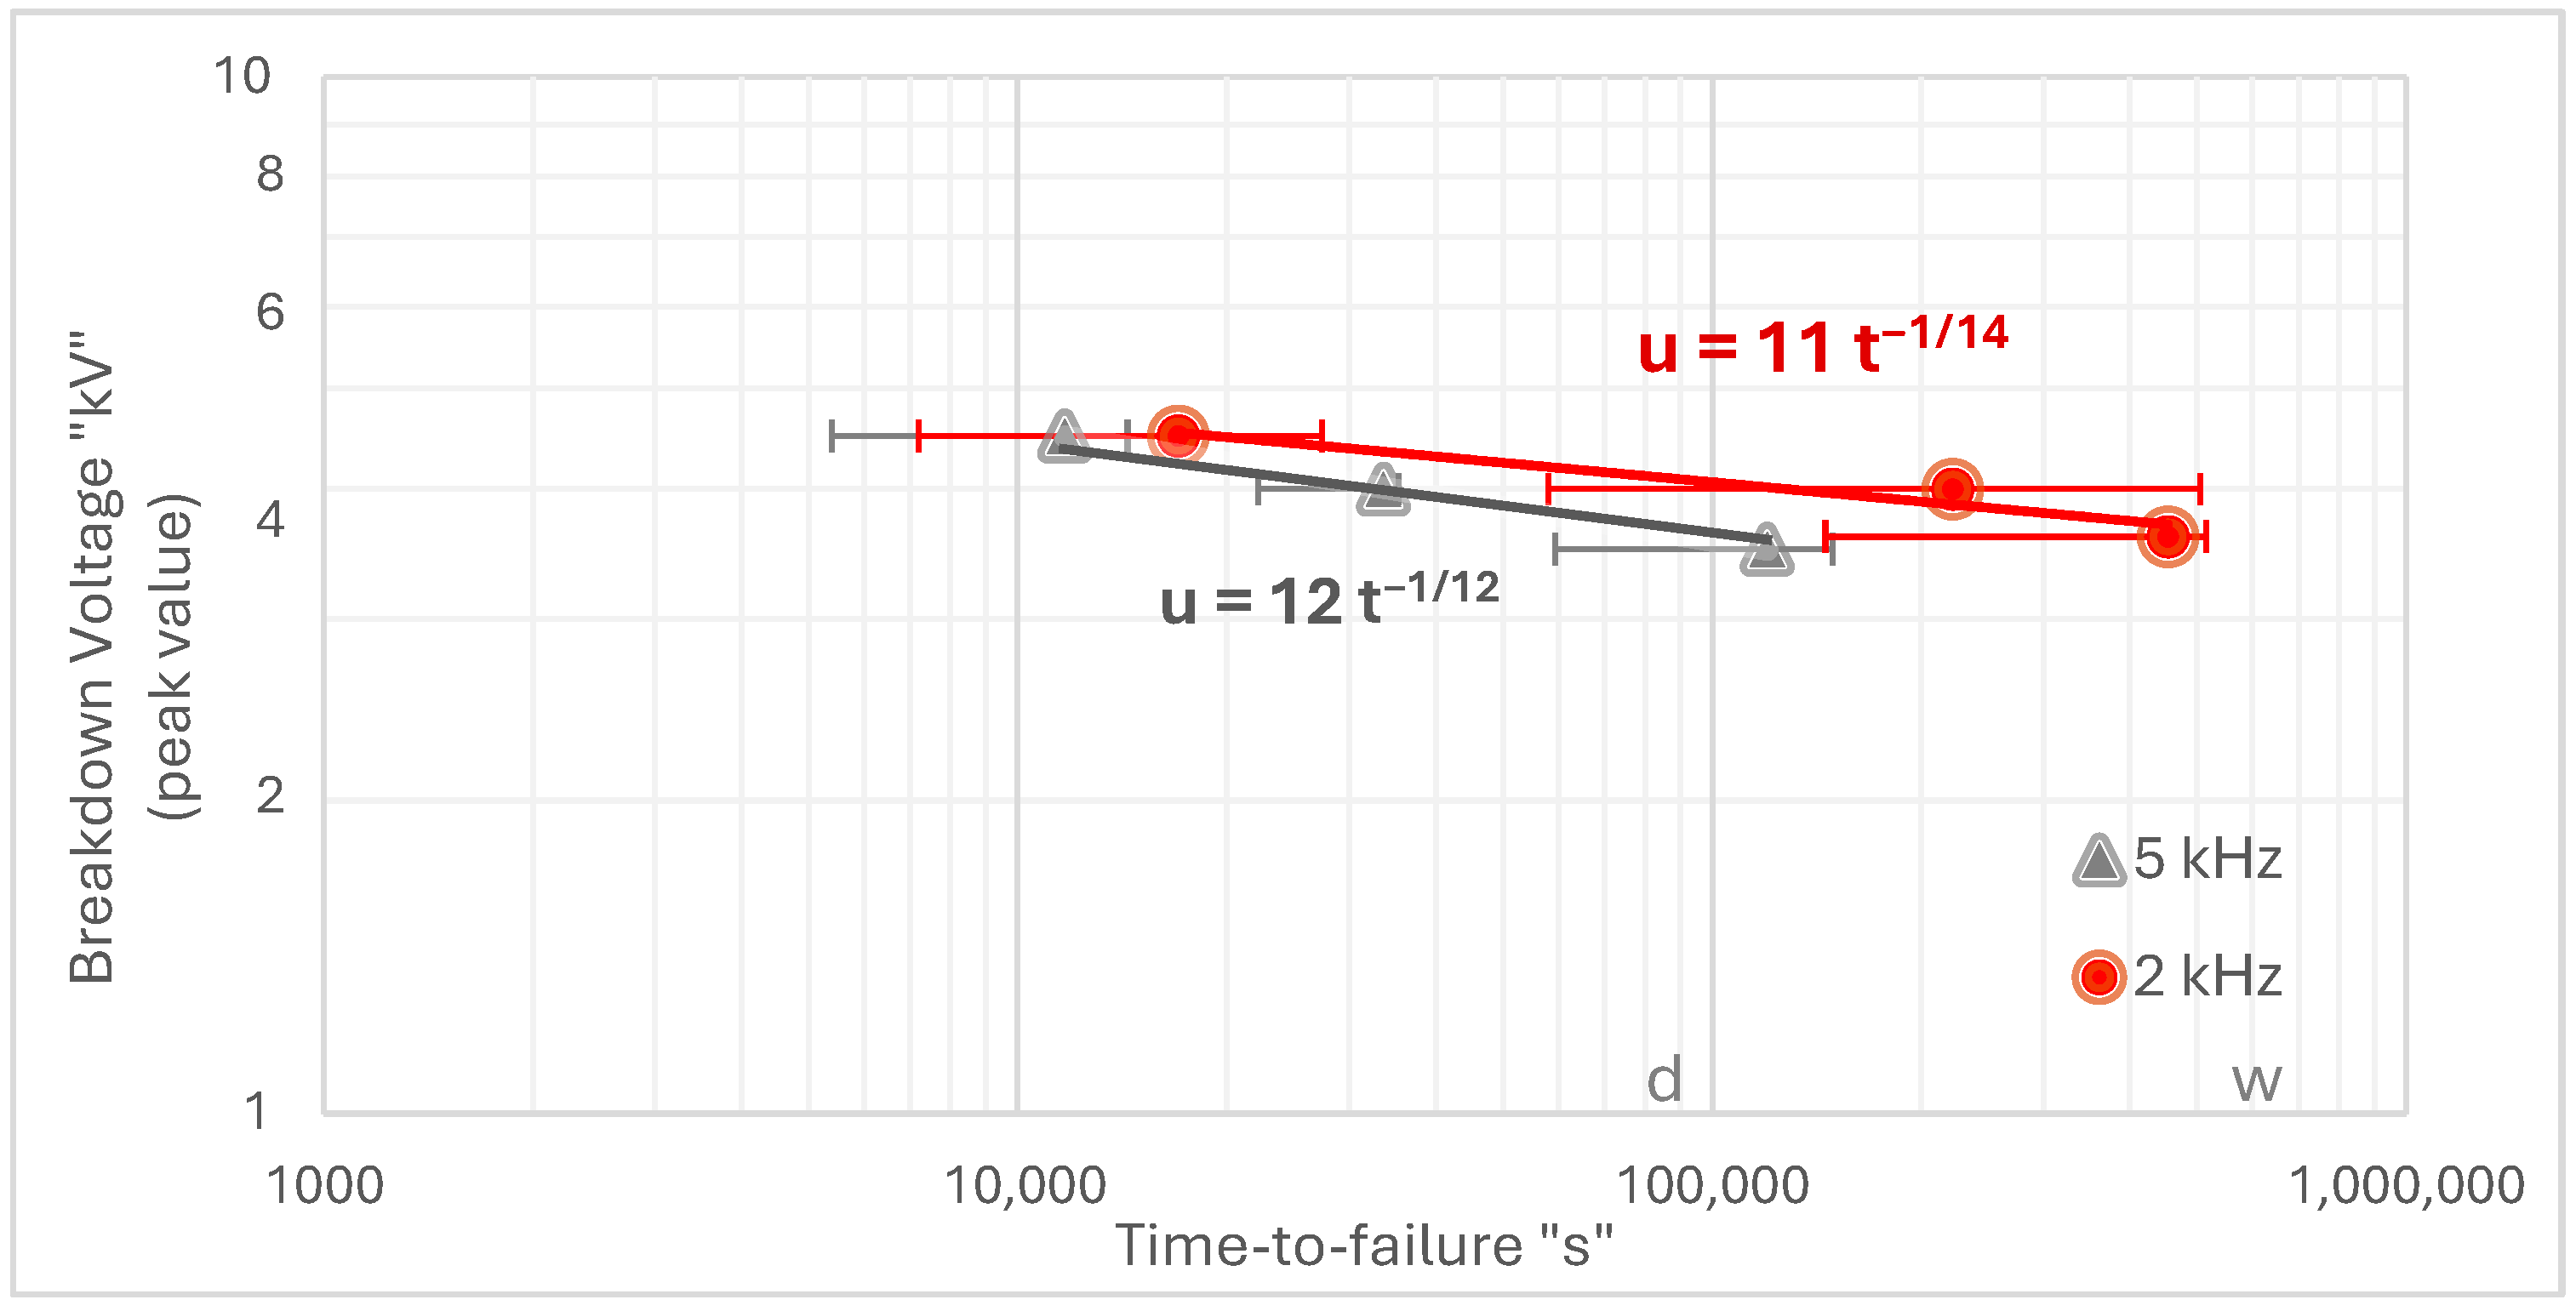
The breakdown voltage dependent on time-to-failure is different for 5 kHz and 2 kHz using Pulse C (
Figure 5). A significant decrease was observed at a frequency of 5 kHz, indicating a faster progression to failure. This highlights the accelerated degradation of insulation under higher-frequency stress conditions, resulting in a quicker onset of failure compared to lower frequencies. The results were obtained at a pulse width of 0.33 microseconds and a voltage rise time of 185 ns, tested at frequencies of 2 kHz and 5 kHz.
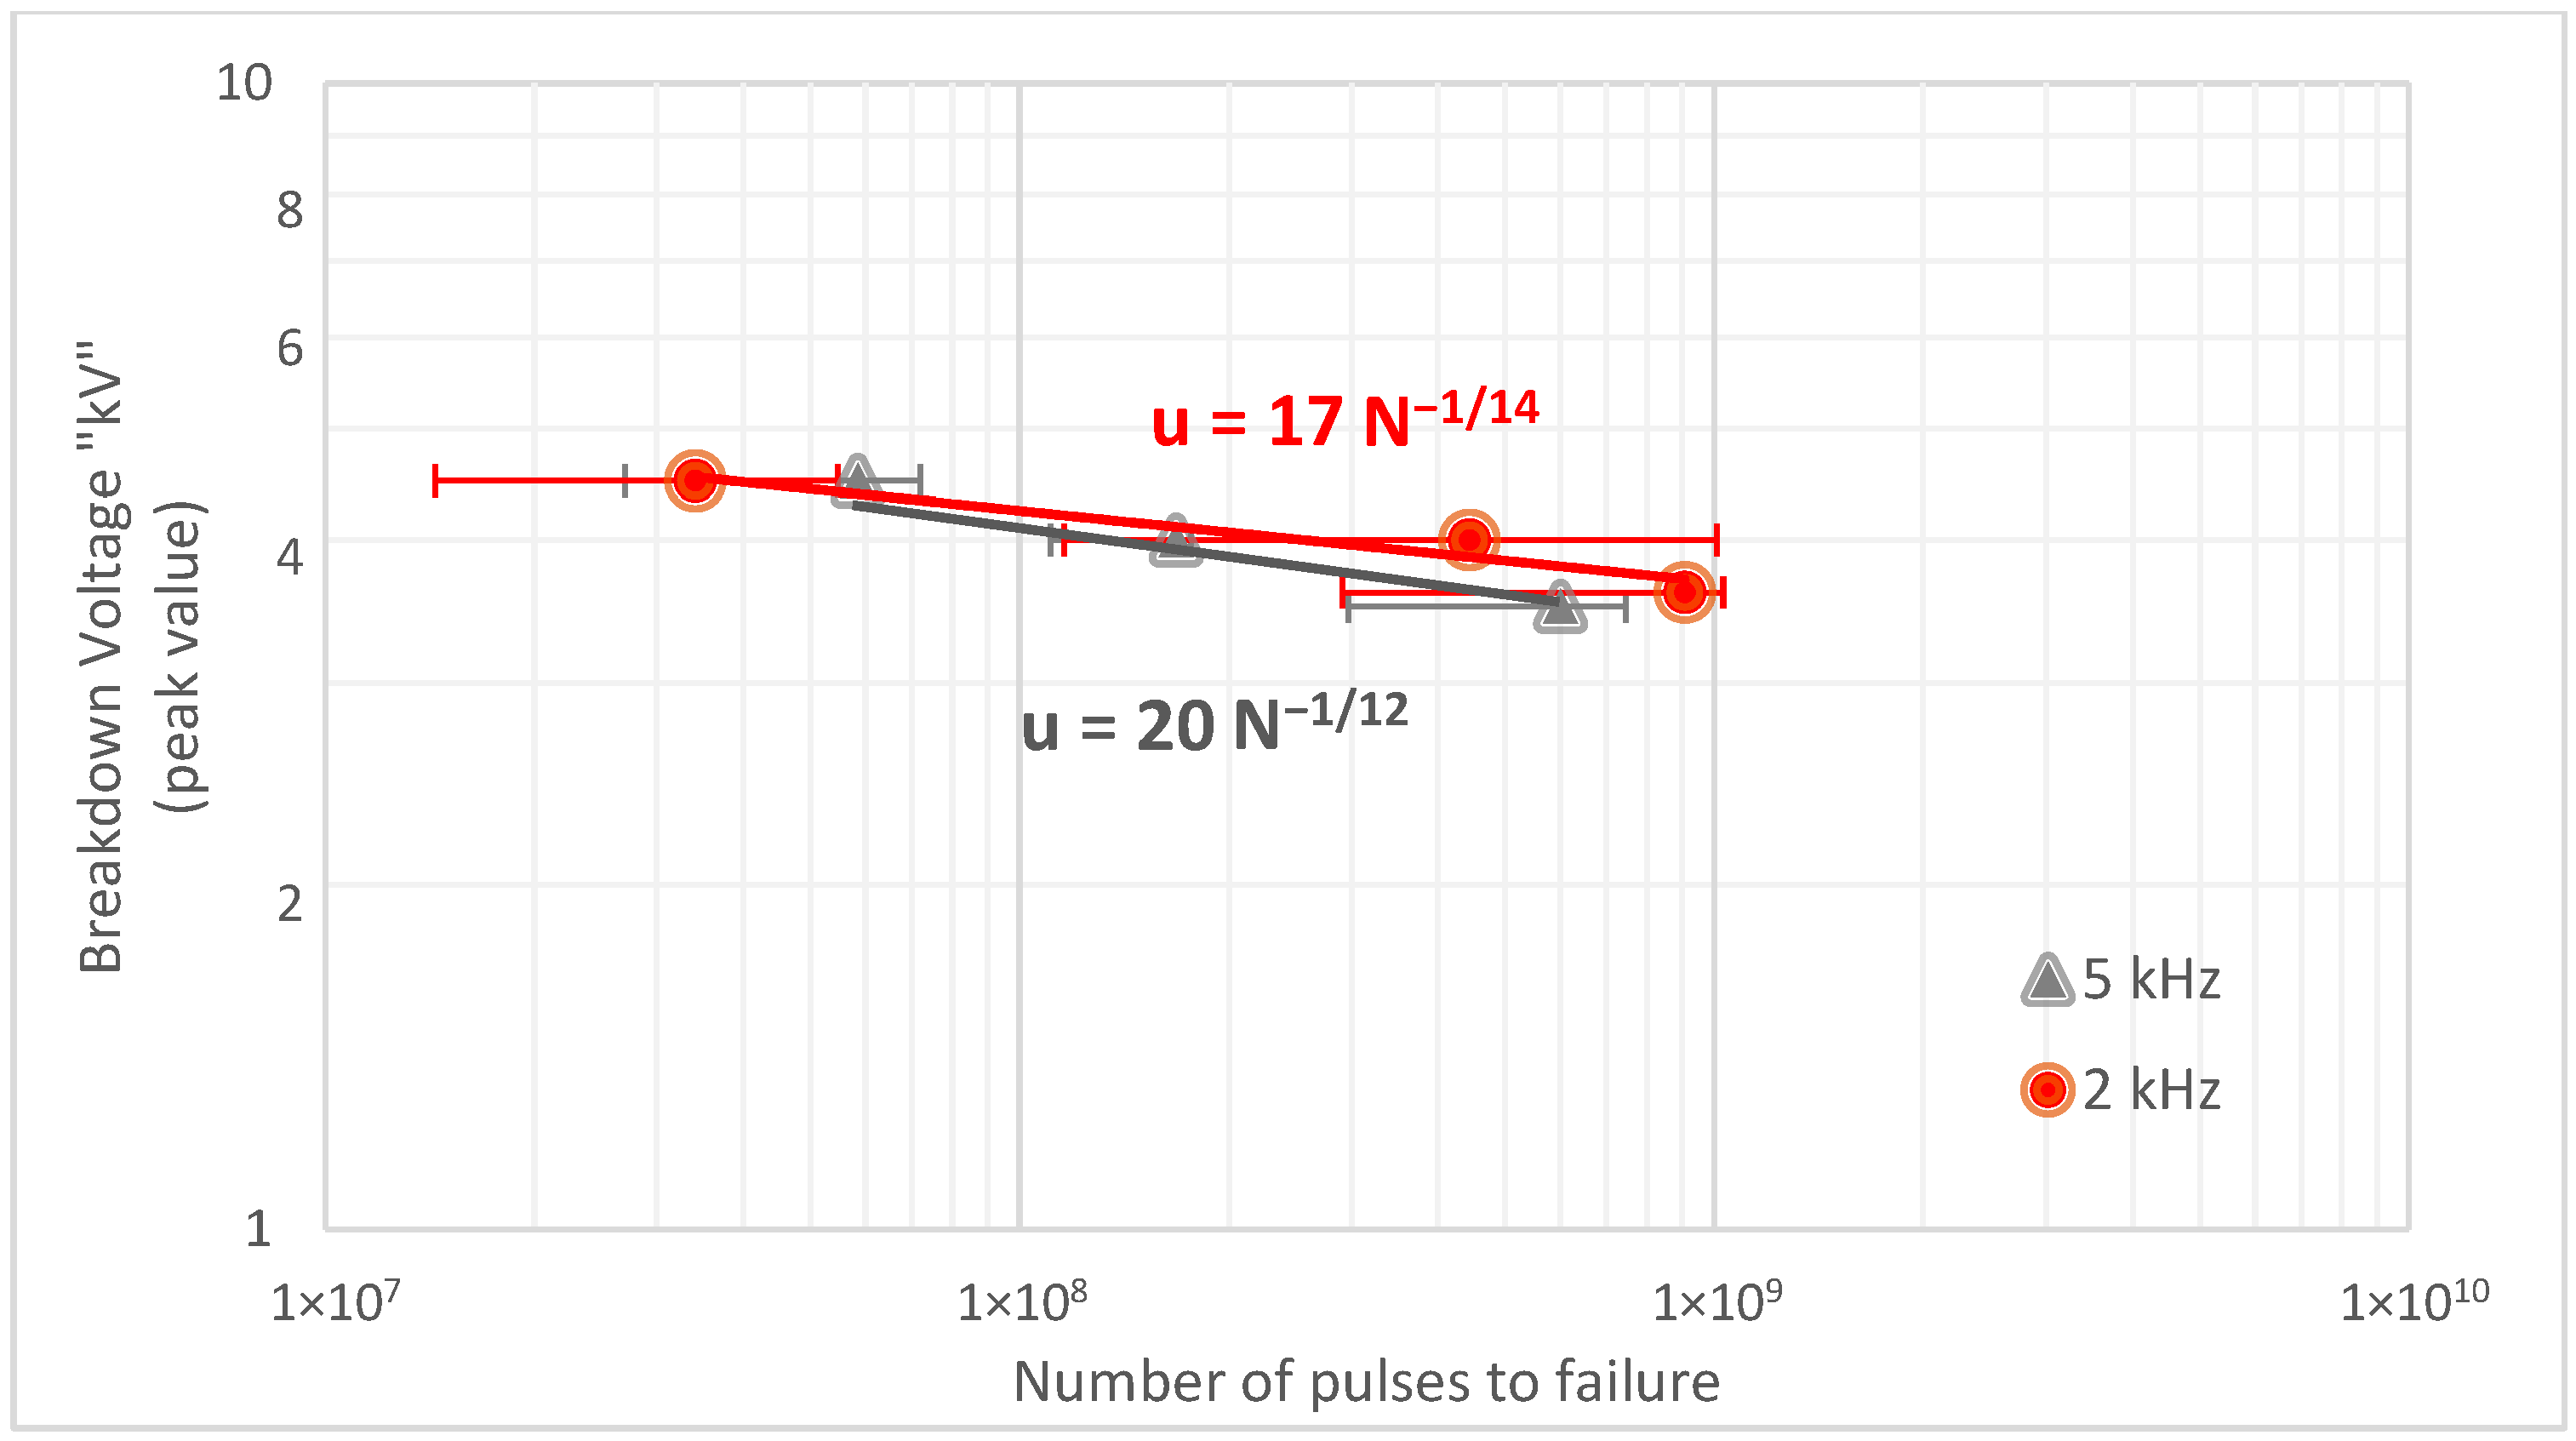
When ignoring the frequency differences by using the number of pulses to failure instead of time-to-failure, where frequency serves as a fundamental parameter, the resulting curves exhibit significant overlaps, as shown in
Figure 6. This overlap suggests that the aging process remains nearly identical under different frequency conditions, indicating that frequency primarily influences the rate of degradation rather than altering the underlying aging mechanism represented by the lifetime exponent (
). Based on these findings, it can be argued that the frequency of pulses does not directly influence electrical aging but accelerates degradation at higher frequencies, leading to faster failure.
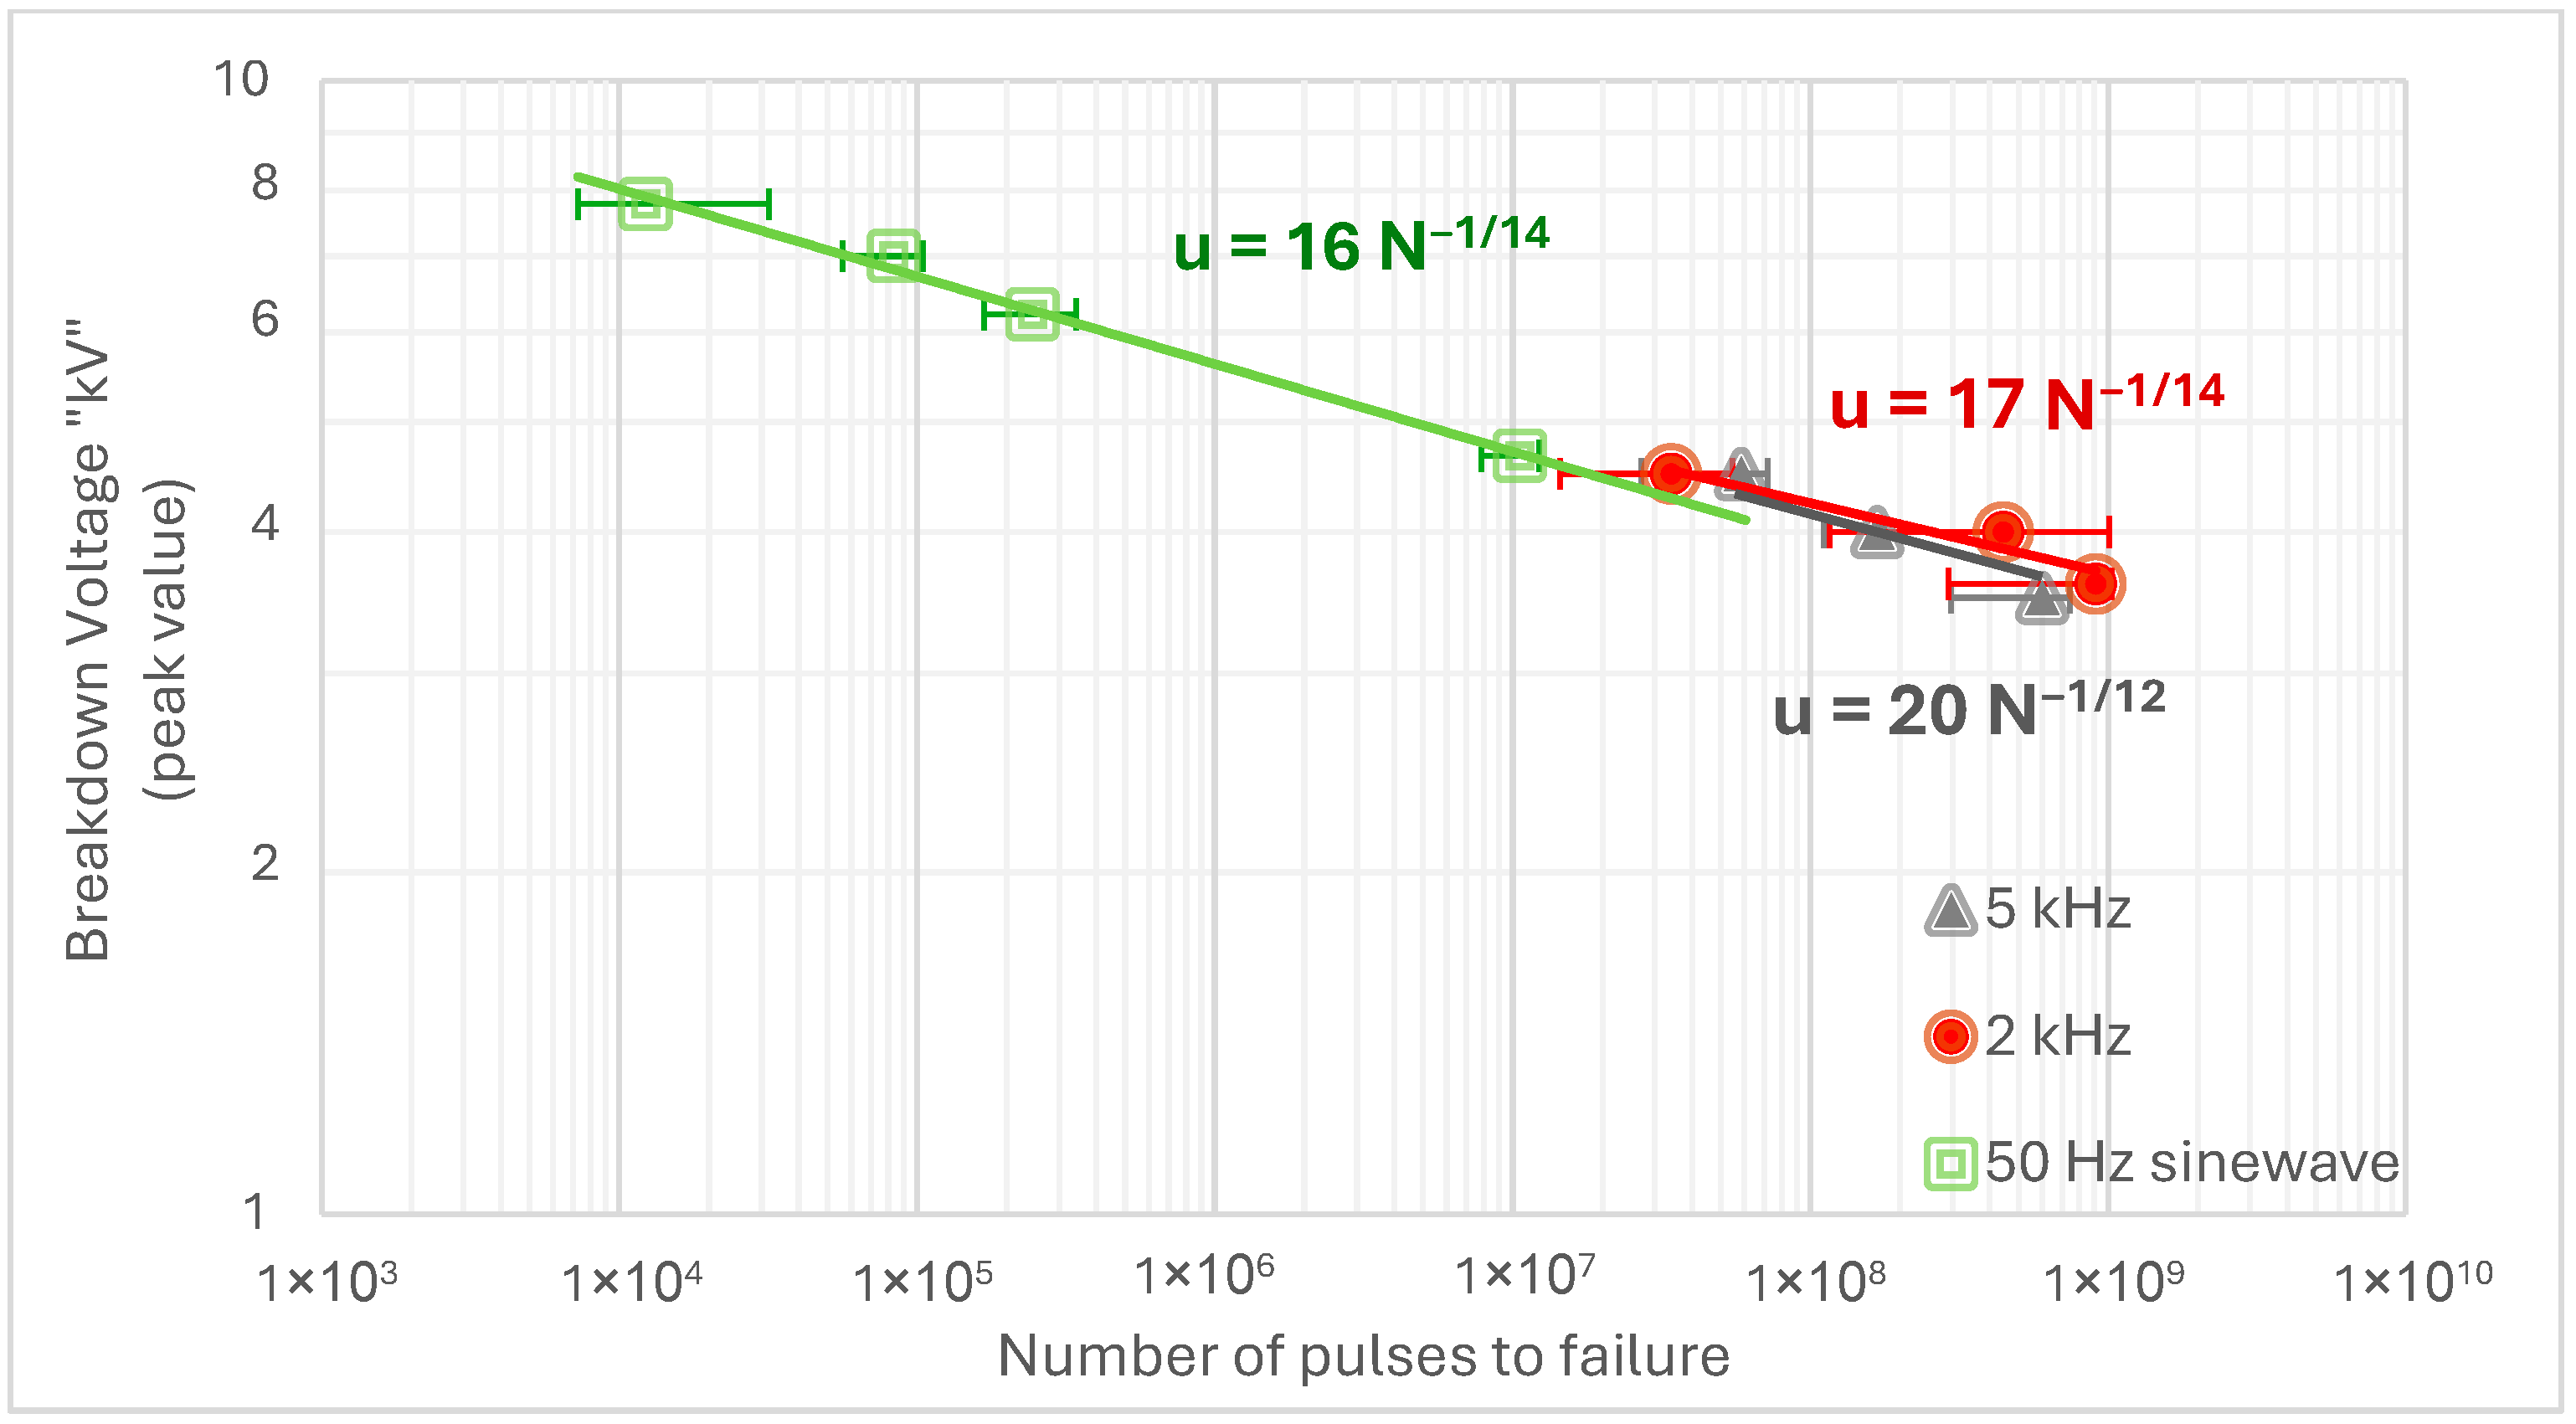
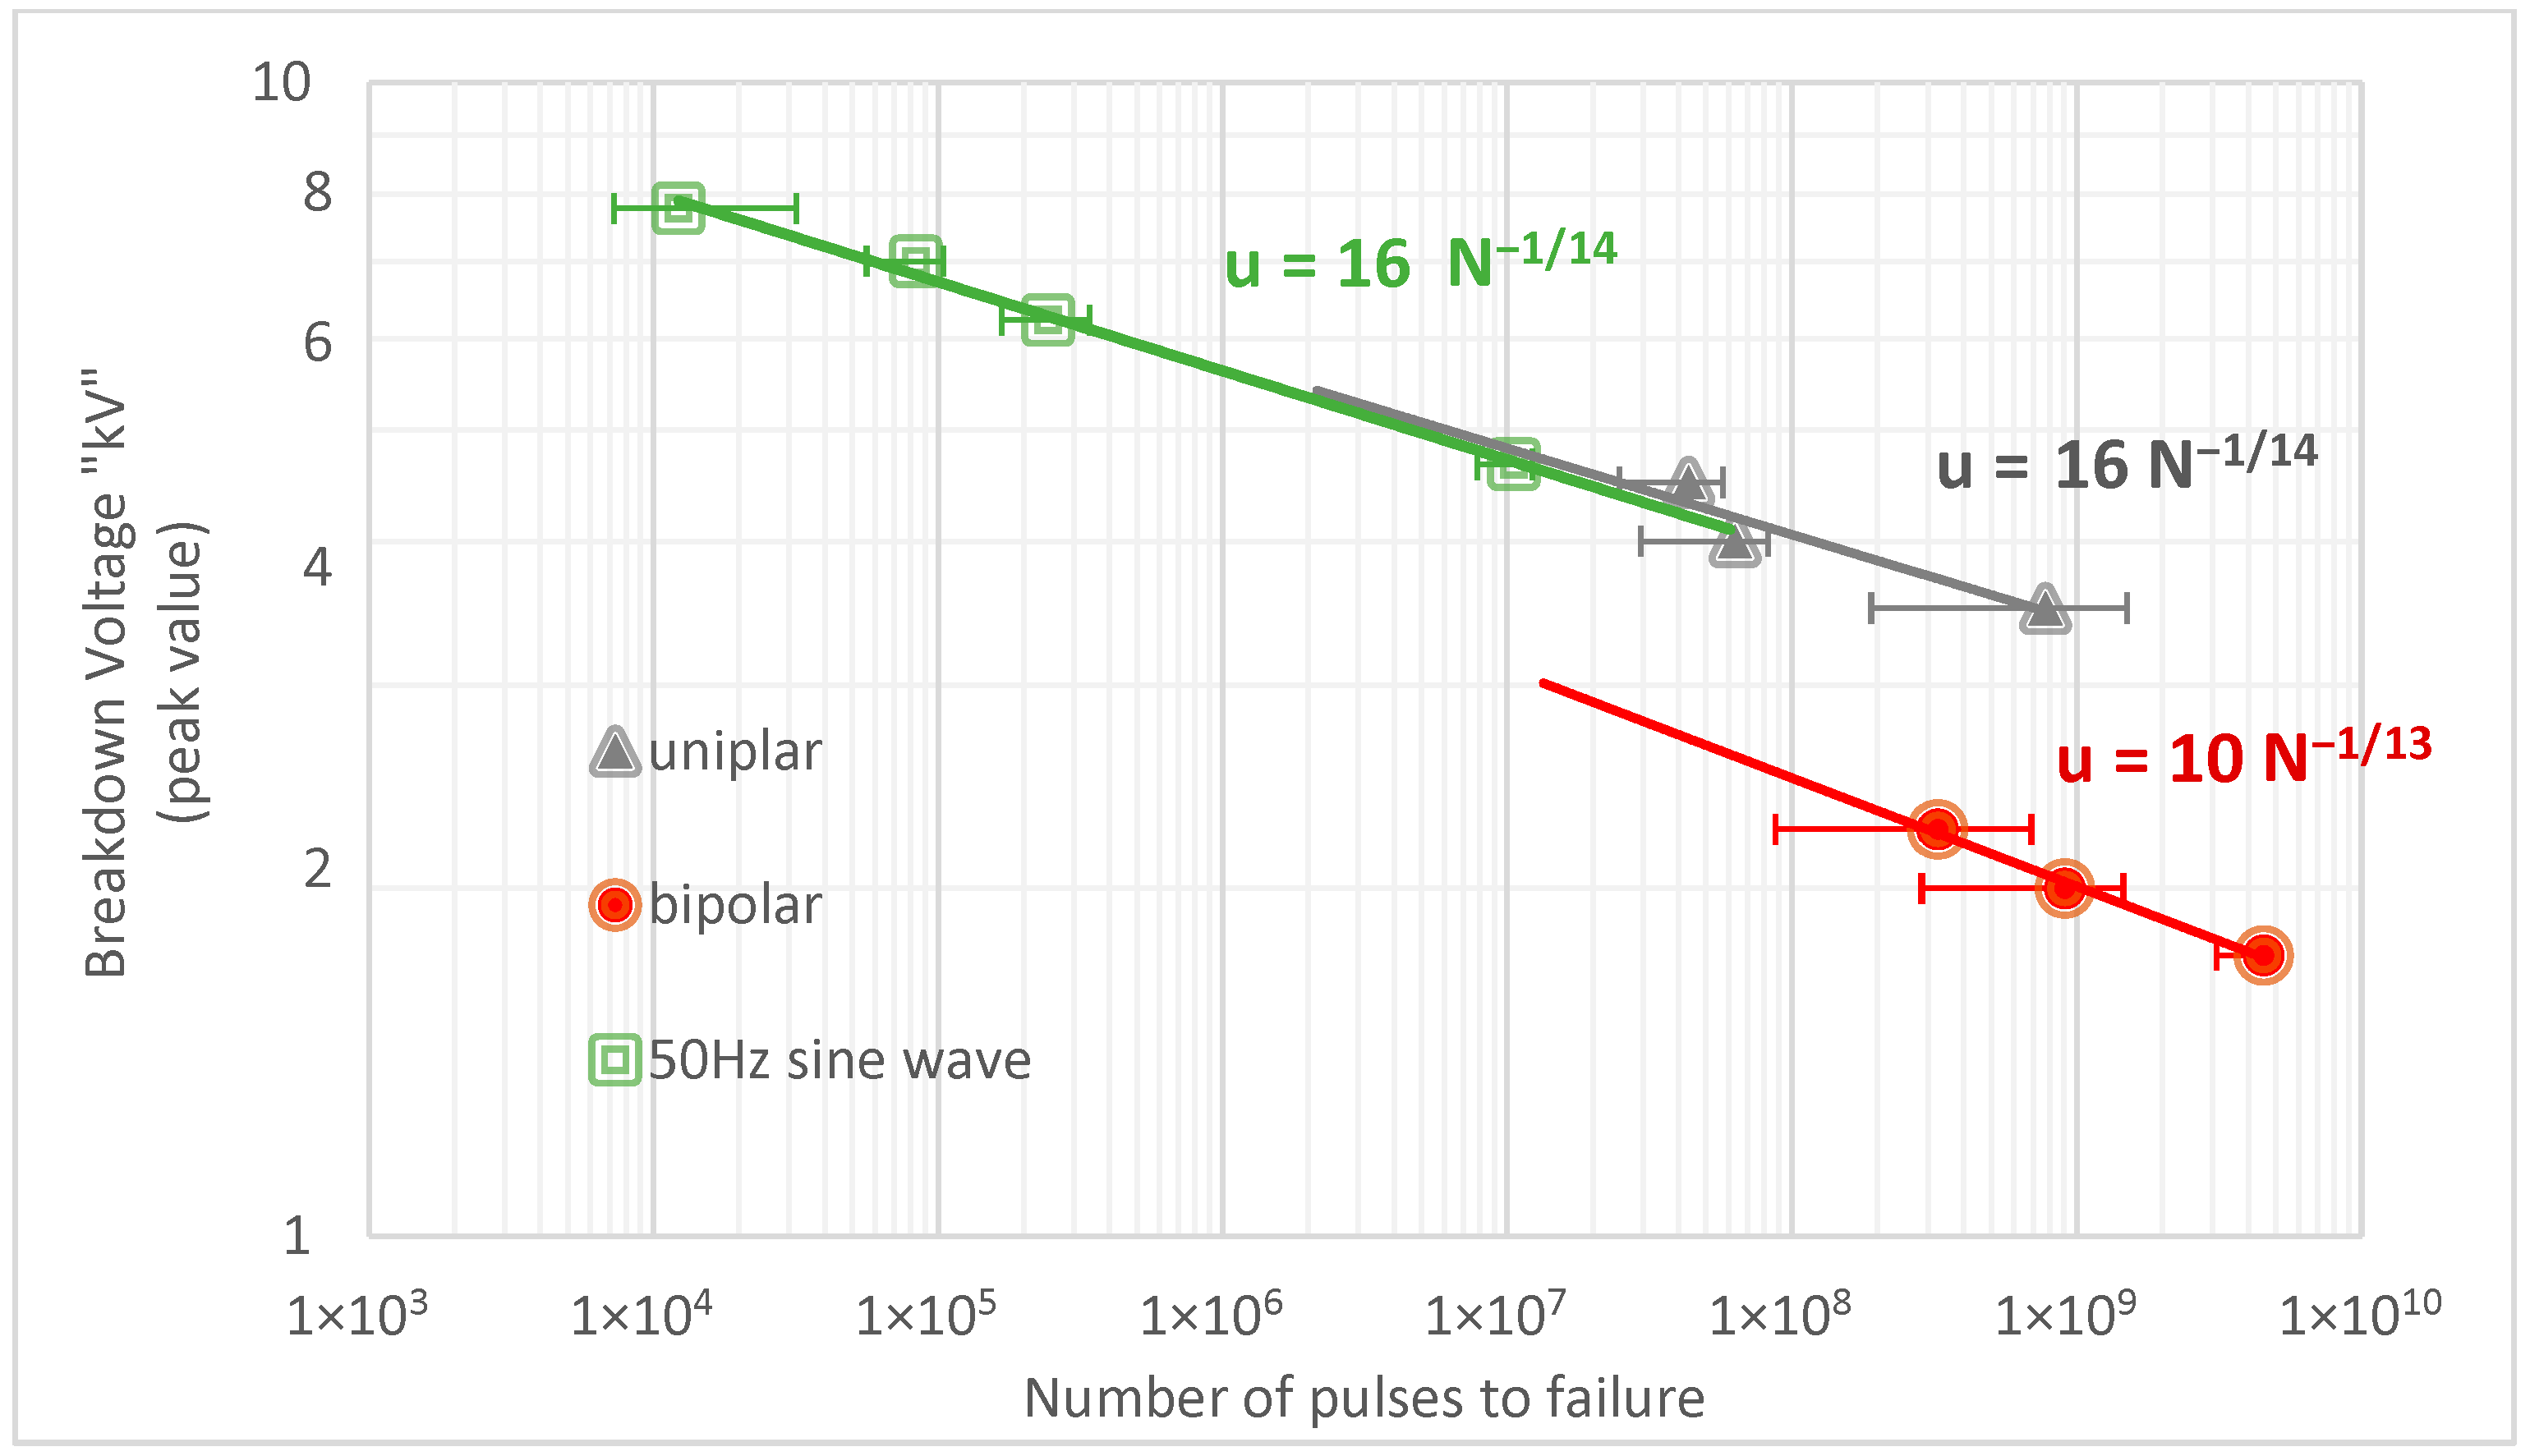
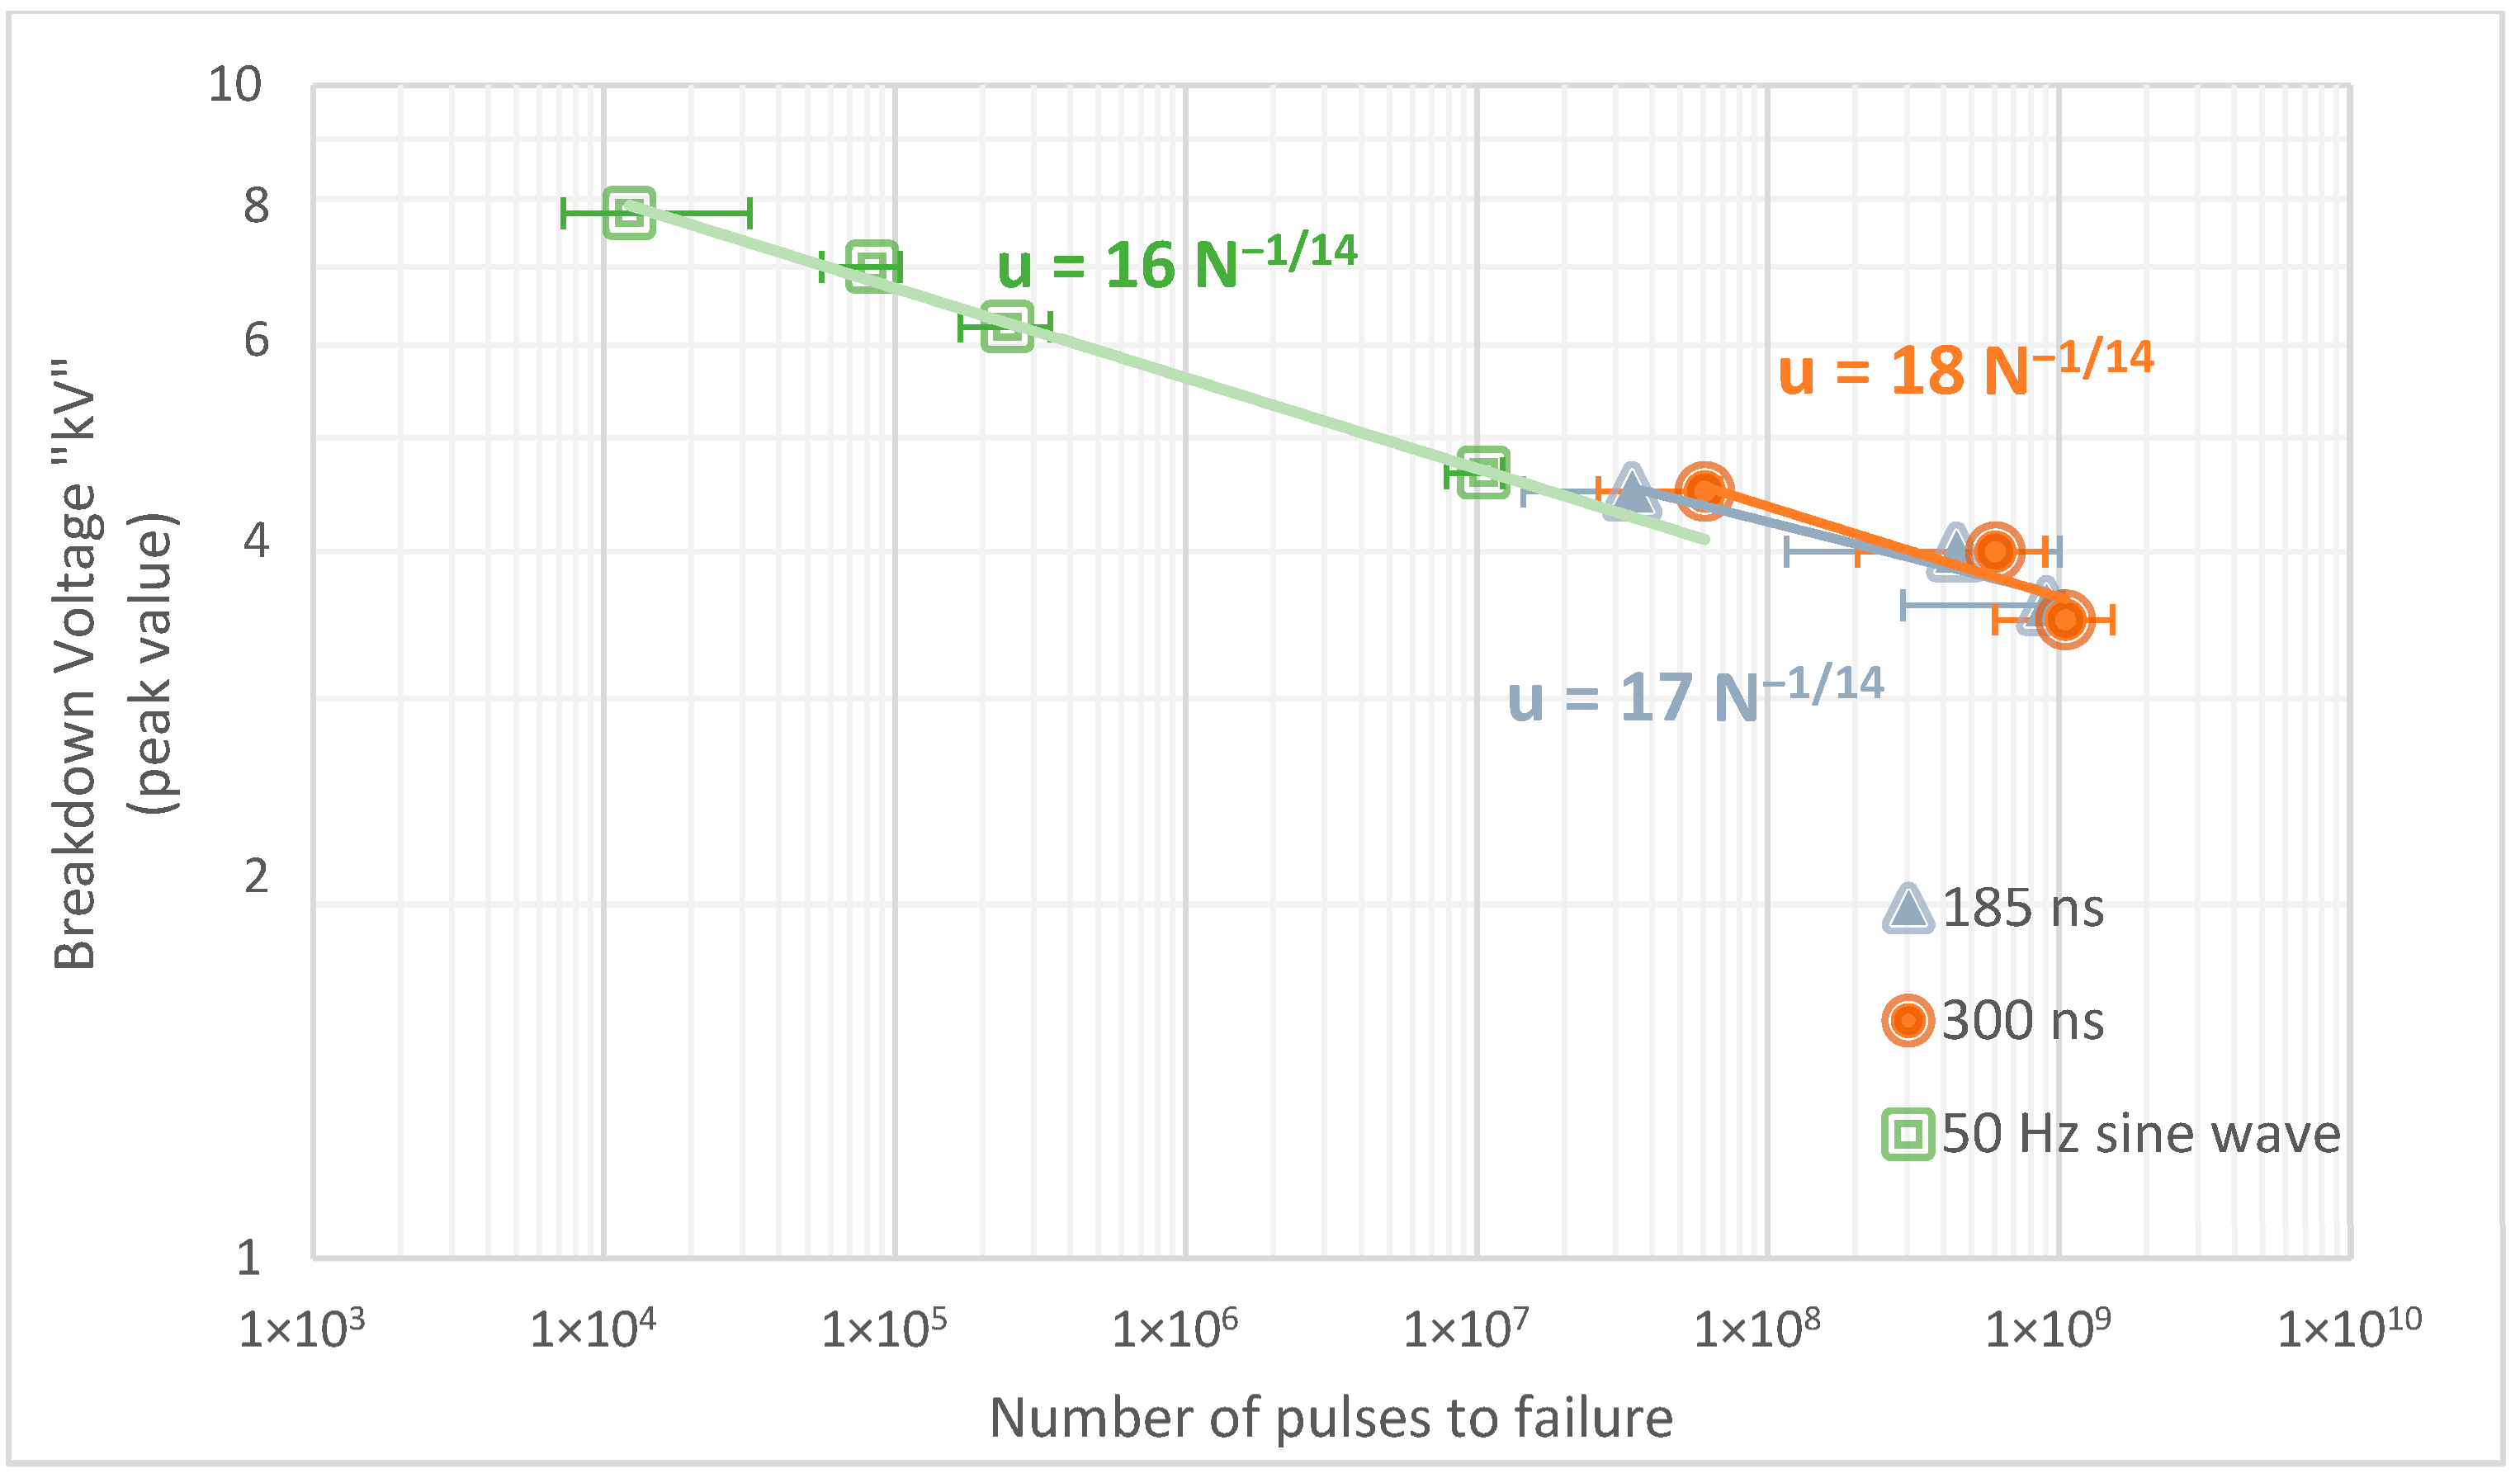
To further investigate, the sinusoidal power frequency waveform is used as a reference to determine whether it can effectively evaluate the lifetime of rotating machines under higher slew rates of (dv/dt). This approach aims to evaluate how well the power frequency waveform can simulate stress conditions involving rapid voltage changes. However, when normalizing the frequency by using the number of pulses to failure instead of time-to-failure, it is suggested that one half-cycle of a 50 Hz sinusoidal power frequency waveform corresponds to a single pulse. Thus, each full period comprises two pulses, meaning (
) equals two in this case, as shown in
Figure 7.
A correlation between the sinusoidal and pulsed waveforms is observed, indicating that despite the differences in waveform type, the number of pulses to failure remains nearly identical. This suggests that the aging processes for both waveforms are comparable, as illustrated in
Figure 8. Therefore, it is feasible to use power frequency testing as a baseline testing method. This approach becomes robust when the lifetime assessment is based on the number of pulses to failure rather than time-to-failure, as it inherently incorporates the effect of frequency variation. Additionally, the number of pulses experienced by the insulation under sinusoidal excitation is slightly lower compared to unipolar pulse waveforms. This difference arises because the electrical stress duration per cycle in unipolar pulsed waveforms is significantly shorter than in sinusoidal waveforms, leading to slower degradation rates, as illustrated in
Figure 7.
To validate these findings, the impact of pulse polarity on insulation behavior was investigated. Differentiating between bipolar and unipolar electrical stress is crucial for understanding their distinct effects. In the present study, the 2 kHz and 5 kHz pulse waveforms are unipolar, whereas the sinusoidal waveform represents a bipolar excitation. Under the assumption that the number of pulses to failure remains constant at a given voltage level under different waveforms and that the aging process adheres to the same degradation exponent (
) and constant (
K) in Equation (2), the relationship between the time-to-failure at different frequencies can be evaluated as follows:
If
=
(similar polarity), this approach yields a relationship that is mathematically identical to the equation defined in the related standard for sinusoidal waveforms [
6]. This supports the validity of using frequency normalization to compare lifetime performance across different waveform types. Therefore, Equation (4) can be effectively employed to estimate the time-to-failure of turn insulation subjected to sinusoidal voltage testing. This application is valid under the assumption of consistent degradation behavior. Accordingly, it offers a reliable approach for extrapolating insulation lifetime based on the number of pulses to failure.
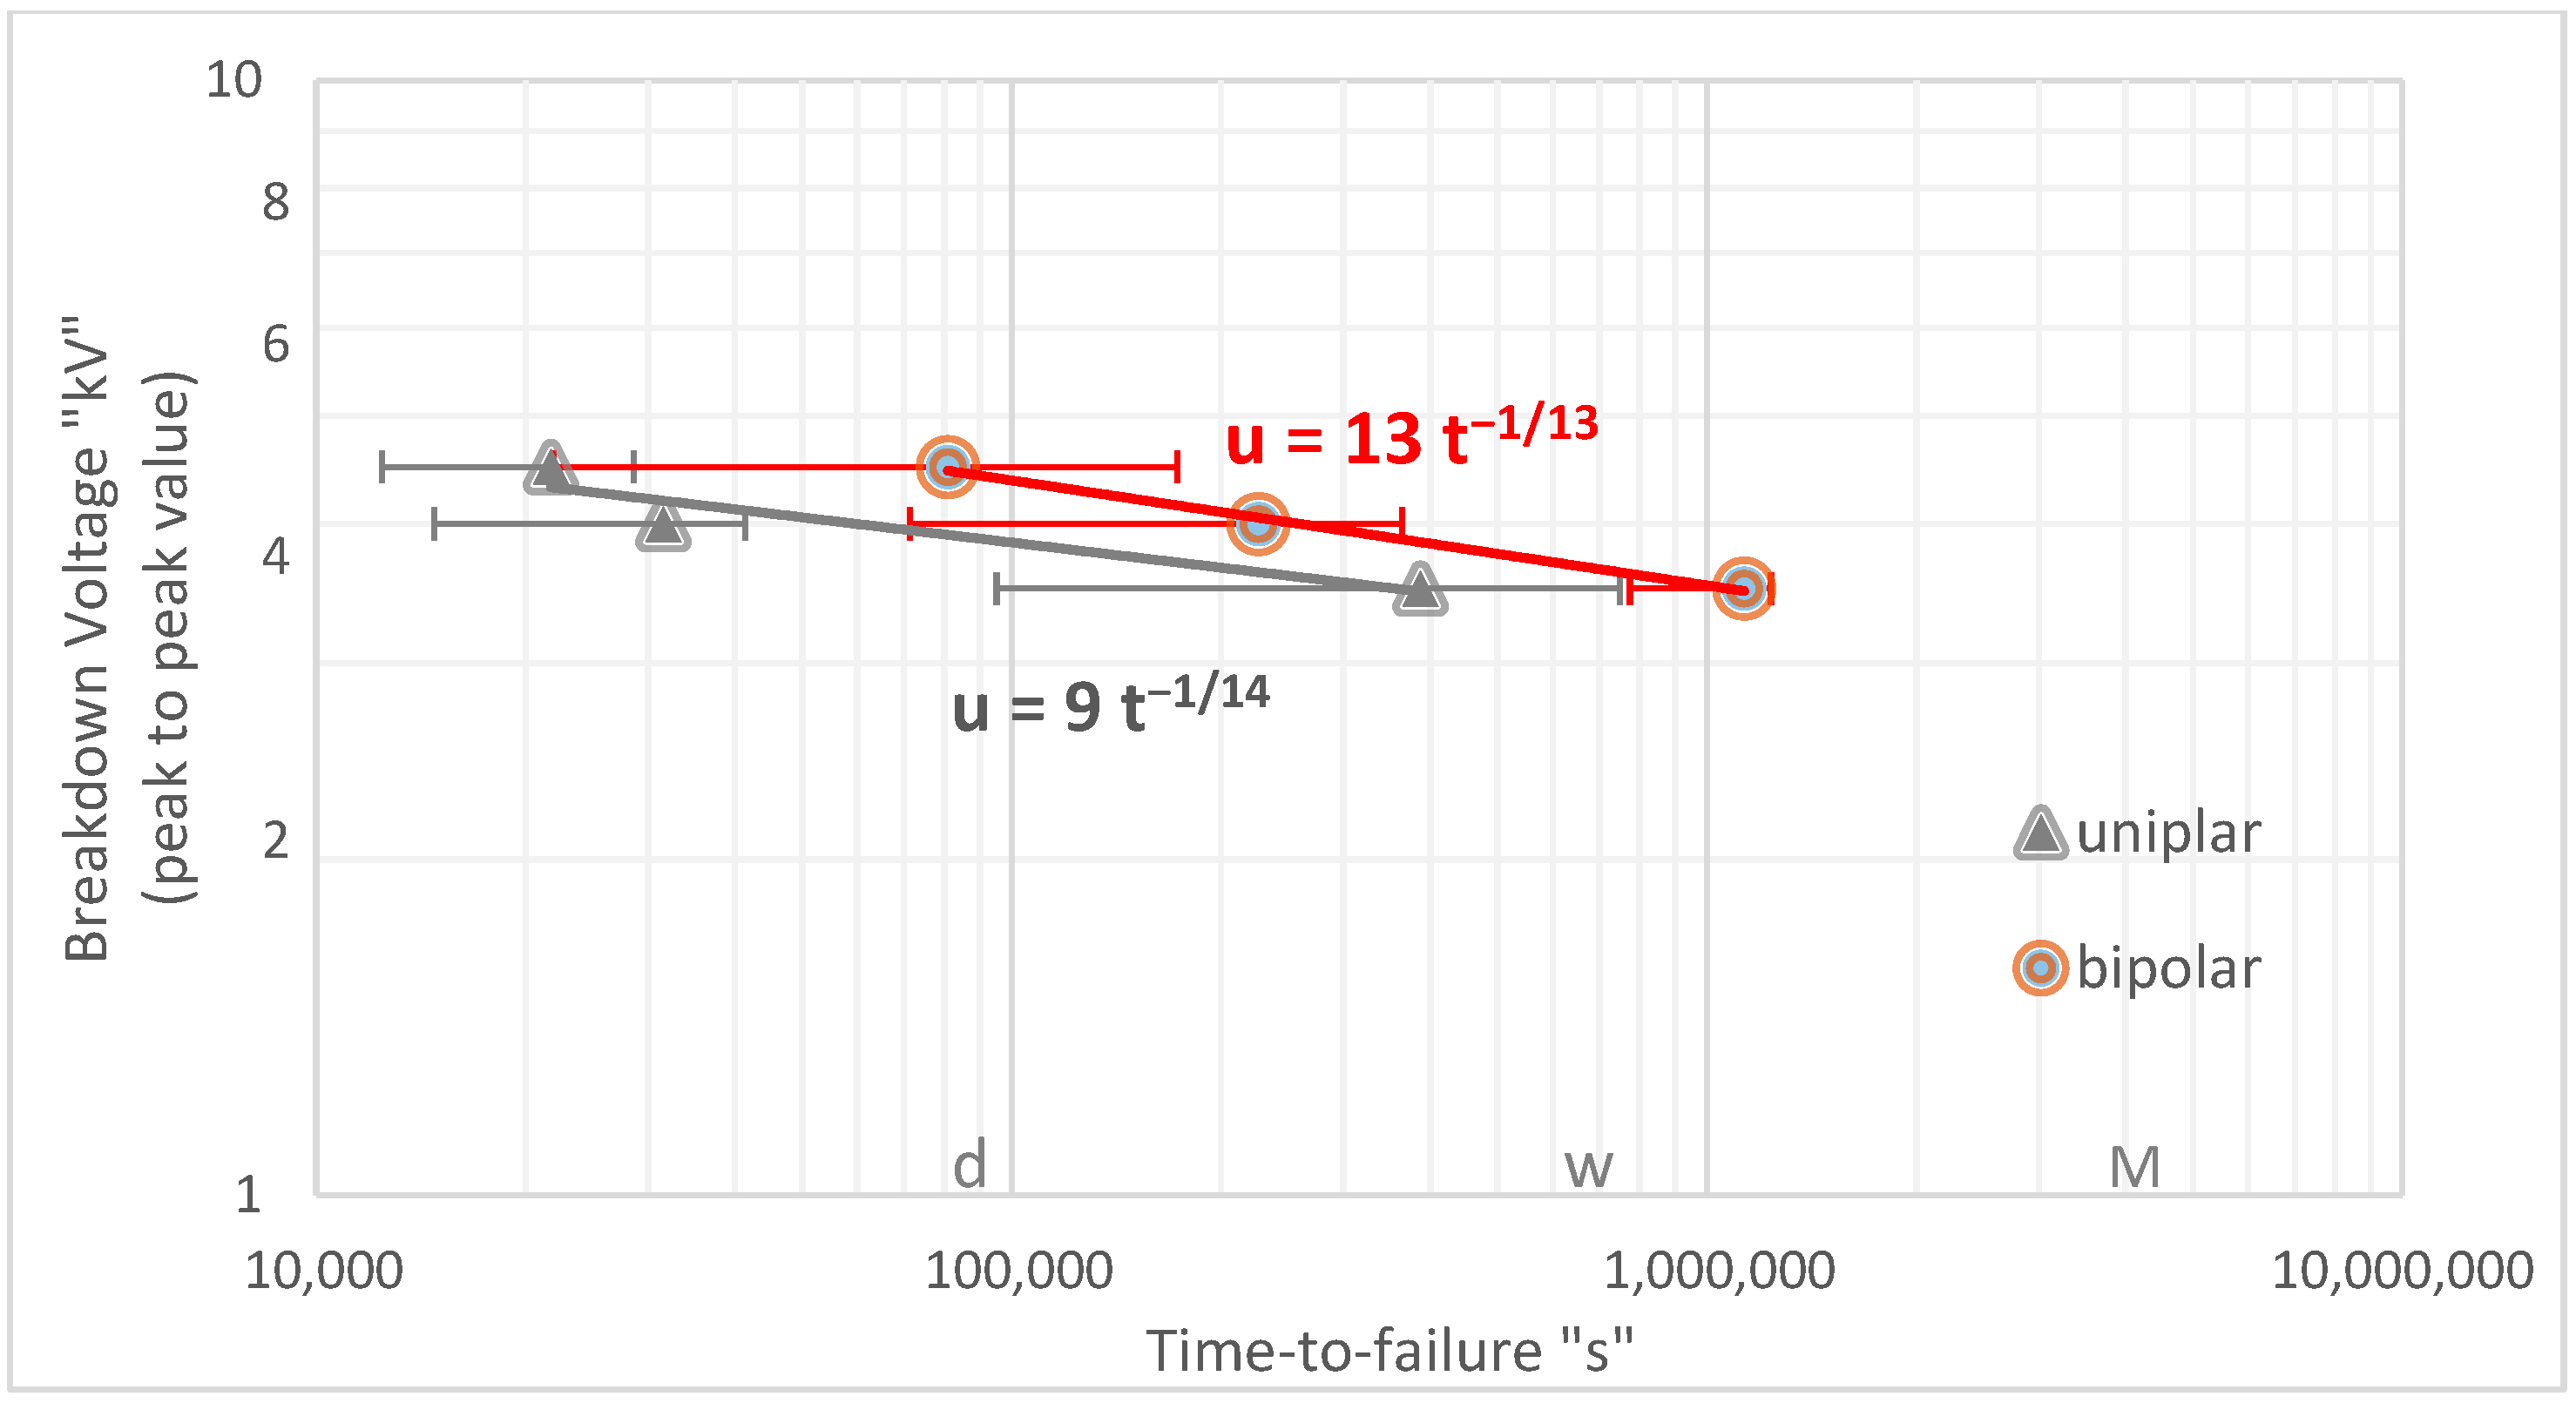
3.2. Impact of Polarity (Unipolar and Bipolar)
The use of pulse waveforms, encompassing both unipolar and bipolar types, is fundamental for assessing the aging behavior of insulation materials. Unipolar pulses maintain a voltage that stays either entirely positive or negative, never crossing zero. This continuous stress in one direction can cause charge buildup and localized heating, accelerating the degradation of the insulation material. In contrast, bipolar pulses switch between positive and negative voltages, crossing zero within each cycle. This alternating pattern helps disperse charges more evenly across the insulation material, reducing the risk of severe localized stress points compared to unipolar pulses. Conversely, the stress duration under bipolar stress conditions is twice that observed under unipolar stress conditions.
Converting a 4 kV unipolar pulse to a ±2 kV bipolar pulse results in the same peak-to-peak voltage. This conversion maintains a similar energy delivery per cycle for both waveforms, enabling a meaningful comparison of their effects on insulation degradation. This conversion method is applicable across various voltage levels. By using bipolar pulses that alternate between positive and negative voltages, we can analyze and compare how both bipolar and unipolar waveforms influence the aging of insulation materials.
The comparison shows that while bipolar pulses may slightly increase the time required for breakdown, the overall aging behavior of the insulation—reflected in the aging exponent—remains consistent between unipolar and bipolar waveforms. Although bipolar waveforms can extend the time-to-failure, the time-to-failure is shorter because each cycle contains two pulses, effectively doubling the stress frequency. This suggests that the fundamental degradation mechanism in the insulation is not significantly altered by waveform polarity (as seen in
Figure 9). One possible explanation is that ionization leads to the accumulation of heteropolar charges, which creates an internal electric field opposing the applied field. This opposition reduces the net electrical stress, and the effect is more pronounced under bipolar waveforms due to alternating polarity. The polarity changes help redistribute charges, mitigating localized field enhancements.
However, this comparison is only valid when the waveforms are evaluated using the same peak-to-peak voltage, which implies similar energy delivery per cycle. In most insulation aging studies, it is more appropriate to compare waveforms using the same peak voltage instead of peak-to-peak voltage. When both waveforms are compared using the same peak voltage—for example, 2.25 kV—it appears that unipolar waveforms lead to a significantly longer time-to-failure. In some cases, unipolar waveforms do not cause breakdown even after extended durations (e.g., more than a month), while bipolar waveforms result in earlier failure. This indicates that unipolar stress results in lower degradation compared to bipolar stress when peak voltage is the controlling parameter, as outlined in [
14]. However, this difference is largely due to the lower energy per pulse and shorter duration of the bipolar waveform when peak voltage is used as the comparison metric. Because a bipolar waveform alternates polarity, each individual pulse is effectively half the duration and delivers about half the energy compared to a unipolar pulse at the same peak voltage.
This means that although bipolar waveforms may seem to cause a faster breakdown under identical peak voltage conditions, it is not a direct reflection of the insulation’s inherent weakness to bipolar stress. Instead, it is a consequence of how the waveforms are defined and how much energy they deliver per pulse. Thus, while unipolar waveforms show a longer time-to-failure in this comparison, it is important to recognize that this outcome is influenced by waveform shape and energy content, not necessarily by fundamental differences in the aging mechanisms.
When using peak voltage as a reference—such as in
Figure 10—to compare bipolar sinusoidal and bipolar pulse waveforms, it becomes evident that sinusoidal waveforms exert much less electrical stress on the insulation than pulsed waveforms. To achieve a breakdown under sinusoidal stress, the voltage needs to be nearly twice as high as that required under pulsed conditions. Specifically, at a lifetime threshold of (
N =
) cycles, the breakdown voltage under sinusoidal stress is approximately 1.8 times higher than that observed under pulsed conditions. Interestingly, the aging behavior observed with sinusoidal waveforms aligns more closely with that of unipolar pulses, even though the waveforms differ in shape. This similarity arises because, in the case of unipolar pulses, each cycle contains only one pulse, resulting in lower energy per cycle—roughly half that of a sinusoidal waveform at the same peak voltage. Therefore, the similarity in aging behavior is primarily due to the comparable total energy delivered over time.
This analysis supports the validity of power-frequency (sinusoidal) testing for insulation aging, provided that the peak voltage of the sinusoidal waveform is used as the reference point comparable to the peak-to-peak voltage of a bipolar pulse waveform. For a meaningful comparison, it is essential to normalize the test conditions, either by matching the number of pulses to failure or by using a consistent frequency basis, as defined by Equation (4). This normalization enables a clearer interpretation of how each waveform contributes to aging insulation, particularly in terms of energy delivery during the critical phase of the waveform, primarily the voltage rise time. While the rise time slope (dv/dt) of a sinusoidal waveform is much lower than that of a fast high-voltage pulse, the total energy under the rise-time curve—which influences partial discharge (PD) activity—is significantly greater for the sinusoidal waveform due to its longer duration and continuous energy delivery. This higher cumulative energy per cycle explains why sinusoidal waveforms, despite having lower instantaneous stress, can still effectively age insulation materials and even mimic unipolar pulse behavior when energy levels are matched.
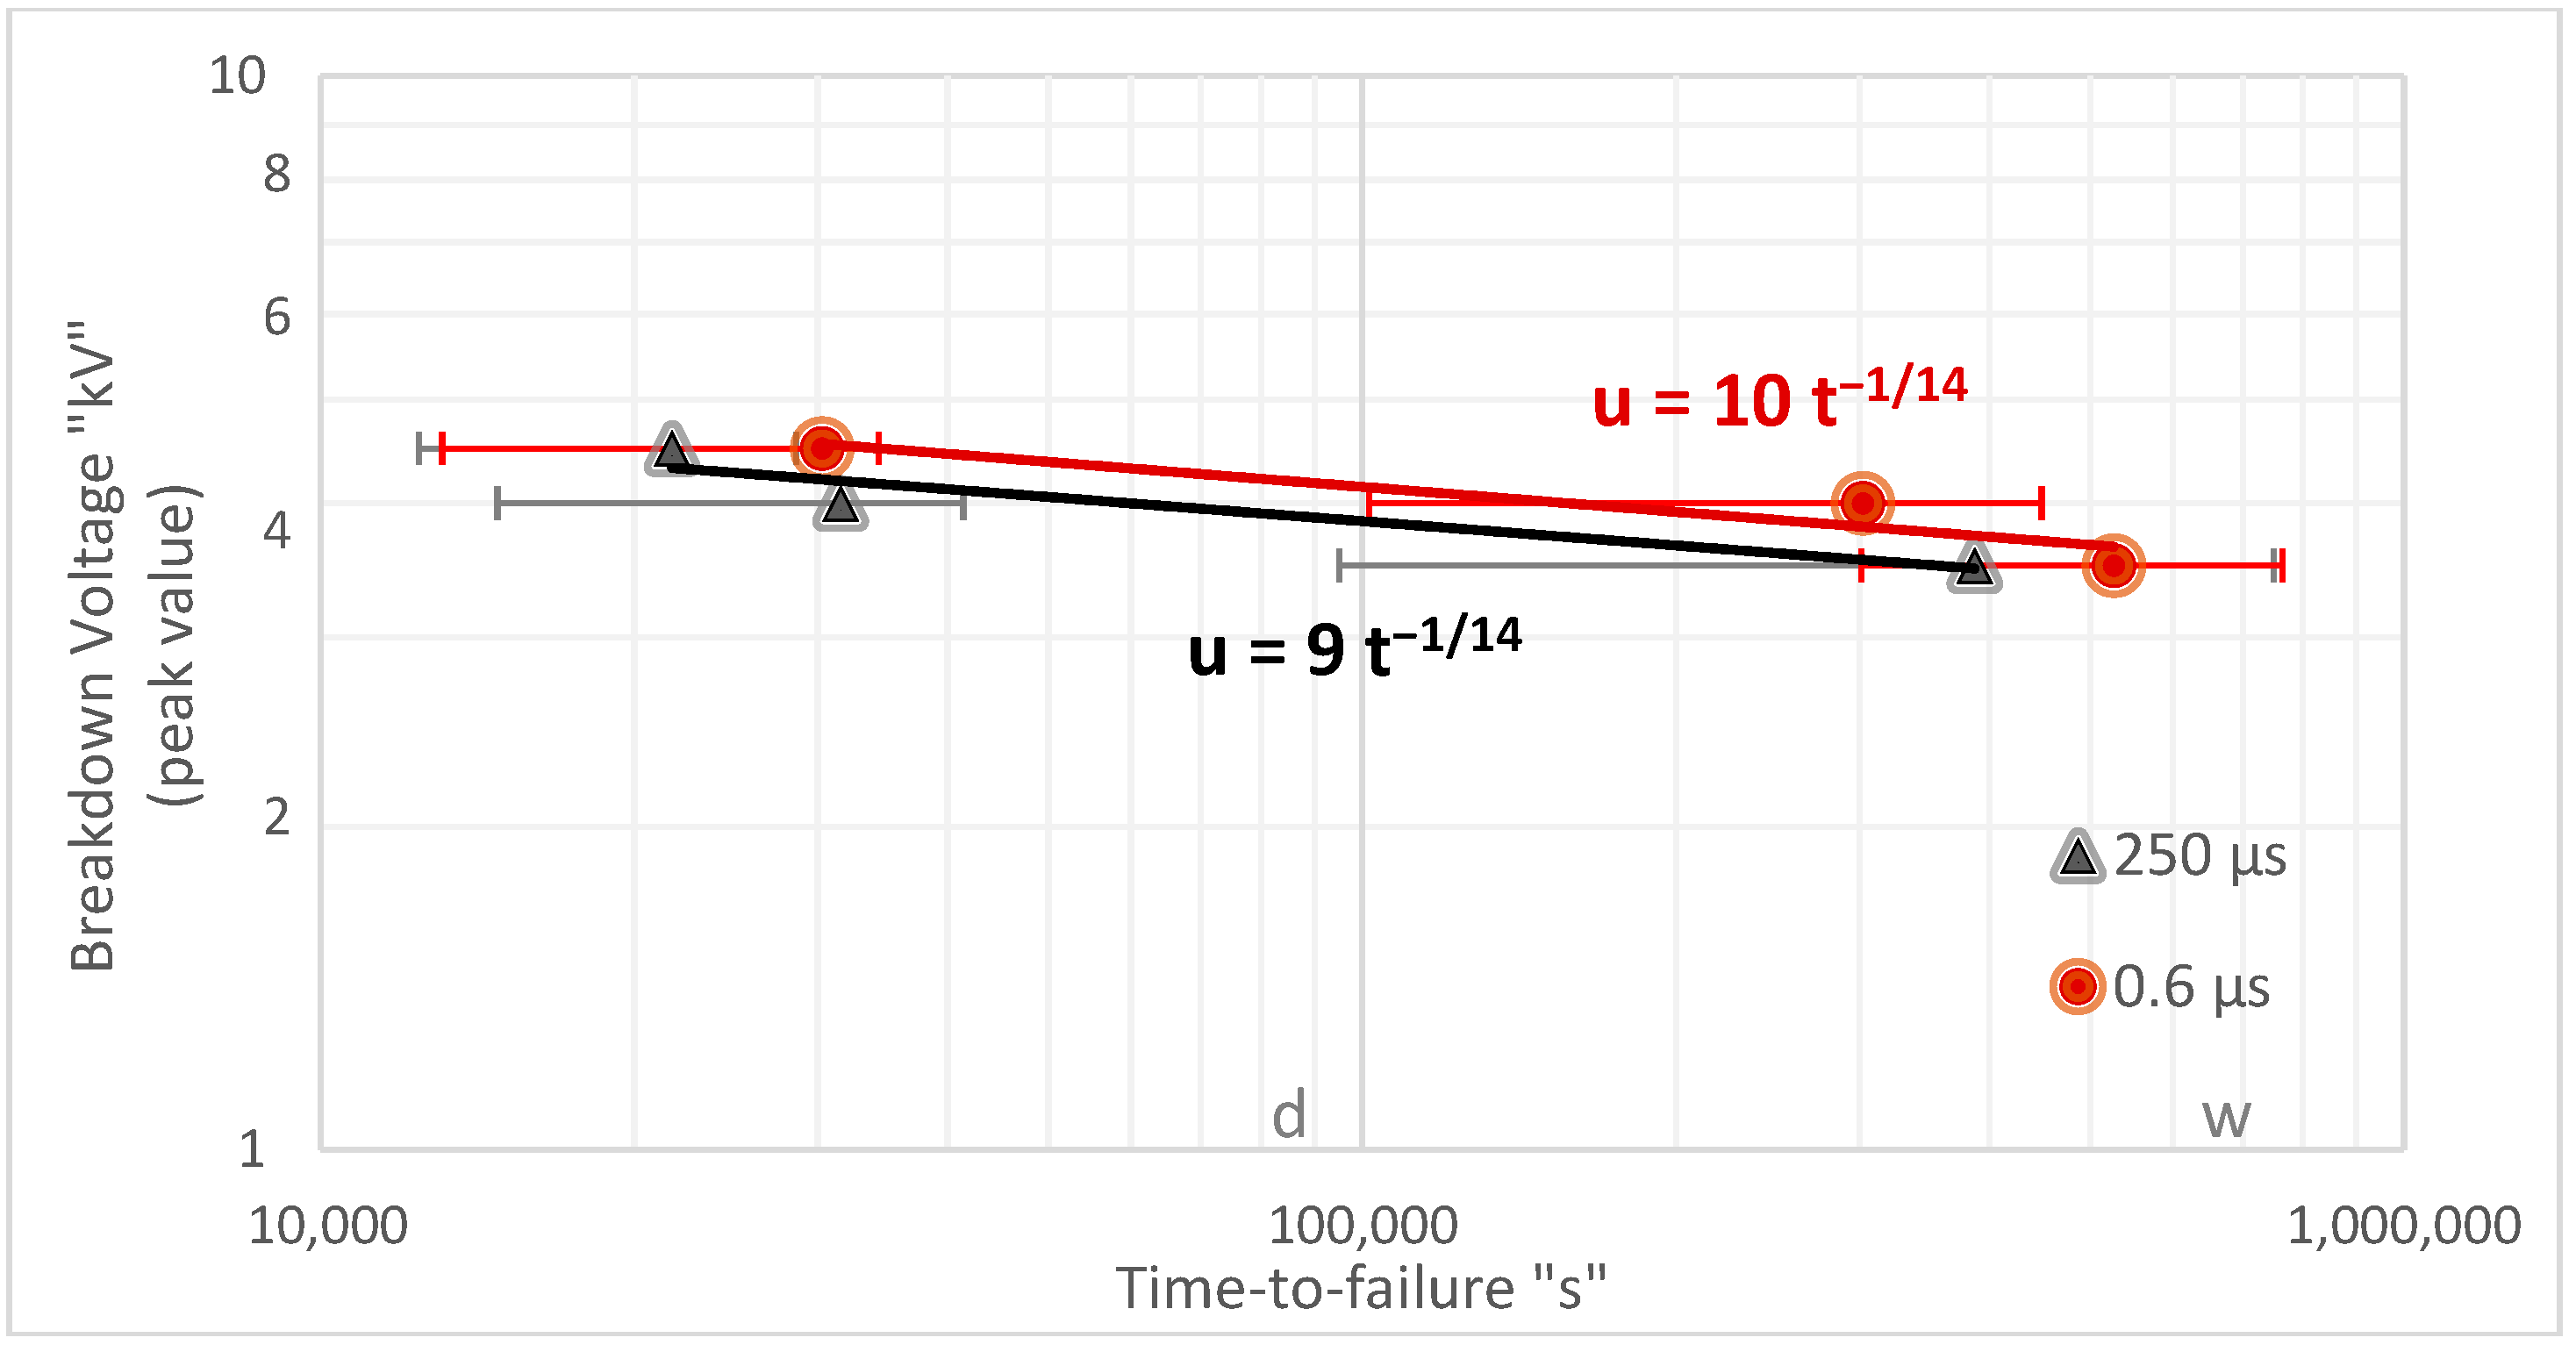
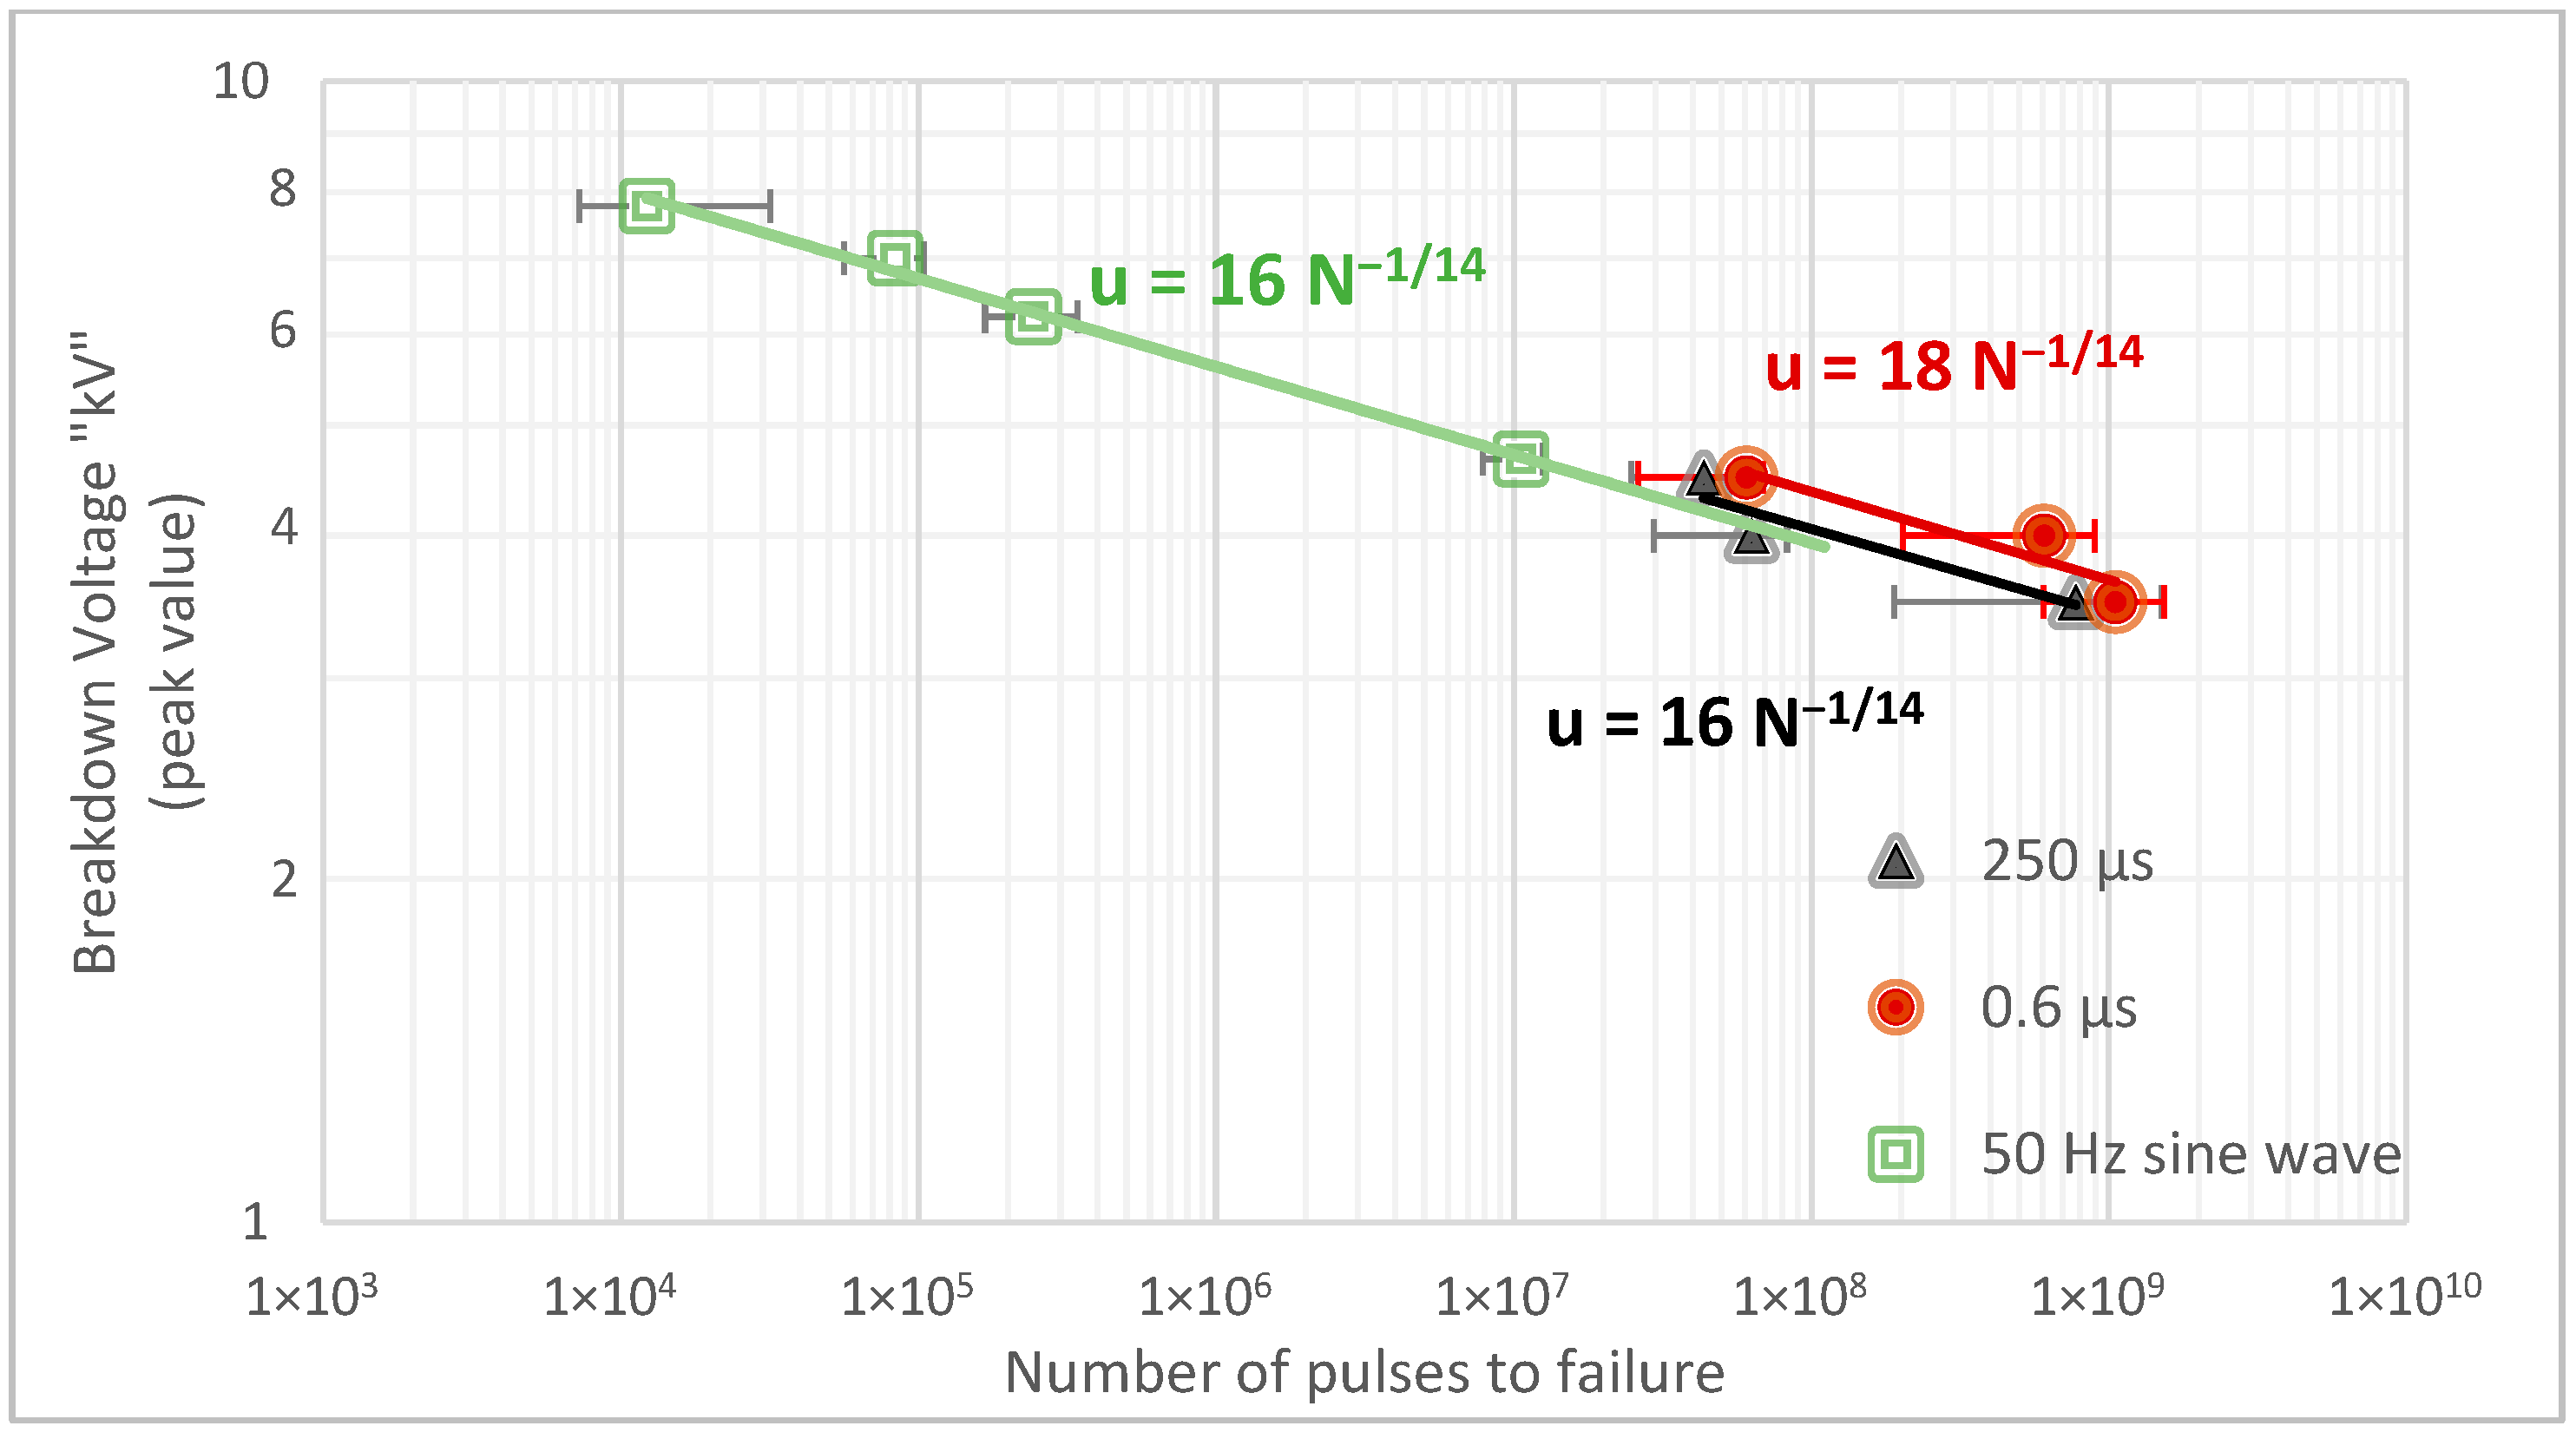
3.3. Impact of Pulse Width
The pulse width represents the duration during which the insulation is subjected to voltage stress, excluding the off-time in a unipolar pulse. Time-to-failure includes the off-times within the lifetime curve. This distinction is crucial for understanding whether the pulse width influences the aging process or the time-to-failure. To investigate this effect, two different pulse widths, 0.6 µs (Pulse D) and 250 µs (Pulse A), were applied to examine their impact on the insulation aging process and failure time under the same frequency (2 kHz) and rise time (300 ns).
Figure 11 shows a slight increase in time-to-failure with a pulse width of 0.6 µs, demonstrating a consistent rate increases across applied voltages, and a minor impact of stress duration on failure time, which enhances energy deposition and accelerates insulation degradation. The lifetime curves might be characterized by the same exponent (
), suggesting that the aging process at both pulse width values is similar.
Similar results were obtained from the lifetime curves depending on the number of pulses to failure, as shown in
Figure 12. These findings suggest that power frequency testing can serve as a reliable baseline for assessing insulation lifetime under various electrical stress conditions. The results indicate that behavior under power frequency closely matches that seen under different electrical stress conditions. The results indicate that behavior under power frequency closely matches that of other test conditions. Failure under power-frequency stress occurs after slightly fewer pulses compared to pulsed conditions with a 0.6 μs width, as each power-frequency cycle subjects the insulation to a significantly longer duration of electrical stress. This finding highlights the critical role of pulse duration in insulation degradation under high electrical stress. An inverse relationship is observed between pulse duration (duty cycle) and time-to-failure, indicating that shorter stress durations per pulse tend to extend insulation life, as outlined in [
17].
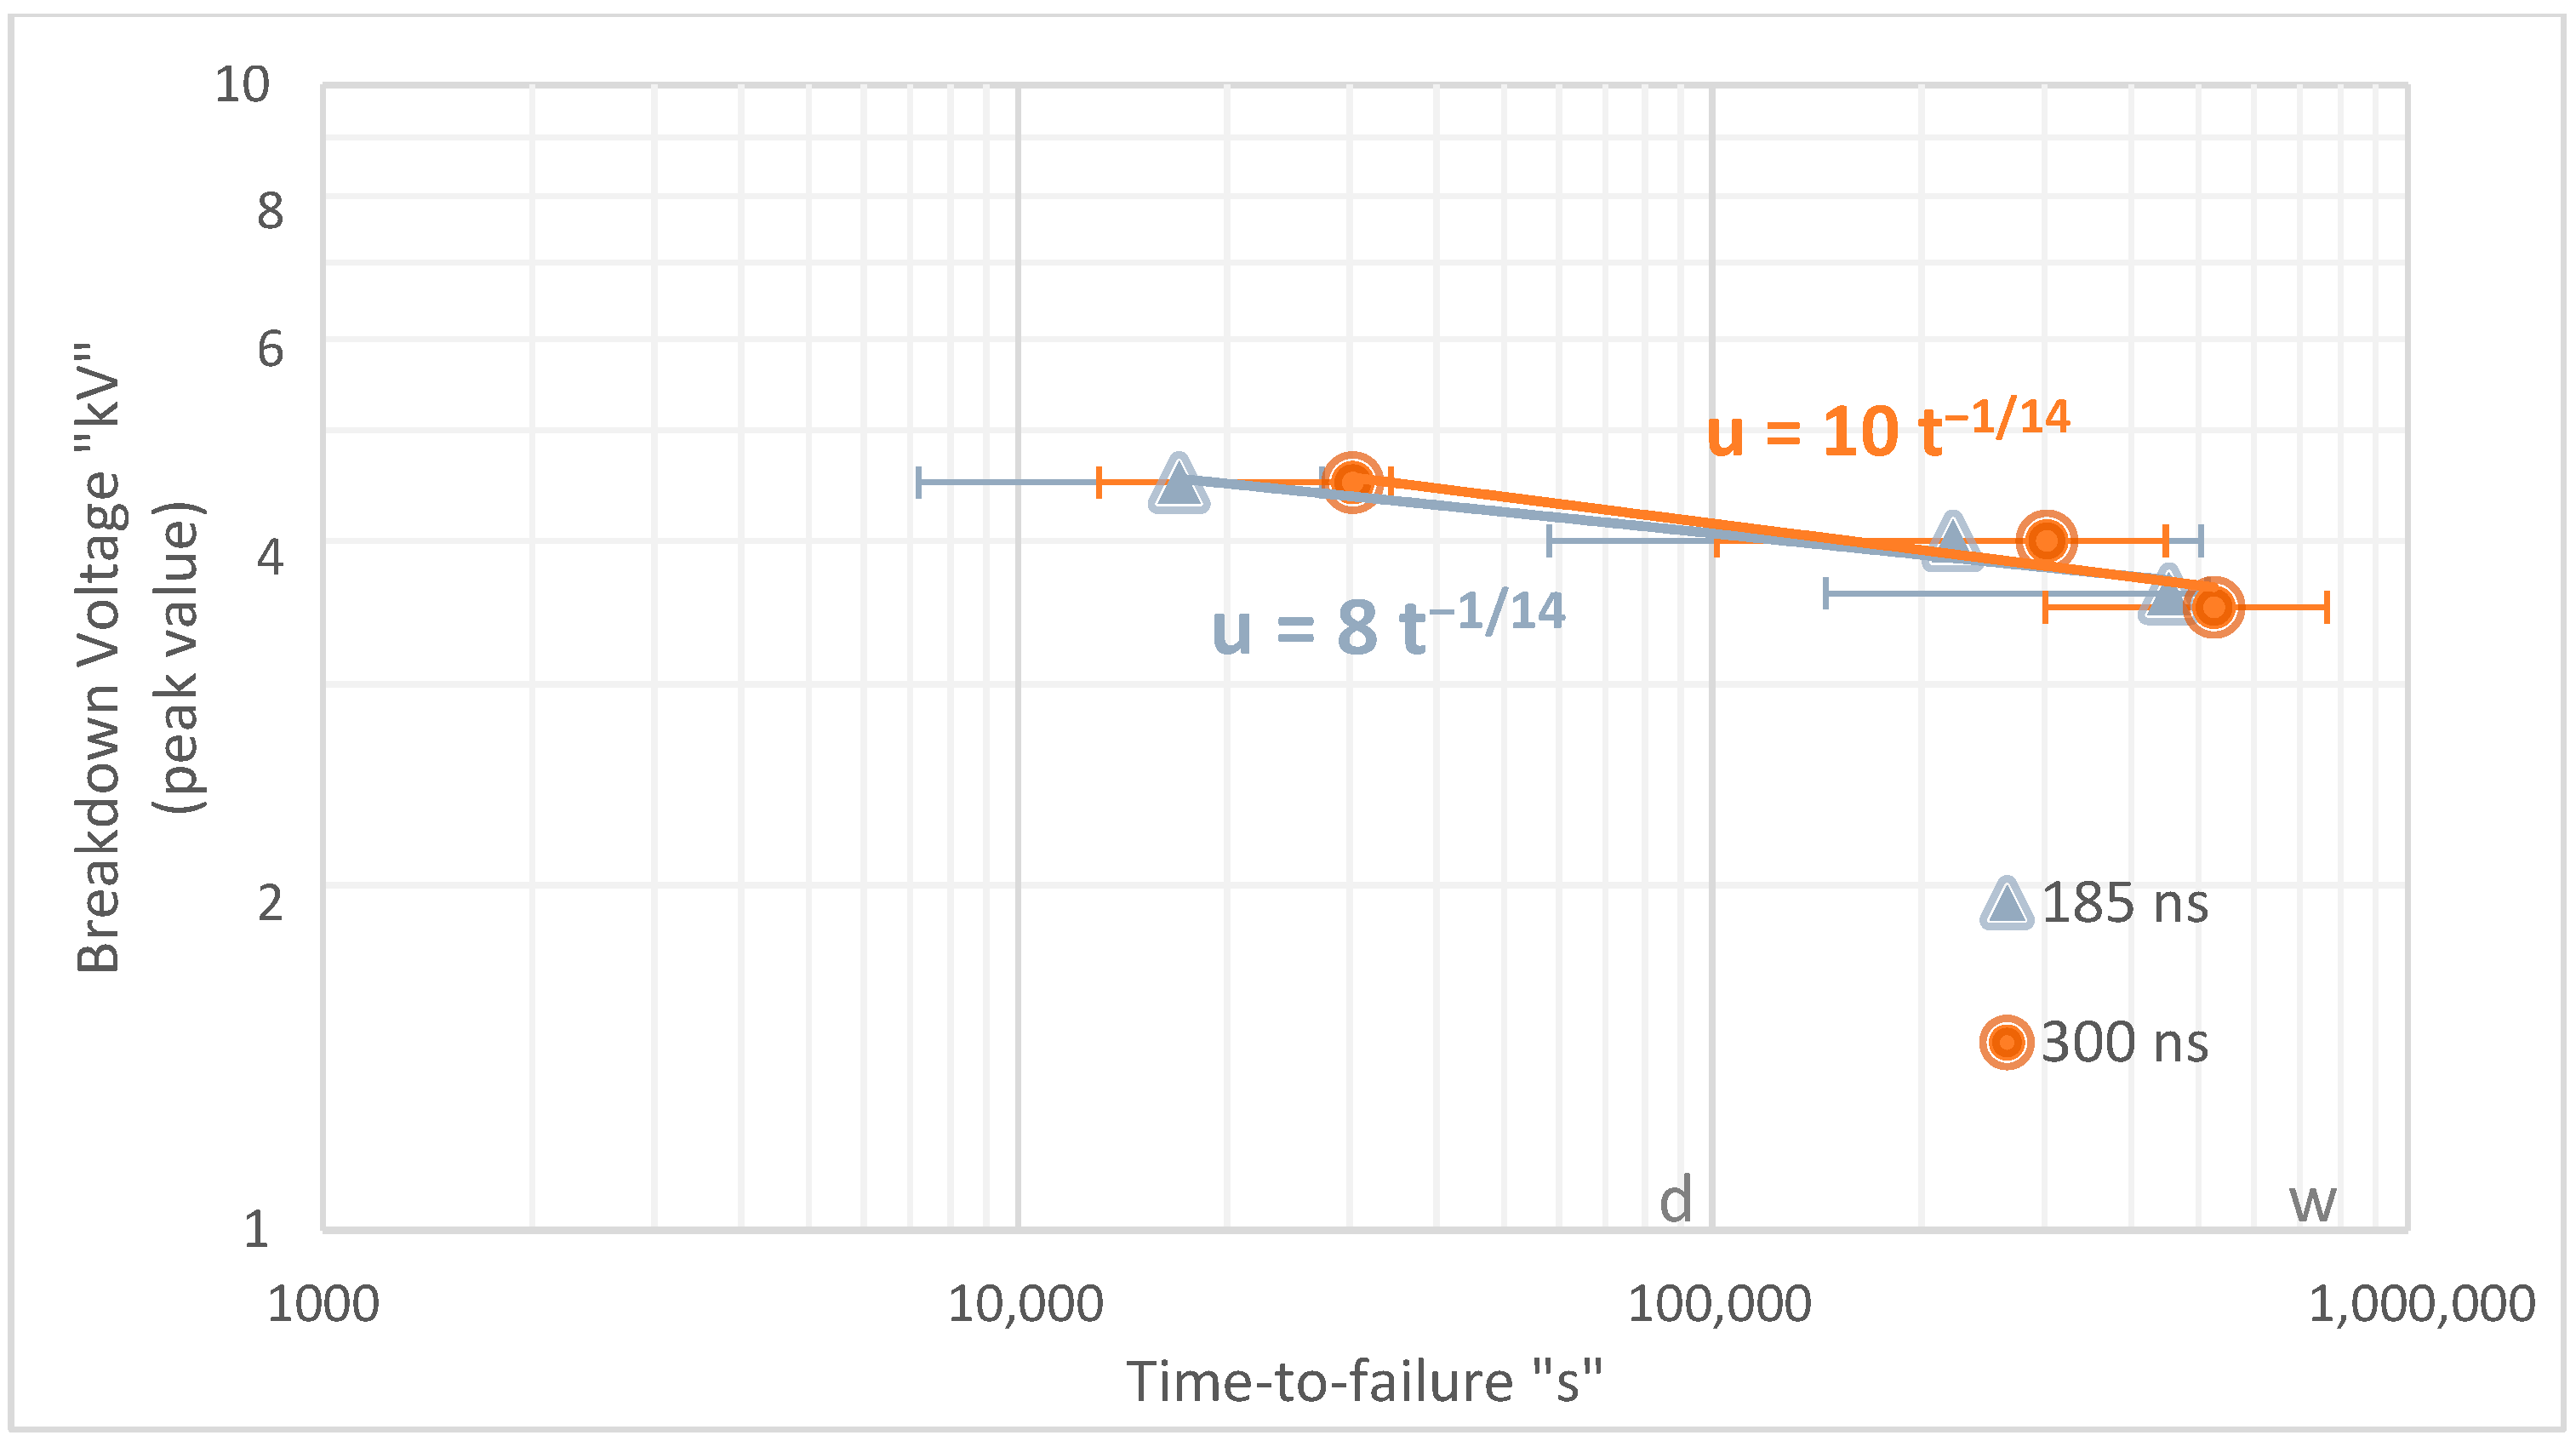
3.4. Impact of Rise Time
Previous studies primarily examining the straight region have highlighted the substantial impact of rise time on electrical insulation degradation. In this section, two waveforms were applied: one with a pulse width of 0.6 μs (pulse D), a frequency of 2 kHz, and a rise time of 300 ns; and the other with a pulse width of 0.33 μs (pulse C) and the same frequency but a shorter risetime of 185 ns. Although the full width at half maximum (FWHM) varies slightly among the pulses, it remains relatively short, while the base width of the pulses is similar.
Figure 13 illustrates an overlap between the two lifetime curves, indicating a comparable aging process in both cases; it also reveals that shorter rise times lead to reduced time-to-failure, especially under higher applied voltages. This highlights the critical influence of risetime on insulation degradation when the insulation is subjected to elevated electrical stress.
The analysis of the number of pulses to failure confirms that power frequency testing is still relevant for studying the lifetime performance of insulation under these stress conditions, as shown in
Figure 14. This reinforces its suitability as a baseline for evaluating aging behavior under pulsed electrical stresses. The comparison of lifetime results across various stress conditions indicates that power frequency testing could serve as a proxy for pulsed stress testing. However, an important distinction lies in the nature of the stress waveforms used. Previous pulse stress tests were unipolar, where the peak voltage equaled the peak-to-peak value. In contrast, power frequency waveforms are bipolar, with the peak voltage representing only half of the peak-to-peak value. This difference in stress application is fundamental. Therefore, it is crucial to investigate how insulation behaves under bipolar pulsed waveforms to determine if the peak voltage applied in power frequency testing remains suitable for evaluating lifetime performance.
3.5. Breakdown Location
The pulse voltage induces electrical stress almost uniformly across all parts of the turn insulation. However, this stress is increased in the bending regions due to the non-uniform electric field, in contrast to the straight sections. Additionally, the shaping process during manufacturing compresses the turn insulation in certain areas while stretching it in others. As a result, these regions become more susceptible to partial discharge (PD) activity and electrical treeing, ultimately leading to insulation failure. Although the turn insulation used in this study exhibits resistance to partial discharge (PD) activity, the bending regions remain the weak points in the insulation. Consequently, failure is expected to occur in these areas due to the increased susceptibility to PD and electrical treeing in the bent sections.
An investigation of the breakdown locations across all experimental results reveals that, in the majority of cases, insulation failures predominantly occur in the bending regions of the coils, while failures in the straight sections are rare. This suggests that the test sample focuses on the straight part of the coil, neglecting the critical stresses experienced by the turn insulation in areas such as the bends and overhangs, which can significantly impact insulation performance. In practice, this is not the most critical aspect of the study, as the greatest stress is applied to the insulated copper strands during the coil-forming process, particularly in the curved or overhang regions of the coil.
4. Summary of Discussion
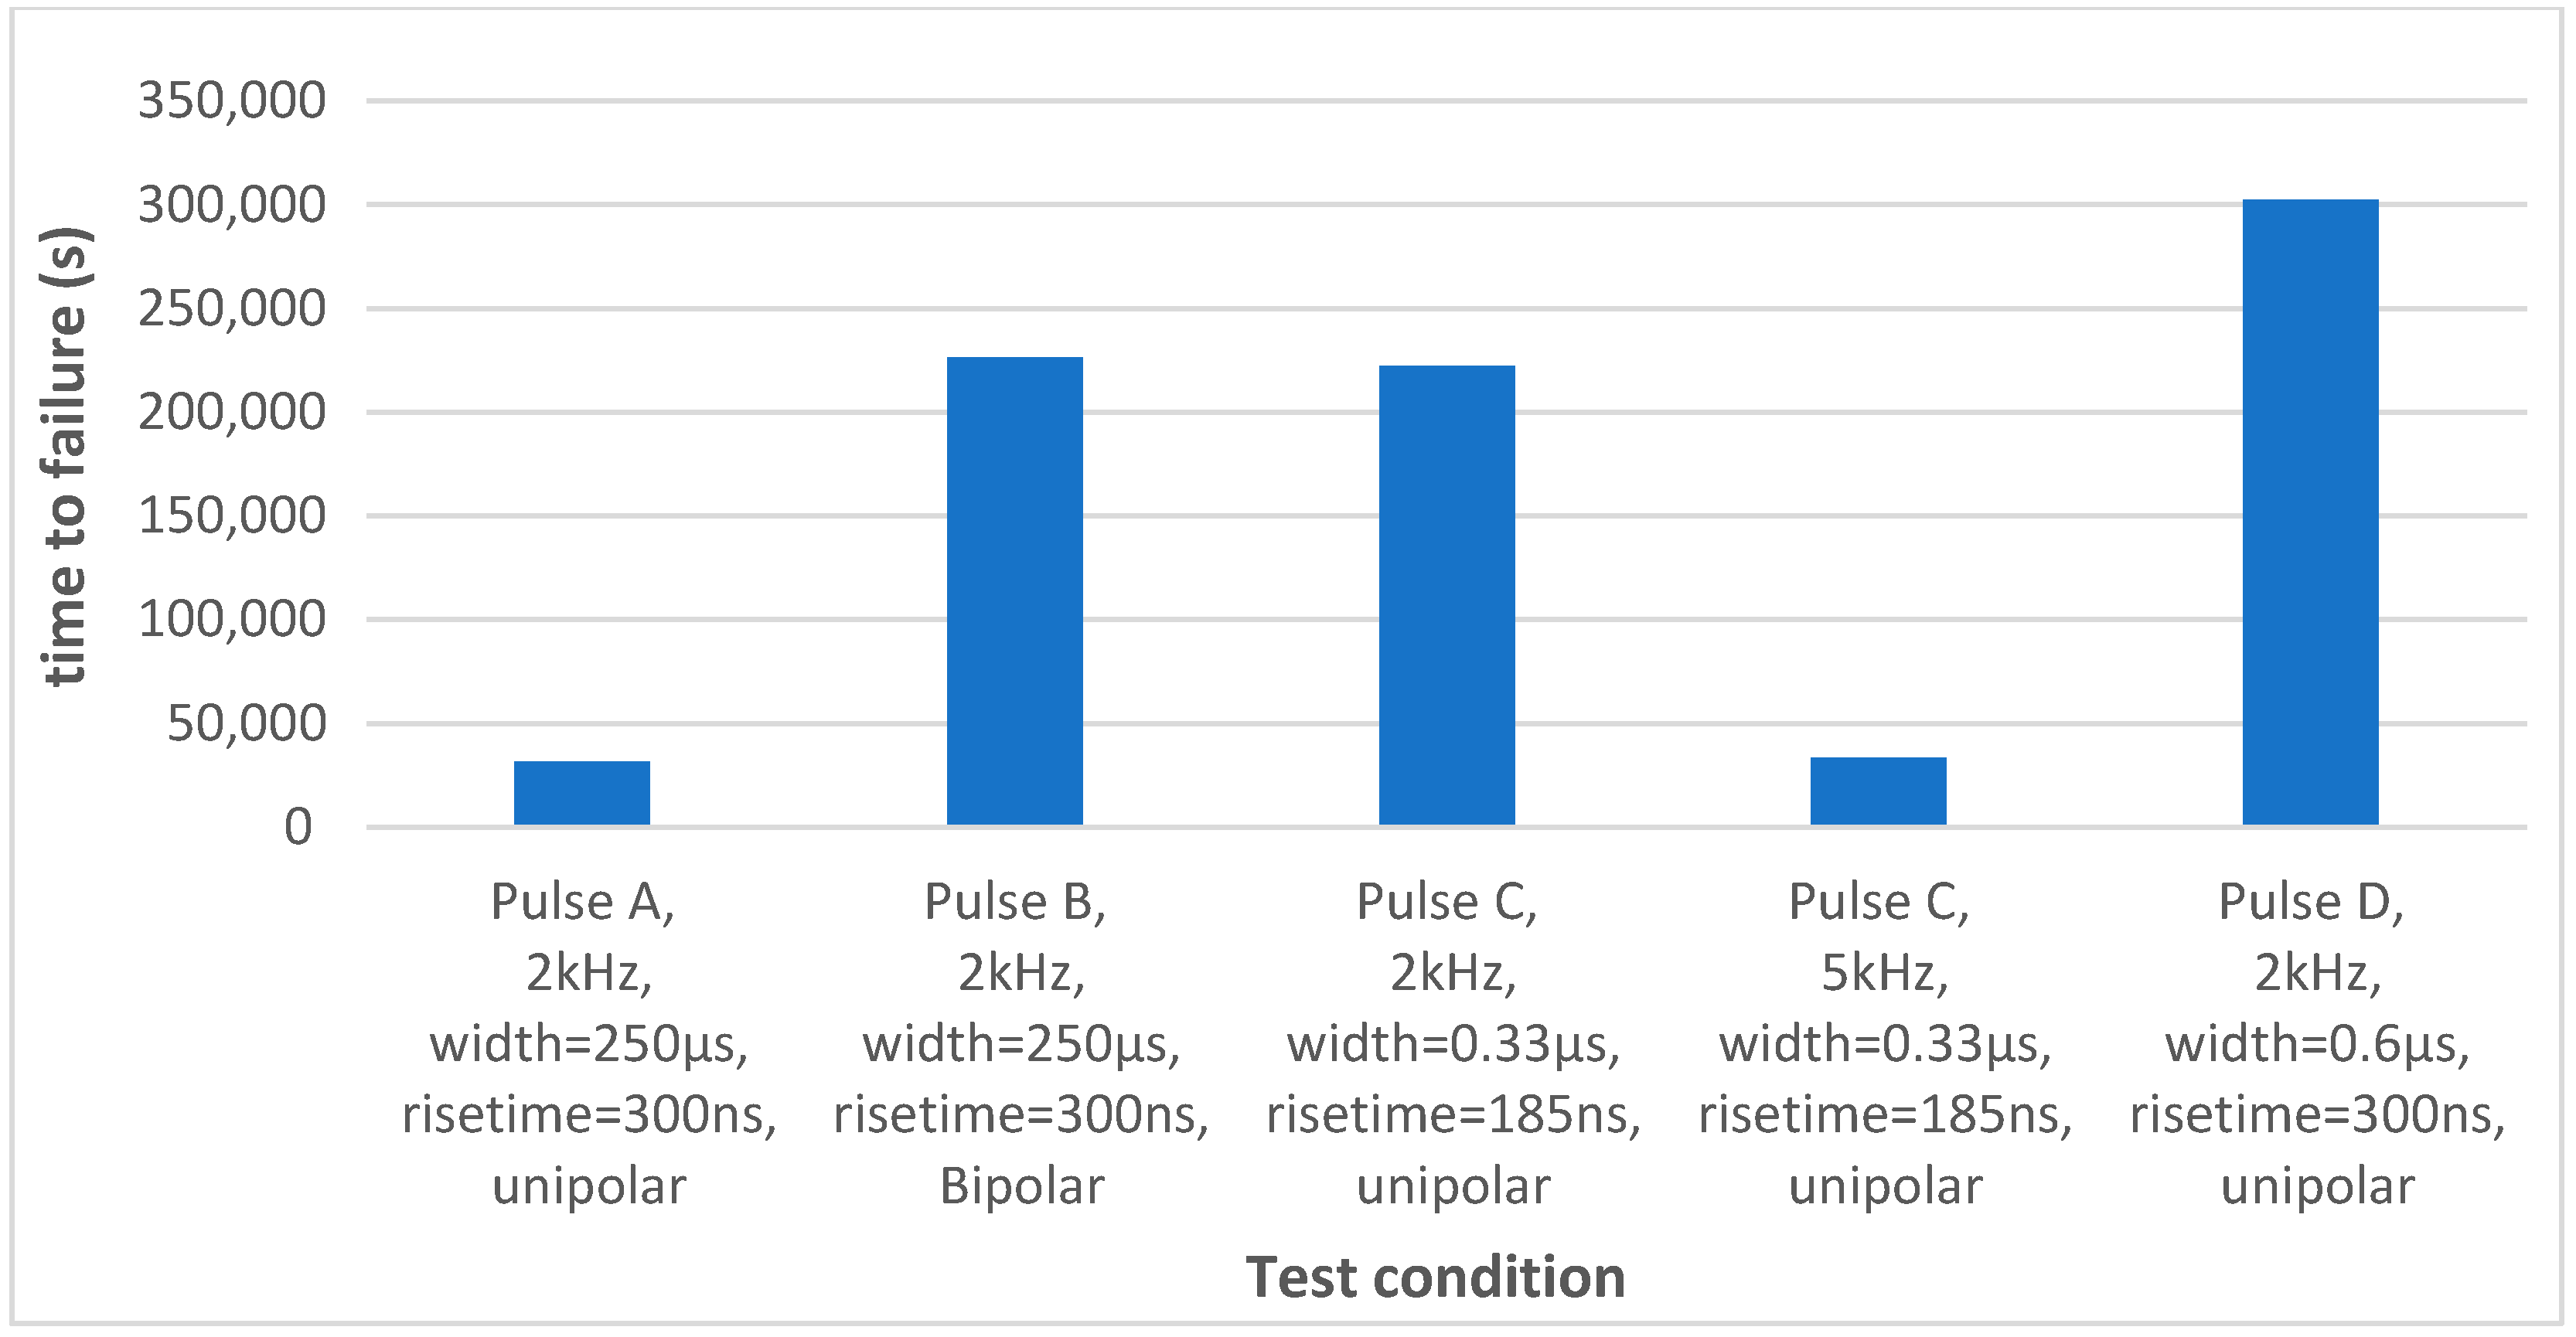
The results are summarized in
Table 2 and
Figure 15. While the lifetime exponent remains largely consistent across different electrical stress conditions—with only a slight reduction observed under bipolar excitation and a marginally lower value at higher frequencies—the variation is minimal. Considering the limited sample size and the evaluated time intervals, these differences are not statistically significant. Thus, it can be concluded that the electrical aging process is largely independent of pulse waveform characteristics and is more likely governed by the intrinsic properties of the insulation material and its response to thermal aging mechanisms. On the other hand, the number of pulses to breakdown appears comparable between sinusoidal and most pulsed waveforms, with the exception of the bipolar pulse (Pulse B). For instance, at (
N =
) pulses, the breakdown voltage under sinusoidal stress is approximately 1.8 times higher than that for Pulse B, 6% lower than Pulse C at 2 kHz, 2% higher than Pulse C at 5 kHz, and 11% higher than Pulse D. This comparison highlights the relatively higher voltage endurance of insulation under sinusoidal excitation compared to most pulsed stress conditions.
The analysis of the bar graph (
Figure 15) indicates that the system’s time-to-failure is significantly influenced by pulse characteristics, including polarity, frequency, pulse width, and rise time. At first glance, bipolar pulses (Pulse B) appear to markedly improve insulation durability compared to unipolar pulses when evaluated using the same peak-to-peak voltage, likely due to reduced charge accumulation. However, it is important to note that in the bipolar case, the peak voltage is half that of the equivalent unipolar condition. Moreover, no breakdown was observed when half the peak voltage (2 kV) was applied in the unipolar mode, indicating that unipolar stress has a lower impact on lifetime when the peak voltage is used as the comparison metric, as is standard practice.
Lower frequencies and shorter pulse widths (e.g., Pulse C at 2 kHz) correlate with extended lifetimes, while higher frequencies (Pulse C at 5 kHz) significantly reduce system endurance. The effect of rise time is evident in Pulse D, which shows a longer time-to-failure than Pulse C at 2 kHz, despite its slightly longer pulse width. These findings suggest that the effective stress duration per pulse plays a critical role in lifetime degradation, as highlighted by the comparison between Pulse A and Pulse D.
The observed variation in lifetime under different pulse conditions is likely influenced by a combination of physical mechanisms, primarily space charge effects, polarization dynamics, and localized heating. Shorter pulse widths and lower frequencies reduce the total energy deposited per unit time, limiting the thermal effects and suppressing partial discharges (PDs), particularly in air gaps or imperfections. Faster rise times may also reduce the time available for charge migration, again minimizing field distortion within the insulation. The cumulative stress per pulse appears to be a more critical factor than voltage amplitude alone, as highlighted by the comparison between Pulse A and Pulse D. Overall, the results suggest that the primary drivers of electrical aging in this context are likely space charge accumulation and polarization effects, with secondary contributions from localized heating. While PD activity cannot be fully ruled out, especially at higher voltages and frequencies, the absence of breakdown at half-peak unipolar stress levels implies that bulk aging processes, rather than surface discharges, dominate the observed degradation.
5. Conclusions
This study systematically investigated the degradation behavior and lifetime performance of Type II turn insulation in rotating machines subjected to various electrical stress conditions, with a particular focus on high-slew-rate (12–20 kV/μs) pulse waveforms. A novel experimental methodology was employed using coil samples that replicate the actual geometries found in electrical machines, especially incorporating the curved regions where insulation failures are most often initiated. The results clearly indicate that insulation breakdown is predominantly localized in these bent sections, emphasizing the limitations of conventional test samples, which often overlook the role of the geometric stress concentrations present in real-world applications.
Across the range of waveform types evaluated—sinusoidal, unipolar, and bipolar pulses—it was observed that while waveform shape, rise time, and other electrical parameters influence the time-to-failure, the fundamental aging mechanisms remain consistent. High dv/dt values and steep voltage rise times were found to impose significantly greater electrical stress on the dielectric material, thereby accelerating localized degradation. Notably, sinusoidal waveforms required approximately 1.8 times the applied peak voltage to achieve the same number of pulses to failure as bipolar pulse waveforms. However, the number of pulses to failure for sinusoidal and unipolar waveforms was observed to be nearly equivalent. These outcomes suggest that, despite differences in waveform morphology and voltage polarity, the energy delivered per cycle is a principal factor governing insulation aging. The comparable degradation behavior observed under varied stress conditions indicates that space charge dynamics, polarization effects, and stress duration per pulse are key mechanisms influencing insulation lifetime.
These findings further support the continued use of power-frequency testing as a valid baseline for estimating insulation lifetime, provided that the results are appropriately normalized using the number of cycles or pulses to failure. For accurate cross-comparison between waveform types, it is critical to treat the applied peak voltage in sinusoidal testing as equivalent to the peak-to-peak voltage in pulse waveform testing, ensuring a consistent basis for evaluating electrical stress intensity.


