Article

Renewable Energy Index: The Country-Group Performance Using Data Envelopment Analysis

by
Geovanna Bernardino Bello
1,
Luana Beatriz Martins Valero Viana
1,
Gregory Matheus Pereira de Moraes
1,* and
Diogo Ferraz
1,2,*
1
Department of Production Engineering, Sao Paulo State University, Bauru 17033-360, Brazil
2
Department of Chemical and Production Engineering, University of São Paulo, Lorena 12602-810, Brazil
*
Authors to whom correspondence should be addressed.
Energies 2025, 18(14), 3803; https://doi.org/10.3390/en18143803
Submission received: 13 June 2025 / Revised: 9 July 2025 / Accepted: 14 July 2025 / Published: 17 July 2025
(This article belongs to the Section B: Energy and Environment)

Abstract

Renewable energy stands as a pivotal solution to environmental concerns, prompting substantial research and development endeavors to promote its adoption and enhance energy efficiency. Despite the recognized environmental superiority of renewable energy systems, there is a lack of globally standardized indicators specifically focused on renewable energy efficiency. This study aims to develop and apply a non-parametric data envelopment analysis (DEA) indicator, termed the Renewable Energy Indicator (REI), to measure environmental performance at the national level and to identify differences in renewable energy efficiency across countries grouped by development status and income level. The REI incorporates new factors such as agricultural methane emissions (thousand metric tons of CO 2 equivalent), PM2.5 air pollution exposure (µg/m3), and aspects related to electricity, including consumption (as % of total final energy consumption), production from renewable sources, excluding hydroelectric (kWh), and accessibility in rural and urban areas (% of population with access), aligning with the emerging paradigm outlined by the United Nations. By segmenting the REI into global, developmental, and income group classifications, this study conducts the Mann–Whitney U test and the Kruskal–Wallis H tests to identify variations in renewable energy efficiency among different country groups. Our findings reveal top-performing countries globally, highlighting both developed (e.g., Sweden) and developing nations (e.g., Costa Rica, Sri Lanka). Central and North European countries demonstrate high efficiency, while those facing political and economic instability perform poorly. Agricultural-dependent nations like Australia and Argentina exhibit lower REI due to significant methane emissions. Disparities between developed and developing markets underscore the importance of understanding distinct socio-economic dynamics for effective policy formulation. Comparative analysis across income groups informs specific strategies tailored to each category.

1. Introduction

Global energy management increasingly became a priority for states and corporations, driven by the challenge of reconciling three essential pillars: energy supply security, democratization of access to energy sources, and environmental preservation [1]. In this context, renewable energy sources emerged as a strategic solution, offering more environmentally friendly and sustainable alternatives compared to petroleum and coal derivatives. Recent technological advances enabled the accelerated expansion of clean energy matrices, including solar, wind, hydro, and bioenergy [2], with climate change, economic factors, technological innovation, and international tensions acting as catalysts in this ongoing transformation [3]. Consequently, policymakers and researchers advocated for continued investments in renewable energy technologies and initiatives that supported widespread adoption [4].
Compared to traditional energy systems, renewable energy systems were considered environmentally superior in terms of CO2 mitigation and efficient resource use [5]. However, despite broad consensus regarding the benefits of renewable energy, significant gaps remained. The expansion of the renewable energy sector underscored the need for a comprehensive exploration of methodologies aimed at increasing energy efficiency [6]. Numerous studies addressed different dimensions of energy efficiency and environmental performance. For instance, Woo et al. [4] investigated the environmental efficiency of renewable energy in 31 OECD countries, considering labor, capital, and renewable energy supply as inputs, while using GDP as a desirable output and carbon emissions as an undesirable output. To this end, the Malmquist productivity index was applied to measure the average variation in efficiency from 2004 to 2011.
Other studies complemented this analysis through alternative approaches. Hou et al. [7] developed a set of indicators—including energy self-sufficiency ratios, energy imports and reserves, GDP productivity, energy intensity, and the share of renewable energy—to create an index of energy efficiency and environmental performance. Ji et al. [6] applied the cross-efficiency DEA model in a game-theoretic framework to measure the efficiency of clean and fossil energy at the provincial level in China. Li, Ji, and Dong [8] employed the Malmquist index and regression models to evaluate renewable energy generation based on different types of installed capacity. Chien and Hu [5] analyzed the influence of renewable energy on technical efficiency in 45 economies using DEA, and Menegaki [9] focused on inefficiencies in European economic growth, emphasizing renewable energy consumption as a key input. Nonetheless, despite these advancements, a lack of globally standardized indicators specifically targeting renewable energy efficiency persisted. The absence of universally accepted, robust, and transparent efficiency indicators continued to pose a barrier to effective global comparative assessment, policy evaluation, and the acceleration of renewable energy adoption [8,10,11].
In response to this gap, the present study proposed the creation of a non-parametric DEA-based indicator capable of measuring the environmental performance of renewable energy at the national level across the globe—the Renewable Energy Indicator (REI). The relevance of the REI lay in its ability to offer new insights into both pollutant emissions and renewable energy strategies. While conventional studies often focused on traditional variables such as energy consumption and CO2 emissions [12,13,14], this approach advanced the field by incorporating additional dimensions, such as methane emissions from agriculture, exposure to PM2.5 air pollution, and variables related to electricity consumption, production, and access. This methodological design aligned with the emerging paradigm outlined by the United Nations [15], which emphasized the significance of methane as a potent greenhouse gas, with an estimated impact 80 times greater than that of carbon dioxide in the first 20 years following its release into the atmosphere [15].
Accordingly, the study made several contributions: (i) it proposed a novel non-parametric indicator (REI) based on Data Envelopment Analysis (DEA) to measure the environmental efficiency of renewable energy on a global scale, addressing the gap in standardized indicators within this domain [8]; (ii) it expanded traditional approaches by incorporating broader variables, such as methane emissions from agriculture and PM2.5 exposure, in line with UN guidelines on greenhouse gases and air pollution [15]; and (iii) it offered a robust comparative basis for the evaluation of public policies and the adoption of renewable energy, integrating not only electricity production and consumption but also equitable access and multidimensional environmental impacts, thereby assisting governments and organizations in the transition to sustainable energy systems. Moreover, the REI was segmented into three distinct groups: a global indicator, development group classifications, and income-level rankings [16] Non-parametric statistical tests were conducted to identify variations in renewable energy efficiency across these groups of countries.

2. Literature Review

This section presents an overview of the literature and the theoretical foundation supporting the use of the data envelopment analysis (DEA) indicator to assess the efficiency of renewable energy.

2.1. Renewable Energy Efficiency

Recent literature examined various dimensions of energy efficiency and the transition to renewable sources, highlighting substantial progress while also revealing methodological and conceptual gaps. For example, Lungkadee et al. [17] analyzed the technical and economic implications of retrofitting post-combustion carbon capture systems in Thailand. Their findings reveal that as the flow rate of flue gas increases, the cost of capturing one ton of CO2 decreases, highlighting the presence of economies of scale in carbon capture and storage (CCS) operations. In addition, Rajab et al. [18] emphasized the importance of expanding renewable energy sources, highlighting the significant potential of agricultural biomass for future energy production. The authors point out that, despite its availability, agricultural biomass remains underutilized, particularly in direct combustion processes. Saygin et al. [19] emphasized that energy efficiency could drive innovation in renewable energy between 2010 and 2030, underscoring the interdependence between these dimensions. However, methodological divergences among national plans—such as differences in population projections and energy targets—undermined data consistency. Moreover, the absence of broader environmental and social variables weakened the systemic assessment of the energy transition. Key indicators such as air pollution from fine particulate matter (PM2.5), essential for measuring the negative externalities of energy generation, were notably omitted [20]. Another neglected aspect concerned the role of energy access across diverse settings—urban and rural, developed and developing—which is critical for achieving a just energy transition [21].
The complexity of the energy transition was also reflected in how different renewable sources were integrated into national energy matrices. Shrestha et al. [22], in an analysis of emerging markets, identified a positive relationship between energy development and modern sources, and a negative association with traditional sources, highlighting the urgency of public policies that promote clean technologies. Lo [23], in a study of renewable energy and energy efficiency policies in China, identified multiple benefits from such strategies, including climate change mitigation and improved quality of life. However, the sectoral focus and the single-country scope limited the generalizability of these findings to other contexts, particularly those in less industrialized regions.
Several authors sought to connect economic and technological factors to energy sustainability. Murshed [24] investigated the impact of trade openness in information and communication technologies (ICTs) on the energy transition in South Asia. The findings suggested that such exchanges could foster renewable energy consumption, promote the use of clean fuels, and reduce CO2 emissions. Nevertheless, methodological constraints limited the capacity to capture complementary variables that reflect the full complexity of energy sustainability. Similarly, Akram et al. [25] examined the heterogeneous effects of energy efficiency and sustainable energy sources on carbon emissions in emerging economies, identifying positive contributions from these variables. That study stressed the importance of energy policies tailored to specific national contexts, noting that institutional, social, and regional heterogeneity could significantly influence results.
Hou et al. [7] proposed a composite index of energy efficiency and environmental performance based on multiple indicators, including energy self-sufficiency, energy intensity, GDP productivity, per capita energy consumption, carbon emissions, and the share of renewable energy. This approach stood out for evaluating each indicator individually before constructing an aggregate score, thereby offering more detailed insights into cross-country comparisons. However, the method fell short in capturing systemic interactions among energy, economic, and environmental dimensions—interactions crucial for understanding the synergies and trade-offs involved in sustainable development [7].
These limitations revealed in the literature indicated the need for more integrated approaches that explicitly incorporated environmental and social variables. Future research was therefore deemed essential to enable more accurate diagnostics and to support the formulation of public policies capable of addressing these dimensions, thereby promoting more robust assessments of sustainable energy transition pathways.

2.2. Renewable Energy and Air Pollution

Environmental pollution became a growing concern starting in the 1970s, although more consistent academic attention was only directed toward the topic in the 1990s [26,27]. The expansion of production systems and the intensification of technological use led to increased energy consumption and excessive waste generation [28], underscoring the urgent need for strategies to promote the efficient use and reuse of resources such as energy [29].
Energy was shown to play a critical role in mitigating environmental pollution while supporting sustainable economic growth. Multiple studies pointed to the effectiveness of energy regulations and environmental policy design in reducing pollution levels [30,31], and demonstrated that economic growth, when accompanied by investments in renewable energy, could contribute to air pollution mitigation [27]. However, the environmental outcomes of renewable energy adoption varied across contexts. For example, Novan [32] emphasized the heterogeneous effects of renewable energy sources on air quality, while Zhu et al. [33] highlighted the need for localized policy interventions to maximize pollution control outcomes.
Empirical evidence also demonstrated the benefits of clean energy implementation, such as emissions reductions in port systems [34], decreased pollution-related mortality in Latin America [35], and substantial cost savings in sulfur dioxide control in countries like India and China [36]. At the same time, energy modeling approaches were developed to aid decision-making by balancing environmental, economic, and risk-related considerations [37,38]. Other studies investigated sector-specific opportunities, such as the environmental gains from integrating electric vehicles and the importance of government incentives to support cleaner technologies [39]. Nonetheless, the literature continued to reflect persistent gaps in aligning the environmental, economic, and social dimensions of the energy transition, particularly in low- and middle-income regions.
Although the economic viability of renewable energy continued to present barriers—due to capital intensity and long payback periods [40]—existing research consistently identified positive relationships between green innovation and pollution reduction [41]. The impact of air pollution on public health and life expectancy further reinforced the case for increased investment in clean energy systems [42].
More recent contributions examined the COVID-19 pandemic as a unique context for evaluating the environmental impacts of temporary reductions in economic activity. Rita et al. [43] suggested that biofuel policies could sustain the emission reductions observed during lockdowns. In contrast, Koengkan et al. [44] highlighted how urbanization and globalization could reverse those gains in the absence of robust fiscal and environmental policies. Additional studies explored alternative energy pathways, such as biogas production from waste [45], and examined institutional barriers linked to foreign investment in the renewable energy sector [46], thereby stressing the importance of well-defined regulatory frameworks.
Despite the growing body of evidence linking renewable energy to pollution reduction [27,32,44], notable research gaps persisted regarding the differential effectiveness of public policies, the socio-economic feasibility of the energy transition, and the resilience of energy systems to external shocks. A broad consensus in the literature pointed to the urgency of policy support—in the form of subsidies, regulations, and innovation incentives—as crucial for scaling up clean energy adoption and minimizing environmental damage [40,46]. The following section addresses the role of energy efficiency as a key factor in enhancing the sustainability and impact of renewable energy sources, underscoring the necessity of integrating efficiency into broader energy and climate strategies.

3. Materials and Methods

This section describes the data and methodological procedures employed to construct a comprehensive indicator for assessing country-level performance in renewable energy, using data envelopment analysis (DEA), a non-parametric method widely applied in efficiency evaluation.

3.1. Inputs and Outputs Variables

The analysis focused on renewable energy efficiency across 135 countries, following the exclusion of 84 countries with populations below one million (See Table A1 in Appendix A). The selection of input variables considered both environmental and energy-related factors critical to sustainable development, including agricultural methane emissions, CO2 emissions, fossil fuel energy consumption, and PM2.5 air pollution. While prior studies emphasized CO2 emissions as a principal measure of environmental degradation [12,13,14,47], methane emissions were also incorporated into the DEA model [48], given their importance as highlighted by the United Nations and the Sustainable Development Goals [15].
In addition, the model included environmental outputs deemed desirable for policy promotion: renewable energy consumption, electricity access in both rural and urban areas, and electricity generation from renewable sources excluding hydroelectric power. All data were sourced from the World Development Indicators database. A summary of the selected variables is presented in Table 1.

3.2. Data Envelopment Analysis

Data envelopment analysis (DEA), a non-parametric technique based on mathematical and linear programming, was used to measure efficiency, as introduced by Charnes et al. [49]. DEA identifies a linear frontier of best performance, allowing comparisons among decision-making units (DMUs)—in this case, countries—in terms of their ability to transform inputs into outputs. Efficient DMUs define the production possibility frontier, while others are evaluated relative to it [50,51]. According to Cook and Zhu [52], DMUs can be ranked using efficiency scores ranging from 0 (completely inefficient) to 1 (fully efficient).
The DEA technique assigns optimal weights to each DMU to maximize individual performance scores [53]. Several DEA models exist, accounting for returns to scale and model orientation. The constant returns to scale (CRS) model assumes proportional variation between inputs and outputs [49], whereas the variable returns to scale (VRS) model accounts for increasing, constant, or decreasing returns [54]. DEA can also be input-oriented, focusing on minimizing inputs for a given output, or output-oriented, focusing on maximizing outputs given a fixed set of inputs.
Maximize i = 1 m u i y i 0 subject to j = 1 n v j x j 0 = 1 i = 1 m u i y i k j = 1 n v j x j k 0 , for k = 1 , 2 , , h Minimize j = 1 n v j x j 0 subject to i = 1 m u i y i 0 = 1 i = 1 m u i y i k j = 1 n v j x j k 0 , for k = 1 , 2 , , h
The following formula describes the input- and output-oriented versions of the VRS model, respectively.
Maximize i = 1 m u i y i 0 + w subject to j = 1 n v j x j 0 = 1 i = 1 m u i y i k j = 1 n v j x j k + w 0 , for k = 1 , 2 , , h w without sign restriction Minimize j = 1 n v j x j 0 w subject to i = 1 m u i y i 0 = 1 i = 1 m u i y i k j = 1 n v j x j k + w 0 , for k = 1 , 2 , , h w without sign restriction
where x j k represents the amount of input j used by company k; y i k represents the amount of output i produced by company k; x j 0 represents the amount of input j used by the company under evaluation; y i 0 represents the amount of output i produced by the company under evaluation; v j represents the weight (or importance) assigned to input j; u i represents the weight assigned to output i; θ denotes the efficiency score of the company being analyzed (used in some DEA formulations, although not shown explicitly in the current ones); w is a free variable that captures the contribution of company k to the evaluated company’s objective, without sign restriction; m is the number of outputs analyzed; n is the number of inputs analyzed; and h denotes the total number of companies (decision-making units) being considered in the model.
This study employed the output-oriented VRS model, which was considered more suitable for cross-country comparisons involving nations of varying sizes, particularly in the context of global renewable energy expansion. However, DEA models are subject to a limitation involving efficiency score ties. Figure 1 illustrates the DEA model according to the selected inputs and outputs.

3.3. Inverted Frontier

To address this issue, the inverted frontier (IF) technique was applied. The problem of ties, where multiple countries obtain identical DEA scores, complicates rank interpretation. This challenge was previously addressed by Angulo-Meza and Lins [55] through the adoption of the IF technique, originally proposed by Yamada et al. [56] and further supported by Leta et al. [57].
The IF method reconfigures the DEA model by inverting the positioning of inputs and outputs, exposing suboptimal practices. Consequently, the composite index computed in this study reflects two scenarios: the traditional DEA frontier (representing best practices) and the inverted DEA frontier (representing worst practices). The final composite score, termed the Renewable Energy Indicator (REI), was calculated using a γ value of 0.5, representing the average between both frontiers, as shown in Equation (1).
The REI holds significance by integrating variables commonly overlooked in earlier studies but deemed critical within sustainable development frameworks, particularly those advocated by the United Nations. Among these variables are methane emissions and PM2.5 air pollution—factors closely aligned with contemporary environmental policy priorities. A further contribution of this methodology is the empirical assessment of renewable energy efficiency across different developmental and income-level country groups, as explored in the subsequent section.
The IF approach provides two key advantages: first, it generates an index based on each country’s inefficiencies; second, it defines a frontier that reflects worst-performing practices rather than best ones. In this study, the IF method was employed to evaluate renewable energy efficiency. The REI was calculated as the average of the traditional DEA efficiency score ( D E A t r a d i t i o n a l ) and one minus the Inverted Frontier score ( D E A I n v e r t e d F r o n t i e r ), as illustrated in Equation (1) [57].
C I = γ D E A traditional + ( 1 γ ) ( 1 D E A Inverted Frontier ) , with 0 α 1
where γ 0 , 1 is a weighting parameter. The first term of the equation, D E A t r a d i t i o n a l , refers to the efficiency obtained from the classical efficient frontier, while the second term, 1 D E A I n v e r t e d F r o n t i e r , represents the distance of the unit from the worst frontier (or inverted frontier), reinterpreted as an indicator of relative efficiency. Thus, the index C I allows for the simultaneous incorporation of information on how close a unit is to the efficient frontier and how far it is from the inefficient frontier, providing a more comprehensive measure if performance.
In this sense, the composite index considers two situations: when countries are compared based on their strongest points (traditional frontier) and when countries are compared based on their weakest points (inverted frontier). This research work computes the value γ equal to 0.5 to aggregate the classical and inverted boundary results (in Equation (1)), which means that this study used the average between the two boundaries.
The composite indicator, which combines the traditional and inverted frontiers, is called REI. This metric holds significance, as it incorporates variables that have been overlooked in prior studies but are highly regarded in the context of sustainable development strategies, particularly those endorsed by organizations such as the United Nations (UN). Notably, the REI encompasses factors such as methane emissions and PM 2.5 air pollution, which align with the broader goals of sustainable development. Moreover, a distinctive contribution of this research lies in its empirical investigation of various developmental and income groups, as discussed in the following section.

3.4. Development and Income Group Tests

Through development and income group analysis, the present study aimed to identify patterns in renewable energy efficiency across diverse socio-economic segments, which corresponds to developed or developing countries or income groups (high-, middle-, and low-income regions). This approach introduced a novel perspective, providing insights into the heterogeneous dynamics of environmental efficiency among country groups and contributing to a more comprehensive understanding of the broader implications of renewable energy adoption. In this context, environmental efficiency refers to the ability of countries to reduce pollutant emissions and the use of fossil fuels while simultaneously expanding the use of renewable energy sources and improving access to electricity in both rural and urban areas. The analysis facilitated the testing of multiple hypotheses concerning the relationship between renewable energy performance and environmental conditions.
Hypothesis 1.
There will be differences in the environmental efficiencies between developed and developing countries.
Hypothesis 2.
There will be differences in environmental efficiencies between income groups (low-, middle-, and high-income).
The environmental efficiency scores for the selected countries were first calculated using the DEA model. Environmental efficiency, in this context, reflects how effectively a country transforms inputs, such as energy use or industrial activity, into desirable outputs like economic performance, while minimizing undesirable outputs such as C O 2 emissions. Subsequently, the hypotheses were evaluated based on these efficiency scores. Following the recommendation by Min et al. [58], the Kolmogorov–Smirnov test was applied to assess the normality of the efficiency data. In cases where DEA efficiency scores did not follow a normal distribution, non-parametric methods—namely, the Mann–Whitney U test and the Kruskal–Wallis H test—were employed. Furthermore, Lee et al. [59] argue that DEA is a widely applied non-parametric approach for assessing the relative efficiency of decision-making units (DMUs). In this sense, the use of non-parametric tests such as the Mann-Whitney and Kruskal–Wallis H is particularly valuable for analyzing differences between country groups when applying data envelopment analysis (DEA). DEA produces efficiency scores that often do not follow a normal distribution, especially when dealing with heterogeneous units like countries with diverse economic, social, and environmental characteristics. In such cases, non-parametric tests provide a robust statistical approach to compare the distribution of efficiency scores across different groups—for instance, comparing developed and developing countries or regions with varying renewable energy policies. Unlike parametric tests, these methods do not rely on strict assumptions about data normality or variance homogeneity, making them well-suited to detect significant differences between groups in the context of DEA results. Consequently, they complement DEA by providing statistically sound evidence to support conclusions about performance disparities among country groups. This step was necessary due to the limitations of regression analysis, which requires the residuals of the dependent variable to meet the assumption of normal distribution [58]. The comparative analysis between country groups relied on non-parametric tests that do not assume a specific data distribution [60]. Following the methodology proposed by Min et al. [58], the Mann–Whitney U test was used to test Hypothesis 1, comparing environmental efficiency between developed and developing countries. The Kruskal–Wallis H test was applied to test Hypothesis 2, which examined differences among low-, middle-, and high-income country groups.
Non-parametric tests, such as the Mann–Whitney U and Kruskal–Wallis H tests, are particularly suitable when the data violate the assumptions required for parametric testing. The Mann–Whitney U test [61] is widely applied for comparing the distributions of two independent groups when the data are not normally distributed. Unlike the independent samples t-test, which assumes normality, the Mann–Whitney U test evaluates whether the distributions of ranks differ significantly between the two groups. In this case, developed and developing countries were combined into a single dataset and ranked before conducting the test. The test statistics, U1 and U2, were then calculated accordingly. The Mann–Whitney U statistics, U1 and U2, are defined as
U 1 = n 1 n 2 + n 1 ( n 1 + 1 ) / 2 R 1
U 2 = n 1 n 2 + n 2 ( n 2 + 1 ) / 2 R 2
where R 1 and R 2 are the sum of the ranks of the developed and developing country groups, respectively, and n 1 and n 2 are the number of observations of the developed and developing country groups. If the number of observations in each group is larger than eight, z statistics can be used to test the difference between U 1 and U 1 [61]. The statistics are
z = U μ σ = U ( n 1 n 2 2 ) n 2 n 2 ( n 1 + n 2 + 1 ) 12
In the above formula, U = min { U 1 , U 2 } and μ = ( U 1 + U 2 ) / 2 = ( n 1 n 2 ) / 2 ; μ corresponds to the average of U distribution and σ refers to its standard deviation.
The Kruskal–Wallis H test [62] served as a non-parametric alternative to one-way ANOVA, comparing the distributions of three or more independent groups. Unlike ANOVA, which requires data to follow an F-distribution, the Kruskal–Wallis H test does not depend on distributional assumptions. In this analysis, the Kruskal–Wallis test compared the environmental efficiency scores of low-, middle-, and high-income countries. The null hypothesis of the Kruskal–Wallis H test posited that the medians of the three income groups were equal, while the alternative hypothesis suggested that at least one group median differed significantly from the others.
H = 12 N ( N + 1 ) i = 1 k R i 2 / n i 3 ( N + 1 )
The H statistics is defined as follows: N is total number of observations, k is the number of groups, n 1 is the number of observations in group i, and R i is the rank sum of group i.

4. Results

This section presents a comprehensive analysis of the outcomes derived from the Renewable Energy Indicator (REI), categorized by global performance, developmental classification, and income group. The objective was to identify trends and disparities in renewable energy efficiency across different world regions and socio-economic contexts.

4.1. Global Analysis

The analysis encompassed 133 countries, and the results reflected efficiency scores ranging from 0 to 1. This scale was used to represent relative environmental efficiency, where values closer to 1 indicated higher efficiency within the sample. It is important to note that a score of 1 did not represent absolute or theoretical maximum efficiency, but rather the best observed performance among the countries under evaluation.
The REI scores, normalized between 0 and 1, provided a standardized metric to compare countries. Higher scores (approaching 1) were associated with nations that emitted lower levels of environmental pollutants, including CO2 emissions (metric tons per capita), methane emissions from agriculture (thousand metric tons CO2 equivalent), and PM2.5 exposure (micrograms per cubic meter), while also producing more electricity from renewable sources excluding hydroelectric (in kWh) and achieving broader electricity access across both rural and urban populations (percentage of population). Conversely, countries with scores approaching 0 exhibited lower performance in these areas, reflecting relatively inefficient outcomes in terms of environmental and energy-related sustainability.
Figure 2 illustrates the correlation between REI scores and pollutant emission indicators. The results indicated that higher REI values were generally associated with lower levels of CO2, methane, and PM2.5 emissions, reinforcing the validity of the index as a proxy for environmental efficiency in the context of renewable energy deployment.
The REI demonstrated a negative correlation with pollutant emissions. Specifically, PM2.5 air pollution (µg/m3) exhibited a correlation of −50% with the REI, followed by methane emissions with −31%, and CO2 emissions with −10%. These findings emphasized the inverse relationship between renewable energy efficiency, as captured by the REI, and the levels of environmentally harmful emissions.
Descriptive statistics of the REI across the full set of 133 countries revealed key patterns. The mean REI was 0.4318, with a standard deviation of 0.2130 and a coefficient of variation of 49.33%. These statistical indicators provided important insights into global renewable energy performance, serving to characterize the average efficiency level and the overall distribution of results. Notably, the REI scores of 72 countries—representing approximately 54.13% of the sample—fell below the mean value. This highlighted that more than half of the countries under analysis exhibited below-average renewable energy efficiency.
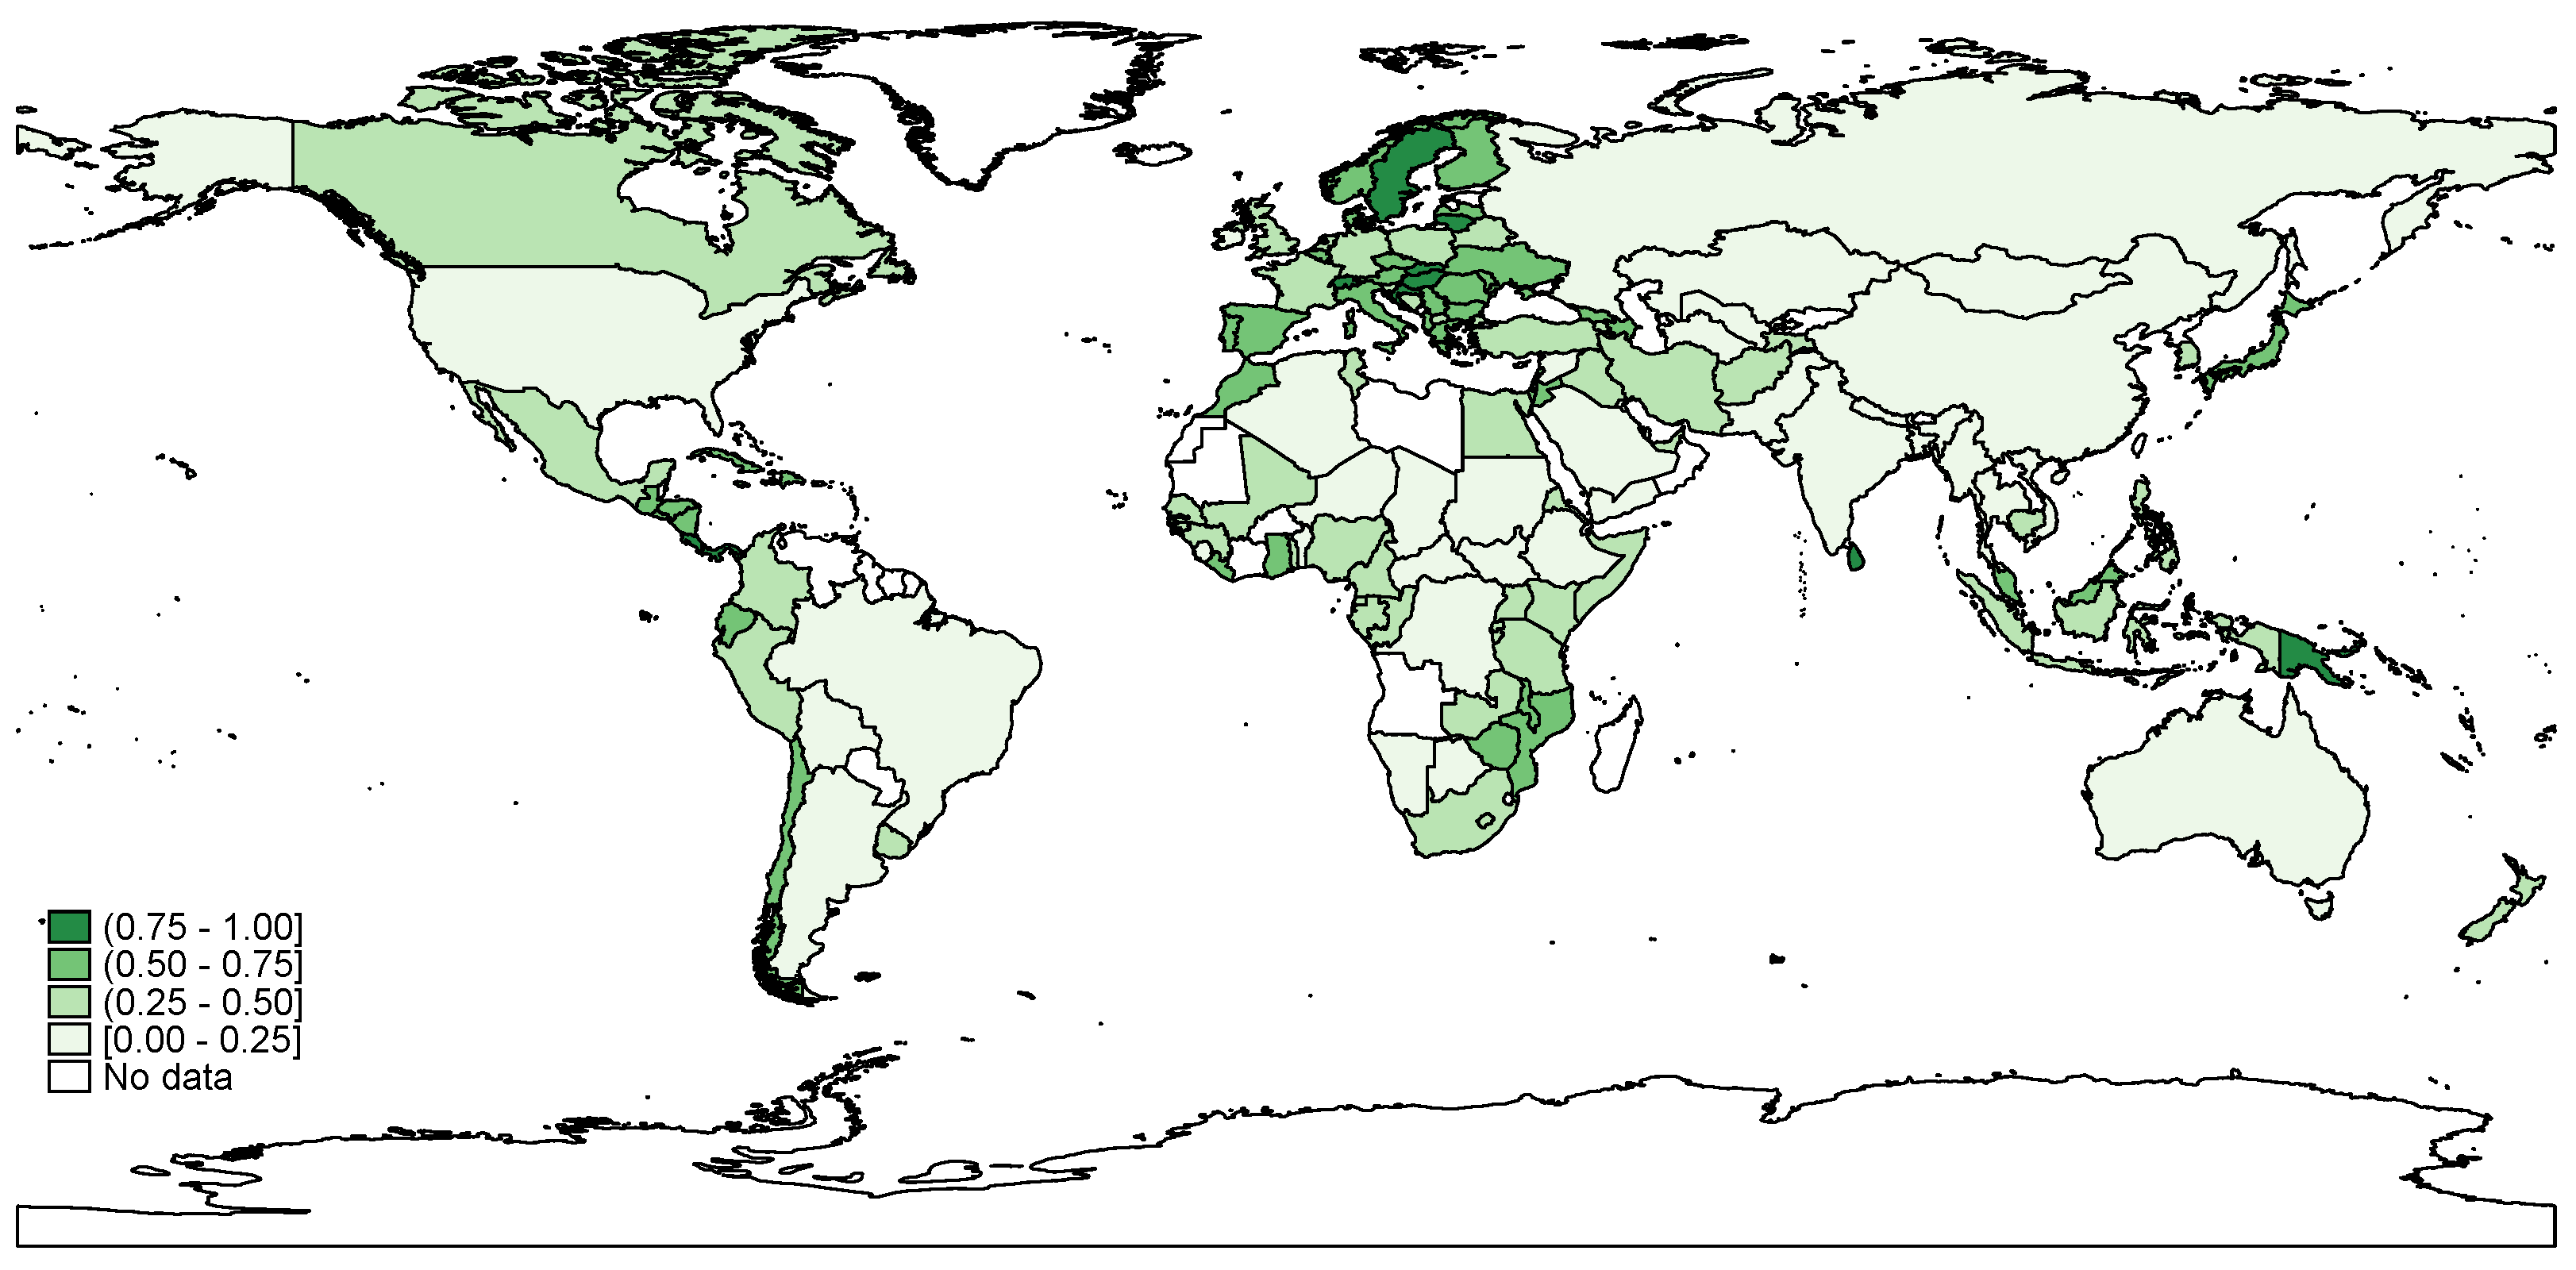
Figure 3 presents a visual representation of the global distribution of REI scores.
The color-coded scheme in Figure 3 delineates distinct levels of REI, with dark green representing higher REI values, indicative of greater efficiency in renewable energy utilization. In contrast, light green corresponds to lower REI scores, reflecting comparatively limited efficiency in the adoption and application of renewable energy sources. This visual representation functioned as a valuable analytical tool for identifying and comparing efficiency levels across geographic regions, offering insight into the global distribution of renewable energy performance.
Countries falling within the first quartile (REI between 0.75 and 1.0) were predominantly located in Central and Northern Europe, including Sweden, Hungary, Switzerland, Portugal, and Norway. In addition, some developing countries—such as Sri Lanka, Costa Rica, Lithuania, and Panama—also appeared within this high-efficiency group, illustrating that advanced renewable energy adoption was not exclusive to high-income nations.
Conversely, the lowest-performing countries, positioned within the fourth quartile (REI between 0.0 and 0.25), were primarily from developing or low-income regions. This group included nations such as South Sudan, Mongolia, Pakistan, and Vietnam, which exhibited limited efficiency in renewable energy deployment and environmental outcomes.
It was also notable that certain developed and globally influential economies did not achieve high rankings in renewable energy efficiency. The United States of America ranked 101st, Brazil 102nd, India 104th, China 105th, and Russia 120th. These results highlighted the complex and context-specific nature of renewable energy efficiency, suggesting that economic prominence did not necessarily correspond with environmental or energy-related efficiency.
Figure 4 illustrates the complex—or in some cases, weak—relationship between the REI and gross domestic product (GDP) per capita across different development categories.
Within the context of Figure 4, the black dots represent countries classified as developing economies, while the red dots denote developed economies. The data revealed substantial variation in REI performance even among affluent nations. For instance, Sweden, a developed country, achieved the highest REI score, demonstrating outstanding efficiency in renewable energy utilization. In contrast, Australia, also categorized as a developed nation, recorded one of the lowest REI scores, reflecting relatively limited success in the implementation and effectiveness of renewable energy practices. This disparity underscored the complex and heterogeneous factors influencing renewable energy efficiency, even within high-income contexts, thereby reinforcing the importance of conducting multifactorial analyses.
The subsequent analysis focused on identifying and examining the ten most efficient and the ten least efficient countries, as determined by the REI. Table 2 presents a summary of the top ten countries globally in terms of renewable energy performance. This emphasis on leading examples aimed to highlight best practices and successful strategies that could serve as benchmarks. By spotlighting these cases, the analysis sought to offer informative insights that could guide future policy development and international initiatives aimed at improving environmental efficiency. This focused evaluation contributed to the broader discussion on the advancement of sustainable energy practices and policy frameworks.
Within the top ten countries based on the REI, a discernible balance existed between developed and developing economies, with six nations classified as developed and four belonging to developing regions. Additionally, the majority of these top-performing countries (seven out of ten) fell within the high-income group category. Notably absent from the top ten were countries characterized by large population sizes or extensive territorial expanses. This observation suggested a trend in which countries with smaller populations and territories tended to exhibit more favorable REI scores. This pattern may be explained by the inclusion of methane emissions in the REI, which are predominantly influenced by agricultural activities. Consequently, nations with extensive agricultural sectors, such as Brazil and the United States of America, showed diminished REI performance due to the negative impact of methane emissions.
As previously indicated, the mean REI score among the 133 countries was 0.4318. Consistent with expectations, the average REI of the top 10 countries (0.8373) significantly exceeded the overall mean, highlighting the superior renewable energy efficiency of these leading nations and contributing to a refined understanding of the global environmental sustainability landscape.
These countries shared a common emphasis on environmental concerns, frequently implementing measures to promote sustainable practices. Many were recognized for proactive initiatives in renewable energy development, environmental conservation, and climate change mitigation. For example, Sweden established binding targets to achieve net-zero emissions by 2045 [63]. According to Eurostat data from 2017, Sweden led the European Union with a renewable energy share of 54.5%, followed by Finland at 41.01% and Latvia at 39.01%. Within the Baltic States, Lithuania reported a notable share of 25.84% [64]. Switzerland also acknowledged the critical role of renewable energy in reducing CO2 emissions [65]. These examples underscored the global recognition of renewable energy as a key factor in promoting environmental sustainability.
Moreover, certain developing countries demonstrated efficiency in reducing pollutant emissions and advancing renewable energy. Sri Lanka (ranked second) and Costa Rica (ranked third) exhibited strong REI performances. Sri Lanka’s success was attributed to the rapid expansion of its renewable energy sector, supported by a feed-in tariff system encouraging diversification of renewable energy sources [66], as well as the implementation of off-grid hybrid renewable energy systems for rural electrification [67]. Similarly, Costa Rica stood out for promoting multiple renewable sources—including hydro, mini-hydro, wind, geothermal, and solar—which accounted for nearly 90% of its electricity production [68]. These cases illustrated the global diversity of approaches to sustainable and renewable energy adoption.
Table 3 presents the ranking of the bottom-10 countries based on the REI. This group was predominantly composed of developing nations with low and lower-middle-income classifications. While the mean REI across all countries was 0.4318, the average REI of the bottom-10 countries was substantially lower at 0.1027. This marked difference emphasized the significant performance gap, indicating that these countries exhibited the poorest outcomes in converting pollutants into renewable energy and providing electricity access. The stark contrast between the overall sample mean and the bottom-10 average highlighted the substantial challenges faced by these nations in achieving satisfactory environmental efficiency.
A prevailing characteristic shared among the enumerated countries was the presence of significant challenges, including political instability, economic difficulties, technological limitations for renewable energy generation, and, in some cases, internal conflicts or instability [69,70]. Additionally, these nations faced socio-economic issues such as poverty, limited access to essential resources, and, in certain instances, human rights concerns. A notable example was South Sudan, whose political economy exhibited unconventional traits. Following independence in 2011, the country descended into renewed civil conflict in 2013, contending with the complexities of a fragile neo-patrimonial guerrilla government. The military-political systems in South Sudan remained fragmented, extending across extensive borderlands [71].
Conversely, Australia stood out as one of the less environmentally efficient countries, a situation attributed partly to substantial methane emissions originating from coal mines [72], livestock, and ruminants [73,74]. Similarly, in Argentina, the considerable cattle population and beef production contributed to increased methane emissions [75,76]. The Argentine economy confronted multiple economic challenges, including high inflation and a significant prevalence of impoverished families, factors that potentially hindered focused investment in renewable energy initiatives [77]. This multifaceted analysis highlighted the intricate interplay between environmental efficiency and the socio-economic context, underscoring the diverse hurdles faced by countries in advancing renewable energy adoption.
In summary, the comprehensive global analysis undertaken in this study elucidated a discernible concentration of higher efficiency within regions predominantly composed of high- and upper-middle-income countries. In contrast, the less efficient group consisted mainly of low- and lower-middle-income regions. This finding challenged the assumption that higher income levels inherently correlated with greater efficiency, particularly when analyzing the inputs and outputs within the DEA framework. Furthermore, it was emphasized that countries characterized by inefficiency frequently confronted technological deficits alongside various economic and social impediments. The exploration of these economic disparities among development groups constituted a significant contribution of this study, providing a nuanced evaluation of each group independently. This approach enhanced the understanding of the complex interplay between economic development, resource utilization efficiency, and the multifaceted challenges faced by countries across different income brackets.

4.2. Group Development Analysis

An initial examination was conducted to assess the statistical distinction in the REI between developed and developing nations. Mann–Whitney U tests were employed to test Hypothesis 1 (H1). The results indicated a statistically significant difference in the efficiency ranks of the two groups at the 1% significance level (Mann–Whitney U = 1304, z = –5.61112). Consequently, it was asserted, with statistical significance at the 1% level, that developed and developing countries differ in their ability to reduce environmental impacts while expanding access to renewable electricity, as evidenced by the application of the DEA model. This finding contributed to a more nuanced understanding of disparities in environmental efficiency across different stages of development.
A comparative analysis of the indicators revealed distinct patterns between developed and developing countries. Developed countries exhibited an average REI of 0.5418, whereas developing countries presented a lower average of 0.3838. These results suggested that, on average, developed economies demonstrated higher efficiency levels compared to their developing counterparts. Thus, the indicator highlighted that developed countries generally exhibited superior environmental renewable energy efficiency. The comparison of these statistical parameters enhanced the understanding of socio-economic disparities influencing environmental performance across the two groups.
Surprisingly, 56.1% of developed countries demonstrated REI values below the overall average, indicating that a substantial portion within this category performed below the mean. Similarly, 54.25% of developing countries exhibited values below the computed average, reflecting widespread below-average performance within this group. These findings provided additional insight into the nuanced variation and distribution of efficiency scores, underscoring the prevalence of below-average performance in both developed and developing regions. Table 4 presents the top five developed countries according to the REI.
It was crucial to observe that the top five developed nations based on the Renewable Energy Indicator (REI) were Sweden, Japan, Spain, Lithuania, and the United Kingdom. These countries were geographically dispersed, indicating no regional concentration. A common characteristic among these nations was the presence of adequate productive structures conducive to providing technology for renewable energy production. This underscored the significance of technological infrastructure and capacity as pivotal factors contributing to their high efficiency in renewable energy utilization.
Chen and Khattak [78] examined the Japanese context, exploring the interconnection between economic complexity and renewable energy adoption, with particular focus on electric hybrid vehicles. Despite Japan’s advanced technology, significant challenges related to air pollution and methane emissions were identified. The population concentration in densely populated urban areas such as Tokyo contributed to air pollution due to intense traffic and industrial activities. The study highlighted that Japan’s economic complexity played a crucial role in influencing its innovation capacity and the adoption of sustainable technologies. Specifically, economic complexity provided a solid foundation for the development and implementation of electric hybrid vehicles. Furthermore, Japan’s consistent investment in research and development contributed to its privileged position in the renewable energy landscape.
The research also emphasized Japan’s historical dependence on non-renewable energy sources and the urgent need to reduce carbon dioxide emissions. Growing environmental awareness and the government’s commitment to sustainable goals were driving efforts to seek ecological solutions such as electric hybrid vehicles. The study concluded that the combination of Japan’s innovation tradition, favorable economic complexity, and environmental awareness created an environment conducive to adopting and continuously developing renewable energy technologies, thereby supporting Japan’s transition toward a more sustainable future.
Table 5 presents the ranking of developed countries with the poorest performance. Poland, Ireland, Belarus, the Netherlands, and Australia exhibited the lowest efficiency levels among developed nations. Australia, as previously discussed, was among the least environmentally efficient countries, partly due to substantial methane emissions from coal mines, livestock, and ruminants. These emissions contributed significantly to the country’s low environmental efficiency. Grell et al. [79] highlighted the need to measure the biochemical methane potential values for dairy manure waste in Australia, pointing to the lack of specific data impacting emission estimates and biogas energy potential in the dairy sector. Sadavarte et al. [72] discussed methane emissions from Australian coal mines, emphasizing the lack of spatial allocation and detailed information on emission control strategies at the mine level. Lumbers, Barley, and Platte [80] underscored the importance of significant methane emission reductions in hydrogen production to decarbonize Australian iron ore mines, aligning with environmental commitments and stricter regulations.
Table 6 provides insights into the most efficient developing countries in converting pollutant emissions into renewable energy and achieving electricity access. Panama, Sri Lanka, Costa Rica, Papua New Guinea, and the Dominican Republic emerged as the top five countries in this regard. These countries shared common characteristics, such as small population sizes and limited territorial expanses. This aspect was significant in interpreting the Renewable Energy Indicator (REI), as these countries were less likely to engage in extensive agricultural activities and thus emitted lower levels of methane gas. Furthermore, as previously noted, both Sri Lanka and Costa Rica implemented policies aimed at diversifying their energy matrices, which contributed to their notable efficiency in the renewable energy sector. The conjunction of these factors underscored the importance of population size, territorial extent, and the implementation of strategic policies in achieving high environmental efficiency within the developing country context.
Table 7 elucidates the least efficient developing economies based on the Renewable Energy Indicator (REI). A noteworthy observation was that among the bottom five, economies experiencing political and economic instability were prominently represented. Furthermore, the case of Argentina stood out, with its low REI ranking attributed to the significant influence of the cattle and beef industry on the country’s economy. This highlighted the intricate interplay between economic structures and environmental efficiency within the developing country context. The presence of economies facing instability suggested a potential correlation between political and economic challenges and lower environmental efficiency, emphasizing the need for a comprehensive understanding of the multifaceted factors influencing renewable energy performance in developing nations.
In the cases of Sudan and South Sudan, Asane-Otoo [81] analyzed African economies and found that industrialization exerted a discernible influence on carbon emissions within both lower- and middle-income nations. However, it was observed that the impact of industrialization on carbon emissions was notably more pronounced in countries characterized by middle-income status. In this context, rapid economic expansion in developing nations gave rise to significant energy and environmental challenges [82] Notably, economic growth was closely linked to increased energy consumption. China, for instance, exhibited energy consumption seven times higher than Africa’s, representing 23% of global primary energy consumption, thereby contributing to adverse impacts on air quality [83,84].

4.3. Income Group Analysis

This section analyzes the REI from an income group perspective. The Kruskal–Wallis H test was conducted to verify Hypothesis 2 (H2), investigating differences among three income groups (high-, middle-, and low-income). The analysis revealed a statistically significant difference among the groups at the 1% level (Kruskal–Wallis H test = 20.7915, N = 133). Therefore, the Kruskal–Wallis H test validated Hypothesis 2, elucidating discernible distinctions among income groups across countries.
A comparative analysis of indicators for countries categorized into high-, middle-, and low-income groups revealed clear patterns. High-income countries exhibited the highest average REI at 0.5265, followed by middle-income countries at 0.4195, and low-income countries at 0.3003. Surprisingly, 37% of low-income countries fell below the calculated mean, highlighting a considerable proportion of nations performing below average within this group. This gradient in REI averages across income groups underscored a systematic variation in the efficiency of converting pollutants into renewable energy and achieving electricity access. The disparity in averages highlighted the importance of income levels in influencing environmental efficiency, suggesting a positive correlation between income and renewable energy performance. Table 8 presents the five high-income countries with the best REI scores.
In this context, the best-performing high-income countries were Sweden, Hungary, Switzerland, Israel, and the Slovak Republic. As highlighted by Mazanec and Bartosova [85], sustainability emerged as a crucial issue in the Slovak Republic, gaining prominence across economic, environmental, and social spheres. The country’s environmental legislation and policies aimed to promote sustainable practices, including regulations for environmental protection, waste management, and renewable energy. Active initiatives developed in the Slovak Republic encompassed energy efficiency programs, nature conservation, environmental education, and sustainable development. Although the Slovak Republic faced challenges such as waste management, air pollution, and biodiversity conservation, these obstacles were regarded as opportunities for innovation and sustainable solutions. Consequently, coordinated efforts were directed toward ensuring a sustainable future for the country and its population.
In contrast, Table 9 summarizes the poorest REI performance among high-income countries. Countries such as New Zealand, Qatar, Slovenia, Ireland, and Australia exhibited the lowest REI scores.
In conducting a comparative analysis of indicators pertaining to the top five middle-income countries, it was observed that these countries exhibited a mean REI of 0.8841, a standard deviation of 0.0728, and a coefficient of variation of 8.23%. Table 10 summarizes the best REI performances among middle-income countries. Notably, Sri Lanka, Costa Rica, Honduras, Guatemala, and the Dominican Republic presented the highest REI scores.
In conducting a comparative analysis of indicators for the bottom five middle-income countries, it was observed that these countries exhibited a mean REI of 0.0580, a standard deviation of 0.0537, and a coefficient of variation of 92.67%. Table 11 summarizes the poorest REI performances among middle-income countries. Notably, Pakistan, Benin, Mongolia, Botswana, and Namibia presented the lowest REI scores.
In conducting a comparative analysis of indicators for the top five low-income countries, it was observed that these countries exhibited an average REI of 0.5238, a standard deviation of 0.1537, and a coefficient of variation of 29.34%. Table 12 summarizes the highest REI performances among low-income countries. Notably, Afghanistan, Burundi, Central African Republic, Chad, and the Democratic Republic of Congo presented the best REI outcomes.
In conducting a comparative analysis of indicators for the bottom five low-income countries, it was observed that these countries exhibited an average REI of 0.5716, a standard deviation of 0.1440, and a coefficient of variation of 25.19%. Table 13 summarizes the lowest REI performances among low-income countries. Notably, Sudan, the Syrian Arab Republic, Togo, Uganda, and Yemen presented the poorest REI outcomes.
Upon the presented findings, there arises the capability to infer conclusions of a more comprehensive nature regarding the research issue.

5. Conclusions

This article undertook a comprehensive analysis of countries’ performance in reducing pollutant emissions, encompassing agricultural methane emissions, CO2 emissions, fossil fuel energy consumption, and PM2.5 air pollution. The overarching objective was to develop a non-parametric, DEA-based indicator capable of measuring the environmental performance of renewable energy at the national level across the globe—the Renewable Energy Indicator (REI). From a scientific perspective, this research fills a critical gap by providing a robust and comparable tool to evaluate how effectively countries are integrating renewable energy while mitigating environmental harm, an area that previously lacked standardized measurement approaches. Socially, this research is justified by the urgent global need to promote cleaner energy sources to reduce health risks associated with air pollution, particularly in vulnerable populations, and to ensure equitable access to sustainable energy, especially in developing regions. The findings underscore the imperative for enhanced development practices specifically designed to bolster the adoption of renewable energy. It is emphasized that such practices must be tailored to address the distinct needs, capacities, and socio-economic contexts of different countries and regions. By providing empirical evidence to guide policymakers, the outcomes of this study are positioned as instrumental in informing targeted interventions aimed at improving renewable energy efficiency, reducing environmental inequality, and accelerating the transition of nations toward more sustainable and inclusive energy models.
In this context, the article introduced the Renewable Energy Indicator (REI), unveiling the potential for top-10 performance globally among both developed countries (e.g., Sweden) and developing countries (e.g., Costa Rica and Sri Lanka). Notably, countries in Central and Northern Europe emerged among the most efficient, while those grappling with political and economic instability remained among the lowest performers. Additionally, nations characterized by predominant agricultural sectors, such as Australia and Argentina, exhibited poorer REI performance due to substantial methane emissions.
The comparative analysis of indicators between developed and developing countries revealed significant disparities in the REI. These disparities emphasize the necessity of understanding the distinct socio-economic dynamics between these two groups, offering essential insights for the formulation of effective policies and strategies. These results provide empirical support for Hypothesis 1, which posited that there would be differences in environmental efficiencies between developed and developing countries. The examination of the interplay between agricultural methane emissions, CO2 emissions, fossil fuel energy consumption, and PM2.5 air pollution with renewable energy consumption and electricity access highlights the critical importance of balanced public policies. Such policies should not only promote renewable energy use but also address the adverse effects of pollution. Existing literature reinforces the direct connection between renewable energy, air pollution, and energy efficiency, emphasizing the role of government incentives in steering the transition toward more sustainable energy sources.
Furthermore, the comparative analysis across high-, middle-, and low-income countries revealed distinct patterns, providing guidance for tailoring strategies to each income group. These findings also corroborate Hypothesis 2, which anticipated differences in environmental efficiencies across income groups. However, this study acknowledges several limitations. First, the REI lacks temporal analysis, and future research should incorporate the evolution of renewable energy over time. Second, the REI does not include gross domestic product as an input, which may affect country rankings relative to available wealth. Third, to offer more robust policy recommendations, future studies may consider alternative methodological approaches, such as second-stage DEA analyses integrating econometric techniques to evaluate determinants of the REI.
Based on the findings, three key policy recommendations are proposed. First, it is imperative to implement country-specific renewable energy development frameworks that align with the unique socio-economic, environmental, and sectoral conditions of each nation. In countries with high agricultural methane emissions, such as Australia and Argentina, policies should prioritize investments in low-emission technologies and biogas solutions, alongside strategies to expand clean energy infrastructure.
Second, government incentives must be strengthened to simultaneously support renewable energy expansion and pollution mitigation. Fiscal and regulatory mechanisms—such as targeted subsidies, tax incentives, and carbon pricing—should be designed to encourage both renewable energy adoption and reductions in PM2.5 and CO2 emissions. These incentives must be tailored to local contexts to ensure that the energy transition is both economically viable and socially inclusive.
Third, the study highlights the need to establish income-sensitive policy instruments to bridge the renewable energy gap among countries at different stages of development. High-income countries may focus on technological innovation and energy efficiency, while low- and middle-income countries require international financing, technology transfer, and institutional capacity-building. Such differentiation ensures that renewable energy adoption contributes to sustainable development without exacerbating existing inequalities.
Despite the valuable contributions of this study, some limitations should be acknowledged, which also point to important directions for future research. First, the Renewable Energy Indicator (REI) developed in this study is based on a cross-sectional analysis and does not capture temporal dynamics, limiting the understanding of how countries’ environmental performance evolves over time. Future studies should incorporate longitudinal data to track progress, assess policy impacts, and reveal trends in renewable energy adoption and pollution reduction. Second, the REI does not consider gross domestic product (GDP) as an input, which may influence the interpretation of efficiency scores by overlooking the role of countries’ economic capacity in shaping their environmental performance. Including GDP or alternative wealth indicators in future research could offer a more nuanced understanding of the relationship between economic development and environmental efficiency. Third, although this study applies to a non-parametric DEA approach, it does not explore second-stage analyses that could reveal the socio-economic, political, or institutional factors driving differences in REI performance. Future research should adopt integrated methodological approaches, such as combining DEA with econometric techniques, to investigate the determinants of renewable energy efficiency and provide more robust, evidence-based policy recommendations.
In conclusion, this article advocates for personalized approaches and tailored strategies to promote renewable energy efficiency across diverse contexts. The overarching goal is to facilitate a transition toward more sustainable energy models and mitigate the adverse environmental impacts associated with conventional energy sources. Within this transition, energy efficiency emerges as a key element to enhance the effectiveness of renewable energy initiatives, amplify their environmental benefits, and ensure the long-term sustainability of energy systems.

Author Contributions

Conceptualization, G.B.B. and D.F.; methodology, G.B.B.; software, G.B.B. and D.F.; validation, D.F., G.M.P.d.M. and L.B.M.V.V.; formal analysis, G.B.B.; investigation, G.B.B.; data curation, G.B.B. and D.F.; writing—original draft preparation, G.B.B.; writing—review and editing, G.M.P.d.M. and L.B.M.V.V.; supervision, D.F.; project administration, D.F.; funding acquisition, D.F. All authors have read and agreed to the published version of the manuscript.

Funding

Diogo Ferraz acknowledges the National Council for Scientific and Technological Development (CNPq)-Productivity Grant 311036/2022-8.

Institutional Review Board Statement

Not applicable.

Data Availability Statement

The data are available upon request from the authors.

Conflicts of Interest

The authors declare no conflicts of interest.

Appendix A

Table A1 shows the ranking of countries used in this work, by income and level of development.
Table A1. Countries by income and level of development.
Num.CountriesDevelopment GroupIncome GroupNum.CountriesDevelopment GroupIncome Group
1SwedenDeveloped economiesHigh income69PhilippinesDeveloping economiesLower middle income
2Sri LankaDeveloping economiesLower middle income70IndonesiaDeveloping economiesUpper middle income
3Costa RicaDeveloping economiesUpper middle income71PolandDeveloped economiesHigh income
4LithuaniaDeveloped economiesHigh income72RwandaDeveloping economiesLow income
5PanamaDeveloping economiesHigh income73SloveniaDeveloped economiesHigh income
6HungaryDeveloped economiesHigh income74GermanyDeveloped economiesHigh income
7Papua New GuineaDeveloping economiesLower middle income75CanadaDeveloped economiesHigh income
8CroatiaDeveloped economiesHigh income76CambodiaDeveloping economiesLower middle income
9Slovak RepublicDeveloped economiesHigh income77BelarusDeveloped economiesUpper middle income
10SwitzerlandDeveloped economiesHigh income78GabonDeveloping economiesUpper middle income
11LatviaDeveloped economiesHigh income79NigeriaDeveloping economiesLower middle income
12IsraelDeveloped economiesHigh income80FranceDeveloped economiesHigh income
13BulgariaDeveloped economiesUpper middle income81ColombiaDeveloping economiesUpper middle income
14PortugalDeveloped economiesHigh income82BurundiDeveloping economiesLow income
15AlbaniaDeveloped economiesUpper middle income83South AfricaDeveloping economiesUpper middle income
16SingaporeDeveloping economiesHigh income84AfghanistanDeveloping economiesLow income
17HondurasDeveloping economiesLower middle income85IraqDeveloping economiesUpper middle income
18NorwayDeveloped economiesHigh income86KenyaDeveloping economiesLower middle income
19Dominican RepublicDeveloping economiesUpper middle income87NetherlandsDeveloped economiesHigh income
20MoldovaDeveloped economiesUpper middle income88TanzaniaDeveloping economiesLower middle income
21GuatemalaDeveloping economiesUpper middle income89United Arab EmiratesDeveloping economiesHigh income
22GeorgiaDeveloping economiesUpper middle income90UgandaDeveloping economiesLow income
23FinlandDeveloped economiesHigh income91Congo, Rep.Developing economiesLower middle income
24MalaysiaDeveloping economiesUpper middle income92MaliDeveloping economiesLow income
25GreeceDeveloped economiesHigh income93MexicoDeveloping economiesUpper middle income
26El SalvadorDeveloping economiesUpper middle income94Egypt, Arab Rep.Developing economiesLower middle income
27ZimbabweDeveloping economiesLower middle income95EritreaDeveloping economiesLow income
28ChileDeveloping economiesHigh income96SenegalDeveloping economiesLower middle income
29JapanDeveloped economiesHigh income97CameroonDeveloping economiesLower middle income
30Cote d’IvoireDeveloping economiesLower middle income98Iran, Islamic Rep.Developing economiesLower middle income
31Kyrgyz RepublicDeveloping economiesLower middle income99New ZealandDeveloped economiesHigh income
32RomaniaDeveloped economiesHigh income100BangladeshDeveloping economiesLower middle income
33EcuadorDeveloping economiesUpper middle income101United StatesDeveloped economiesHigh income
34UkraineDeveloped economiesLower middle income102BrazilDeveloping economiesUpper middle income
35NicaraguaDeveloping economiesLower middle income103BotswanaDeveloping economiesUpper middle income
36MalawiDeveloping economiesLow income104IndiaDeveloping economiesLower middle income
37LebanonDeveloping economiesLower middle income105ChinaDeveloping economiesUpper middle income
38JamaicaDeveloping economiesUpper middle income106Sierra LeoneDeveloping economiesLow income
39CzechiaDeveloped economiesHigh income107NepalDeveloping economiesLower middle income
40CubaDeveloping economiesUpper middle income108Congo, Dem. Rep.Developing economiesLow income
41MozambiqueDeveloping economiesLow income109Saudi ArabiaDeveloping economiesHigh income
42SerbiaDeveloped economiesUpper middle income110BoliviaDeveloping economiesLower middle income
43AustriaDeveloped economiesHigh income111Yemen, Rep.Developing economiesLow income
44MoroccoDeveloping economiesLower middle income112KuwaitDeveloping economiesHigh income
45JordanDeveloping economiesLower middle income113BeninDeveloping economiesLower middle income
46AzerbaijanDeveloping economiesUpper middle income114QatarDeveloping economiesHigh income
47ItalyDeveloped economiesHigh income115NamibiaDeveloping economiesUpper middle income
48DenmarkDeveloped economiesHigh income116EthiopiaDeveloping economiesLow income
49SpainDeveloped economiesHigh income117AlgeriaDeveloping economiesLower middle income
50BelgiumDeveloped economiesHigh income118Central African RepublicDeveloping economiesLow income
51GhanaDeveloping economiesLower middle income119Syrian Arab RepublicDeveloping economiesLow income
52LiberiaDeveloping economiesLow income120Russian FederationDeveloped economiesUpper middle income
53Lao PDRDeveloping economiesLower middle income121VietnamDeveloping economiesLower middle income
54ZambiaDeveloping economiesLower middle income122ThailandDeveloping economiesUpper middle income
55Bosnia and HerzegovinaDeveloped economiesUpper middle income123IrelandDeveloped economiesHigh income
56TogoDeveloping economiesLow income124NigerDeveloping economiesLow income
57SomaliaDeveloping economiesLow income125UzbekistanDeveloping economiesLower middle income
58United KingdomDeveloped economiesHigh income126KazakhstanDeveloping economiesUpper middle income
59GuineaDeveloping economiesLower middle income127PakistanDeveloping economiesLower middle income
60ArmeniaDeveloping economiesUpper middle income128MyanmarDeveloping economiesLower middle income
61TunisiaDeveloping economiesLower middle income129TurkmenistanDeveloping economiesUpper middle income
62Korea, Rep.Developed economiesHigh income130ChadDeveloping economiesLow income
63PeruDeveloping economiesUpper middle income131SudanDeveloping economiesLow income
64UruguayDeveloping economiesHigh income132ArgentinaDeveloping economiesUpper middle income
65North MacedoniaDeveloped economiesUpper middle income133AustraliaDeveloped economiesHigh income
66TajikistanDeveloping economiesLower middle income134MongoliaDeveloping economiesLower middle income
67Gambia, TheDeveloping economiesLow income135South SudanDeveloping economiesLow income
68TurkiyeDeveloping economiesUpper middle income
Source: The Authors.

References

  1. Liu, H.; Khan, I.; Zakari, A.; Alharthi, M. Roles of trilemma in the world energy sector and transition towards sustainable energy: A study of economic growth and the environment. Energy Policy 2022, 170, 113238. [Google Scholar] [CrossRef]
  2. Praveen, R.; Keloth, V.; Abo-Khalil, A.G.; Alghamdi, A.S.; Eltamaly, A.M.; Tlili, I. An insight to the energy policy of GCC countries to meet renewable energy targets of 2030. Energy Policy 2020, 147, 111864. [Google Scholar] [CrossRef]
  3. Telli, A.; Erat, S.; Demir, B. Comparison of energy transition of Turkey and Germany: Energy policy, strengths/weaknesses and targets. Clean Technol. Environ. Policy 2021, 23, 413–427. [Google Scholar] [CrossRef]
  4. Woo, C.; Chung, Y.; Chun, D.; Seo, H.; Hong, S. The static and dynamic environmental efficiency of renewable energy: A Malmquist index analysis of OECD countries. Renew. Sustain. Energy Rev. 2015, 47, 367–376. [Google Scholar] [CrossRef]
  5. Chien, T.; Hu, J.L. Renewable energy and macroeconomic efficiency of OECD and non-OECD economies. Energy Policy 2007, 35, 3606–3615. [Google Scholar] [CrossRef]
  6. Ji, Z.; Niu, D.; Li, W.; Wu, G.; Yang, X.; Sun, L. Improving the energy efficiency of China: An analysis considering clean energy and fossil energy resources. Energy 2022, 259, 124950. [Google Scholar] [CrossRef]
  7. Hou, Y.; Iqbal, W.; Muhammad Shaikh, G.; Iqbal, N.; Ahmad Solangi, Y.; Fatima, A. Measuring energy efficiency and environmental performance: A case of South Asia. Processes 2019, 7, 325. [Google Scholar] [CrossRef]
  8. Li, W.; Ji, Z.; Dong, F. Global renewable energy power generation efficiency evaluation and influencing factors analysis. Sustain. Prod. Consum. 2022, 33, 438–453. [Google Scholar] [CrossRef]
  9. Menegaki, A.N. Growth and renewable energy in Europe: Benchmarking with data envelopment analysis. Renew. Energy 2013, 60, 363–369. [Google Scholar] [CrossRef]
  10. Reuter, M.; Patel, M.K.; Eichhammer, W.; Lapillonne, B.; Pollier, K. A comprehensive indicator set for measuring multiple benefits of energy efficiency. Energy Policy 2020, 139, 111284. [Google Scholar] [CrossRef]
  11. Dogan, E.; Inglesi-Lotz, R.; Altinoz, B. Examining the determinants of renewable energy deployment: Does the choice of indicator matter? Int. J. Energy Res. 2021, 45, 8780–8793. [Google Scholar] [CrossRef]
  12. Iftikhar, Y.; He, W.; Wang, Z. Energy and CO2 emissions efficiency of major economies: A non-parametric analysis. J. Clean. Prod. 2016, 139, 779–787. [Google Scholar] [CrossRef]
  13. Aliprandi, F.; Stoppato, A.; Mirandola, A. Estimating CO2 emissions reduction from renewable energy use in Italy. Renew. Energy 2016, 96, 220–232. [Google Scholar] [CrossRef]
  14. Zhou, P.; Ang, B.; Poh, K. Slacks-based efficiency measures for modeling environmental performance. Ecol. Econ. 2006, 60, 111–118. [Google Scholar] [CrossRef]
  15. United Nations. An Eye on Methane: International Methane Emissions Observatory 2021 Report. 2021. Available online: https://www.unep.org/resources/report/eye-methane-international-methane-emissions-observatory-2021-report (accessed on 13 June 2025).
  16. World Bank. World Bank Country and Lending Groups. Available online: https://datahelpdesk.worldbank.org/knowledgebase/articles/906519 (accessed on 13 July 2025).
  17. Lungkadee, T.; Katongtung, T.; Pokkanta, P.r.; Onsree, T.; Jaroenkhasemmeesuk, C.; Tippayawong, N. Current technology landscape of biochar in carbon capture and storage research via bibliometric analysis. AIMS Energy 2024, 12, 277–303. [Google Scholar] [CrossRef]
  18. Elqadhi, M.E.R.; Škrbić, S.V.; Mohamoud, O.A.; Ašonja, A.N. Energy integration of corn cob in the process of drying the corn seeds. Therm. Sci. 2024, 28, 3325–3336. [Google Scholar] [CrossRef]
  19. Saygin, D.; Kempener, R.; Wagner, N.; Ayuso, M.; Gielen, D. The implications for renewable energy innovation of doubling the share of renewables in the global energy mix between 2010 and 2030. Energies 2015, 8, 5828–5865. [Google Scholar] [CrossRef]
  20. Gao, M.; Beig, G.; Song, S.; Zhang, H.; Hu, J.; Ying, Q.; Liang, F.; Liu, Y.; Wang, H.; Lu, X.; et al. The impact of power generation emissions on ambient PM2. 5 pollution and human health in China and India. Environ. Int. 2018, 121, 250–259. [Google Scholar] [CrossRef] [PubMed]
  21. Johnson, O.W.; Han, J.Y.C.; Knight, A.L.; Mortensen, S.; Aung, M.T.; Boyland, M.; Resurrección, B.P. Intersectionality and energy transitions: A review of gender, social equity and low-carbon energy. Energy Res. Soc. Sci. 2020, 70, 101774. [Google Scholar] [CrossRef]
  22. Shrestha, A.; Mustafa, A.A.; Htike, M.M.; You, V.; Kakinaka, M. Evolution of energy mix in emerging countries: Modern renewable energy, traditional renewable energy, and non-renewable energy. Renew. Energy 2022, 199, 419–432. [Google Scholar] [CrossRef]
  23. Lo, K. A critical review of China’s rapidly developing renewable energy and energy efficiency policies. Renew. Sustain. Energy Rev. 2014, 29, 508–516. [Google Scholar] [CrossRef]
  24. Murshed, M. An empirical analysis of the non-linear impacts of ICT-trade openness on renewable energy transition, energy efficiency, clean cooking fuel access and environmental sustainability in South Asia. Environ. Sci. Pollut. Res. 2020, 27, 36254–36281. [Google Scholar] [CrossRef] [PubMed]
  25. Akram, R.; Chen, F.; Khalid, F.; Ye, Z.; Majeed, M.T. Heterogeneous effects of energy efficiency and renewable energy on carbon emissions: Evidence from developing countries. J. Clean. Prod. 2020, 247, 119122. [Google Scholar] [CrossRef]
  26. Shafik, N.; Bandyopadhyay, S. Economic Growth and Environmental Quality: Time-Series and Cross-Country Evidence; World Bank: Washington, DC, USA, 1992; Volume 904. [Google Scholar]
  27. Alvarez-Herranz, A.; Balsalobre-Lorente, D.; Shahbaz, M.; Cantos, J.M. Energy innovation and renewable energy consumption in the correction of air pollution levels. Energy Policy 2017, 105, 386–397. [Google Scholar] [CrossRef]
  28. Tansel, B. From electronic consumer products to e-wastes: Global outlook, waste quantities, recycling challenges. Environ. Int. 2017, 98, 35–45. [Google Scholar] [CrossRef] [PubMed]
  29. Cooper, D.R.; Gutowski, T.G. The environmental impacts of reuse: A review. J. Ind. Ecol. 2017, 21, 38–56. [Google Scholar] [CrossRef]
  30. Dogan, E.; Seker, F. Determinants of CO2 emissions in the European Union: The role of renewable and non-renewable energy. Renew. Energy 2016, 94, 429–439. [Google Scholar] [CrossRef]
  31. Bilgili, F.; Koçak, E.; Bulut, Ü. The dynamic impact of renewable energy consumption on CO2 emissions: A revisited Environmental Kuznets Curve approach. Renew. Sustain. Energy Rev. 2016, 54, 838–845. [Google Scholar] [CrossRef]
  32. Novan, K. Valuing the wind: Renewable energy policies and air pollution avoided. Am. Econ. J. Econ. Policy 2015, 7, 291–326. [Google Scholar] [CrossRef]
  33. Zhu, Y.; Wang, Z.; Yang, J.; Zhu, L. Does renewable energy technological innovation control China’s air pollution? A spatial analysis. J. Clean. Prod. 2020, 250, 119515. [Google Scholar] [CrossRef]
  34. Kotrikla, A.M.; Lilas, T.; Nikitakos, N. Abatement of air pollution at an aegean island port utilizing shore side electricity and renewable energy. Mar. Policy 2017, 75, 238–248. [Google Scholar] [CrossRef]
  35. Koengkan, M.; Fuinhas, J.A.; Silva, N. Exploring the capacity of renewable energy consumption to reduce outdoor air pollution death rate in Latin America and the Caribbean region. Environ. Sci. Pollut. Res. 2021, 28, 1656–1674. [Google Scholar] [CrossRef] [PubMed]
  36. Boudri, J.; Hordijk, L.; Kroeze, C.; Amann, M.; Cofala, J.; Bertok, I.; Junfeng, L.; Lin, D.; Shuang, Z.; Runquing, H.; et al. The potential contribution of renewable energy in air pollution abatement in China and India. Energy Policy 2002, 30, 409–424. [Google Scholar] [CrossRef]
  37. Chen, Y.; He, L.; Li, J.; Cheng, X.; Lu, H. An inexact bi-level simulation–optimization model for conjunctive regional renewable energy planning and air pollution control for electric power generation systems. Appl. Energy 2016, 183, 969–983. [Google Scholar] [CrossRef]
  38. Jacobson, M.Z. Roadmaps to transition countries to 100% clean, renewable energy for all purposes to curtail global warming, air pollution, and energy risk. Earths Future 2017, 5, 948–952. [Google Scholar] [CrossRef]
  39. Longo, M.; Yaïci, W.; Zaninelli, D. “Team play” between renewable energy sources and vehicle fleet to decrease air pollution. Sustainability 2015, 8, 27. [Google Scholar] [CrossRef]
  40. Yousefi, H.; Roumi, S.; Tabasi, S.; Hamlehdar, M. Economic and air pollution effects of city council legislations on renewable energy utilisation in Tehran. Int. J. Ambient. Energy 2018, 39, 626–631. [Google Scholar] [CrossRef]
  41. Shen, N.; Wang, Y.; Peng, H.; Hou, Z. Renewable energy green innovation, fossil energy consumption, and air pollution—Spatial empirical analysis based on China. Sustainability 2020, 12, 6397. [Google Scholar] [CrossRef]
  42. Rodriguez-Alvarez, A. Air pollution and life expectancy in Europe: Does investment in renewable energy matter? Sci. Total Environ. 2021, 792, 148480. [Google Scholar] [CrossRef] [PubMed]
  43. Rita, E.; Chizoo, E.; Cyril, U.S. Sustaining COVID-19 pandemic lockdown era air pollution impact through utilization of more renewable energy resources. Heliyon 2021, 7. [Google Scholar] [CrossRef] [PubMed]
  44. Koengkan, M.; Fuinhas, J.A.; Kazemzadeh, E.; Alavijeh, N.K.; de Araujo, S.J. The impact of renewable energy policies on deaths from outdoor and indoor air pollution: Empirical evidence from Latin American and Caribbean countries. Energy 2022, 245, 123209. [Google Scholar] [CrossRef]
  45. Begum, S. Use of oil palm waste as a renewable energy source and its impact on reduction of air pollution in context of Malaysia. In Proceedings of the 4th International Conference on Energy and Environment 2013 (ICEE 2013), Putrajaya, Malaysia, 5–6 March 2013; IOP Conference Series: Earth and Environmental Science. IOP Publishing: Brsitol, UK, 2013; Volume 16, p. 012026. [Google Scholar]
  46. Shah, M.H.; Salem, S.; Ahmed, B.; Ullah, I.; Rehman, A.; Zeeshan, M.; Fareed, Z. Nexus between foreign direct investment inflow, renewable energy consumption, ambient air pollution, and human mortality: A public health perspective from non-linear ARDL approach. Front. Public Health 2022, 9, 814208. [Google Scholar] [CrossRef] [PubMed]
  47. Yu, D.; He, X. A bibliometric study for DEA applied to energy efficiency: Trends and future challenges. Appl. Energy 2020, 268, 115048. [Google Scholar] [CrossRef]
  48. Herrero, M.; Henderson, B.; Havlík, P.; Thornton, P.K.; Conant, R.T.; Smith, P.; Wirsenius, S.; Hristov, A.N.; Gerber, P.; Gill, M.; et al. Greenhouse gas mitigation potentials in the livestock sector. Nat. Clim. Change 2016, 6, 452–461. [Google Scholar] [CrossRef]
  49. Charnes, A.; Cooper, W.; Rousseau, J.; Samle, J. DEA and Axiomatic Notions of Efficiency and Reference sets. In Research Report CCS 558; University of Texas at Austin: Austin, TX, USA, 1987. [Google Scholar]
  50. Cook, W.D.; Tone, K.; Zhu, J. Data envelopment analysis: Prior to choosing a model. Omega 2014, 44, 1–4. [Google Scholar] [CrossRef]
  51. Santana, N.B.; do Nascimento Rebelatto, D.A.; Périco, A.E.; Mariano, E.B. Sustainable development in the BRICS countries: An efficiency analysis by data envelopment. In Managing Organizations for Sustainable Development in Emerging Countries; Routledge: London, UK, 2017; pp. 65–78. [Google Scholar]
  52. Cook, W.D.; Harrison, J.; Imanirad, R.; Rouse, P.; Zhu, J. Data envelopment analysis with non-homogeneous DMUs. In Data Envelopment Analysis: A Handbook of Models and Methods; Springer: Boston, MA, USA, 2015; pp. 309–340. [Google Scholar]
  53. Mariano, E.B.; Sobreiro, V.A.; do Nascimento Rebelatto, D.A. Human development and data envelopment analysis: A structured literature review. Omega 2015, 54, 33–49. [Google Scholar] [CrossRef]
  54. Banker, R.D.; Morey, R.C. Efficiency analysis for exogenously fixed inputs and outputs. Oper. Res. 1986, 34, 513–521. [Google Scholar] [CrossRef]
  55. Angulo-Meza, L.; Lins, M.P.E. Review of methods for increasing discrimination in data envelopment analysis. Ann. Oper. Res. 2002, 116, 225–242. [Google Scholar] [CrossRef]
  56. Yamada, Y.; Matui, T.; Sugiyama, M. New analysis of efficiency based on DEA. J. Oper. Res. Soc. Jpn. 1994, 37, 158–167. [Google Scholar]
  57. Leta, F.R.; Soares de Mello, J.C.C.; Gomes, E.G.; Meza, L.A. Métodos de melhora de ordenação em DEA aplicados à avaliação estática de tornos mecânicos. Investig. Oper. 2005, 25, 229–242. [Google Scholar]
  58. Min, S.; Kim, J.; Sawng, Y.W. The effect of innovation network size and public R&D investment on regional innovation efficiency. Technol. Forecast. Soc. Change 2020, 155, 119998. [Google Scholar]
  59. Lee, J.; Kim, C.; Choi, G. Exploring data envelopment analysis for measuring collaborated innovation efficiency of small and medium-sized enterprises in Korea. Eur. J. Oper. Res. 2019, 278, 533–545. [Google Scholar] [CrossRef]
  60. Cooper, W.W.; Seiford, L.M.; Tone, K. The basic CCR model. In Data Envelopment Analysis: A Comprehensive Text with Models, Applications, References and DEA-Solver Software; Springer: New York, NY, USA, 2007; pp. 21–39. [Google Scholar]
  61. Mann, H.B.; Whitney, D.R. On a test of whether one of two random variables is stochastically larger than the other. Ann. Math. Stat. 1947, 18, 50–60. [Google Scholar] [CrossRef]
  62. Kruskal, W.H.; Wallis, W.A. Use of ranks in one-criterion variance analysis. J. Am. Stat. Assoc. 1952, 47, 583–621. [Google Scholar] [CrossRef]
  63. Salman, M.; Long, X.; Wang, G.; Zha, D. Paris climate agreement and global environmental efficiency: New evidence from fuzzy regression discontinuity design. Energy Policy 2022, 168, 113128. [Google Scholar] [CrossRef]
  64. Suharevska, K.; Blumberga, D. Progress in renewable energy technologies: Innovation potential in Latvia. Rigas Teh. Univ. Zinat. Raksti 2019, 23, 47–63. [Google Scholar] [CrossRef]
  65. Saidi, K.; Omri, A. The impact of renewable energy on carbon emissions and economic growth in 15 major renewable energy-consuming countries. Environ. Res. 2020, 186, 109567. [Google Scholar] [CrossRef] [PubMed]
  66. Wijayatunga, P.D. Regulation for renewable energy development: Lessons from Sri Lanka experience. Renew. Energy 2014, 61, 29–32. [Google Scholar] [CrossRef]
  67. Kolhe, M.L.; Ranaweera, K.I.U.; Gunawardana, A.S. Techno-economic sizing of off-grid hybrid renewable energy system for rural electrification in Sri Lanka. Sustain. Energy Technol. Assessments 2015, 11, 53–64. [Google Scholar] [CrossRef]
  68. Nandwani, S.S. Uses of solar energy in Costa Rica. Renew. Energy 2006, 31, 689–701. [Google Scholar] [CrossRef]
  69. Przychodzen, W.; Przychodzen, J. Determinants of renewable energy production in transition economies: A panel data approach. Energy 2020, 191, 116583. [Google Scholar] [CrossRef]
  70. Chen, C.; Pinar, M.; Stengos, T. Determinants of renewable energy consumption: Importance of democratic institutions. Renew. Energy 2021, 179, 75–83. [Google Scholar] [CrossRef]
  71. Hillion, C.A.P. The UK Withdrawal from the EU-Legal Implications for Norway as Party to the EEA Agreement; NUPI-rapport; Norwegian Institute of International Affairs: Oslo, Norway, 2017. [Google Scholar]
  72. Sadavarte, P.; Pandey, S.; Maasakkers, J.D.; Lorente, A.; Borsdorff, T.; Denier van der Gon, H.; Houweling, S.; Aben, I. Methane emissions from superemitting coal mines in Australia quantified using TROPOMI satellite observations. Environ. Sci. Technol. 2021, 55, 16573–16580. [Google Scholar] [CrossRef] [PubMed]
  73. Black, J.L.; Davison, T.M.; Box, I. Methane emissions from ruminants in Australia: Mitigation potential and applicability of mitigation strategies. Animals 2021, 11, 951. [Google Scholar] [CrossRef] [PubMed]
  74. Howden, S.; Reyenga, P. Methane emissions from Australian livestock: Implications of the Kyoto Protocol. Aust. J. Agric. Res. 1999, 50, 1285–1292. [Google Scholar] [CrossRef]
  75. Huarte, A.; Cifuentes, V.; Gratton, R.; Clausse, A. Correlation of methane emissions with cattle population in Argentine Pampas. Atmos. Environ. 2010, 44, 2780–2786. [Google Scholar] [CrossRef]
  76. Rearte, D.H.; Pordomingo, A. The relevance of methane emissions from beef production and the challenges of the Argentinean beef production platform. Meat Sci. 2014, 98, 355–360. [Google Scholar] [CrossRef] [PubMed]
  77. Blanco, A.; Diaz de Astarloa, B.; Drenik, A.; Moser, C.; Trupkin, D.R. The evolution of the earnings distribution in a volatile economy: Evidence from Argentina. Quant. Econ. 2022, 13, 1361–1403. [Google Scholar] [CrossRef]
  78. Chen, Q.; Khattak, S.I. The future of green transportation: Evaluating the impact of innovation in hybrid electric vehicles relating technologies on carbon dioxide emissions in Asia’s top knowledge-based economies. Environ. Sci. Pollut. Res. 2023, 30, 105398–105414. [Google Scholar] [CrossRef] [PubMed]
  79. Grell, T.; Harris, P.W.; Marchuk, S.; Jenkins, S.; McCabe, B.K.; Tait, S. Biochemical methane potential of dairy manure residues and separated fractions: An Australia-wide study of the impact of production and cleaning systems. Bioresour. Technol. 2024, 391, 129903. [Google Scholar] [CrossRef] [PubMed]
  80. Lumbers, B.; Barley, J.; Platte, F. Low-emission hydrogen production via the thermo-catalytic decomposition of methane for the decarbonisation of iron ore mines in Western Australia. Int. J. Hydrogen Energy 2022, 47, 16347–16361. [Google Scholar] [CrossRef]
  81. Asane-Otoo, E. Carbon footprint and emission determinants in Africa. Energy 2015, 82, 426–435. [Google Scholar] [CrossRef]
  82. Arroyo, F.R.M.; Miguel, L.J. The role of renewable energies for the sustainable energy governance and environmental policies for the mitigation of climate change in Ecuador. Energies 2020, 13, 3883. [Google Scholar] [CrossRef]
  83. Jin, Y.; Xia, J.; Pan, Z.; Yang, J.; Wang, W.; Fu, Z. Polystyrene microplastics induce microbiota dysbiosis and inflammation in the gut of adult zebrafish. Environ. Pollut. 2018, 235, 322–329. [Google Scholar] [CrossRef] [PubMed]
  84. Sinton, J.E.; Levine, M.D. Changing energy intensity in Chinese industry: The relatively importance of structural shift and intensity change. Energy Policy 1994, 22, 239–255. [Google Scholar] [CrossRef]
  85. Mazanec, J.; Bartosova, V. Prediction model as sustainability tool for assessing financial status of non-profit organizations in the Slovak Republic. Sustainability 2021, 13, 9721. [Google Scholar] [CrossRef]
Figure 1. Flowchart of the DEA model (elaborated by the authors).
Energies 18 03803 g001
Figure 2. Correlation matrix (elaborated by the authors).
Energies 18 03803 g002
Figure 3. Global distribution of the REI (elaborated by the authors).
Energies 18 03803 g003
Figure 4. REI and GDP per capita across different developmental groups (elaborated by the authors).
Energies 18 03803 g004
Table 1. Inputs and outputs definition.
IndicatorUnitDefinition
Agricultural methane emissionsThousand metric tons of CO2 equivalentEmissions from animals, animal waste, rice production, agricultural waste burning (non energy, on-site), and savanna burning
CO2 emissionsMetric tons per capitaCarbon dioxide emissions
PM2.5 air pollution, mean annual exposureMicrograms per cubic meterPopulation-weighted exposure to ambient PM2.5 pollution is defined as the average level of exposure of a nation’s population to concentrations of suspended particles measuring less than 2.5 microns in aerodynamic diameter, which are capable of penetrating deep into the respiratory tract and causing severe health damage. Exposure is calculated by weighting mean annual concentrations of PM2.5 by population in both urban and rural areas
Renewable energy consumption% of total final energy consumptionRenewable energy consumption is the share of renewables energy in total final energy consumption
Access to electricity, ruralPercentageRural population with access to electricity
Access to electricity, urbanPercentageUrban population with access to electricity
Electricity production from renewable sources, excluding hydroelectrickWhElectricity production from renewable sources, excluding hydroelectric, includes geothermal, solar, tides, wind, biomass, and biofuels
Source: The authors.
Table 2. Top ten countries on REI.
CountryREIDevelopment GroupIncome GroupPopulation
Sweden1.0000Developed economiesHigh income8,618,398
Sri Lanka0.8762Developing economiesLower middle income3,882,481
Costa Rica0.8713Developing economiesUpper middle income3,844,155
Lithuania0.8676Developed economiesHigh income1,932,212
Panama0.8456Developing economiesHigh income2,698,732
Hungary0.7992Developed economiesHigh income6,946,267
Papua New Guinea0.7907Developing economiesLower middle income1,161,342
Croatia0.7858Developed economiesHigh income2,354,458
Slovak Republic0.7751Developed economiesHigh income2,922,095
Switzerland0.7609Developed economiesHigh income6,174,416
Source: The Authors.
Table 3. Bottom ten countries on REI.
CountryREIDevelopment GroupIncome GroupPopulation
South Sudan0.0000Developing economiesLow income2,112,741
Mongolia0.0693Developing economiesLower middle income2,069,095
Australia0.0772Developed economiesHigh income20,755,798
Argentina0.0824Developing economiesUpper middle income39,940,546
Sudan0.1088Developing economiesLow income13,435,884
Chad0.1248Developing economiesLow income3,309,161
Turkmenistan0.1328Developing economiesUpper middle income2,977,004
Myanmar0.1343Developing economiesLower middle income15,610,256
Pakistan0.1474Developing economiesLower middle income77,368,591
Kazakhstan0.1504Developing economiesUpper middle income10,189,588
Source: The Authors.
Table 4. Top five developed countries on REI.
CountriesStandard EfficiencyInverted FrontierComposite IndicatorREI
Sweden1.00000.93590.96741.0000
Japan0.86040.84450.85240.7917
Spain0.88540.71220.79410.6860
Lithuania0.96180.63740.78300.6659
United Kingdom0.93020.65370.77980.6602
Source: The authors.
Table 5. Bottom five developed countries on REI.
CountriesStandard EfficiencyInverted FrontierComposite IndicatorREI
Poland0.57320.41870.48990.1350
Ireland0.63480.35970.47780.1131
Belarus0.63130.35970.47650.1108
Netherlands0.52930.41450.46840.0960
Australia0.47970.35970.41540.0000
Source: The authors.
Table 6. Top five developing countries on REI.
CountriesStandard EfficiencyInverted FrontierComposite IndicatorREI
Panama1.00000.82260.90701.0000
Sri Lanka1.00000.71280.84420.9127
Costa Rica1.00000.70660.84060.9076
Papua New Guinea1.00000.60880.78030.8237
Dominican Republic0.98220.56270.74340.7724
Source: The authors.
Table 7. Bottom five developing countries on REI.
CountriesStandard EfficiencyInverted FrontierComposite IndicatorREI
Argentina0.63310.12630.28280.1313
Chad0.62870.12630.28180.1300
Sudan0.52540.13820.26950.1128
Mongolia0.53060.12630.25890.0981
South Sudan0.28100.12630.18840.0000
Source: The authors.
Table 8. Top five high-income countries on REI.
CountriesStandard EfficiencyInverted FrontierComposite IndicatorREI
Sweden1.00001.00001.00001.0000
Hungary0.93280.68770.80090.7297
Switzerland0.87070.71580.78950.7142
Israel0.99640.61210.78090.7026
Slovak Republic0.95650.62870.77550.6952
Source: The authors.
Table 9. Bottom five high-income countries on REI.
CountriesStandard EfficiencyInverted FrontierComposite IndicatorREI
New Zealand0.96730.14470.37410.1502
Qatar0.94830.14470.37040.1452
Slovenia0.94360.14470.36940.1439
Ireland0.63480.14470.30300.0538
Australia0.47970.14470.26340.0000
Source: The authors.
Table 10. Top five middle-income countries on REI.
CountriesStandard EfficiencyInverted FrontierComposite IndicatorREI
Sri Lanka1.00000.51820.71991.0000
Costa Rica1.00000.47590.68980.9377
Honduras0.95990.43500.64620.8473
Guatemala1.00000.40150.63360.8212
Dominican Republic0.99380.39980.63030.8144
Source: The authors.
Table 11. Bottom five middle-income countries on REI.
CountriesStandard EfficiencyInverted FrontierComposite IndicatorREI
Pakistan0.64190.13730.29690.1230
Benin0.68640.12660.29480.1186
Mongolia0.53050.12660.25920.0447
Botswana0.45200.12660.23920.0034
Namibia0.44580.12660.23760.0000
Source: The authors.
Table 12. Top five low-income countries on REI.
CountriesStandard EfficiencyInverted FrontierComposite IndicatorREI
Afghanistan1.00000.99530.50230.5298
Burundi1.00000.63960.68020.7936
Central African Republic0.88561.00000.44280.4415
Chad0.73201.00000.36600.3276
Congo, Dem. Rep.1.00001.00000.50000.5263
Source: The authors.
Table 13. Bottom five low-income countries on REI.
CountriesStandard EfficiencyInverted FrontierComposite IndicatorREI
Sudan0.75931.00000.37970.3479
Syrian Arab Republic1.00001.00000.50000.5263
Togo1.00000.71570.64210.7372
Uganda0.91260.65120.63070.7202
Yemen, Rep.1.00001.00000.50000.5263
Source: The authors.
Disclaimer/Publisher’s Note: The statements, opinions and data contained in all publications are solely those of the individual author(s) and contributor(s) and not of MDPI and/or the editor(s). MDPI and/or the editor(s) disclaim responsibility for any injury to people or property resulting from any ideas, methods, instructions or products referred to in the content.

