Article

Tidal Current Energy Assessment and Exploitation Recommendations for Semi-Enclosed Bay Straits: A Case Study on the Bohai Strait, China

1
National Ocean Technology Center, Tianjin 300112, China
2
Key Laboratory of Ocean Observation Technology, Ministry of National Resources, Tianjin 300112, China
3
School of Civil Engineering, Tianjin University, Tianjin 300072, China
4
School of Hydraulic and Civil Engineering, Ludong University, Yantai 264025, China
*
Author to whom correspondence should be addressed.
Energies 2025, 18(14), 3787; https://doi.org/10.3390/en18143787
Submission received: 5 May 2025 / Revised: 11 July 2025 / Accepted: 14 July 2025 / Published: 17 July 2025

Abstract

Against the backdrop of increasingly depleted global non-renewable resources, research on renewable energy has become urgently critical. As a significant marine clean energy source, tidal current energy has attracted growing scholarly interest, effectively addressing global energy shortages and fossil fuel pollution. Semi-enclosed bay straits, with their geographically advantageous topography, offer substantial potential for tidal energy exploitation. China’s Bohai Strait exemplifies such a geomorphological feature. This study focuses on the Bohai Strait, employing the Delft3D model to establish a three-dimensional numerical simulation of tidal currents in the region. Combined with the Flux tidal energy assessment method, the tidal energy resources are evaluated, and exploitation recommendations are proposed. The results demonstrate that the Laotieshan Channel, particularly its northern section, contains the most abundant tidal energy reserves in the Bohai Strait. The Laotieshan Channel has an average power flux density of 50.83 W/m2, with a tidal energy potential of approximately 81,266.5 kW, of which about 12,189.97 kW is technically exploitable. Particularly in its northern section, favorable flow conditions exist—peak current speeds can reach 2 m/s, and the area offers substantial effective power generation hours. Annual durations with flow velocities exceeding 0.5 m/s total around 4500 h, making this zone highly suitable for deploying tidal turbines. To maximize the utilization of tidal energy resources, installation within the upper 20 m of the water layer is recommended. This study not only advances tidal energy research in semi-enclosed bay straits but also provides a critical reference for future studies, while establishing a foundational framework for practical tidal energy development in the Bohai Strait region.

1. Introduction

It is widely recognized that land constitutes approximately 29% of the Earth’s surface, while oceans account for 71%, serving as a vital foundation for human survival. The ocean harbors abundant marine energy resources, including tidal current energy, wave energy, salinity gradient energy, and thermal gradient energy. Among these, tidal current energy has garnered significant global attention due to its exceptional predictability and stability [1,2,3]. With the increasing depletion of non-renewable resources, the exploitation and utilization of renewable energy sources such as tidal current energy have become critically important. Tidal current energy arises from the kinetic energy of horizontal tidal movements and is generated by surging flows during tidal ascent or descent. In open seas, flow velocities are generally insufficient to meet the activation thresholds of conventional tidal energy turbines. Optimal sites for tidal energy exploitation are typically confined to coastal geomorphological features such as headlands, islands, or narrow straits adjacent to landmasses [4]. These locations exhibit significantly higher peak flow velocities, making them prime candidates for energy extraction.
In 2006, the Hydraulics Centre of Canada’s National Research Council conducted a comprehensive evaluation of tidal energy resources along Canadian coasts. By integrating predictions from 14 tidal models and applying the Flux method within the energy flux framework, the study identified 190 potential sites with mean power outputs exceeding 1 MW. These sites collectively demonstrated a total mean power capacity of over 42,000 MW—equivalent to approximately 63% of the nation’s contemporaneous electricity demand [5]. Mahmood et al. conducted numerical simulation studies on tidal current profiles in the Persian Gulf and Gulf of Oman. The results indicated substantial tidal energy potential in these regions, though fulfilling this potential requires enhanced power conversion system efficiency [6]. Ozturk et al. investigated the annual current energy potential of the Bosphorus Strait, Turkey. Their findings revealed peak energy availability from late spring to late summer, correlating with intensified water level differentials across the strait [7]. Marta-Almeida et al. performed a numerical assessment of tidal energy resource potential in Brazil’s Todos os Santos Bay, demonstrating a significant renewable energy generation capacity within the estuarine system [8]. Hou et al. analyzed eight channels with peak tidal velocities exceeding 2.5 m/s in China’s Zhoushan Archipelago using the Farm simulation method [9]. The study estimated 1400 MW theoretical tidal energy reserves yet identified only approximately 200 MW as technically recoverable in critical channels, highlighting a substantial disparity between resource potential and feasible extraction. Yang et al. employed Delft3D modeling to assess tidal energy resources along China’s Shandong Peninsula [10]. Subsequent research applying the Flux tidal energy assessment method revealed abundant tidal energy resources in the offshore waters near Chengshantou. The Chengshantou offshore area exhibited particularly favorable conditions with total reserves of 122.85 MW and a technically exploitable potential of 18.43 MW. YE et al. conducted a comparative analysis of prevalent tidal energy assessment methods [11]. Their research revealed that while the GC method offers stronger physical foundations compared to the Flux and Farm methods, it relies on excessive assumptions. The accurate determination of two critical parameters—the head difference between channel ends and maximum flow discharge—proves particularly challenging. Consequently, both the energy-flux-based Flux method and Farm method demonstrate superior accuracy over the GC method.
Recent advancements in tidal energy harvesting have seen the exploitation and experimental validation of multiple device typologies, with horizontal-axis tidal current turbines (HATTs) and vertical-axis tidal current turbines (VATTs) emerging as predominant configurations [12]. As mechanical design critically governs energy conversion efficiency, substantial research efforts have focused on the hydrodynamic optimization of rotor geometry, blade pitch control mechanisms, and structural reinforcement strategies to maximize power outputs. HATTs rotate around a horizontal axis parallel to the water flow direction, while VATTs rotate around a vertical axis perpendicular to the flow. VATTs offer advantages over HATTs, including a multi-directional energy harvesting capability due to their vertical-axis rotation and higher energy capture efficiency. However, VATTs exhibit limitations such as a lower self-starting capability, significant torque fluctuations, and a relatively lower operational efficiency [13]. Their exploitational maturity remains inferior to HATTs, resulting in limited commercial adoption. Consequently, most commercial tidal energy platforms employ HATTs. Recent megawatt-scale technological advancements in tidal turbines predominantly feature horizontal-axis designs, exemplified by the Rotech Tidal Turbine developed by UK-based Lunar Energy Ltd. (London, UK). [14], the Voith Hydro turbine by Germany’s Voith Group (Stuttgart, Germany) [15], and the 650 kW HATT prototype independently developed by Zhejiang University (Zhejiang China) [16]. These represent state-of-the-art achievements in HATT technology. Nevertheless, with ongoing improvements in VATT development and reduced design costs, vertical-axis turbines are anticipated to gain increasing prominence in future tidal energy systems.
Semi-enclosed bays, characterized by their tripartite terrestrial boundaries, offer geomorphological advantages that effectively mitigate oceanic swells and storm surges, thereby enhancing safety in tidal power station construction. The narrow straits of such bays amplify tidal ranges [17], creating pronounced tidal channel effects that accelerate current velocities—an ideal condition for tidal energy generation. Notable examples include the Gulf of Marseille at the eastern entrance of the Gulf of Lion in the northwestern Mediterranean [18] and San Diego Bay in California, USA [19], both demonstrating significant tidal channel effects. China’s Bohai Strait epitomizes this geomorphological type, with its three-sided land enclosure. The strait between Laotieshan Cape and the Shandong Peninsula is segmented into multiple channels by islets, where constricted channels combined with semi-enclosed tidal dynamics yield exceptionally abundant tidal energy resources. In previous studies on the development and utilization of tidal energy resources, research has predominantly focused on open-sea areas [10] and narrow straits [7], with insufficient attention given to tidal energy exploitation in semi-enclosed bay entrances. Therefore, this paper selects the Bohai Strait in China—a typical semi-enclosed bay entrance—as the study area. The Flux tidal energy assessment method is employed to evaluate the region’s tidal energy resources. By combining flow velocity thresholds with exploitable water layers through a three-dimensional numerical model, the optimal placement of tidal energy turbines is more reasonably determined. This approach provides explicit numerical support for future tidal energy development and has significant reference significance for the harnessing of tidal energy resources in semi-enclosed bay entrances.

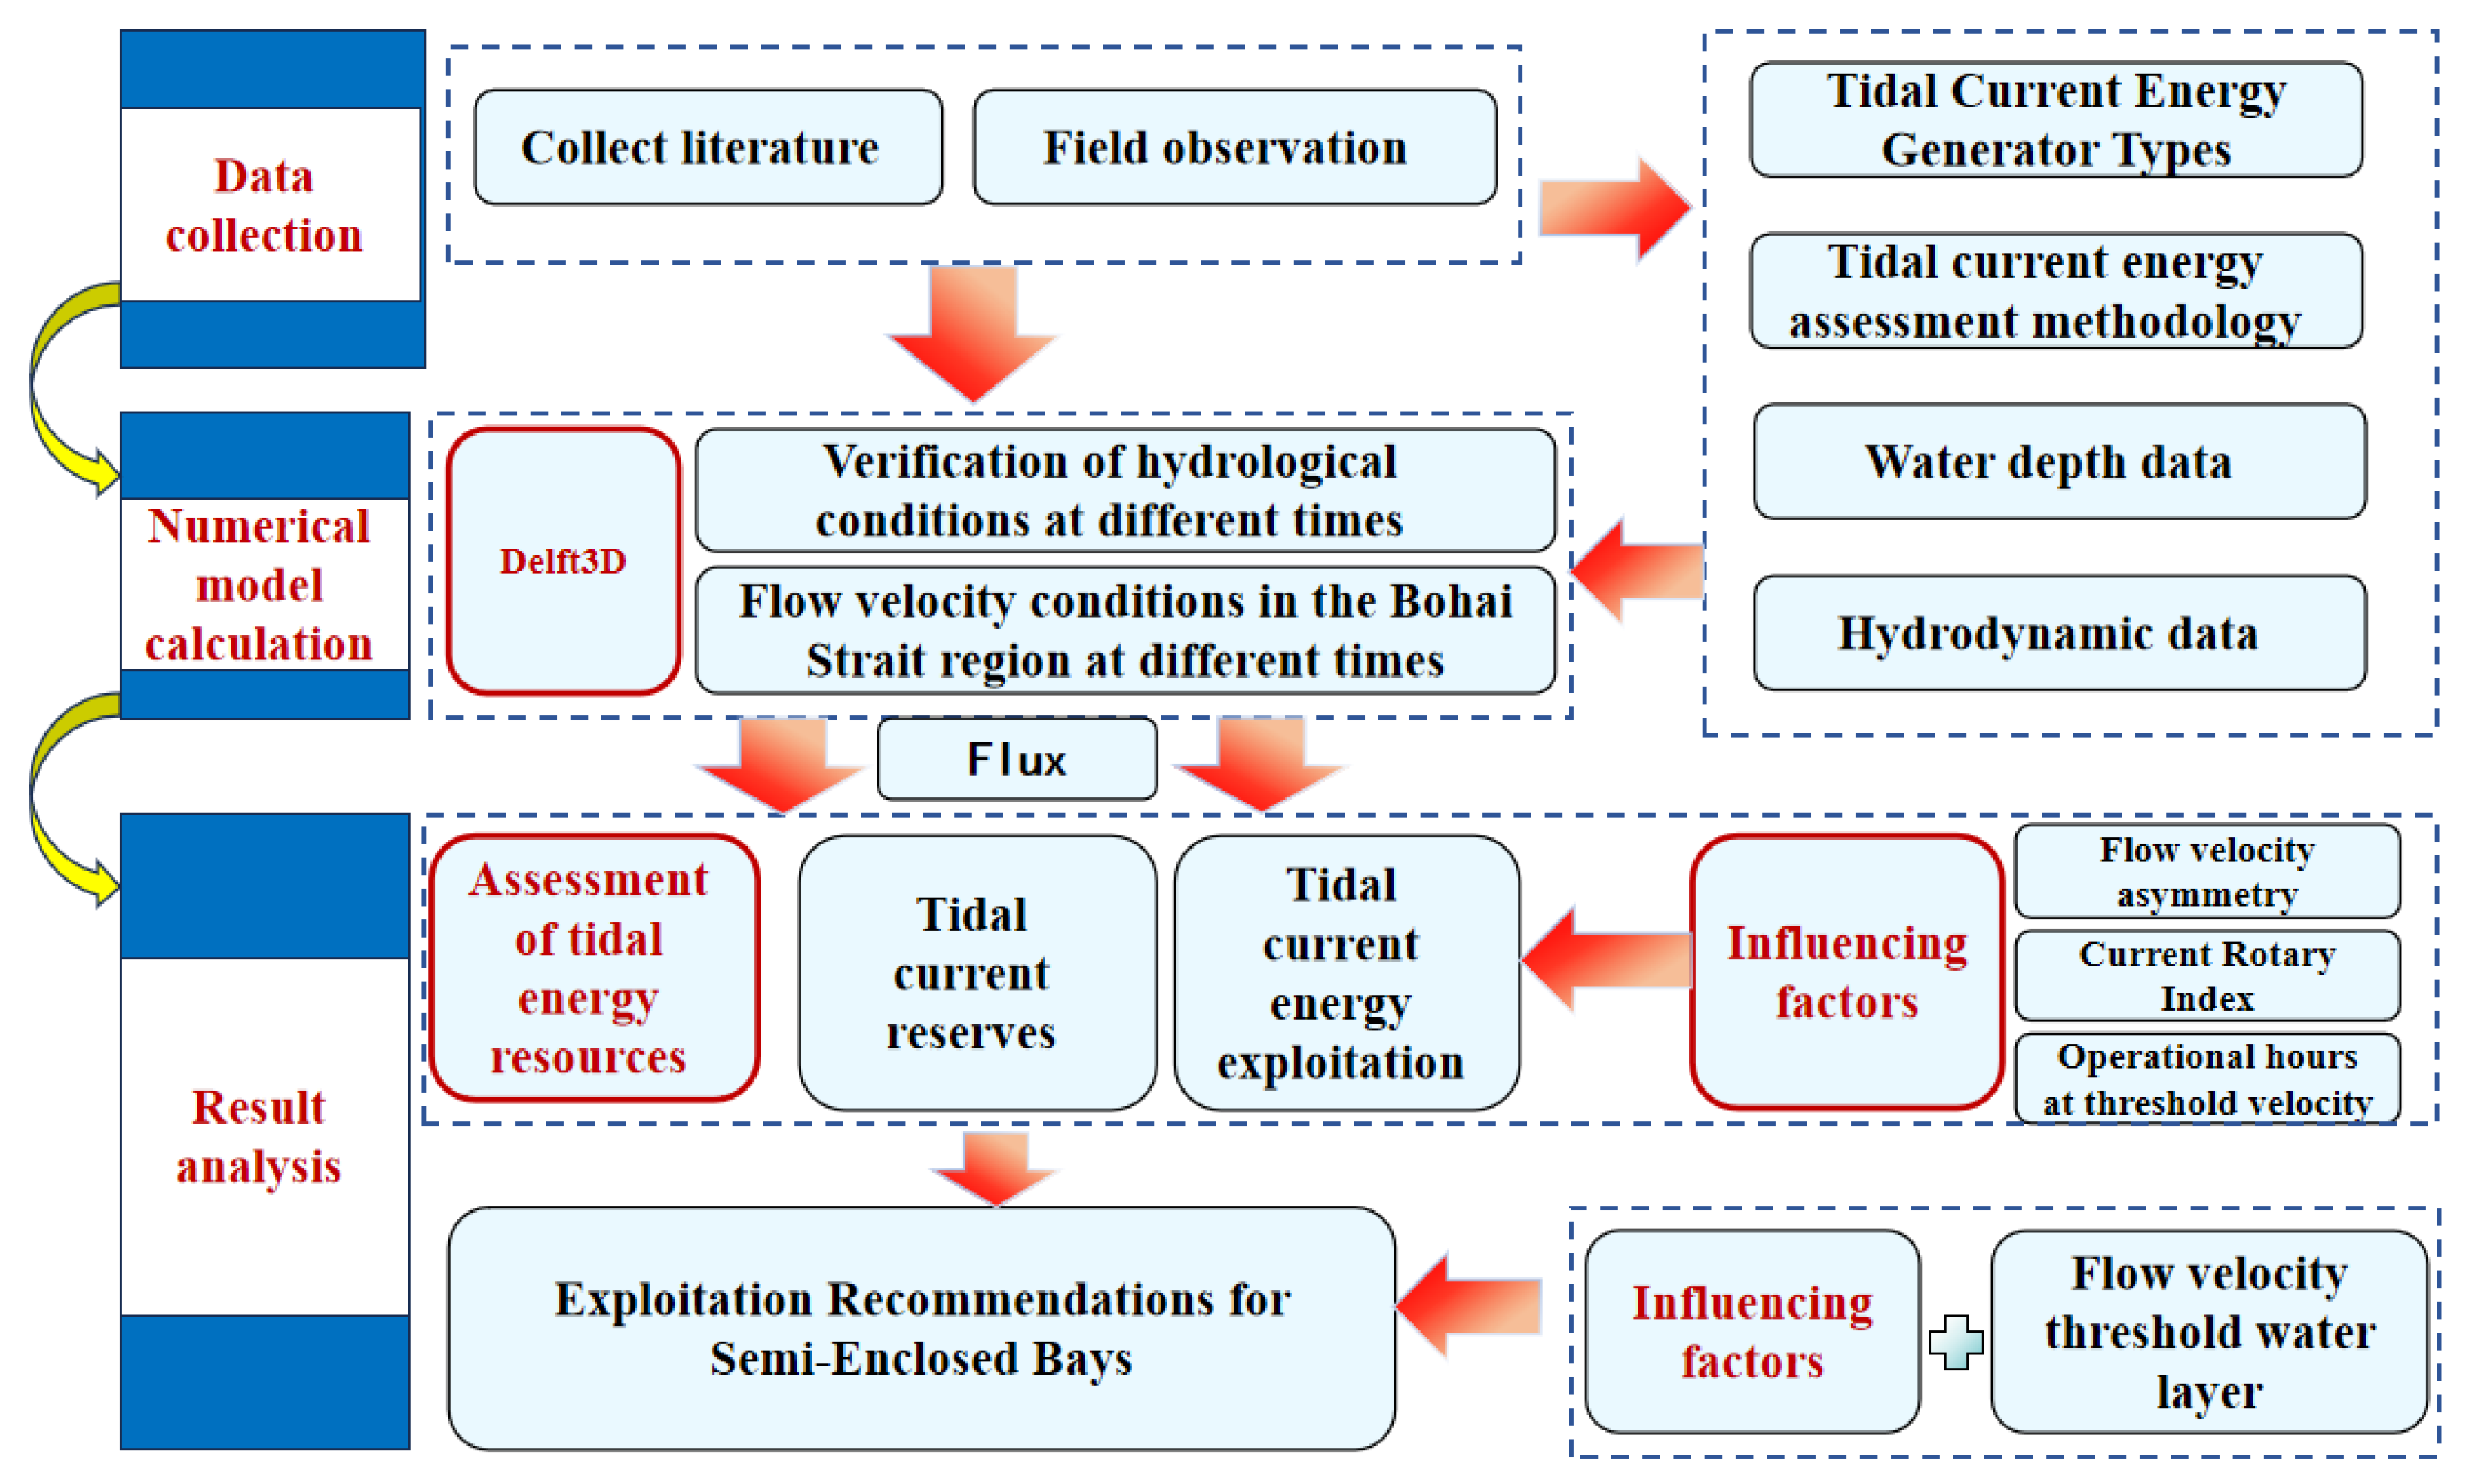
2. Methods and Dates
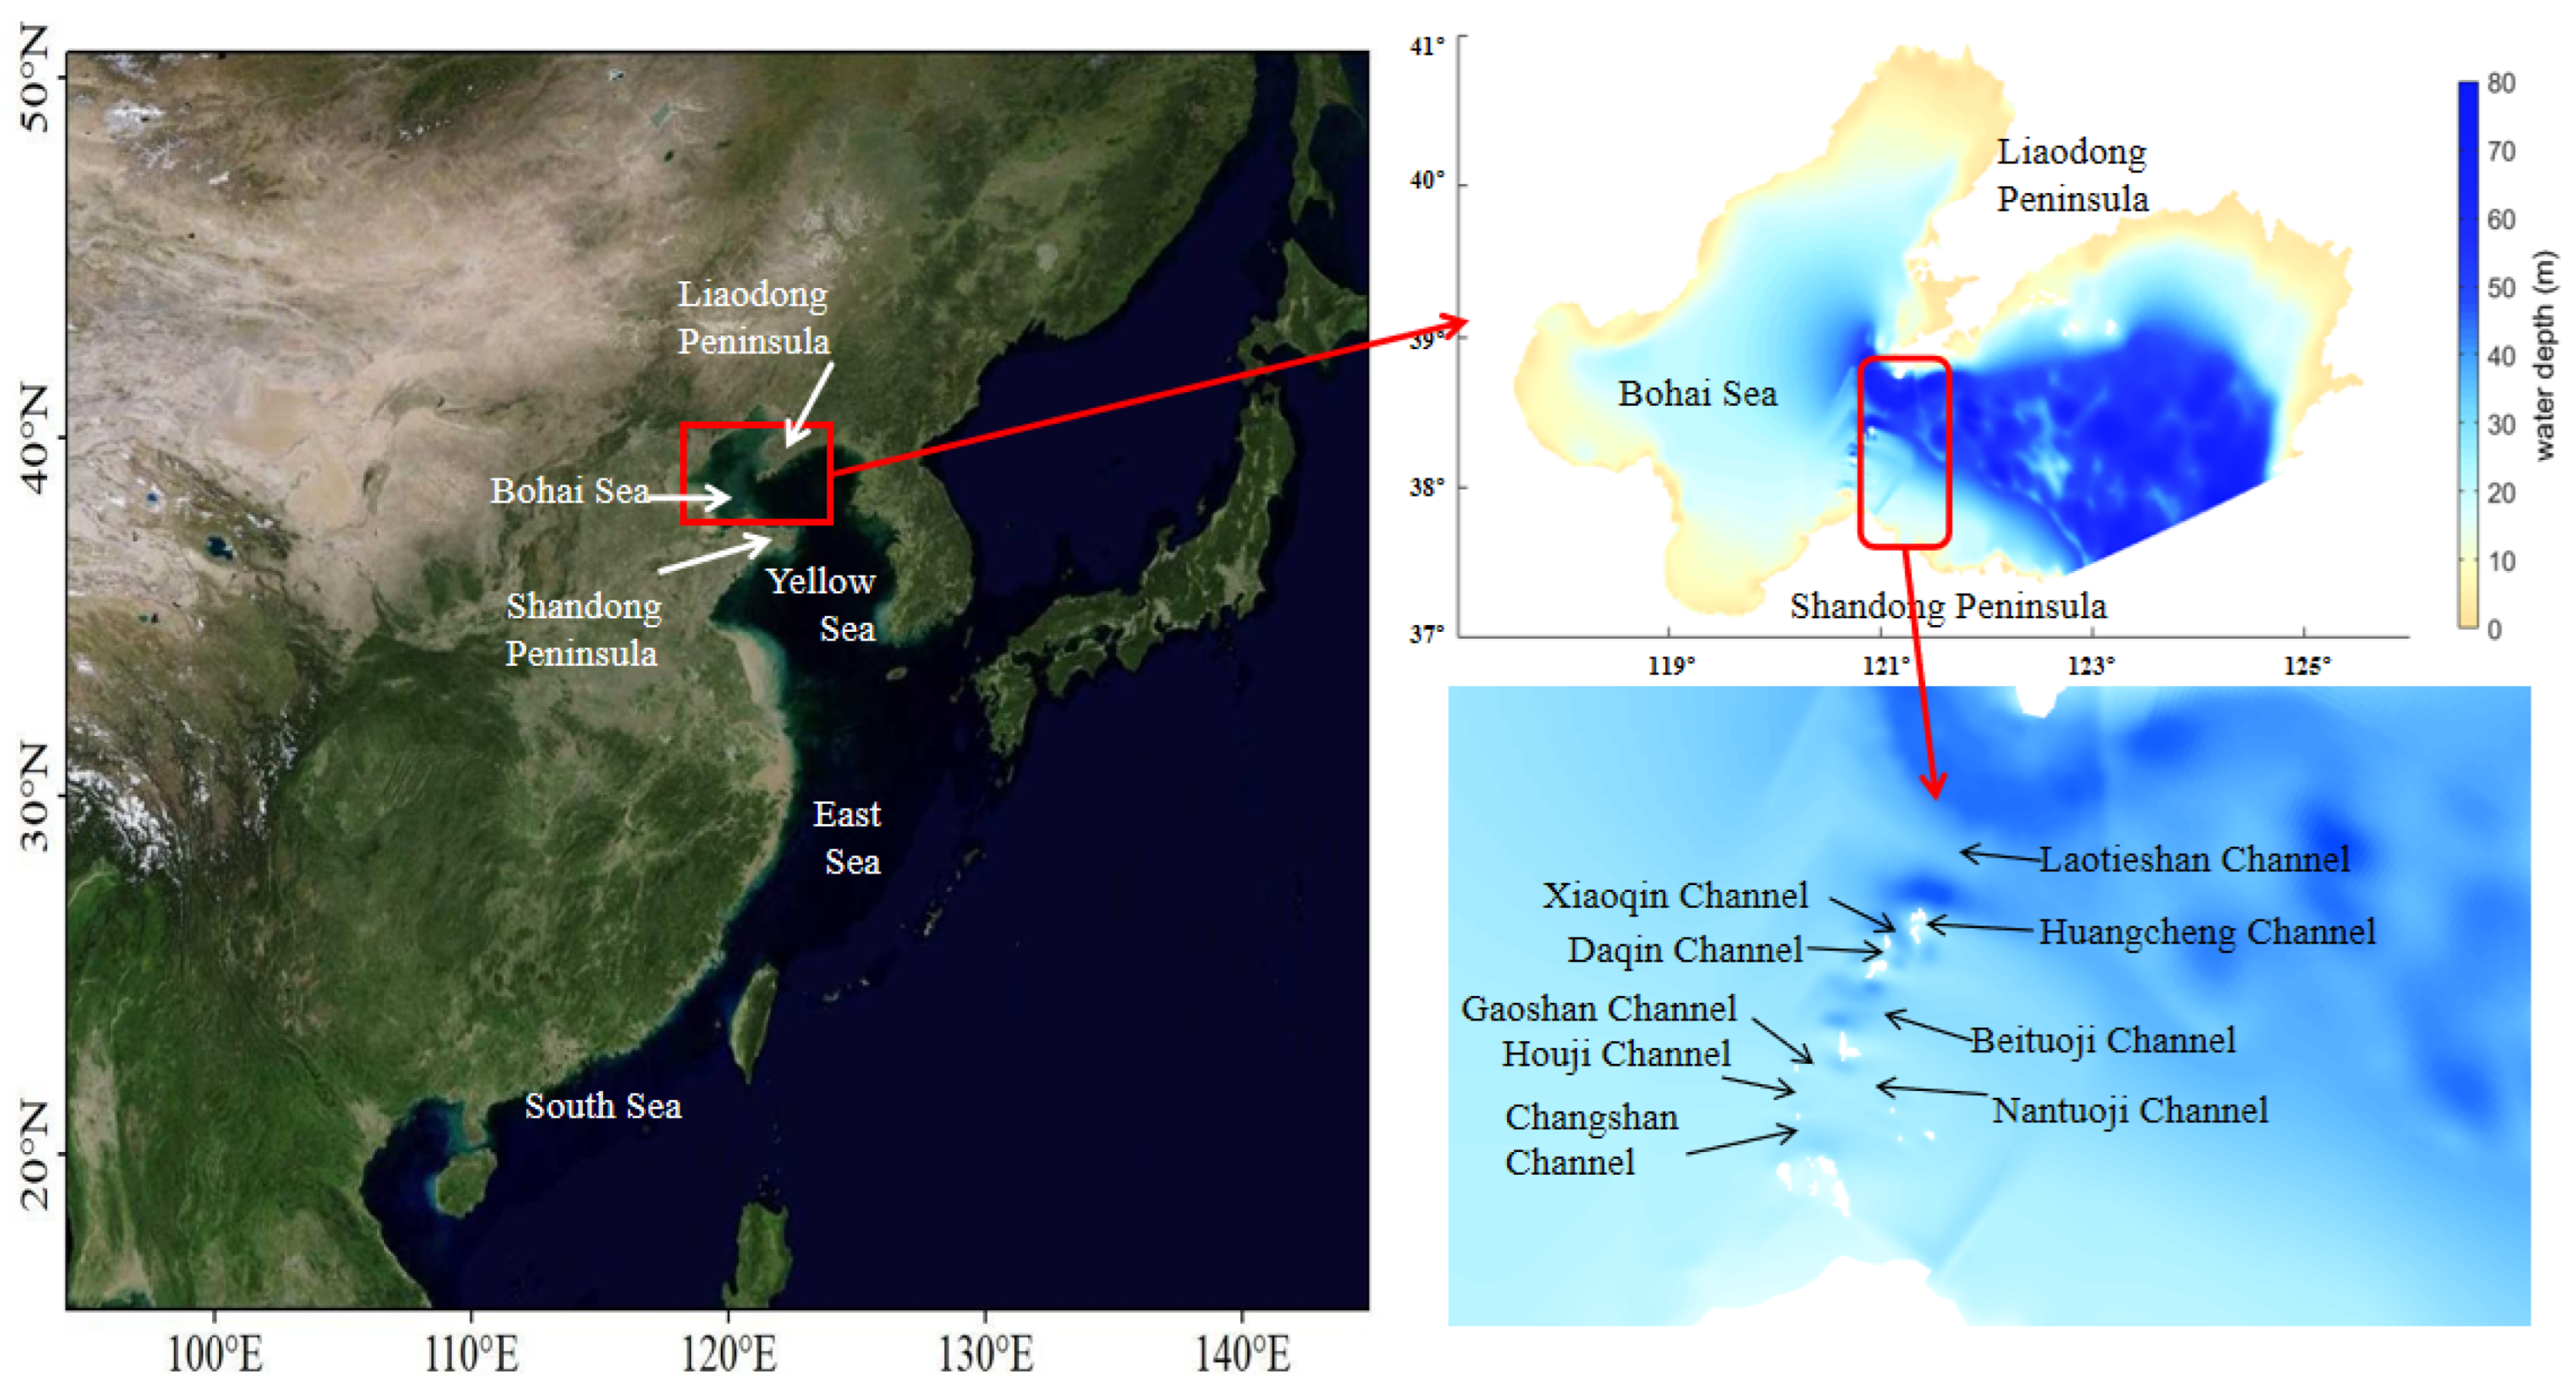
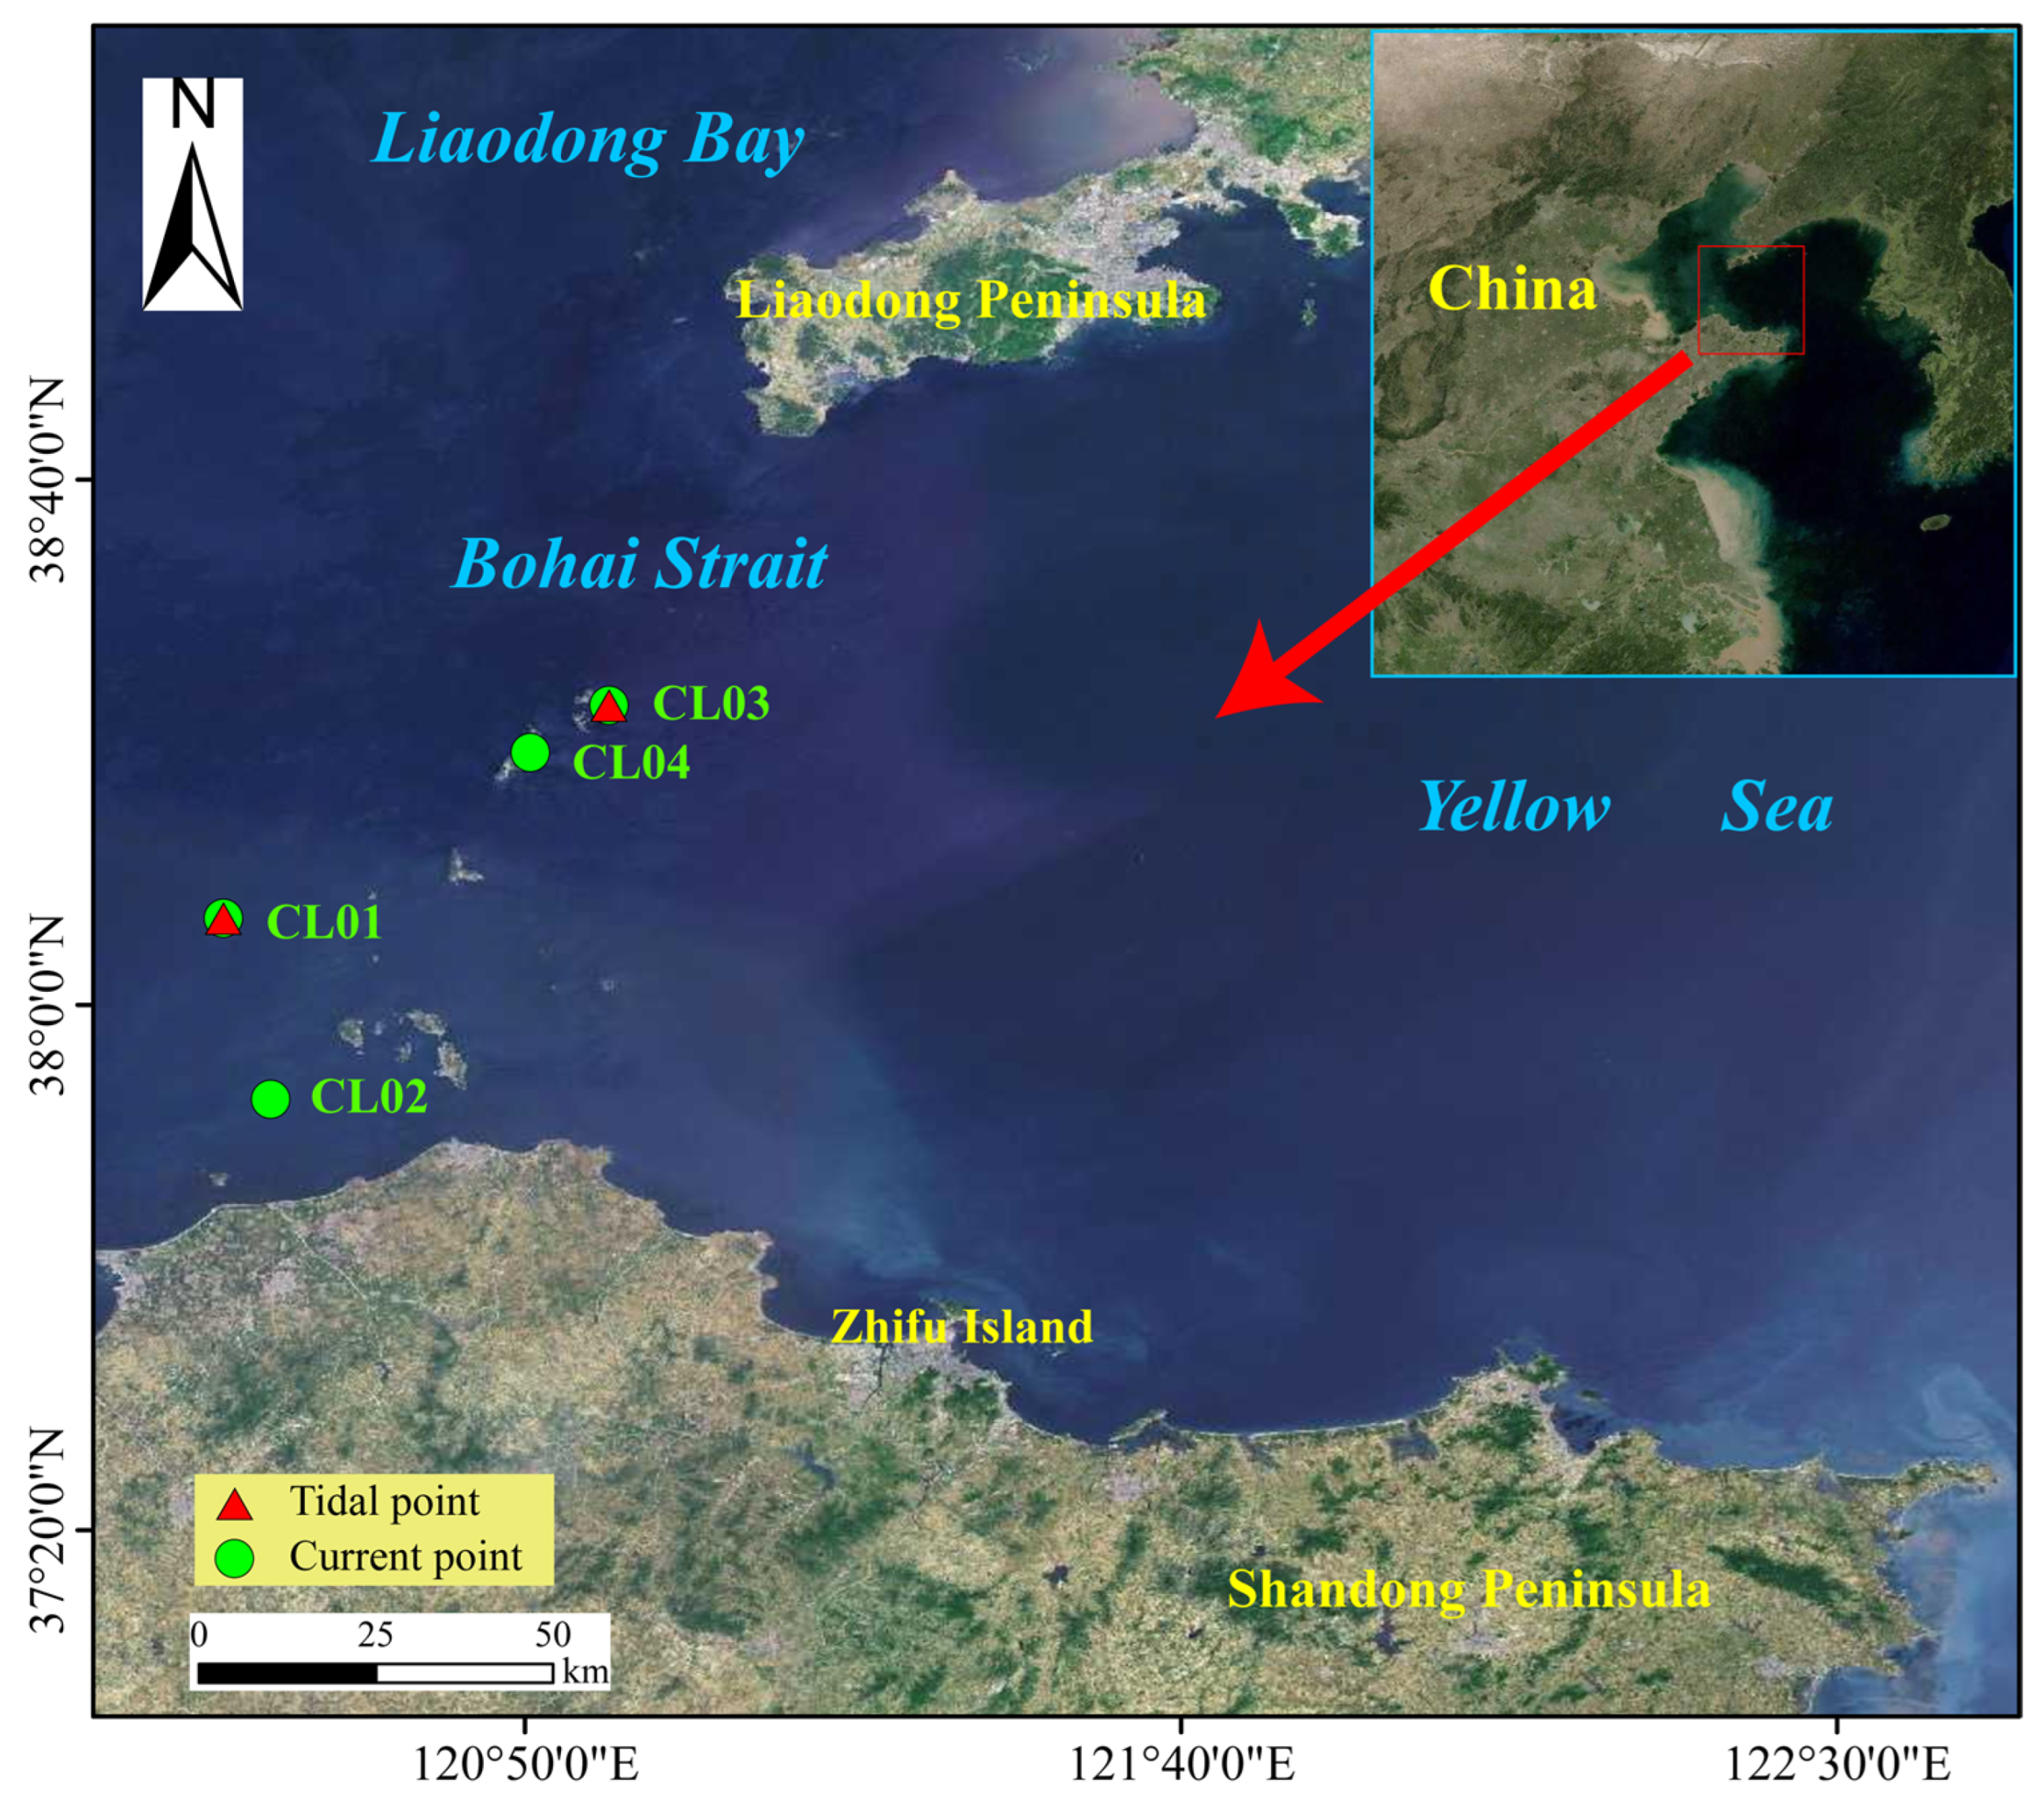
2.1. Study Area

The Bohai Strait, situated along China’s eastern seaboard, forms the connecting water body between the Bohai Sea and Yellow Sea. Bounded by the Liaodong Peninsula to the north, Shandong Peninsula to the south, Yellow Sea to the east, and Bohai Sea to the west, this strait constitutes a vital natural channel in northern coastal China [20]. The central Miaodao Archipelago (comprising Daheishan Island, Xiaoheishan Island, and Changdao Island), Houji Island, Gaoshan Island, Tuoji Island, Daqin Island, Xiaoqin Island, and Huangcheng Island create natural geomorphological advantages. The narrow inter-island channels including the Nantuoji Channel, Gaoshan Channel, Beituoji Channel, Houji Channel, Changshan Channel, Daqin Channel, Xiaoqin Channel, Huangcheng Channel, and Laotieshan Channel experience intensified bidirectional tidal flows, which constitute the primary mechanism for tidal energy concentration in this region. With a width of approximately 90 km, the strait serves as the sole connection between the Bohai Sea and open ocean. The northern Laotieshan Channel functions as a critical submarine transit corridor. Bathymetrically, the strait exhibits relatively shallow depths, with maximum depths exceeding 60 m in northern sections, while maintaining an average depth of 30 m throughout other areas, as shown in Figure 1.

2.2. Tidal Current Energy Assessment Methodology

This study began with a comprehensive literature review to collect data on semi-enclosed bay topography and tidal energy assessment methodologies. Research areas were subsequently delineated through systematic data consolidation. The bathymetric and topographic datasets required for modeling were acquired and preprocessed, while concurrent field measurements collected tidal elevation and current data for model validation. A numerical model was constructed using Delft3D and validated against field observations, demonstrating its capability to accurately replicate tidal dynamics across varying temporal scales. Validated model outputs were then employed to calculate the power density, enabling the estimation of both tidal energy reserves and exploitable potential. Finally, optimal deployment sites were determined by integrating calculated exploitable energy into key factors—tidal asymmetry, flow direction variability, exploitable hours, and vertical velocity profiles—yielding practical development recommendations. The research method and technical roadmap are shown in Figure 2.

2.2.1. Flow Velocity Asymmetry and Directional Rotational Variability

Power flux density (P) is principally governed by the flow velocity magnitude. The quantitative analysis of velocity–direction characteristics is therefore critical in turbine siting optimization. Preferred deployment zones exhibit pronounced reciprocating flow patterns. Therefore, in the calculation process, we also need to pay attention to the asymmetry of the local tidal flow velocity and the rotational nature of the flow direction [21]. α v represents the Flow velocity asymmetry; α v represents the Current Rotary Index; and α v , α θ can be calculated by Equations (6) and (7) [22]:
α v = | 1 V e V f |
α θ = | 180 ° | θ e θ f | |
where V f represents the Flood Tide Average Velocity; V e represents the Ebb Tide Average Velocity; θ e represents the Principal Flood Current Axis; and θ f represents the Principal Ebb Current Axis. The larger the α v value, the greater the asymmetry of flow velocity, and the greater the environmental impact on the exploitation area. The larger the same α θ value, the greater the rotational nature of the flow direction in this area; that is, it is closer to the rotational flow. Conversely, it is closer to the reciprocating flow and is more suitable for exploitation.

2.2.2. Operational Hours at Threshold Velocity

Tidal velocities under astronomical forcing exhibit sinusoidal-like periodic variations. Not all velocity ranges are suitable for energy conversion devices, as operational thresholds exist [4]. To quantify power generation duration, this study adopts the metric of Effective Generation Hours (EGH), defined as the cumulative time when the local flow velocity exceeds the turbine’s cut-in threshold. The calculation is as follows [22]:
sig H = v 1 0 dt
where sigH (significant hours) represents the effective tidal energy generation duration; v1 represents the minimum velocity threshold for turbine activation.

2.2.3. Power Flux Density

Power flux density (P) is a key metric for tidal energy assessment, defined as the tidal energy passing through a unit cross-sectional area per unit time (also termed power density). This parameter forms the foundation of the Flux method for estimating both theoretical reserves and technically extractable tidal energy. With the seawater density kept constant, P depends solely on the flow velocity. Higher velocities exponentially increase the energy yield per unit area, making P a critical indicator for resource evaluation [23].
P = 1 2 ρ v 3
where ρ denotes the seawater density—dependent on factors such as the geographic location, season, and water temperature—typically approximated as ρ = 1025   kg / m 3 ; v represents the flow velocity. Correspondingly, the maximum power flux density Pmax is introduced:
P max = 1 2 ρ v max 3
It is also determined by vmax to represent the spatial distribution of the maximum power flux density.

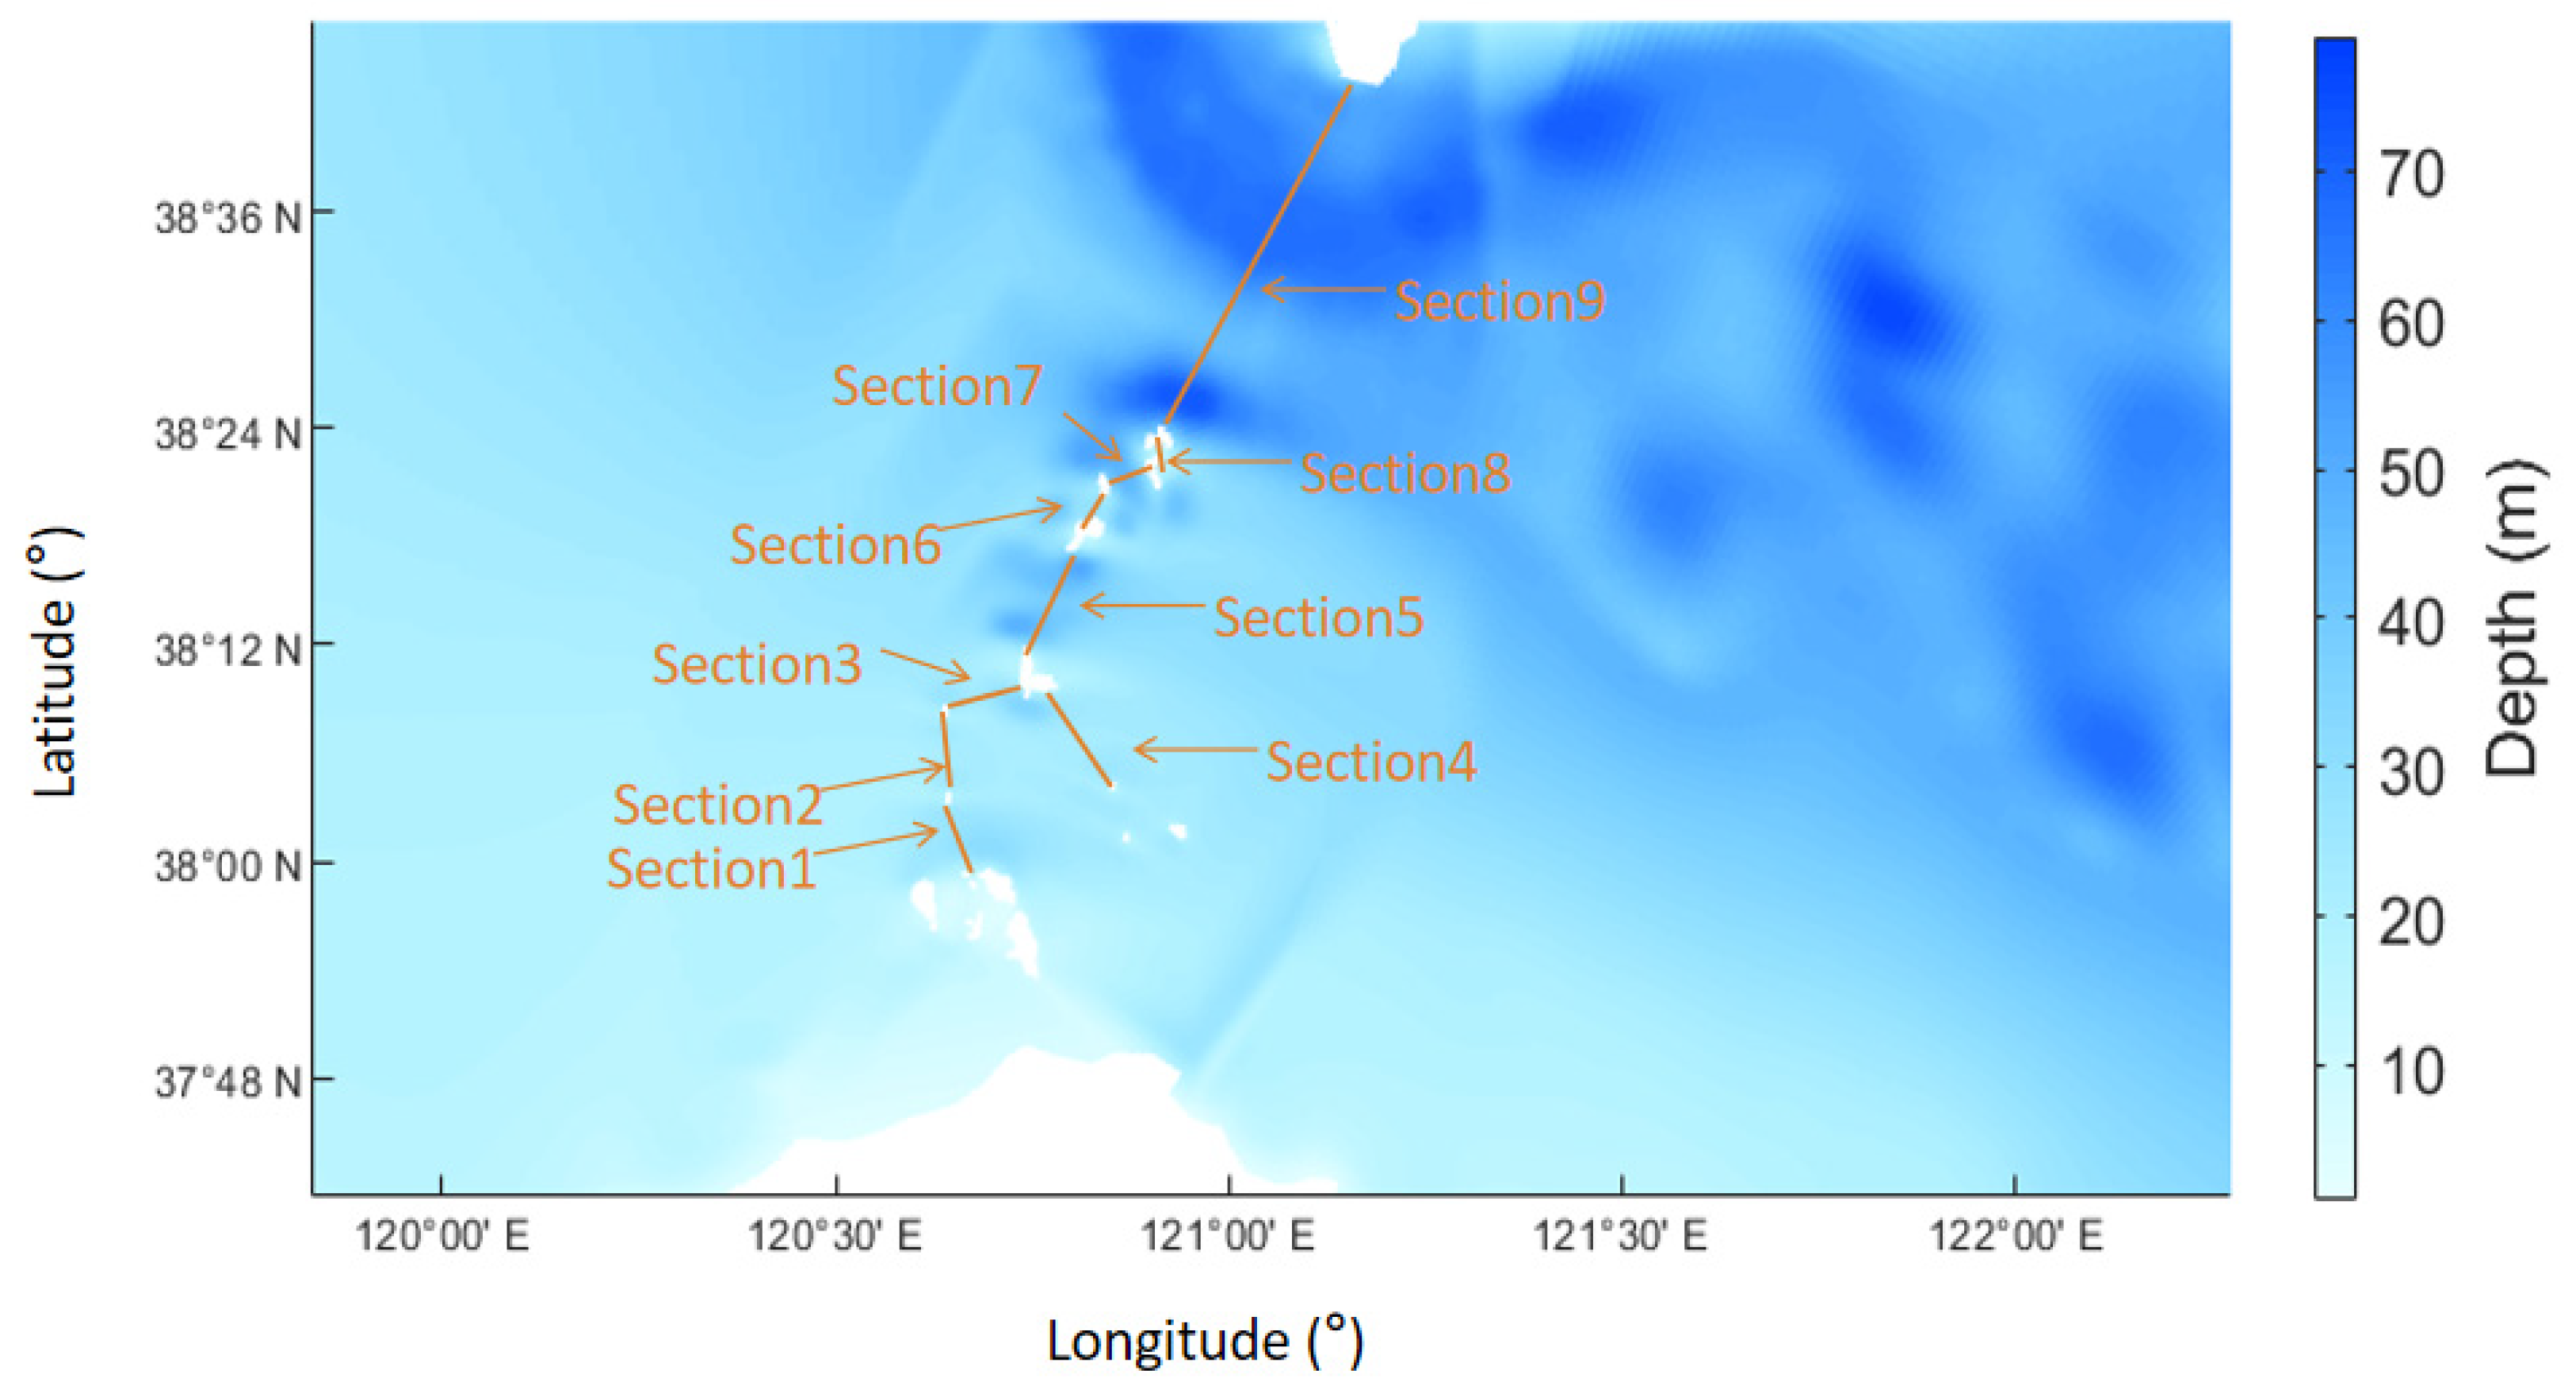
2.2.4. Flux Tidal Energy Assessment Methodology

The Flux methodology was co-developed by Black & Veatch and Robert Gordon University, UK [24]. This approach decouples computational analysis from local turbine selection and array configuration, instead focusing on environmental constraints in tidal energy exploitation. It posits that technically extractable tidal energy depends solely on the power flux density within the channel, formulated as follows:
N total = P m A
N α site = N total S I F
where Ntotal is the tidal current energy potential (W); Pm is the mean power flux density (W/m2); A is the channel cross-sectional area (m2); Nasite is the exploitation potential of tidal energy (W); and SIF is the Effective Impact Factor, a constant typically correlated with local topographical conditions.
According to the BV-04 report [25], the average exploitable potential of tidal energy resources along UK coastlines constitutes 20% of total reserves, indicating a maximum theoretical Effective Impact Factor (SIF) of 20%. The TISEC program by the US Electric Power Research Institute (EPRI) adopted a 15% SIF value for North American tidal energy assessments, positioned between the 20% upper limit from the BV-04 report and Bryden’s proposed 10% lower bound. In practice, SIF determination requires site-specific environmental evaluation. Collaborative research between Black & Veatch and Robert Gordon University (RGU) led to the development of a modeling framework in the BV-05 report to quantify SIF under real-world marine conditions. This study classified five geomorphological types—resonant estuaries, channels, headlands, open waters, and coastal lagoons—with the corresponding SIF values detailed in Table 1 [26].

2.3. Model Setup

The computational grid spans from 37.04° N to 41.03° N latitude and 117.52° E to 125.64° E longitude, covering the entire Bohai Sea and the northern Yellow Sea area beyond Chengshantou, Shandong Peninsula. A curvilinear orthogonal grid was generated using the built-in RGFGRID module, with local grid refinement around the Bohai Strait study area. The domain contains 615 × 534 grid cells, featuring an outer boundary grid size of approximately 1800 m, while refined regions attain a resolution of 200 m, as shown in Figure 3. This study incorporates dual bathymetric data sources: large-scale bathymetry from the ETOPO bathymetric elevation dataset, providing 1′ resolution coverage across extensive marine and coastal zones with proven accuracy, and high-resolution coastal charts of China’s near-shore waters, utilizing Electronic Navigational Charts (ENCs) for the Bohai Strait area. These ENC datasets achieve 500 m resolution with enhanced precision, while the model’s bathymetric reference plane aligns with the mean sea level.
Delft3D (4.04.02) offers multiple open boundary condition types, including water level, current velocity, Neumann, and total discharge. This model’s open ocean boundaries are driven by water level forcing derived from the Tide Model Driver (TMD), which assimilates satellite altimetry data to obtain harmonic constants of tidal constituents. Eight principal tidal constituents (K1, O1, P1, Q1, M2, S2, N2, and K2) are incorporated in the simulation [27]. The computational domain is initialized with zero water levels and current velocities across all grid points:
ζ x , y , t t = 0 = 0    
u x , y , t t = 0 = 0  
v x , y , t t = 0 = 0  
A three-dimensional hydrodynamic model was implemented using Delft3D to simulate the period from 15 April 2022 00:00 to 15 May 2022 23:00. Key parameter configurations include the gravitational acceleration is 9.8 m/s2, the seawater density is 1025 kg/m3, the Manning roughness coefficient is 0.025, the horizontal eddy viscosity coefficient is 1 m2/s, and the time step is 1 min. The analysis focused on the spring-neap tidal cycle between 1 and 12 May 2022. The specific model settings and operational details are summarized in Table 2.

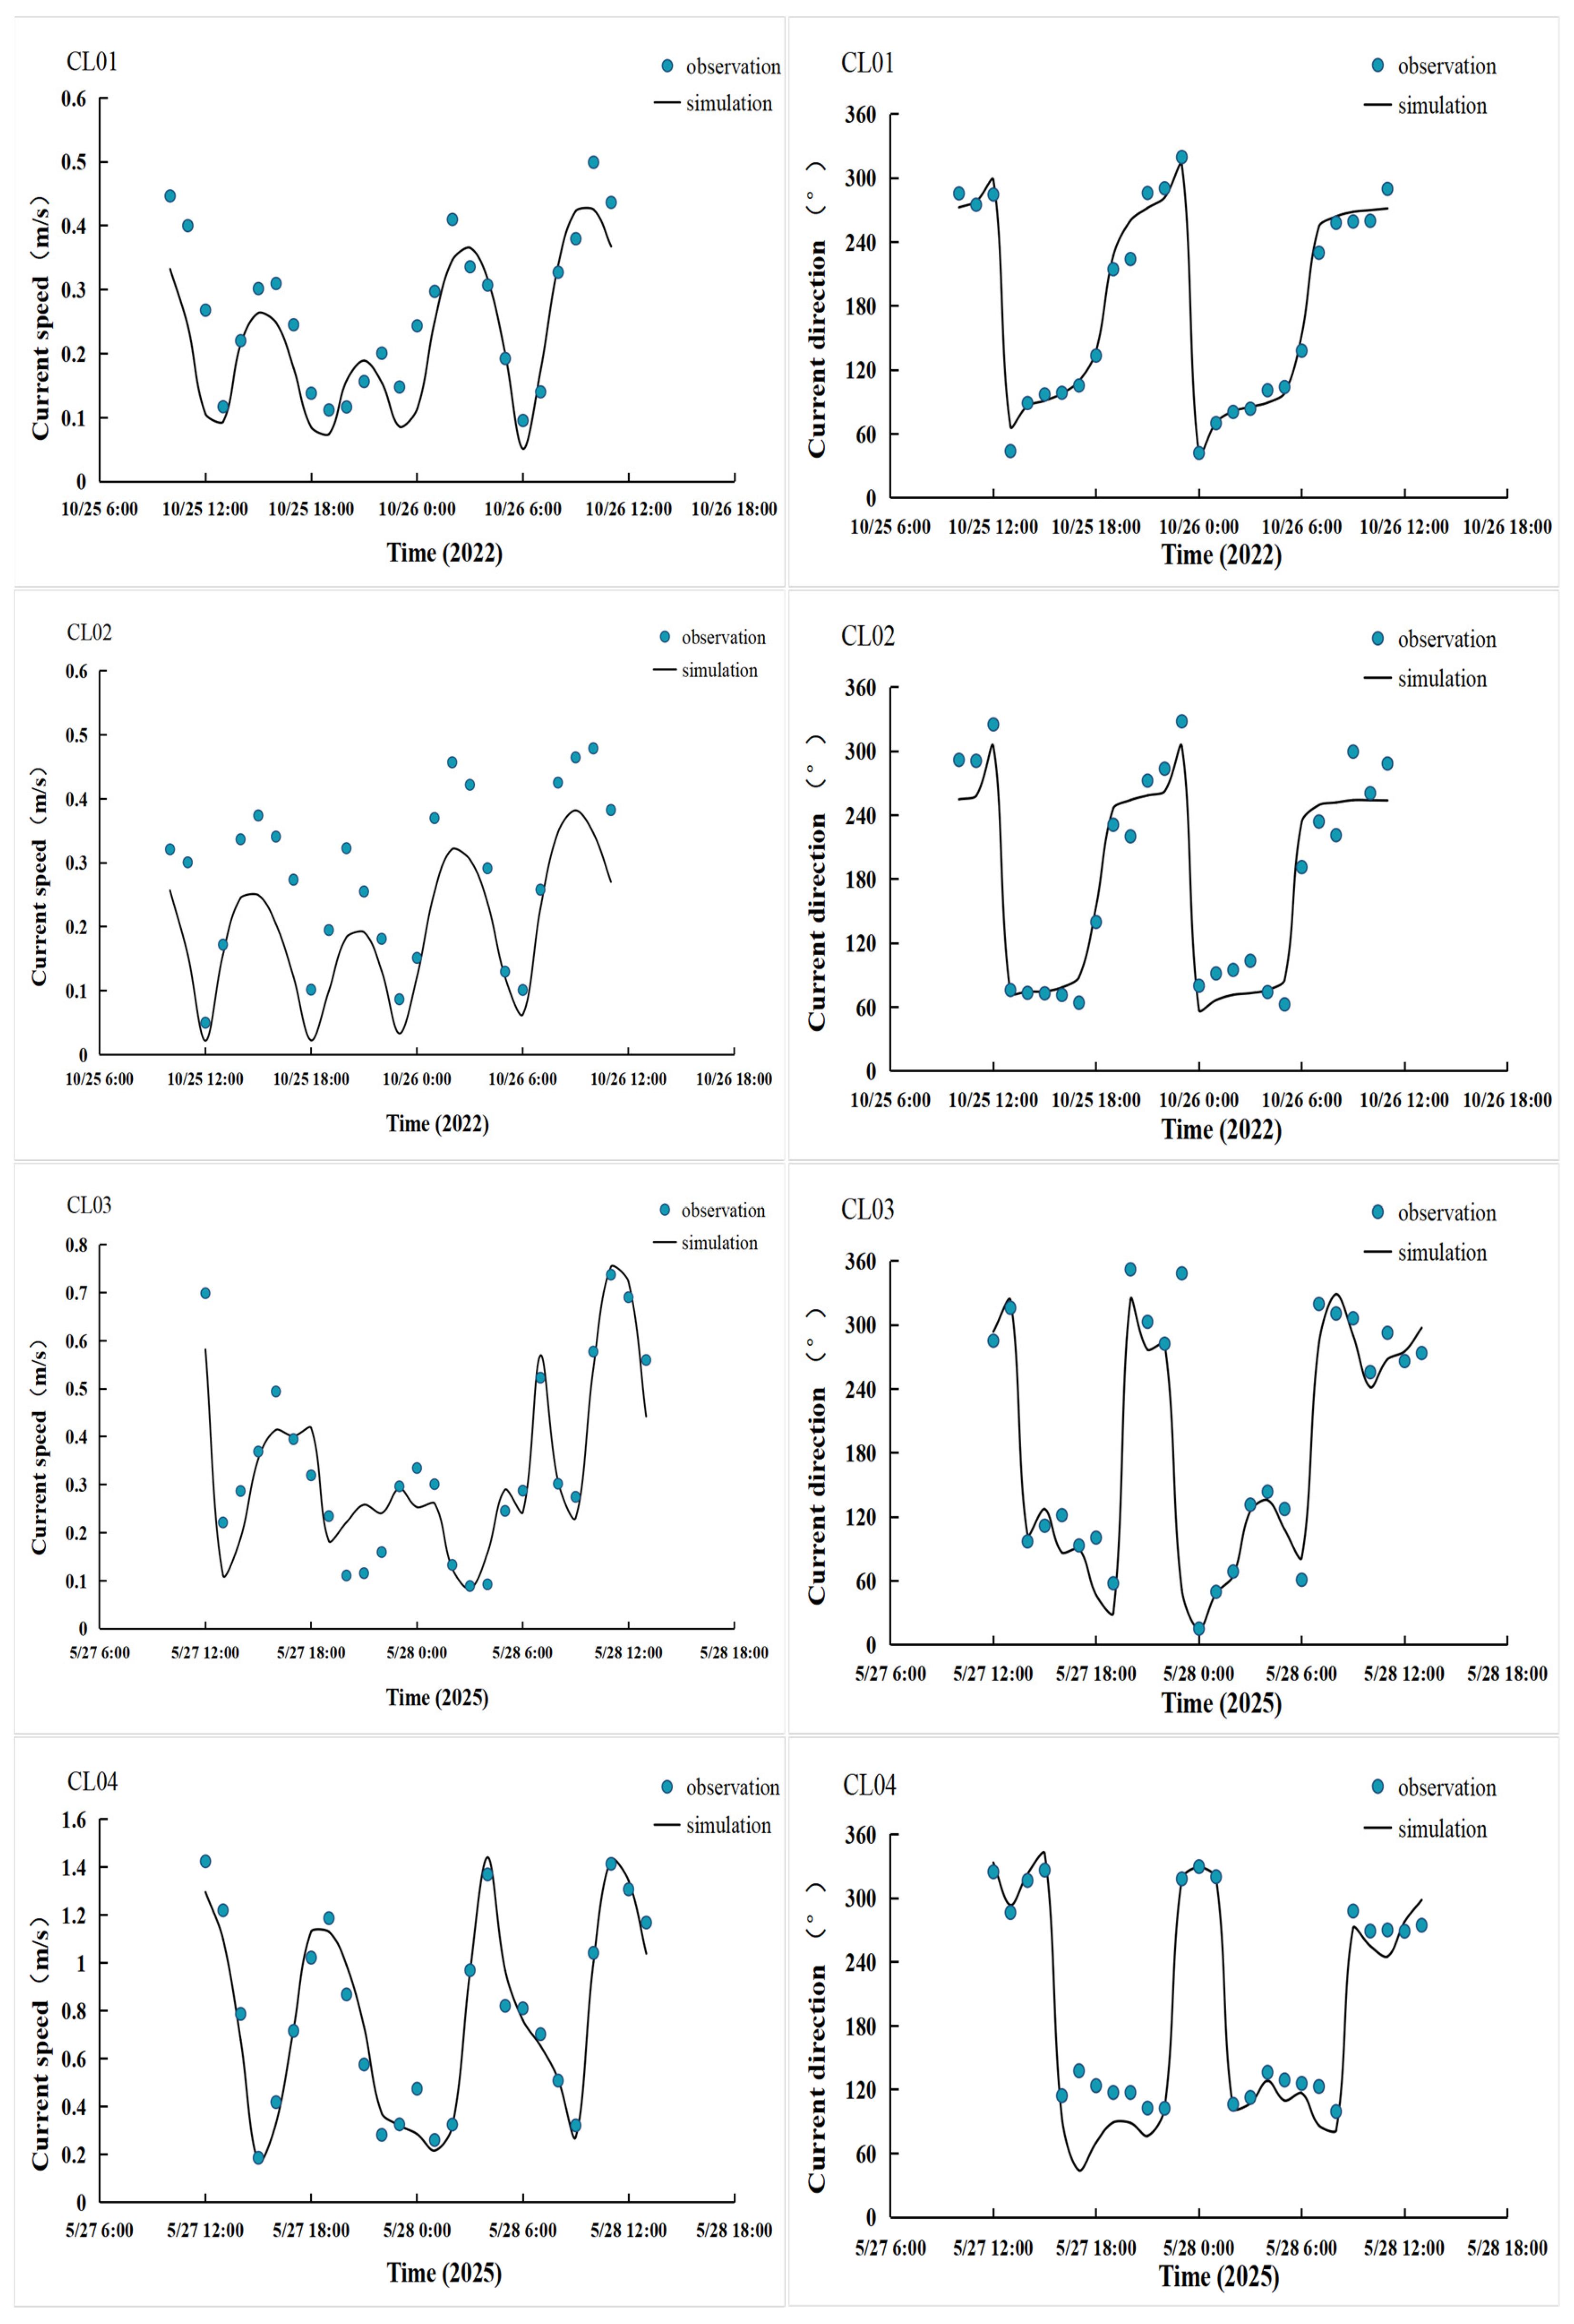
2.4. Model Validation

The model validation utilized real-time tidal current data (velocity and direction) collected from stations CL01 and CL02 between 10:00 on 25 October 2022 and 11:00 on 26 October 2022. The model validation also utilized real-time tidal current data (speed and direction) collected from stations CL03 and CL04 between 12:00 on 27 May 2025 and 13:00 on 28 May 2025. The model validation was further enhanced by incorporating tidal level measurements from CL01 (November 2021) and CL03 (May 2025), while leveraging tidal current data across distinct time periods to better demonstrate the model’s robustness. The geographic coordinates of validation points and their spatial distribution are detailed in Table 3 and Figure 4.
To validate the reliability of the model simulation results, this study employs two widely adopted statistical metrics for quantitative evaluation: the Pearson Correlation Coefficient (R) and the Root Mean Square Error (RMSE) [28]. The correlation coefficient quantifies the linear correlation between simulated and observed data, while the RMSE measures the magnitude of deviations in simulation outcomes. Collectively, these metrics provide a comprehensive assessment of model accuracy and reliability from complementary perspectives, with their computational formulas detailed below.
R = X mod X ¯ mod X o b s X ¯ o b s X mod X ¯ mod 2 X o b s X ¯ o b s 2
R M S E = X obs X mod 2 N
where X mod is the simulated value of the model, X o b s is the observed value, X ¯ mod and X ¯ o b s are the arithmetic means of the simulated values and observed values, respectively, and N is the number of statistical variables. The Pearson Correlation Coefficient (R) score measures how closely model simulation deviations from the observed mean align with corresponding deviations in observed values. This metric ranges from 0 to 1, with a perfect value of 1 indicating complete consistency between simulations and observations. Interpretation guidelines classify results as follows: scores exceeding 0.65 demonstrate excellent performance; values between 0.50 and 0.65 denote very good outcomes; scores of 0.20–0.50 suggest good agreement; and results below 0.20 reflect poor correspondence. Conversely, the Root Mean Square Error (RMSE) follows an inverse relationship with lower-accuracy values, indicating a reduced discrepancy between simulated and observed data, signifying superior model fidelity to real-world conditions. As shown in Table 4, the simulation results from the model exhibit minimal discrepancies compared to the measured data. Thus, the outcomes from the Delft3D model can support subsequent analysis and prediction efforts.
In prior studies, Abundo et al. employed Delft3D to investigate tidal current patterns at four Philippine locations, proposing site-specific tidal energy exploitation strategies [29]. Similarly, Ma et al. successfully simulated Bohai Strait tidal dynamics using Delft3D, demonstrating the model’s robust performance across diverse geographic settings [30]. The comparative analysis of tidal elevation, current velocity, and direction between simulation outputs and field measurements (Figure 5 and Figure 6) reveals minimal discrepancies, with the observed data showing strong agreement with the modeled results, thus validating the model’s reliability for subsequent analysis and forecasting applications.

3. Tidal Current Results and Evaluation of Tidal Current Energy

3.1. Tidal Current Hydrodynamic Characterization

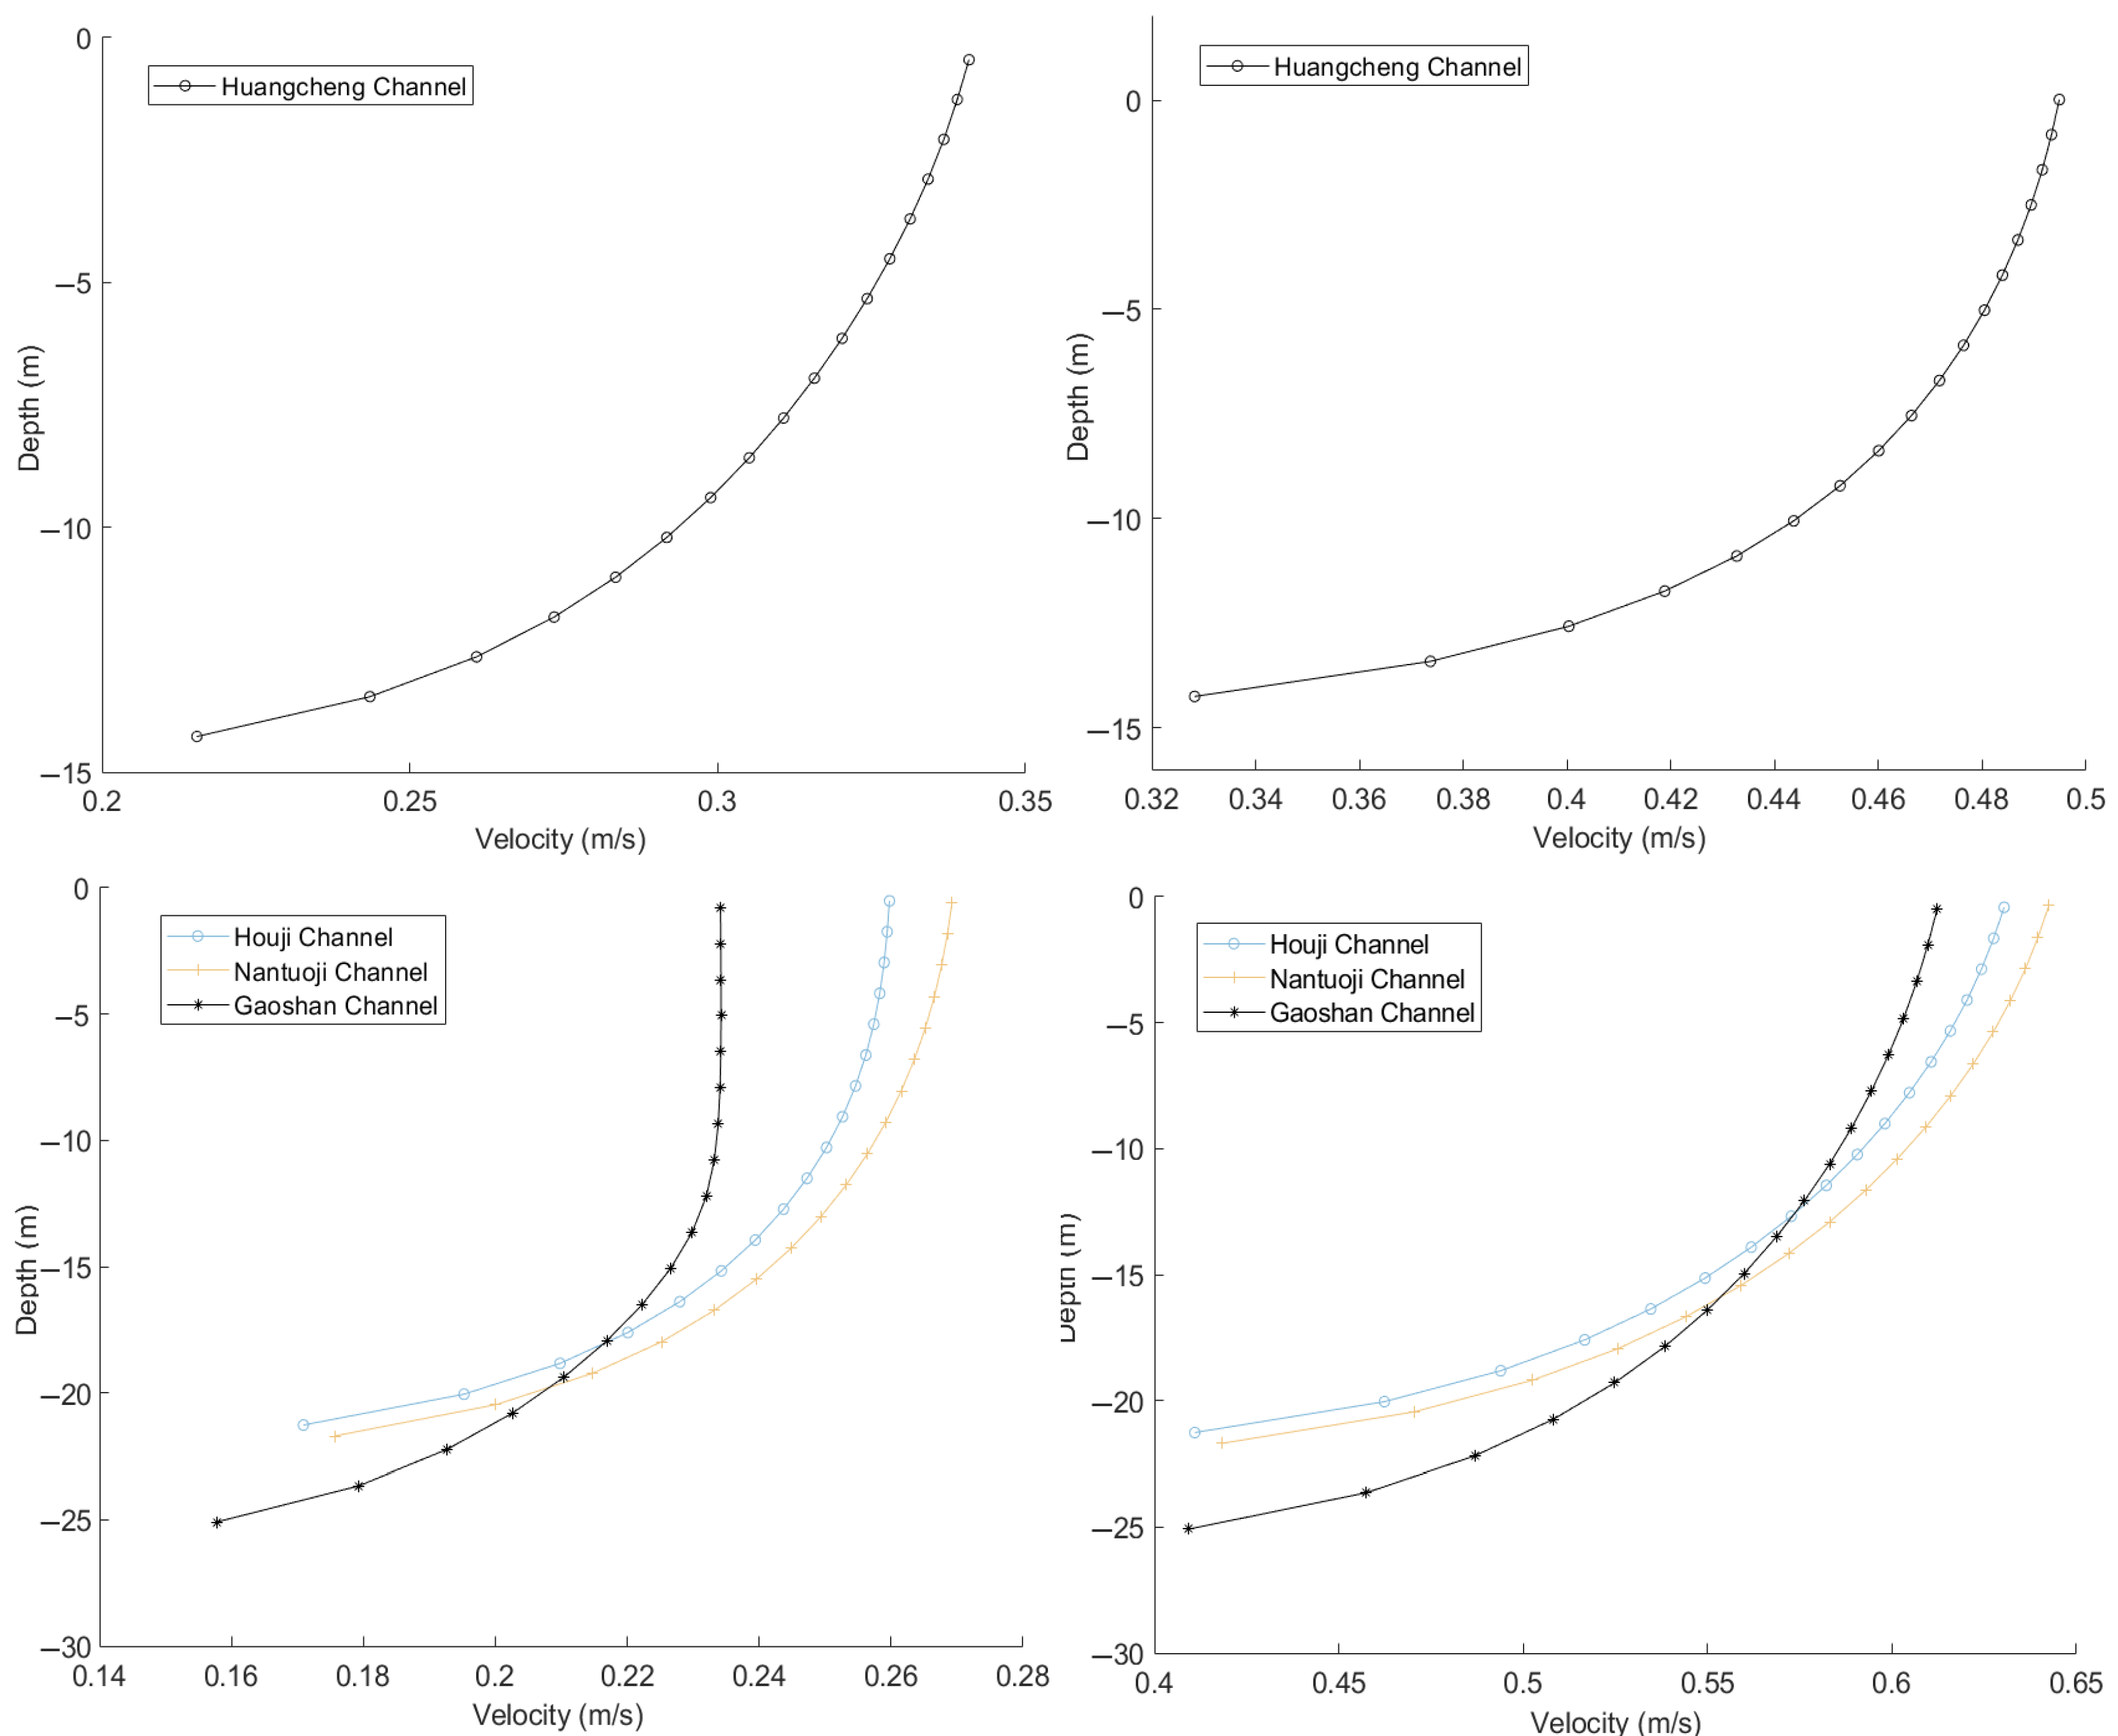
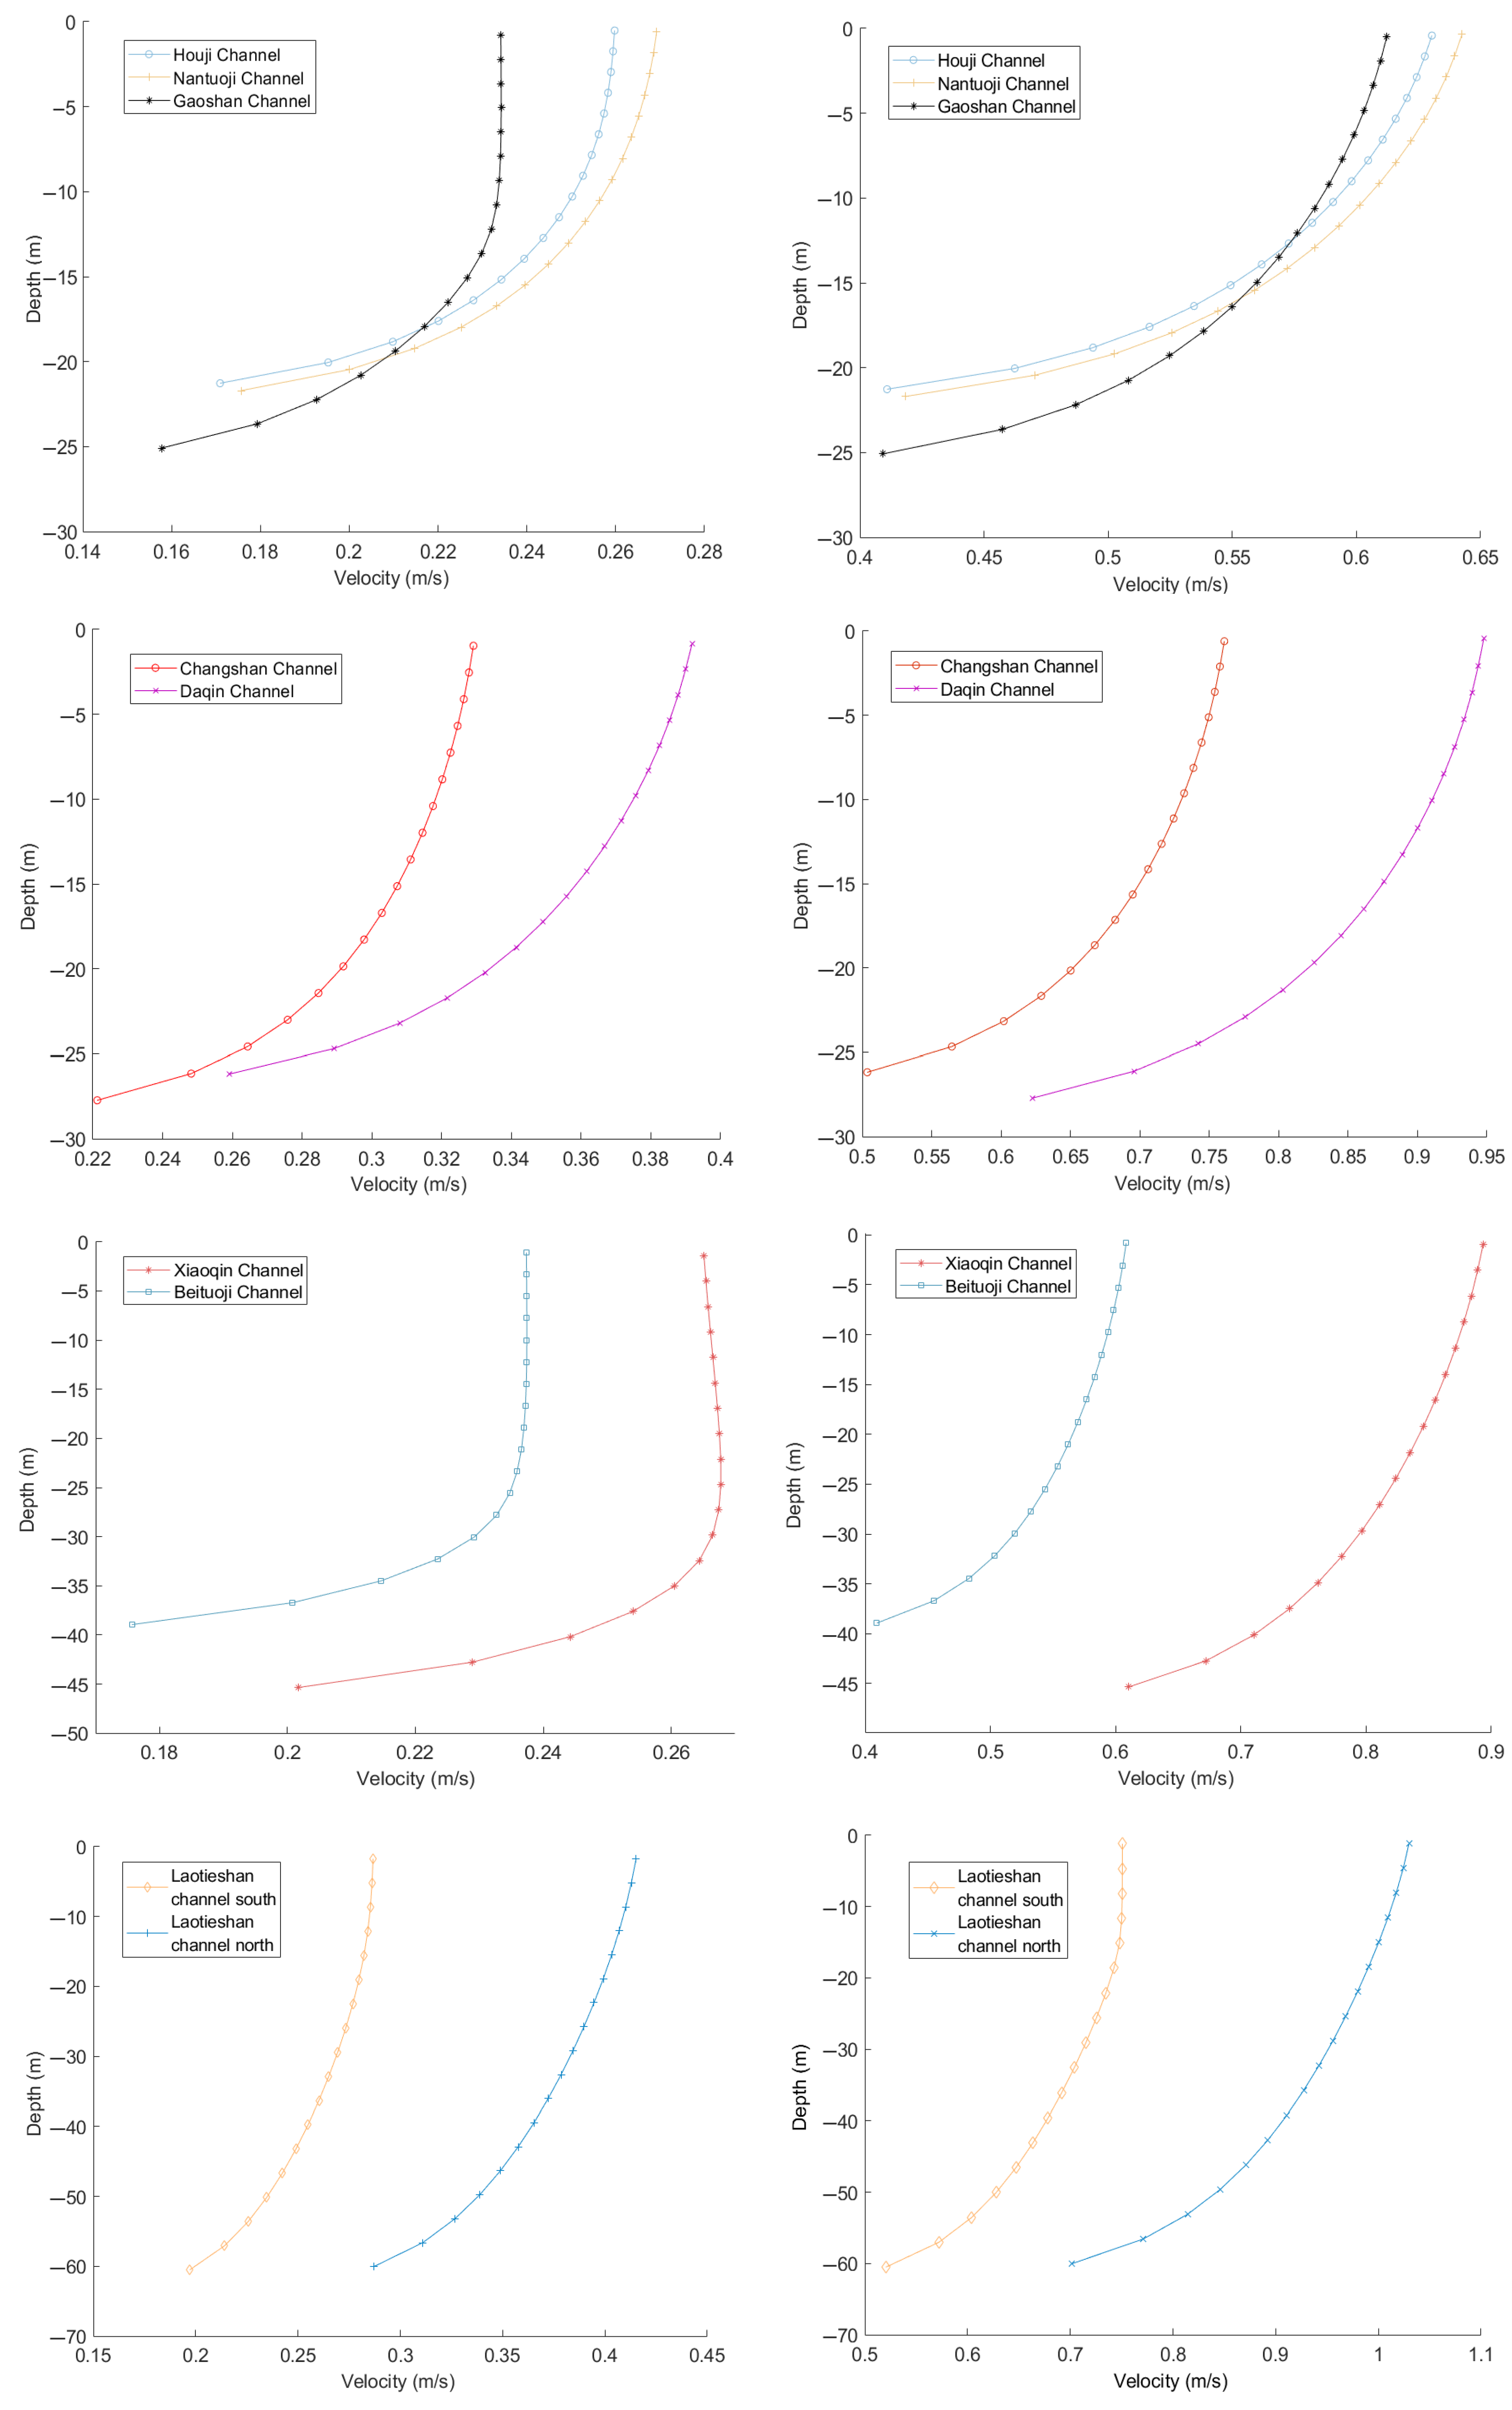
3.1.1. Vertical Flow Velocity Profile

Based on the Delft3D three-dimensional velocity data, vertical profiles of maximum and mean current velocities were plotted for mid-channel sections and the northern and southern regions of Laotieshan Channel. As shown in Figure 7, the results indicate an exponential decrease in both mean and maximum velocities from the seabed to the surface, with the flow velocities progressively diminishing as the water depth increases. The relatively shallow Huangcheng Channel requires depths exceeding 5 m to attain velocity thresholds. At its surface layer, the mean velocity threshold approximates 0.33 m/s, while the maximum velocity threshold reaches 0.5 m/s. Houji Channel, Nantuoji Channel, Gaoshan Channel, Changshan Channel, and Daqin Channel are a little deeper compared to the Huangcheng Channel; the flow velocity of these channels decreases gradually from the bottom to the surface until reaching the 10 m layer threshold. At this time, Houji Channel, Nantuoji Channel, and Gaoshan Channel have an average flow velocity threshold of 0.23–0.26 m/s and a maximum flow velocity threshold of 0.6–0.65 m/s; Changshan Channel has an average flow velocity threshold around 0.32 m/s, and its maximum flow velocity threshold is around 0.75 m/s; and Daqin Channel has a higher flow velocity, with an average flow velocity threshold of 0.39 m/s, and a maximum flow velocity threshold of 0.75 m/s. Xiaoqin Channel, Beituoji Channel, and Laotieshan Channel have a deeper water depth, so the flow rate threshold in this area is reached when the area is underwater by 20 m. The average flow rate threshold of Beituoji Channel is 0.24 m/s, and the maximum flow rate threshold is 0.6 m/s; the average flow rate threshold of Xiaoqin Channel is 0.27 m/s, and the maximum flow rate threshold is 0.9 m/s; the average flow rate threshold of the southern part of Laotieshan Channel is 0.28 m/s, and the maximum flow rate threshold is 0.75 m/s; and the average flow rate threshold of the northern part of Laotieshan Channel is 0.43 m/s, and the maximum flow rate threshold is 1.05 m/s.

3.1.2. Flow Velocity Asymmetry and Directional Rotational Variability

As shown in Table 5, the Changshan and Nantuoji Channels exhibit a significant flow velocity asymmetry, exceeding 0.4. The Houji and Gaoshan Channels demonstrate a tidal energy asymmetry of 0.35. Consequently, tidal turbine deployment in these four channels may induce environmental impacts on local ecosystems [22]. Although reciprocating flow dominates across the Bohai Strait channels, the Xiaoqin, Ntuoji, and Houji Channels demonstrate discernible rotational flow characteristics due to bathymetric constraints, which are particularly pronounced in the Xiaoqin Channel. Turbine deployment should therefore prioritize reciprocating flow-dominated channels with minimal rotational flow to mitigate structural fatigue risks.

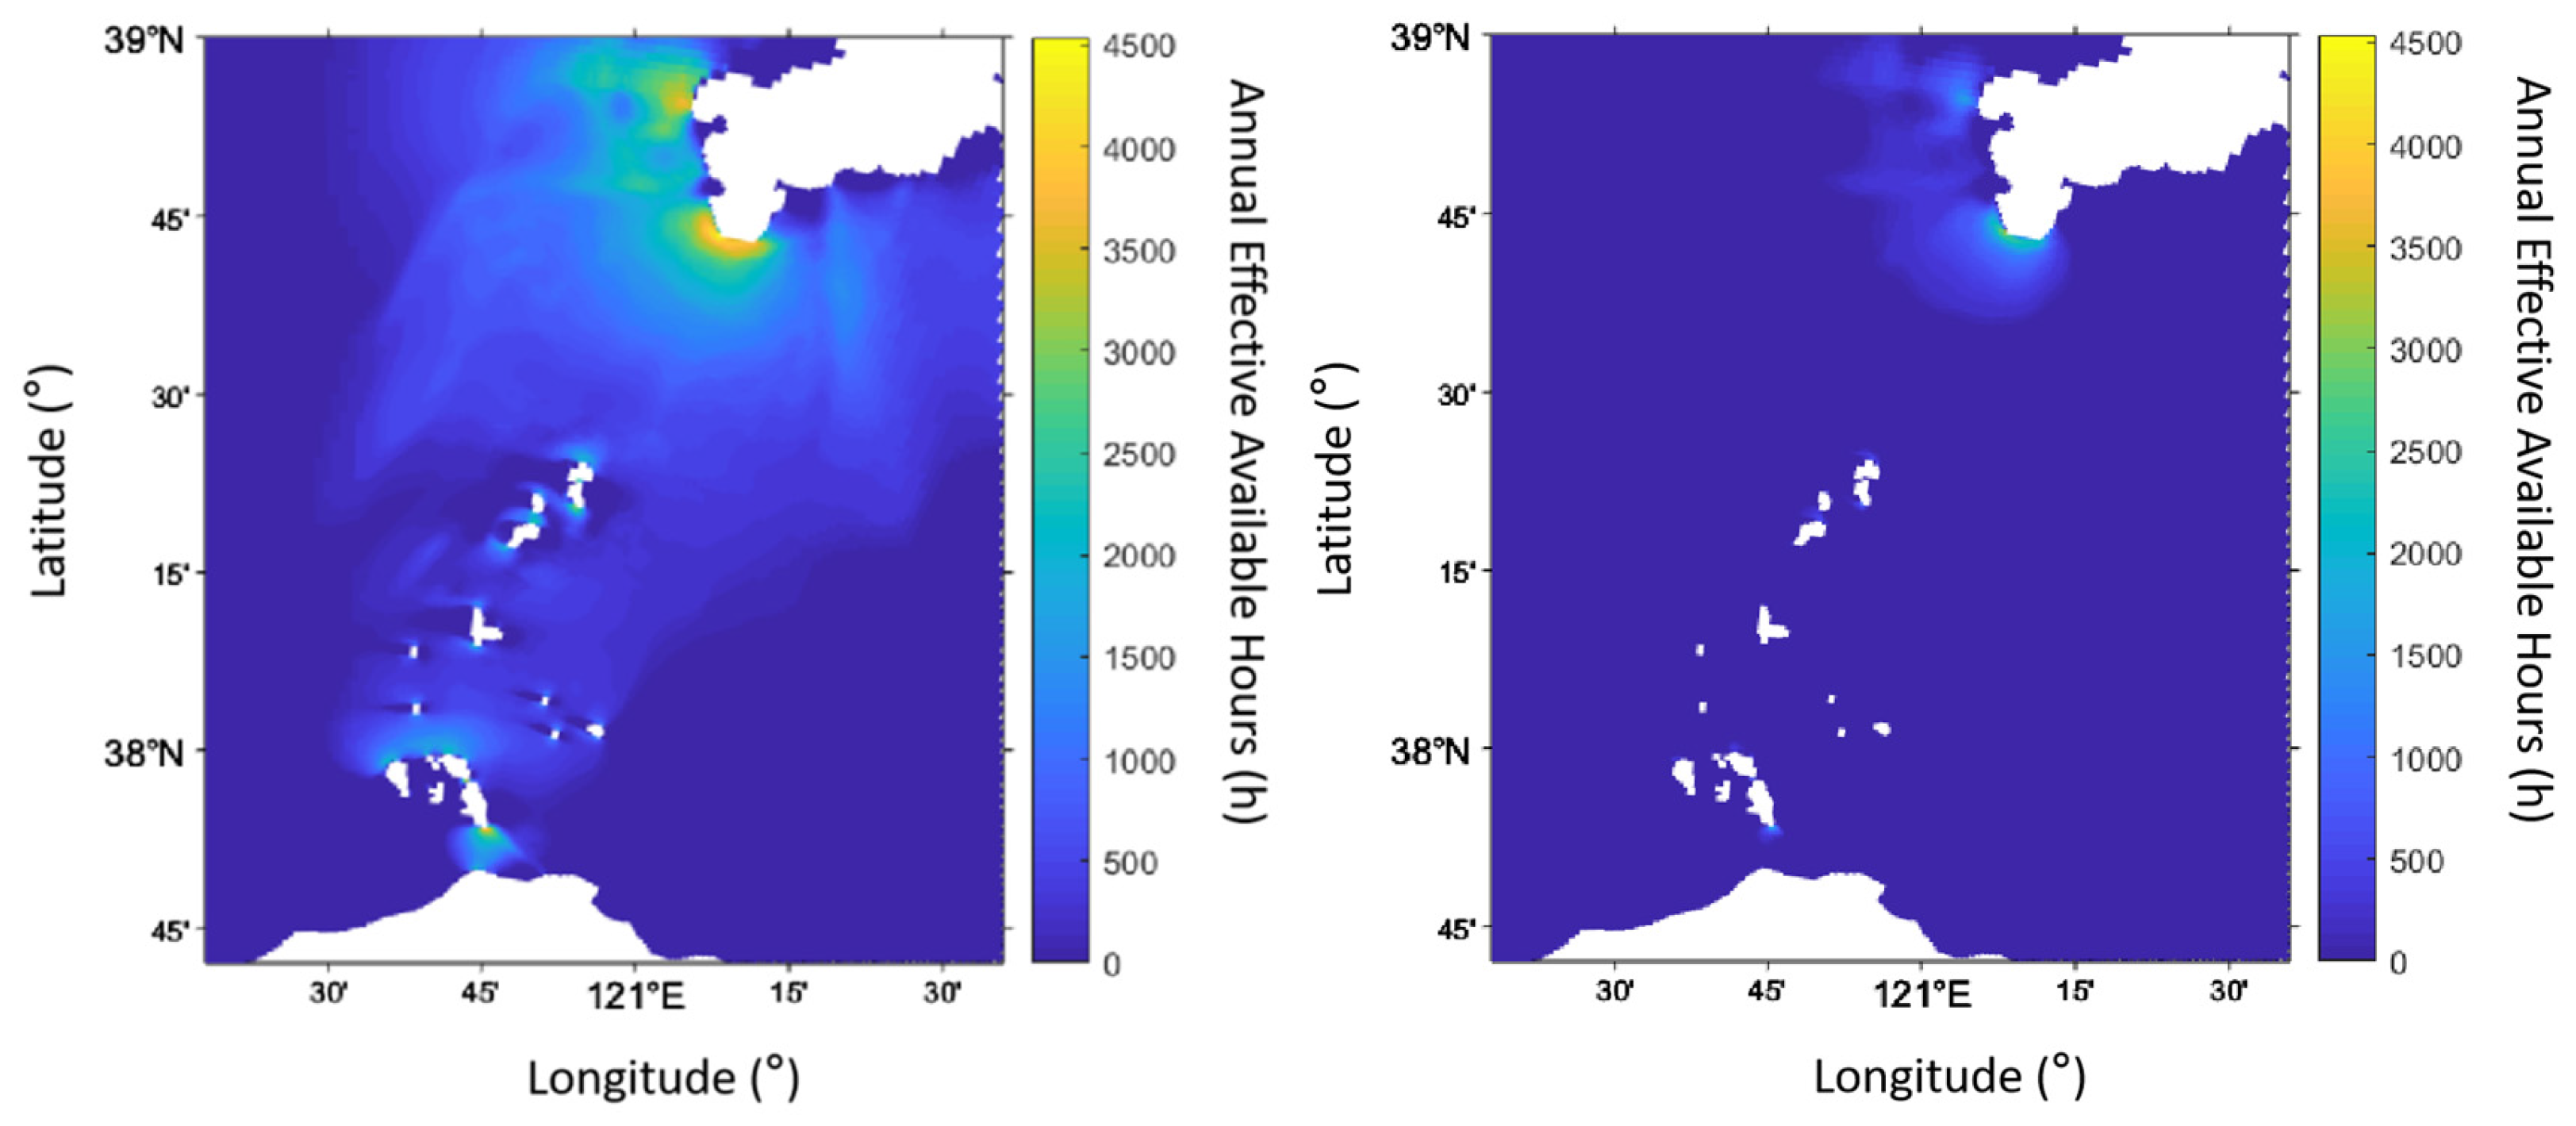
3.1.3. Operational Hours at Threshold Velocity

Given the generally low flow velocities in the Bohai Strait, this study calculates the cumulative effective generation duration with vertically averaged velocities exceeding 0.8 m/s and 0.5 m/s over a complete tidal cycle (including spring, neap, and intermediate tides). These durations are then annualized to Yearly Effective Generation Hours for the analysis of the temporal distribution characteristics of tidal energy exploitation in the region, as illustrated in Figure 8.
Yearly Effective Generation Hours serve as a critical economic indicator in tidal energy exploitation. With a fixed installed capacity, higher Yearly Effective Generation Hours directly correlates with an increased annual energy yield. As shown in Figure 8, it can be seen that the flow velocity in the Bohai Strait is above 0.5 m/s for 1500 h in a year, and it is, more near the shore, up to 2000 h. The northern part of the Laotieshan Channel is able to reach more than 4500 h. The area where the flow velocity can be more than 0.8 m/s is generally less than 500 h in a year, and only the area in the northern part of the Laotieshan Channel is in the range of 1500–2500 h. This area has the most abundant tidal energy resources. Only the northern part of the Laotieshan Channel has a period of about 1500–2500 h at 0.8 m/s or higher; the flow velocity in this area is greater, and the tidal energy resource is the most abundant.

3.2. Tidal Energy Resource Assessment

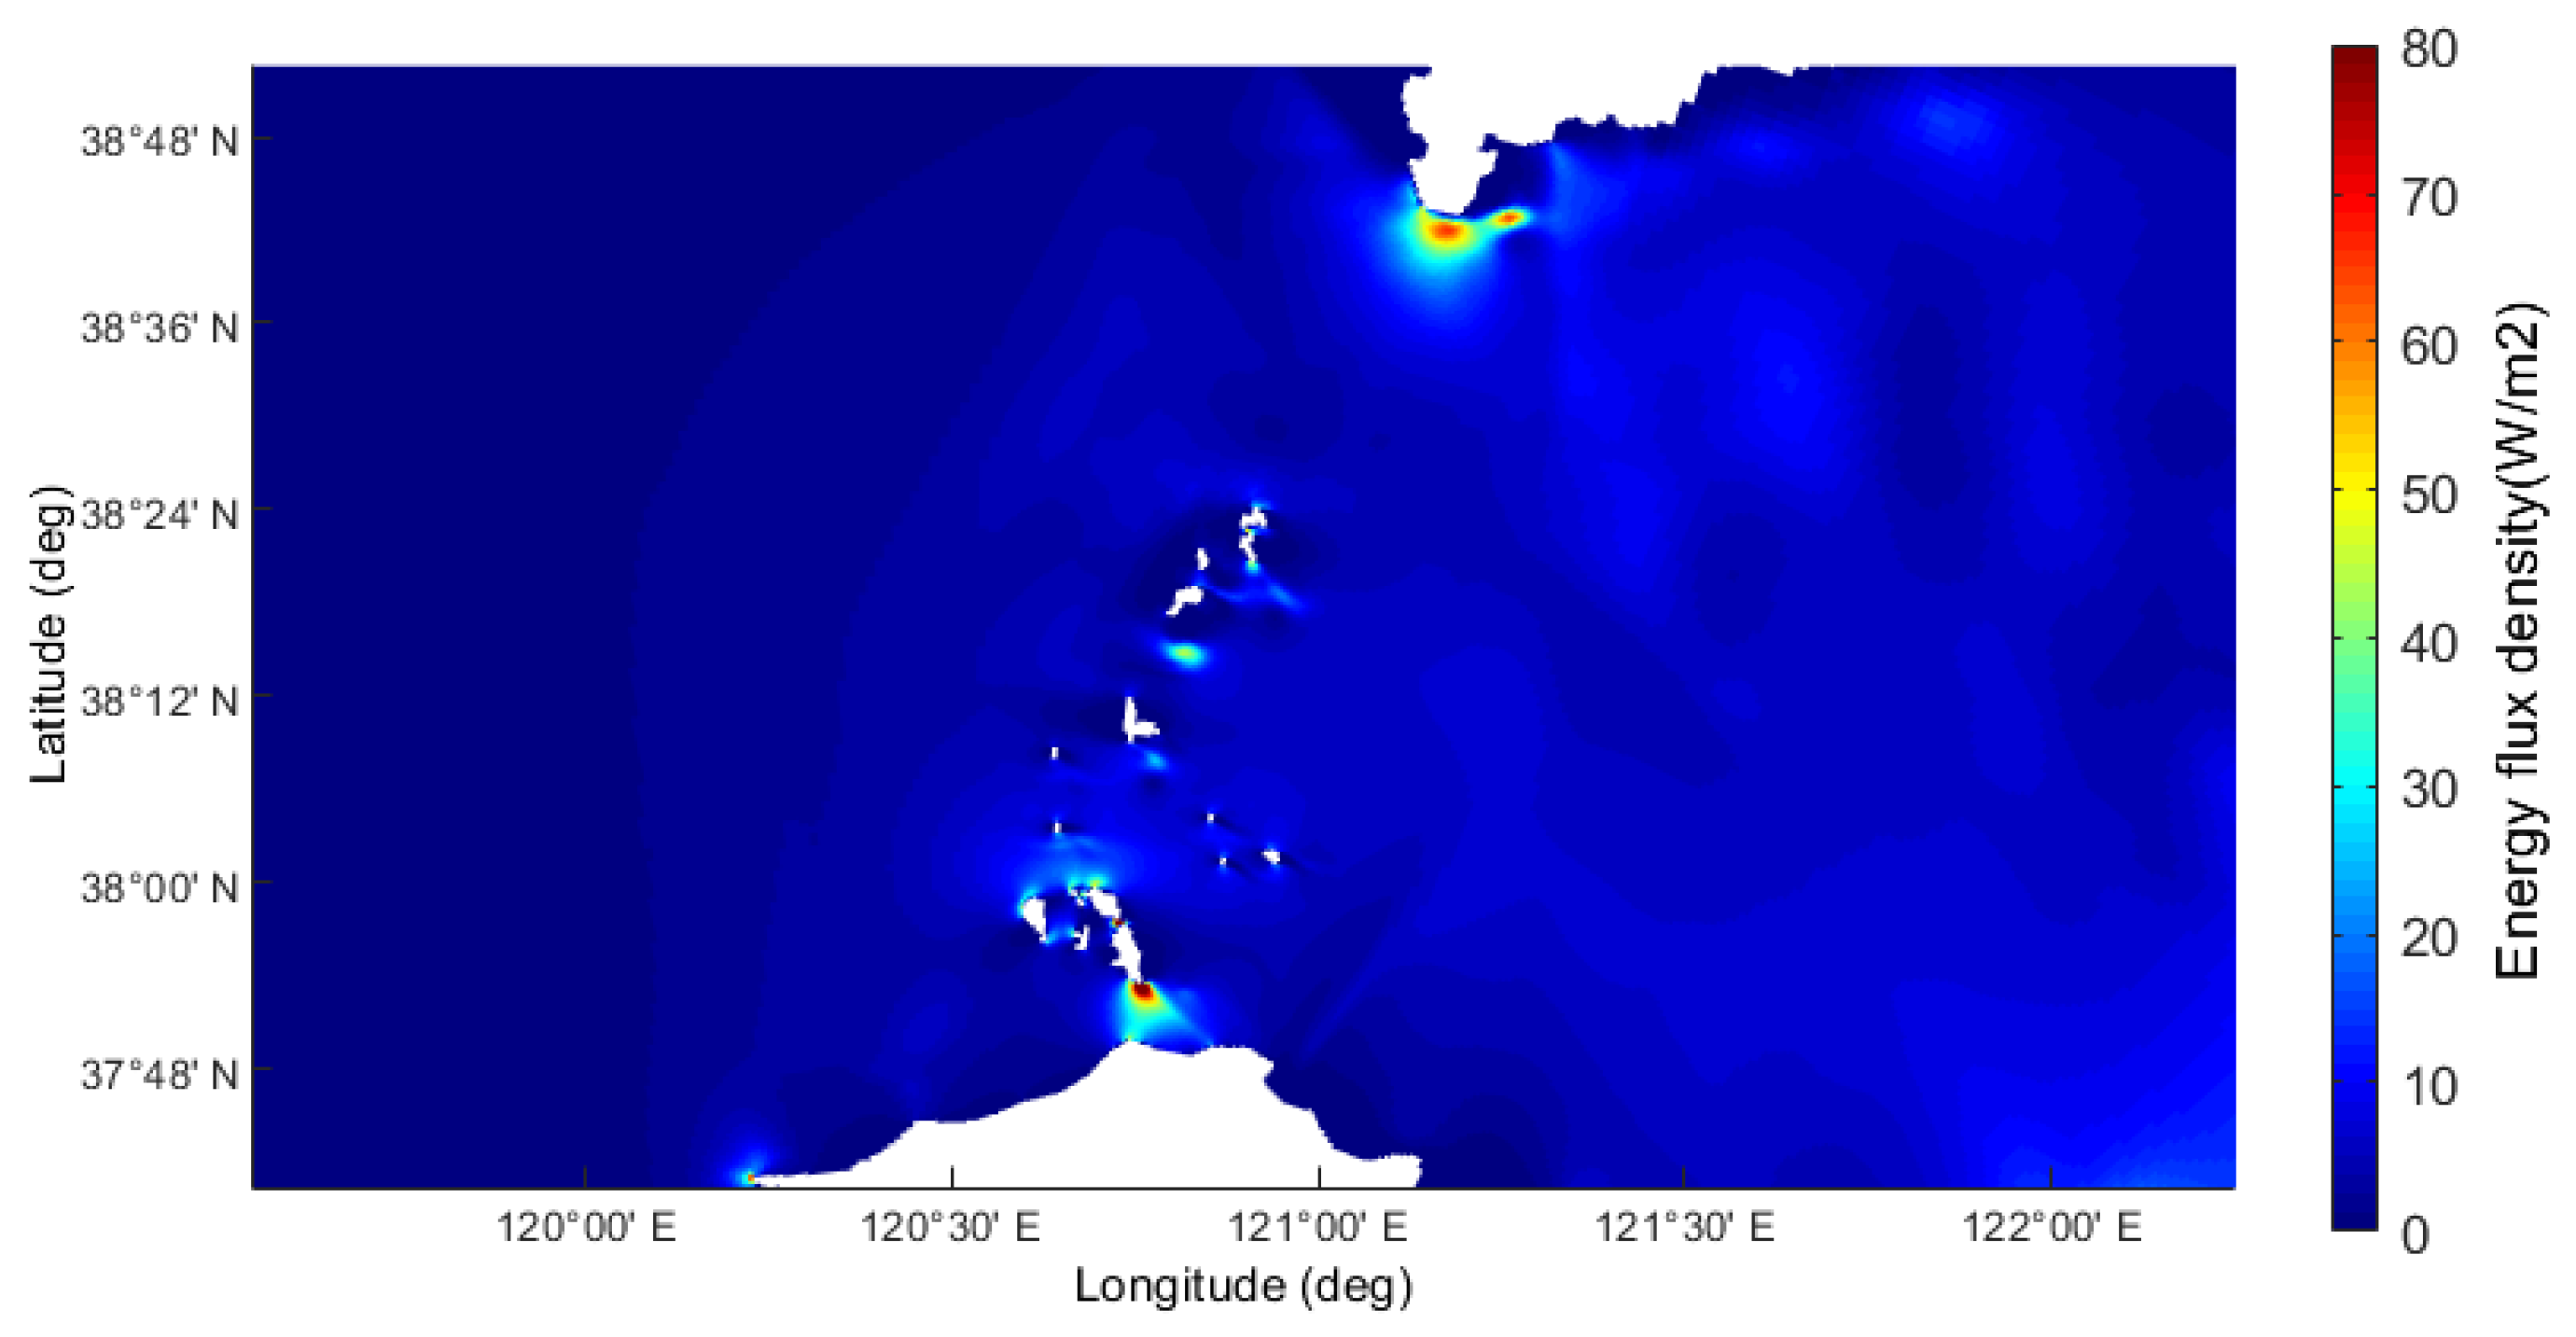
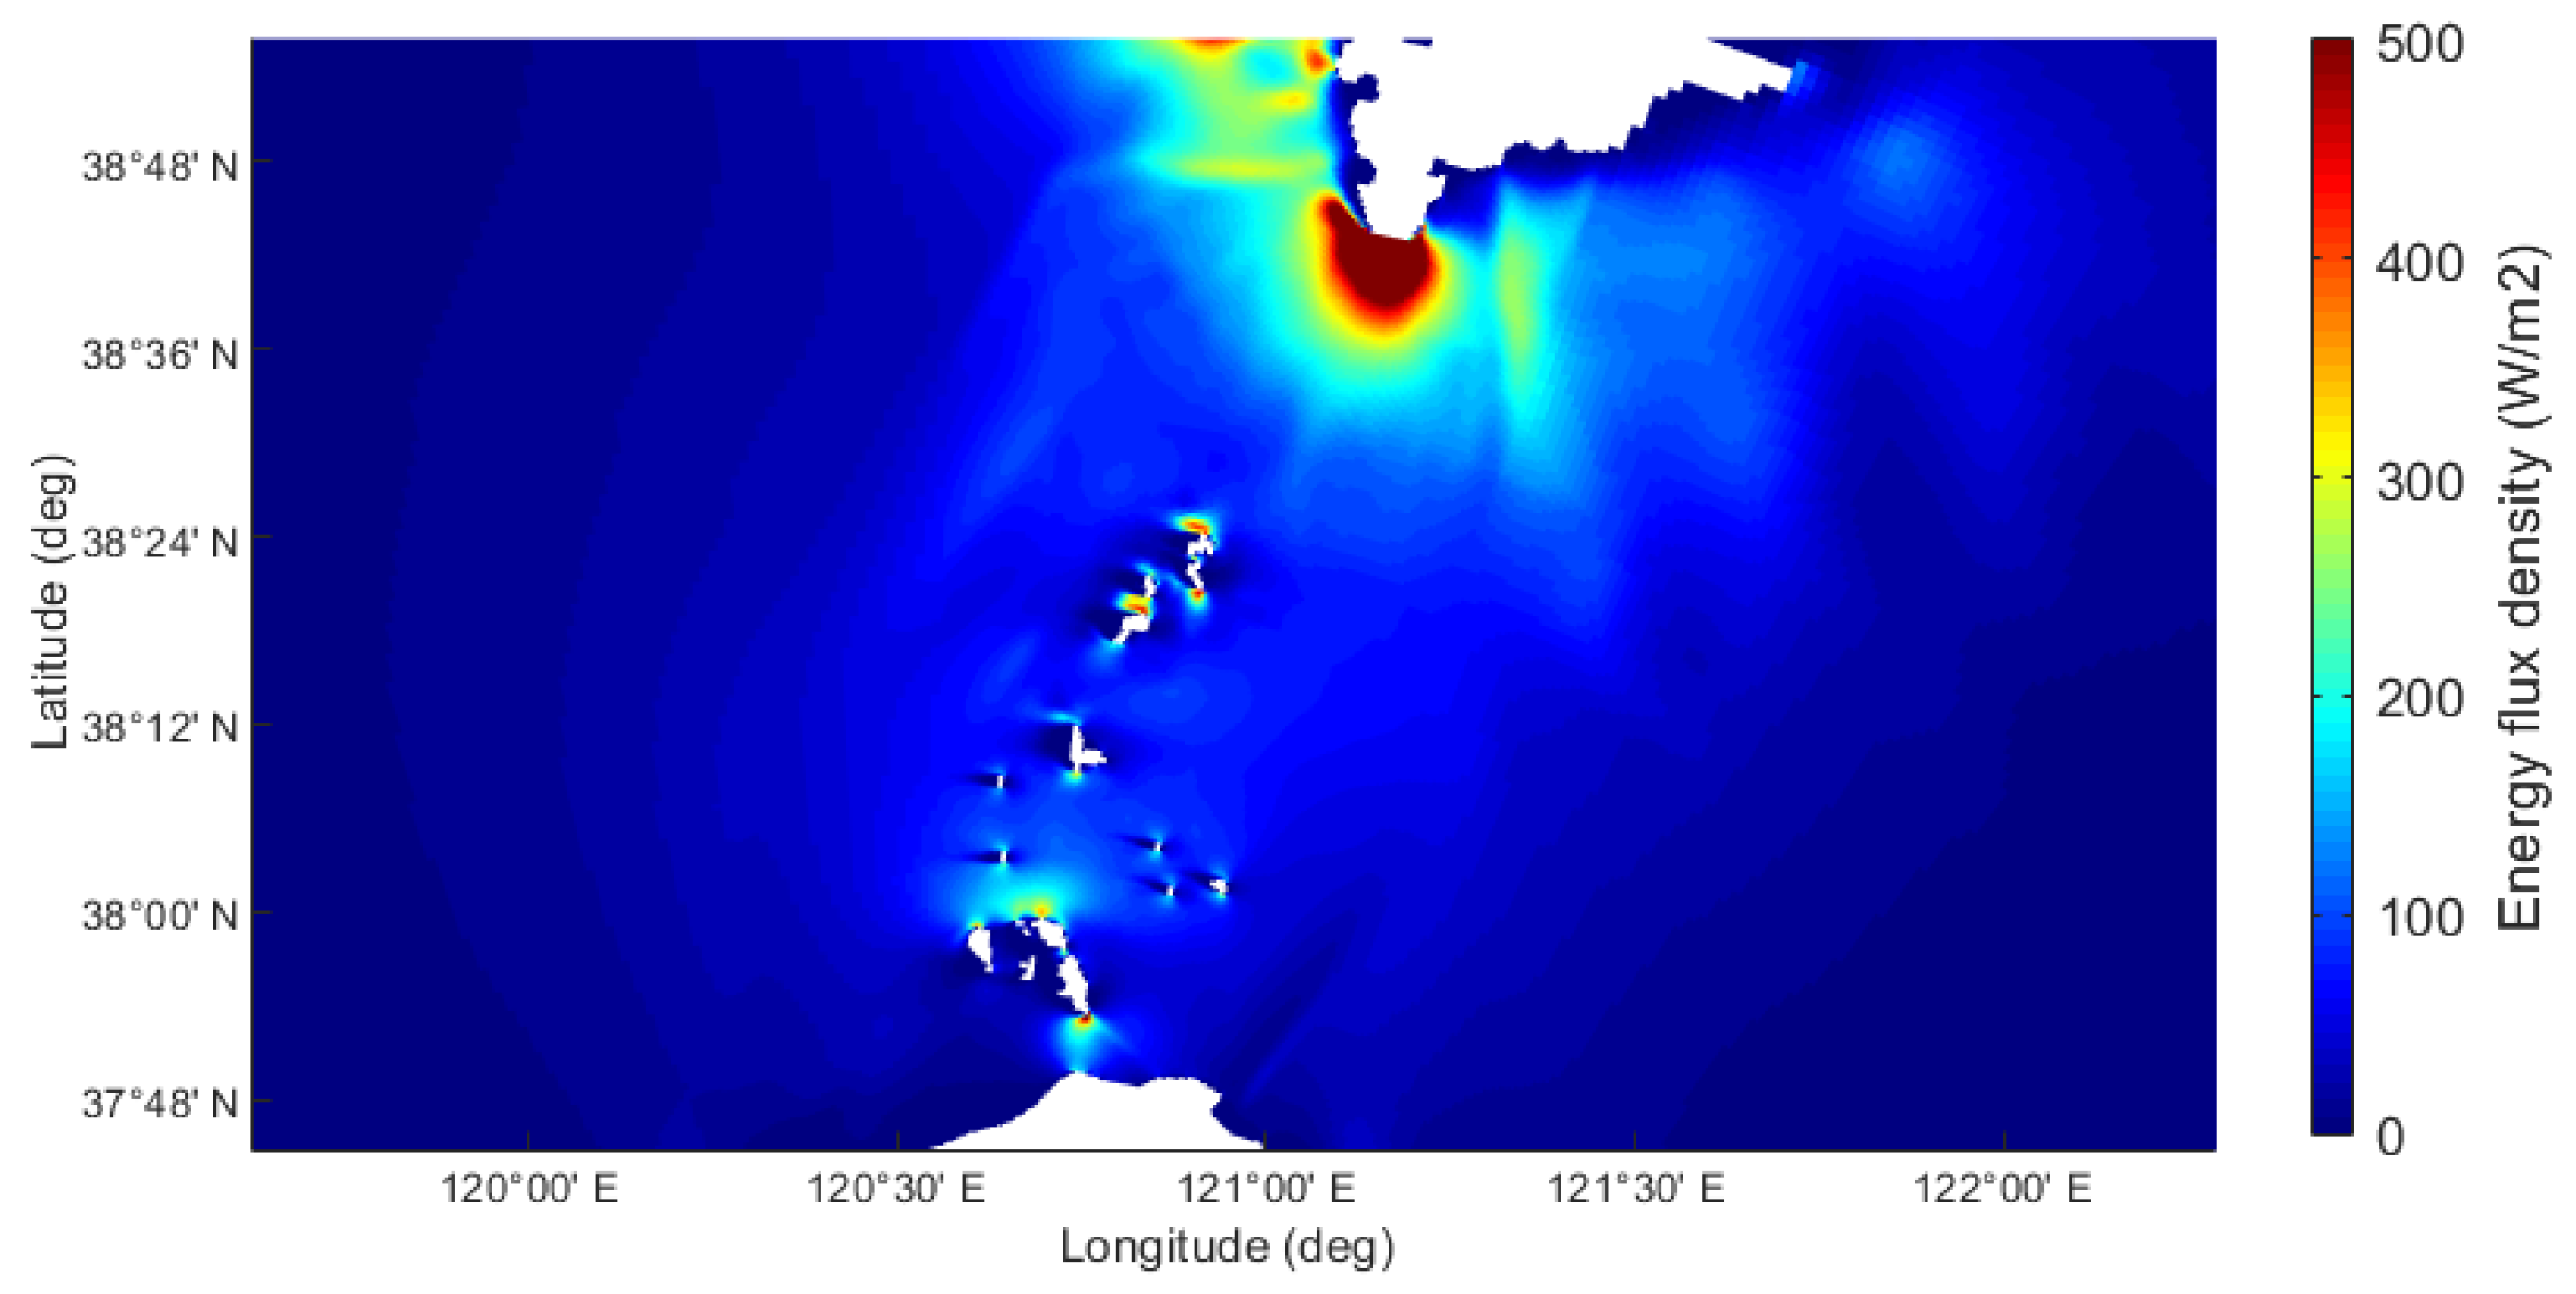
3.2.1. Power Flux Density

The distribution of the average and maximum power flux density in the sea area of the Bohai Strait is shown in Figure 9 and Figure 10. Overall, the power flux density in the northern channel is higher than that in the southern channel, the average power flux density in the channels located in the southern part of the Bohai Strait is generally less than 30 W/m2, and the channels with the highest average power flux density are Changshan Channel, Daqin Channel, Xiaoqin Channel, and Laotieshan Channel, with an average power flux density ranging from 30 to 60 W/m2. The average power flux density in the northern part of Laotieshan can reach 80 W/m2 or more, and only Changshan channel is located in the southern part of the strait; the channels in the southern part of the Bohai Strait, such as the Beituo Channel, Nantuoji Channel, Gaoshan Channel, Houji Channel, and Changshan Channel have the maximum power flux density in the range of 150–250 W/m2. In particular, the area of Changshan Channel is, in general, in the range of 200–300 W/m2, and the channels in the northern part of the Strait are the Huangcheng Channel, Daqin Channel, and Xiaoqin Channel. In the northern part of the Bohai Strait, the power flux density of Huangcheng Channel is small, except for the Daqin Channel, Xiaoqin Channel and Laotieshan Channel, where the maximum power flux density is more than 300 W/m2; the maximum power flux density in the northern part of Laotieshan is more than 500 W/m2.

3.2.2. Tidal Energy Reserves and Exploitable Potential

The Bohai Strait demonstrates substantial tidal energy potential. Implementing the Flux method for energy assessment (Section 2.2.3) coupled with power flux density calculations, we discretized the strait into nine sections profiles (geospatial distribution in Figure 11). The tidal energy reserves and exploitation capacity in the Bohai Strait region were evaluated by counting the channel width and average depths at different sections, and the results are shown in Table 6.
According to Table 6, the Laotieshan Channel contains abundant tidal energy resources with reserves of 80,000 kW and technically exploitable energy of 12,189.97 kW, indicating significant potential for planned exploitation. The Beituoji, Nantuoji, Gaoshan, and Xiaoqin Channels follow, with reserves of 4000–6000 kW and exploitable energy of 500–900 kW. The Changshan and Houji Channels have reserves of approximately 3000 kW and exploitable energy around 450 kW. Lastly, the Daqin and Huangcheng Channels, with reserves of only a few hundred kW and exploitable energy of 100 kW, are unsuitable for tidal energy exploitation due to their narrow widths and shallow depths.

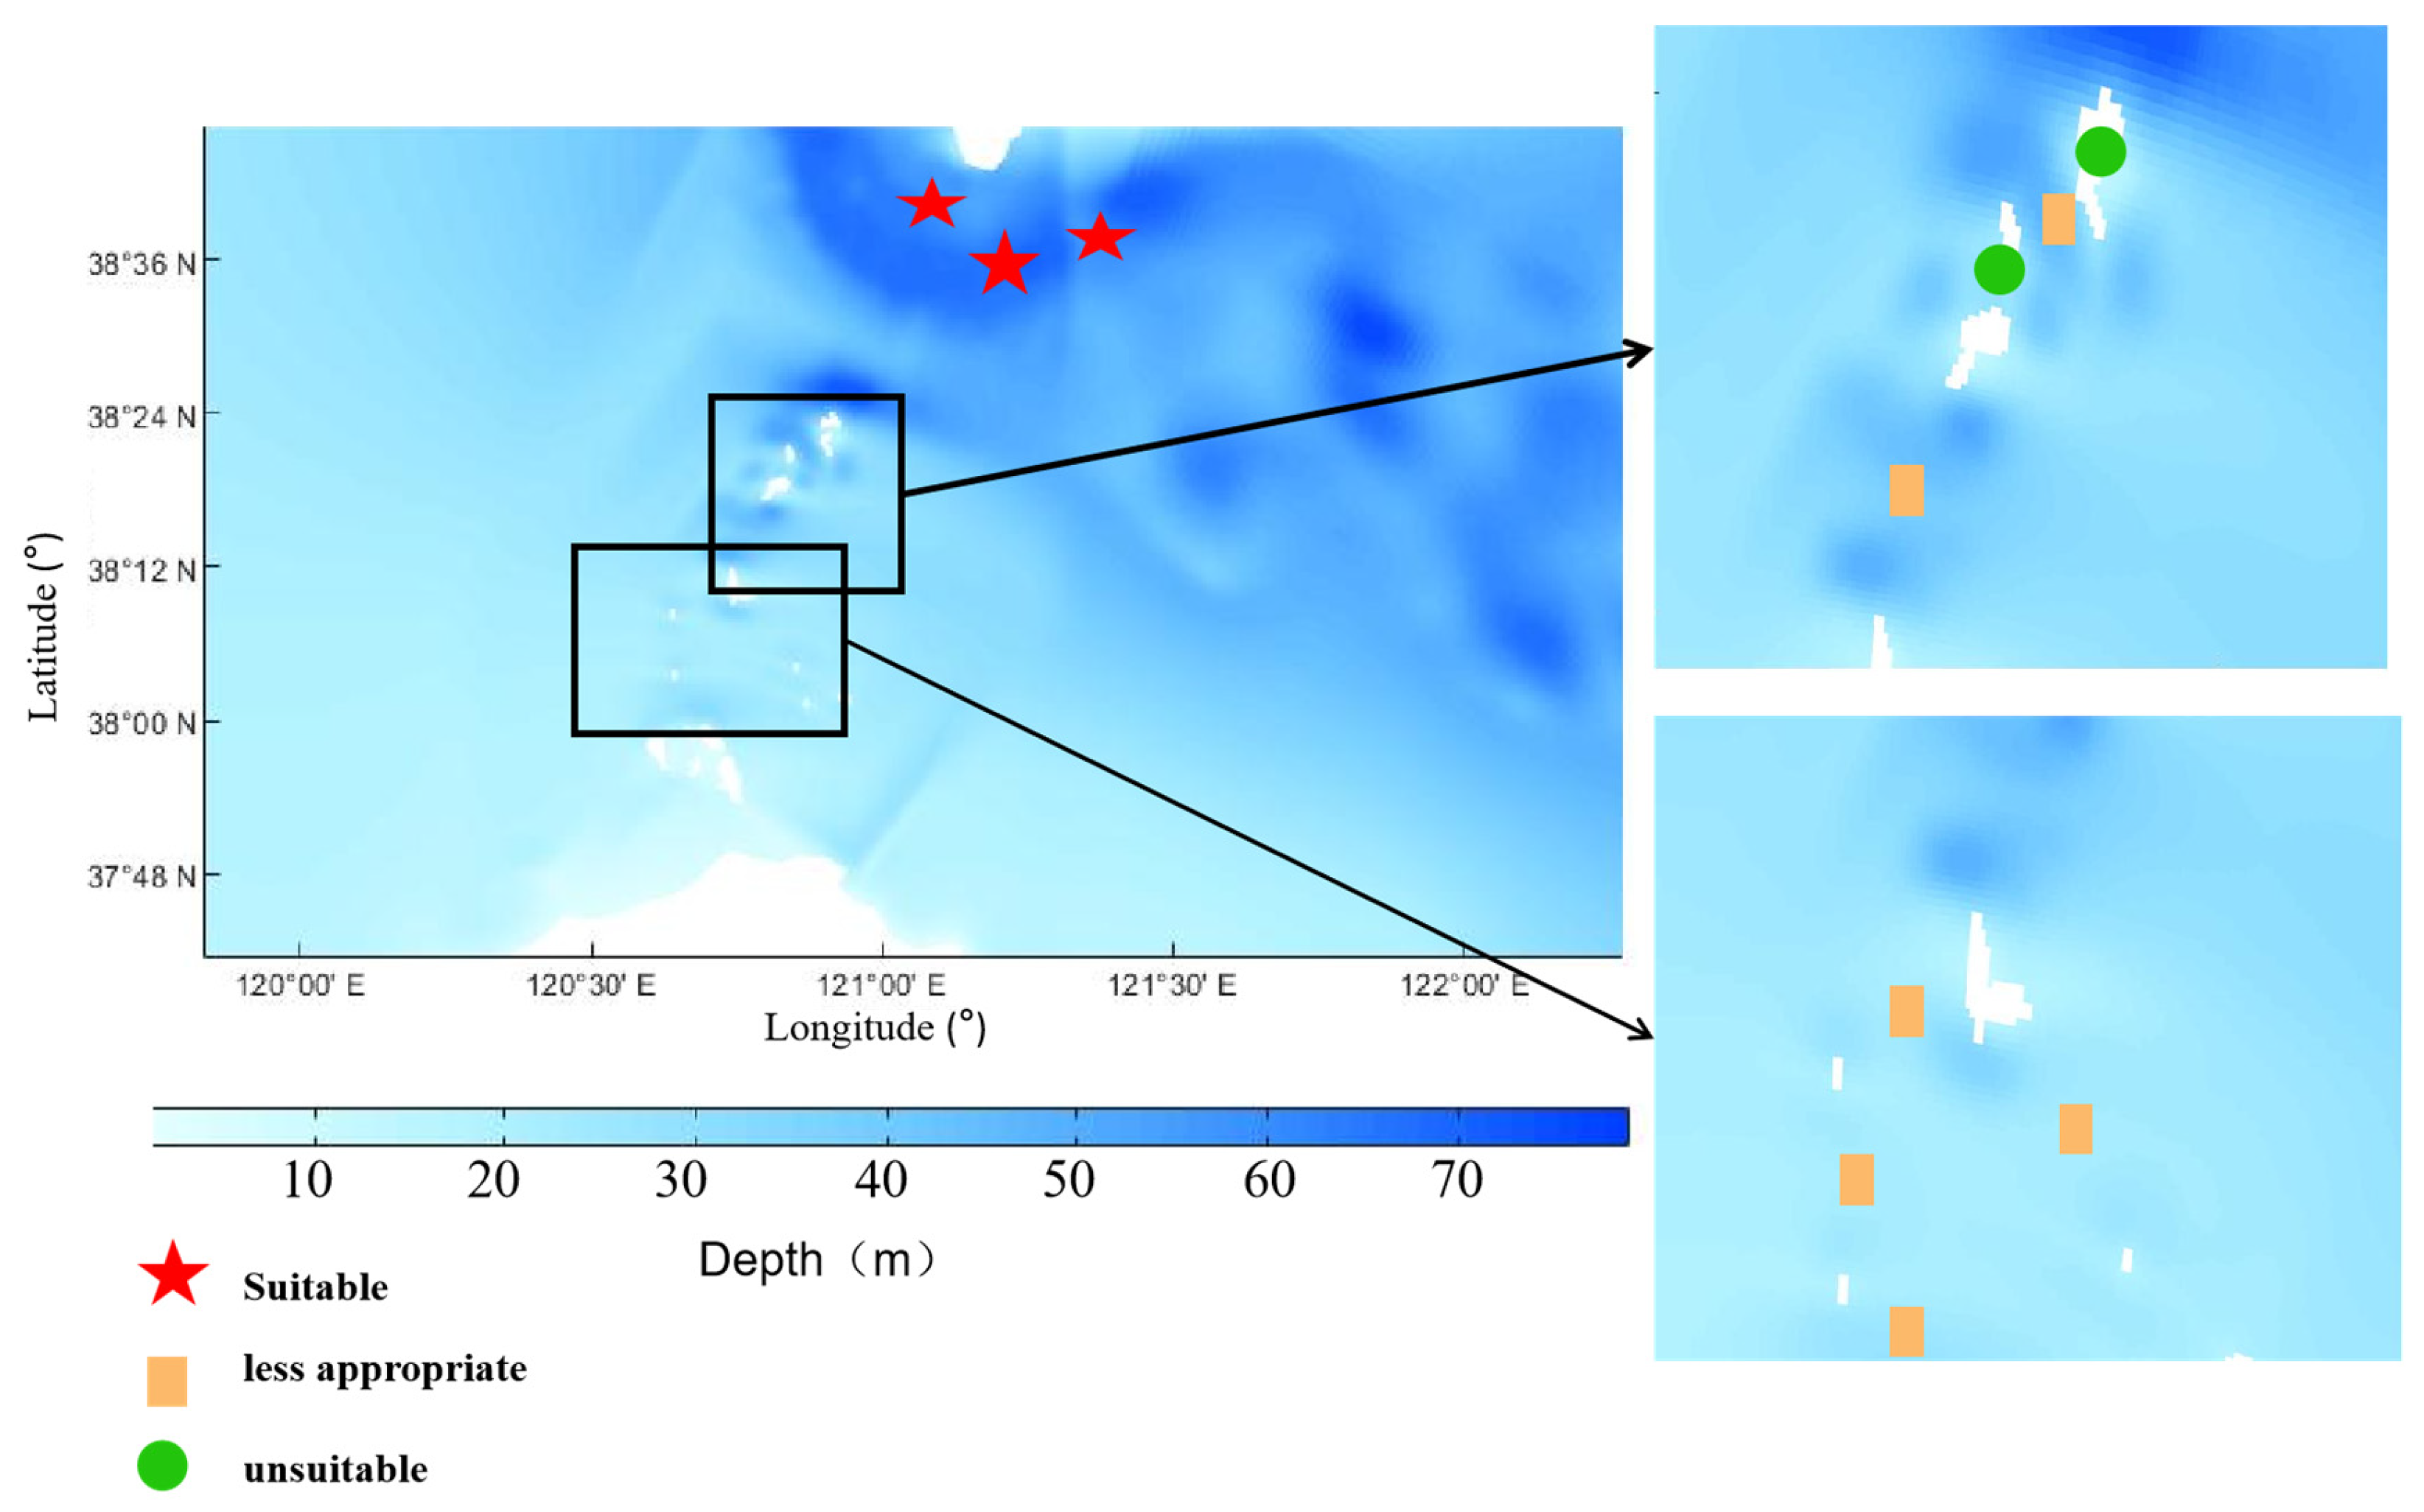
3.3. Exploitation Proposals

The northern Laotieshan area maintains flow velocities above 0.8 m/s for over 3000 h annually, demonstrating significant exploitable value and making it a highly suitable area for tidal energy development. The Xiaoqin, Beituoji, and Nantuoji Channels exhibit moderate tidal energy reserves warranting consideration for exploitation, making them less appropriate for exploitation and utilization. In contrast, the Huangcheng and Daqin Channels characterized by limited spatial dimensions and low energy density show negligible potential for large-scale exploitation, rendering them unsuitable for tidal energy exploitation. Generally speaking, areas with a tidal current speed above 1.5 m/s, an average water depth of 20–50 m, and stable resources that are close to the demand center are suitable for exploitation; areas with a tidal current speed above 0.3 m/s or an average water depth above 10 m and rich tidal energy reserves are less appropriate for exploitation; areas with a tidal current speed less than 0.3 m/s or an average water depth below 10 m and small tidal energy reserves are unsuitable for tidal energy exploitation; and areas with tidal energy reserves below 10 m are not suitable for exploitation. Areas with a flow velocity less than 0.3 m/s or an average water depth less than 10 m and less tidal energy reserves are not suitable for tidal energy exploitation. It can be seen, as shown in Figure 12, that the Laotieshan Channel is a suitable area for exploitation, the Huangcheng Channel and Daqin Channel are unsuitable areas for exploitation, and the Changshan Channel and Gaoshan Channel are less appropriate areas for exploitation.
In addition, according to the vertical flow velocity distribution of each channel in Section 3.1.1, it can be seen that the water layer suitable for tidal energy exploitation in the Huangcheng Channel is within 4 m, the water layers suitable for tidal energy exploitation in the Houji Channel, Nantuoji Channel, Gaoshan Channel, Changshan Channel, and Daqin Channel are within 10 m, and the waters of the Xiaoqin Channel, Beituoji Channel, and Laotieshan Channel are relatively deep, so the flow velocity threshold can be reached at a depth of 20 m, but in order to make more efficient use of tidal energy resources, it is more highly recommended to set up tidal energy generators within 15 m to maximize the use of tidal energy.

4. Results and Discussion

This study employed Delft3D to simulate the hydrodynamic conditions in the Bohai Strait from 15 April to 15 May 2022. A complete tidal cycle was selected for analysis. The Flux method for tidal energy assessment was applied to evaluate resources in this semi-enclosed strait based on the simulation results. It was found that the Laotieshan Channel has rich tidal resources—more than 10 times those of the other channels in the Bohai Strait—which is mainly due to its large flow velocity and wide area, especially in the northern part, where the maximum flow velocity can be more than 2 m/s, a result that is similar to that of MA et al. [30]. According to Neill et al. [31], tidal turbine installation in areas with strong flow velocity asymmetry alters the sediment transport dynamics. Research indicates that energy extraction from high-asymmetry zones increases the bedform variation amplitude by 20% along large estuarine systems compared to symmetrical tidal zones. Consequently, exploitation planning for the Changshan, Nantuoji, Gaoshan, and Houji Channels must include the rigorous assessment of the bathymetric disturbance potential. Tidal power station construction should proceed only if the environmental impacts remain within acceptable limits. Horizontal-axis turbines are currently more prevalent in areas with minimal flow direction rotation, such as the Laotieshan Channel in the northern Bohai Strait. Vertical-axis turbines are better suited for locations with significant directional variability, exemplified by the Lesser Qin Channel. For zones with limited tidal energy reserves (unsuitable for conventional development), emerging turbine technologies may enable small-scale exploitation. Additionally, Figure 7 illustrates the varying relationship between the vertical current velocity and water depth, based on which we propose the following water layer recommendations for tidal energy development. The Houji, Nantuoji, Gaoshan, Changshan, and Daqin Channels demonstrate optimal tidal energy development potential within the upper 10 m water layer, while deeper channels, including Xiaoqin, Beituoji, and Laotieshan, are better suited for energy extraction at 15–20 m depths. As the water depth increases, the flow rate will decrease; within the Flux assessment methodology, reduced velocity lowers the P, consequently diminishing the exploitable tidal energy. As the velocity declines rapidly beyond critical depths, establishing a site-specific velocity threshold becomes essential. Turbines should be deployed in hydrodynamic layers maintaining stable velocities to maximize the utilization of regional tidal resources. Similarly, other semi-enclosed bays and straits also possess abundant tidal current energy resources. When developing these resources, we must consider vertical velocity thresholds and select appropriate water layers for turbine deployment to maximize energy utilization in these areas.
Previous studies have predominantly focused on channel constrictions within open-sea areas, exemplified by China’s Zhoushan Archipelago region [22]. This resource-rich tidal energy zone has consistently attracted scholarly attention, with Ye and Gu [11] employing multiple assessment methodologies—including the Farm method, Garrett method, and LiDan method—to conduct comparative analyses of different evaluation approaches. Concurrently, Zhang [32] and Liu [33] and colleagues investigated different types of tidal energy converters, examining their power generation efficiency and operational mechanisms. However, limited attention has been given to semi-enclosed bay channel systems where bathymetric confinement amplifies tidal currents. This study specifically addresses this geomorphic configuration for tidal energy assessment. A three-dimensional numerical model was developed to analyze vertical velocity profiles, providing depth-stratified deployment recommendations for each channel to inform future exploitation planning. This finding holds for all semi-enclosed bay channels, where topographic constriction amplifies tidal ranges through pronounced tidal channeling effects. The resultant flow acceleration renders these areas significantly more viable for tidal energy exploitation than adjacent waters. Moreover, our proposed strategy—integrating turbine placement into velocity-threshold-defined hydrodynamic layers—can be applied universally to tidal energy projects, enabling cost efficiency while maximizing regional resource utilization.
It should be noted that this study employs the Flux method for tidal energy assessment. Subsequent research could integrate more detailed turbine parameters (blade design, energy capture efficiency) for evaluation. Based on the maximum flow velocities in each region, specific turbine models with appropriate rated velocities and cut-in velocities should be recommended. Fluid dynamics software can be utilized to analyze blade energy capture performance, enabling the refined assessment of tidal energy resources and providing more precise exploitation recommendations.

5. Conclusions

This study established a hydrodynamic numerical model using Delft3D software, validated against spring tide data from November 2021 in the Bohai Strait. The results show good agreement with measured data, confirming its applicability for subsequent tidal energy resource assessment. The Flux method was applied to assess tidal energy resources across nine major channels in the Bohai Strait, quantifying both theoretical reserves and exploitable potential per unit time. The results indicate that the Laotieshan Channel area has the highest flow velocity and the most abundant tidal current energy resources, approximately 81,266.5 kW, with an exploitable potential of about 12,189.97 kW. This is followed by the South Tuoji Channel, North Tuoji Channel, and Lesser Qin Channel areas, where the tidal current energy reserves are around 6000 kW, with an exploitable potential of approximately 900 kW. Due to their narrow channels and shallow water depths, the Greater Qin Channel and Huangcheng Channel possess relatively limited tidal energy resources—only about 1000 kW and 500 kW, respectively—with an exploitable potential as low as 100 kW. Therefore, these areas are not suitable for tidal energy development and utilization. Based on tidal characteristics and resource distribution, the Laotieshan Channel is identified as the most suitable area for tidal energy exploitation with optimal turbine deployment within 20 m water layers. Secondary suitable areas include the Beituoji, Nantuoji, Xiaoqin, Gaoshan, Houji, and Changshan Channels. The Xiaoqin and Beituoji Channels are recommended for deployment within 20 m layers, while the Houji, Nantuoji, Gaoshan, and Changshan Channels should utilize 10 m layers. The Daqin and Huangcheng Channels are generally unsuitable; if developed, turbines should be installed within 10 m layers in Daqin and 4 m layers in Huangcheng. The assessment results provide important references for future studies on tidal energy in semi-enclosed bays and establish a data-based foundation for practical tidal energy exploitation in the Bohai Strait region.

Author Contributions

Methodology, Y.S. and H.S.; Software, Y.S. and P.M.; Formal analysis, Z.L.; Investigation, Y.Z.; Resources, Z.L. and H.S.; Data curation, Y.S., P.M., Z.L., Y.Z., D.L. and C.L.; Writing—original draft, Y.S.; Writing—review & editing, P.M.; Visualization, D.L.; Funding acquisition, Y.S. All authors have read and agreed to the published version of the manuscript.

Funding

This research received no external funding.

Data Availability Statement

The original contributions presented in this study are included in the article. Further inquiries can be directed to the corresponding author.

Conflicts of Interest

The authors declare no conflict of interest.

References

  1. Liu, X.; Chen, Z.; Si, Y.; Qian, P.; Wu, H.; Cui, L.; Zhang, D. A review of tidal current energy resource assessment in China. Renew. Sustain. Energy Rev. 2021, 145, 111012. [Google Scholar] [CrossRef]
  2. Lewis, M.; Mcnaughton, J.; Dominguez, C.M.; Todeschini, G.; Togneri, M.; Masters, I.; Allmark, M.; Stallard, T.; Neill, S.; Brown, A.G.; et al. Power variability of tidal-stream energy and implications for electricity supply. Energy 2019, 183, 1061–1074. [Google Scholar] [CrossRef]
  3. Zhang, D.; Wang, J.; Lin, Y.; Si, Y.; Huang, C.; Yang, J.; Huang, B.; Li, W. Present situation and future prospect of renewable energy in China. Renew. Sustain. Energy Rev. 2017, 76, 865–871. [Google Scholar] [CrossRef]
  4. Liu, H.; Ma, S.; Li, W.; Gu, H.G.; Lin, Y.G.; Sun, X.J. A review on the development of tidal current energy in China. Renew. Sustain. Energy Rev. 2011, 15, 1141–1146. [Google Scholar] [CrossRef]
  5. Cornett, A. Inventory of Canada’s Marine Renewable Energy Resources; CHC-TR-041; Canadian Hydraulics Centre, National Research Council of Canada: Ottawa, Canada, 2006.
  6. Akhyani, M.; Chegini, V.; Bidokhti, A.A. An appraisal of the power density of current profile in the Persian Gulf and the Gulf of Oman using numerical simulation. Renew. Energy 2015, 74, 307–317. [Google Scholar] [CrossRef]
  7. Ozturk, M.; Sahin, C.; Yuksel, Y. Current power potential of a sea strait: The Bosphorus. Renew. Energy 2017, 114, 191–203. [Google Scholar] [CrossRef]
  8. Almeida, M.M.; Cirano, M.; Soares, C.G.; Lessa, G.C. A numerical tidal stream energy assessment study for Baía de Todos os Santos, Brazil. Renew. Energy 2017, 107, 271–287. [Google Scholar] [CrossRef]
  9. Hou, F.; Yu, H.M.; Bao, X.W.; Wu, H. Analysis of tidal current energy in zhoushan sea area based on high resolution numerical modeling. Acta Energiae Solaris Sin. 2014, 35, 125–133. [Google Scholar]
  10. Yang, L. Numerical Estimates on Tidal Stream Energy Resources of the Coastal Areas of Shandong Peninsula; Ocean University of China: Qingdao, China, 2012. [Google Scholar]
  11. Ye, Z.; Gu, W. A comparative study of methods for calculating the exploitable amount of tidal energy. J. Phys. Conf. Ser. 2022, 2399, 012002. [Google Scholar] [CrossRef]
  12. Chen, L.; Lam, W.H. A review of survivability and remedial actions of tidal current turbines. Renew. Sustain. Energy Rev. 2015, 43, 891–900. [Google Scholar] [CrossRef]
  13. Yosry, A.G.; Jiménez, A.F.; Álvarez, E.A.; Marigorta, E.B. Design and characterization of a vertical-axis micro tidal turbine for low velocity scenarios. Energy Convers. Manag. 2021, 237, 114144. [Google Scholar] [CrossRef]
  14. Ko, D.H.; Park, J.S.; Lee, K.S. Assessment of Tidal current energy potential at Uldolmok in the Southwestern coast of Korea. J. Coast. Res. 2018, 85, 1301–1305. [Google Scholar] [CrossRef]
  15. Spänhoff, B. Current status and future prospects of hydropower in Saxony (Germany) compared to trends in Germany, the European Union and the World. Renew. Sustain. Energy Rev. 2014, 30, 518–525. [Google Scholar] [CrossRef]
  16. The largest tidal current energy generator set in our country has been successfully developed. Environ. Technol. 2020, 38, 4–5. (In Chinese). Available online: https://www.jiemian.com/article/3872095.html (accessed on 4 May 2025).
  17. He, W.U.; Wang, X.; Han, L.S. Assessment of extractable energy of tidal current at Chengshantou cape. Oceanol. Limnol. Sinica 2013, 44, 570–576. (In Chinese) [Google Scholar] [CrossRef]
  18. Rossi, V.; Lo, M.; Legrand, T.; Giacomi, E.S.; de Jode, A.; de Ville d’Avray, L.T.; Pairaud, I.; Faure, V.; Fraysse, M.; Pinazo, C.; et al. Small-scale connectivity of coralligenous habitats: Insights from a modelling approach within a semi-opened Mediterranean bay. Vie Milieu-Life Environ. 2020, 70, 161–174. [Google Scholar]
  19. Flegal, A.R.; Wilhelmy, S.A.S. Comparable levels of trace metal contamination in two semienclosed embayments: San Diego Bay and south San Francisco Bay. Environ. Sci. Technol. 1993, 27, 1934–1936. [Google Scholar] [CrossRef]
  20. Liu, H.; Pang, C.; Yang, D.; Liu, Z. Seasonal variation in material exchange through the Bohai Strait. Cont. Shelf Res. 2021, 231, 104599. [Google Scholar] [CrossRef]
  21. Bedard, R. Survey and Characterization: Tidal in Stream Energy Conversion (TISEC) Devices, EPRI North American Tidal InStream Power Feasibility Demonstration Project; EPRI: Palo Alto, CA, USA, 2005. [Google Scholar]
  22. Ye, Z.; Gu, W.; Ji, Q. Study on Critical Factors Affecting Tidal Current Energy Exploitation in the Guishan Channel Area of Zhoushan. Sustainability 2022, 14, 16820. [Google Scholar] [CrossRef]
  23. Black, Consulting Veatch. Assessment of Tidal Energy Resource, Tech. Rep.; The European Marine Energy Centre Ltd.: Orkney Islands, UK, 2009. [Google Scholar]
  24. Bryden, I.G.; Couch, S.J.; Owen, A.; Melville, G.T. Tidal current resource assessment. Proc. Inst. Mech. Eng. Part A J. Power Energy 2007, 221, 125–135. [Google Scholar] [CrossRef]
  25. Bryden, I.G.; Couch, S.J. ME1—Marine energy extraction: Tidal resource analysis. Renew. Energy 2006, 31, 133–139. [Google Scholar] [CrossRef]
  26. Hou, F. The analysis of tidal energy in zhoushan lsland based on FVCOM; Ocean University of China: Qingdao, China, 2012. [Google Scholar]
  27. Xia, H.; Wang, X.; Shi, J.; Jia, N.; Duan, Y. Research on Analysis Method of Tidal Current Energy Resource Characteristics. Mar. Technol. Soc. J. 2022, 56, 10–17. [Google Scholar] [CrossRef]
  28. Zhang, L.; Shi, H.; Xing, H.; Li, P.; Ma, P. Analysis of the evolution of the Yellow River Delta coastline and the response of the tidal current field. Front. Mar. Sci. 2023, 10, 1232060. [Google Scholar] [CrossRef]
  29. Abundo, M.; Nerves, A.; Paringit, E.; Villanoy, C. A combined multi-site and multi-device decision support system for tidal in-stream energy. Energy Procedia 2012, 14, 812–817. [Google Scholar] [CrossRef]
  30. Ma, P.; Shi, H.; Xue, H.; Li, P.; Sun, Y. Analysis of tidal current energy potential in the major channels of the Bohai Strait based on Delft3D. J. Ocean. Univ. China 2024, 23, 859–870. [Google Scholar] [CrossRef]
  31. Neill, S.P.; Litt, E.J.; Couch, S.J.; Davies, A.G. The impact of tidal stream turbines on large-scale sediment dynamics. Renew. Energy 2009, 34, 2803–2812. [Google Scholar] [CrossRef]
  32. Zhang, J.; Zhou, Y.; Lin, X.; Wang, G.; Guo, Y.; Chen, H. Experimental investigation on wake and thrust characteristics of a twin-rotor horizontal axis tidal stream turbine. Renew. Energy 2022, 195, 701–715. [Google Scholar] [CrossRef]
  33. Liu, Z.; Qu, H.; Song, X.; Chen, Z.; Ni, H. Energy-harvesting performance of tandem coupled-pitching hydrofoils under the semi-activated mode: An experimental study. Energy 2023, 279, 128060. [Google Scholar] [CrossRef]
Figure 1. Channels of the Bohai Strait.
Energies 18 03787 g001
Figure 2. Research method and technical roadmap.
Energies 18 03787 g002
Figure 3. The grid division of the calculation area.
Energies 18 03787 g003
Figure 4. Map of verification points for tidal current monitoring.
Energies 18 03787 g004
Figure 5. Water level verification diagram.
Energies 18 03787 g005
Figure 6. Tide verification diagram.
Energies 18 03787 g006
Figure 7. Distribution of vertical velocity of each channel in the Bohai Strait.
Energies 18 03787 g007aEnergies 18 03787 g007b
Figure 8. Annual effective available hours (>0.5 m/s (left), >0.8 m/s (right)).
Energies 18 03787 g008
Figure 9. Distribution of the average power flux density in the Bohai Strait.
Energies 18 03787 g009
Figure 10. Distribution of the maximum power flux density in the Bohai Strait.
Energies 18 03787 g010
Figure 11. Channel section interception position of the Bohai Strait.
Energies 18 03787 g011
Figure 12. Diagram of tidal current energy exploitation proposals in the Bohai Strait.
Energies 18 03787 g012
Table 1. Reference values for SIF under different regional conditions.
Area TypeResonant EstuaryChannel and CampLagoon
SIF<10%10~20%<50%
Table 2. Model parameter setting schematic table.
Parameter NameParameter Setting
Start time15 April 2022 00:00
End time15 May 2022 23:00
Gravitational acceleration9.8 m/s2
Seawater density1025 kg/m3
Manning roughness coefficient0.025
Horizontal eddy viscosity coefficient1 m2/s
Time step1 min
Running duration5 d
Memory usage165 G
Table 3. Specific latitude and longitude coordinates of verification points.
Verification Point NameLongitudeLatitude
CL01120.45° E38.11° N
CL02120.51° E37.88° N
CL03120.94° E38.38° N
CL04120.84° E38.32° N
Table 4. Model validation statistical metrics.
Verification
Station Name
RRMSE
CL01 (water level)0.990.04 m
CL03 (water level)0.990.1 m
CL01 (current speed)0.870.07 m/s
CL02 (current speed)0.950.09 m/s
CL03 (current speed)0.930.07 m/s
CL04 (current speed)0.980.09 m/s
CL01 (current direction)0.9812.89°
CL02 (current direction)0.9724.65°
CL03 (current direction)0.8641.8°
CL04 (current direction)0.9826.84°
Table 5. Analysis of velocity characteristics of each channel in the Bohai Strait.
ChannelMax Flow Velocity (m/s)Average Flow Velocity (m/s)Flood Tide Average Velocity (m/s)Ebb Tide Average Velocity (m/s)Principal Flood Current Axis (°)Principal Ebb Current Axis (°)Flow Velocity AsymmetryDirectional Rotational Variability (°)
Changshan 0.690.290.230.3489.6263.20.486.4
Houji0.570.240.20.2799.5271.20.358.3
Gaoshan0.570.230.20.27112.1291.80.350.3
Nantuoji0.580.240.210.26105.82840.241.8
Beituoji0.570.240.20.28107.2277.30.49.9
Daqin0.890.350.340.36108287.10.060.9
Xiaoqin0.810.260.230.29114.1322.40.2628.3
Huangcheng0.60.30.310.3122.7309.50.036.8
Laotieshan0.930.310.290.33117.4292.70.144.7
Table 6. Tidal current energy potential reserves and exploitable potential in each channel of the Bohai Strait.
ChannelSectionSection Width/mAverage Water Depth/mCross-Sectional Area of Channel/m−2Average Energy
Flux Density
/W*m−2
Tidal Current
Reserves
/kW
SIFTidal Current Energy Exploitation/kW
ChangshanSection 173309.1366,92342.462841.550.15426.23
HoujiSection 2764115.44117,97728.343343.470.15501.52
GaoshanSection 3852817.25147,10828.14133.730.15620.06
NantuojiSection 411,70017.4203,58028.975897.710.15884.66
BeituojiSection 510,59419.21203,51130.176139.930.15920.99
DaqinSection 625456.9517,68862.961113.640.15167.05
XiaoqinSection 7419130.78128,99934.464445.310.15666.8
HuangchengSection 813927.14993947467.130.1570.07
LaotieshanSection 941,10038.91,598,79050.8381,266.50.1512,189.97
Disclaimer/Publisher’s Note: The statements, opinions and data contained in all publications are solely those of the individual author(s) and contributor(s) and not of MDPI and/or the editor(s). MDPI and/or the editor(s) disclaim responsibility for any injury to people or property resulting from any ideas, methods, instructions or products referred to in the content.

