Article

Research on an Energy-Harvesting System Based on the Energy Field of the Environment Surrounding a Photovoltaic Power Plant

1
School of Mechanical, Electrical & Information Engineering, Shandong University, Weihai 264209, China
2
Preparation and Application of Aerospace High-Performance Composite Materials, Future Industry Laboratory of Higher Education Institutions in Shandong Province, Shandong University, Weihai 264209, China
3
Faculty of Sciences Semlalia, Cadi Ayyad University, Bd Prince Moulay Abdellah, Marrakech 40000, Morocco
4
Laboratory of Engineering Sciences for Energy (LabSIPE), National School of Applied Sciences, Chouaib Doukkali University, El Jadida 24000, Morocco
5
L’Ecole Supérieure de Technologie Sidi Bennour (ESTSB), Chouaib Doukkali University, El Jadida 24000, Morocco
6
School of Electrical Engineering, Xi’an University of Technology, Xi’an 710048, China
*
Author to whom correspondence should be addressed.
Energies 2025, 18(14), 3786; https://doi.org/10.3390/en18143786
Submission received: 22 June 2025 / Revised: 11 July 2025 / Accepted: 11 July 2025 / Published: 17 July 2025
(This article belongs to the Section D: Energy Storage and Application)

Abstract

With the large-scale global deployment of photovoltaics (PV), traditional monitoring technologies face challenges such as wiring difficulties, high energy consumption, and high maintenance costs in remote or complex terrains, which limit long-term environmental sensing. Therefore, energy-harvesting systems are crucial for the intelligent operation of photovoltaic systems; however, their deployment depends on the accurate mapping of wind energy fields and solar irradiance fields. This study proposes a multi-scale simulation method based on computational fluid dynamics (CFD) to optimize the placement of energy-harvesting systems in photovoltaic power plants. By integrating wind and irradiance distribution analysis, the spatial characteristics of airflow and solar radiation are mapped to identify high-efficiency zones for energy harvesting. The results indicate that the top of the photovoltaic panel exhibits a higher wind speed and reflected irradiance, providing the optimal location for an energy-harvesting system. The proposed layout strategy improves overall energy capture efficiency, enhances sensor deployment effectiveness, and supports intelligent, maintenance-free monitoring systems. This research not only provides theoretical guidance for the design of energy-harvesting systems in PV stations but also offers a scalable method applicable to various geographic scenarios, contributing to the advancement of smart and self-powered energy systems.

1. Introduction

Energy provides an indispensable driving force for economic development, among which fossil fuels have always dominated the energy supply in modern society. However, with the continuous growth of the global population, the energy crisis caused by the increase in energy demand will have a profound impact on the environment, economy, and society [1]. Due to the non-renewable nature of fossil fuels, solving the need for a sustainable energy supply has become urgent [2]. At the same time, environmental issues such as global warming and air pollution caused by fossil fuel combustion have also received more and more attention. Studies have shown that the cumulative global CO2 emissions are as high as 6000 Gt [3]. The main source of carbon dioxide emissions is the extensive use of fossil fuels to produce energy. The combustion of fossil fuels releases carbon dioxide, methane, and other greenhouse gases, trapping heat in the atmosphere and causing global warming [4]. In addition, the exploitation and transportation of fossil fuels have also led to environmental degradation. For example, oil spills destroy marine life and ecosystems, while coal mining causes soil erosion, deforestation, and air pollution [5].
In order to solve the above problems, a large number of policies have been implemented around the world. The ‘Paris Agreement’ decided to keep global warming below 2 °C, with a target of 1.5 °C [6]. In order to help reduce greenhouse gas emissions, EU regulations also set mandatory emission reduction targets for new cars by 2025 and 2030 [7]. As a party and active practitioner of the Paris Agreement, China has been committed to action on climate change and actively seeking new ways of low-carbon development. In September 2020, China announced at the 75th United Nations General Assembly that it would strive to peak carbon dioxide emissions by 2030 and strive to achieve the 2060 carbon neutrality goal [8].
However, fossil fuel dependence cannot be eliminated immediately, so research has focused on clean, renewable energy. The concept of new energy has been rapidly developed, including solar energy [9,10], wind energy [11,12,13], tidal energy [14,15,16], hydrogen energy [17,18,19], and so on. Among them, solar energy has made great progress due to its unique advantages, such as safety, high efficiency, cleanliness, and stability. Photovoltaic panels can easily and cheaply convert solar energy into electrical energy, and with the continuous development of technology, the efficiency of photovoltaic panels has gradually increased, as shown in Figure 1. Solar photovoltaic energy supply is destined to become one of the world’s major energy supply carriers by 2030 and become a leading energy source by 2050 [20]. The EU plans to expand the total installed capacity of the photovoltaic industry to 397 million kW, accounting for 15% of the EU’s total power generation; the United States plans to reach 300 million kW, accounting for about 11% of the world’s power generation. The European Union and the United States plan to expand the total installed capacity of the photovoltaic industry to more than 1.5 billion kilowatts by 2050, of which electricity generation accounts for 30% [21]. China’s goal is to build a photovoltaic industry with a total installed capacity of 1050 GW by 2030 [22].
As photovoltaic panels need to be exposed to external air for a long time under normal working conditions, they are greatly affected by environmental factors, such as sunlight, strong wind, high temperature, low temperature, humidity, and mechanical load. These factors usually lead to a gradual decline in performance. In some cases, they will lead to sudden failure and power loss [36]. Therefore, it is necessary to detect large-area photovoltaic panels in a timely and effective manner. To this end, the base station uses a variety of detection methods to troubleshoot this damage, such as manual troubleshooting, drones [37,38], thermal imaging technology [39,40,41], etc. Manual troubleshooting is inefficient, time-consuming, and laborious, and drones, thermal imaging technology, and other methods cannot obtain feedback at any time. In contrast, the use of self-powered sensors for detection and remote monitoring has the advantage of solving the above problems. In order to make the sensors self-powered, it is necessary to study the energy field distribution around the photovoltaic panel. At present, the most widely used form of energy capture is wind and solar energy. At the same time, large-scale photovoltaic power plants are mostly distributed in open terrain areas such as deserts, where there are rich wind and solar energy resources. Hence, this study explores a self-powered sensor arrangement analysis method based on the simulation distribution of wind and solar energy fields.
The rest of this paper is organized as follows. In Section 2, the research status of the current photovoltaic panel detection method and the energy field distribution around the photovoltaic panel are described. The third section describes the simulation scheme and setting. The fourth section introduces the simulation process of the wind field and solar irradiance field around the photovoltaic panel and explains the simulation results. Simulation results and discussions are provided in Section 5.

2. Development Status of Photovoltaic Power Plant Maintenance

Failures in photovoltaic systems can lead to significant energy losses and fire hazards. In order to ensure the reliable and safe operation of photovoltaic devices, these devices must be equipped with monitoring and fault diagnosis systems in order to detect and solve problems in time [42]. The main objectives of photovoltaic system monitoring are fault detection, performance evaluation, and ensuring the normal operation of the system. This requires a PV panel and environmental data [43]. The current research in the field of photovoltaic system fault detection and diagnosis (FDD) covers many aspects, such as fault type classification, fault detection strategy, the application of electrical and thermal imaging technology, and artificial intelligence (AI) algorithm fusion. In terms of fault classification, photovoltaic system faults can be divided into multiple dimensions, as shown in Figure 2.
From the perspective of detection methods, traditional FDD technology mainly includes two categories: electrical signal analysis and thermal imaging. Electrical-Based Methods (EBMs) are mainly based on the I–V characteristic curve and detect faults through fluctuations in key parameters such as open-circuit voltage and short-circuit current, supplemented by time domain reflection (TDR), spectrum analysis, capacitance measurement, and other means for in-depth diagnosis. However, these methods still have limitations in terms of positioning accuracy and automation level. Madeti et al. [44] and Rahman et al. [45] summarized the existing photovoltaic monitoring technology. The former pointed out that most of the monitoring systems included data acquisition and data transmission. The latter listed a variety of different forms of photovoltaic monitoring equipment in detail. For example, Andreoni et al. [46] proposed a wireless monitoring and control system based on ZigBee for photovoltaic distributed generation (PV-DG) in a microgrid. Researchers, such as Rashidi et al. [47] and Rajaravivarma et al. [48], also proposed a similar wireless monitoring architecture based on ZigBee and GPRS, which realized module positioning, condition monitoring, and data remote transmission. Moreno-Garcia et al. [49,50] used CompactRIO controller (cRIO) equipment combined with a WSN network to realize real-time monitoring of environmental parameters and power generation of a photovoltaic system. Naeem et al. [51] and Husain et al. [52] proposed photovoltaic monitoring systems based on PIC18 and PIC16 microcontrollers, respectively. In the past five years, new progress has been made in photovoltaic panel monitoring. Touati et al. [53] developed a customized data acquisition system (DAS) for photovoltaic performance evaluation under extreme weather conditions. It can measure and analyze meteorological and electrical parameters and transmit data wirelessly to the cloud. Khan et al. [54] proposed and implemented a simple, low-cost, and wireless photovoltaic monitoring system (PVMS) for real-time monitoring and analyzing the impact of environmental changes on the performance of photovoltaic cells. The system is based on a microcontroller, a ZigBee wireless module, a sensor, and the LabVIEW platform. It can monitor the open circuit voltage, short circuit current, environment, battery temperature, and maximum power point and obtain the I–V, P–V characteristic curves of photovoltaic modules in real time. Yacine et al. [55] presented a Raspberry Pi-based PV monitoring system leveraging WiFi communication and multiple sensors, which allows for real-time data acquisition, visualization, and remote access with minimal infrastructure cost. Emamian et al. [56] proposed an intelligent monitoring system (IMS) based on the Internet of Things (IoT) to achieve comprehensive monitoring and intelligent management of photovoltaic systems. The measured results show that IMS performs well in output prediction and fault identification, with an accuracy rate of more than 96%. Similarly, Radia et al. [57] developed a low-cost IoT-based wireless data acquisition and control system that enables real-time monitoring of PV module performance parameters and supports the remote optimization of solar energy harvesting. Abdallah et al. [58] proposed a new photovoltaic monitoring system based on an artificial neural network (ANN) and Internet of Things platform, focusing on detecting shadows and other faults in photovoltaic panels. The system realizes high-precision fault identification by collecting sensor data such as voltage, current, temperature, humidity, and irradiance, combined with an ANN algorithm, and realizes remote real-time monitoring and data analysis by using an IoT platform. In this regard, Chouay et al. [59] introduced a neural network-based soft sensor that only utilizes the short-circuit current and open-circuit voltage to accurately estimate irradiance and temperature, simplifying PV parameter acquisition without direct environmental sensors. Mehmood et al. [60] developed a cloud-integrated IoT system that uses artificial neural networks to predict PV panel soiling ratios, improving maintenance scheduling by estimating the short-circuit current with a high prediction accuracy. Similarly, Krishna et al. [61] proposed an intelligent photovoltaic (PV) monitoring system based on the Internet of Things for the real-time monitoring and prediction of solar power generation performance. The system consists of a microcontroller, a photovoltaic panel, a sensor, and a graphical interface (GUI). It can remotely collect key parameters such as voltage, current, temperature, and irradiance to achieve continuous monitoring and data analysis of the photovoltaic system. Furthermore, Lin et al. [62] reviewed the integration of artificial intelligence, IoT, and big data in PV systems, highlighting their synergistic role in predictive diagnostics, real-time energy management, and the transition toward autonomous operation.
In recent years, the rapid development of visual and thermal imaging technology (Visual and Thermal Methods, VTMs) has become an important means of non-contact and non-destructive detection [63,64], especially infrared thermal imaging (Infrared Thermography, IRTG), which is widely used in photovoltaic fault detection. This method can not only realize large-area rapid scanning but also be suitable for monitoring in complex environments by collecting the thermal distribution image of the PV module and identifying defects such as hot spots, fractures, and delamination. It is worth noting that with the rapid development of artificial intelligence technology, the integration of AI algorithms and thermal imaging technology has become the forefront of FDD research. Among many AI methods, the convolutional neural network [65,66,67] (CNN) has become the most mainstream classifier due to its image recognition advantages. Long short-term memory network (LSTM) is suitable for fault trend prediction because of its ability to process time series data. The generative adversarial network (GAN) is used to enhance and reconstruct fault data and improve sample diversity. Network structures such as stacked autoencoder (SAE) and Boltzmann machine (BM) improve the feature abstraction ability and fault tolerance of the model. In addition, the ensemble learning algorithm [68,69] integrates multiple basic models to build a more robust and accurate fault classification system, such as Stacking technology. By combining models with different structures, such as CNN and LSTM, and introducing meta-learners, it has achieved an accuracy of up to 99% on multiple data sets, effectively improving the fault recognition ability under complex working conditions. Unmanned Aerial Vehicles (UAVs) are also an important means of photovoltaic fault detection. With the combination of infrared images obtained by UAVs [70,71] and edge computing, remote, real-time, and automated photovoltaic system monitoring can be realized, and the cost of manual inspection can be significantly reduced. Meanwhile, Olayiwola et al. [72] explored the application of digital twin frameworks in PV systems, integrating AI and IoT technologies for dynamic simulation, predictive maintenance, and optimized resource allocation, which complements UAV-based fault visualization.
Although the existing FDD technology has made significant progress, there are still some key issues that have not been fully resolved. First, most of the detection systems rely on an external power supply or regular maintenance of the power supply, and there are obstacles in the deployment of remote areas or large-scale stations. Secondly, the high cost of thermal imaging equipment and the dependence on professional operators restrict its popularity. Third, the adaptability of most AI models to complex environmental changes still needs to be improved, especially the lack of robustness in the case of multiple fault superposition, image occlusion, and data loss. Based on the above situation, future research can focus on developing low-power, automatic power supply intelligent monitoring nodes. Under the guidance of this trend, the fine research on the spatial distribution characteristics of the external environment energy field of photovoltaic power plants, namely, wind energy and solar energy, has become the key link to ensure the sensor power supply and the continuous operation of the system. In fact, there are abundant wind and solar energy resources around photovoltaic plants, with predictability and regional distribution characteristics, and they can be used as an energy source for sensor nodes. Through the simulation analysis of the wind and solar energy field, the identification of energy high-density areas and the optimal arrangement of sensors can be realized so as to maximize the layout efficiency and energy efficiency ratio of sensor nodes while ensuring the reliable power supply of the system. Therefore, the research based on the energy field is not only a supplement to the existing FDD technology but also a necessary way to promote the intelligent and autonomous development of the photovoltaic monitoring system. It will fundamentally solve the problems of energy bottleneck, difficulties in wiring layout, and system maintenance burden and support the construction of a true ‘zero maintenance’ photovoltaic smart sensing system. Especially in the future, large-scale photovoltaic power plants and photovoltaic applications in deserts, mountainous areas, and remote areas will become more and more extensive. It will be of great theoretical value and practical significance to carry out research on the integrated design of wind–solar energy field simulation and sensing systems.
In summary, it can be found that most of the current status monitoring methods used for photovoltaic panels use a combination of sensors and communication modules. It can be seen that self-powered sensors have high development potential in the future. PV panels will continue to be deployed on a large scale in the next decade [73]. At the same time, it can be seen from the above literature that the current photovoltaic monitoring system generally relies on an external power supply or battery power supply, and there are problems, such as difficult wiring, high maintenance costs, and limited power life, especially in remote, complex, or large-scale photovoltaic stations. Therefore, the exploration of self-powered sensor systems has become a key direction of current research. As renewable energy sources, wind energy and solar energy have the advantages of good continuity, a wide distribution, and convenient access, which provide a feasible energy source for the construction of wireless sensor networks without an external power supply. Around the photovoltaic array, wind flow is affected by the layout of the panel to form a high- and low-speed area, and the reflection of the ground and the panel enhances the local radiation intensity on the back. These environmental characteristics provide natural conditions for energy capture. Based on this, the fine analysis of the wind and solar energy field not only helps to clarify the optimal energy capture position and form but also improves the sensor layout efficiency and system stability, thus promoting the development of photovoltaic monitoring in the direction of intelligence and autonomy.

3. Scheme Analysis

The model considered in this study is a more general solar photovoltaic panel array. The ground is a flat area, such as a desert or grassland, without considering the occlusion of other buildings, as shown in Figure 3a. The model consists of three rows of photovoltaic panels facing the same direction, and each row is tightly arranged with six photovoltaic panels. The photovoltaic panel parameters are shown in Table 1.
Aiming at the research requirements of dynamic characteristics and spatial complexity of the wind field and solar irradiance field, this study adopts a multi-scale simulation system based on computational fluid dynamics (CFD) and realizes the accurate analysis of the wind field and solar irradiance field through geometric modeling, boundary condition setting, and numerical solution process. In the CFD simulation settings, the boundary layer is handled using a hybrid mesh of free triangular and free tetrahedral grids, with high-resolution encryption applied to critical areas (such as the surface of photovoltaic panels) to capture the high-gradient flow characteristics near the wall: the maximum cell size of the free tri-angular grid is 0.002 m, the minimum cell size is 0.0012 m, the curvature factor is 0.2, and the maximum cell growth rate is 1.3; the maximum cell size of the free tetrahedral grid is 1.1 m, the minimum is 0.08 m, the curvature factor is 0.4, the resolution in narrow areas is 0.7, and the total number of grid cells reaches 1,132,372, as shown in Figure 3b. The key areas of the photovoltaic panel surface achieve high-resolution encryption to meet the engineering accuracy requirements. The grid quality within the boundary layer is ensured by controlling the grid growth rate within 1.5. The standard k-ε model is used for turbulence simulation, with its constants set as Cμ = 0.09, C1ε = 1.44, C2ε = 1.92, σk = 1.0, and σε = 1.3, which is suitable for the scenario of fully developed turbulent flow around the photovoltaic array. The convergence criteria adopt dual standards: in terms of residuals, the residuals of the continuity equation, momentum equation, and energy equation need to drop below 10−4; in terms of physical quantities, key parameters such as the surface temperature and heat flux of the photovoltaic panel are monitored, requiring that the variation range in consecutive time steps is less than 0.1%. Meanwhile, the absolute tolerance in the transient solver is set to 0.001 to ensure the stability and accuracy of the simulation results. The design of the computational domain strictly follows the engineering practice criteria proposed by Franke et al. [74], Tominaga et al. [75], and Blocken et al. [76] to ensure the credibility and repeatability of the simulation results. Specifically, the inlet and side boundaries of the computational domain are 5 times the length of the building, the downstream outlet boundary extends to 5 times the length, and the top extends to 3 times the length to avoid the unexpected gradient interference of the inlet velocity profile. The final geometric domain size is 100 m (length) × 100 m (width) × 75 m (height), as shown in Figure 3c.
In the northwest of China, the Xinjiang Uygur Autonomous Region (referred to as Xinjiang) has become the place with the most potential for the large-scale development of new energy power generation in China, and even the world, because of its excellent natural conditions, especially in the field of photovoltaic power generation. The region has long sunshine hours and high total solar radiation; wind energy resources are also very rich. In addition, Xinjiang is sparsely populated and has a spatial advantage for building large-scale wind and photovoltaic power plants. Based on this research, this study selected Urumqi city in Xinjiang Province as a case study area to carry out wind and solar energy field simulation and energy-harvesting system arrangement optimization research, as shown in Figure 3d. Although the analysis is based on specific sites, by replacing wind and solar resource data, this method has good versatility and is suitable for similar scenarios around the world.

4. Simulation of Wind–Solar Energy Field Around Photovoltaic Power Plant

The method used in the simulation of the wind and solar energy field around the photovoltaic power plant includes the following steps, as shown in Figure 4.

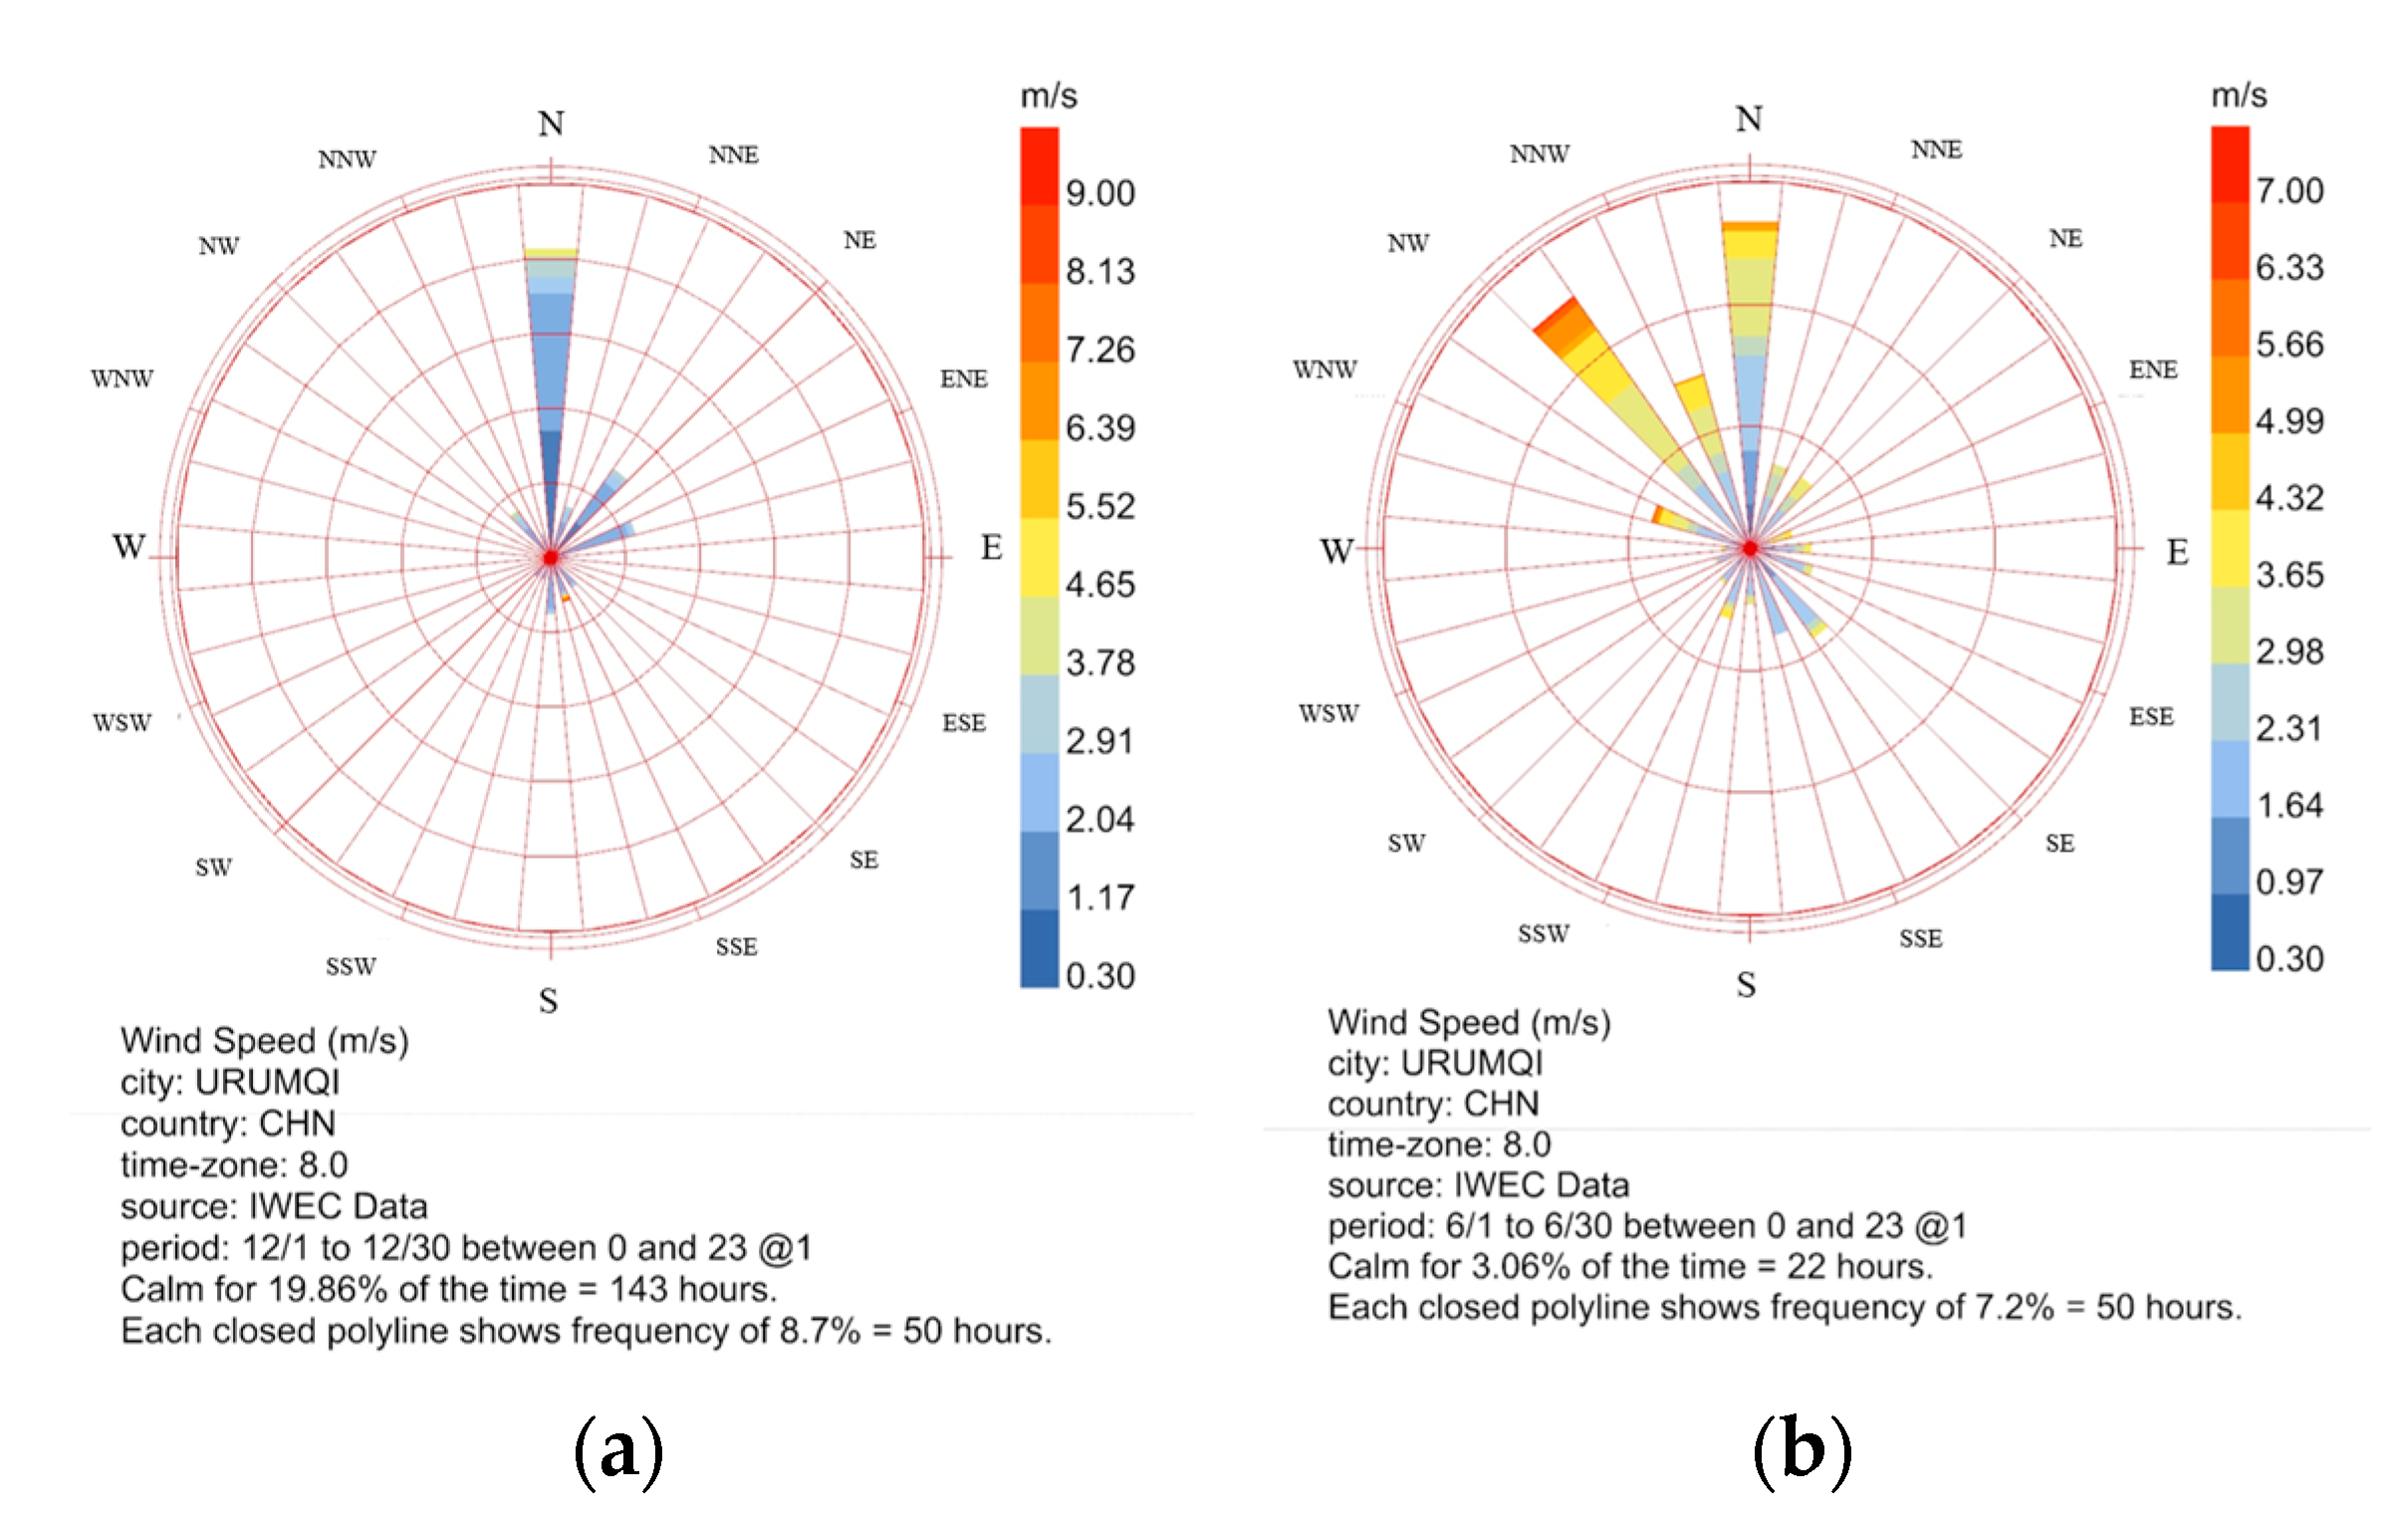
4.1. Meteorological Data Acquisition and Analysis

The simulation of the wind and solar energy field around the photovoltaic power plant is needed to obtain accurate meteorological information and data in the region and carry out preliminary analysis. The Ladybug plug-in in Grasshopper can obtain meteorological data related to the site, including detailed meteorological parameters such as temperature, humidity, wind speed, and wind direction. These data are usually provided in the EPW file format, including climate change in different time periods throughout the year. Using these meteorological data, we can more clearly understand the climatic characteristics of the site area, thus laying the foundation for subsequent environmental energy field simulation. Using Ladybug’s components, we built a battery pack (as shown in Figure 5) in the user interface, downloaded meteorological data for the preset area, and generated the corresponding wind rose chart, as shown in Figure 6.
Moreover, the wind rose charts reveal that the winter monsoon predominantly brings strong northwesterly winds, while the summer monsoon is characterized by relatively gentler southeasterly flows. These seasonal variations have significant implications for the spatial–temporal distribution of the wind energy potential. Sensor placement should prioritize locations exposed to these dominant wind paths to ensure consistent wind harvesting, especially during the high-wind winter period, when energy demand for monitoring increases. Additionally, the concentration of wind directions within narrow angular sectors indicates a stable prevailing wind pattern, which favors fixed-direction energy-harvesting devices.

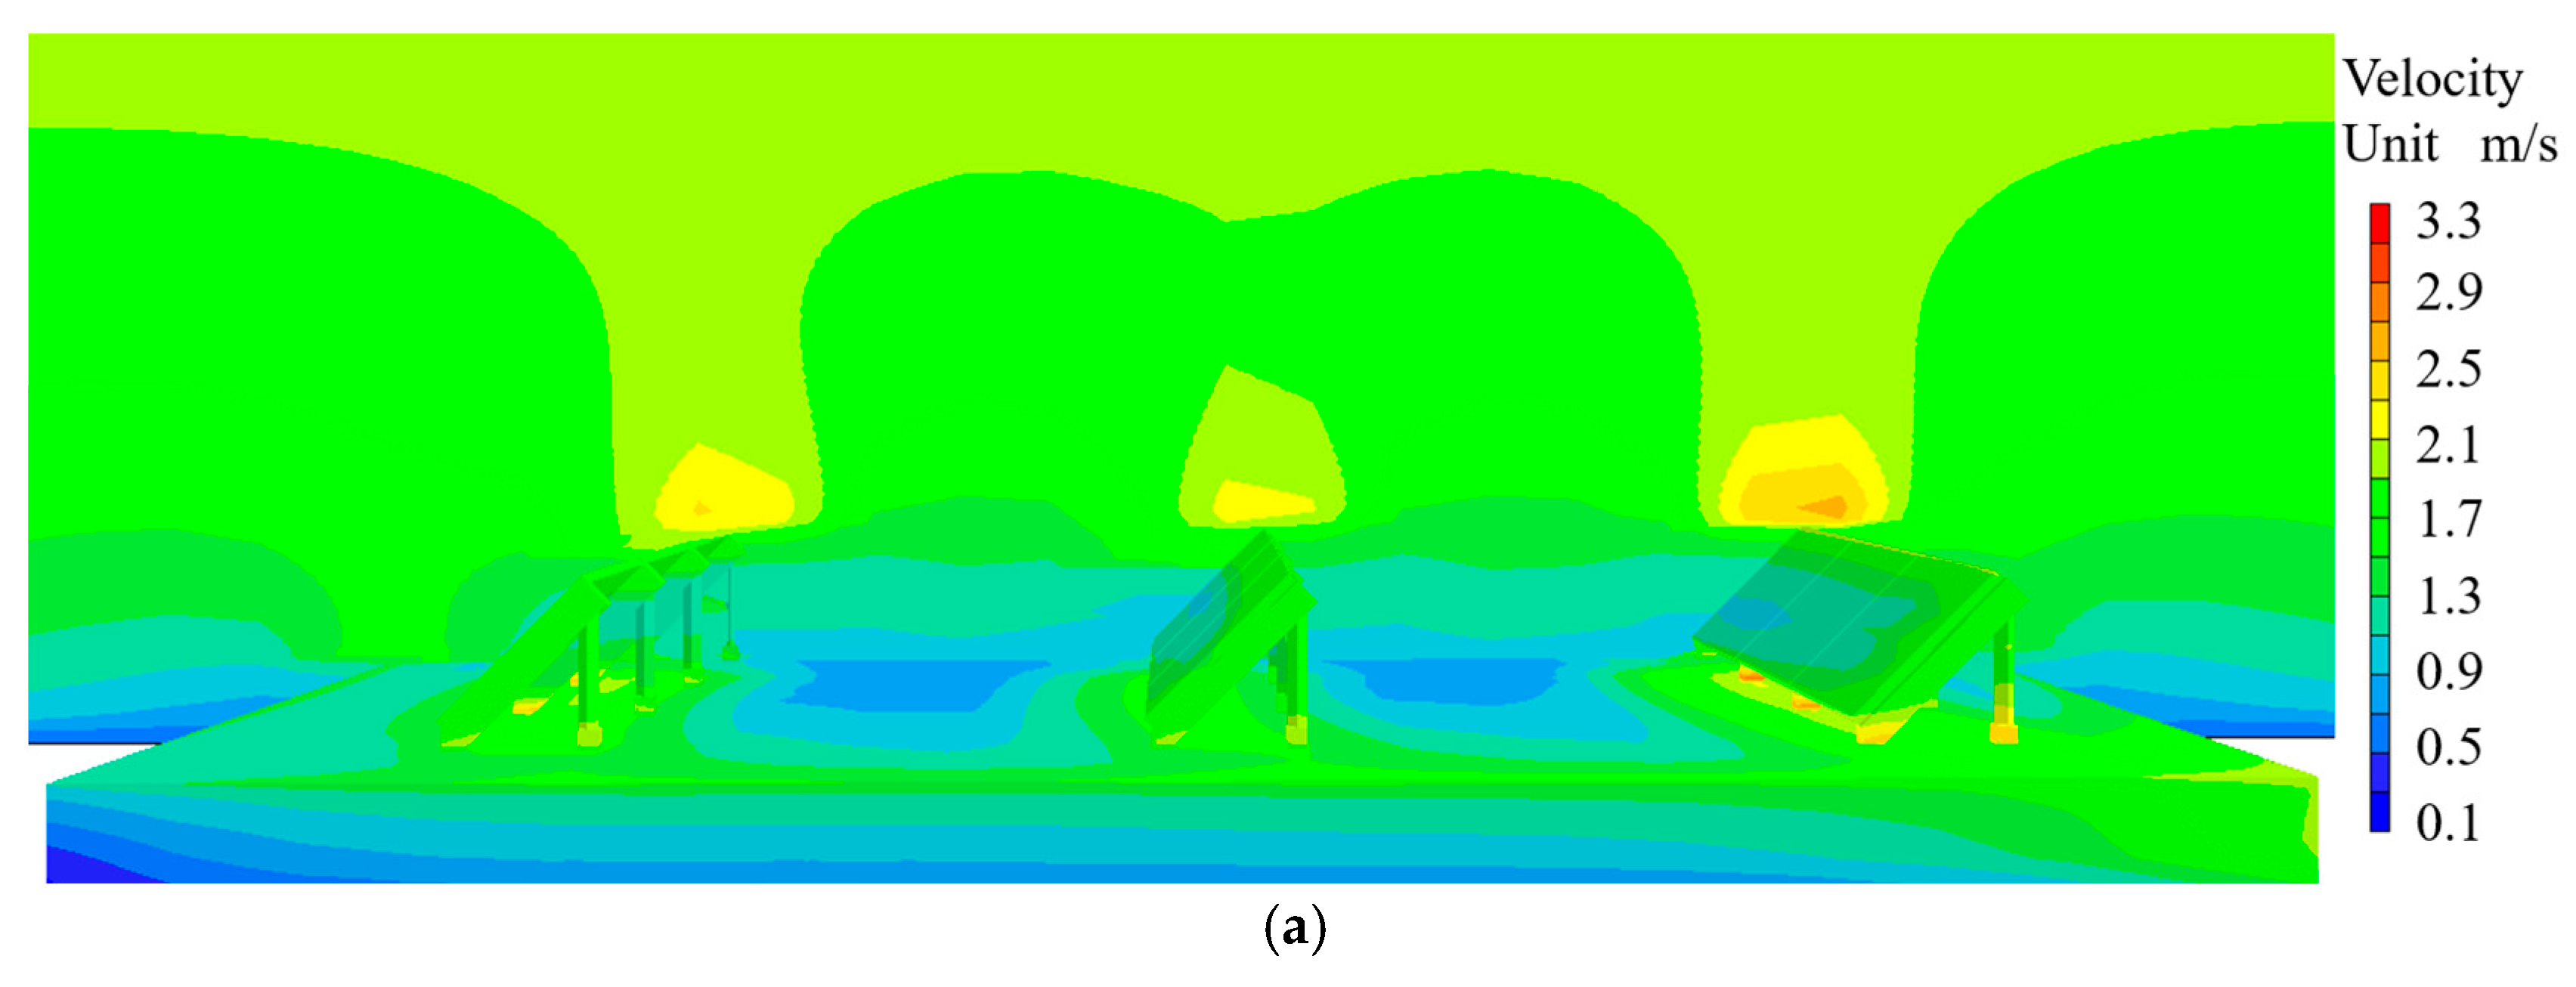
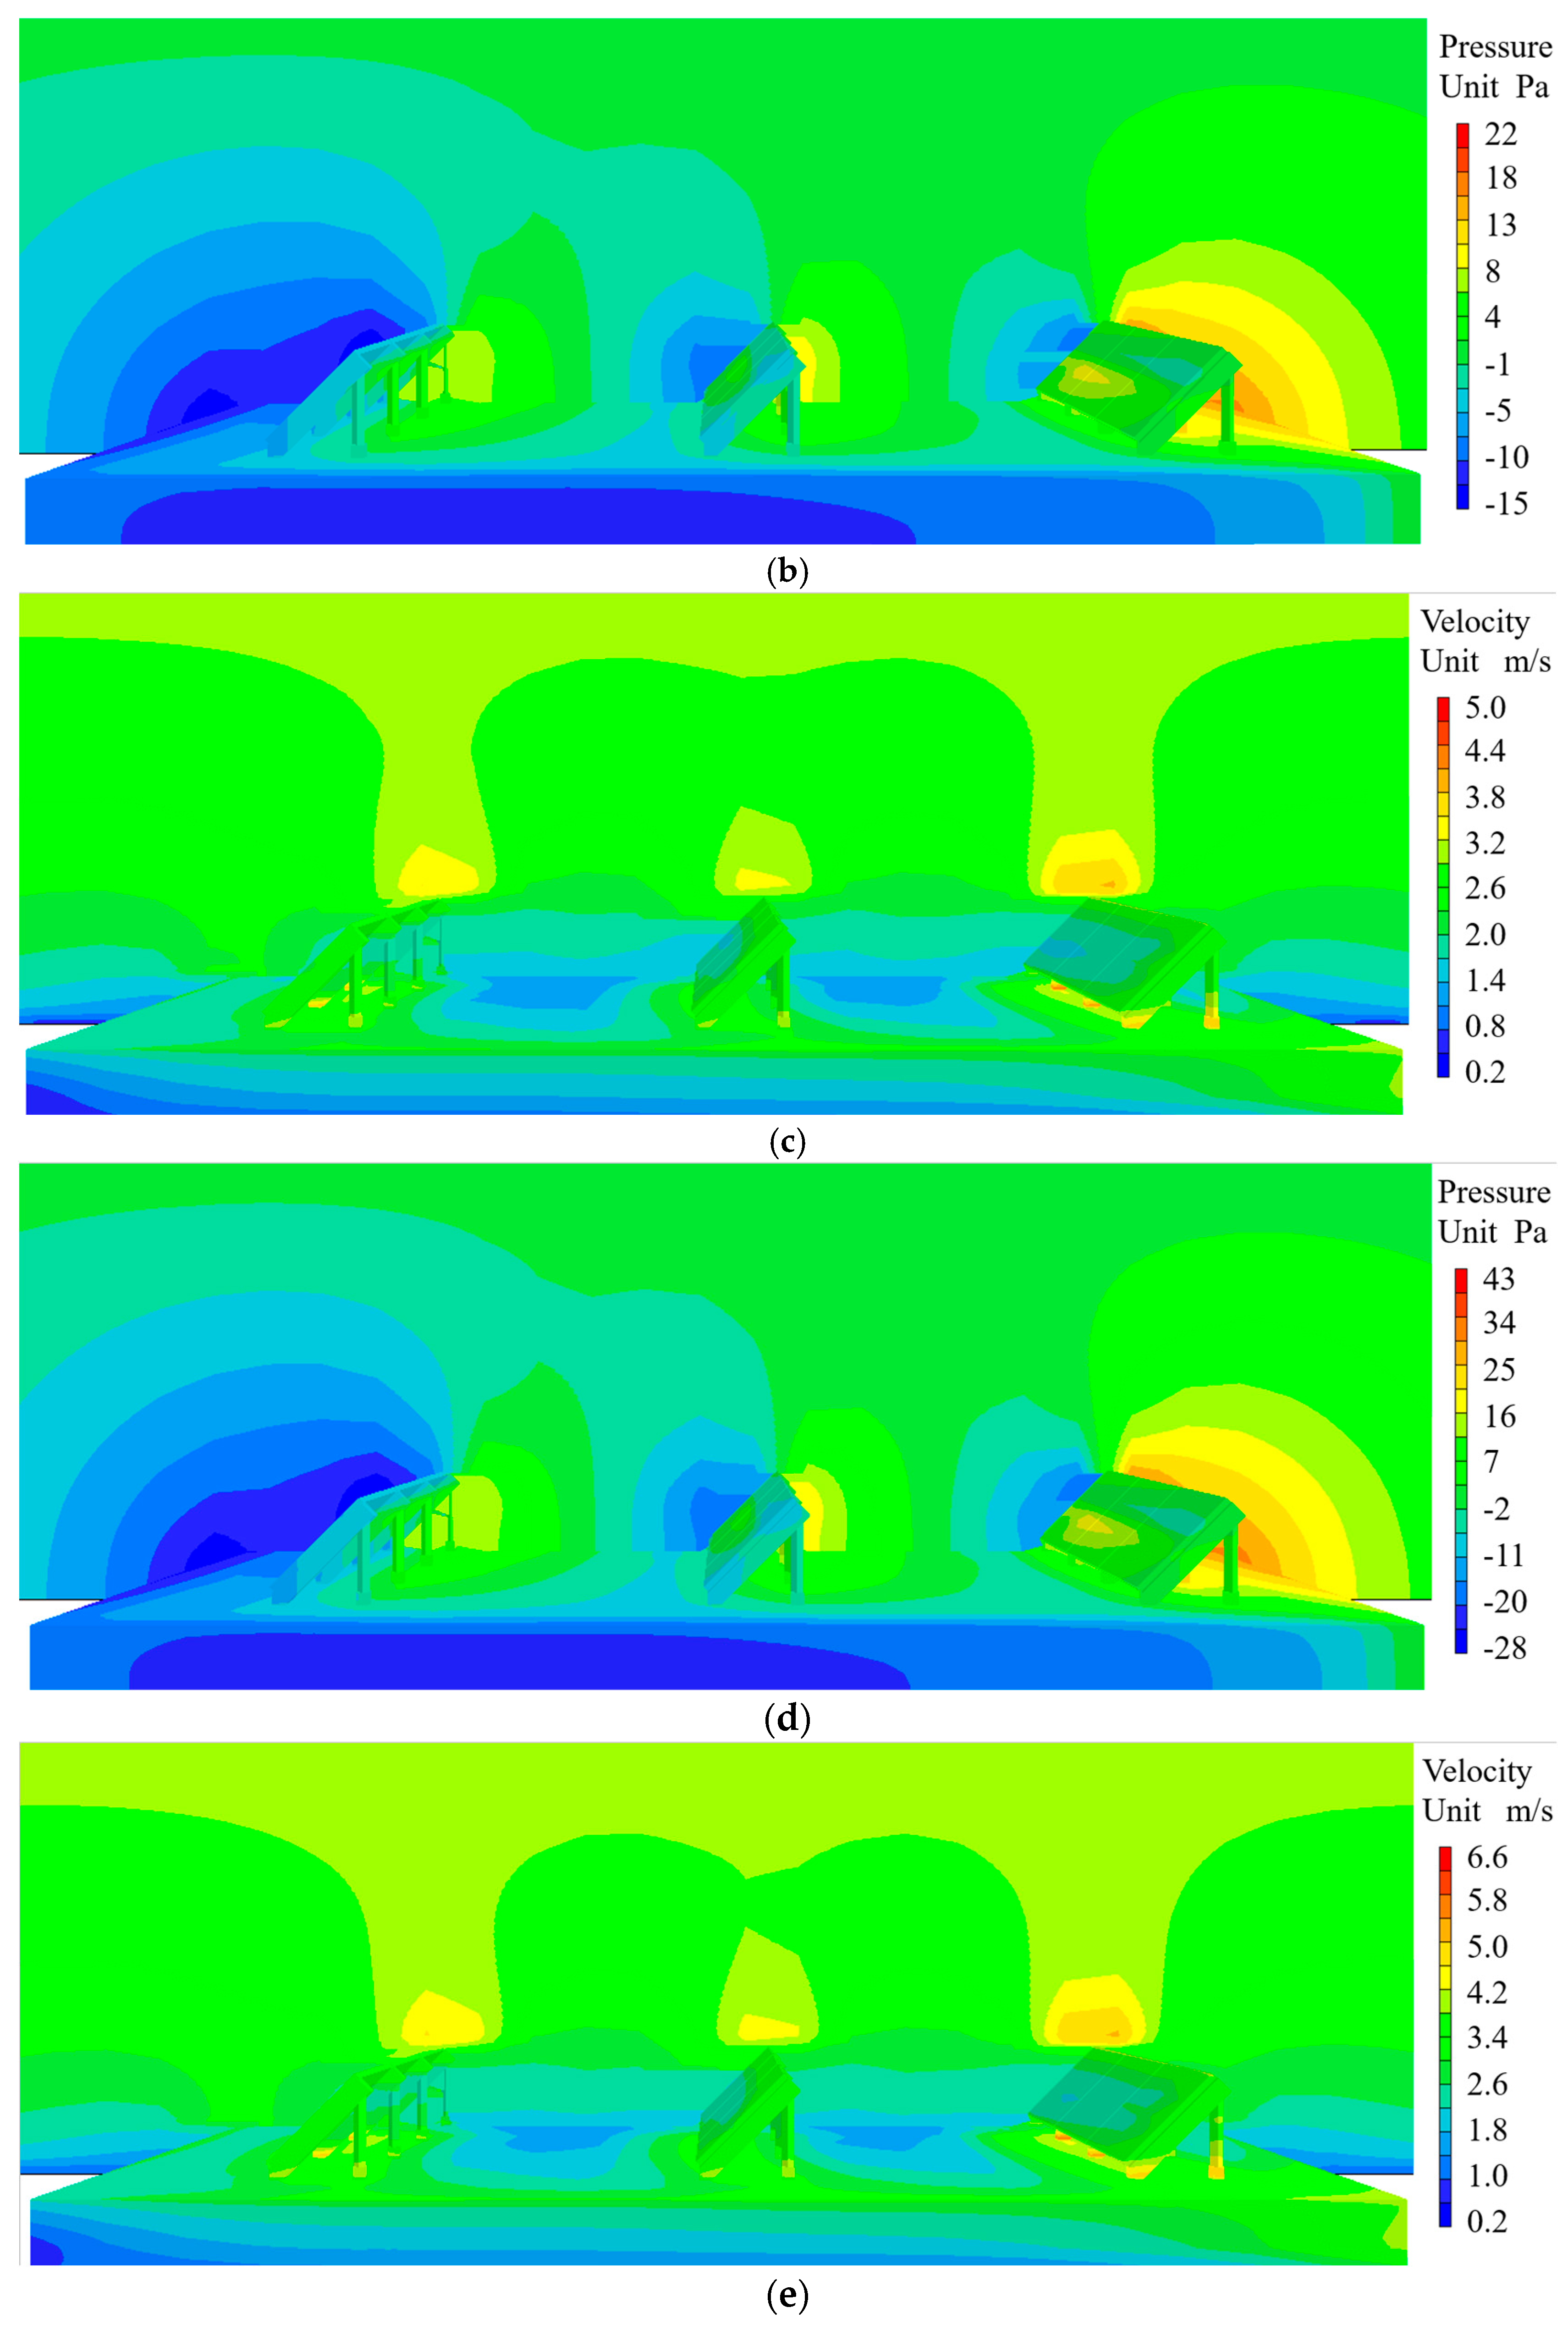
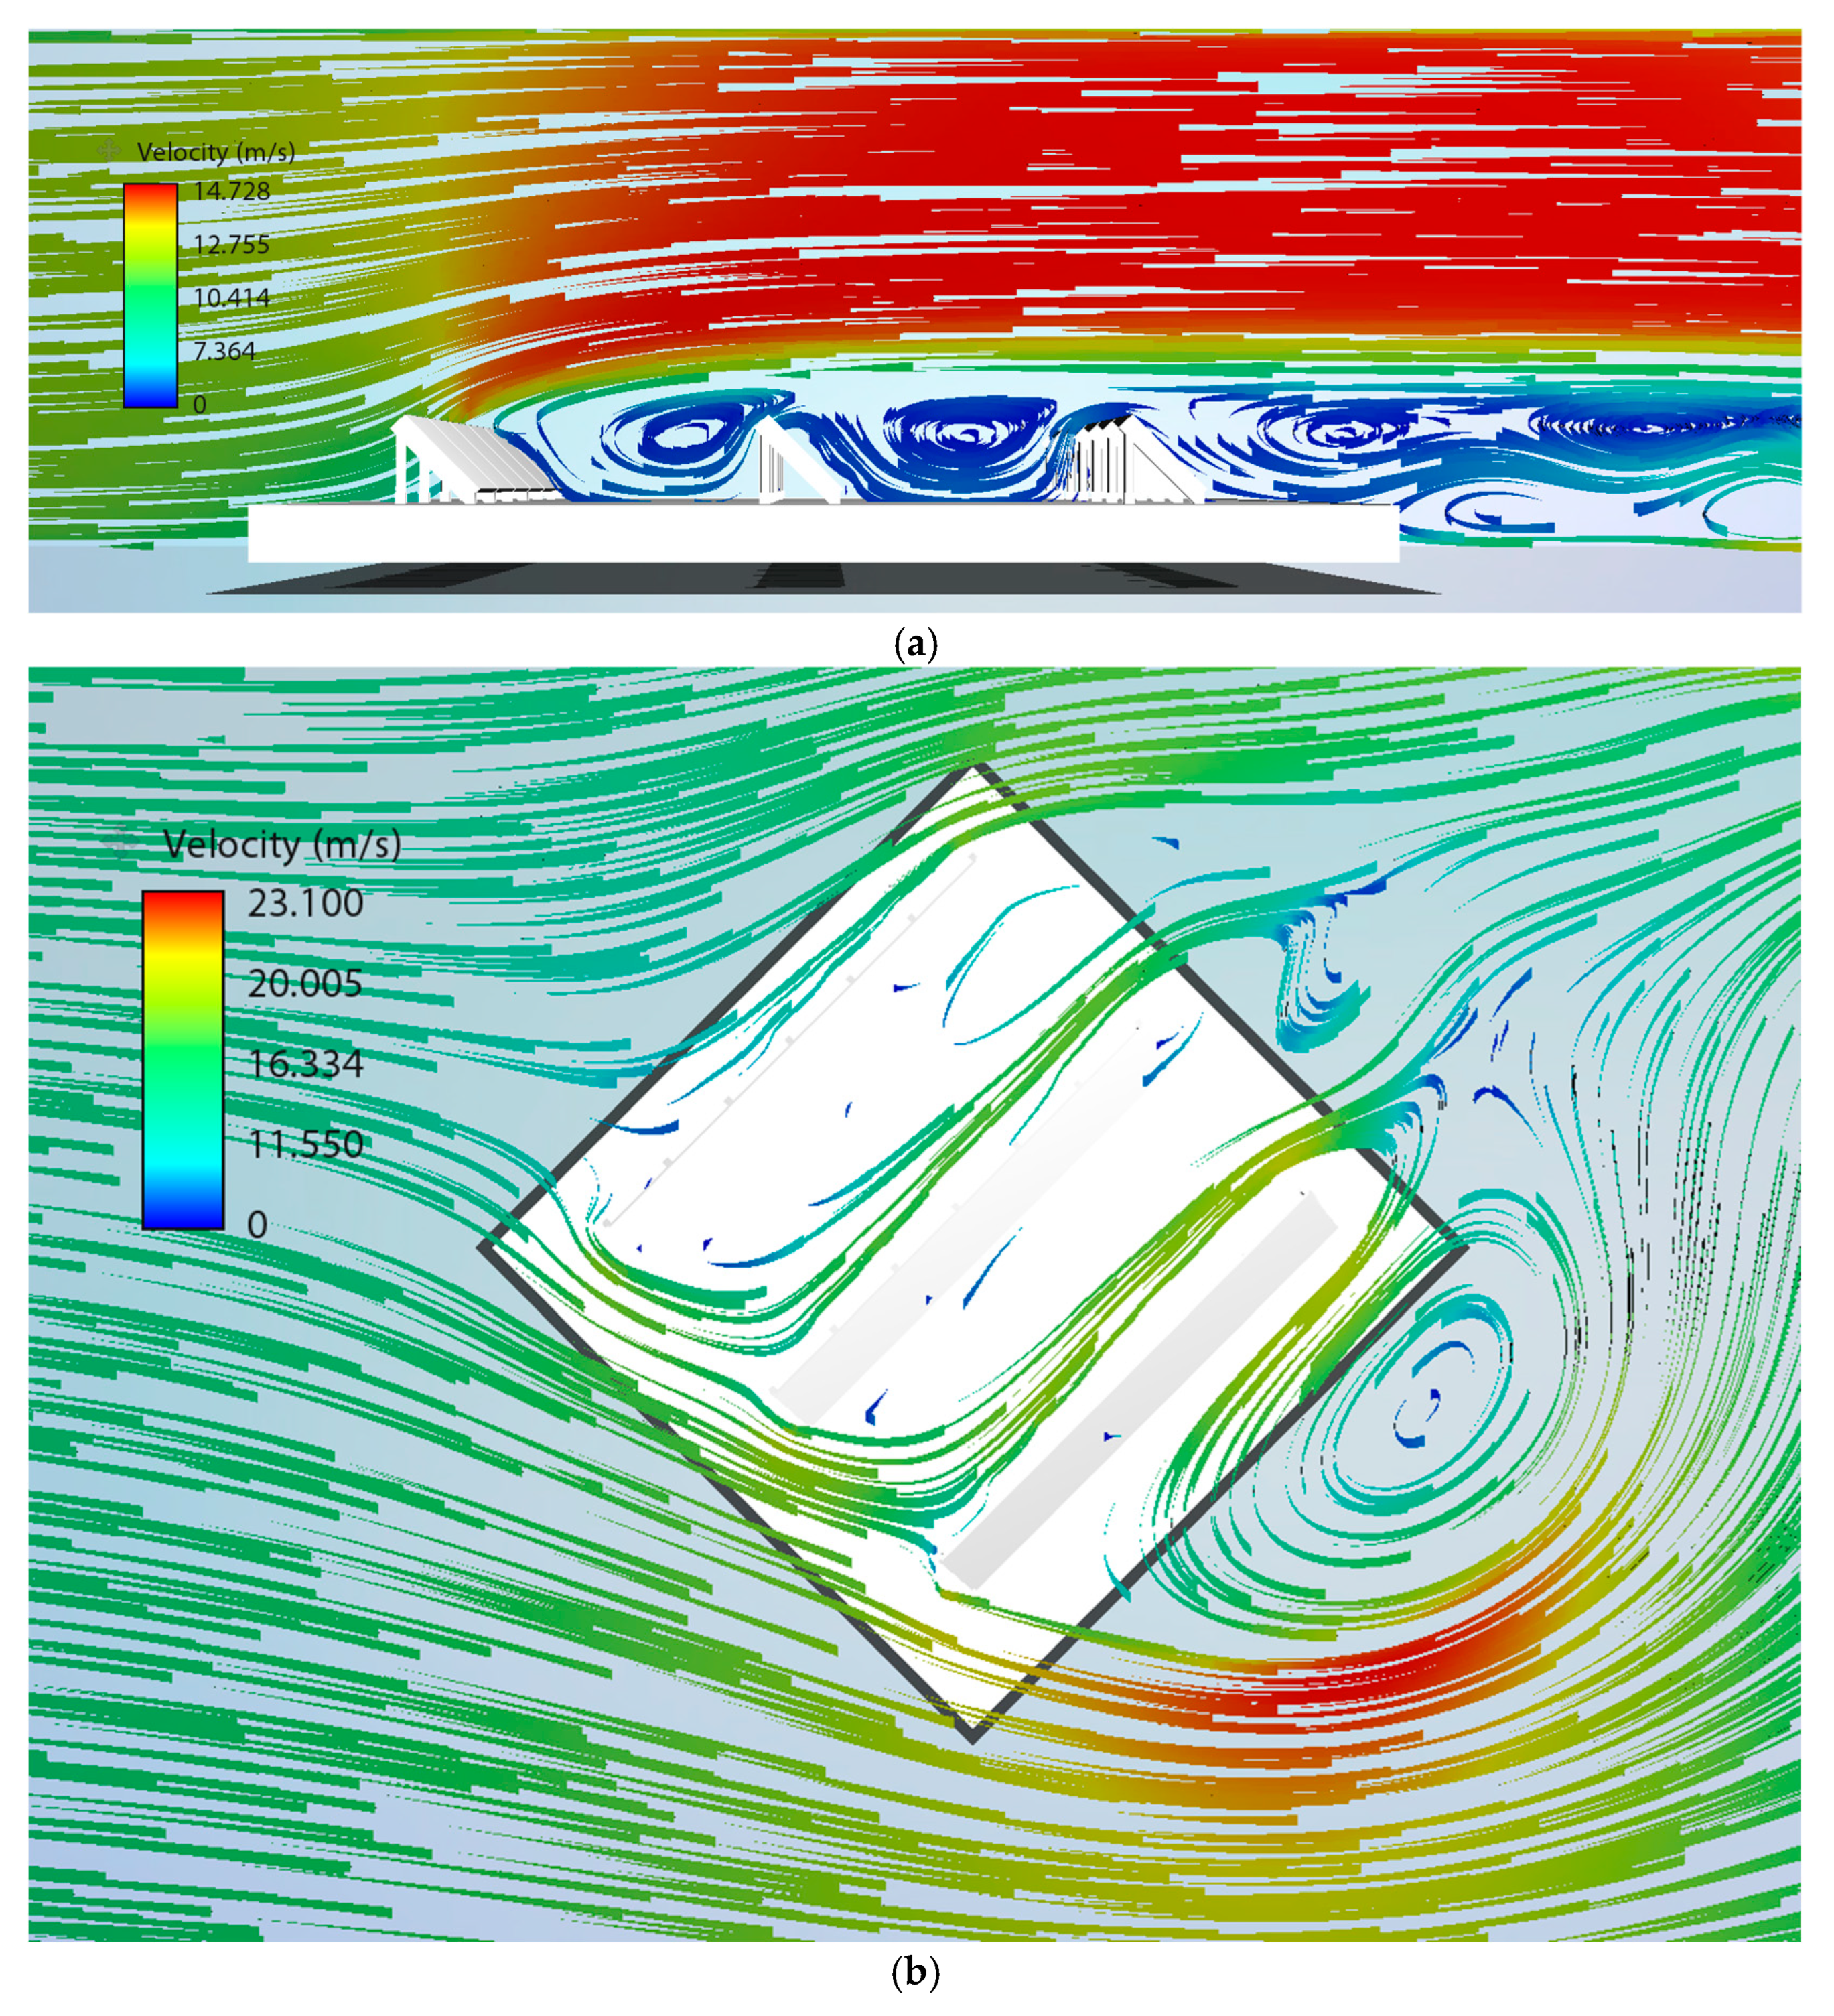
4.2. Wind Field Simulation

The k-ε turbulence model for calculating the wind environment was simulated using the numerical method. This method has a low cost and strong applicability and has been widely used in the numerical simulation of the outdoor wind environment [77]. In this study, Phoenics 2016 was used to simulate the wind environment of photovoltaic panels. This process includes five steps: model import, meshing, boundary condition setting, solution calculation, and post-processing. The model, grid, and flow field of the calculation region are described in detail in Section 3. The most important boundary conditions for wind environment simulation are the wind speed and wind direction vector data of the incoming flow boundary. According to the analysis results obtained from the wind rose diagram, the corresponding wind speed and wind direction can be set to simulate the winter monsoon and summer monsoon environment, respectively. The simulation output includes a wind speed cloud diagram and pressure cloud diagram, as shown in Figure 7. The analysis shows that the wind speed at the top of the photovoltaic panel is higher than that in the middle, forming a local high-speed zone, which is the optimal installation location for energy capture devices. A low-speed zone can be formed on the leeward side of the photovoltaic panel, where auxiliary equipment can be arranged. The pressure gradient between the array gaps is significant, and the wake interference leads to a decrease in wind pressure. For this reason, sensors for monitoring pressure can be placed on the outermost side of the photovoltaic panel to prevent excessive wind pressure from causing deformation of the photovoltaic panel.
Specifically, Figure 7a–h present detailed wind speed and pressure distributions at average wind speeds of 2 m/s, 3 m/s, 4 m/s, and 5 m/s from top to bottom. As the wind speed increases, the velocity gradient near the top of the PV panel intensifies, expanding the high-speed zone, while the wake region on the leeward side remains relatively stagnant. In the pressure maps (Figure 7b,d,f,h), elevated wind speeds lead to a sharper pressure drop between the windward and leeward sides, increasing the aerodynamic load on the panel. This trend underscores the importance of reinforcing structural supports near panel edges and suggests that energy-harvesting devices like vertical-axis wind turbines or piezoelectric generators should be concentrated in top-edge high-speed zones, where flow velocity is maximized.
Through dynamic simulation, how photovoltaic panels change the airflow was analyzed, and the phenomena of the wind-shielding effect and local acceleration effect were discussed. Flow Design was used for three-dimensional flow characteristic analysis. This tool was used to accurately evaluate the flow process of wind through the simulation of flow characteristics and display detailed information, such as the wind speed, airflow path, and eddies, in a three-dimensional environment. The simulation was carried out according to the following process: (1) make the model according to the original proportion; (2) download the model in the program; (3) set the parameters of the virtual wind tunnel; (4) set the initial conditions and select the size of the purging area. The specific setting is the same as the geometric domain size set in the scheme analysis in Section 3, which is 100 m (length) × 100 m (width) × 75 m (height). The simulation results are shown in Figure 8.
The streamline visualizations in Figure 8 illustrate the complex airflow behavior around the photovoltaic array. It is evident that a strong curvature of streamlines occurs near the panel tips, indicating localized flow acceleration and vortex shedding. In particular, the side gaps between panel rows generate distinct counter-rotating vortices that intensify turbulence and create zones of unsteady pressure. These turbulent pockets are not ideal for precise instrumentation but may be leveraged for piezoelectric energy harvesting due to their high-frequency vibration characteristics. Conversely, laminar streamlines near the top panel edges confirm steady high-speed zones suitable for mounting miniaturized wind turbines with minimal flow disturbance.
In this study, the flow field characteristics are of great significance to the installation position optimization and power generation improvement of small wind turbines and piezoelectric energy-harvesting devices. According to the performance study of a vertical axis wind turbine (VAWT) in a low-wind-speed environment [78], the Savonius turbine and the Savonius–Darrieus hybrid turbine show good adaptability under turbulent conditions. Combined with the wind speed distribution in the flow field of the photovoltaic panel, the power generation at different installation positions is significantly different. In the top or edge area of the photovoltaic panel with a high wind speed, such as a wind speed close to 7 m/s, the hybrid turbine can generate about 66.58 W of power, and the Savonius turbine corresponds to about 51.38 W; in the shaded area with a low wind speed, such as a wind speed below 3 m/s, the Savonius turbine can still maintain a power output of about 4.98 W due to its superior self-starting performance, while the hybrid turbine has a low power generation of about 1.81 W due to the limited speed. In the research field of piezoelectric energy-harvesting devices, the triangular rod-attached cylindrical structure designed by Hu et al. [79] can generate about 1.6 mW of power at the top or edge of the photovoltaic panel with a high wind speed, which is 2.5 times higher than the power generation in the middle of the photovoltaic panel. The electromagnetic piezoelectric generator designed by Zhu et al. [80] can output 1.6 mW of power in the windward leading edge area of the plate array with a wind speed of 5 m/s, while 470 μW of power can still be generated in the shelter area with a wind speed of 2.5 m/s. The piezoelectric cantilever energy harvester designed by Sun et al. [81] can achieve a power output of 3.6 μW in the open area of the top of the plate at a wind speed of 8 m/s, and the power is reduced to 0.35 μW in the leeward shelter area at a wind speed of 2 m/s.

4.3. Irradiance Simulation

The irradiance simulation uses COMSOL Multiphysics 6.3 to quantify the combined effect of direct light reflection and reveal the distribution of the solar irradiance field on the surface of photovoltaic panels. The simulation results are shown in Figure 9, and the radiance contour is shown in Figure 10. It can be seen in the simulation results that on the back of the photovoltaic panel, the upper part can receive more reflection from the ground. In Formula (1), P is the power generation of the photovoltaic panel, η is the conversion efficiency of the photovoltaic module, A is the area of the photovoltaic module, and G is the solar radiation intensity.
P = ηAG
Taking the Si (crystalline cell) photovoltaic panel described in Figure 1 as an example, the area of the photovoltaic panel is 1 m2. When it is arranged on the upper part of the back of the photovoltaic panel, the power generation of the photovoltaic panel is calculated to be 200.27 W. When it is arranged in the middle of the photovoltaic panel, the power generation of the photovoltaic panel is calculated to be 175.99 W. Therefore, for the energy-capturing device capturing energy in the form of solar energy, the optimal installation position is the top position of the back of the photovoltaic panel, without blocking the front of the photovoltaic panel from receiving sunlight.
The irradiance simulation shown in Figure 9 shows a non-uniform distribution of reflected solar energy on the back surface of the photovoltaic panel array. Due to the combined effects of panel inclination and ground albedo, the top rear sections receive intensified reflected irradiance. The central and lower regions exhibit reduced irradiance, mainly due to geometric shading and lower reflection angles. This indicates that solar-powered sensor nodes or micro energy-harvesting modules should be mounted in the upper rear areas of the array to maximize energy intake while avoiding interference with front-side power generation. Additionally, the contour map indicates a steep irradiance gradient across the vertical axis of the panel’s rear surface. This gradient is particularly useful for designing tiered energy-harvesting layouts, where sensors with higher power demands are installed at the top (maximum irradiance zone), and low-power nodes are placed lower, where available energy is reduced.

5. Results and Discussion

In this paper, a multi-scale analysis framework integrating CFD wind field simulation and irradiance simulation is constructed to guide the optimal placement of an energy-harvesting system in a photovoltaic power plant. The results show that the flow field characteristics of wind play a key role in improving energy capture efficiency. By comparing the performance of the Savonius turbine and the Savonius–Darrieus hybrid turbine in different wind speed regions, the Savonius turbine shows a higher power output of 66.58 W in the high-wind-speed region (about 7 m/s) at the top or edge of the photovoltaic panel, which is significantly better than the middle of the photovoltaic panel. In research on piezoelectric energy harvesting, the research on various energy-harvesting structures further verifies that the power-generation effect varies greatly in different wind speed regions. In addition, the power output of the photovoltaic panel is also significantly affected by the installation position. Taking the Si (crystalline cell) photovoltaic panel as an example, when the energy-capture device is arranged on the top of the back of the photovoltaic panel, the power generation of the photovoltaic panel reaches 200.27 W, which is higher than the 175.99 W laid in the middle, indicating that the top layout is the most advantageous under the premise of not blocking the front surface irradiation. Combining the collection efficiency of wind energy, piezoelectric energy, and photovoltaic energy, the optimal layout strategy proposed in this study not only improves the total energy capture but also provides theoretical basis and design guidance for the structural integration and engineering deployment of the composite self-powered system, reflecting its practical application potential in the field of green energy utilization and intelligent sensing. This article uses Urumqi in Xinjiang Province as a case study to verify the effectiveness of the analysis method. The proposed method is not only applicable to the location of this case but can also be extended to the evaluation of scenery resources and the optimization of equipment layout in other areas. In the future, more environmental factors can be introduced on this basis to achieve a more detailed design of an intelligent energy-harvesting system. Although this study established a CFD-based wind and solar energy field simulation system, combined with meteorological data to analyze the wind speed and irradiance distribution around the photovoltaic panel array in detail, there are still some limitations. For example, the model assumes that the terrain is flat and does not fully consider the impact of actual complex terrain and building occlusion on the wind and solar environment; the simulation data rely on annual average meteorological data and lack a dynamic response to short-term climate change. In order to further improve the accuracy and application value of the research, real-time meteorological data with a high spatial and temporal resolution can be introduced in the future, and the reliability of the simulation results can be verified via field measurements. At the same time, complex terrain modeling is introduced to consider the comprehensive influence of wind–solar synergy on the energy-harvesting system layout. An energy balance analysis of the energy-harvesting system and the sensor load should also be carried out, and the intelligence and adaptability of the layout scheme should be improved through an artificial intelligence optimization algorithm.

Author Contributions

Conceptualization, B.Z.; methodology, B.W.; software, B.Z.; validation, B.Z. and B.W.; formal analysis, H.Z.; investigation, A.O.; resources, F.B.; data curation, B.W.; writing—original draft preparation, B.Z. and B.W.; writing—review and editing, Z.E.F., B.Z. and A.O.; visualization, J.-W.Z.; supervision, B.Z. and J.G. All authors have read and agreed to the published version of the manuscript.

Funding

This project is supported by the National Key R&D Program of China (grant No. 2023YFE0114600); the Program of National Natural Science Foundation of China (grant No. 51805298); the Natural Science Foundation of Shandong Province (grant No. ZR2019PEE015); the Young Scholars Program of Shandong University, Weihai (grant No. 20820201004); and Fundamental Research Funds for the Central Universities (grant No. 2019ZRJC006).

Data Availability Statement

The original contributions presented in this study are included in the article. Further inquiries can be directed to the corresponding author.

Conflicts of Interest

The authors declare no conflicts of interest.

References

  1. Farghali, M.; Osman, A.I.; Mohamed, I.M.; Chen, Z.; Chen, L.; Ihara, I.; Yap, P.-S.; Rooney, D.W. Strategies to save energy in the context of the energy crisis: A review. Environ. Chem. Lett. 2023, 21, 2003–2039. [Google Scholar] [CrossRef] [PubMed]
  2. Ball, M. Non-renewable energy resources: Fossil fuels–supply and future availability. In Hydrogen Economy: Opportunities and Challenges; Cambridge Press New York: New York, NY, USA, 2009; pp. 46–115. [Google Scholar]
  3. Andrew, R.M. A comparison of estimates of global carbon dioxide emissions from fossil carbon sources. Earth Syst. Sci. Data 2020, 12, 1437–1465. [Google Scholar] [CrossRef]
  4. Farghali, M.; Osman, A.I.; Umetsu, K.; Rooney, D.W. Integration of biogas systems into a carbon zero and hydrogen economy: A review. Environ. Chem. Lett. 2022, 20, 2853–2927. [Google Scholar] [CrossRef]
  5. Worlanyo, A.S.; Jiangfeng, L. Evaluating the environmental and economic impact of mining for post-mined land restoration and land-use: A review. J. Environ. Manag. 2021, 279, 111623. [Google Scholar] [CrossRef] [PubMed]
  6. Seneviratne, S.I.; Rogelj, J.; Séférian, R.; Wartenburger, R.; Allen, M.R.; Cain, M.; Millar, R.J.; Ebi, K.L.; Ellis, N.; Hoegh-Guldberg, O. The many possible climates from the Paris Agreement’s aim of 1.5 C warming. Nature 2018, 558, 41–49. [Google Scholar] [CrossRef] [PubMed]
  7. Ekren, O.; Canbaz, C.H.; Güvel, Ç.B. Sizing of a solar-wind hybrid electric vehicle charging station by using HOMER software. J. Clean. Prod. 2021, 279, 123615. [Google Scholar] [CrossRef]
  8. Yang, W.; Chen, X.; Liu, Y. Review and reflections of legislation and policies on shipping decarbonization under China’s “dual carbon” target. Front. Mar. Sci. 2023, 10, 1131552. [Google Scholar] [CrossRef]
  9. Singh, S.; Tiwari, P.; Tiwari, S. Introduction to solar energy. In Fundamentals and Innovations in Solar Energy; Springer: Singapore, 2021; pp. 1–9. [Google Scholar]
  10. Khan, J.; Arsalan, M.H. Solar power technologies for sustainable electricity generation–A review. Renew. Sustain. Energy Rev. 2016, 55, 414–425. [Google Scholar] [CrossRef]
  11. Mahela, O.P.; Shaik, A.G. Comprehensive overview of grid interfaced wind energy generation systems. Renew. Sustain. Energy Rev. 2016, 57, 260–281. [Google Scholar] [CrossRef]
  12. Mahmoud, M.; Ramadan, M.; Abdelkareem, M.A.; Olabi, A.G. Introduction and definition of wind energy. In Renewable Energy-Volume 1: Solar, Wind, and Hydropower; Elsevier: Amsterdam, The Netherlands, 2023; pp. 299–314. [Google Scholar]
  13. Roga, S.; Bardhan, S.; Kumar, Y.; Dubey, S.K. Recent technology and challenges of wind energy generation: A review. Sustain. Energy Technol. Assess. 2022, 52, 102239. [Google Scholar] [CrossRef]
  14. Masood Ahmad, M.; Kumar, A.; Ranjan, R. Recent developments of tidal energy as Renewable energy: An overview. River Coast. Eng. Hydraul. Water Resour. Coast. Eng. 2022, 117, 329–343. [Google Scholar]
  15. Shetty, C.; Priyam, A. A review on tidal energy technologies. Mater. Today Proc. 2022, 56, 2774–2779. [Google Scholar] [CrossRef]
  16. Chowdhury, M.; Rahman, K.S.; Selvanathan, V.; Nuthammachot, N.; Suklueng, M.; Mostafaeipour, A.; Habib, A.; Akhtaruzzaman, M.; Amin, N.; Techato, K. Current trends and prospects of tidal energy technology. Environ. Dev. Sustain. 2021, 23, 8179–8194. [Google Scholar] [CrossRef] [PubMed]
  17. Younas, M.; Shafique, S.; Hafeez, A.; Javed, F.; Rehman, F. An overview of hydrogen production: Current status, potential, and challenges. Fuel 2022, 316, 123317. [Google Scholar] [CrossRef]
  18. Filippov, S.P.; Yaroslavtsev, A.B. Hydrogen energy: Development prospects and materials. Russ. Chem. Rev. 2021, 90, 627. [Google Scholar] [CrossRef]
  19. Peng, S. Electrochemical Hydrogen Production from Water Splitting; Springer: Berlin/Heidelberg, Germany, 2023. [Google Scholar]
  20. Energy, C. The Report on China’s Energy and Carbon Emissions; Science Press: Beijing, China, 2009. [Google Scholar]
  21. NREL; Hand, M.; Baldwin, S.; DeMeo, E.; Reilly, J.; Mai, T.; Arent, D.; Porro, G.; Meshek, M.; Sandor, D. Renewable Electricity Futures; NREL: Golden, CO, USA, 2012; Volume 4. [Google Scholar]
  22. Sun, H.; Zhi, Q.; Wang, Y.; Yao, Q.; Su, J. China’s solar photovoltaic industry development: The status quo, problems and approaches. Appl. Energy 2014, 118, 221–230. [Google Scholar] [CrossRef]
  23. Moslehi, M.; Kapur, P.; Kramer, J.; Rana, V.; Seutter, S.; Deshpande, A.; Stalcup, T.; Kommera, S.; Ashjaee, J.; Calcaterra, A. World-Record 20.6% Efficiency 156 mm × 156 mm Full-Square Solar Cells Using Low-Cost Kerfless Ultrathin Epitaxial Silicon & Porous Silicon Lift-off Technology for Industry-Leading High-Performance Smart PV Modules; PV Asia Pacific Conference (APVIA/PVAP): Singapore, 2012. [Google Scholar]
  24. Kayes, B.M.; Nie, H.; Twist, R.; Spruytte, S.G.; Reinhardt, F.; Kizilyalli, I.C.; Higashi, G.S. 27.6% Conversion Efficiency, A New Record for Single-Junction Solar Cells Under 1 Sun Illumination. In Proceedings of the 2011 37th IEEE Photovoltaic Specialists Conference, Seattle, WA, USA, 19–24 June 2011; pp. 000004–000008. [Google Scholar]
  25. Wanlass, M. Systems and Methods for Advanced Ultra-High-Performance InP Solar Cells; National Renewable Energy Laboratory NREL: Golden, CO, USA, 2017. [Google Scholar]
  26. Nakamura, M.; Yamaguchi, K.; Kimoto, Y.; Yasaki, Y.; Kato, T.; Sugimoto, H. Cd-free Cu (In, Ga)(Se, S) 2 thin-film solar cell with record efficiency of 23.35%. IEEE J. Photovolt. 2019, 9, 1863–1867. [Google Scholar] [CrossRef]
  27. First Solar Builds the Highest Efficiency Thin Film PV Cell on Record. Available online: https://www.glasstec-online.com/en/Media_News/First_Solar_Builds_the_Highest_Efficiency_Thin_Film_PV_Cell_on_Record (accessed on 15 July 2025).
  28. Zhou, J.; Xu, X.; Wu, H.; Wang, J.; Lou, L.; Yin, K.; Gong, Y.; Shi, J.; Luo, Y.; Li, D. Control of the phase evolution of kesterite by tuning of the selenium partial pressure for solar cells with 13.8% certified efficiency. Nat. Energy 2023, 8, 526–535. [Google Scholar] [CrossRef]
  29. Yan, C.; Huang, J.; Sun, K.; Johnston, S.; Zhang, Y.; Sun, H.; Pu, A.; He, M.; Liu, F.; Eder, K. Cu2ZnSnS4 solar cells with over 10% power conversion efficiency enabled by heterojunction heat treatment. Nat. Energy 2018, 3, 764–772. [Google Scholar] [CrossRef]
  30. Matsui, T.; Bidiville, A.; Maejima, K.; Sai, H.; Koida, T.; Suezaki, T.; Matsumoto, M.; Saito, K.; Yoshida, I.; Kondo, M. High-efficiency amorphous silicon solar cells: Impact of deposition rate on metastability. Appl. Phys. Lett. 2015, 106, 053901. [Google Scholar] [CrossRef]
  31. Sai, H.; Matsui, T.; Kumagai, H.; Matsubara, K. Thin-film microcrystalline silicon solar cells: 11.9% efficiency and beyond. Appl. Phys. Express 2018, 11, 022301. [Google Scholar] [CrossRef]
  32. Green, M.A.; Dunlop, E.D.; Yoshita, M.; Kopidakis, N.; Bothe, K.; Siefer, G.; Hao, X.; Jiang, J.Y. Solar Cell Efficiency Tables (Version 66). Prog. Photovolt. Res. Appl. 2025, 29, 657. [Google Scholar] [CrossRef]
  33. Han, L.; Fukui, A.; Chiba, Y.; Islam, A.; Komiya, R.; Fuke, N.; Koide, N.; Yamanaka, R.; Shimizu, M. Integrated dye-sensitized solar cell module with conversion efficiency of 8.2%. Appl. Phys. Lett. 2009, 94, 013305. [Google Scholar] [CrossRef]
  34. Komiya, R.; Fukui, A.; Murofushi, N.; Koide, N.; Yamanaka, R.; Katayama, H. Improvement of the conversion efficiency of a monolithic type dye-sensitized solar cell module. In Proceedings of the 21st International Photovoltaic Science and Engineering Conference (PVSEC-21), Fukuoka, Japan, 28 November–2 December 2011; Technical Digest. [Google Scholar]
  35. Faisst, J.; Jiang, E.; Bogati, S.; Pap, L.; Zimmermann, B.; Kroyer, T.; Würfel, U.; List, M. Organic Solar Cell with an Active Area> 1 cm2 Achieving 15.8% Certified Efficiency using Optimized VIS-NIR Antireflection Coating. Sol. RRL 2023, 7, 2300663. [Google Scholar] [CrossRef]
  36. Aghaei, M.; Fairbrother, A.; Gok, A.; Ahmad, S.; Kazim, S.; Lobato, K.; Oreski, G.; Reinders, A.; Schmitz, J.; Theelen, M. Review of degradation and failure phenomena in photovoltaic modules. Renew. Sustain. Energy Rev. 2022, 159, 112160. [Google Scholar] [CrossRef]
  37. Libra, M.; Daneček, M.; Lešetický, J.; Poulek, V.; Sedláček, J.; Beránek, V. Monitoring of defects of a photovoltaic power plant using a drone. Energies 2019, 12, 795. [Google Scholar] [CrossRef]
  38. Kumar, N.M.; Sudhakar, K.; Samykano, M.; Jayaseelan, V. On the technologies empowering drones for intelligent monitoring of solar photovoltaic power plants. Procedia Comput. Sci. 2018, 133, 585–593. [Google Scholar] [CrossRef]
  39. Umar, S.; Qureshi, M.S.; Nawaz, M.U. Thermal imaging and AI in solar panel defect identification. Int. J. Adv. Eng. Technol. Innov. 2024, 1, 73–95. [Google Scholar]
  40. Cubukcu, M.; Akanalci, A. Real-time inspection and determination methods of faults on photovoltaic power systems by thermal imaging in Turkey. Renew. Energy 2020, 147, 1231–1238. [Google Scholar] [CrossRef]
  41. Kirubakaran, V.; Preethi, D.; Arunachalam, U.; Rao, Y.K.; Gatasheh, M.K.; Hoda, N.; Anbese, E.M. Infrared thermal images of solar PV panels for fault identification using image processing technique. Int. J. Photoenergy 2022, 2022, 6427076. [Google Scholar] [CrossRef]
  42. El-Banby, G.M.; Moawad, N.M.; Abouzalm, B.A.; Abouzaid, W.F.; Ramadan, E. Photovoltaic system fault detection techniques: A review. Neural Comput. Appl. 2023, 35, 24829–24842. [Google Scholar] [CrossRef]
  43. Triki-Lahiani, A.; Abdelghani, A.B.-B.; Slama-Belkhodja, I. Fault detection and monitoring systems for photovoltaic installations: A review. Renew. Sustain. Energy Rev. 2018, 82, 2680–2692. [Google Scholar] [CrossRef]
  44. Madeti, S.R.; Singh, S. Monitoring system for photovoltaic plants: A review. Renew. Sustain. Energy Rev. 2017, 67, 1180–1207. [Google Scholar] [CrossRef]
  45. Rahman, M.M.; Selvaraj, J.; Rahim, N.; Hasanuzzaman, M. Global modern monitoring systems for PV based power generation: A review. Renew. Sustain. Energy Rev. 2018, 82, 4142–4158. [Google Scholar] [CrossRef]
  46. Lopez, M.E.A.; Mantinan, F.J.G.; Molina, M.G. Implementation of wireless remote monitoring and control of solar photovoltaic (PV) system. In Proceedings of the 2012 Sixth IEEE/PES Transmission and Distribution: Latin America Conference and Exposition (T&D-LA), Montevideo, Uruguay, 3–5 September 2012; pp. 1–6. [Google Scholar]
  47. Rashidi, Y.; Moallem, M.; Vojdani, S. Wireless Zigbee system for perormance monitoring of photovoltaic panels. In Proceedings of the 2011 37th IEEE Photovoltaic Specialists Conference, Seattle, WA, USA, 19–24 June 2011; pp. 003205–003207. [Google Scholar]
  48. Rajaravivarma, V.; Yang, Y.; Yang, T. An overview of wireless sensor network and applications. In Proceedings of the 35th Southeastern Symposium on System Theory, Morgantown, WV, USA, 18 March 2003; pp. 432–436. [Google Scholar]
  49. Guidelines for the Assessment of Photovoltaic Plants. Document A, Photovoltaic System Monitoring. Available online: https://op.europa.eu/en/publication-detail/-/publication/b499e5de-b6ed-4c3e-818b-3021f4b0d62a/language-en (accessed on 15 July 2025).
  50. Moreno-García, I.M.; Pallares-Lopez, V.; Gonzalez-Redondo, M.; Lopez-Lopez, J.; Varo-Martinez, M.; Santiago, I. Implementation of a real time monitoring system for a grid-connected PV park. In Proceedings of the 2015 IEEE International Conference on Industrial Technology (ICIT), Seville, Spain, 17–19 March 2015; pp. 2915–2920. [Google Scholar]
  51. Naeem, M.; Anani, N.; Ponciano, J.; Shahid, M. Remote condition monitoring of a PV system using an embedded web server. In Proceedings of the 2011 2nd IEEE PES International Conference and Exhibition on Innovative Smart Grid Technologies, Manchester, UK, 5–7 December 2011; pp. 1–4. [Google Scholar]
  52. Husain, N.S.; Zainal, N.A.; Singh, B.S.M.; Mohamed, N.M.; Nor, N.M. Integrated PV based solar insolation measurement and performance monitoring system. In Proceedings of the 2011 IEEE Colloquium on Humanities, Science and Engineering, Penang, Malaysia, 5–6 December 2011; pp. 710–715. [Google Scholar]
  53. Touati, F.; Khandakar, A.; Chowdhury, M.E.; Gonzales, A.J.S.; Sorino, C.K.; Benhmed, K. Photo-Voltaic (PV) monitoring system, performance analysis and power prediction models in Doha, Qatar. In Renewable Energy-Technologies and Applications; IntechOpen: London, UK, 2020. [Google Scholar]
  54. Khan, M.; Iqbal, J.; Ali, M.; Muhmmad, A.; Zahir, A.; Ali, N. Designing and implementation of energy-efficient wireless photovoltaic monitoring system. Trans. Emerg. Telecommun. Technol. 2022, 33, e3685. [Google Scholar] [CrossRef]
  55. Yacine, H.; Boufeldja, K. Wireless internet of things solutions for efficient photovoltaic system monitoring via WiFi networks. Indones. J. Electr. Eng. Comput. Sci. 2024, 33, 901–910. [Google Scholar] [CrossRef]
  56. Emamian, M.; Eskandari, A.; Aghaei, M.; Nedaei, A.; Sizkouhi, A.M.; Milimonfared, J. Cloud computing and IoT based intelligent monitoring system for photovoltaic plants using machine learning techniques. Energies 2022, 15, 3014. [Google Scholar] [CrossRef]
  57. Radia, M.A.; El Nimr, M.; Atlam, A. IoT-based wireless data acquisition and control system for photovoltaic module performance analysis. e-Prime-Adv. Electr. Eng. Electron. Energy 2023, 6, 100348. [Google Scholar] [CrossRef]
  58. Abdallah, F.S.M.; Abdullah, M.; Musirin, I.; Elshamy, A.M. Intelligent solar panel monitoring system and shading detection using artificial neural networks. Energy Rep. 2023, 9, 324–334. [Google Scholar] [CrossRef]
  59. Chouay, Y.; Ouassaid, M. An accurate real time neural network based irradiance and temperature sensor for photovoltaic applications. Results Eng. 2024, 21, 101766. [Google Scholar] [CrossRef]
  60. Ul Mehmood, M.; Ulasyar, A.; Ali, W.; Zeb, K.; Zad, H.S.; Uddin, W.; Kim, H.-J. A new cloud-based IoT solution for soiling ratio measurement of PV systems using artificial neural network. Energies 2023, 16, 996. [Google Scholar] [CrossRef]
  61. Krishna Rao, C.; Sahoo, S.K.; Yanine, F.F. An IoT-based intelligent smart energy monitoring system for solar PV power generation. Energy Harvest. Syst. 2024, 11, 20230015. [Google Scholar] [CrossRef]
  62. Lin, C. Enhancing Energy Efficiency in Photovoltaic Systems through Smart Technology Integration: Innovations and Future Perspectives. In Proceedings of the 2024 International Conference on Naval Architecture and Ocean Engineering (ICNAOE 2024), Beijing, China, 21 January 2025; E3S Web of Conferences; EDP Sciences: Shenzhen, China, 2025; p. 05004. [Google Scholar]
  63. Jamuna, V.; Muniraj, C.; Periasamy, P. Fault detection for photovoltaic panels in solar power plants by using linear iterative fault diagnosis (LIFD) technique based on thermal imaging system. J. Electr. Eng. Technol. 2023, 18, 3091–3103. [Google Scholar] [CrossRef]
  64. Alwar, S.; Samithas, D.; Boominathan, M.S.; Balachandran, P.K.; Mihet-Popa, L. Performance analysis of thermal image processing-based photovoltaic fault detection and PV array reconfiguration—A detailed experimentation. Energies 2022, 15, 8450. [Google Scholar] [CrossRef]
  65. Lu, S.-D.; Wang, M.-H.; Wei, S.-E.; Liu, H.-D.; Wu, C.-C. Photovoltaic module fault detection based on a convolutional neural network. Processes 2021, 9, 1635. [Google Scholar] [CrossRef]
  66. Kellil, N.; Aissat, A.; Mellit, A. Fault diagnosis of photovoltaic modules using deep neural networks and infrared images under Algerian climatic conditions. Energy 2023, 263, 125902. [Google Scholar] [CrossRef]
  67. Lu, X.; Lin, P.; Cheng, S.; Lin, Y.; Chen, Z.; Wu, L.; Zheng, Q. Fault diagnosis for photovoltaic array based on convolutional neural network and electrical time series graph. Energy Convers. Manag. 2019, 196, 950–965. [Google Scholar] [CrossRef]
  68. Mansouri, M.; Trabelsi, M.; Nounou, H.; Nounou, M. Deep learning-based fault diagnosis of photovoltaic systems: A comprehensive review and enhancement prospects. IEEE Access 2021, 9, 126286–126306. [Google Scholar] [CrossRef]
  69. Wang, P.; Poovendran, P.; Manokaran, K.B. Fault detection and control in integrated energy system using machine learning. Sustain. Energy Technol. Assess. 2021, 47, 101366. [Google Scholar] [CrossRef]
  70. Michail, A.; Livera, A.; Tziolis, G.; Candás, J.L.C.; Fernandez, A.; Yudego, E.A.; Martínez, D.F.; Antonopoulos, A.; Tripolitsiotis, A.; Partsinevelos, P. A comprehensive review of unmanned aerial vehicle-based approaches to support photovoltaic plant diagnosis. Heliyon 2024, 10, e23983. [Google Scholar] [CrossRef] [PubMed]
  71. Alsafasfeh, M.; Abdel-Qader, I.; Bazuin, B.; Alsafasfeh, Q.; Su, W. Unsupervised fault detection and analysis for large photovoltaic systems using drones and machine vision. Energies 2018, 11, 2252. [Google Scholar] [CrossRef]
  72. Olayiwola, O.; Cali, U.; Elsden, M.; Yadav, P. Enhanced Solar Photovoltaic System Management and Integration: The Digital Twin Concept. Solar 2025, 5, 7. [Google Scholar] [CrossRef]
  73. Hoffmann, W. PV solar electricity industry: Market growth and perspective. Sol. Energy Mater. Sol. Cells 2006, 90, 3285–3311. [Google Scholar] [CrossRef]
  74. Best Practice Guideline for the CFD Simulation of Flows in the Urban Environment: COST Action 732 Quality Assurance and Improvement of Microscale Meteorological Models. Available online: https://www.researchgate.net/publication/257762102_Best_Practice_Guideline_for_the_CFD_Simulation_of_Flows_in_the_Urban_Environment_COST_Action_732_Quality_Assurance_and_Improvement_of_Microscale_Meteorological_Models#citations (accessed on 15 July 2025).
  75. Tominaga, Y.; Mochida, A.; Yoshie, R.; Kataoka, H.; Nozu, T.; Yoshikawa, M.; Shirasawa, T. AIJ guidelines for practical applications of CFD to pedestrian wind environment around buildings. J. Wind Eng. Ind. Aerodyn. 2008, 96, 1749–1761. [Google Scholar] [CrossRef]
  76. Blocken, B. Computational Fluid Dynamics for urban physics: Importance, scales, possibilities, limitations and ten tips and tricks towards accurate and reliable simulations. Build. Environ. 2015, 91, 219–245. [Google Scholar] [CrossRef]
  77. Yang, Y.; Gou, A. Research on wind environment simulation of commercial district based on Phoenics—Taking shanghai central building group as an example. In IOP Conference Series: Earth and Environmental Science; IOP Publishing: Bristol, UK, 2021; p. 012193. [Google Scholar]
  78. Wilberforce, T.; Olabi, A.; Sayed, E.T.; Alalmi, A.H.; Abdelkareem, M.A. Wind turbine concepts for domestic wind power generation at low wind quality sites. J. Clean. Prod. 2023, 394, 136137. [Google Scholar] [CrossRef]
  79. Hu, G.; Tse, K.T.; Kwok, K.C.S.; Song, J.; Lyu, Y. Aerodynamic modification to a circular cylinder to enhance the piezoelectric wind energy harvesting. Appl. Phys. Lett. 2016, 109, 193902. [Google Scholar] [CrossRef]
  80. Zhu, D.; Beeby, S.; Tudor, J.; White, N.; Harris, N. A novel miniature wind generator for wireless sensing applications. In Proceedings of the IEEE Sensors 2010 Conference, Waikoloa, HI, USA, 1–4 November 2010; pp. 1415–1418. [Google Scholar]
  81. Sun, H.; Zhu, D.; White, N.; Beeby, S. A miniature piezoelectric energy harvester for air flows. In Proceedings of the 2015 Symposium on Design, Test, Integration and Packaging of MEMS/MOEMS (DTIP), Montpellier, France, 27–30 April 2015; pp. 1–3. [Google Scholar]
Figure 1. Efficiency of different types of photovoltaic materials [23,24,25,26,27,28,29,30,31,32,33,34,35].
Energies 18 03786 g001
Figure 2. Classification and detection method used for photovoltaic system faults [42].
Energies 18 03786 g002
Figure 3. Structural layout and calculation settings for wind field simulation and irradiance simulation of photovoltaic arrays. (a) Photovoltaic array structure model. (b) Grid division scheme. (c) Compute domain configuration. (d) Representative case site.
Energies 18 03786 g003
Figure 4. Simulation steps of the wind and solar energy field.
Energies 18 03786 g004
Figure 5. Ladybug meteorological data analysis battery pack.
Energies 18 03786 g005
Figure 6. Seasonal wind rose charts for Urumqi in Xinjiang Province derived from EPW meteorological data. (a) Winter monsoon meteorological data; (b) summer monsoon meteorological data.
Energies 18 03786 g006
Figure 7. CFD simulation results of wind speed and pressure distribution around photovoltaic module array under different wind speed conditions. (a) Wind speed distribution at average wind speed of 2 m/s; (b) wind pressure distribution at average wind speed of 2 m/s; (c) wind speed distribution at average wind speed of 3 m/s; (d) wind pressure distribution at average wind speed of 3 m/s; (e) wind speed distribution at average wind speed of 4 m/s; (f) wind pressure distribution at average wind speed of 4 m/s; (g) wind speed distribution at average wind speed of 5 m/s; (h) wind pressure distribution at average wind speed of 5 m/s.
Energies 18 03786 g007aEnergies 18 03786 g007bEnergies 18 03786 g007c
Figure 8. Visualization simulation diagram of airflow around photovoltaic panels. (a) Simulation results of airflow from the back to the front of the photovoltaic panels. (b) Simulation results of airflow flowing through photovoltaic panels at a 45° angle from the side. (c) Simulation results of airflow flowing from one side to the other when photovoltaic panels are arranged on a slope with a 20 degree angle.
Energies 18 03786 g008aEnergies 18 03786 g008b
Figure 9. Simulation diagram of solar reflection intensity distribution on the back of photovoltaic panel.
Energies 18 03786 g009
Figure 10. Contour map of solar reflection intensity on the back of photovoltaic panels.
Energies 18 03786 g010
Table 1. Parameters of photovoltaic panels.
ParameterValue
Tilt angle of photovoltaic panel45°
Photovoltaic panel area8.75 m2
Supporting structurestructural steel
Cell typesingle-crystal silicon
Disclaimer/Publisher’s Note: The statements, opinions and data contained in all publications are solely those of the individual author(s) and contributor(s) and not of MDPI and/or the editor(s). MDPI and/or the editor(s) disclaim responsibility for any injury to people or property resulting from any ideas, methods, instructions or products referred to in the content.

