1. Introduction
The observed greenhouse effect and projected impacts of climate change are currently significant sources of global concern [
1,
2]. In response to these challenges and to mitigate the increase in global temperatures, individual nations and blocs, such as the European Union, have initiated an energy transition plan [
3]. Its primary objective is to reduce CO
2 emissions by the rapid deployment of intermittent renewable energy sources (IRESs), particularly solar and wind power [
4].
This presents a substantial challenge, as a significant increase in global energy demand is projected for the coming decades. Currently, more than 80% of primary energy is sourced from fossil fuels, with only approximately 5.6% derived from solar and wind power. Furthermore, electricity generation alone consumed about 40% of the total primary energy, where only 12% of electricity generation was attributed to solar and wind, in 2023, and this then increased slightly to just below 15% in 2024 (mainly due to increased solar generation) [
5,
6,
7,
8].
The planned increase in the share of solar and wind in primary energy consumption, essential to achieving the goals of climate neutrality, requires massive investments, especially in IRESs, which are estimated at 36.6 trillion USD in the EU alone [
9]. Inevitably, this also involves the need to extract a multitude of minerals more than is being performed at present, which consequently requires the construction of numerous new mines, as well as refining and processing facilities [
10,
11].
All of these factors make choosing the correct path for energy transformation exceptionally difficult, especially when considering that the economic prosperity and sustainable development of modern societies are closely tied to the choice of energy supply technologies. Among the key metrics used to assess these technologies, Energy Returned on Investment (EROI) stands out as the most fundamental.
EROI measures the net energy gain throughout the life cycle of an energy system, defined as the ratio of usable energy obtained to the energy invested in making it available [
12,
13]. Its significance lies in its independence from short-term economic fluctuations or politically driven biases since it is based purely on physical energy units (joules) rather than financial metrics, making it a universally applicable and objective indicator.
It is important to emphasize that cost-weighted metrics, often misrepresented as EROI, should not be confused with true EROI values because it can lead to untrue conclusions. In the present work, the definition and evaluation of EROI for various energy technologies was based on the framework proposed by [
12].
The credibility of the results presented in [
12,
13], particularly in the context of IRESs such as photovoltaic (PV) and wind farms, has been repeatedly confirmed in the literature. For example, in [
14], a 100% photovoltaic energy system was shown to exhibit critically low EROI values, which is insufficient to support energy-intensive societies. Similarly, the study by [
15], who evaluated PV-based systems in regions with moderate solar insolation, concluded that the use of photovoltaic technology can lead to the creation of an energy sink. Furthermore, the analysis presented in [
11] highlights the systemic risks associated with rapid and large-scale transitions to IRESs, which can result in a decrease in the overall EROI of the energy system to levels incompatible with the viability of the system.
Similarly, since EROI can be calculated for individual energy sources or entire energy systems, it is also possible to estimate the minimum EROI required to sustain economic growth, support complex societal functions, and maintain a high quality of life. The authors of [
16] were among the first to suggest that an EROI of approximately 10 is the lower bound necessary for developed societies to maintain their current levels of economic and cultural activity.
A study examining historical energy expenditures relative to GDP for the US, the UK, and the world generally found that economic growth in the US is only possible if energy spending remains below 11% of GDP, which corresponds to an average energy price that is no more than twice the current level. The same analysis indicates that a minimum EROI of 11 is required to maintain positive economic growth [
17].
A particularly noteworthy contribution is the work of Lambert et al. [
18], which connected EROI with broader well-being indicators, such as the Human Development Index (HDI), income inequality (Gini index), literacy, child mortality, and life expectancy. Their findings suggest that significant improvements in social well-being correlate with EROI values approaching 30, marking a threshold of prosperity and sustainability.
However, it should be noted that energy efficiency and technological advancement are capable of increasing net energy savings for an economy. This has been especially confirmed in the case of developing countries [
19]. This may imply that economies and societies that prioritize energy efficiency will be able to function sustainably and prosperously with lower minimum EROI values than is currently assumed.
However, a future energy system may require an increase in the minimum EROI. This is due to the challenges of adapting to climate change and the need to ensure a sufficient energy surplus [
20]. This surplus may be crucial for mitigating the risks associated with the projected increase in the intensity of hazardous natural phenomena while simultaneously ensuring sustainable economic development.
It is also important to note that, for many countries, the energy transformation toward net zero could, in practice, mean a significant reduction in the EROI (Energy Return on Investment) ratio. Poland, a large EU country whose energy system is mainly based on coal, serves as an example, where transformation investments are estimated to be EUR 527 billion by 2030 alone [
21]. Such substantial expenditures, coupled with a simultaneous decrease in EROI, could directly lead to a considerable economic burden for every average citizen [
22].
The above-mentioned studies, despite using different methodologies, have proposed that the minimum system-level EROI required to sustain modern industrial societies, including sectors such as healthcare, education, and the arts, beyond basic needs like food and shelter, should fall between 10 and 30. Higher-end values may be required for economies involved in sectors with a very high energy demand, such as the military and space industries.
The present study uses the main results reported in the studies mentioned above to develop a model that aims to estimate the feasible composition of an energy mix consisting of intermittent renewable energy sources and stable sources, including fossil fuel-powered plants, nuclear energy, and hydropower. The objective is to determine the system configurations that maintain a minimum EROI threshold of 10, 15, and 30. The analysis also aims to provide insight into the maximum allowable share of IRESs in the total energy mix and how this share changes dynamically as a function of increasing minimum EROI targets.
2. Materials and Methods
The key metric utilized in this context is the EROI (Energy Return on Investment). It represents the ratio between the amount of usable energy (
) produced by a power plant over its operational lifetime and the total amount of energy invested (
) to make that energy available:
In the current work, the EROI values for each energy generation technology were taken from [
12,
13], which are considered as providing the best estimates available in the literature. The evaluation of EROI assumes that the entire energy system is based on the given technology. This includes accounting for the necessary energy storage, such as the pumped hydro storage, for technologies that require it, namely intermittent renewable energy sources (IRESs) such as wind and photovoltaic (PV) solar, as well as hydroelectric plants. The authors of the aforementioned studies relied on the following principles:
Strict exergy usage only: In order to maintain reliable comparability, nonexergetical components such as waste heat were omitted for power plants, as some types of plants (wind and photovoltaics) provide electricity exclusively.
No quality weighting of the output: Only the unweighted electricity production was considered.
No quality weighting of the input: Where possible, only the unweighted amount of exergy used was taken into account.
Considering input as is: Theoretical values were avoided in favor of real measured values.
Discarding fuel energy content: The calculations included the exergy spent on extracting the fuel and that which is obtained by burning it and converting the combustion heat in a thermodynamic engine (rather than the raw energy content of the fuel itself).
Usage of physical inputs only: Only exergy flows were considered. This was implemented by summing all relevant inputs from all significant areas and processes, which is also known as bottom-up analysis.
Treat recycling as it is: The analysis used actual material inventories, which already include recycled fractions, omitting the assumptions mentioned above.
System borders and auxiliary facilities: Auxiliary facilities, such as storage units, mining sites, as well as material inventories and exergy flows, related to the power plant were included in the system. However, infrastructure such as the production of mining machinery or lubricants were not considered because they have a negligible impact.
Additionally, it was assumed that the power plant must not only produce electricity, but that it must also ensure that its output satisfies societal demand, so unpredictable volatility must be eliminated by buffering (e.g., in the case of wind and solar farms). All data and calculations performed in the studies [
12,
13] used in the current analysis were compiled in a publicly accessible table that is continuously updated [
23].
Furthermore, the energy outputs of the IRES technologies were evaluated under the conditions of Central Europe (mid-latitudes); in particular, for wind technology, a full-load equivalent of 2000 h was assumed, corresponding to very favorable wind conditions. The EROI values for each technology are presented in
Table 1 and represent the ones used in the current study.
The literature includes attempts to estimate the minimum EROI (
) required for an energy system to support positive economic growth, the functioning of a developed society, and a high quality of life. These values
have been estimated at 10 [
12,
13], 20 [
11], and 30 [
18], respectively. In the present study, these thresholds were used to assess the energy mix that—particularly the acceptable share of IRESs—ensures that the overall EROI remains above the minimum required level.
To estimate the possible share values of individual technologies in the energy mix,
, which ensure the EROI remains above a minimum threshold, the following system of equations and inequalities can be used:
where
. The system of Equations (
2)–(
4) represents a 7-dimensional space and is underdetermined. To reduce its dimensionality, allowing both a graphical presentation of results and the derivation of specific solutions, the system was simplified to include only three variables. This reduction was performed in a way that preserves the main assumptions of the present study.
Specifically, IRES technologies were grouped together, assuming an equal share of PV solar and wind in the system. Furthermore, given the very similar EROI values for biomass and wind, it was assumed that . This does not necessarily imply the absence of biomass in the energy mix; rather, in terms of EROI, it can be considered functionally interchangeable with wind.
Furthermore,
was assumed, as the analysis focuses on mid-latitude regions. The average EROI values for the Combined Cycle Gas Turbine (CCGT), Coal Power Plant (CPP), and Hydro Power Plant (HPP) were also used due to their similar EROI values and their common role in providing inertial stability to the power system. The combination of CCGT, CPP, and HPP is, in this article, denoted as FFW (Fossil Fuels and Water). The final reduced system of equations takes the following form:
where
is the EROI value of IRESs (average value of EROI of PV and wind);
is the average EROI value of CCGT, CPP, and HPP; and
is the EROI value of NPP (Nuclear Power Plant). Finally, the remaining independent variables, which describe the share of considered technology, are
, respectively.
The system of Equations (
5)–(
7) can be solved parametrically by setting
, which ultimately results in the following:
The parameterization of
in the system of Equation (
8) means that, for each assumed share of IRESs in the energy system, the corresponding values of
and
will be evaluated to determine whether they can ensure
is met. It should be noted that, regardless of whether
or
is used as the parameter instead of
, as in (
8), the same results will be obtained.
The equations below show the alternative form of the system when setting
or
as a parameter:
and
The main reason for showing results with different variables as parameters is for visualization purposes. Setting
,
, or
places IRESs, FFW, or NPP on the horizontal axis, respectively.
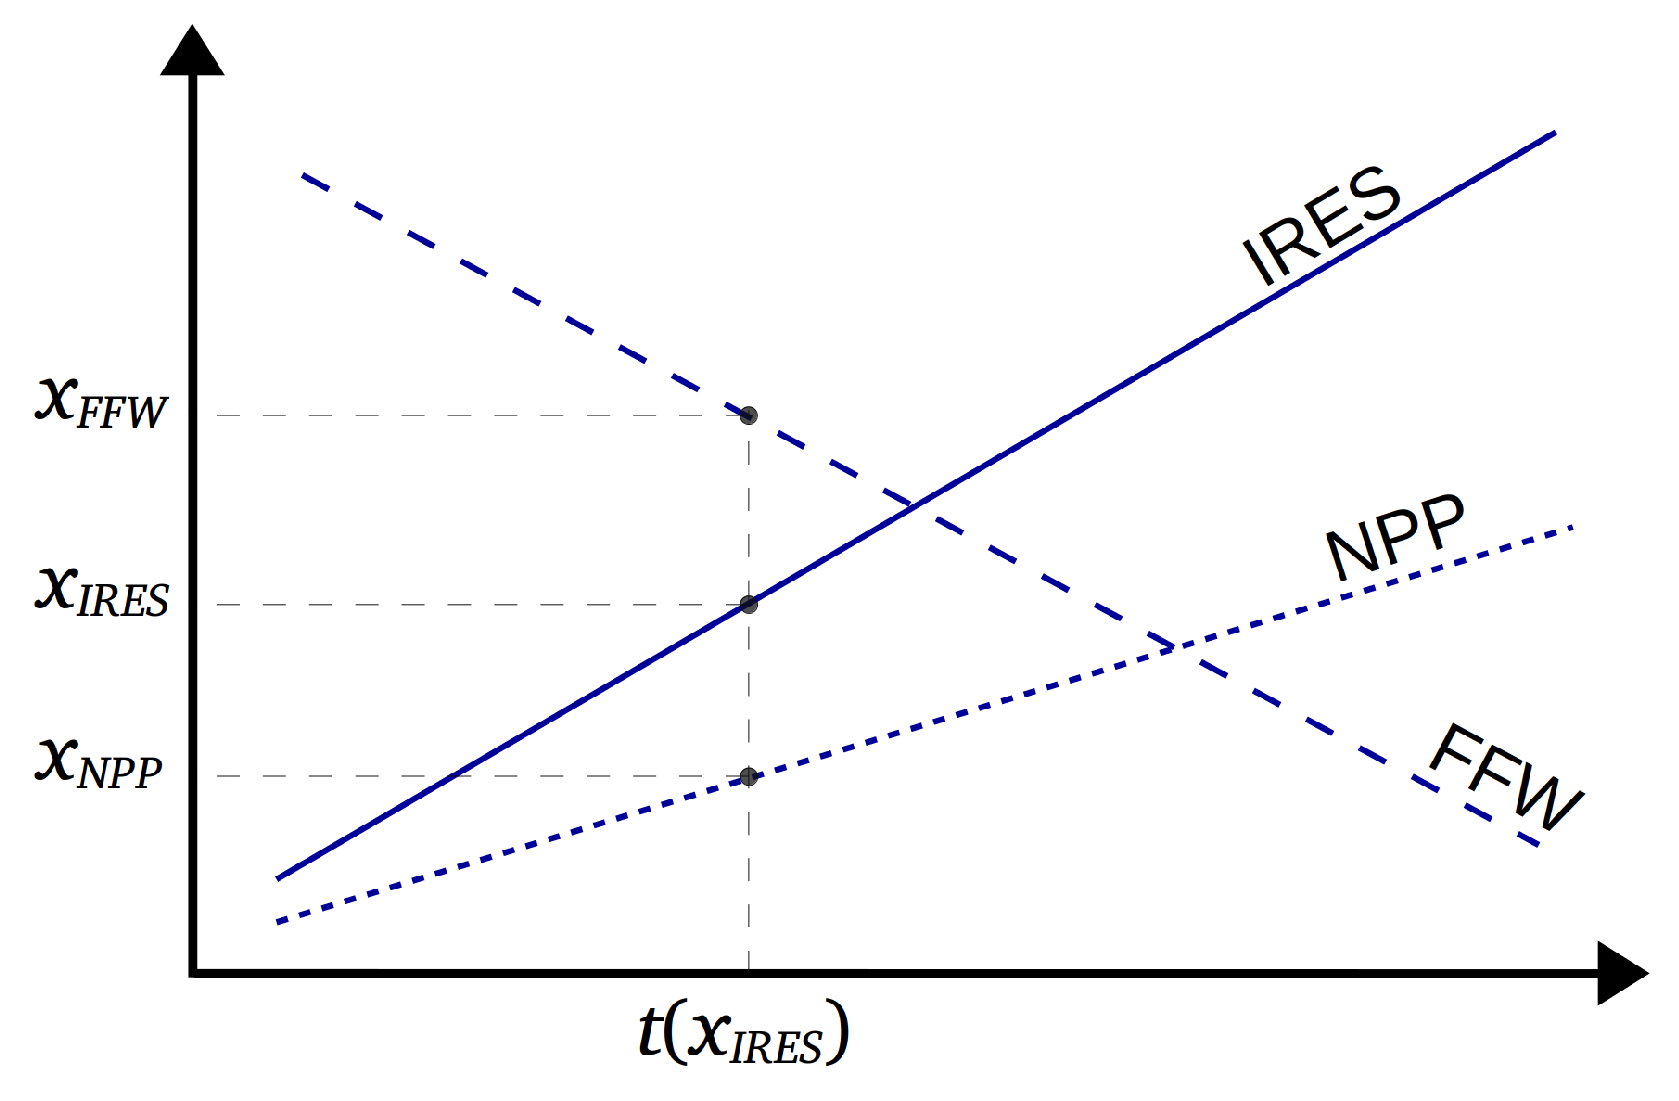
Figure 1 schematically illustrates the solution of the proposed model and explains how to interpret its results. The figure presents a schematic solution for the system of Equation (
8), in which the parameter is
and the solution consists of the shares of the remaining energy generation technologies:
and
.
3. Results and Discussion
Figure 2,
Figure 3 and
Figure 4 present the results of the analysis of possible energy mixes that satisfy Equations (
8)–(
10) for different values of EROI
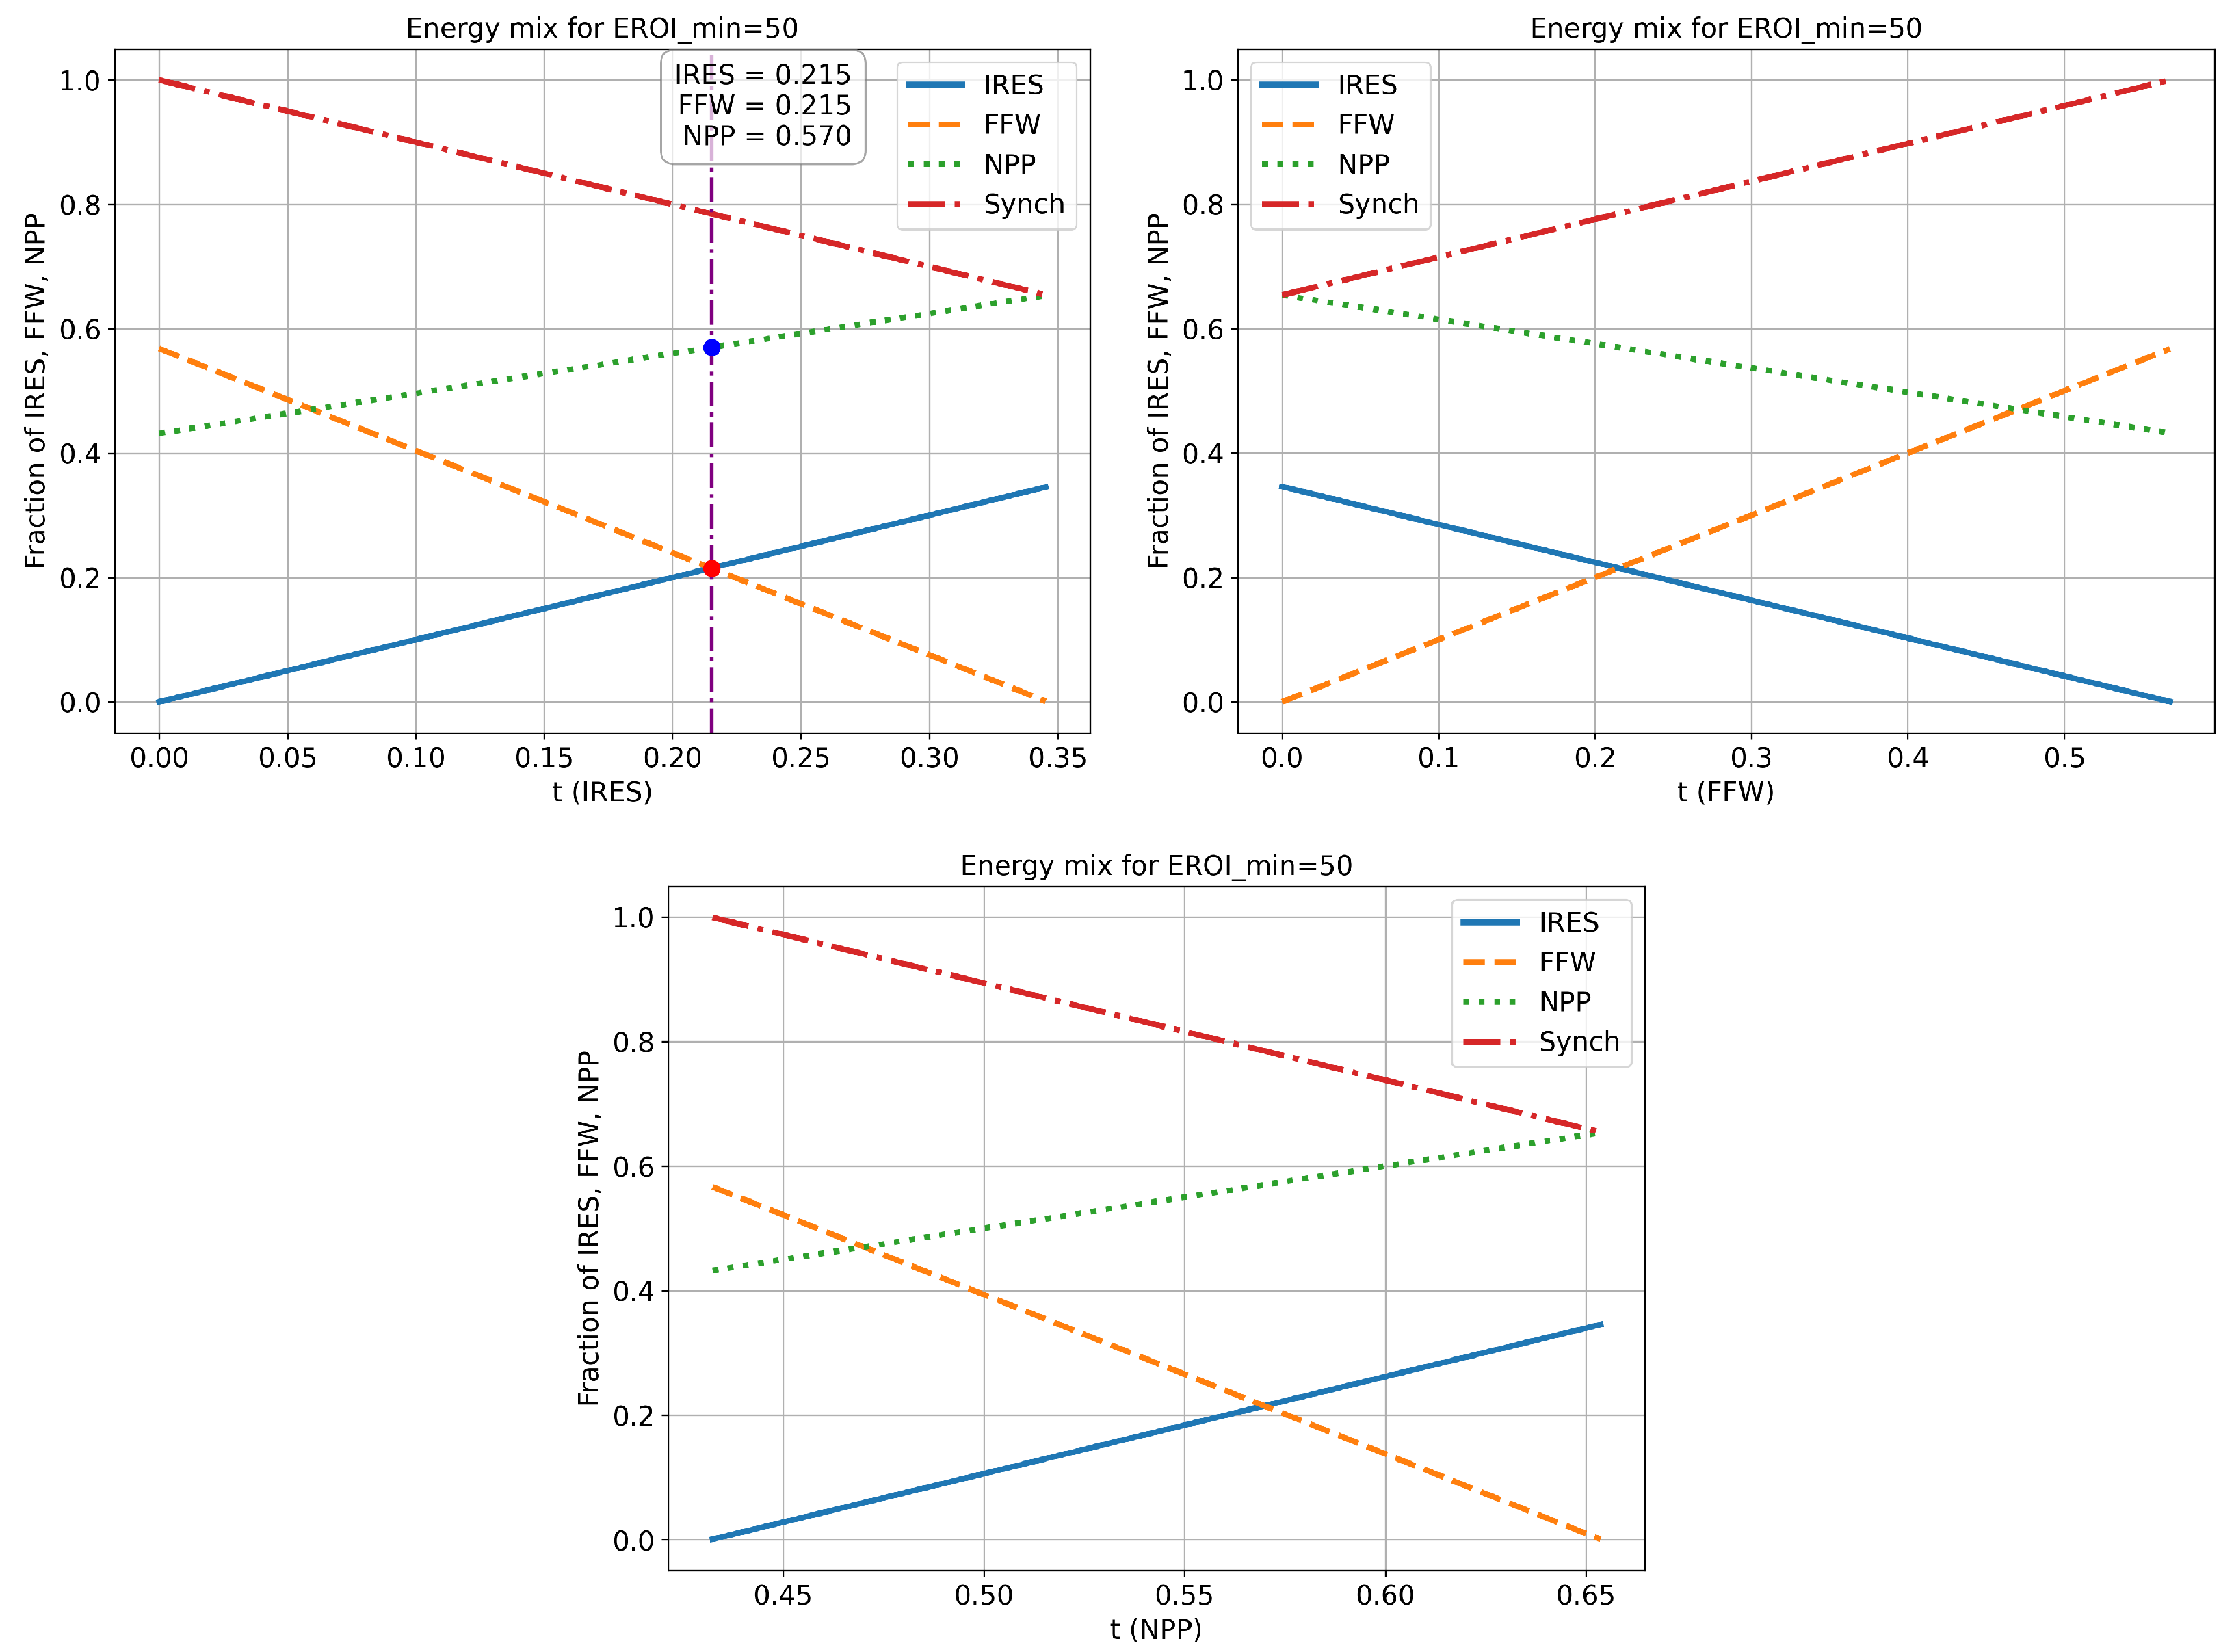
min, which are equal to 10, 15, 30, and 50, respectively. The horizontal and vertical axes represent the shares of individual generation technologies that, at any given point along the horizontal axis, sum up to 1, corresponding to 100% of the energy mix.
Each plot shown in
Figure 2,
Figure 3 and
Figure 4 show the solution to the corresponding system of Equations (
8)–(
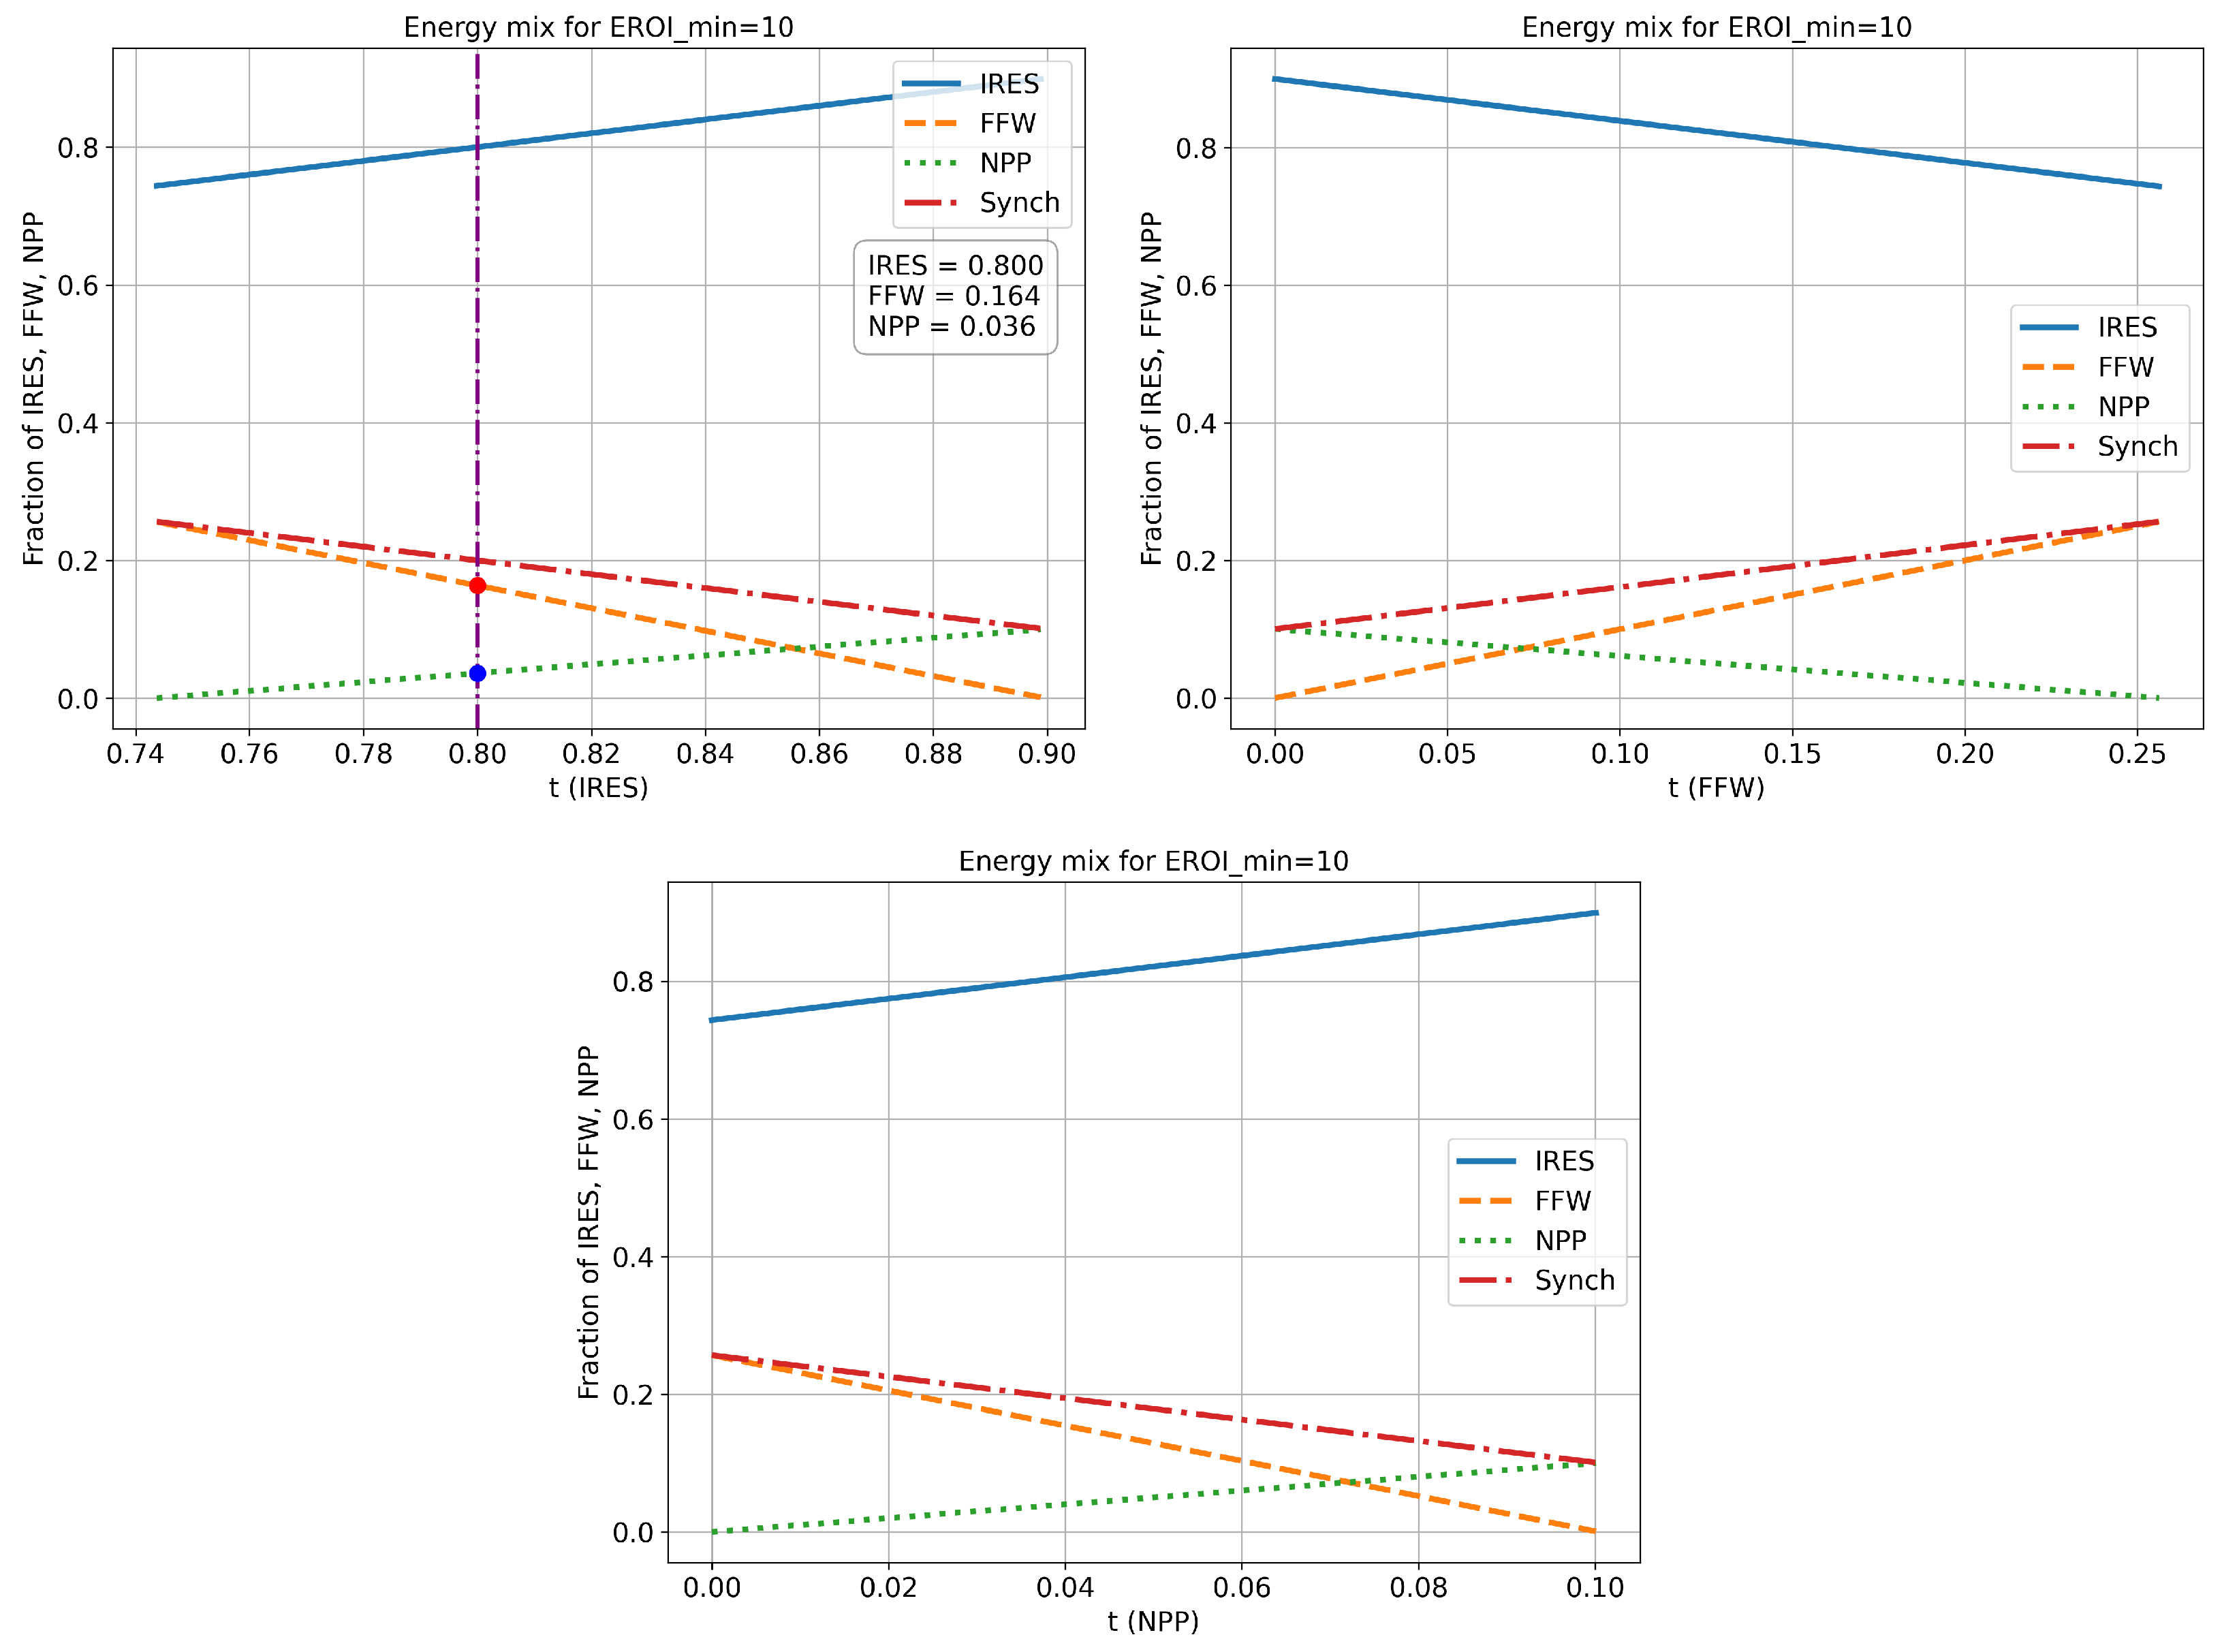
10), and they have, on their horizontal axes, the adequate parameter variable: IRESs, FFW, or NPP. Although each plot presents the same underlying results, they visualize the data differently to improve readability and interpretation. In the results shown in the first graphs, selected example solutions are also shown to illustrate how to read the results. For example, in
Figure 2, a vertical dashed line indicates the results of an energy mix consisting of IRESs = 0.8, which intersects the FFW curve at a value of 0.164 and the NPP curve at 0.036. This means that the energy mix consists of 80% IRESs, 16.4% FFW, and 3.6% NPP.
Table 2,
Table 3,
Table 4 and
Table 5 provide a statistical summary, including the minimum and maximum shares of each generation source.
In the case of EROI
min = 10, as shown in
Figure 2 and
Table 2, the energy mix may consist predominantly of IRESs, whose share ranges from 74% to 90%. However, maintaining a continuous electricity supply with a 90% share of IRESs appears to be infeasible under current technological and systemic constraints. This is the case because, for this configuration, the share of FFW is close to zero, and raising the EROI value above the minimum is achieved through an NPP share of around 10%. As can be seen, this system does not assume the existence of FFW plants that could serve as backup power plants that duplicate IRESs, but instead requires a practically unattainable amount of large-scale and long-duration energy storage [
24].
Even the solution in which IRESs have their minimum share of 74% is difficult to implement because, as practice shows, this leads to frequent disconnections of IRESs for safety reasons [
25,
26]. Another critical issue is the high risk of blackouts resulting from the absence of synchronous generators with inertial response, which are essential to maintaining grid frequency stability.
In 2023, researchers and experts issued warnings about the potential for a blackout in Spain due to factors related to grid stability [
27]. Subsequently, on 28 April 2025, the largest blackout in European history occurred, affecting a large part of Spain and some of Portugal. The inability to actively counteract this blackout may have been caused by a significant reduction in synchronous generation sources [
28].
All of the above, along with the overestimation of the energy production from IRESs due to surface contamination (e.g., dust and ice) [
29,
30], efficiency losses that were caused by mutual aerodynamic interference between wind turbines [
31,
32] and prolonged periods of simultaneous low solar and wind availability [
33] suggest that the actual EROI of IRESs at such high share levels may be even lower than the estimates used in this study.
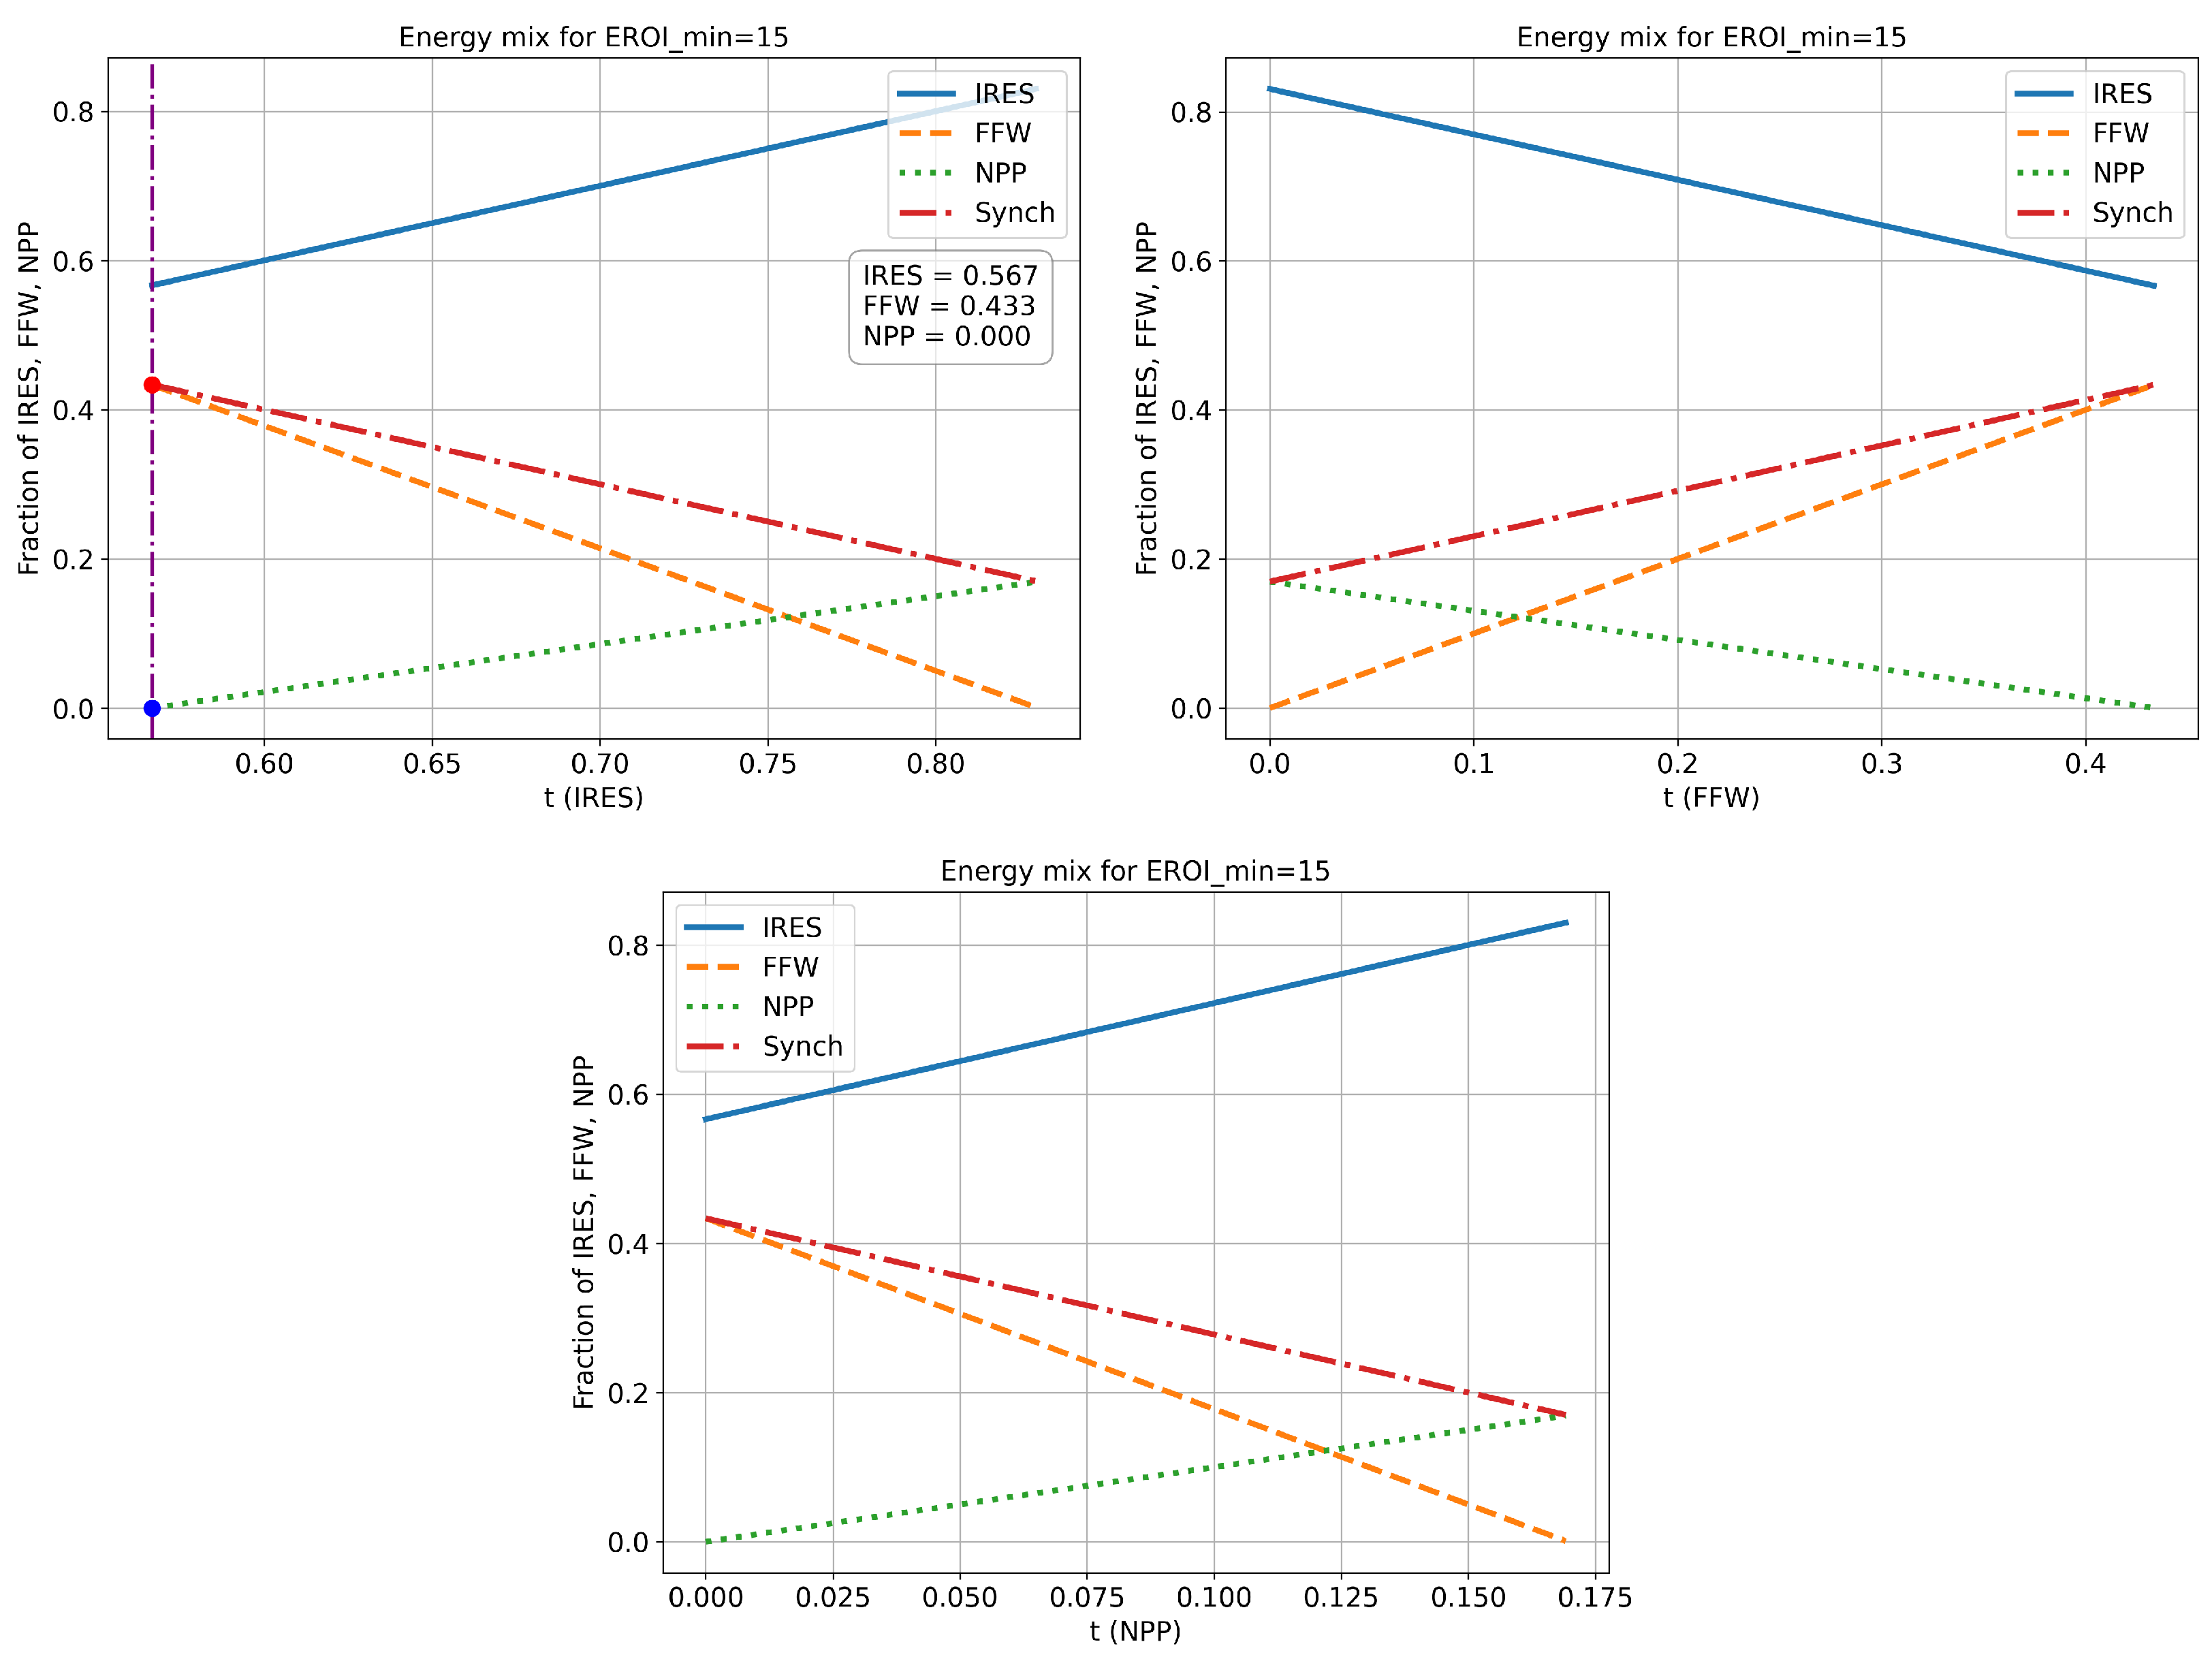
Figure 3 and
Table 3 present the results for the case in which the energy mix is required to ensure a minimum
. As mentioned in the introduction, this threshold appears more frequently in the literature than a value of 10, and it is often considered necessary for the functioning of developed societies.
In this scenario, the share of IRESs ranges from 57% to 83%. For reasons similar to those discussed above, it should be concluded that a more favorable and feasible solution would involve IRES shares near the lower end of this range. It should be noted that for , the contribution of nuclear power becomes apparent, reaching up to 17%. Of course, a scenario without nuclear power (NPP = 0), which is shown as an example solution in the first graph, is still possible; however, in such a case, the remaining synchronous sources would need to cover up to 43% of the total mix.
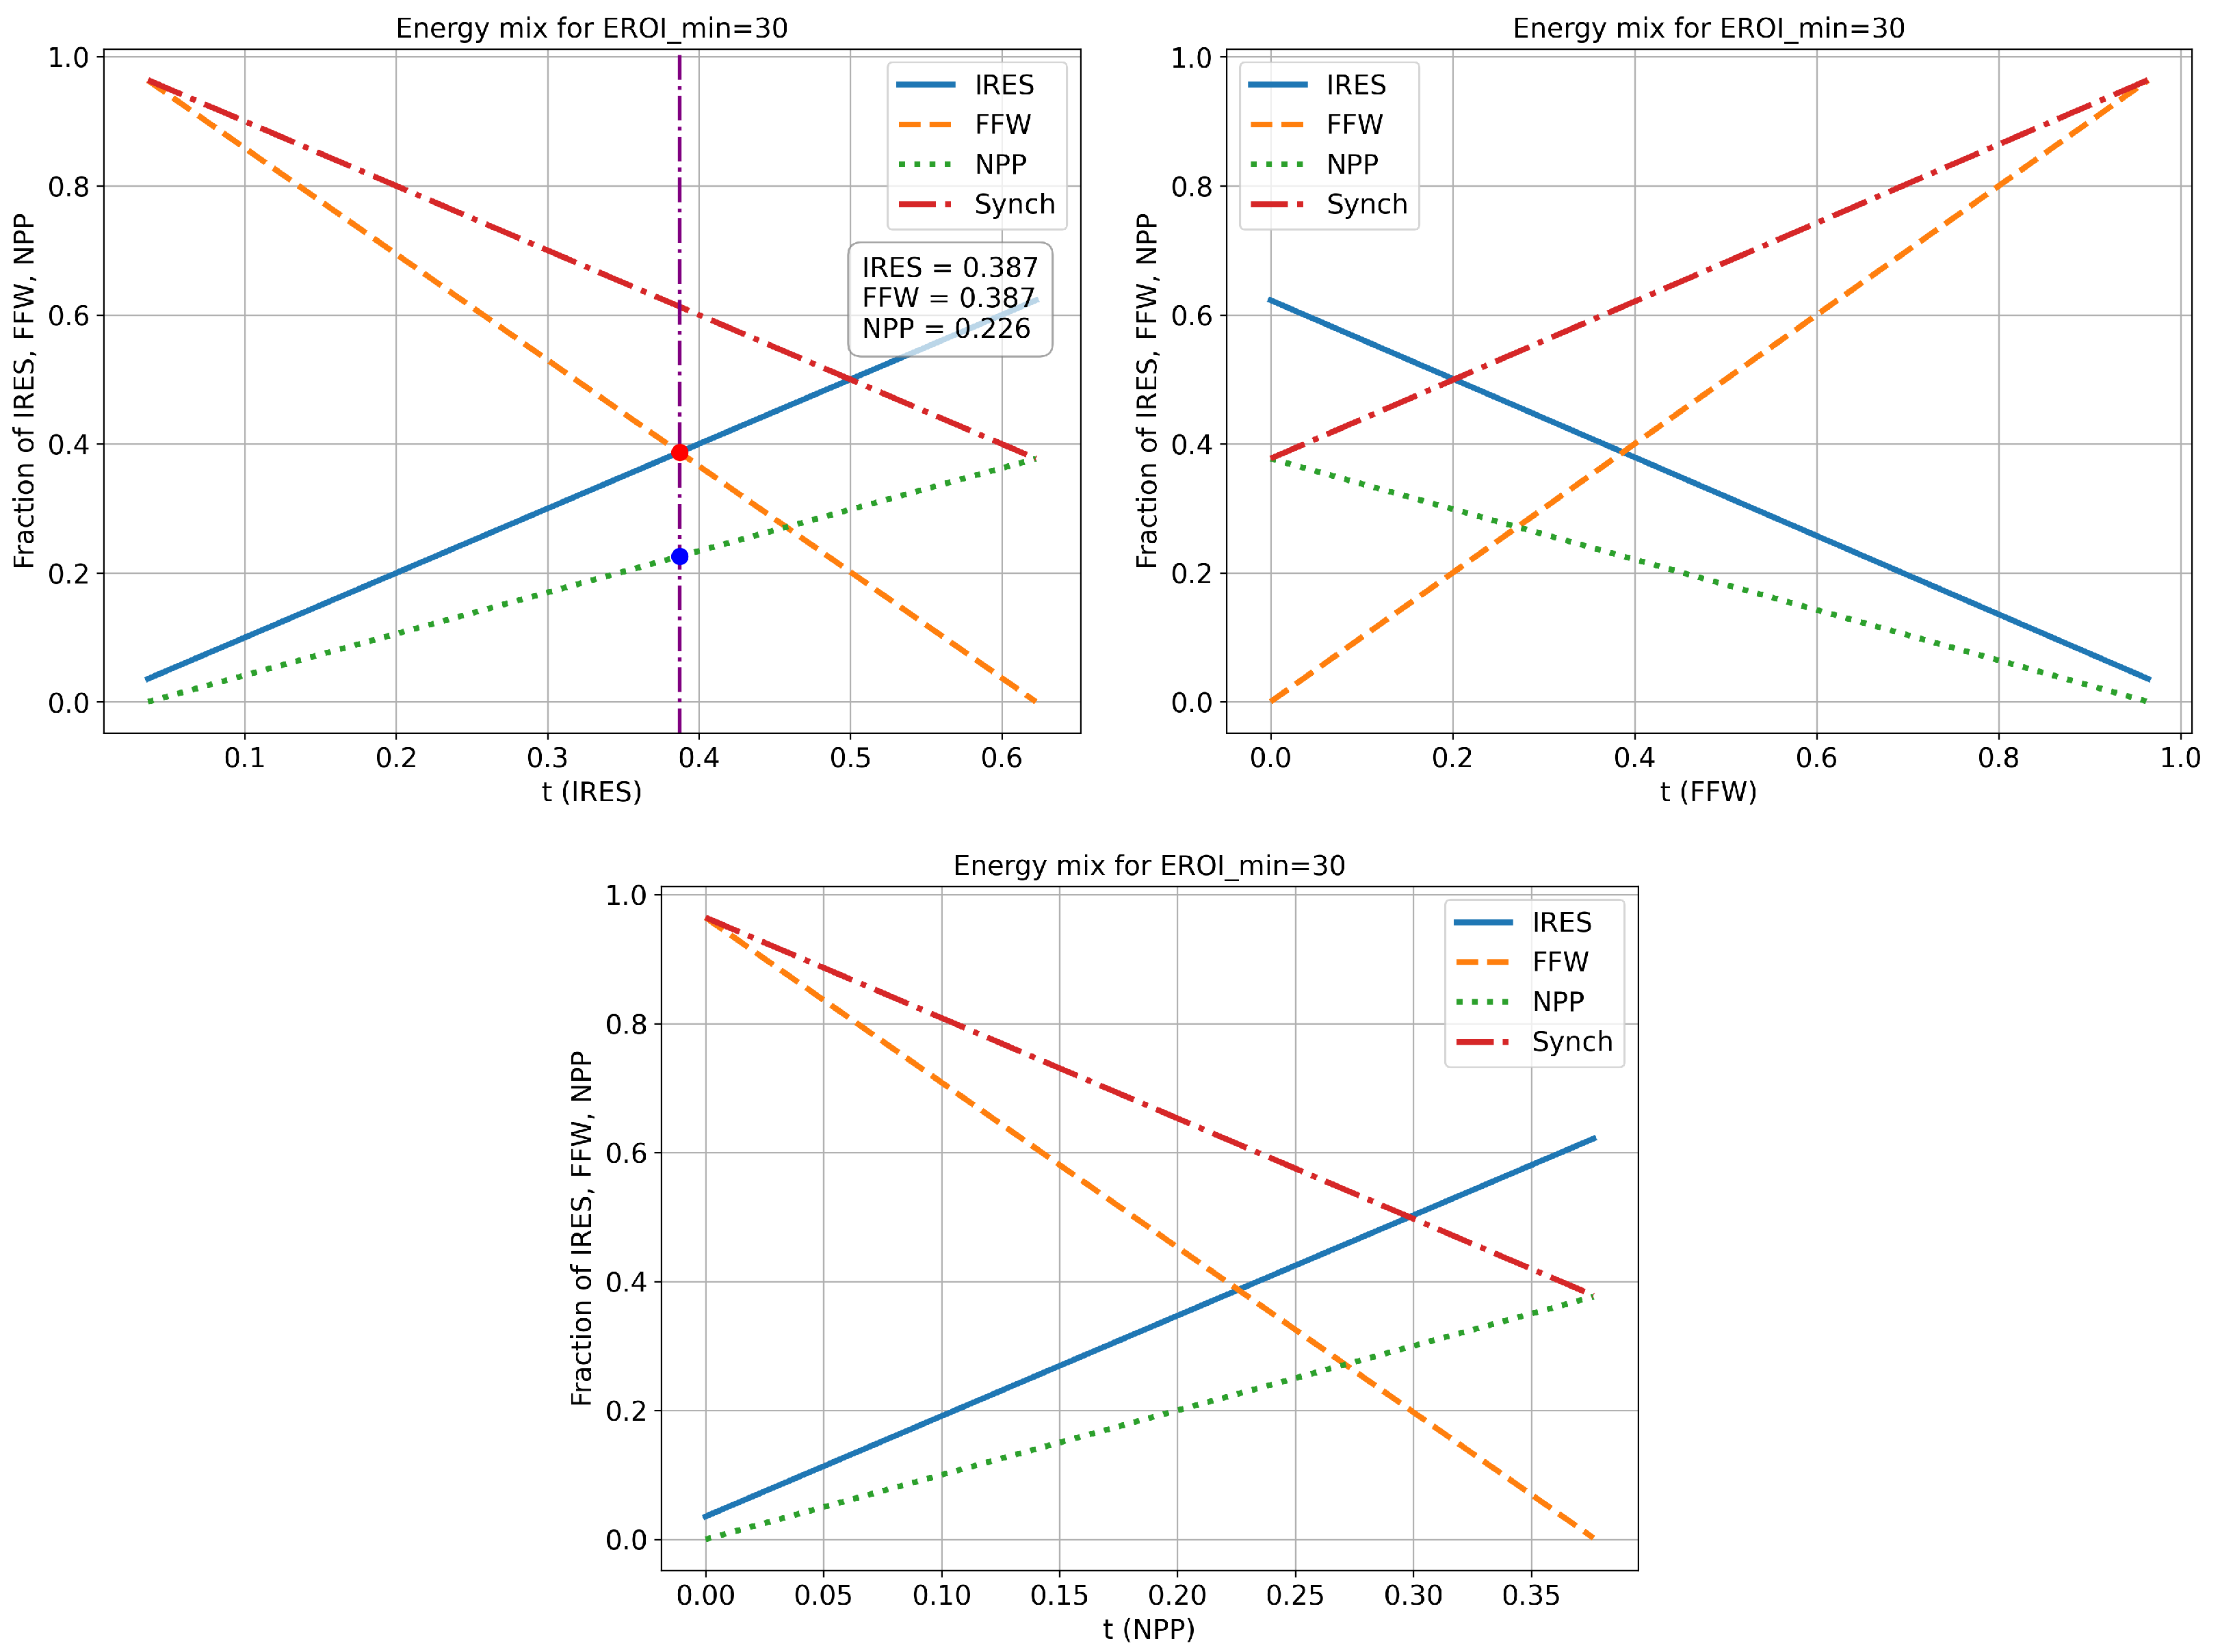
Figure 4 and
Table 4 present the results for the case in which the energy mix is required to ensure
. This value already appears relatively high, but it is important to note that these levels of EROI—and even higher—were achieved during the industrial revolution of the 20th century and are still considered the threshold to ensure a high quality of life [
18,
34]. As an example solution of the energy mix shown in the first graph, a configuration was selected in which the share of IRESs is equal to that of FFW and amounts to 38.7%. This is an important case because, in analyses examining the stability of an energy system with significant penetration of IRESs, it is assumed that it should be backed up by an equivalent share of installed capacity in fast-starting conventional power plants. It should be noted that, for this system, the share of NPP should be 22.6%.
It should be noted that a relatively high EROI level can still be achieved while maintaining IRESs at approximately 62% of the energy mix. Alternatively, a more balanced mix can be pursued, with nuclear power contributing around 22%, IRESs a little below 40%, and stable sources of FFW at a level similar to IRESs. Such a proportion of the fast-starting dispatchable system that matches the share of IRESs should help ensure stable operation of the power grid [
33].
Figure 5 and
Table 5 present the results for the case in which the energy mix is required to ensure
. This value may seem very high, but it is important to note that these levels of EROI were historically achieved by highly developed countries during periods of rapid industrial growth based on easily accessible fossil fuels [
34]. As an example solution, as in the previous case, an energy mix was selected in which the shares of IRESs and FFW are at the same level and in this case equal to 21.5%. For this configuration, the share of nuclear power plants must be at the level of 57%.
According to the literature referenced in this study, such high EROI values for the entire energy system can only be achieved today by ensuring a sufficiently high share of nuclear power in the energy mix, ranging from 43% to 65%. At the same time, the maximum possible share of IRESs under these conditions is limited to no more than 34.5%.
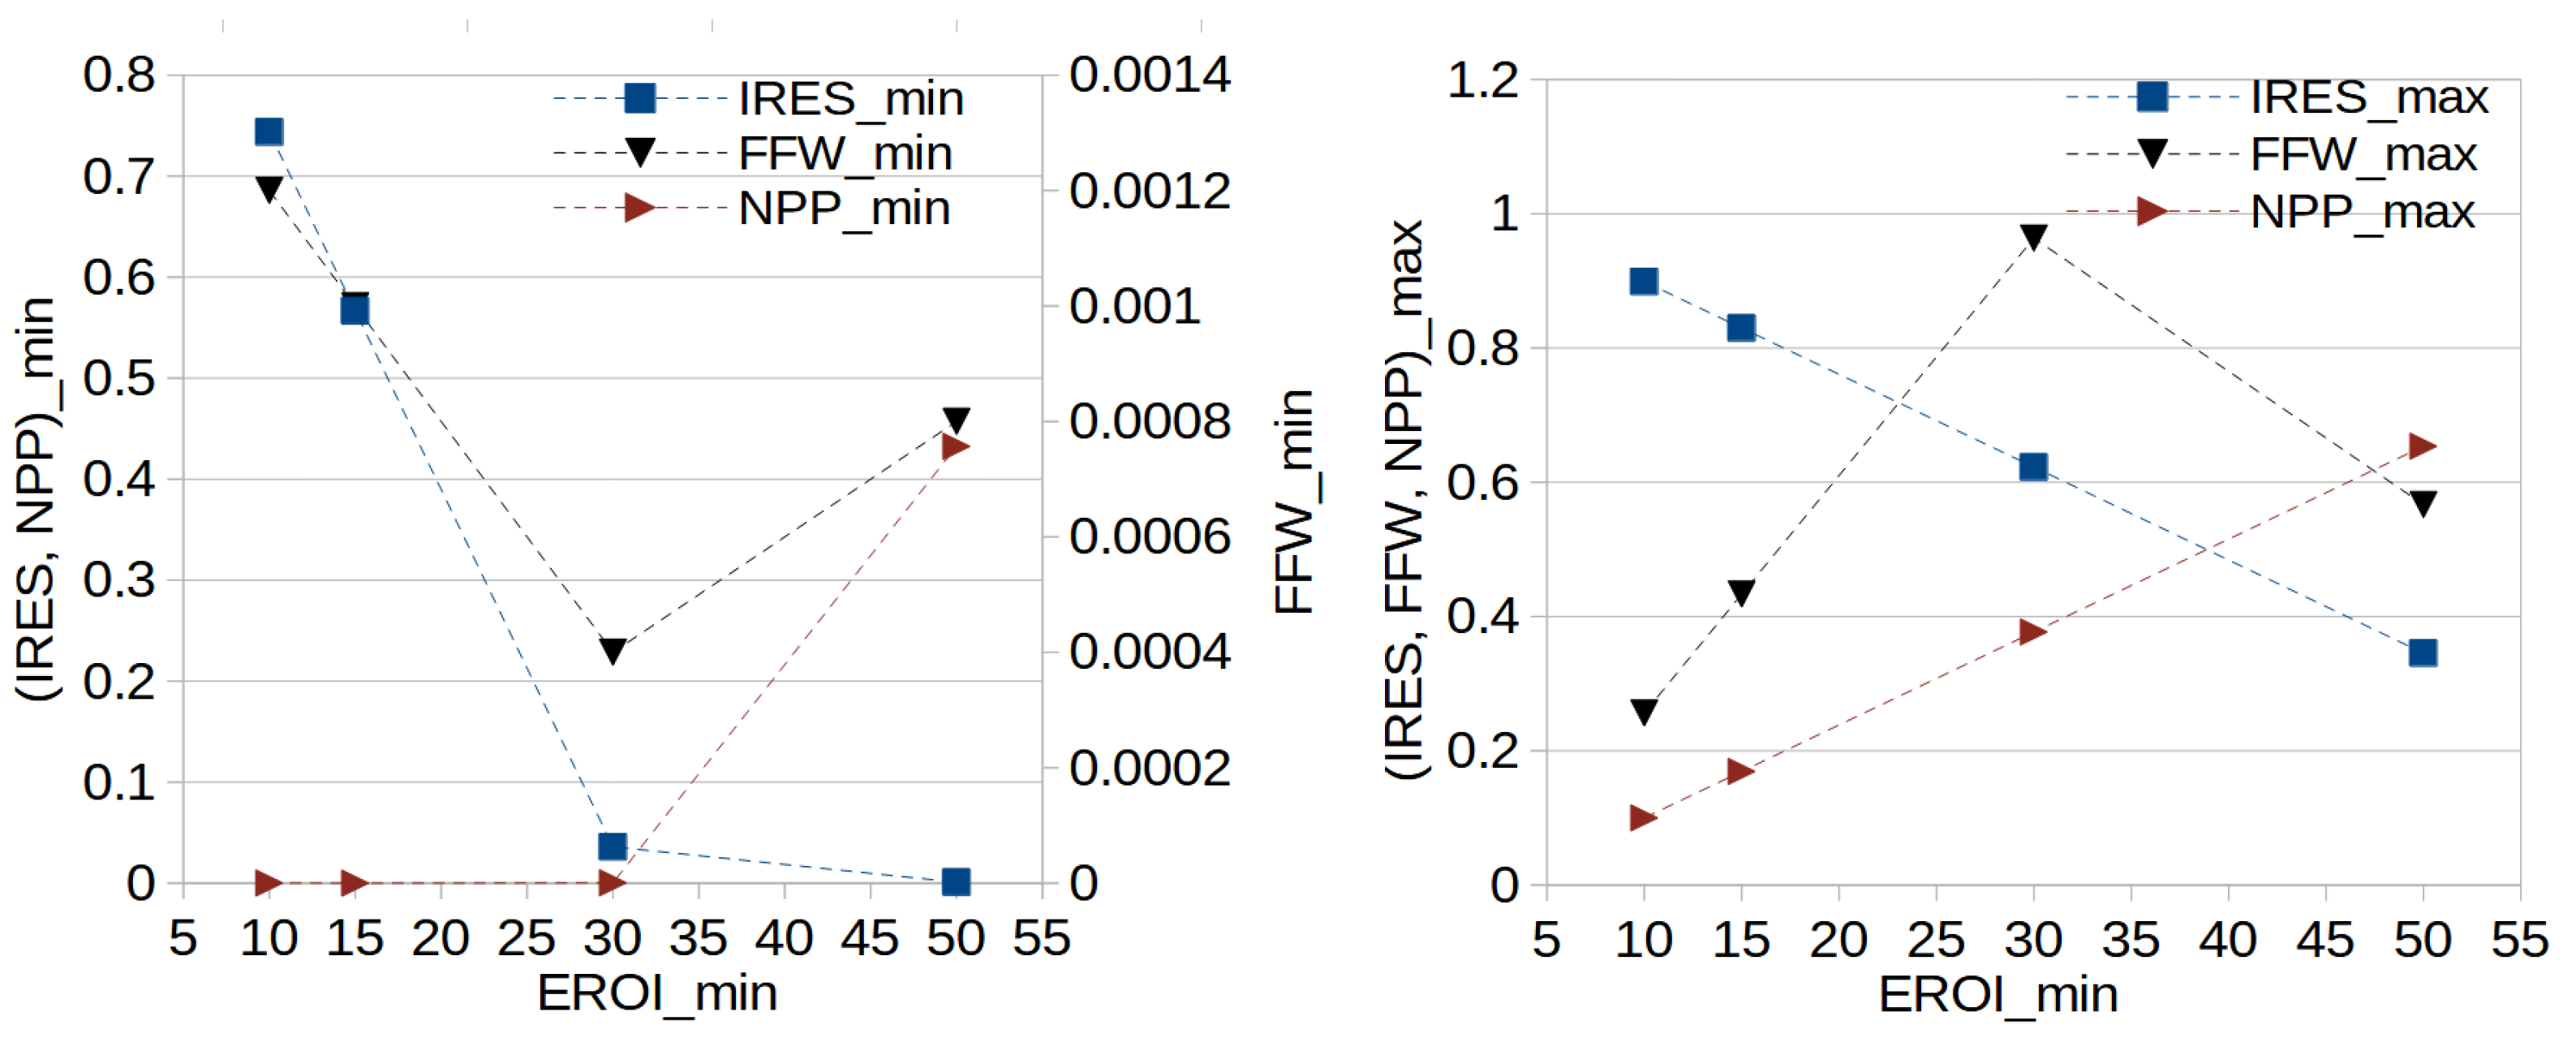
Figure 6 provides a statistical summary of the results presented in
Table 2,
Table 3,
Table 4 and
Table 5, showing how the minimum and maximum shares of individual generation sources in the energy mix change as a function of
. In particular, there is a clear downward trend in both the minimum and maximum shares of IRESs as
increases. In the right panel, which displays the maximum shares of each generation source, it can be seen that the decrease in IRESs is compensated by increasing the shares of FFW and nuclear power, but only up to
. Beyond this point, only a sufficiently high share of nuclear energy can ensure a
of 50.
4. Conclusions
The study presented in this article investigated the minimum Energy Return on Investment () of the energy mix required to maintain the functioning of complex modern societies and explored the implications of this threshold for future energy system design. To address this issue, the analysis in this study focused on the composition of the energy mix, with a particular emphasis on the shares of individual energy sources required to ensure that the overall system meets or exceeds .
The results of this study have practical implications for the design and implementation of energy systems. Firstly, the findings challenge the feasibility of achieving very-high (e.g., 90%) shares of Intermittent Renewable Energy Sources (IRESs) if maintaining a robust system-wide EROI is a social imperative. Even for an EROI sufficient for developed societies, the maximum share of IRESs may be significantly constrained. This necessitates a reevaluation of energy transition roadmaps that prioritize IRES dominance, emphasizing instead the critical, inherent value of dispatchable and synchronous generation capacity from sources like nuclear power (NPP) and hydro/fossil fuel-based plants (FFW) for grid stability and reliable energy supply.
The real-world challenges of large-scale, high-EROI energy storage and the documented risks of blackouts in systems with reduced inertia underscore that the true cost of intermittency extends far beyond simple levelized cost of energy (LCOE) calculations, leading to degradation of the effective EROI of the entire system at high IRES penetrations.
Politically, these results imply the need for a more nuanced and honest discourse on the energy transition plan. Policymakers must move beyond a singular focus on decarbonization and recognize EROI as a fundamental coequal design criterion for a sustainable energy future. This involves challenging the politically popular but potentially unrealistic narrative of “100% renewables” and instead advocating for strategic investments in a diverse energy portfolio. Political courage will be required to avoid premature decommissioning of existing high-EROI, dispatchable assets and to support the expansion of technologies like nuclear power, even if they face historical public perception challenges, given their crucial role in securing high system EROI and grid resilience (especially for societies aiming for advanced economic activity and quality of life).
To maintain a high system EROI during the energy transition, a multifaceted strategy is essential. This includes prioritizing a balanced energy mix, as suggested by this study, where IRES shares are strategically integrated but do not exceed the 40–50% range and are complemented by a robust backbone of stable, high-EROI and synchronous sources, such as nuclear, hydropower, and fossil fuel. In parallel, substantial investments are needed to develop truly high-EROI, long-duration energy storage solutions to bridge intermittency gaps without significantly diluting the overall system EROI. It is also important not to forget that energy efficiency measures can reduce the overall demand for energy, effectively increasing the net energy available to society.
Beyond the current findings, the analysis performed in this study highlights several crucial avenues for future research to deepen the understanding of sustainable energy transitions. One key direction is to develop integrated modeling frameworks that combine EROI calculations with essential grid stability metrics, such as inertia and transient response. Such models could explicitly quantify the energy investment required for grid support technologies like synchronous condensers and grid-forming inverters, thereby offering more actionable EROI thresholds for highly integrated intermittent renewable energy systems.
Furthermore, future research should explore the dynamic evolution of EROI values over time, taking into account technological advancements, resource availability, and the changing demands of complex societies. This includes detailed EROI assessments of long-duration large-scale energy storage solutions beyond traditional pumped hydro to understand their true net energy contribution to high-IRES scenarios. Finally, the analysis should be expanded to include region-specific EROI assessments.


