Abstract
The performance of the turbine in a variable geometry turbocharger (VGT) may be affected by changes in the vane operating angle and heat transfer loss during operation. However, existing studies have been conducted under the assumption of an adiabatic process. In this study, we investigated the effect of heat transfer between all working fluids and a VGT structure when using computational fluid dynamics to evaluate turbine performance. Through this study, we confirmed that when heat transfer was considered, the turbine efficiency decreased by approximately 2–6%, depending on the vane position angle change, compared to when heat transfer was not considered. In addition, the total entropy production ratio, which represented the flow loss in the turbine during operation, increased by approximately 0.2–0.5% when heat transfer was considered. In conclusion, the findings confirmed that the heat transfer phenomenon directly affected the efficiency and flow loss during the turbine performance evaluation process.
1. Introduction
A turbocharger is a device that uses exhaust gas energy to drive a compressor by using the rotational force obtained through a turbine to improve the performance and fuel efficiency of an internal combustion engine. Therefore, the performance of the turbine in a turbocharger directly affects the engine’s efficiency. Recently, to maximize the efficiency of turbochargers, a variable geometry turbocharger (VGT) with variable vanes that could change the vane position angle during operation has been applied not only to large diesel engines with relatively low exhaust gas temperatures but also to small gasoline engines with relatively high exhaust gas temperatures [1,2,3,4,5,6,7,8,9,10]. When such a VGT is applied to a small gasoline engine, a performance evaluation, including the heat transfer loss occurring among the VGT and the surrounding atmosphere and working fluid, is necessary for improving turbine performance. In addition, in the case of a VGT turbine, the vane position angle during operation determines the inflow direction along with the flow rate of the exhaust gas supplied to the turbine impeller; therefore, VGT performance evaluation according to the change in the vane position angle is also very important. However, existing studies on VGTs have primarily analyzed the turbine performance change only for a specific vane position angle while ignoring the loss owing to heat transfer [8,11]. Therefore, studying how changes in the vane operating angle and heat transfer loss during operation affect the performance of the VGT is necessary.
In this study, we closely investigated the effect of heat transfer on the turbine performance evaluation process through conjugate heat transfer analysis by considering the heat transfer phenomenon between all working fluids and all components of the VGT applied to a 1.5L gasoline engine that emits exhaust gas at a higher temperature than a diesel engine. To this end, a computational thermal-fluid comparison analysis of the VGT considering adiabatic and nonadiabatic conditions was performed, and the effect of heat transfer inside the turbine on the efficiency was quantitatively evaluated. Finally, the efficiency and flow characteristics according to the change of the vane position angle were analyzed to quantitatively identify the effect of heat transfer on the turbine performance evaluation process.
2. Computational Flow Dynamics (CFD) Model and Boundary Conditions
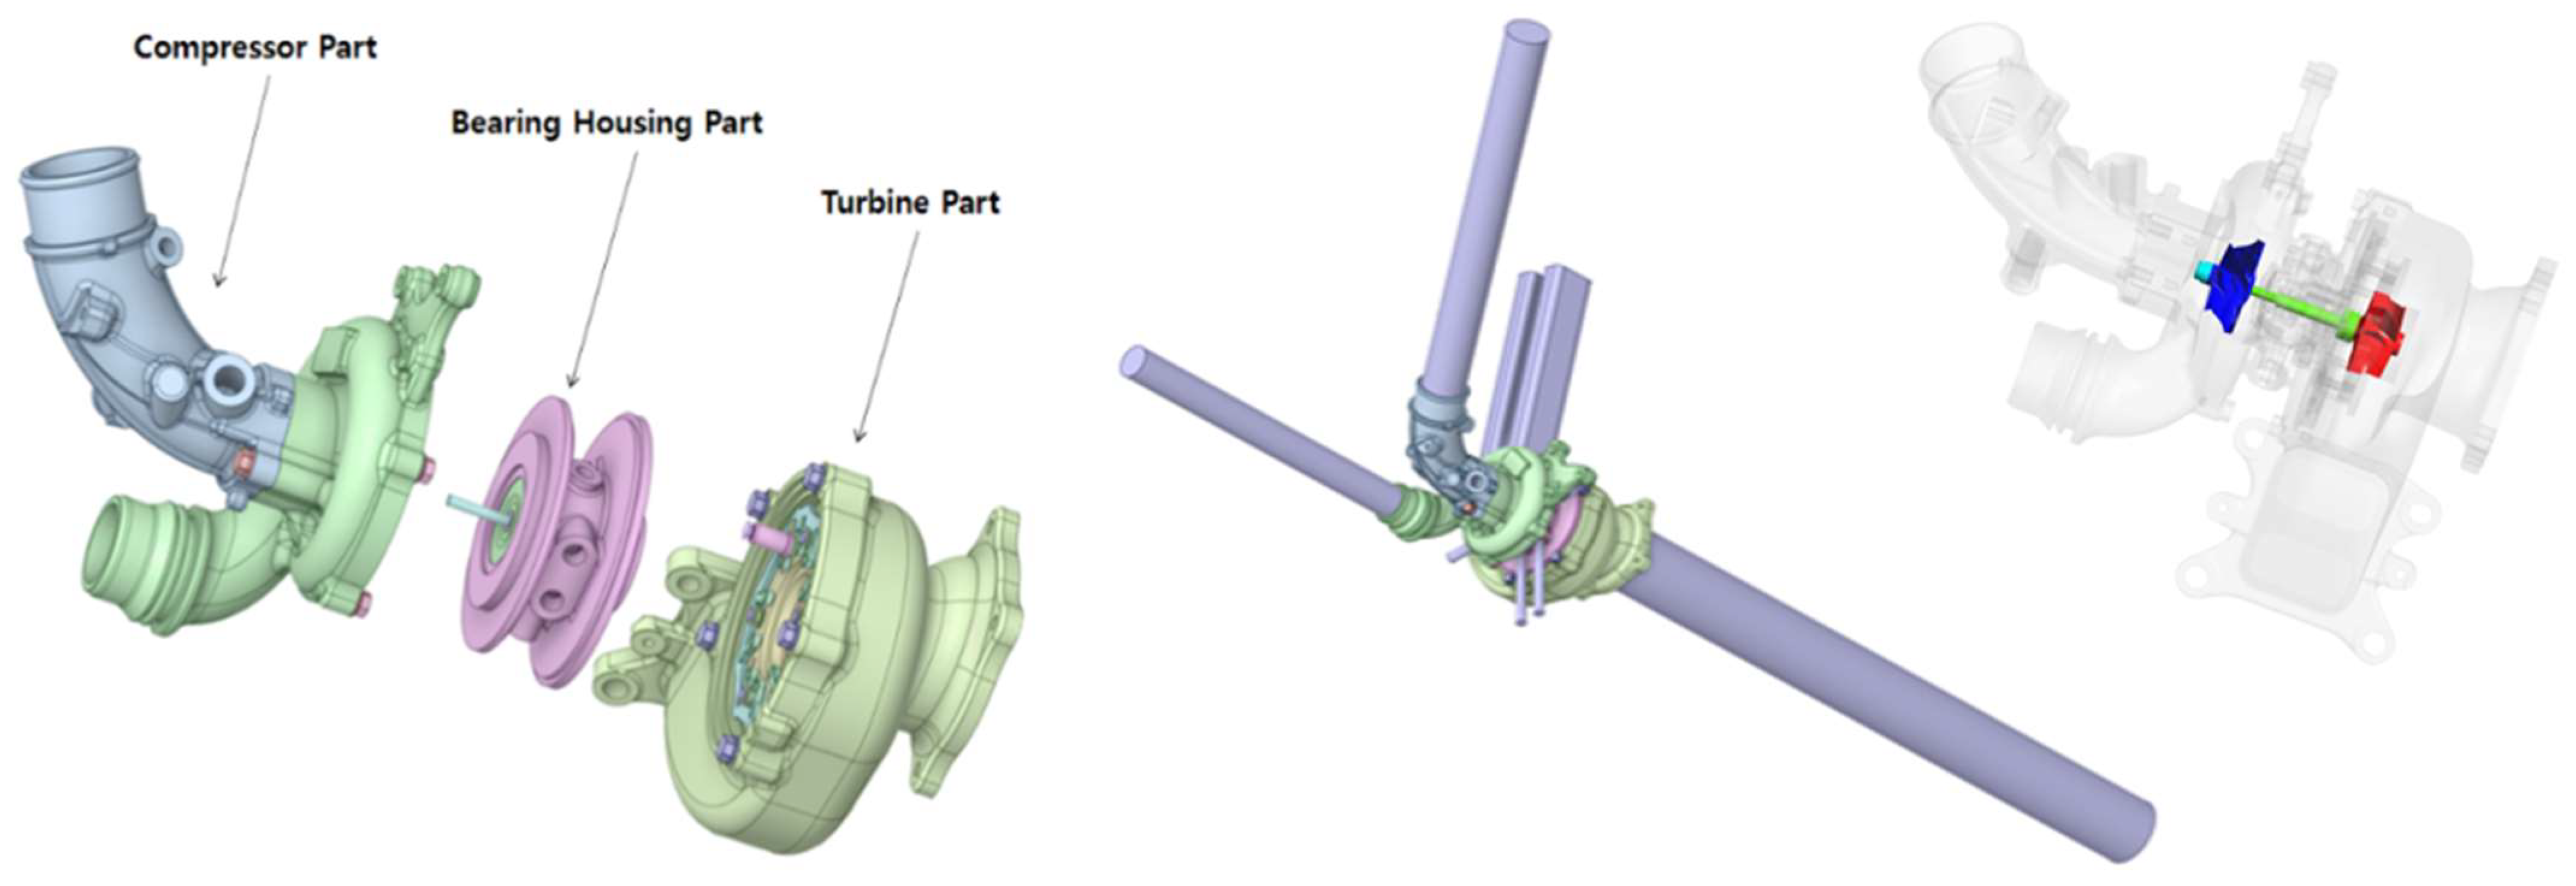
A conjugate heat transfer (CHT) analysis was performed using Ansys CFX to evaluate the performance of the VGT, including heat transfer losses between the VGT and the surrounding atmosphere and working fluid. Figure 1 shows the VGT used for the analysis, where the solid part consists of three parts: the compressor, the bearing housing, and the turbine. The compressor consists of 20 parts, including the impeller (outer diameter = 49 mm), and the bearing housing consists of 33 parts that comprise the bearing, the oil passage, and the coolant passage. The turbine consists of 40 parts, including a turbine impeller (outer diameter = 43 mm) and 10 vanes. The fluid part consists of four parts: the air passage to the compressor, the hot exhaust gas passage to drive the turbine, the coolant supply passage to cool the VGT during operation, and the oil supply passage to lubricate the rotary shaft connecting the turbine and compressor impellers.
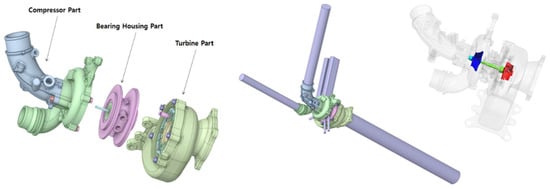
Figure 1.
VGT 3-D solid model (left side) and overall analysis model including flow field (right side).
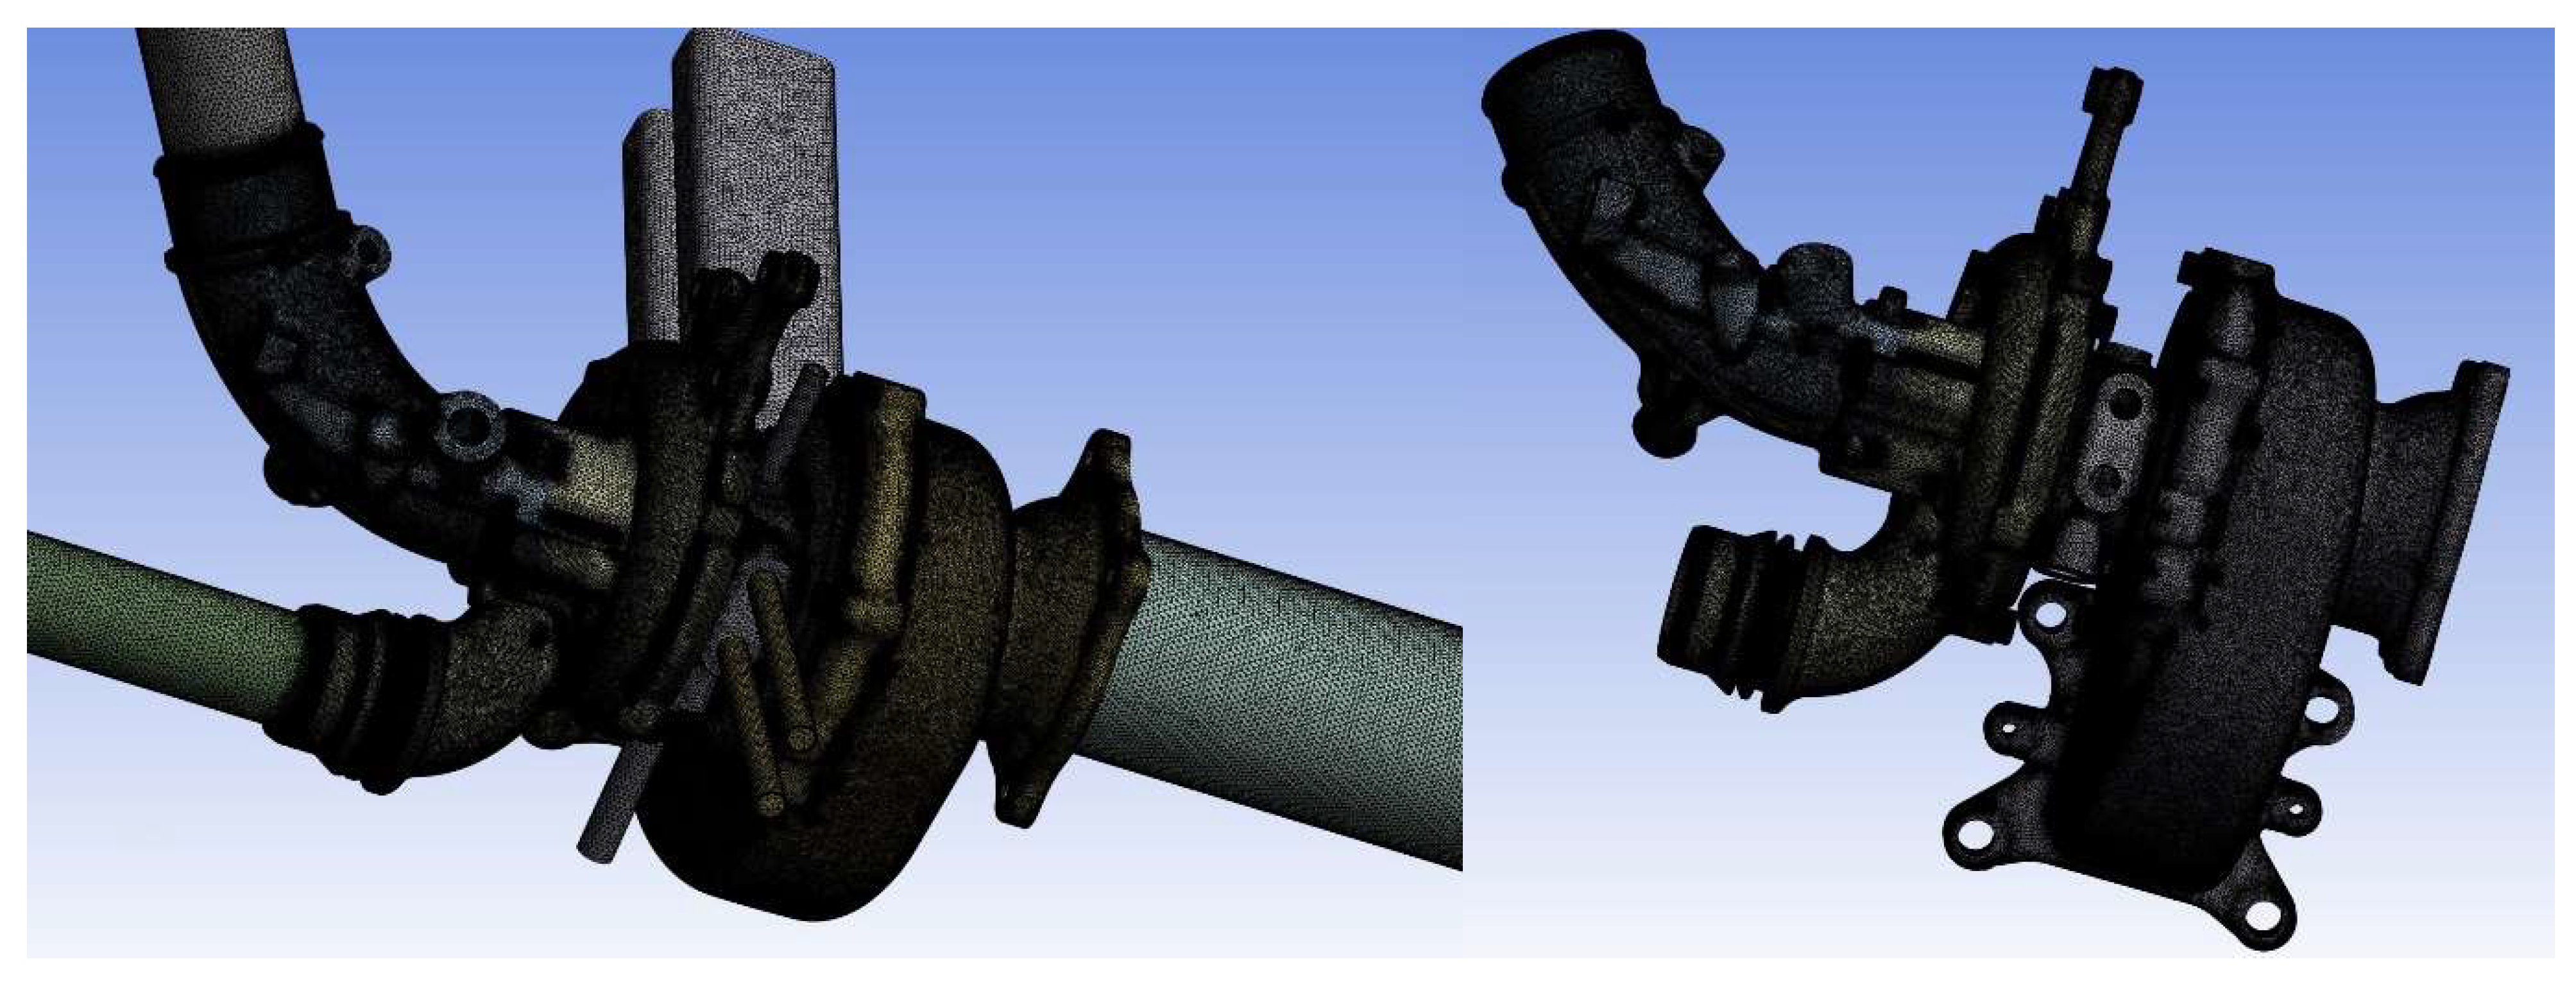
Figure 2 shows the mesh used for the CHT analysis of these parts. Considering the complexity of the geometric shape of the parts that constituted the VGT, a tetrahedral mesh was mainly used for grid generation, and four thin layers of prism grids were added to the wall surface so that the Y+ value was less than 100. Finally, through a mesh independence test, approximately 44 million fluid model meshes and 100 million solid model meshes were composed for a total of 144 million meshes.
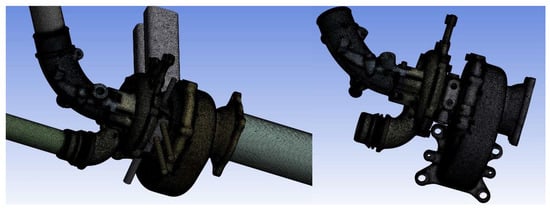
Figure 2.
Computational mesh for CHT analysis of a VGT.
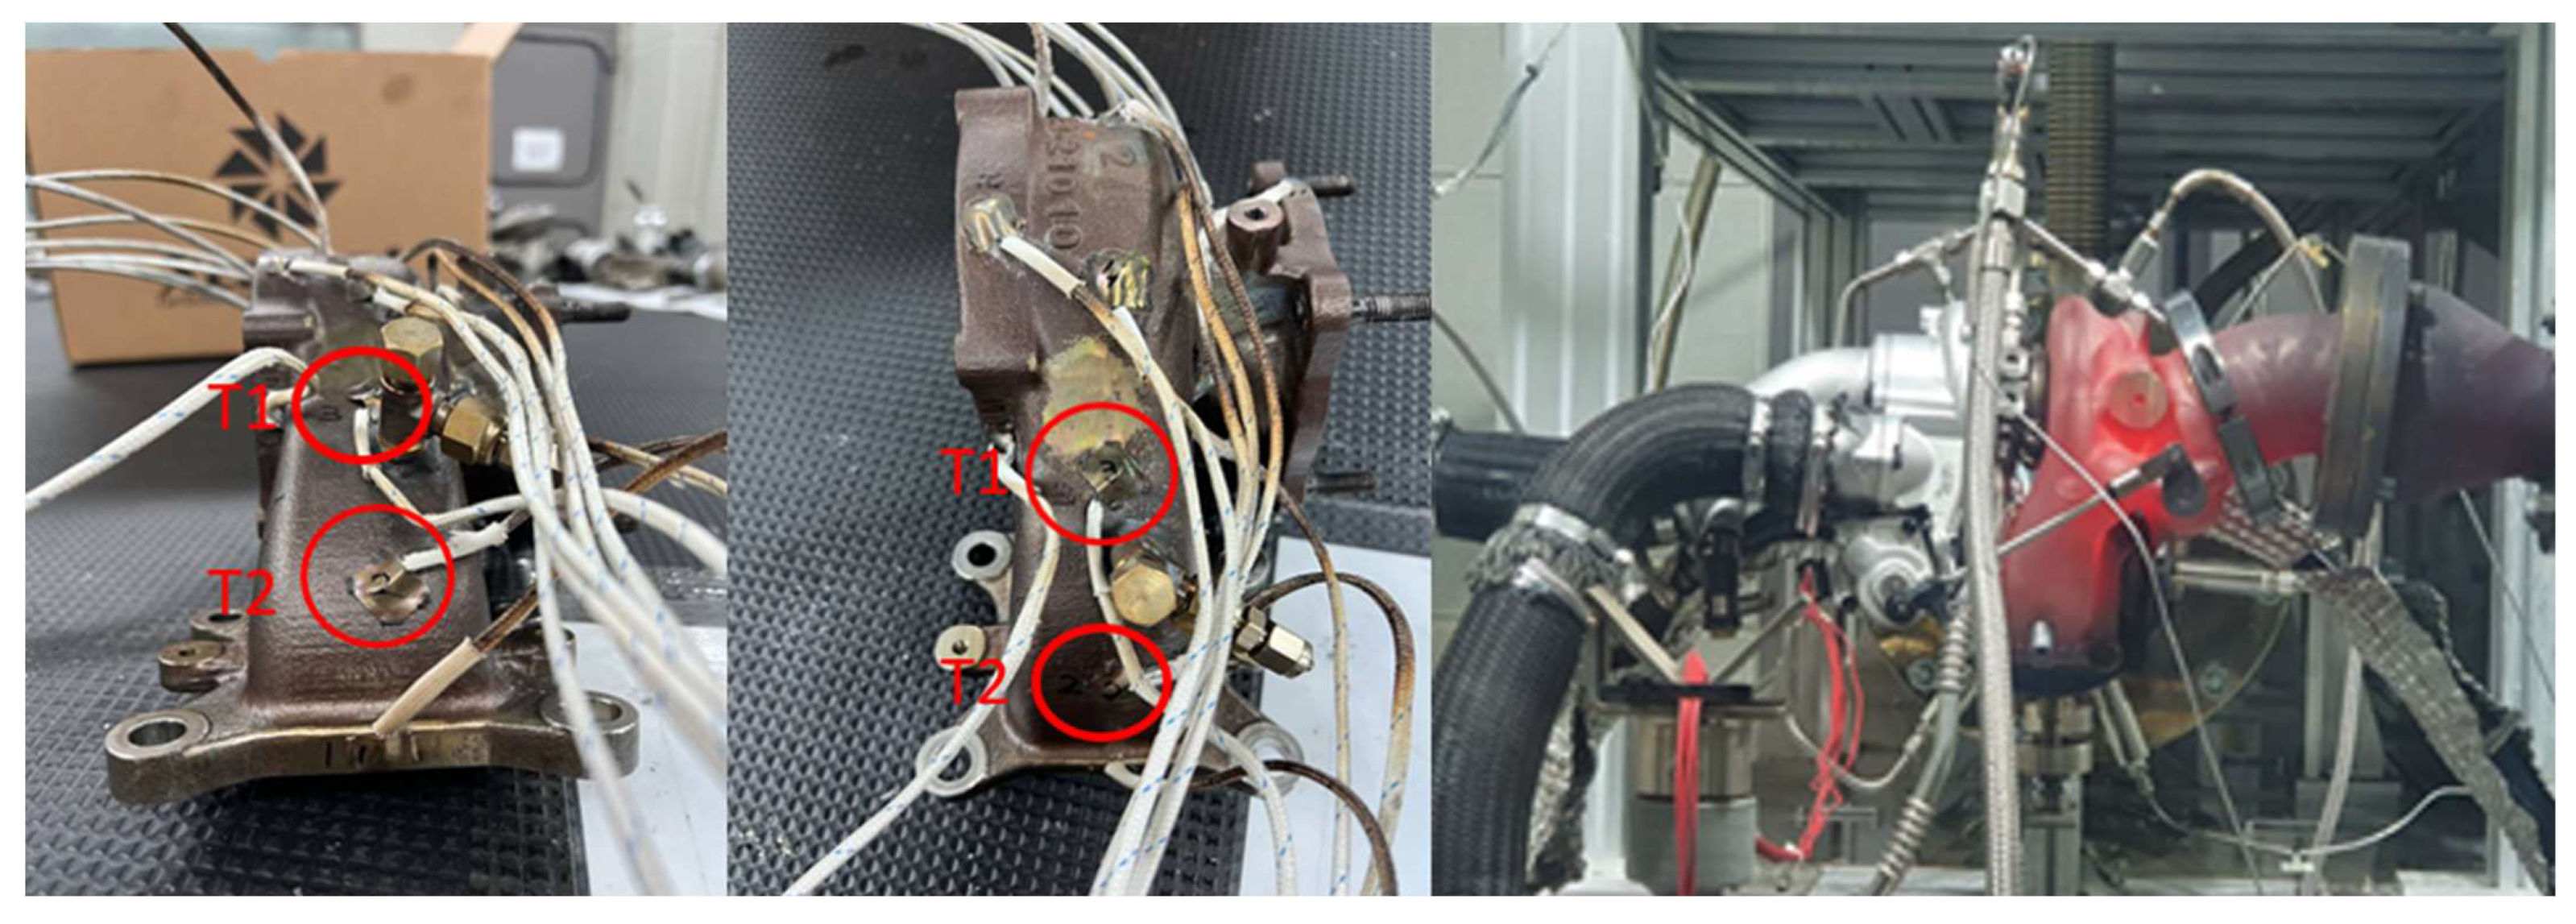
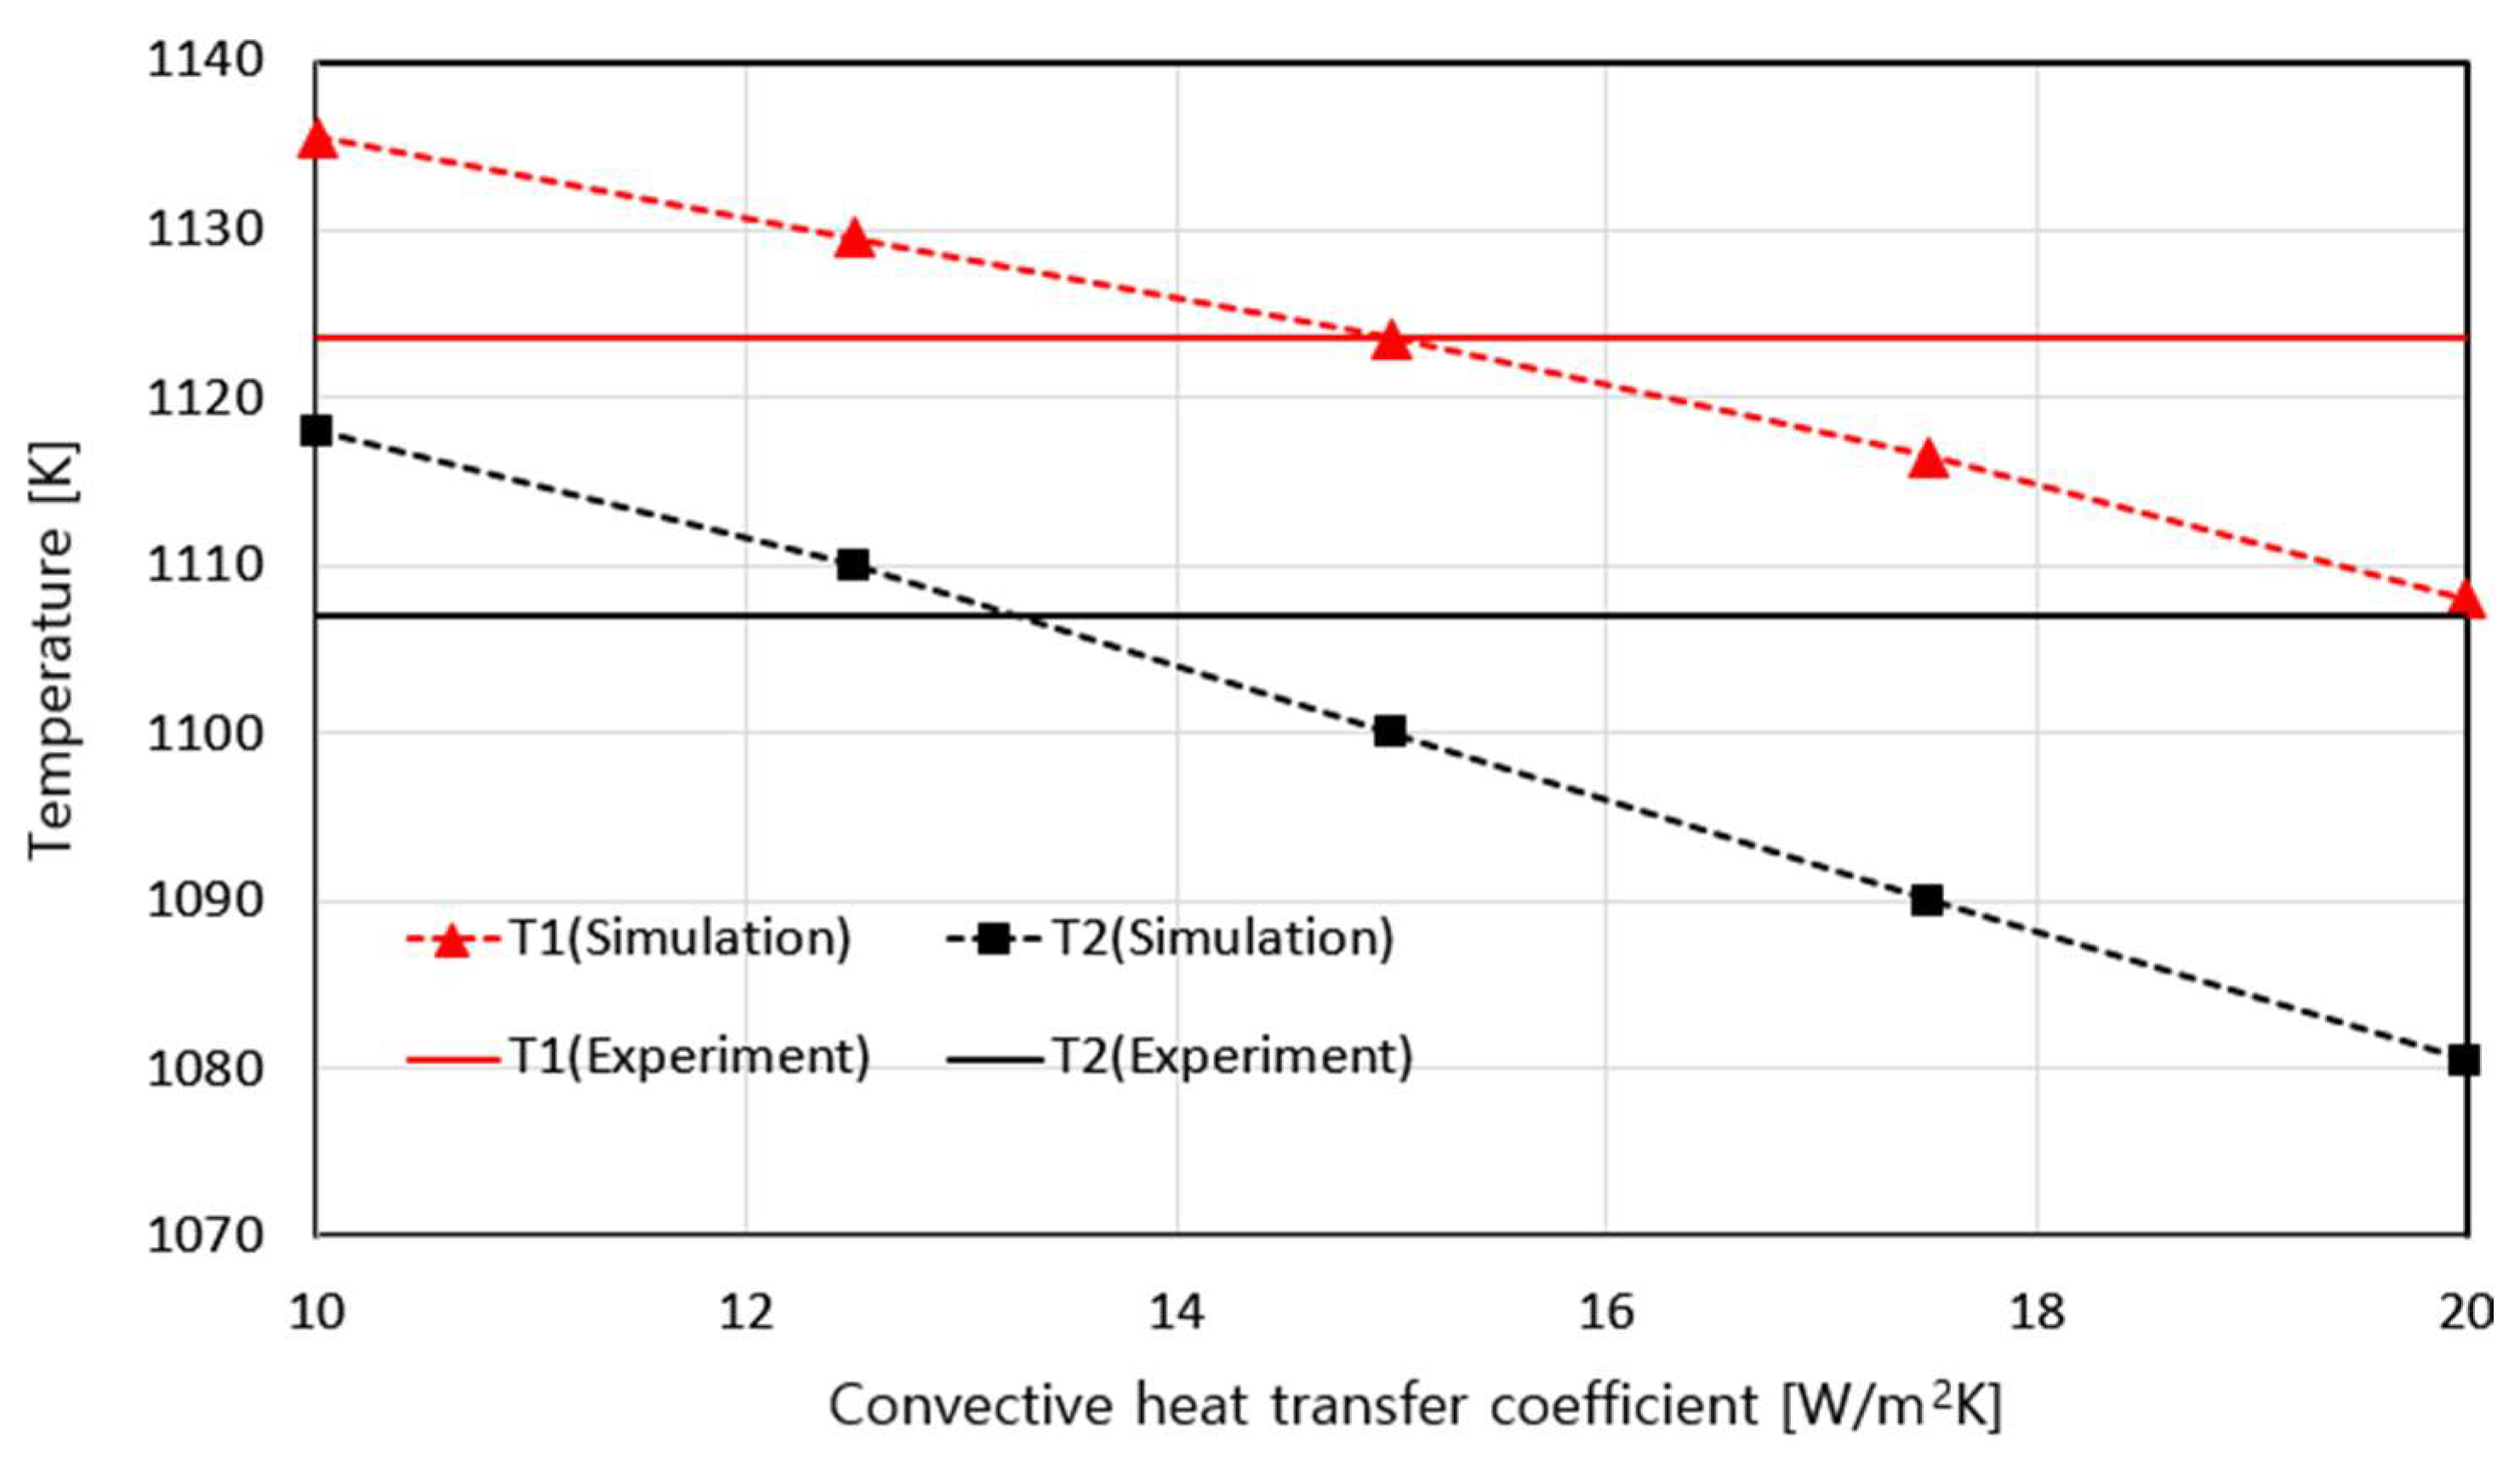
Table 1 lists the materials, analysis models, and boundary conditions used for each heat and flow field. In Table 1, a VGT obtains a rotational force of 175,690 rpm from the turbine by utilizing the engine’s exhaust gas energy supplied at 1192.95 K and 1.7 bar in full load conditions and supplies 121,000 Pa fresh air to the engine inlet through the compressor. The turbine experiences heat transfers and flow losses during operation due to heat transfer between components that make up the VGT and interactions with coolant, oil, and outside air. To accurately evaluate this heat transfer loss effect, we assumed that natural convective heat transfer occurred between the VGT surface and the 293.15 K atmosphere; the convective heat transfer coefficient was determined by tuning the analysis result with the experimental result. Figure 3 shows the thermocouple installed in the turbine housing for tuning the heat transfer coefficient. Figure 4 shows the temperature distribution of the housing when the CHT analysis is performed by changing the heat transfer coefficient to h = 10–20 W/m2K. When the calculated temperature values were compared with the experimental temperature values as shown in Figure 5, the temperature values calculated with h = 14 W/m2K were found to be the most consistent with the experimental temperature values. This convection heat transfer value was identical to the value h = 15 W/m2K used in a previously published paper [12]; the convection heat transfer value of h = 14 W/m2K was used in all subsequent CHT analyses in this study.

Table 1.
Working fluids, computational flow analysis models, and boundary conditions used in calculation.
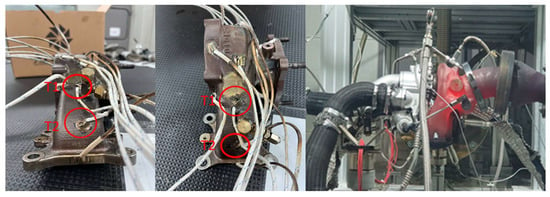
Figure 3.
Photograph of thermocouples installed at positions T1 and T2 on the turbine housing of the VGT.

Figure 4.
Changes in the temperature distribution around the turbine housing surfaces T1 and T2 (see Figure 3) due to changes in the convective heat transfer coefficient during CHT analysis of VGT.
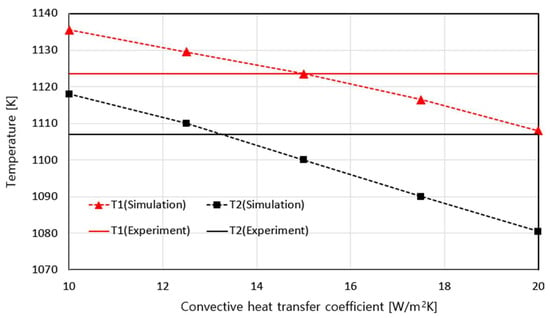
Figure 5.
Comparison between the surface temperature values calculated by changing the convective heat transfer coefficient and the experimental temperature values at the turbine housing points T1 and T2 in Figure 4.
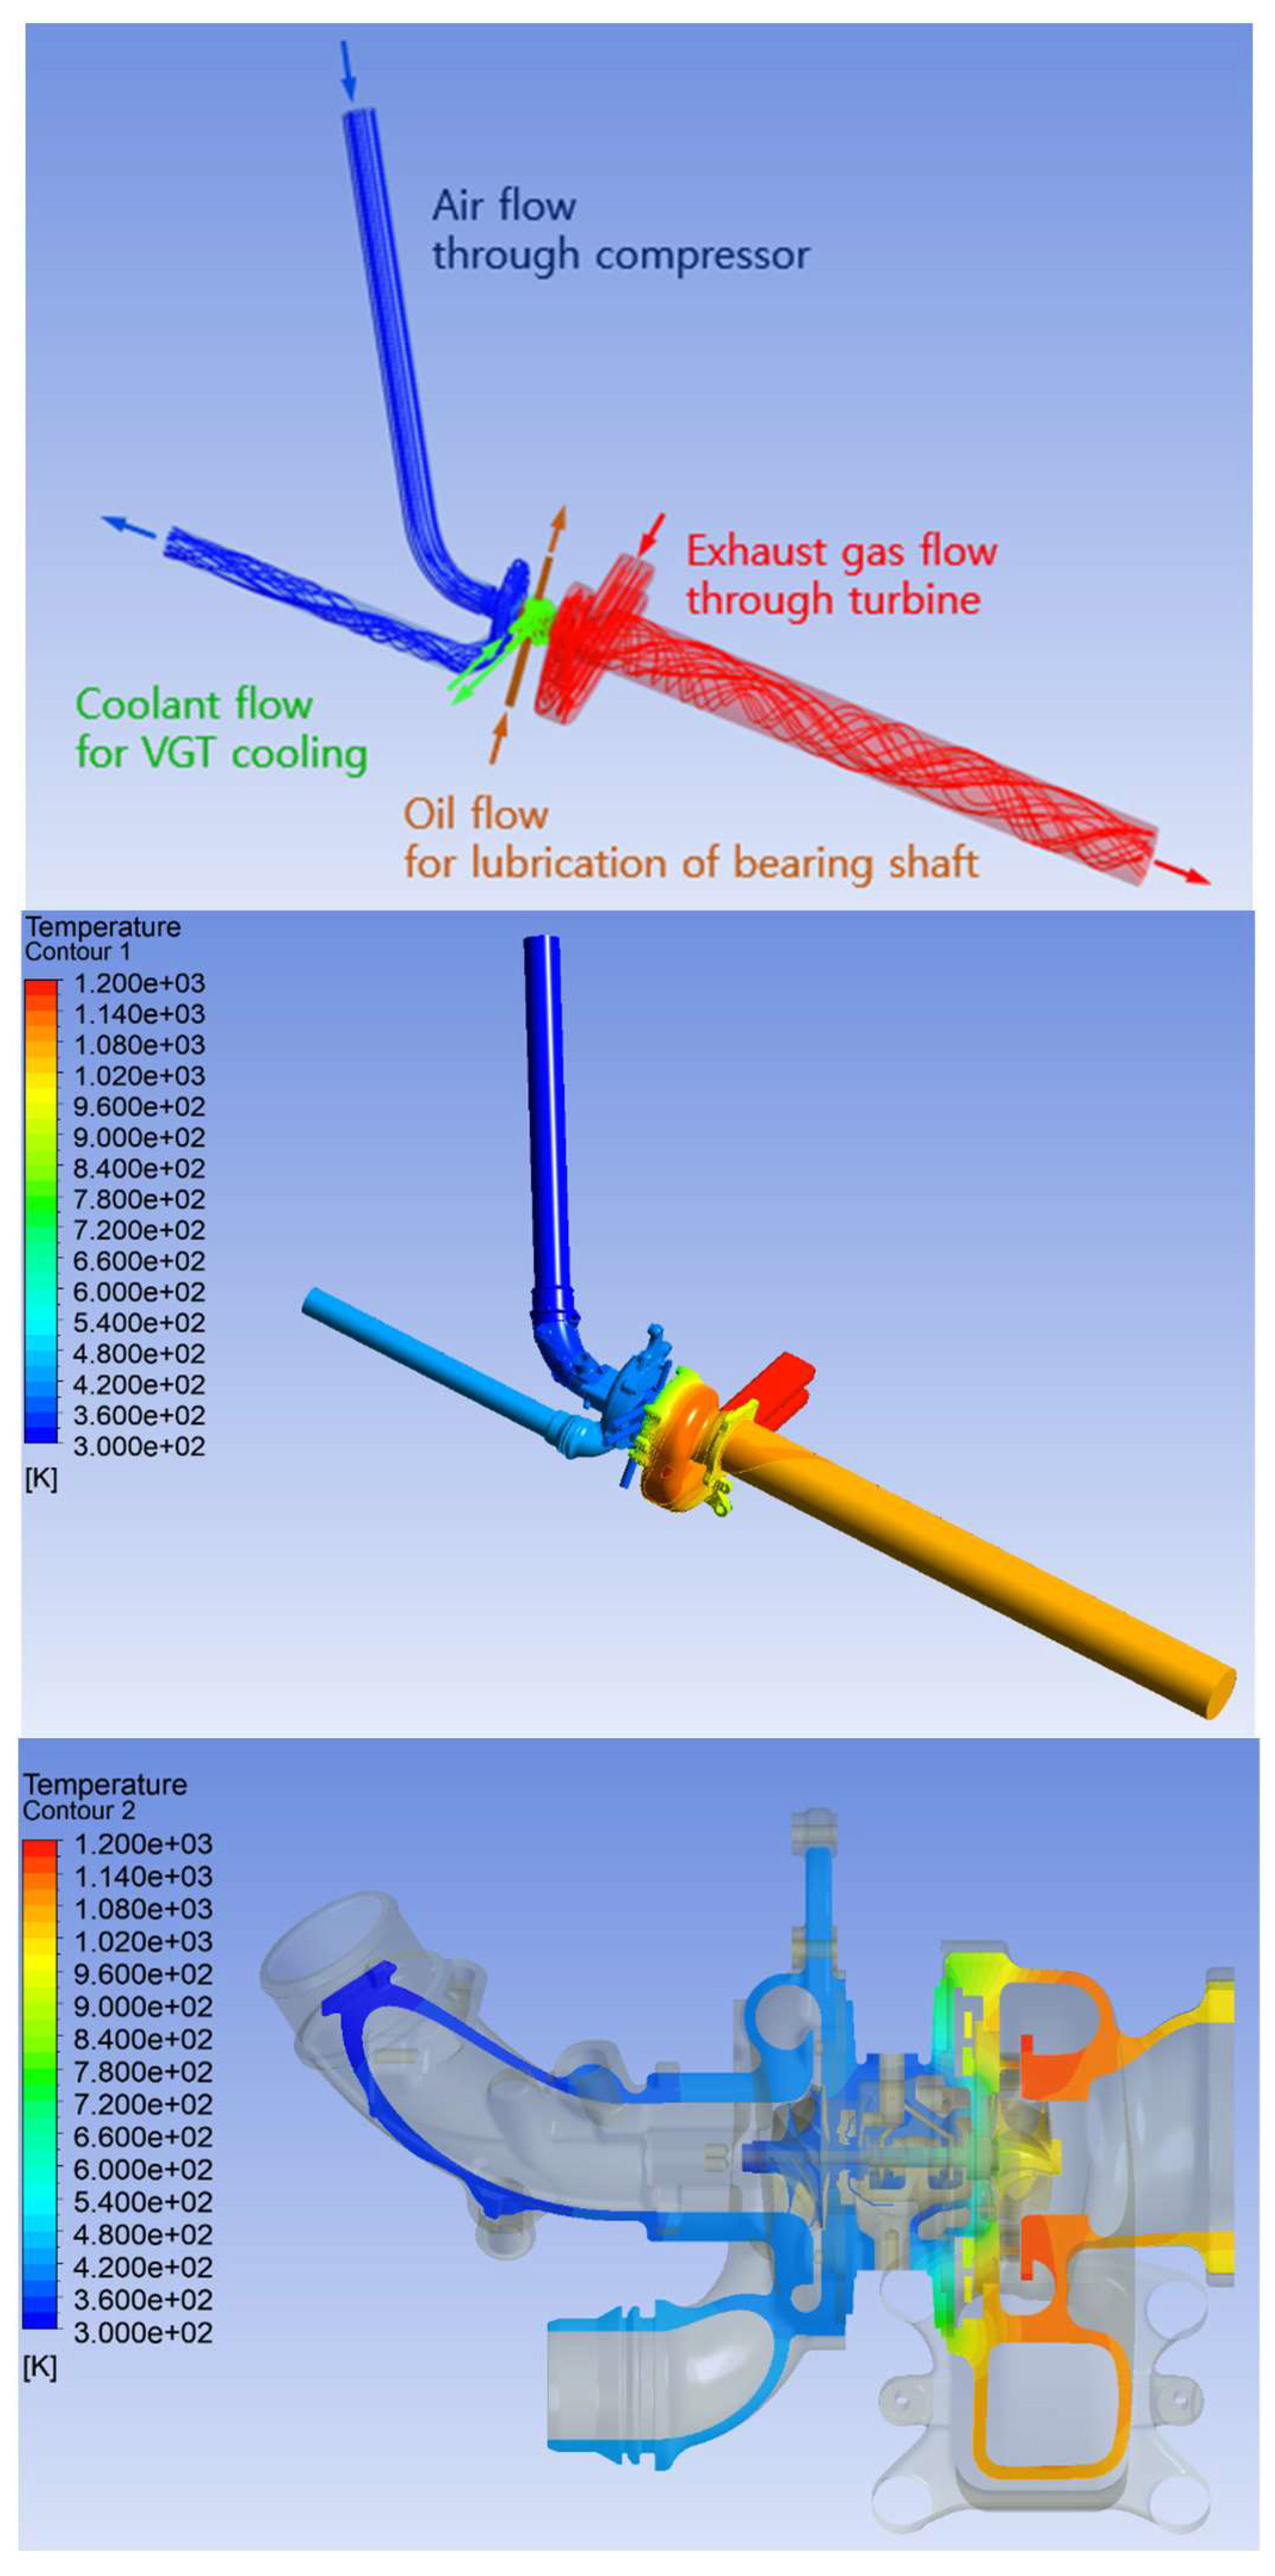
Figure 6 shows the CHT analysis results calculated using the values determined by comparing the convective heat transfer coefficients with the experimental results. As shown in the figure, the analysis was performed considering the heat transfer phenomena of all components constituting the VGT, including the coolant heat flow inside for VGT cooling, the oil heat flow for lubrication of the bearing shaft, the air flow through the compressor, and the exhaust gas flow through the turbine. Thus, we examined the difference between the turbine performance when heat transfer was not considered and the actual performance evaluation when heat transfer was considered.
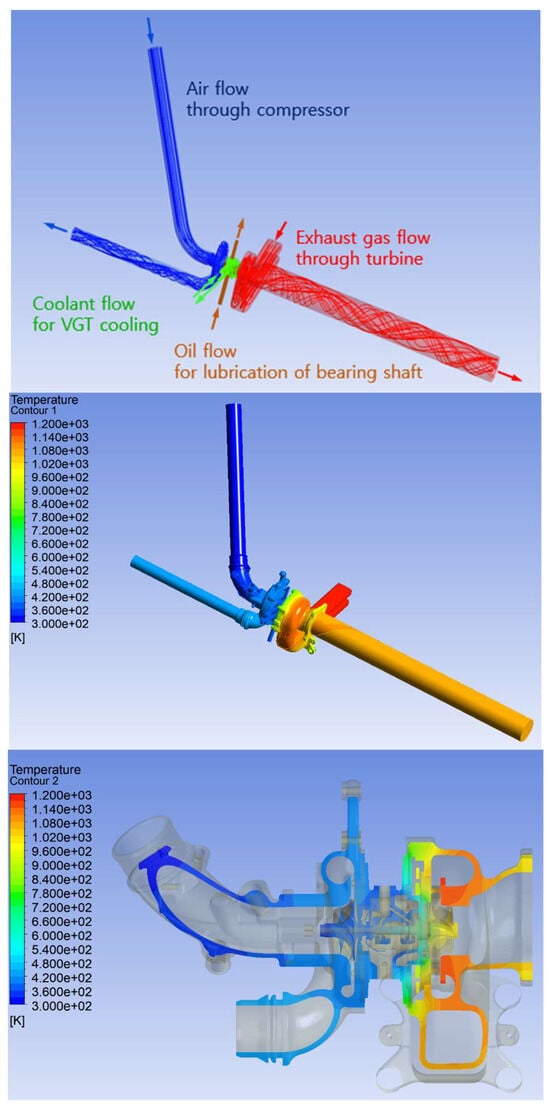
Figure 6.
CHT analysis results calculated using the values determined by comparing the convective heat transfer coefficients with the experimental results: streamlines and temperature distributions on fluids and solid bodies.
3. Results and Discussion
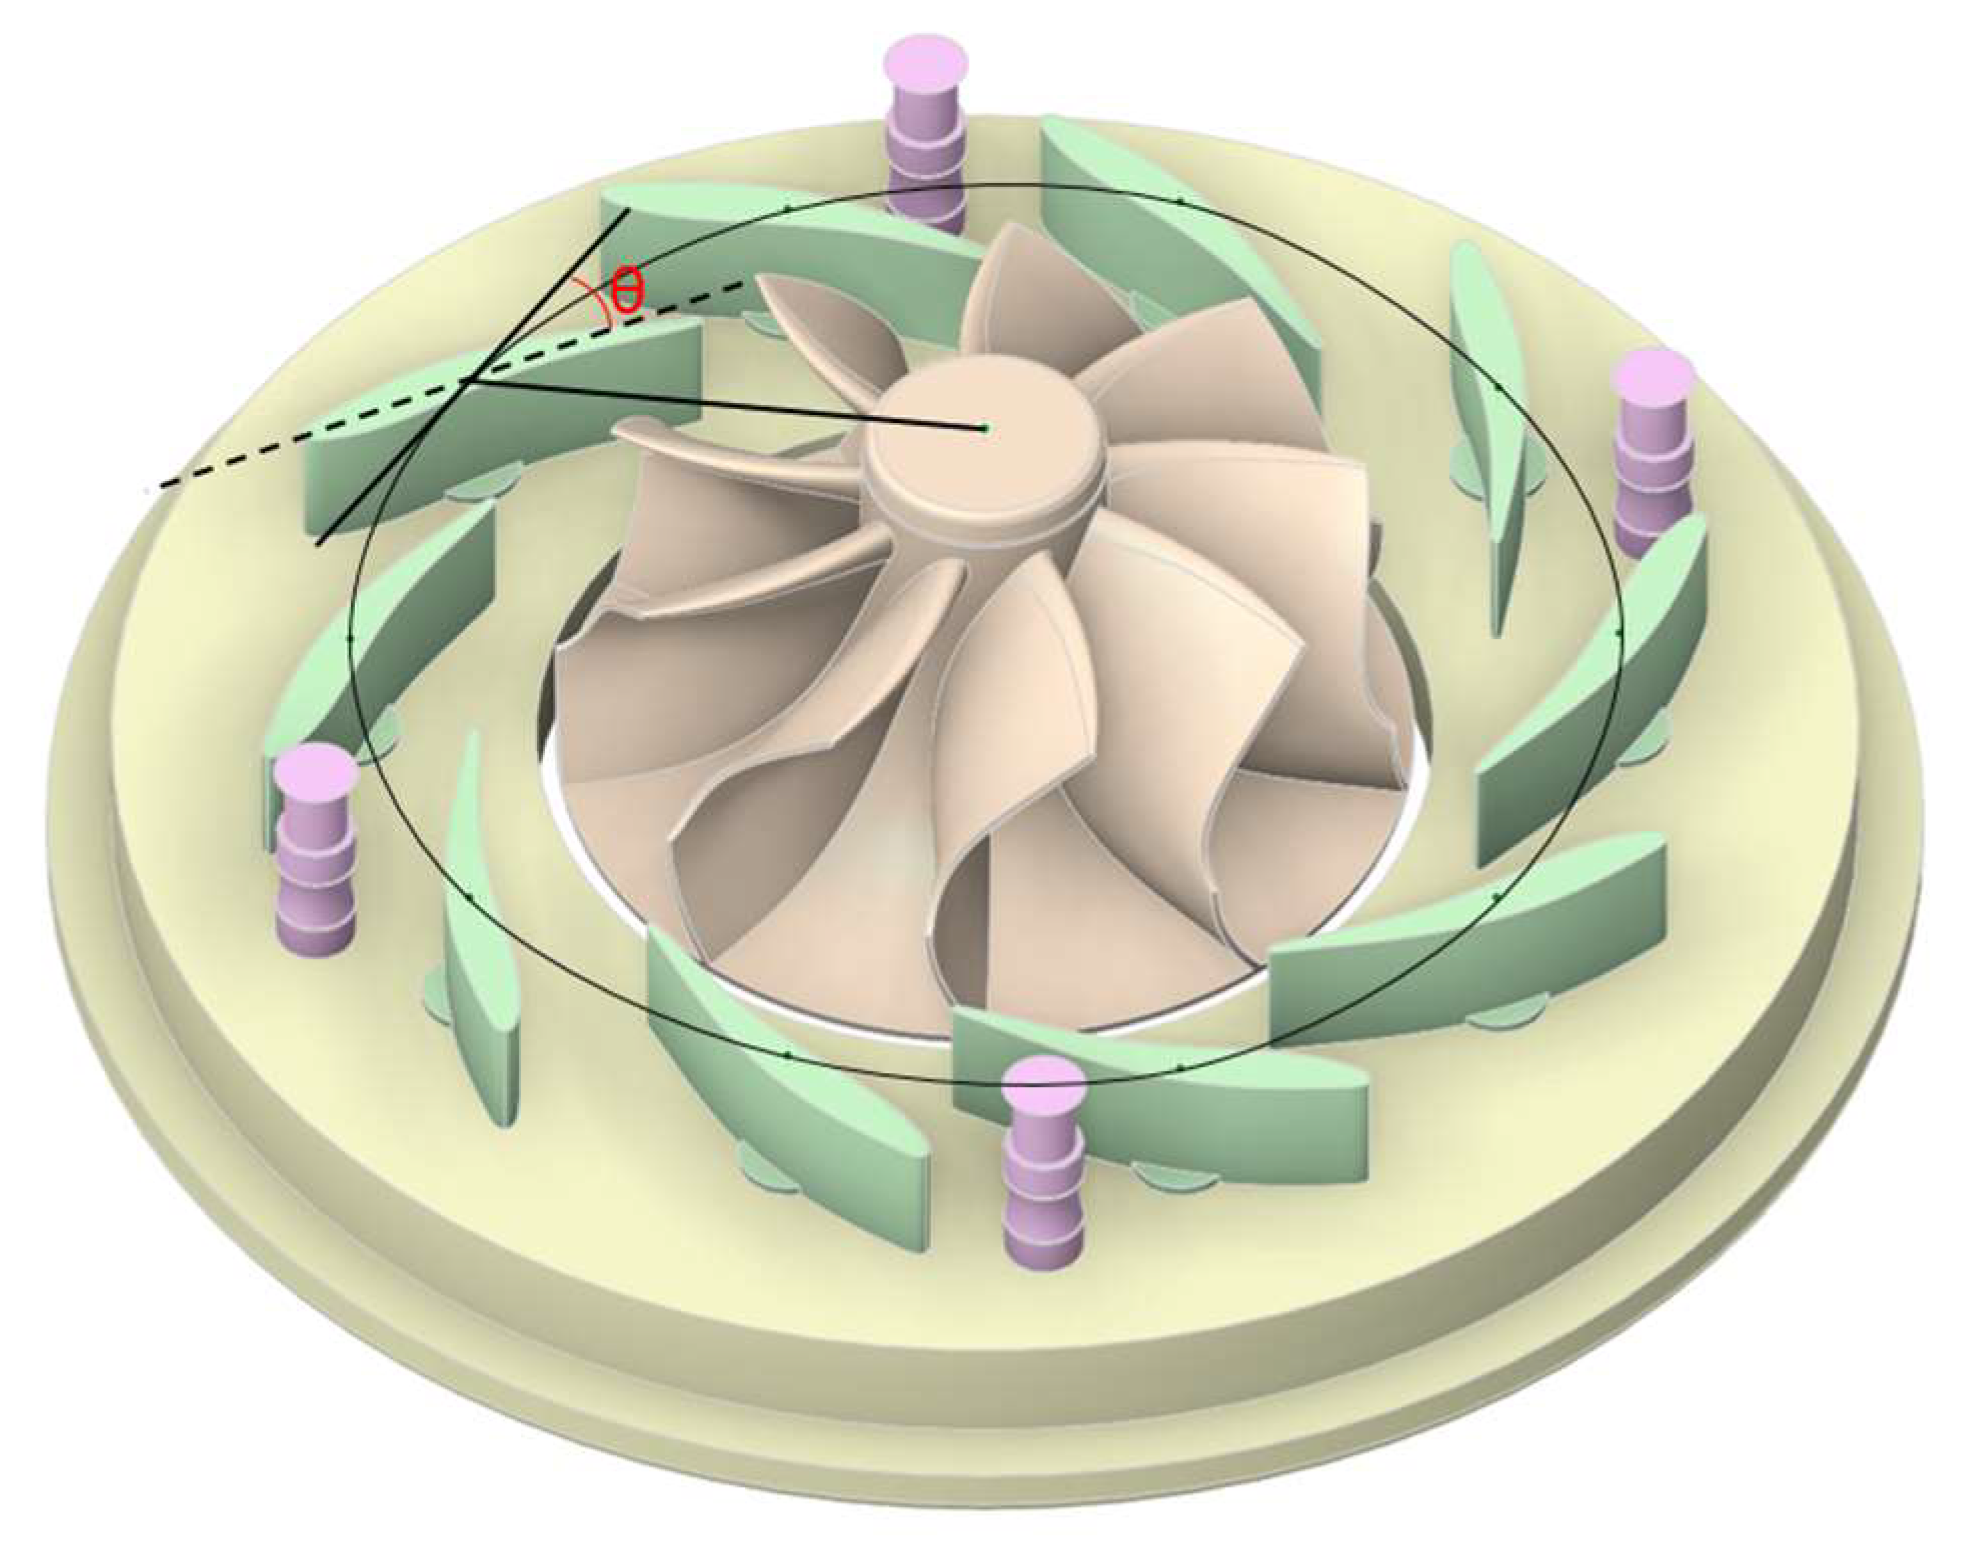
Figure 7 shows the vane installed in the turbine, which determines its position and changes its driving angle such that the turbine can operate most efficiently depending on the operating conditions of the engine. As shown in the figure, the position angle of the vane is defined as the angle at which the vane rotates around the pivot located at the center of the vane after setting the flow path to 0° when the flow path is completely closed.
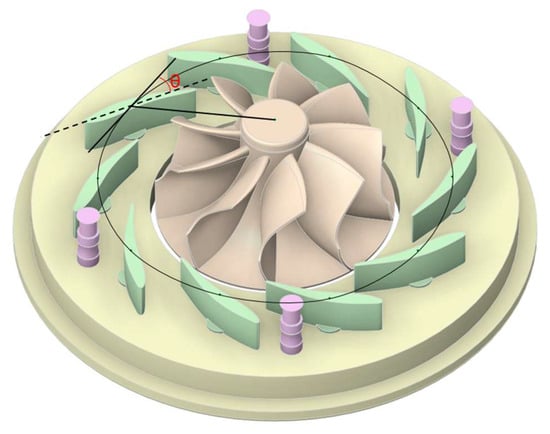
Figure 7.
Turbine impeller and vanes located in the turbine housing in a VGT and defining the vane operating angle.
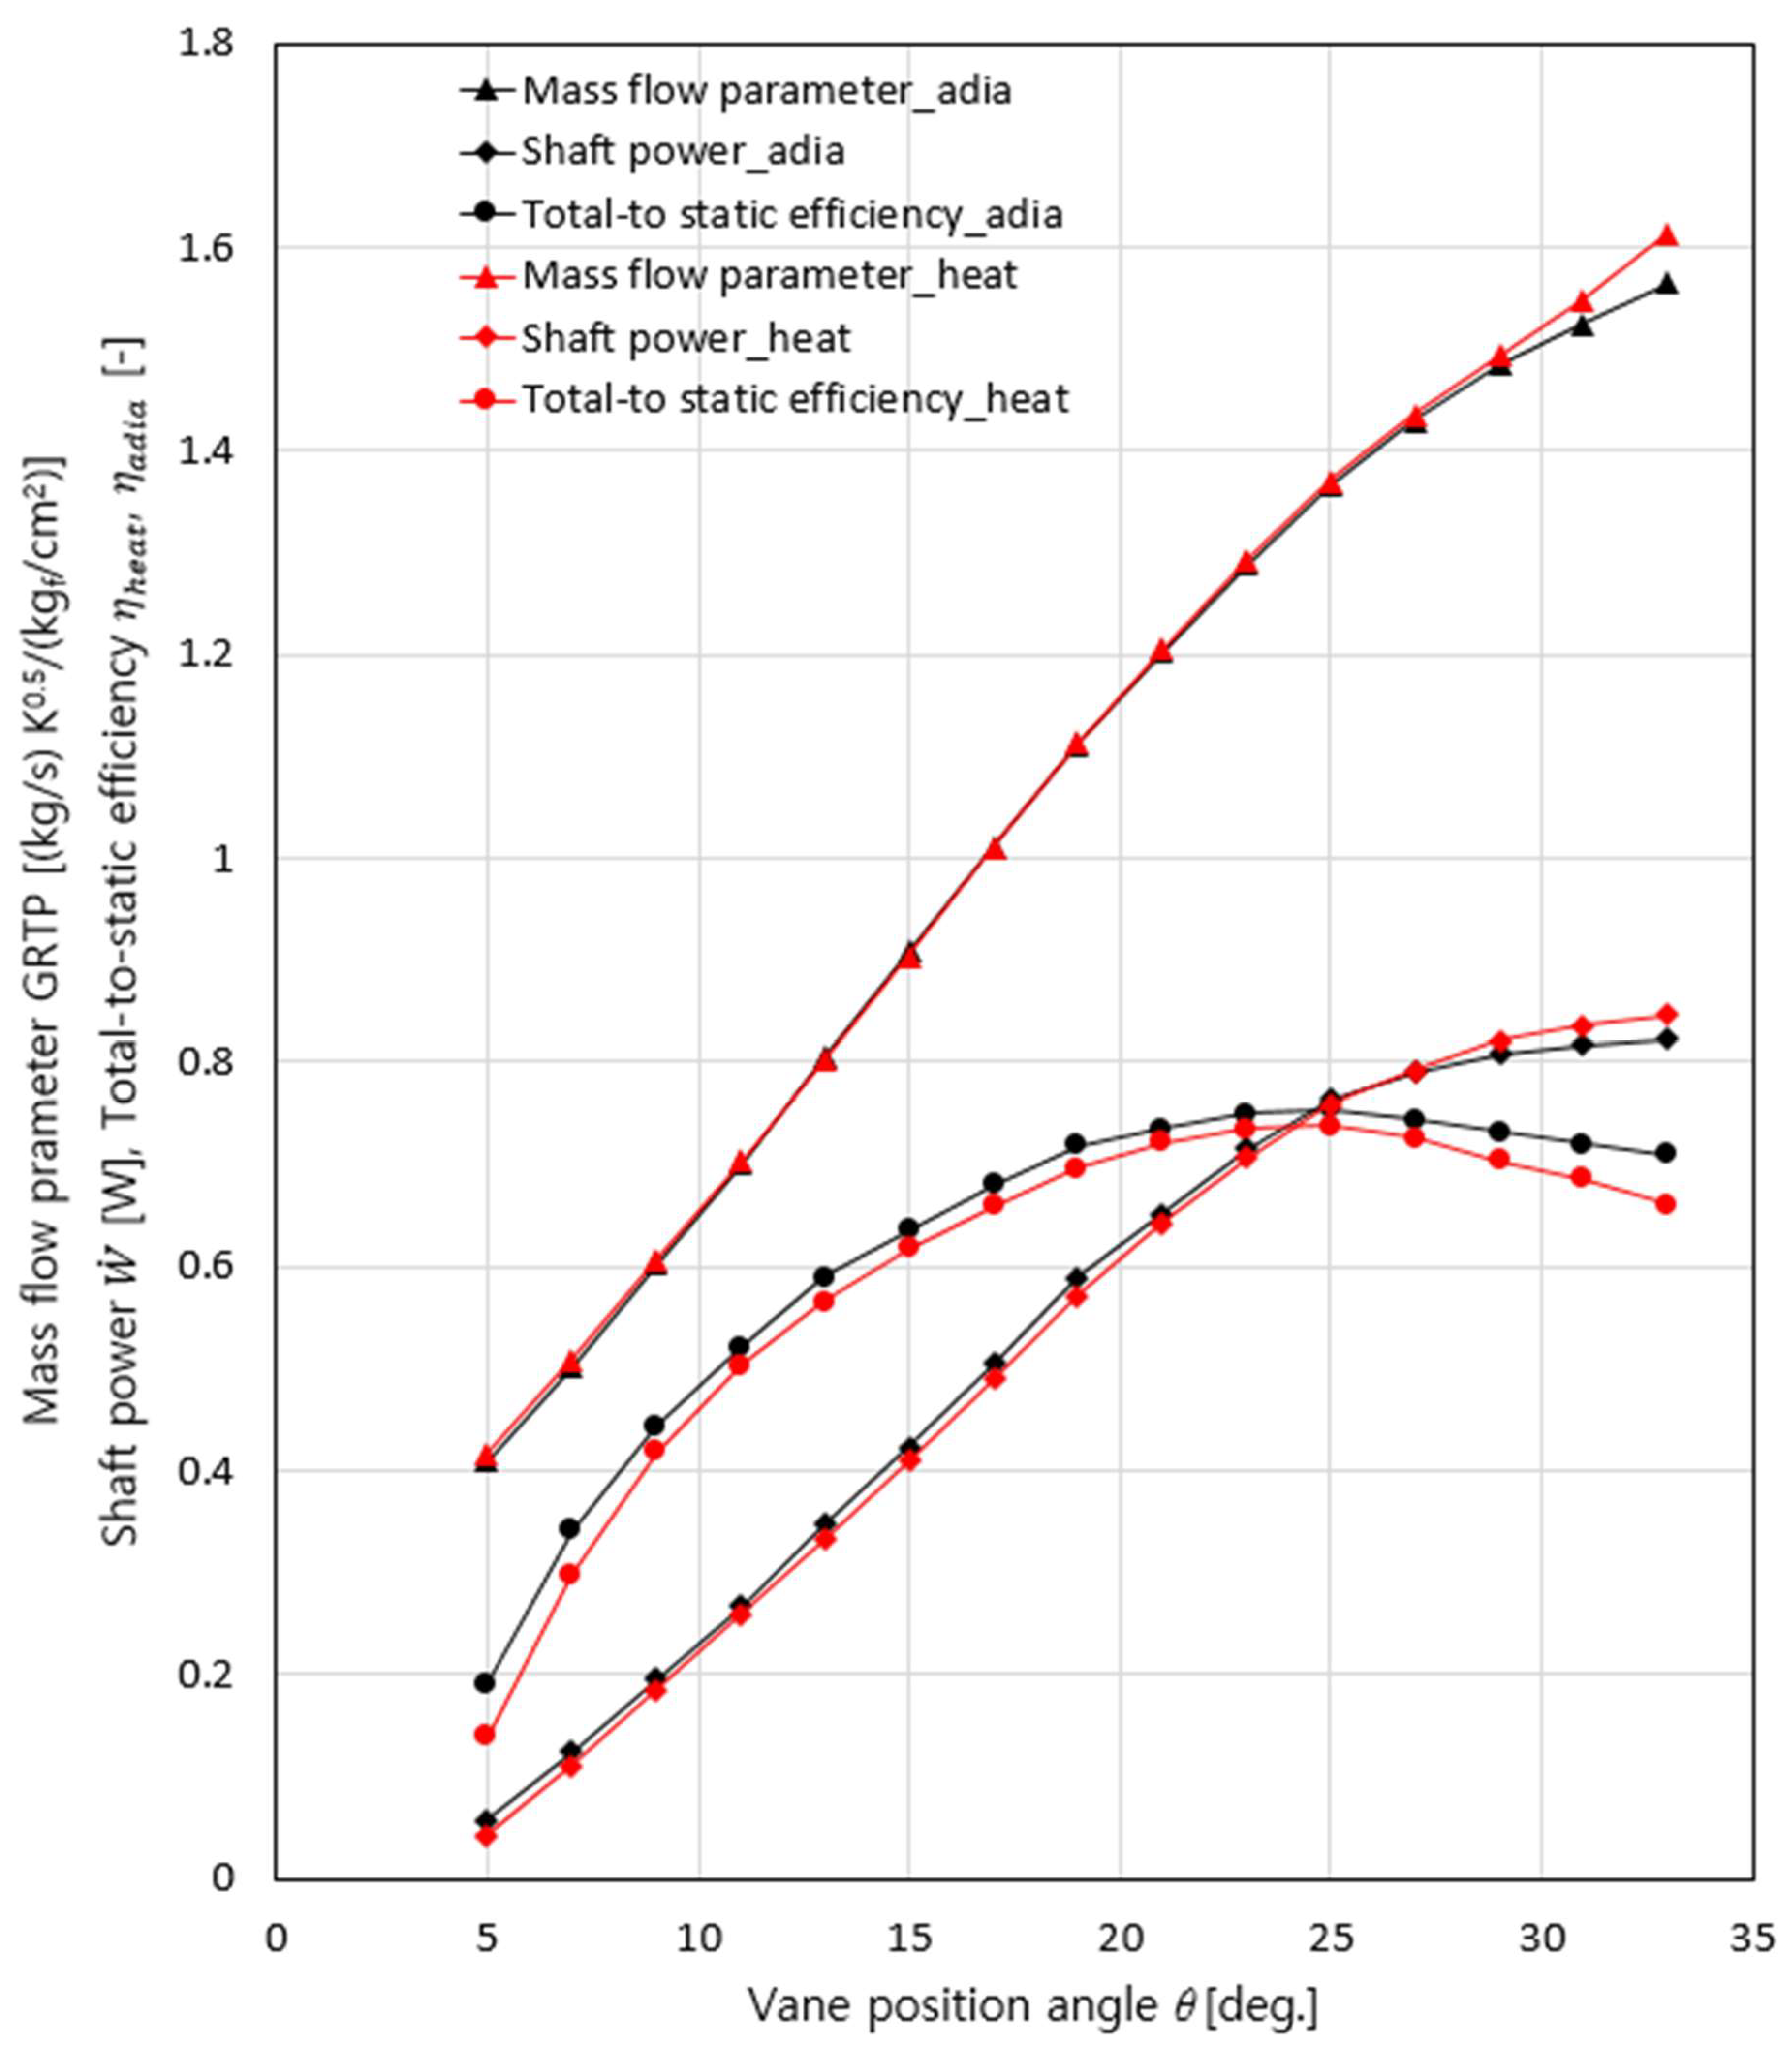
Figure 8 shows the results of calculating the change in the total-to-static efficiency () of the turbine defined by Equation (1), the mass flow parameter (GRTP) defined by Equation (2), and the shaft power () defined by Equation (3), when the operating angle of the vane is changed from 5 to 33° under the operating conditions shown in Table 1, with and without considering the heat transfer to the VGT housing.
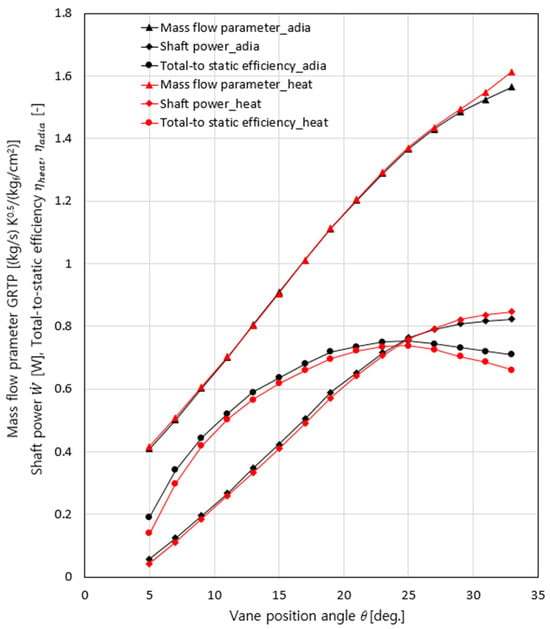
Figure 8.
Changes in turbine efficiency, mass flow parameter, and shaft power according to changes in vane position angle under heat transfer and adiabatic conditions.
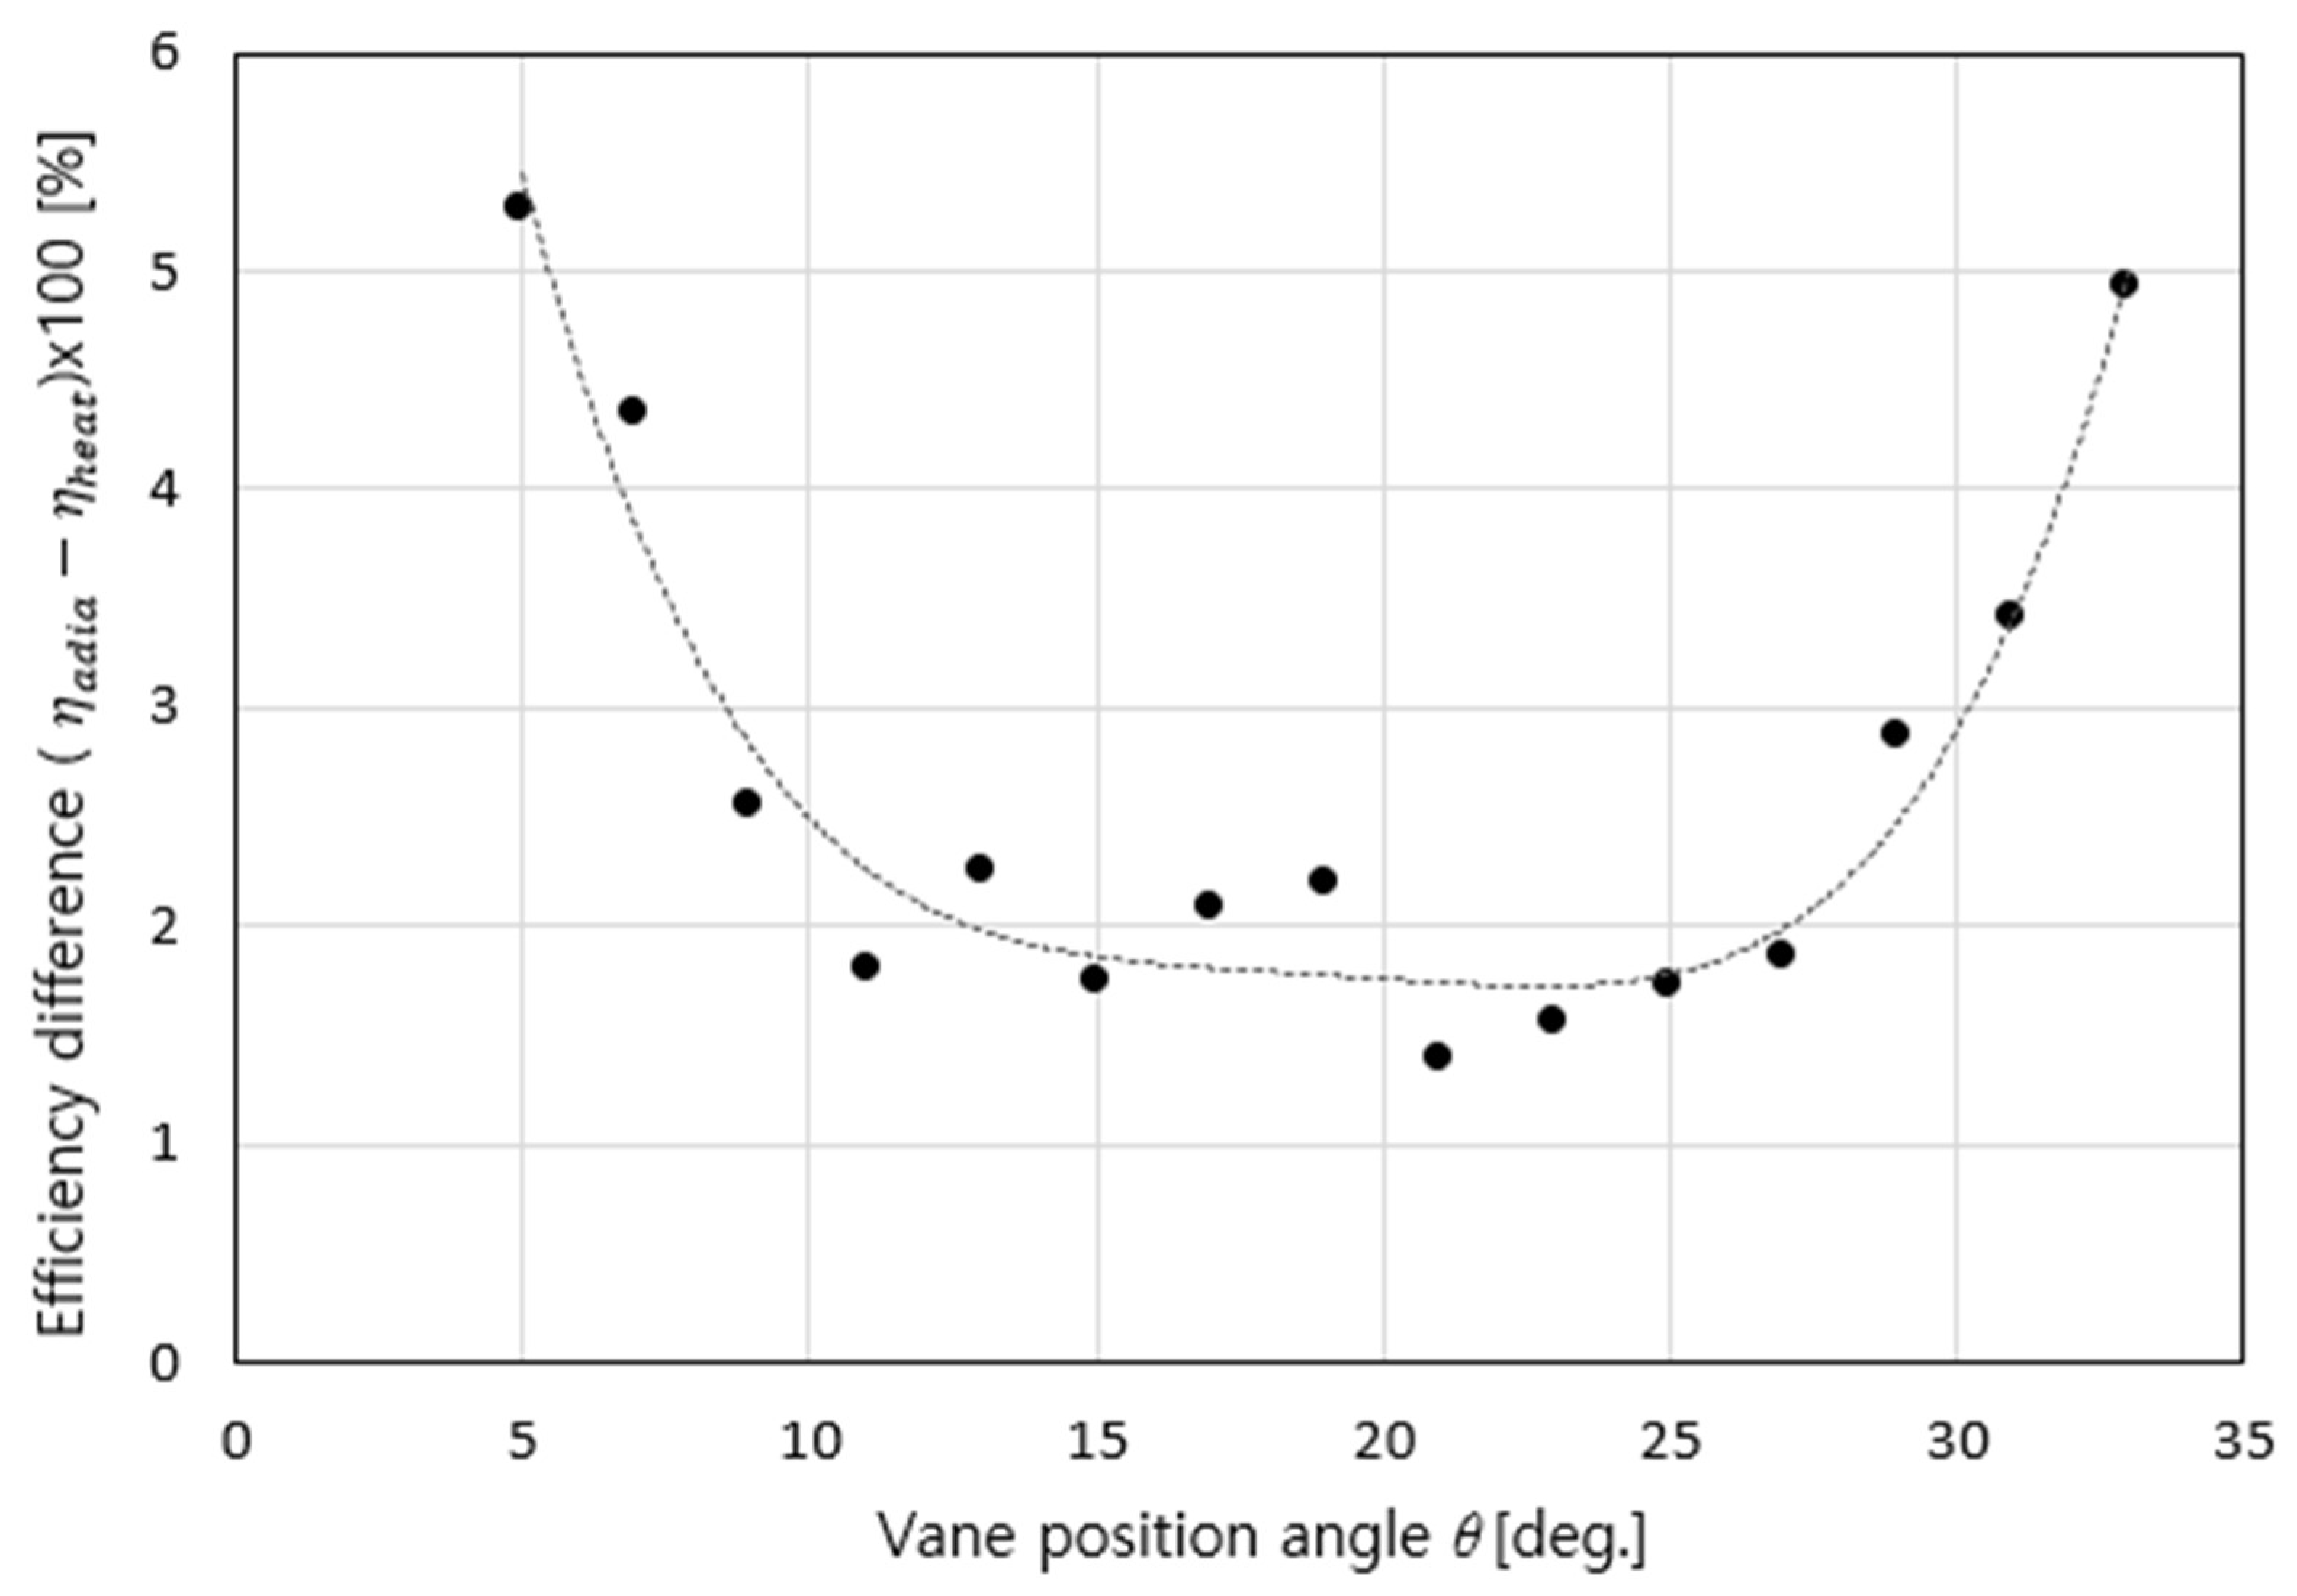
As shown in the figure, as the driving angle of the vane increased, the mass flow rate increased because the flow path of the exhaust gas into the turbine impeller, which rotated constantly, became wider under constant pressure conditions at the inlet and outlet of the turbine. The figure also shows that the shaft power increased with an increase in the mass flow rate. However, the efficiency of the turbine increased with the operating angle of the vane and then decreased again after reaching a peak of 25°. This phenomenon is mainly governed by how well the inflow speed and angle of the exhaust gas guided to the turbine impeller inlet match the turbine impeller inlet rotation speed and blade angle according to the operating angle of the vane. When heat transfer between the working fluid and the VGT structure during VGT operation is considered, the mass flow rate and shaft power tend to increase as the vane opens, compared to when heat transfer is not considered. This happens because, when heat transfer is considered, the density increases relatively owing to a decrease in the temperature of the working fluid. From the efficiency case in Figure 8, we confirmed that when heat transfer was considered, the efficiency was reduced by approximately 2–5% over the entire operating range because of the heat loss to the wall during operation, compared to when heat transfer was not considered. Figure 9 shows the difference in efficiency between the working fluid and the VGT structure with and without considering the heat transfer. From the graph, we can observe that the efficiency deteriorated rapidly when the heat transfer was considered at approximately 25°, which was the operating position of the vane with optimal efficiency. This is because the flow phenomenon also changes with heat loss owing to heat transfer to the wall.
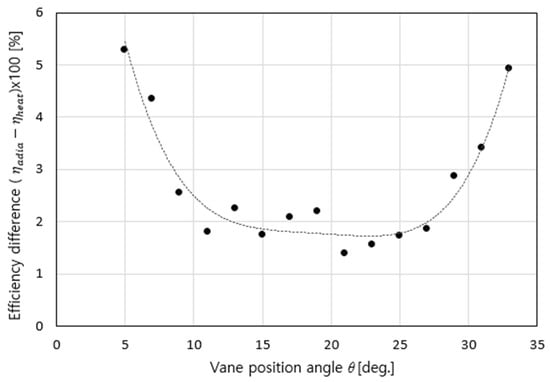
Figure 9.
Difference in efficiency when heat transfer is considered and when it is not considered.
Equation (4) defines the power ratio (), which is the shaft power () produced in the turbine divided by the total input energy () supplied through the working fluid at the turbine inlet. Equation (5) defines the wall heat release ratio (), which is the heat transfer loss () caused by the heat of the working fluid being transferred to the wall of the VGT during turbine operation divided by the total input energy.
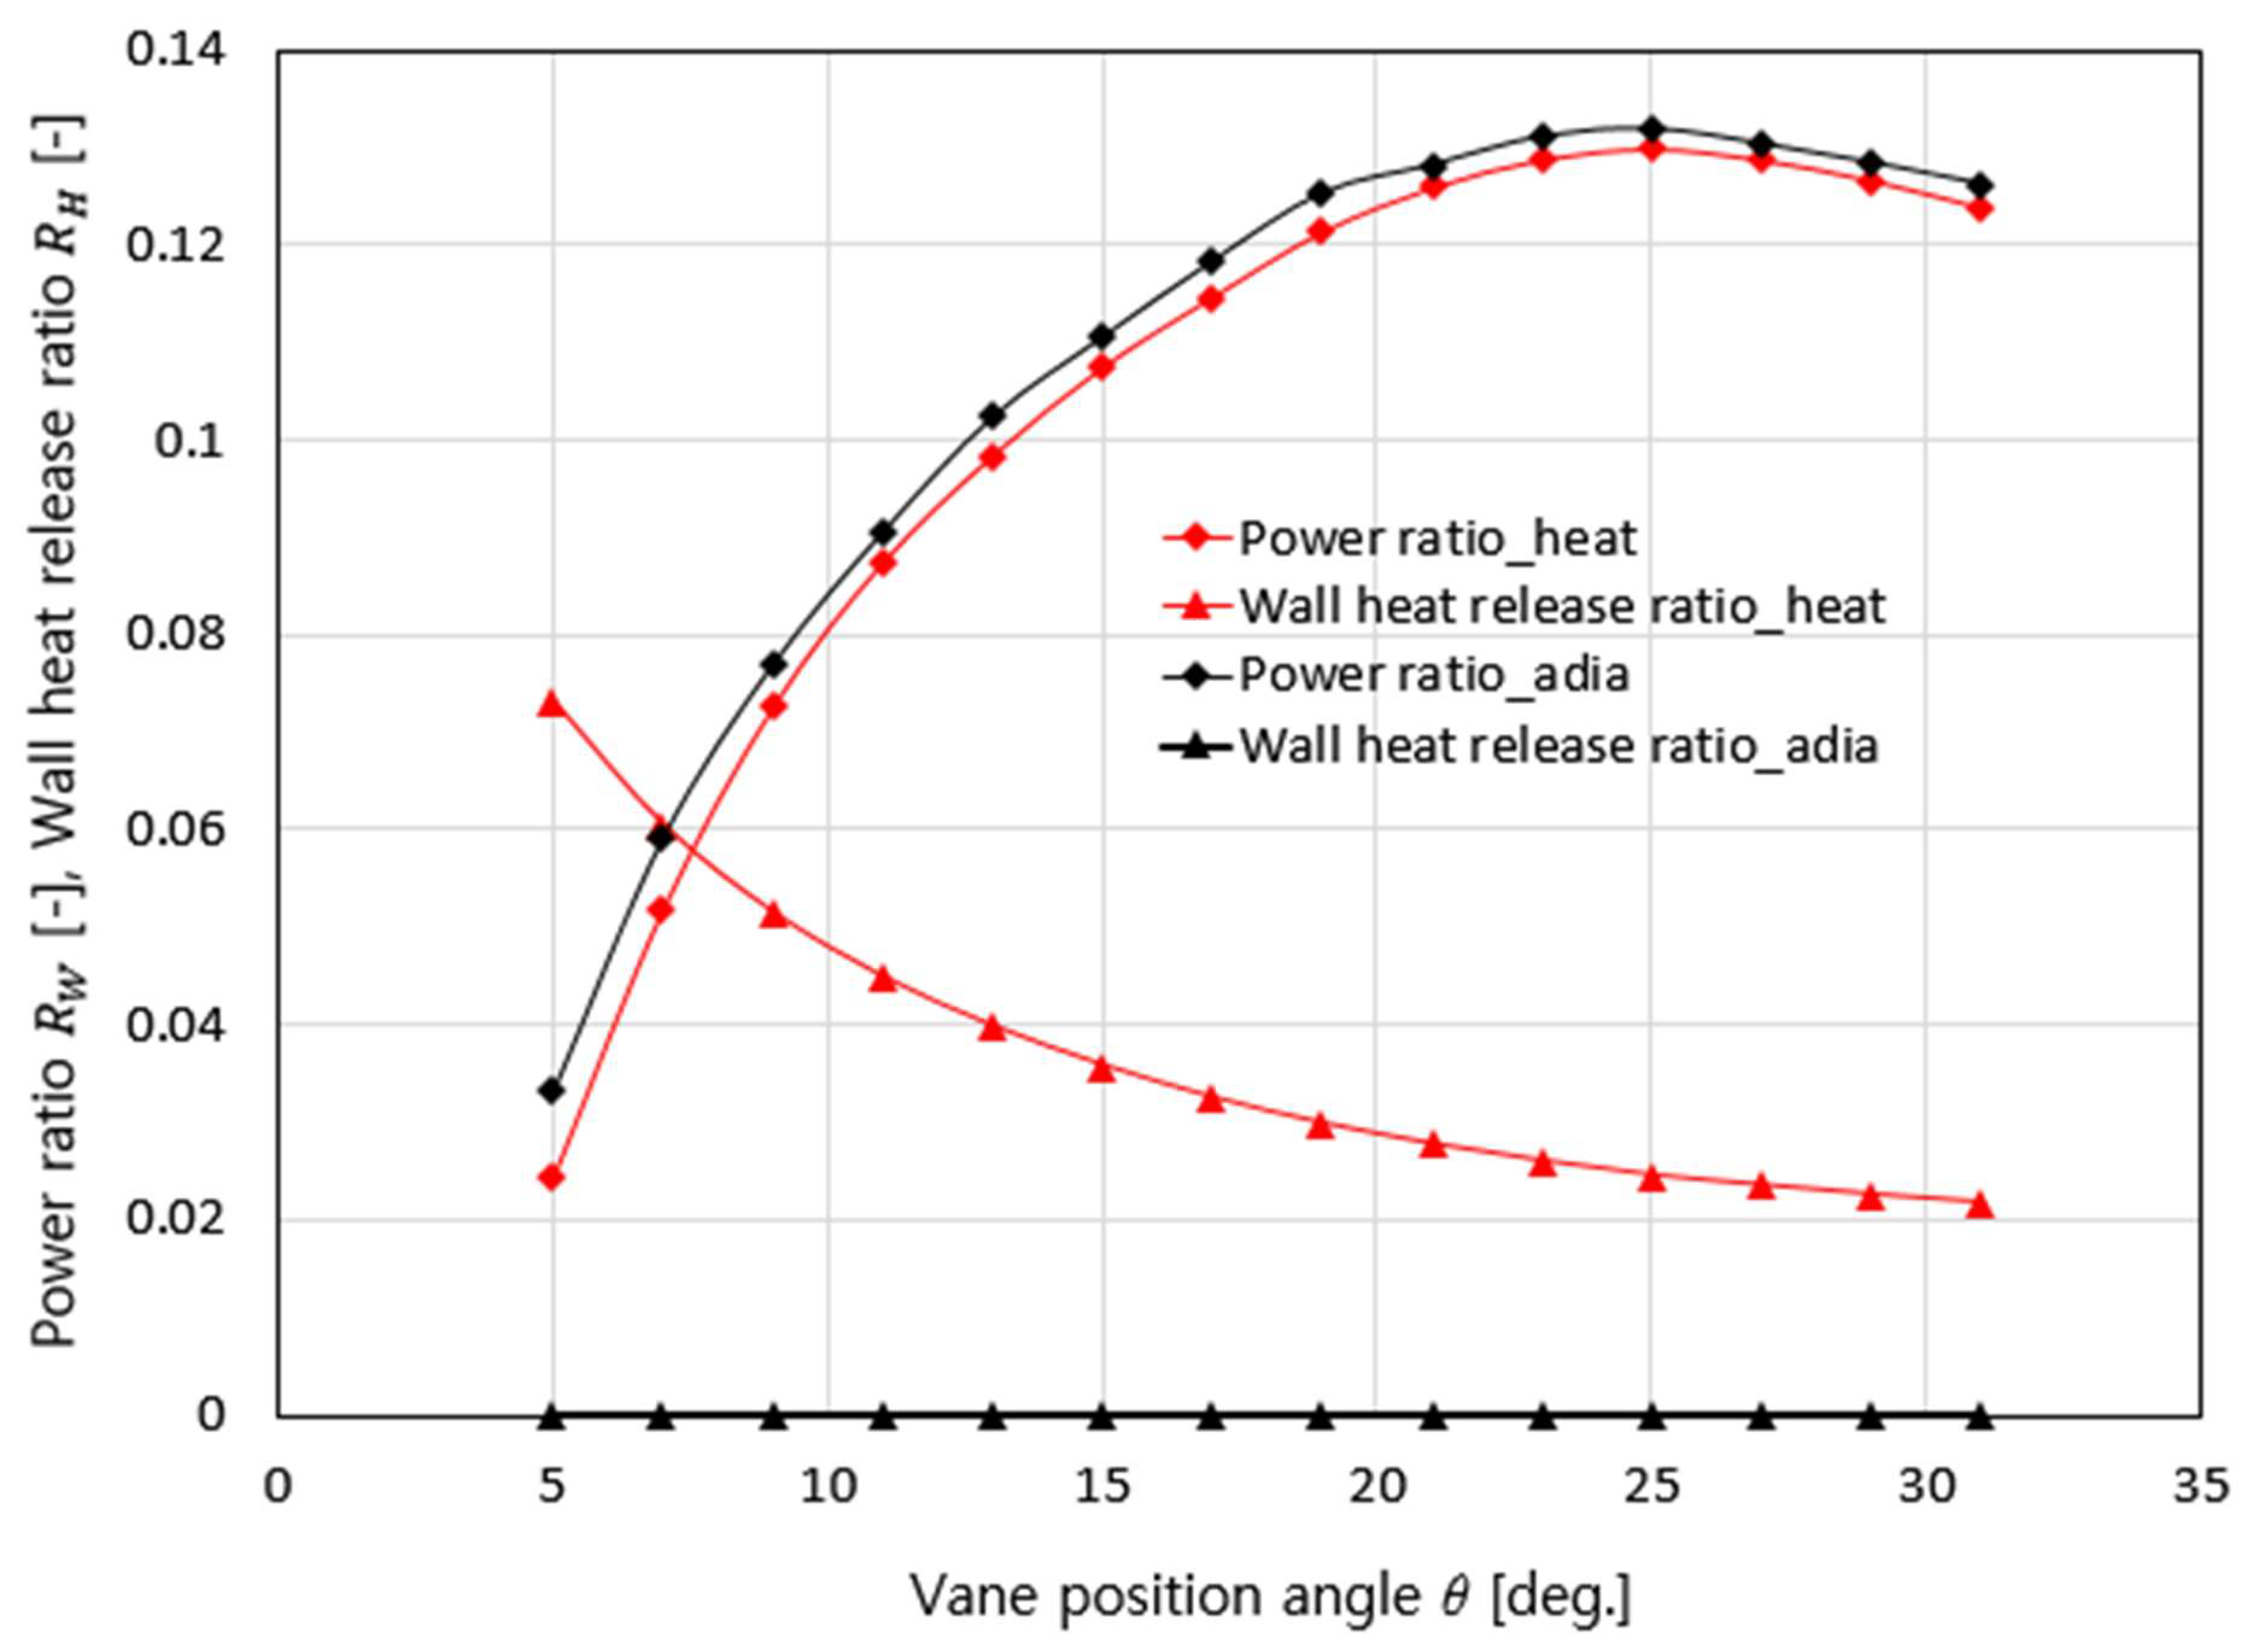
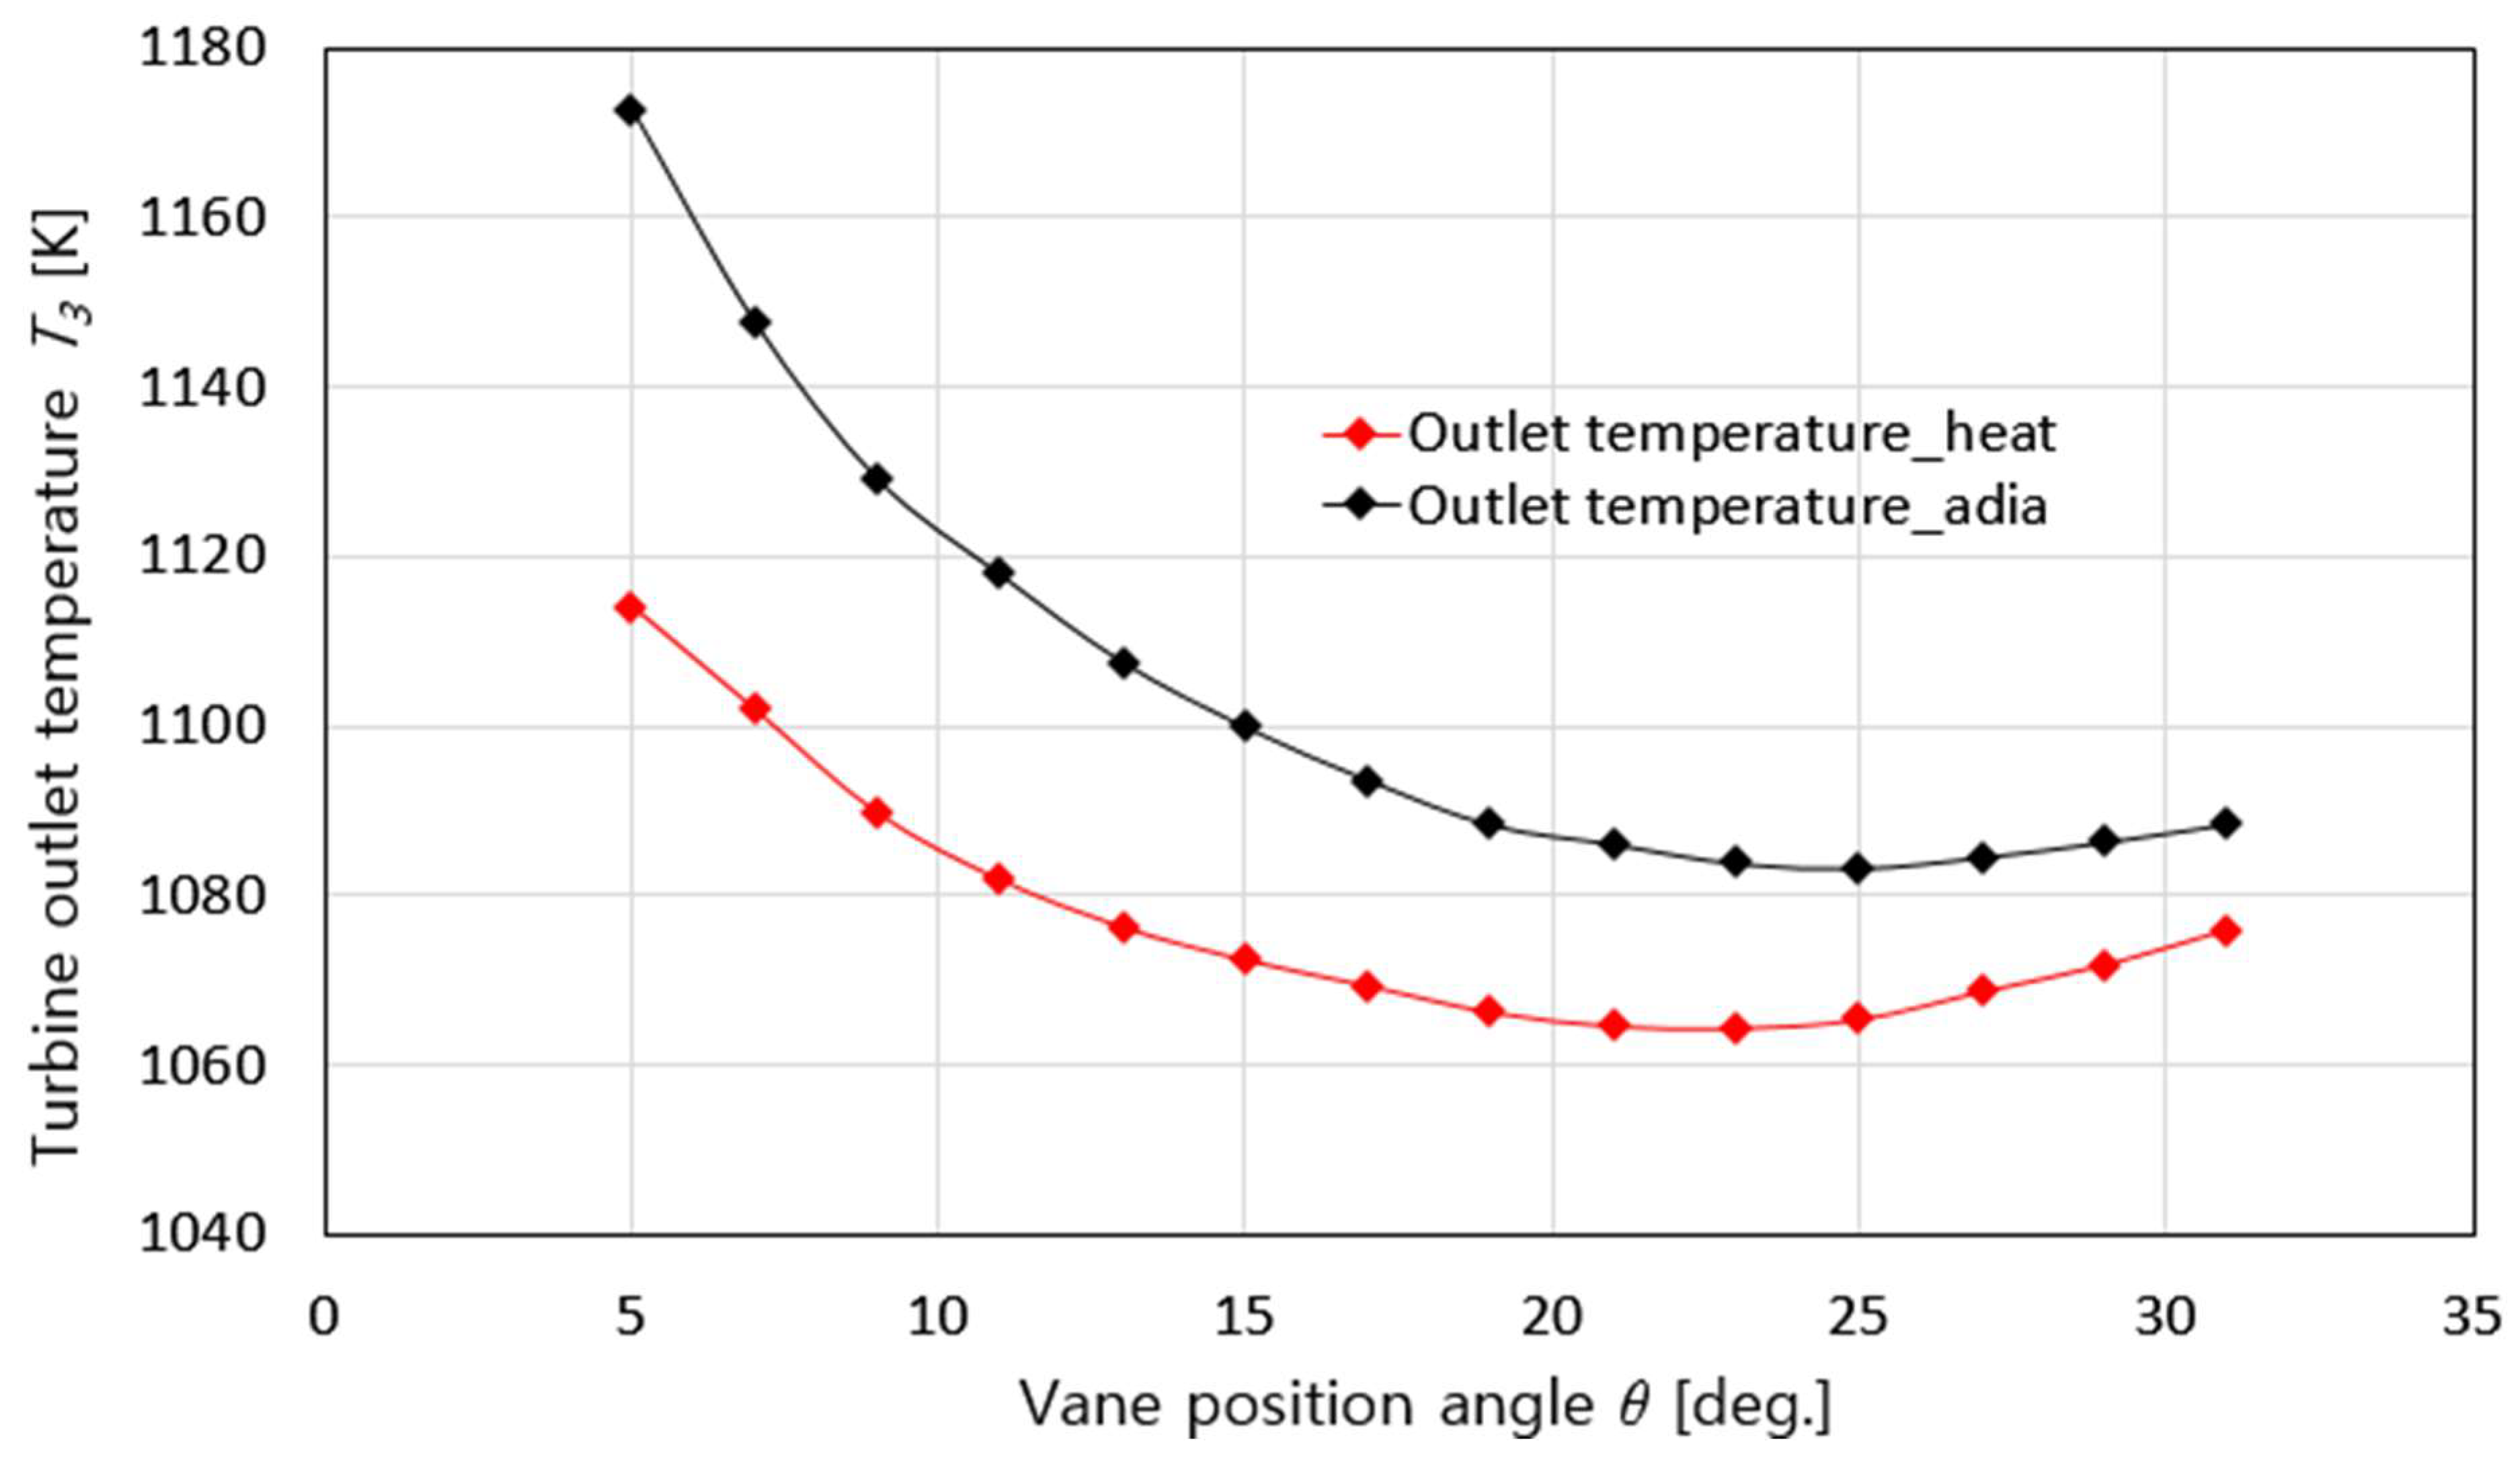
Figure 10 shows the results of calculating the changes in the power ratio () and wall heat release ratio () defined in Equations (3) and (4) for cases with and without heat transfer. In Equation (3), the power ratio () is proportional to the efficiency when the input and output pressure conditions are constant, and this result can be confirmed by comparing Figure 8 and Figure 10. In addition, from the wall heat release ratio () graph in Figure 10, we observed that when heat transfer occurred, as the vane angle increased, the heat transfer loss rate to the wall decreased in proportion to the supply flow rate. Owing to the influence of the wall heat transfer loss, the power ratio () value was lower when heat transfer was considered, from a maximum of approximately 1% to a minimum of approximately 0.2%, compared to when heat transfer was not considered. Therefore, when analyzing the turbine performance and considering heat transfer under these operating conditions, we observed that the turbine used up to approximately 13% of the total input energy supplied to the turbine as shaft power, transferred up to 8% of the heat energy to the wall, dissipated it, and released the remainder to the atmosphere. Consequently, the turbine received the input energy supplied at 1193 K and 1.7 bar, consumed it as shaft power and heat flow energy to the wall, and discharged the remaining energy into the atmosphere with the outlet temperature distribution shown in Figure 11.
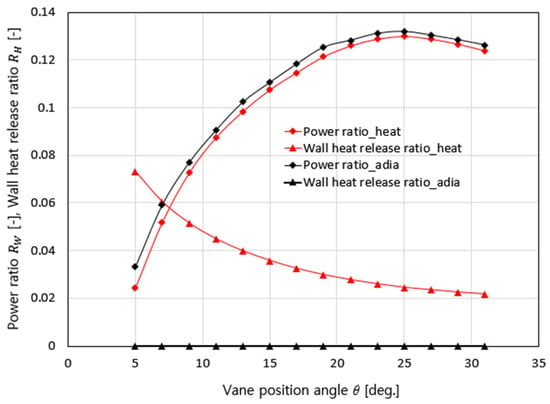
Figure 10.
Changes in power and wall heat release ratios according to changes in vane position angle under heat transfer and adiabatic conditions.
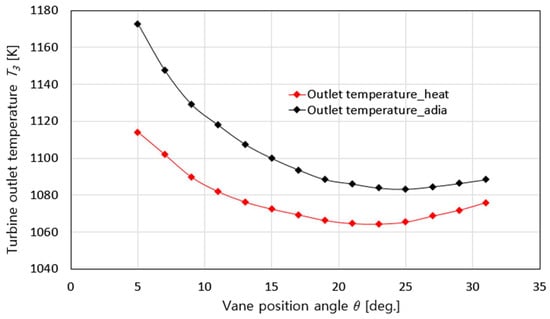
Figure 11.
Changes in turbine outlet temperature according to changes in vane position angle under heat transfer and adiabatic conditions.
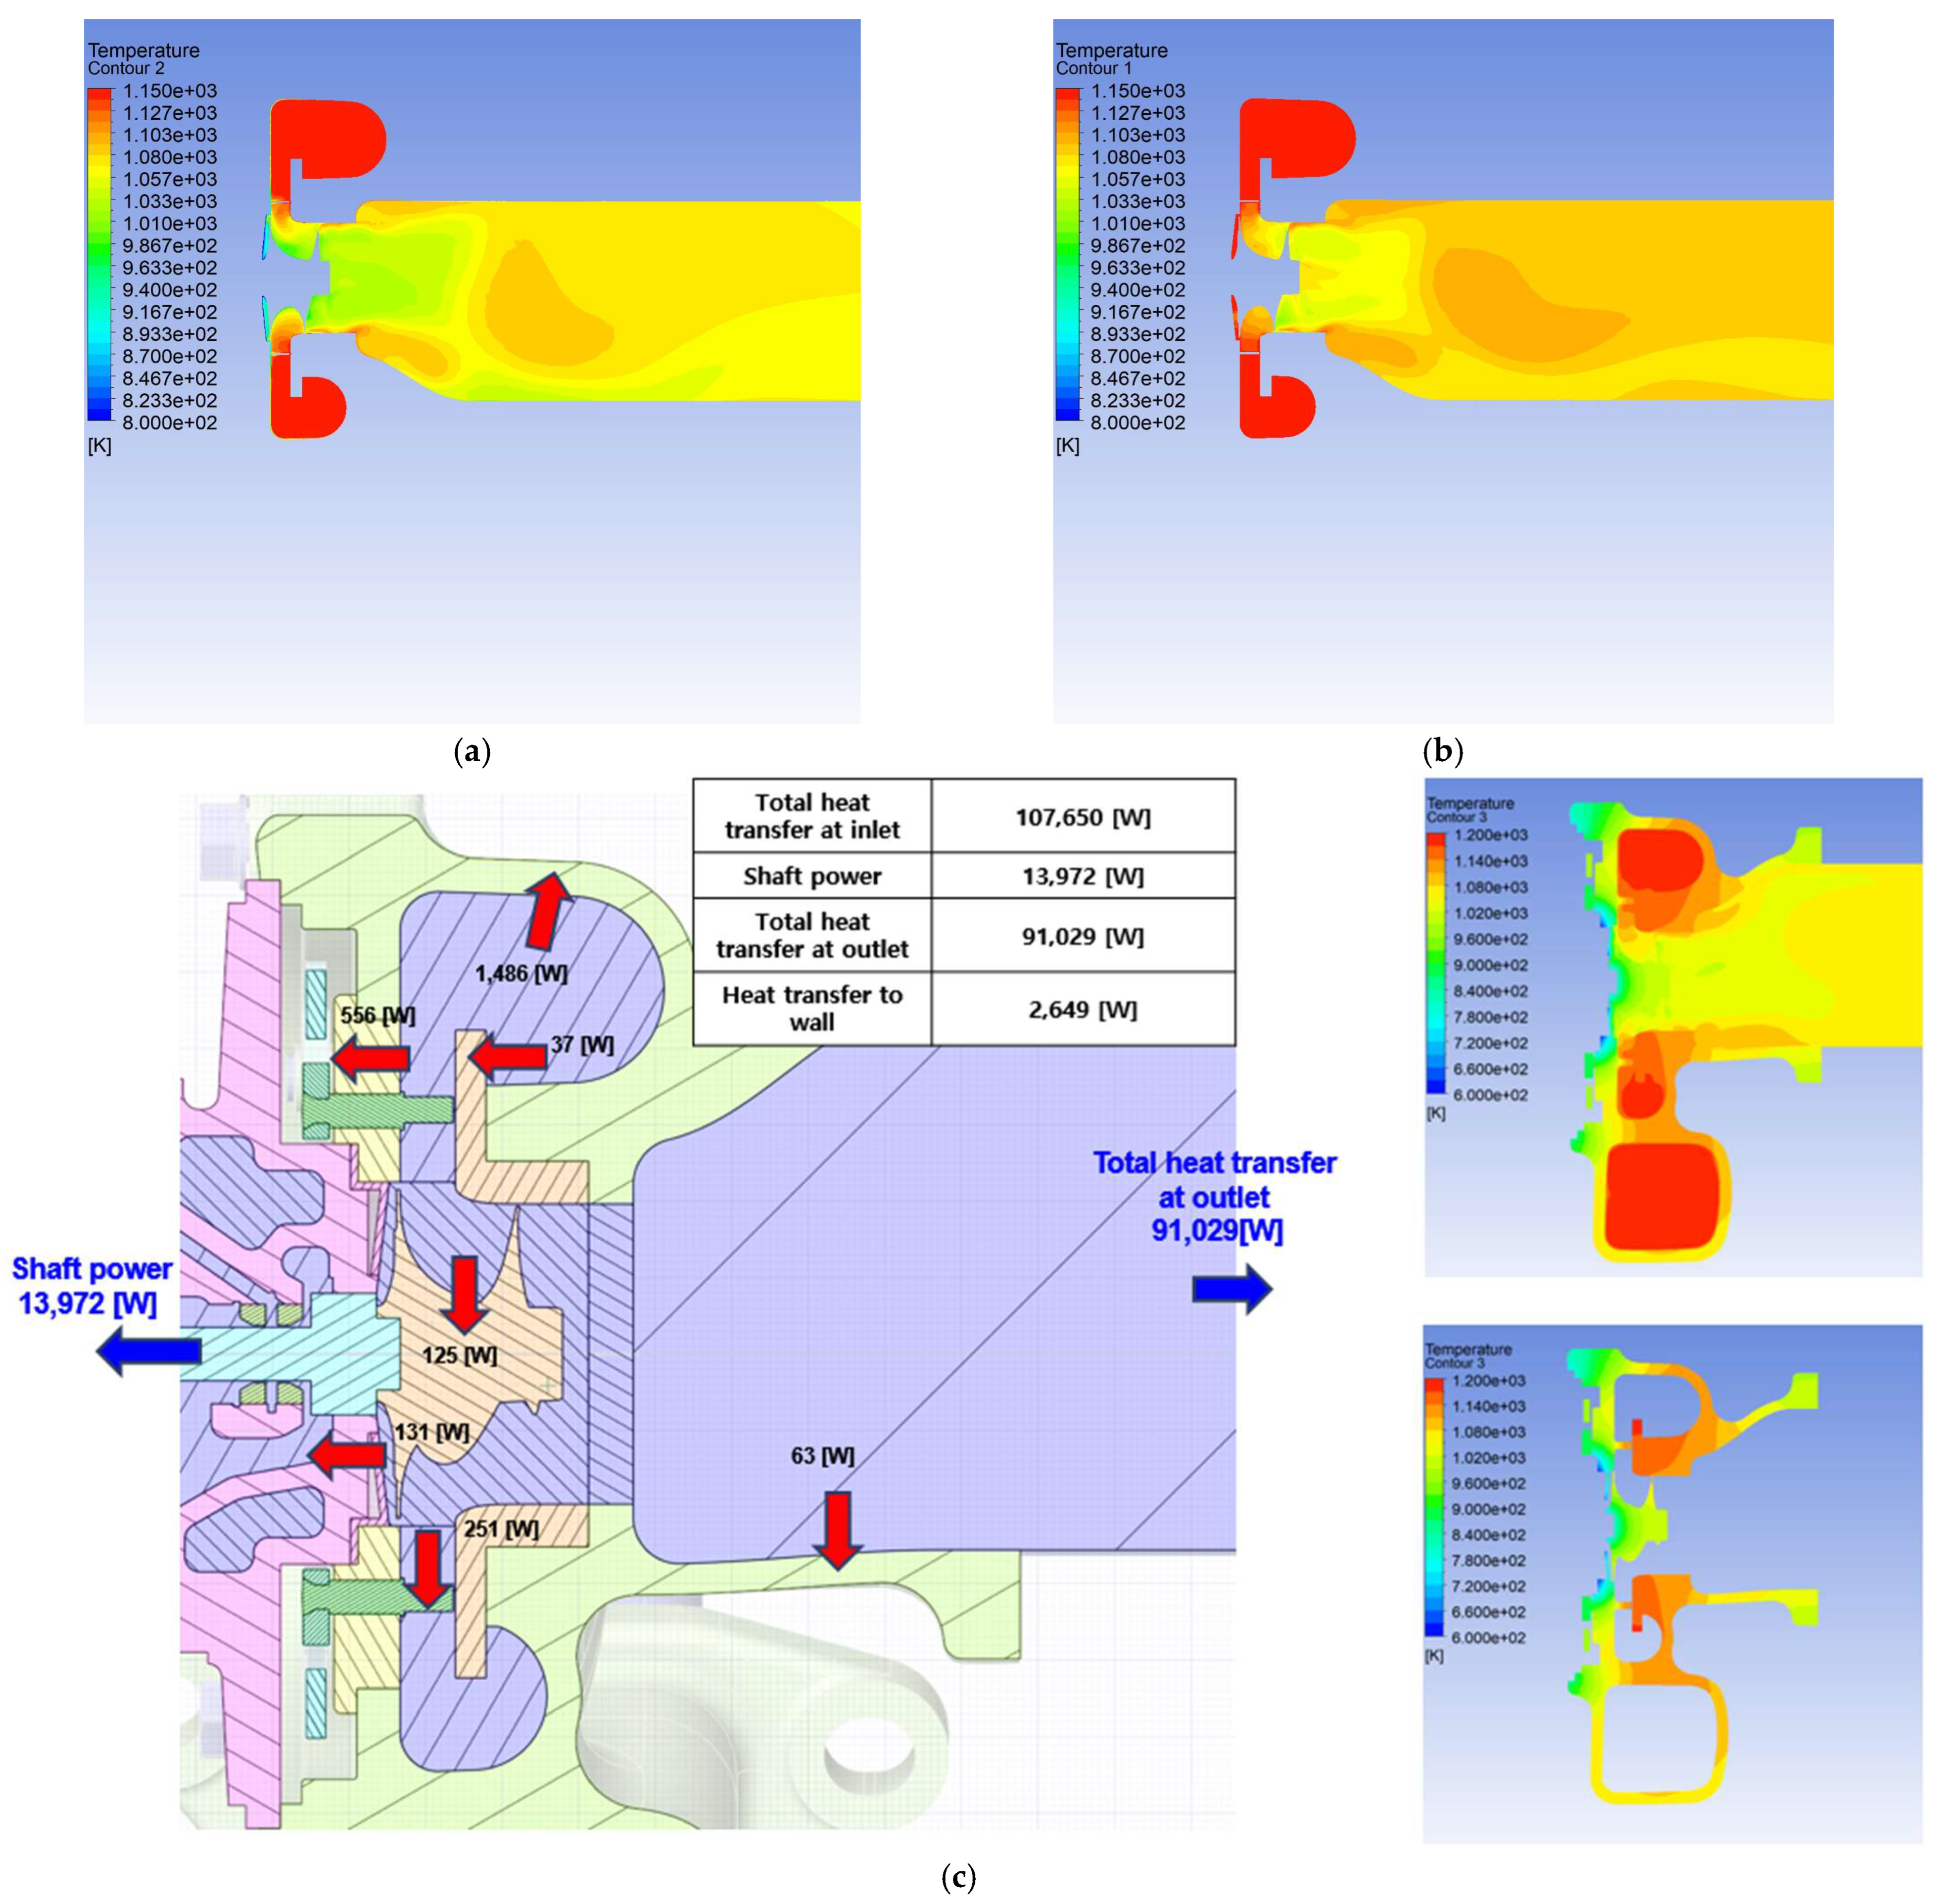
Figure 12a,b show the temperature distributions at the turbine outlet calculated for cases (a) considering the heat transfer and (b) not considering the heat transfer, when the vane operating angle is 25°. In addition, Figure 12c shows the distribution of heat loss through the turbine wall of the VGT from the total input energy supplied to the turbine when heat transfer is considered. As shown in the figure, a significant amount of energy supplied to the turbine is lost through the volute wall and then through the vanes and the back plate supporting the vanes. We confirmed that approximately 13% of the supplied energy was recovered as shaft power, approximately 3% was consumed as wall heat transfer, and the remaining 84% was discharged into the atmosphere.
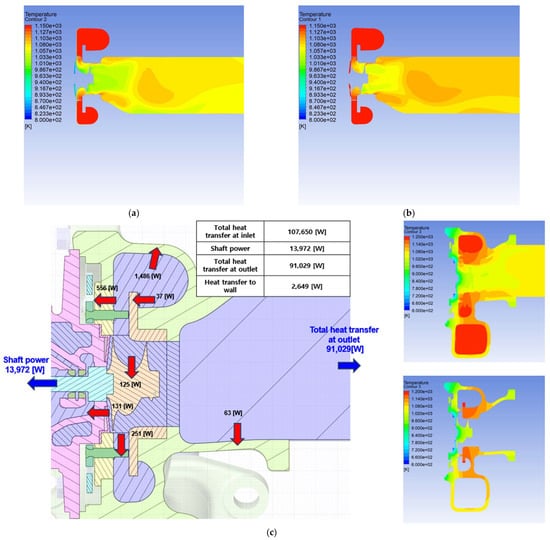
Figure 12.
Distribution of outlet working fluid temperature for cases (a) considering heat transfer, (b) not considering heat transfer, and (c) distribution of heat loss through the turbine wall when considering heat transfer.
As shown in Figure 10, if only the wall heat transfer is considered in the turbine performance analysis process, the turbine efficiency must be constant regardless of the vane opening when there is no heat transfer; if heat transfer is considered, the efficiency must increase in proportion to the vane opening. However, the trend shown in Figure 8, in which the efficiency decreases again after the vane position angle peaks at 25°, cannot be explained. The reason for the observed efficiency curve as shown in Figure 8 exhibited by the turbine efficiency defined in Equation (1) with an increase in the vane opening angle is because of the phenomenon that occurs owing to the flow loss inside the turbine during operation. Recently, several studies have utilized entropy production in relation to the heat flow loss analysis of turbines [13,14,15,16]. According to Li and Herwig et al., the total entropy production rate () related to the loss of fluid machinery when considering heat transfer is composed of a part owing to turbulent flow and a part owing to heat transfer, as shown in Equation (6) [16,17,18,19]. The part owing to turbulent flow is again expressed as a part owing to viscous dissipation () and a part owing to turbulent dissipation () by Equations (7) and (8), respectively, where heat transfer is expressed as a part owing to heat conduction by mean temperature gradients () and a part owing to heat conduction by fluctuating temperature gradients () by Equations (9) and (10). Equations (11)–(14) are the entropy production ratios defined using the entropy production rates defined above. The entropy production ratio, which is a dimensionless value, is obtained by dividing the entropy production rate generated by the working fluid in the turbine space during operation by the total input energy supplied to the turbine inlet, which is obtained through spatial integration. Then, the sum of these values is defined as the total entropy production ratio generated by the heat flow during turbine operation, as shown in Equation (15).
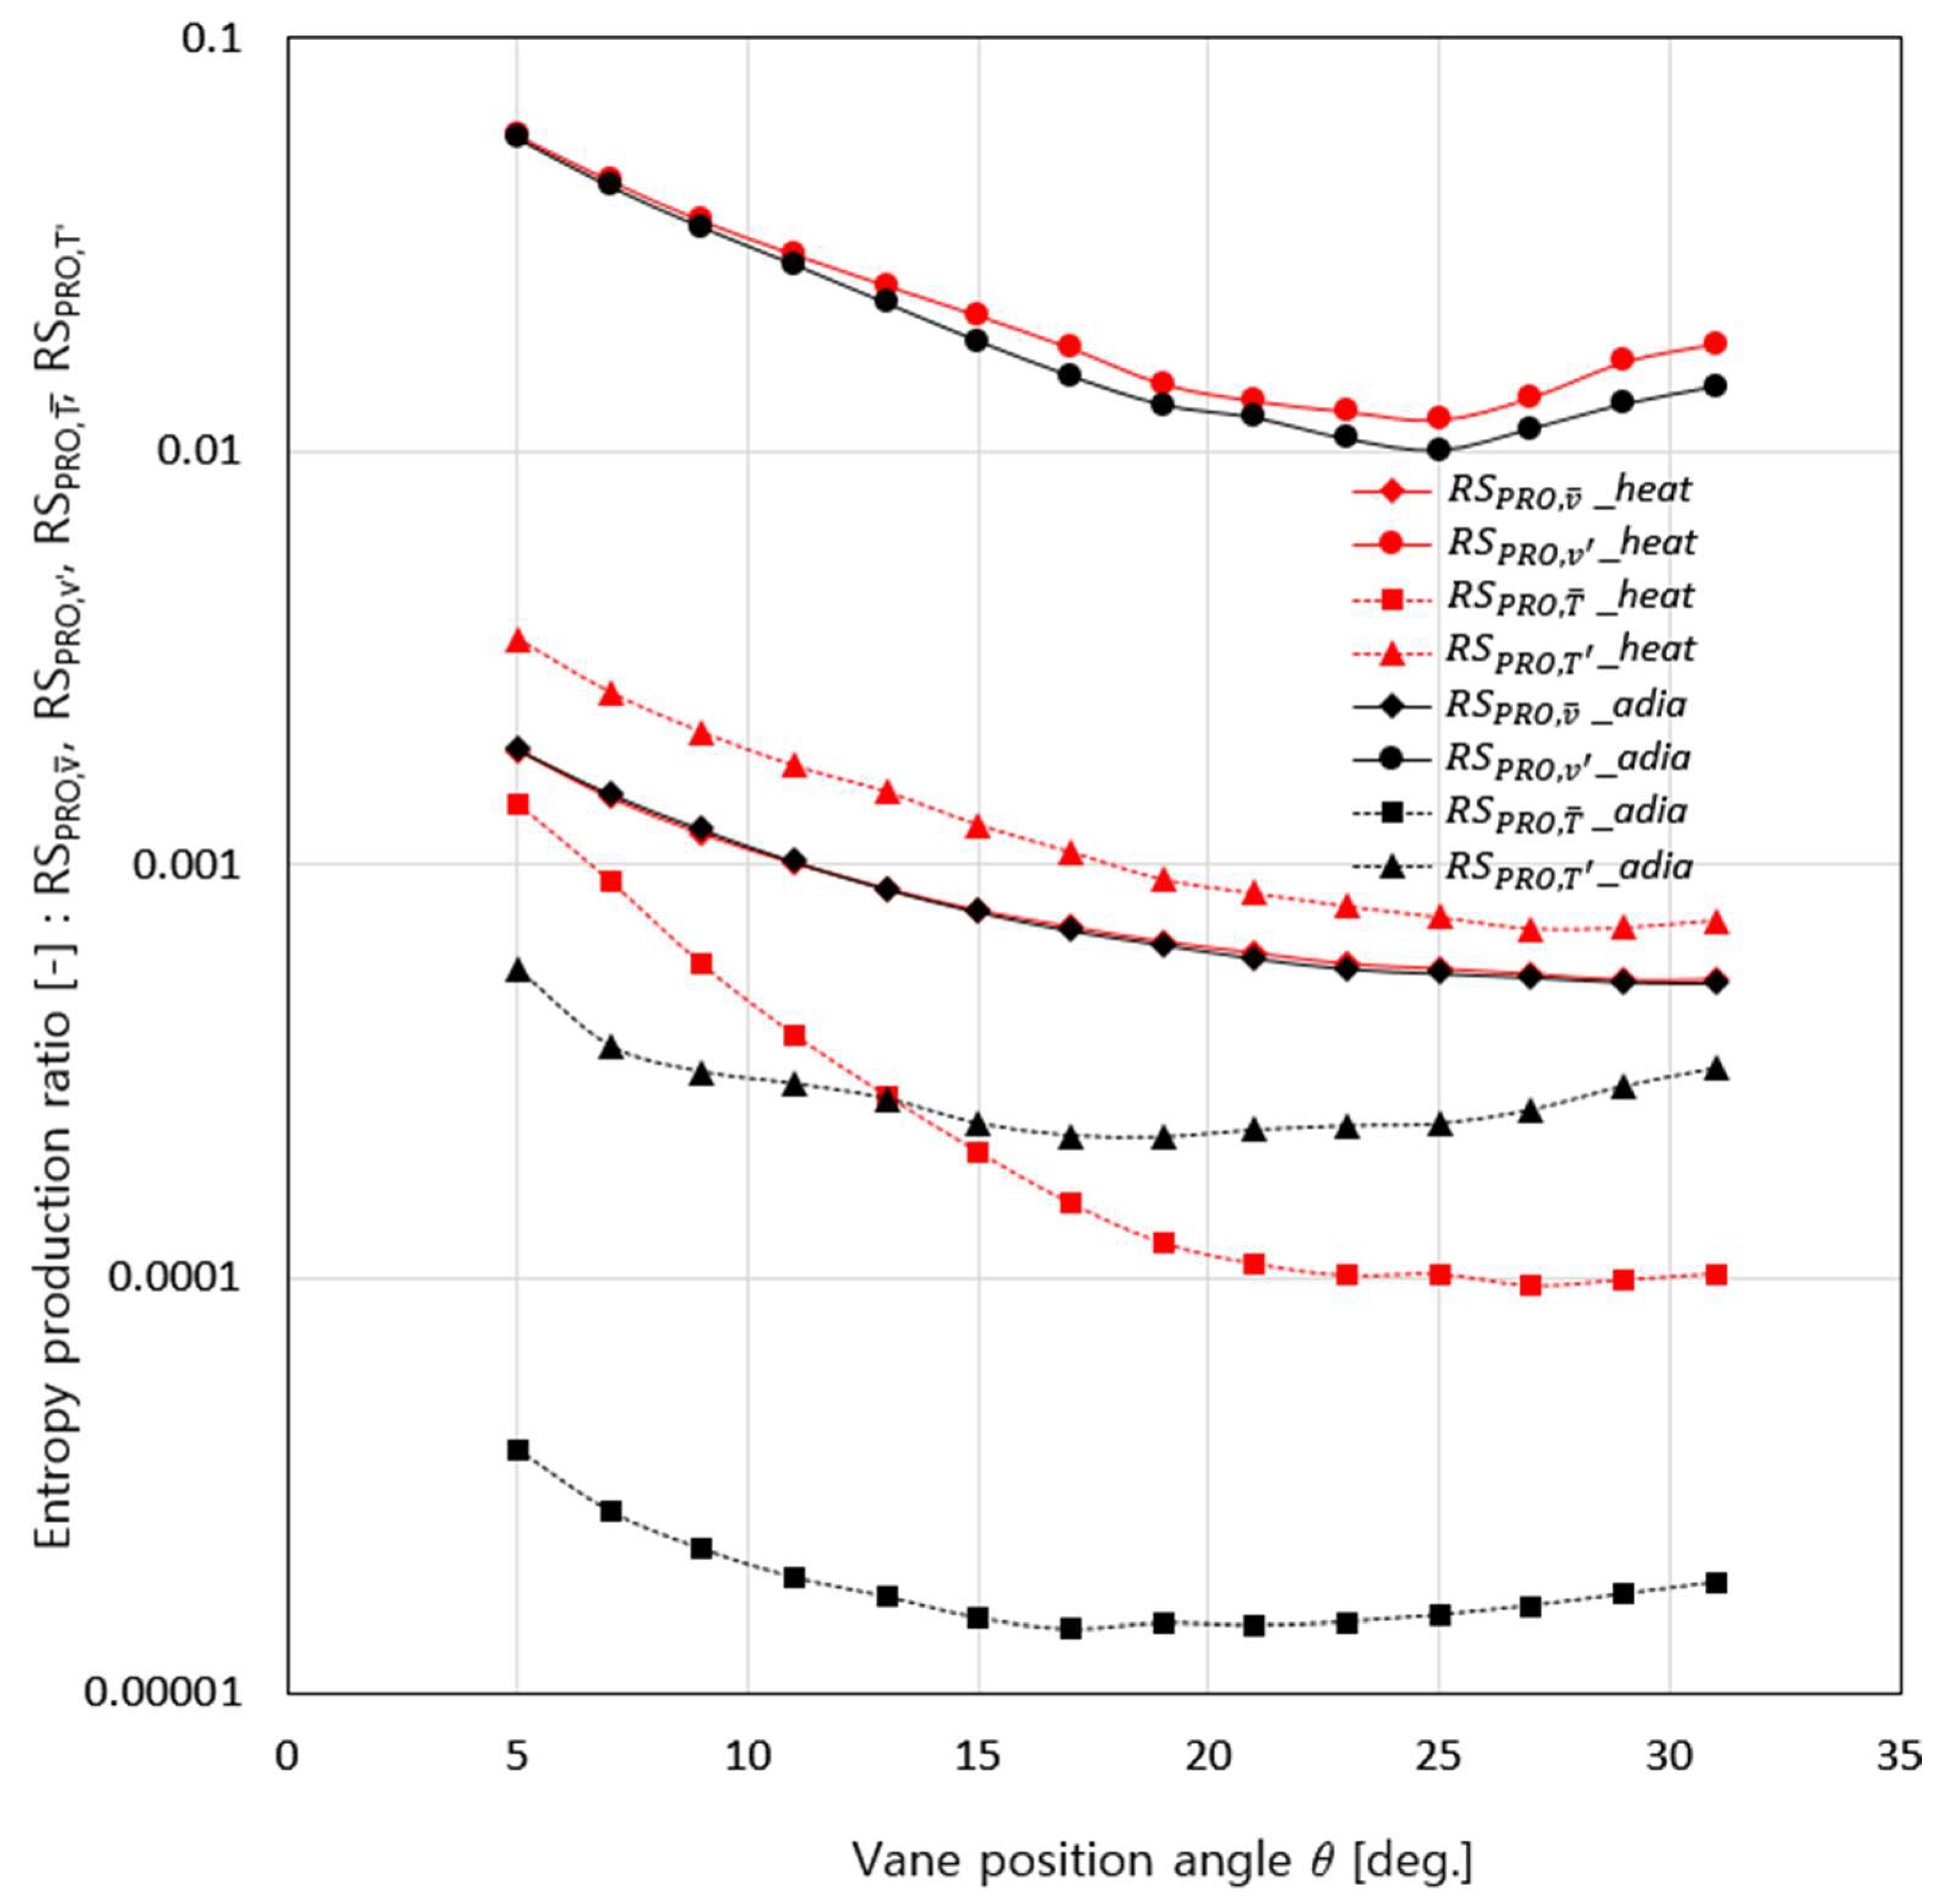
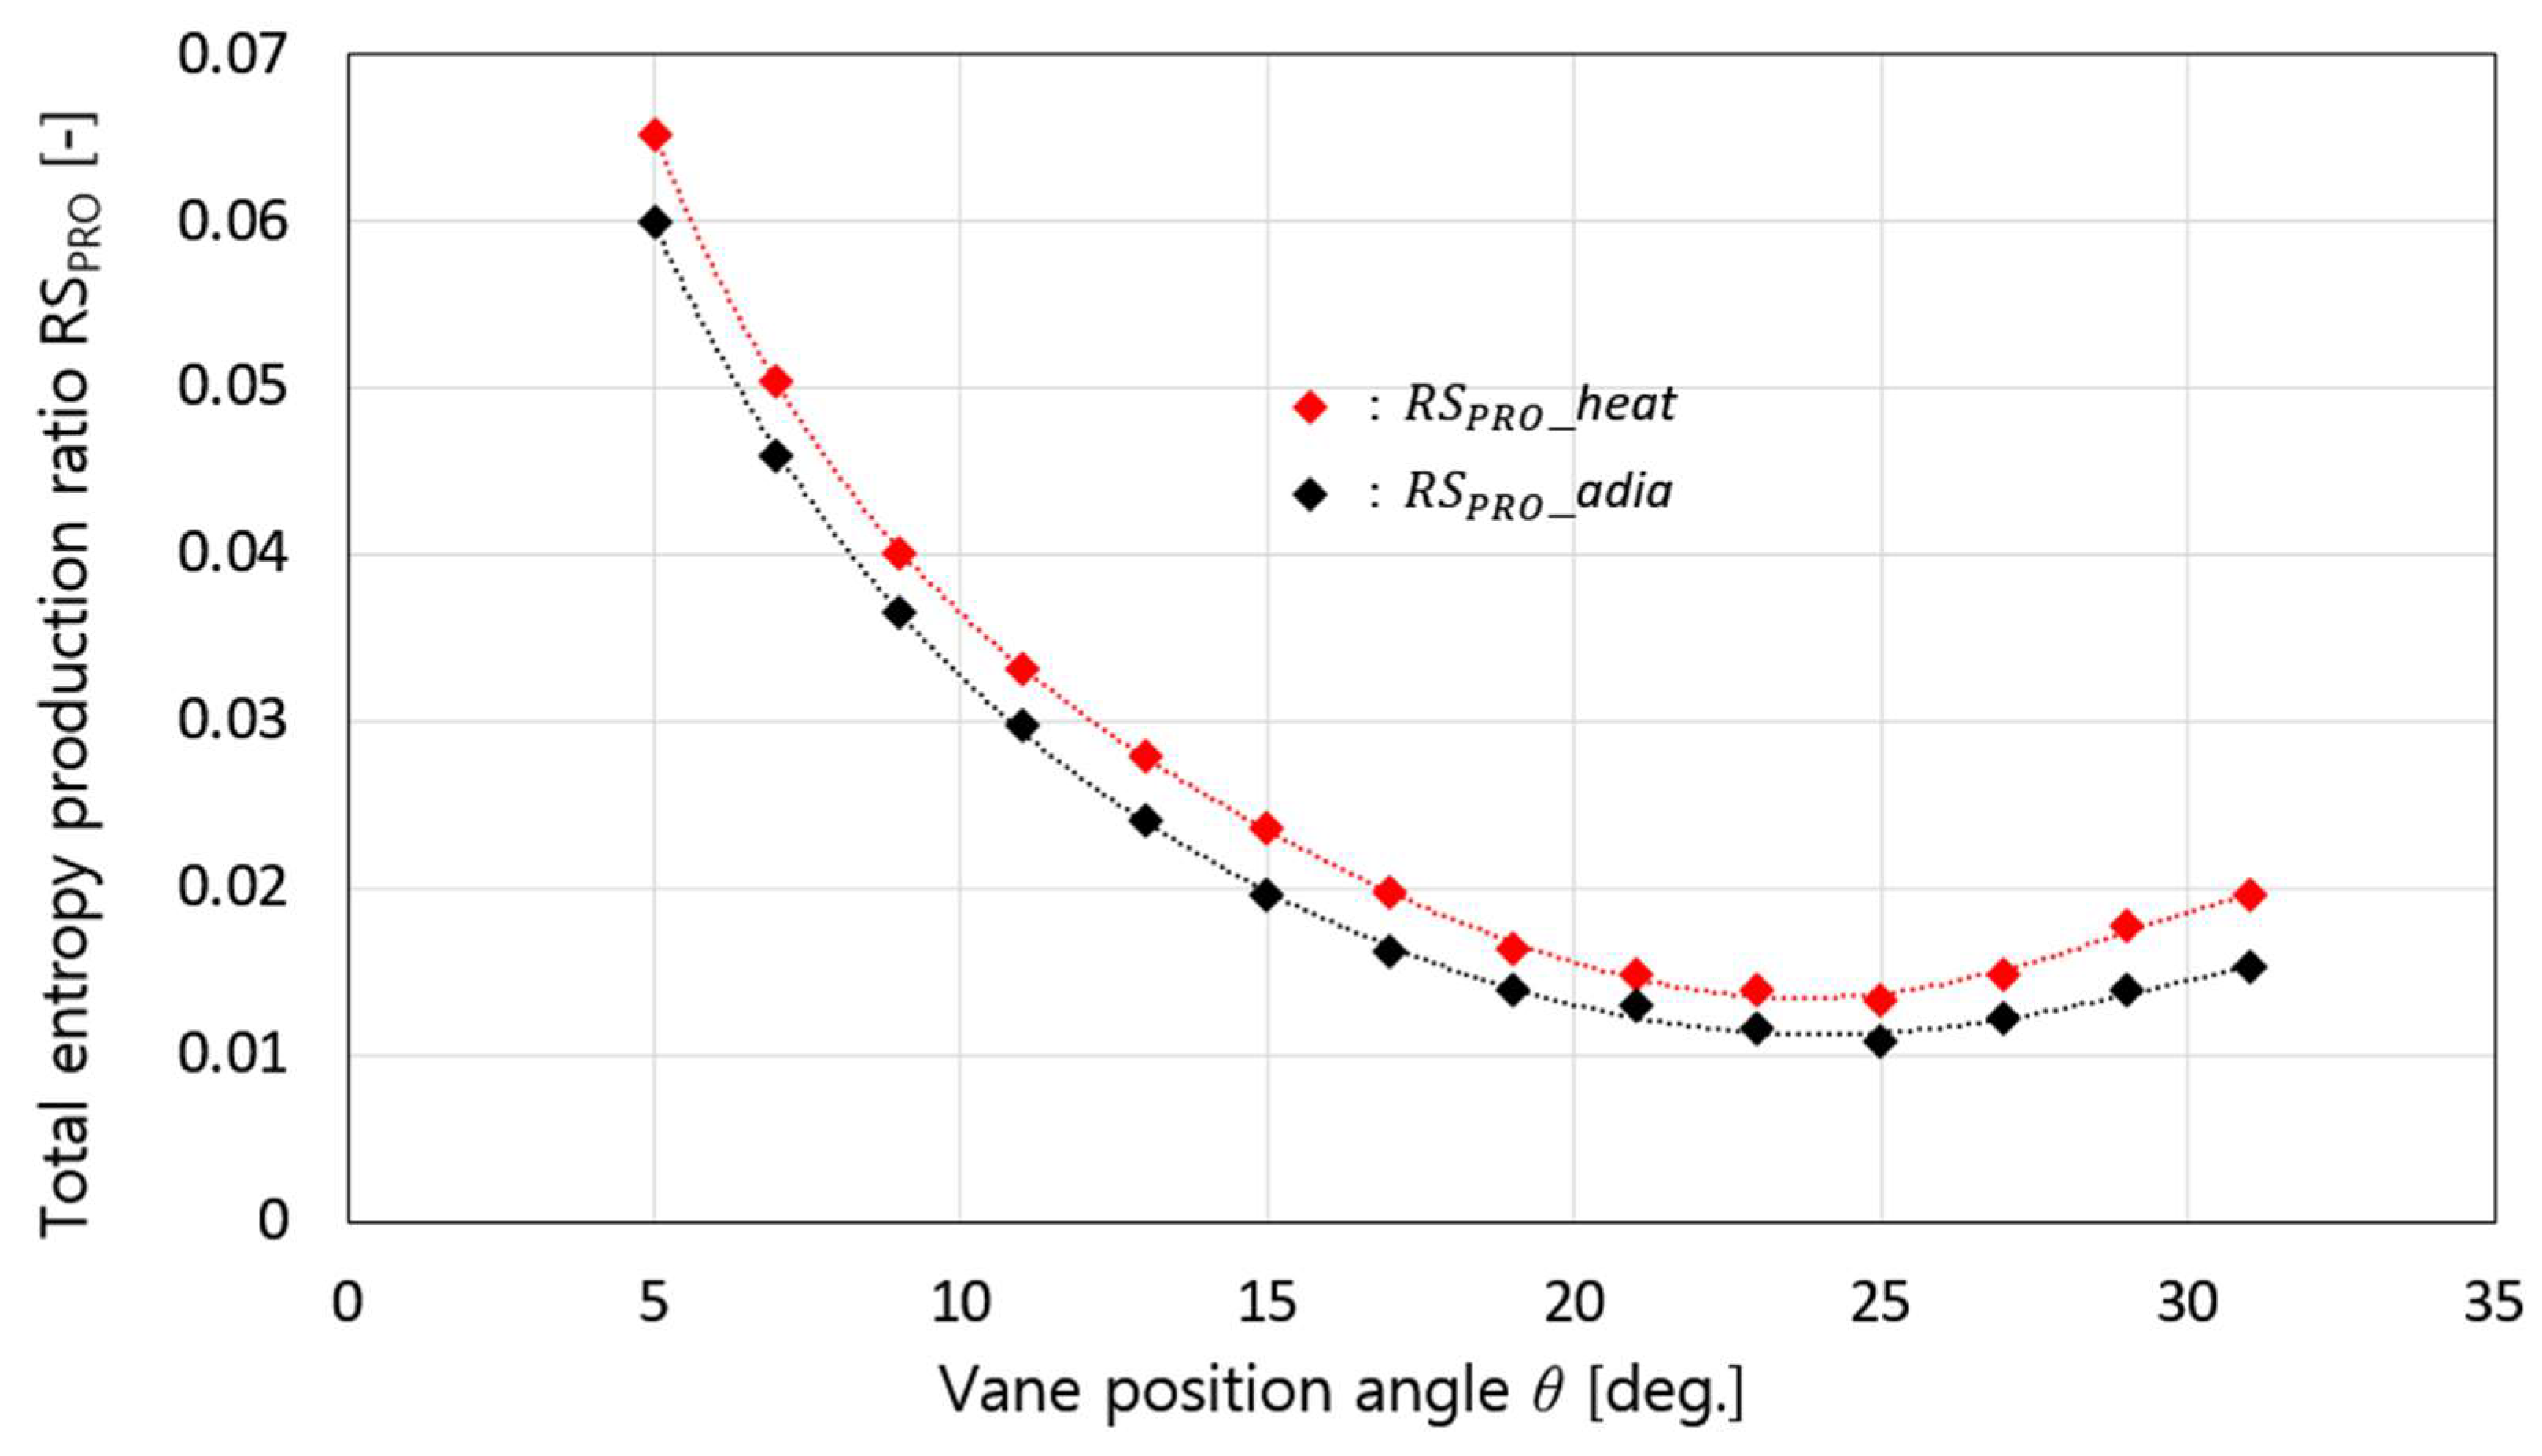
Figure 13 shows the results of the entropy production ratios according to the change in the vane position during turbine operation. From the figure, we confirmed that the entropy production ratio term () owing to the turbulent fluctuation of the flow in the turbine rotating at a high speed of 175,690 rpm had a much larger value than the other terms. This phenomenon is more severe when wall heat transfer is considered. This result is a general phenomenon found in many other studies, and the flow loss of a turbine rotating at high speed is mainly caused by dissipation owing to the turbulent fluctuation of the flow velocity. Figure 14 shows the total entropy production ratio () obtained by calculating all entropy production ratio values shown in Figure 13 according to Equation (14). The total entropy production ratio () has a minimum value at the vane position where the efficiency is the highest and shows a tendency to increase rapidly at other values. As explained above, this happens because when the vane position angle is operated at a point outside the maximum efficiency point, the inflow speed of the exhaust gas is induced at the turbine impeller inlet, and the turbine impeller inlet rotation speed and impeller inlet blade angle do not match, resulting in a large amount of shock loss. Therefore, efficiency decreases sharply when driving outside the most efficient vane angle. The total entropy production ratio when heat transfer is considered is shown to increase by 0.2–0.5% compared to when heat transfer is not considered. This result confirms that heat transfer loss directly affects flow loss.
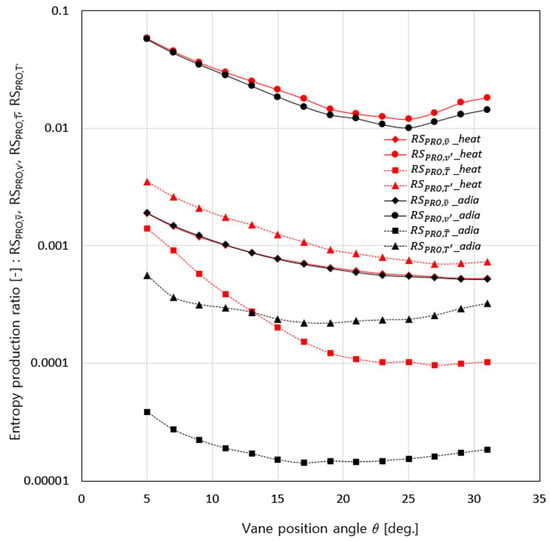
Figure 13.
Changes in entropy production ratios according to changes in vane position angle under heat transfer and adiabatic conditions.
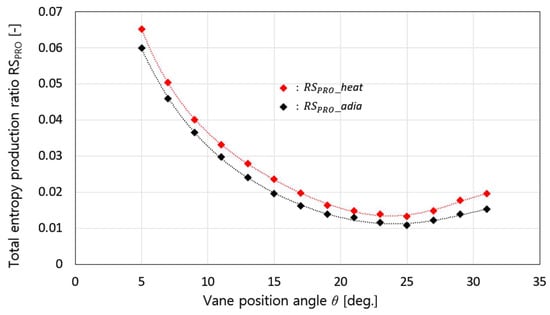
Figure 14.
Changes in total entropy production ratios according to changes in vane position angle under heat transfer and adiabatic conditions.
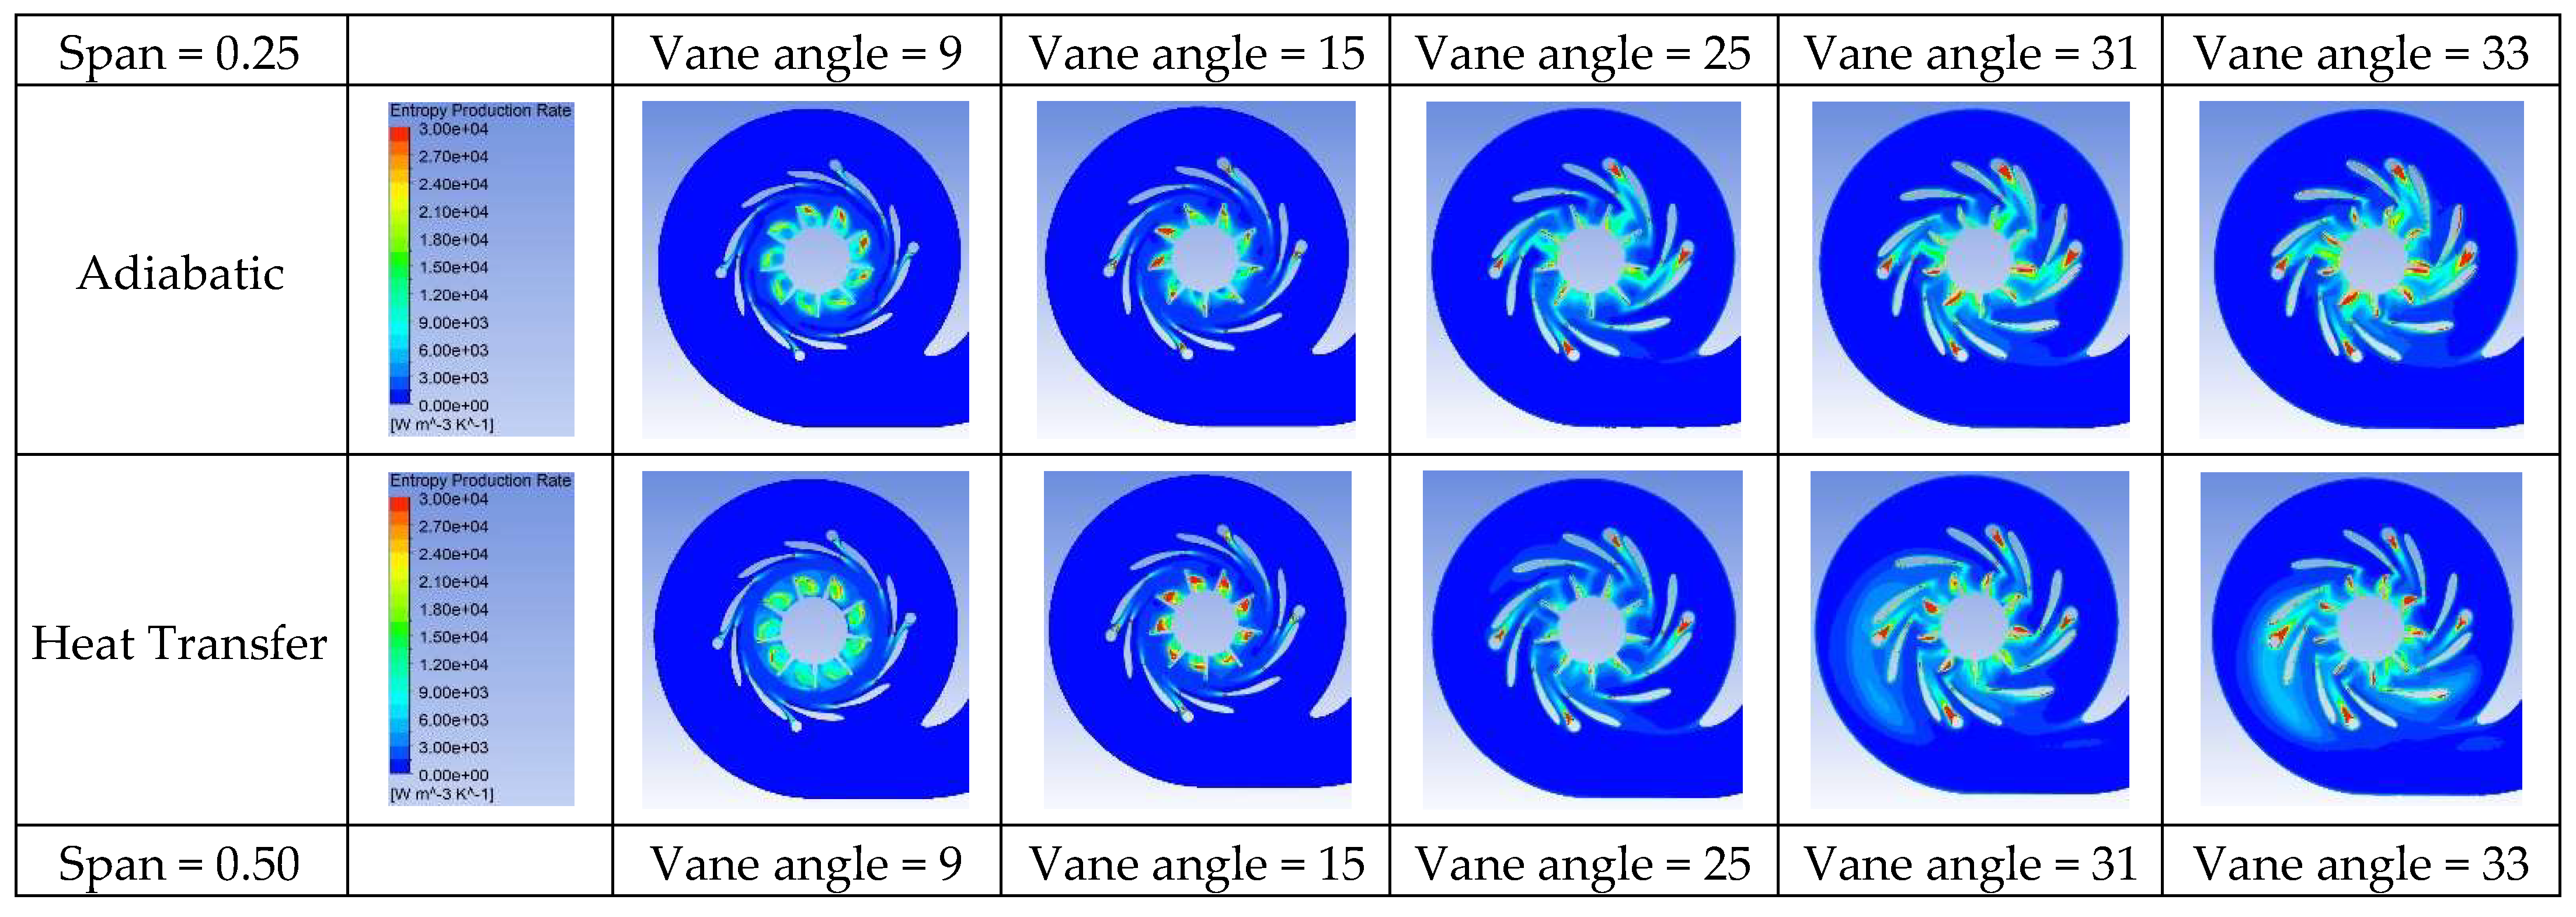
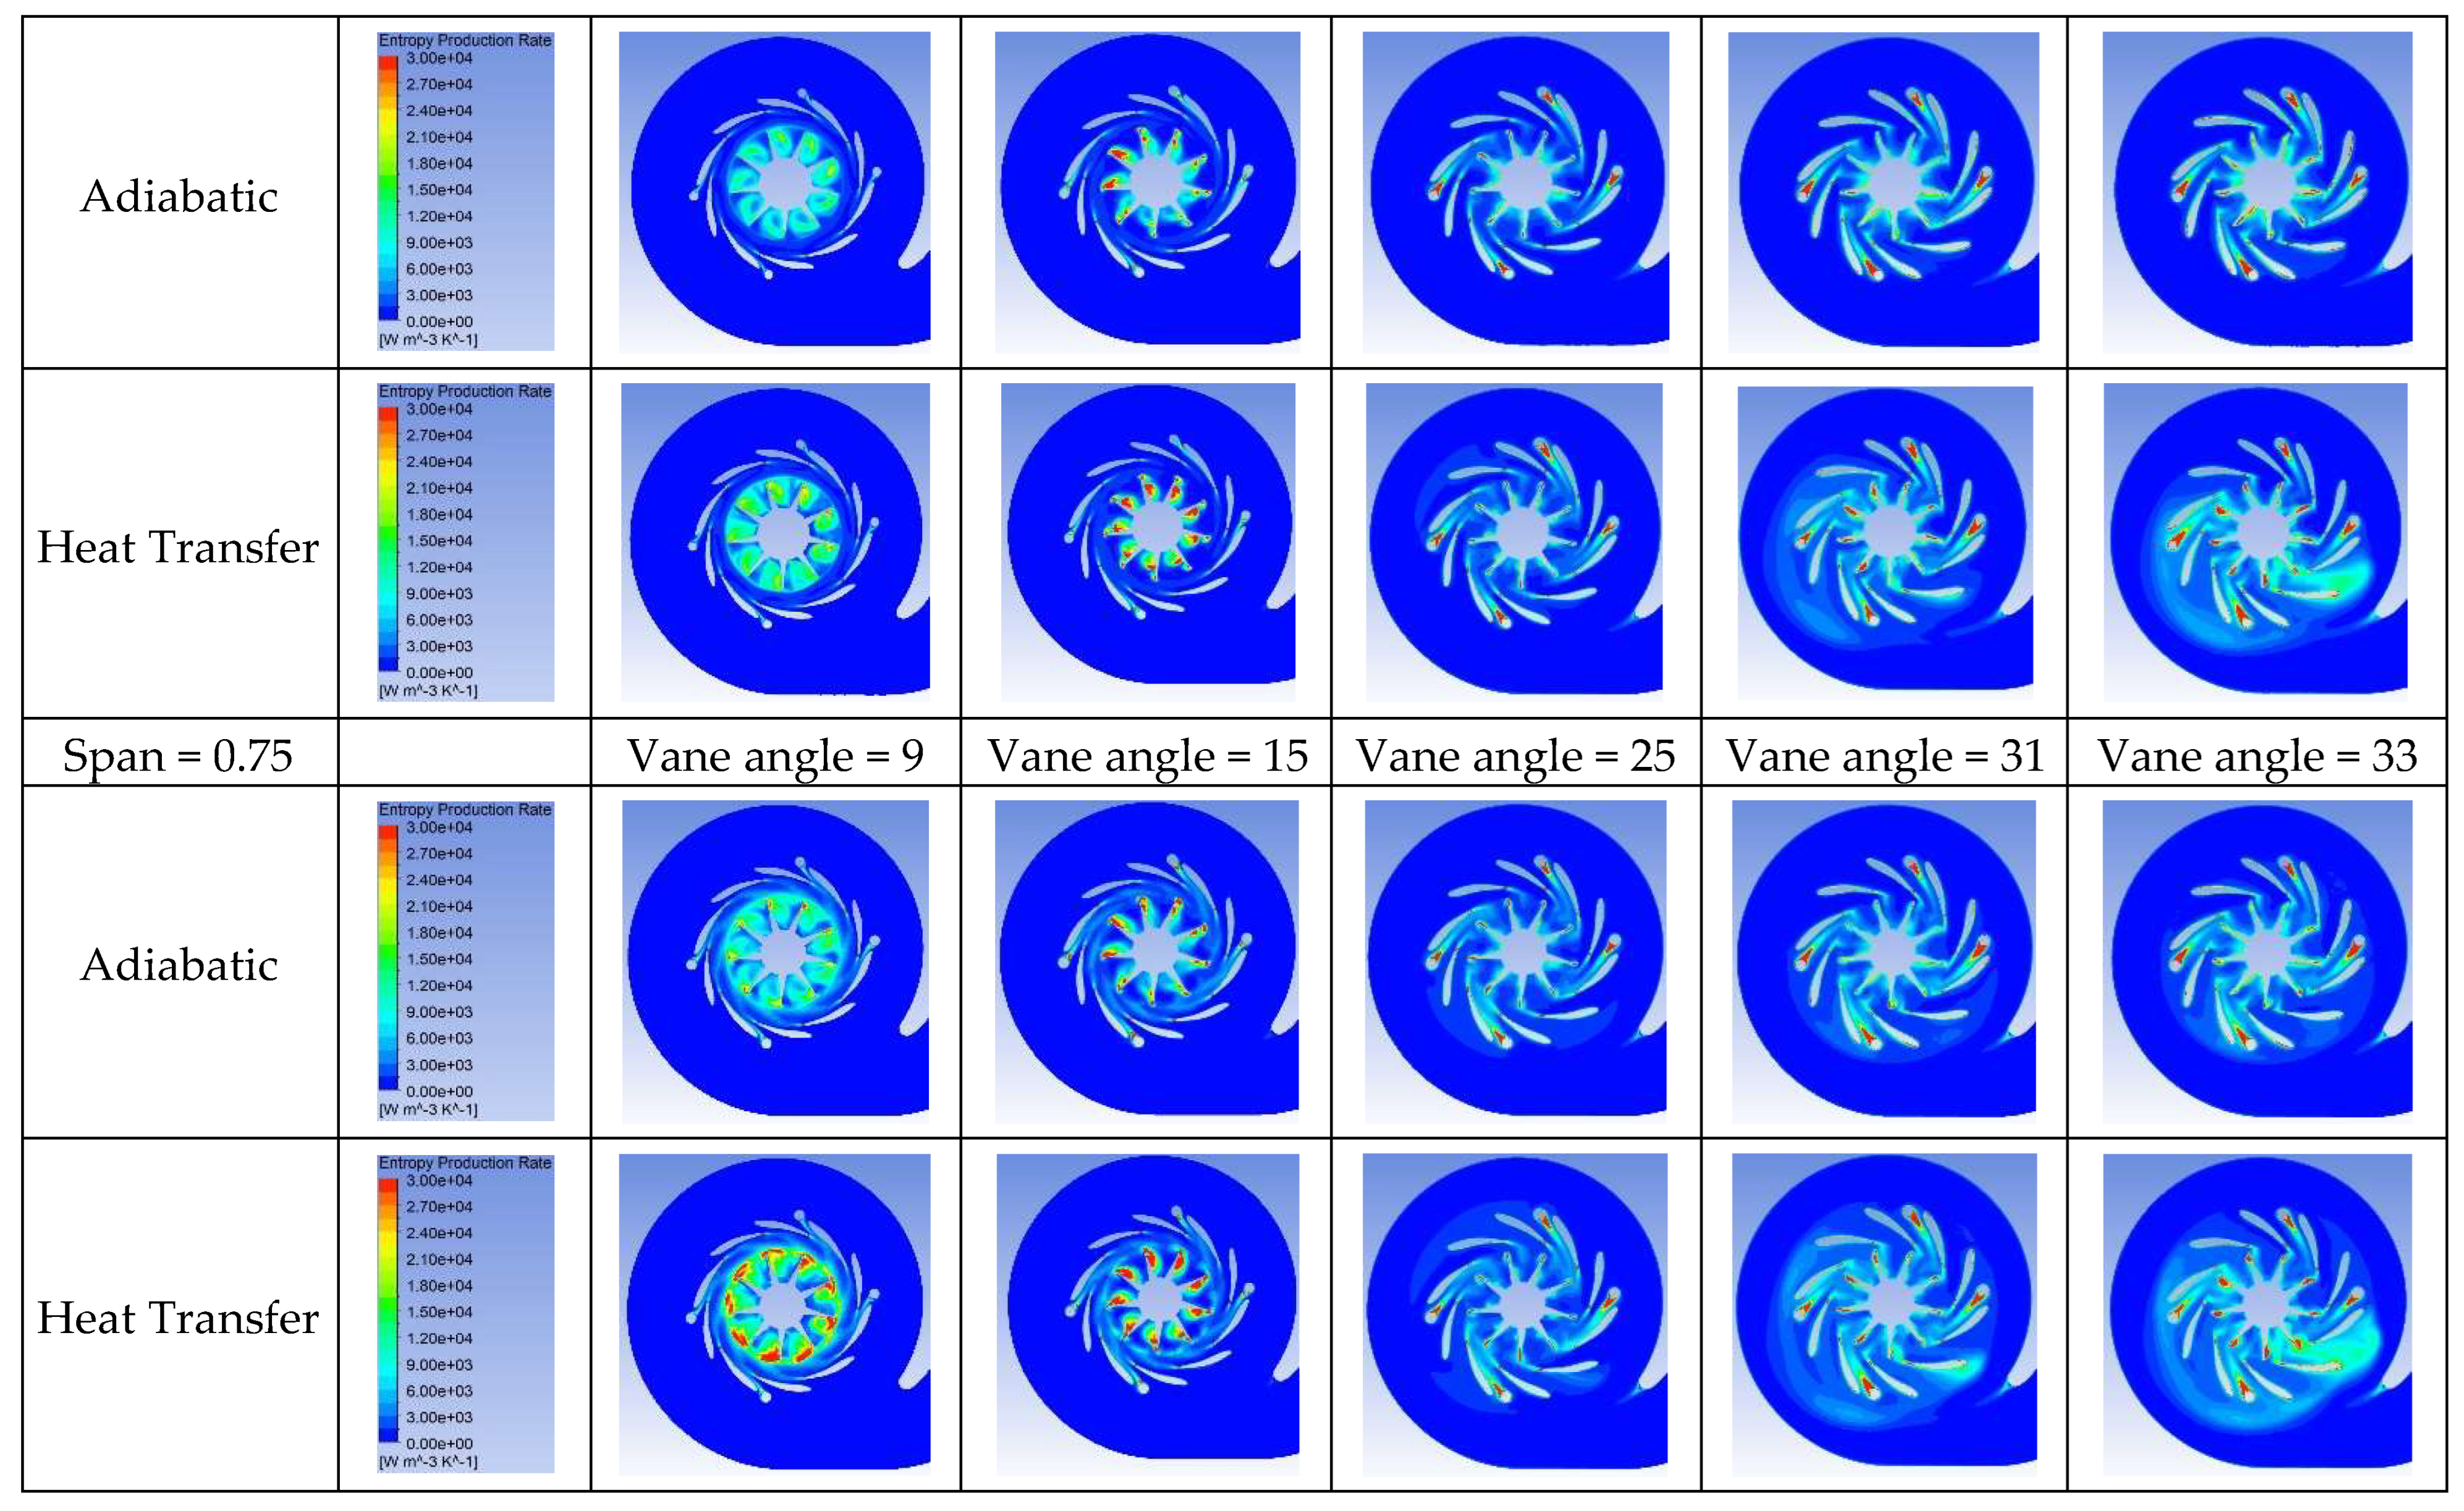
Figure 15 shows the distribution of the entropy production rate () inside the turbine according to the change in the vane angle. First, when the vane operating angle is 9°, the vane operating angle is too small, the entry angle of the exhaust gas through the vane to the turbine impeller inlet is too small compared to the turbine impeller inlet blade angle, and severe shock loss occurs on the turbine impeller inlet suction side; thus, the entropy production has a large value. This causes the efficiency of the turbine impeller to rapidly deteriorate. In addition, as the vane operating angle increased, the entry angle of the exhaust gas through the vane to the turbine impeller inlet gradually became identical to the turbine impeller inlet blade angle, and the shock loss decreased rapidly. When the vane operating angle is 25°, which shows the maximum efficiency, the entropy production value owing to the shock loss occurring at the turbine impeller inlet is minimized. After passing the maximum efficiency point, the entry angle of the exhaust gas through the vane to the turbine impeller is larger than the turbine impeller blade angle, which causes shock loss on the pressure side and reduces the efficiency. After comparing all figures together, we can conclude that this overall trend is the same regardless of the wall heat transfer phenomenon. As a result, the trend of change in total entropy production ratio according to the change in vane angle takes the form shown in Figure 14, and we can observe the efficiency change shown in Figure 8.
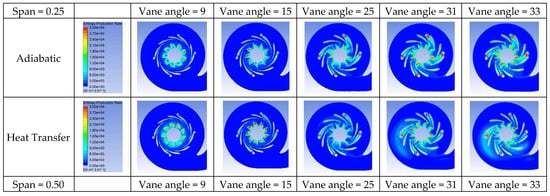
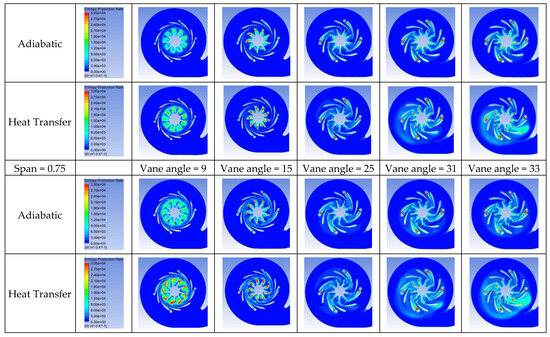
Figure 15.
Changes in entropy production rate () according to changes in vane position angle. Span is defined as the ratio of the distance from the hub to the shroud of the turbine.
4. Conclusions
Previous studies utilizing computational fluid dynamics analysis related to the turbine performance evaluation of VGT adopted to improve the performance of gasoline engines have mainly been conducted under the assumption of an adiabatic process. In this study, the turbine performance was evaluated according to the change in the vane position angle by considering the heat transfer phenomenon between all working fluids and the VGT applied to a gasoline engine that emitted exhaust gas at a higher temperature than a diesel engine; the difference was analyzed by comparing it with the case when the heat transfer phenomenon was not considered.
First, under constant operating conditions (input exhaust gas pressure and temperature and turbine rotation speed), the VGT turbine efficiency varied with the vane position angle, and the turbine’s maximum efficiency point occurred where the shock loss between the exhaust gas supplied through the vanes and the impeller was minimized. In addition, the vane position angle of 25°, at which the turbine’s highest efficiency was reached, was constant, regardless of whether the heat transfer phenomenon was considered in the computational fluid dynamics analysis process for the performance evaluation. Second, when heat transfer was considered in the computational fluid dynamics analysis process, the efficiency of the turbine decreased by approximately 2–6%, depending on the change in the vane position angle compared with when heat transfer was not considered; this efficiency reduction owing to the heat transfer phenomenon was more severe in areas where efficiency was relatively low. Third, the power ratio () (defined as the shaft power produced by the turbine divided by the total input energy) changed in the same way as the efficiency, depending on the change in the vane position angle, and had a value of approximately 0.13 at a vane position angle of 25°, which was the highest turbine efficiency. Additionally, the wall heat release ratio () (i.e., the heat transfer loss divided by the total input energy) tended to decrease continuously as the vane position angle increased. Owing to this effect, the power ratio was approximately 1–0.2% lower when heat transfer was considered than when it was not considered. Further, the flow loss related to the change in the turbine efficiency according to the change in the vane position angle was evaluated using four entropy production ratios. We confirmed that the entropy production ratio () owing to the turbulent velocity fluctuation of the flow in the turbine rotating at a high speed of 175,690 rpm had a much larger value than the other ratios. Finally, the total entropy production ratio () increased by 0.2–0.5% when heat transfer was considered compared with when heat transfer was not considered. From this result, we observed that the wall heat transfer phenomenon directly affected the flow loss inside the turbine.
Author Contributions
Conceptualization, writing-original draft, investigation, data curation, writing-review and editing, methodology, resources, supervision, funding acquisition, and project administration, J.-E.Y.; formal analysis, software, validation, and visualization, J.-Y.S.; formal analysis, C.H.; validation, resources, funding acquisition, and project administration, G.-Y.K. and H.-J.K. All authors have read and agreed to the published version of the manuscript.
Funding
This work was supported by the Development of a Variable Geometry Turbocharger for High-Efficiency Gasoline Engines program [grant number 20018843] as a support project for the Automobile Industry Technology Development (Green Car) project of the Ministry of Trade, Industry, and Energy.
Data Availability Statement
The original contributions presented in this study are included in the article, and further inquiries can be directed to the corresponding author.
Acknowledgments
We would like to thank the staff at Keyyang Precision Co., Ltd. for providing VGT experimental data that helped us complete this research paper.
Conflicts of Interest
Authors Gi-Yong Kim and Hyung-Jun Kim were employed by the company R&D Center, Keyyang Precision Co., Ltd. The remaining authors declare that the research was conducted in the absence of any commercial or financial relationships that could be construed as a potential conflict of interest.
List of Symbols
The following symbols and subscripts are used in this manuscript:
| Area vector [m2] | |
| Specific heat [J/kg K] | |
| GRTP | Mass flow parameter [(kg/s) K0.5/(kgf/cm2)] |
| Specific total enthalpy at turbine inlet [J/kg] | |
| Specific enthalpy at turbine outlet in isentropic process [J/kg] | |
| Mass flow rate [kg/s] | |
| Total pressure at turbine inlet [Pa] | |
| Pressure at turbine outlet [Pa] | |
| Heat transfer to turbine wall [W] | |
| Power ratio [-] | |
| Entropy production ratio [-] | |
| Wall heat release ratio [-] | |
| Entropy production rate [WK/m3] | |
| Fluctuating temperature [K] | |
| Mean temperature [K] | |
| Total temperature at turbine inlet [Pa] | |
| Fluctuating velocity components [m/s] | |
| Mean velocity components [m/s] | |
| Velocity vector [m/s] | |
| Volume [m3] | |
| Specific shaft work [J/kg] | |
| Shaft power [W] | |
| Cartesian coordinates [m] | |
| Greek symbols | |
| Thermal diffusivity [m2/s] | |
| Turbulent thermal diffusivity [m2/s] | |
| Empirical constant of SST- turbulence model [-], | |
| Ratio of specific heat of exhaust gas [-] | |
| Turbulent dissipation rate [m2/s3] | |
| Total-to-static efficiency [-] | |
| Turbulent kinetic energy [m2/s2] | |
| Viscosity [kg/ms] | |
| Thermal conductivity [W/mK] | |
| Density [kg/m3] | |
| Turbulence eddy frequency [1/s] | |
| Subscripts | |
| _adia | Adiabatic process |
| _heat | Heat transfer process |
References
- Czechanowski, M.; Gugau, M.; Gao, X.; Christmann, R. Variable Turbine Geometry for High-power Gasoline Engines. MTZ Worldw. 2025, 86, 16–23. [Google Scholar] [CrossRef]
- Wang, W.; Ueno, T.; Morita, I.; Garcia, N.P.; Sakaguchi, D. Internal Flow Analysis of an Optimized Turbine with a Variable Geometry System for Automotive Turbochargers. SSRN 2025, 5079938. [Google Scholar]
- Mazuro, P.; Kozak, D. Effect of variable geometry turbocharger on the performance of the opposed piston engine—An experimental approach. Appl. Therm. Eng. 2024, 236, 121602. [Google Scholar] [CrossRef]
- Serrano, J.R.; Piqueras, P.; De la Morena, J.; Gómez-Vilanova, A.; Guilain, S. Methodological analysis of variable geometry turbine technology impact on the performance of highly downsized spark-ignition engines. Energy 2021, 215, 119122. [Google Scholar] [CrossRef]
- Galloway, L.; Kim, S.I.; Park, J.Y.; Kwon, S.; Yoo, S.J. Aerodynamic Design Optimization of a Variable Geometry Nozzle Vane for Automotive Turbochargers. In Proceedings of the ASME Turbo Expo 2021: Turbomachinery Technical Conference and Exposition, Online, 7–11 June 2021. GT2021-59616. [Google Scholar]
- Gupta, B.; Hoshi, T.; Ogawa, S.; Osako, M.; Yoshizawa, H.; Inoue, N. Development of Next Generation Variable Geometry Turbocharger for Commercial Vehicles; SAE Technical Paper 2021-01-0643; SAE: Warrendale, PA, USA, 2021. [Google Scholar]
- Dasgupta, S.; Sarmah, P.; Borthakur, P.P. Application of Variable Geometry Turbine Turbochargers to Gasoline Engines—A review. Mater. Sci. Eng. 2020, 943, 012010. [Google Scholar] [CrossRef]
- Thomas, A.M.; Jensen, S.J.; Paul, P.M.; Ramesh, A.; Murugesan, R.; Kumarasamy, A. Simulation of a Diesel Engine with Variable Geometry Turbocharger and Parametric Study of Variable Vane Position on Engine Performance. Def. Sci. J. 2017, 67, 375–381. [Google Scholar] [CrossRef][Green Version]
- Feneley, A.J.; Pesiridis, A.; Andwari, A.M. Variable Geometry Turbocharger Technologies for Exhaust Energy Recovery and Boosting—A Review. Renew. Sustain. Energy Rev. 2017, 71, 959–975. [Google Scholar] [CrossRef]
- Sjerić, M.; Taritaš, I.; Tomić, R.; Blažić, M.; Kozarac, D.; Lulić, Z. Efficiency improvement of a spark-ignition engine at full load conditions using exhaust gas recirculation and variable geometry turbocharger—Numerical study. Energy Convers. Manag. 2016, 125, 26–39. [Google Scholar] [CrossRef]
- Racca, A. Turbocharger Design Optimization by Adjoint Method Coupled with CHT Analysis. Ph.D. Thesis, Von Karman Institute for Fluid Dynamics, Sint-Genesius-Rode, Belgium, 2021. [Google Scholar]
- Dimelow, A. Steady and transient conjugate heat transfer analysis of a turbocharger. In Proceedings of the 13th International Conference on Turbochargers and Turbocharging, London, UK, 16–17 May 2018; Institution of Mechanical Engineers: London, UK, 2018. [Google Scholar]
- Jia, X.; Zhang, X. Numerical Study on Local Entropy Production Mechanism of a Contra-Rotating Fan. Entropy 2023, 25, 1293. [Google Scholar] [CrossRef] [PubMed]
- Wang, Z.; Xie, B.; Xia, X.; Luo, L.; Yang, H.; Li, X. Entropy production analysis of a radial inflow turbine with variable inlet guide vane for ORC application. Energy 2023, 265, 126313. [Google Scholar] [CrossRef]
- Zhou, L.; Hang, J.; Bai, L.; Krzemianowski, Z.; El-Emam, M.A.; Yasser, E.; Agarwal, R. Application of entropy production theory for energy losses and other investigation in pumps and turbines: A review. Appl. Energy 2022, 318, 119211. [Google Scholar] [CrossRef]
- Li, D.; Wang, H.; Qin, Y.; Han, L.; Wei, X.; Qin, D. Entropy production analysis of hysteresis characteristic of a pump-turbine model. Energy Convers. Manag. 2017, 149, 175–191. [Google Scholar] [CrossRef]
- Herwig, H. The Role of Entropy Generation in Momentum and Heat Transfer. In Proceedings of the International Heat Transfer Conference IHTC14-23348, Washington, DC, USA, 8–13 August 2010. [Google Scholar]
- Herwig, H.; Kock, F. Direct and Indirect Methods of Calculating Entropy Generation Rates in Turbulent Convective Heat Transfer Problems. Heat Mass Transf. 2007, 43, 207–215. [Google Scholar] [CrossRef]
- Kock, F.; Herwig, H. Entropy production calculation for turbulent shear flows and their implementation in CFD codes. Int. J. Heat Fluid Flow. 2005, 26, 672–680. [Google Scholar] [CrossRef]
Disclaimer/Publisher’s Note: The statements, opinions and data contained in all publications are solely those of the individual author(s) and contributor(s) and not of MDPI and/or the editor(s). MDPI and/or the editor(s) disclaim responsibility for any injury to people or property resulting from any ideas, methods, instructions or products referred to in the content. |
© 2025 by the authors. Licensee MDPI, Basel, Switzerland. This article is an open access article distributed under the terms and conditions of the Creative Commons Attribution (CC BY) license (https://creativecommons.org/licenses/by/4.0/).

