Article

Restructuring the Coupling Coordination Mechanism of the Economy–Energy–Environment (3E) System Under the Dual Carbon Emissions Control Policy—An Exploration Based on the “Triangular Trinity” Theoretical Framework

1
Guangzhou Power Supply Bureau of Guangdong Power Grid Co., Ltd., Guangzhou 510620, China
2
Guangdong Provincial Key Laboratory of Renewable Energy, Guangzhou Institute of Energy Conversion, Chinese Academy of Sciences, Guangzhou 510640, China
3
School of Engineering Science-Energy Science and Technology, University of Science and Technology of China, Hefei 230026, China
*
Author to whom correspondence should be addressed.
Energies 2025, 18(14), 3735; https://doi.org/10.3390/en18143735
Submission received: 7 June 2025 / Revised: 9 July 2025 / Accepted: 11 July 2025 / Published: 15 July 2025

Abstract

Against the backdrop of the profound restructuring in global climate governance, China’s energy management system is undergoing a comprehensive transition from dual energy consumption control to dual carbon emissions control. This policy shift fundamentally alters the underlying logic of energy-focused regulation and inevitably impacts the economy–energy–environment (3E) system. This study innovatively constructs a “Triangular Trinity” theoretical framework integrating internal, intermediate, and external triangular couplings, as well as providing a granular analysis of their transmission relationships and feedback mechanisms. Using Guangdong Province as a case study, this study takes the dual control emissions policy within the external triangle as an entry point to research the restructuring logic of dual carbon emissions control for the coupling coordination mechanisms of the 3E system. The key findings are as follows: (1) Policy efficacy evolution: During 2005–2016, dual energy consumption control significantly improved energy conservation and emissions reduction, elevating Guangdong’s 3E coupling coordination. Post 2017, however, its singular focus on total energy consumption revealed limitations, causing a decline in 3E coordination. Dual carbon emissions control demonstrably enhances 3E systemic synergy. (2) Decoupling dynamics: Dual carbon emissions control accelerates economic–carbon emission decoupling, while slowing economic–energy consumption decoupling. This created an elasticity space of 5.092 million tons of standard coal equivalent (sce) and reduced carbon emissions by 26.43 million tons, enabling high-quality economic development. (3) Mechanism reconstruction: By leveraging external triangular elements (energy-saving technologies and market mechanisms) to act on the energy subsystem, dual carbon emissions control leads to optimal solutions to the “Energy Trilemma”. This drives the systematic restructuring of the sustainability triangle, achieving high-order 3E coupling coordination. The Triangular Trinity framework constructed by us in the paper is an innovative attempt in relation to the theory of energy transition, providing a referenceable methodology for resolving the contradictions of the 3E system. The research results can provide theoretical support and practical reference for the low-carbon energy transition of provinces and cities with similar energy structures.

1. Introduction

Against the backdrop of the profound restructuring in global climate governance, China’s energy management system is undergoing a comprehensive transition. China’s dual energy consumption control system was established during the 11th Five-Year Plan period (2006–2010) [1]. By regulating both total energy consumption and energy consumption per unit of GDP, it effectively curbed extensive growth patterns. However, under the carbon peak and carbon neutrality goals, this undifferentiated approach—imposing blanket controls on all energy sources without distinguishing between fossil and non-fossil energy—has constrained the development of non-fossil energy industries, thus hindering economic progress. This “one-size-fits-all” management model exposes fundamental value conflicts between energy consumption control and carbon reduction objectives. The 2021 Central Economic Work Conference first proposed “creating conditions to advance the transition from dual energy consumption control to dual carbon emissions control” [2], marking the beginning of a systemic shift after 15 years of energy-focused regulation (i.e., the control of total energy consumption and energy intensity) toward a carbon-centered framework (i.e., the control of total carbon emissions and carbon intensity). Subsequently, the Chinese government has introduced a series of policies to accelerate this transition [3,4]. The “Accelerating the Construction of the Institutional Framework for Dual Control of Carbon Emissions: Implementation Plan (State Council Circular, 2024)” formally established China’s institutional framework, centered on the dual control of total carbon emissions and carbon intensity [5].
Dual carbon emissions control is a novel policy that was first proposed by the Chinese government in 2021. The international academic community, though rarely using the term “dual carbon emissions control” directly, has extensively studied the advantages and disadvantages of absolute emission caps and intensity targets, as well as their combined application and practical effectiveness. These studies essentially formed the core of the research on “dual carbon emissions control”. International studies have mainly focused on the following three aspects:
(1) Theoretical foundations and policy goal selection: This area investigates why and how to choose between absolute carbon emission caps, intensity targets, or their combination (“dual carbon emissions control”). The core focus lies in balancing different objectives across economic efficiency, environmental certainty, equity, political acceptability, and resilience to economic fluctuations [6].
(2) Policy design and implementation mechanisms: Research in this area explores translating absolute and intensity control goals into specific policy instruments (e.g., carbon markets, carbon taxes, and regulatory standards), as well as how to integrate the “dual control” concept into the design of these tools [7,8,9].
(3) Impact assessment and challenge mitigation: This area involves evaluating the effects of carbon emissions or carbon intensity control policies on macroeconomic stability, industrial structure, corporate competitiveness, technological innovation, individual health [10], and regional equity, while also proposing strategies to address associated challenges [11,12].
The core of international research lies in balancing absolute emission targets with intensity goals. China’s “dual carbon emissions control” framework represents a concrete implementation of this principle. Studies have demonstrated that single-target approaches (pure absolute caps or pure intensity targets) exhibit significant limitations.
Domestic research has primarily focused on the following three dimensions:
(1) Necessity, existing foundations, and challenges in transitioning from dual energy consumption control to dual carbon emissions control: Tian Hongdou et al. [13] analyzed the historical evolution and limitations of both policies, comparing national objectives across periods to demonstrate the necessity for transition. Xie Dian et al. [14] identified implementation barriers, including imperfect accounting systems, ambiguous institutional design, and unclear market mechanisms. To address these, Xuan Xiaowei et al. [15] proposed specific measures including expanding carbon market functions, leveraging carbon taxes and standards, optimizing dual carbon emissions control policies, and enhancing governmental engagement, with a core shift transitioning from “plan-dominant” to “market-driven” mechanisms.
(2) Socioeconomic impacts and implementation pathways of the policy transition: Jiang Chunhai [16] and Tang Lang et al. [17] conducted multi-perspective comparative analyses using a Computable General Equilibrium (CGE) model; they found that transitioning from dual energy consumption control to dual carbon emissions control can further reduce carbon emissions and peaks, unleash clean energy consumption potential (non-fossil energy share), boost clean energy industries, and limit the effects on industrial restructuring rationalization, but can lead to uncertain economic growth promotion. Tang Fang et al. [18] quantified the impacts on regulated aggregates and indicators via an integrated economy–energy–environment model, designing phased transition pathways.
(3) Response strategies under dual carbon emissions control: Provincial governments [19,20,21,22,23,24] developed localized implementation frameworks considering regional disparities. Energy-intensive industries [25,26,27,28] formulated sector-specific decarbonization roadmaps addressing technical and operational constraints.
Although scholars have conducted research on the economy, energy, and environment sectors, as well as on various industries, quantitative studies remain scarce regarding the extent and mechanisms through which dual carbon emissions control affects the coupling coordination development of the economy–energy–environment (3E) system, which is also known as the sustainability triangle. China is currently undergoing a critical transition from dual energy consumption control to dual carbon emissions control. There is an urgent need for systematic research on how dual carbon emissions control policies reshape the interactive relationships within the 3E system and reconstruct its coupling coordination mechanisms. To address this gap, this study innovatively constructs a “Triangular Trinity” theoretical framework, integrating internal, intermediate, and external triangular couplings. Taking Guangdong Province—a major energy consumer and carbon emitter—as a case study, as well as taking the policies within the external triangle as the entry point to analyze the impacts of the policy transition on the 3E system, we reveal the restructuring logic and mechanisms of dual carbon emissions control on 3E coupling coordination, systematically determine the interactions among the three triangles, and provide a foundational basis for the implementation and evaluation of the government’s dual carbon emissions control system.
Case region introduction: Guangdong Province (geographical location is shown in Figure 1) has the most developed economy (with a CNY 13.57 trillion provincial total economic output in 2023, accounting for 10.85% of the country’s total economic output), the largest energy consumption (376.59 million tons of standard coal equivalent (sce) in 2023, accounting for 6.58% of the country’s total energy consumption), the largest population (127.06 million at the end of 2023, accounting for 9.01% of the country’s total population), and the greatest dependence on external energy supply (only reporting 25.11% energy self-sufficiency in 2023). Guangdong Province has acted as a national pioneer in transitioning from dual energy consumption control to dual carbon emissions control. As early as 2015, it took the lead in proposing the gradual establishment of a dual-control mechanism for both total carbon emissions and carbon intensity, compelling an economic transition toward low-carbon development. Subsequent policy documents have repeatedly emphasized the need to systematically establish a system prioritizing carbon intensity control supplemented by total carbon emissions control, thereby advancing the shift from dual energy consumption control to dual carbon emissions control [29,30,31]. This initiative has provided critical references for formulating China’s national dual carbon emissions control policy.

2. Materials and Methods

2.1. Construction of the “Triangular Trinity” Theoretical Framework

The “Triangular Trinity” framework is formed by coupling three interconnected triangles—internal, intermediate, and external (Figure 2).
The internal triangle refers to the “Energy Trilemma” within the energy subsystem [32]; the energy subsystem inherently faces an irreconcilable trilemma where security, cleanliness, and affordability cannot be simultaneously optimized. The intermediate triangle refers to the sustainability triangle. This represents the synergistic linkages within the economy–energy–environment (3E) system [33]. The external triangle refers to the policy–technology–market triad.
The internal triangle is the basic physical constraint of the energy system, which directly affects the supply and demand balance of the central triangle, whereby reductions in renewable energy development costs can achieve economic breakthroughs through large-scale production, supporting the increase in the proportion of new energy in the 3E system, and subsequently improving energy security; it can also reduce the environmental pressure in the central triangle. The central triangle promotes the reconstruction of external factors; breakthroughs in new energy technology and power grid technology not only increase economic returns (intermediate triangle) but also optimize the proportion of clean energy (internal triangle). Policy, as the basis for the external triangle, is used to regulate behavior, set goals, coordinate resource allocation, and guide the formation of a market mechanism. As a means of feedback on supply and demand signals, the market guides the adjustment of policy directions, technological research, and development directions. Inner-central coordination that catalyzes the external triangle can lead to policy–technical coordination breaking through internal constraints, market–technical coupling reconstructing the 3E relationship, and policy–market linkages balancing target conflicts.

2.2. Construction of the 3E System (Intermediate Triangle) Indicator Framework

Grounded in the “Triangular Trinity” theoretical framework, the intermediate triangle constitutes the core component and operational carrier of the “Triangular Trinity” system. This necessitates establishing a 3E system indicator for quantitative study. Considering inter-indicator independence, data accessibility, and well-founded projections, and after performing a comparative analysis of multiple domestic 3E indicator systems [34,35], we selected the most frequently adopted, data-available, and projection-substantiated indicators for subsequent calculations. This ensures the authoritativeness of the metrics. The 3E system indicators constructed in this study are presented below (Table 1).

2.3. Calculation of Coupling Coordination Degree

The formula for calculating the coupling coordination development degree is as follows:
D = C ( x , y , z ) T ( x , y , z )
where
C = 3 × f ( x ) g ( y ) h ( z ) f ( x ) + g ( y ) + h ( z ) 3 1 / 3
T = θ f ( x ) + β g ( y ) + γ h ( z )
In the formula, D is the coupling coordination degree, D ∈ [0, 1]; C is the coupling degree, reflecting the level of synergy of the interaction between systems; T is the coordination degree, reflecting the comprehensive development level of the 3E system. x, y, and z, respectively, represent economic subsystem, energy subsystem, and environment subsystem; θ, β, and γ are the weights to be determined for the economic, energy, and environmental systems, respectively, where θ + β + γ = 1. f(x), g(y), and h(z) are the comprehensive scores used to measure the development level and status of each subsystem. The calculation formulae are as follows:
f ( x ) = i = 1 2 w i x i
g ( y ) = j = 1 3 w j y j
h ( z ) = k = 1 2 w k z k
x i , y j , and z k represent the values of the economic, energy, and environmental system indicators, respectively, after linear proportional transformation and standardization; these are calculated using the extreme value method. w i , w j , and w k are the weights assigned to each indicator using the entropy method. Taking the calculation of x i and wi as an example, the method is described in [36]. The calculations of y j , z k , w j , and w k are similar to those of x i and w i , where j = 1–3 and k = 1–3. The classification criteria for coupling levels of coordination can be found in Appendix A and Table A1.
The standardization of indicators is performed as follows:
x i = x i λ min λ max λ min , λ min x i λ max , x i   is   p o s i t i v e   ( i = 1 3 ) λ max x i λ max λ min , λ min x i λ max , x i   is   n e g a t i v e   ( i = 1 3 )
The proportion of indicators is determined as follows:
X i = x i i = 1 3 x i
The entropy value of the i-th indicator is calculated as follows, where k > 0 and k = ln(i):
e i = k i = 1 3 X i l n ( X i )
The information utility value of the i indicator is calculated as follows:
ui = 1 − ei
The weight of each indicator is calculated as follows:
w i = u i i = 1 3 u i
The weight calculation results for each indicator in the 3E system can be found in Appendix A and Table A2.

2.4. Decoupling Assessment of the Economy from Energy and Carbon Emissions

To characterize the quantitative impacts of different policy scenarios on economic development, this study conducted synchronized decoupling assessments of the economy from the perspectives of both energy consumption and carbon emissions. Currently, two mainstream decoupling models exist: the OECD decoupling model, and the Tapio decoupling model. Through empirical verification and comparative analysis, scholars have found that the Tapio decoupling model possesses irreplaceable advantages over the OECD model [37]. Given this evidence, our research adopted the Tapio decoupling model to compute the decoupling states between the economy and energy/carbon emissions.
The Tapio decoupling model is expressed as follows:
D t = Δ C / C Δ G D P / G D P
where C represents carbon emissions in the target year; ΔC denotes the change in carbon emissions relative to the base period; GDP signifies the gross domestic product in the target year; and ΔGDP indicates the GDP variation relative to the base period. The following two approaches exist for selecting the base period:
(1) Fixed Base Year: All subsequent years are compared to a single fixed year, reflecting the overall evolution of economy–energy–carbon relationships throughout the study period. This suits medium-to-long-term decoupling assessments but may mask anomalies from short-term fluctuations.
(2) Previous Year Base: This calculates decoupling elasticity between consecutive years, enabling short-term dynamic analysis. This captures interannual sensitivity and is ideal for evaluating the immediate impacts of policies, emergencies, or economic shocks. However, the results may become unstable due to short-term outliers.
This paper adopts two approaches for setting the base period—a fixed year and the preceding year. For the fixed-year approach, two further methods are employed, i.e., using 2005 as the base year, as well as establishing five-year intervals, with the beginning year of each interval serving as the base period. Based on decoupling elasticity values, Tapio defines eight distinct decoupling states, as detailed in Appendix A and Table A3.

2.5. Scenario Design

This study establishes three policy scenarios—business-as-usual (BAU), enhanced dual energy consumption control (EC), and dual carbon emissions control (CC). Scenario descriptions and parameter configurations are detailed in Table 2. Using 2023 as the base year, the projection period spans from 2024 to 2035.

2.6. Monte Carlo Model Construction Based on the 3E System

The Monte Carlo model is a numerical computation framework based on stochastic sampling. Its core lies in leveraging random variable simulations and the law of large numbers to approximate the statistical properties of complex systems. Below is the core mathematical framework of the Monte Carlo model for the 3E system.
(1)
System state equations
G D P t = G D P t 1 × ( 1 + g t ) E C t = G D P t × E I t C E t = G D P t × C I t
ECt: total energy consumption in year t;
CEt: total carbon emissions in year t;
EIt = EIt − 1 × (1 − ηt): energy intensity (tonnes of SCE/CNY 10,000 GDP);
CIt = CIt − 1 × (1 − κt): carbon intensity (tonnes of carbon/CNY 10,000 GDP);
gt, ηt, κt: random variables following specified probability distributions.
(2)
Stochastic parameter generation
g t η t κ t ~ F ( θ )
F: joint probability distribution (e.g., Copula function);
Θ: distribution parameters (mean, variance, and correlation matrix).

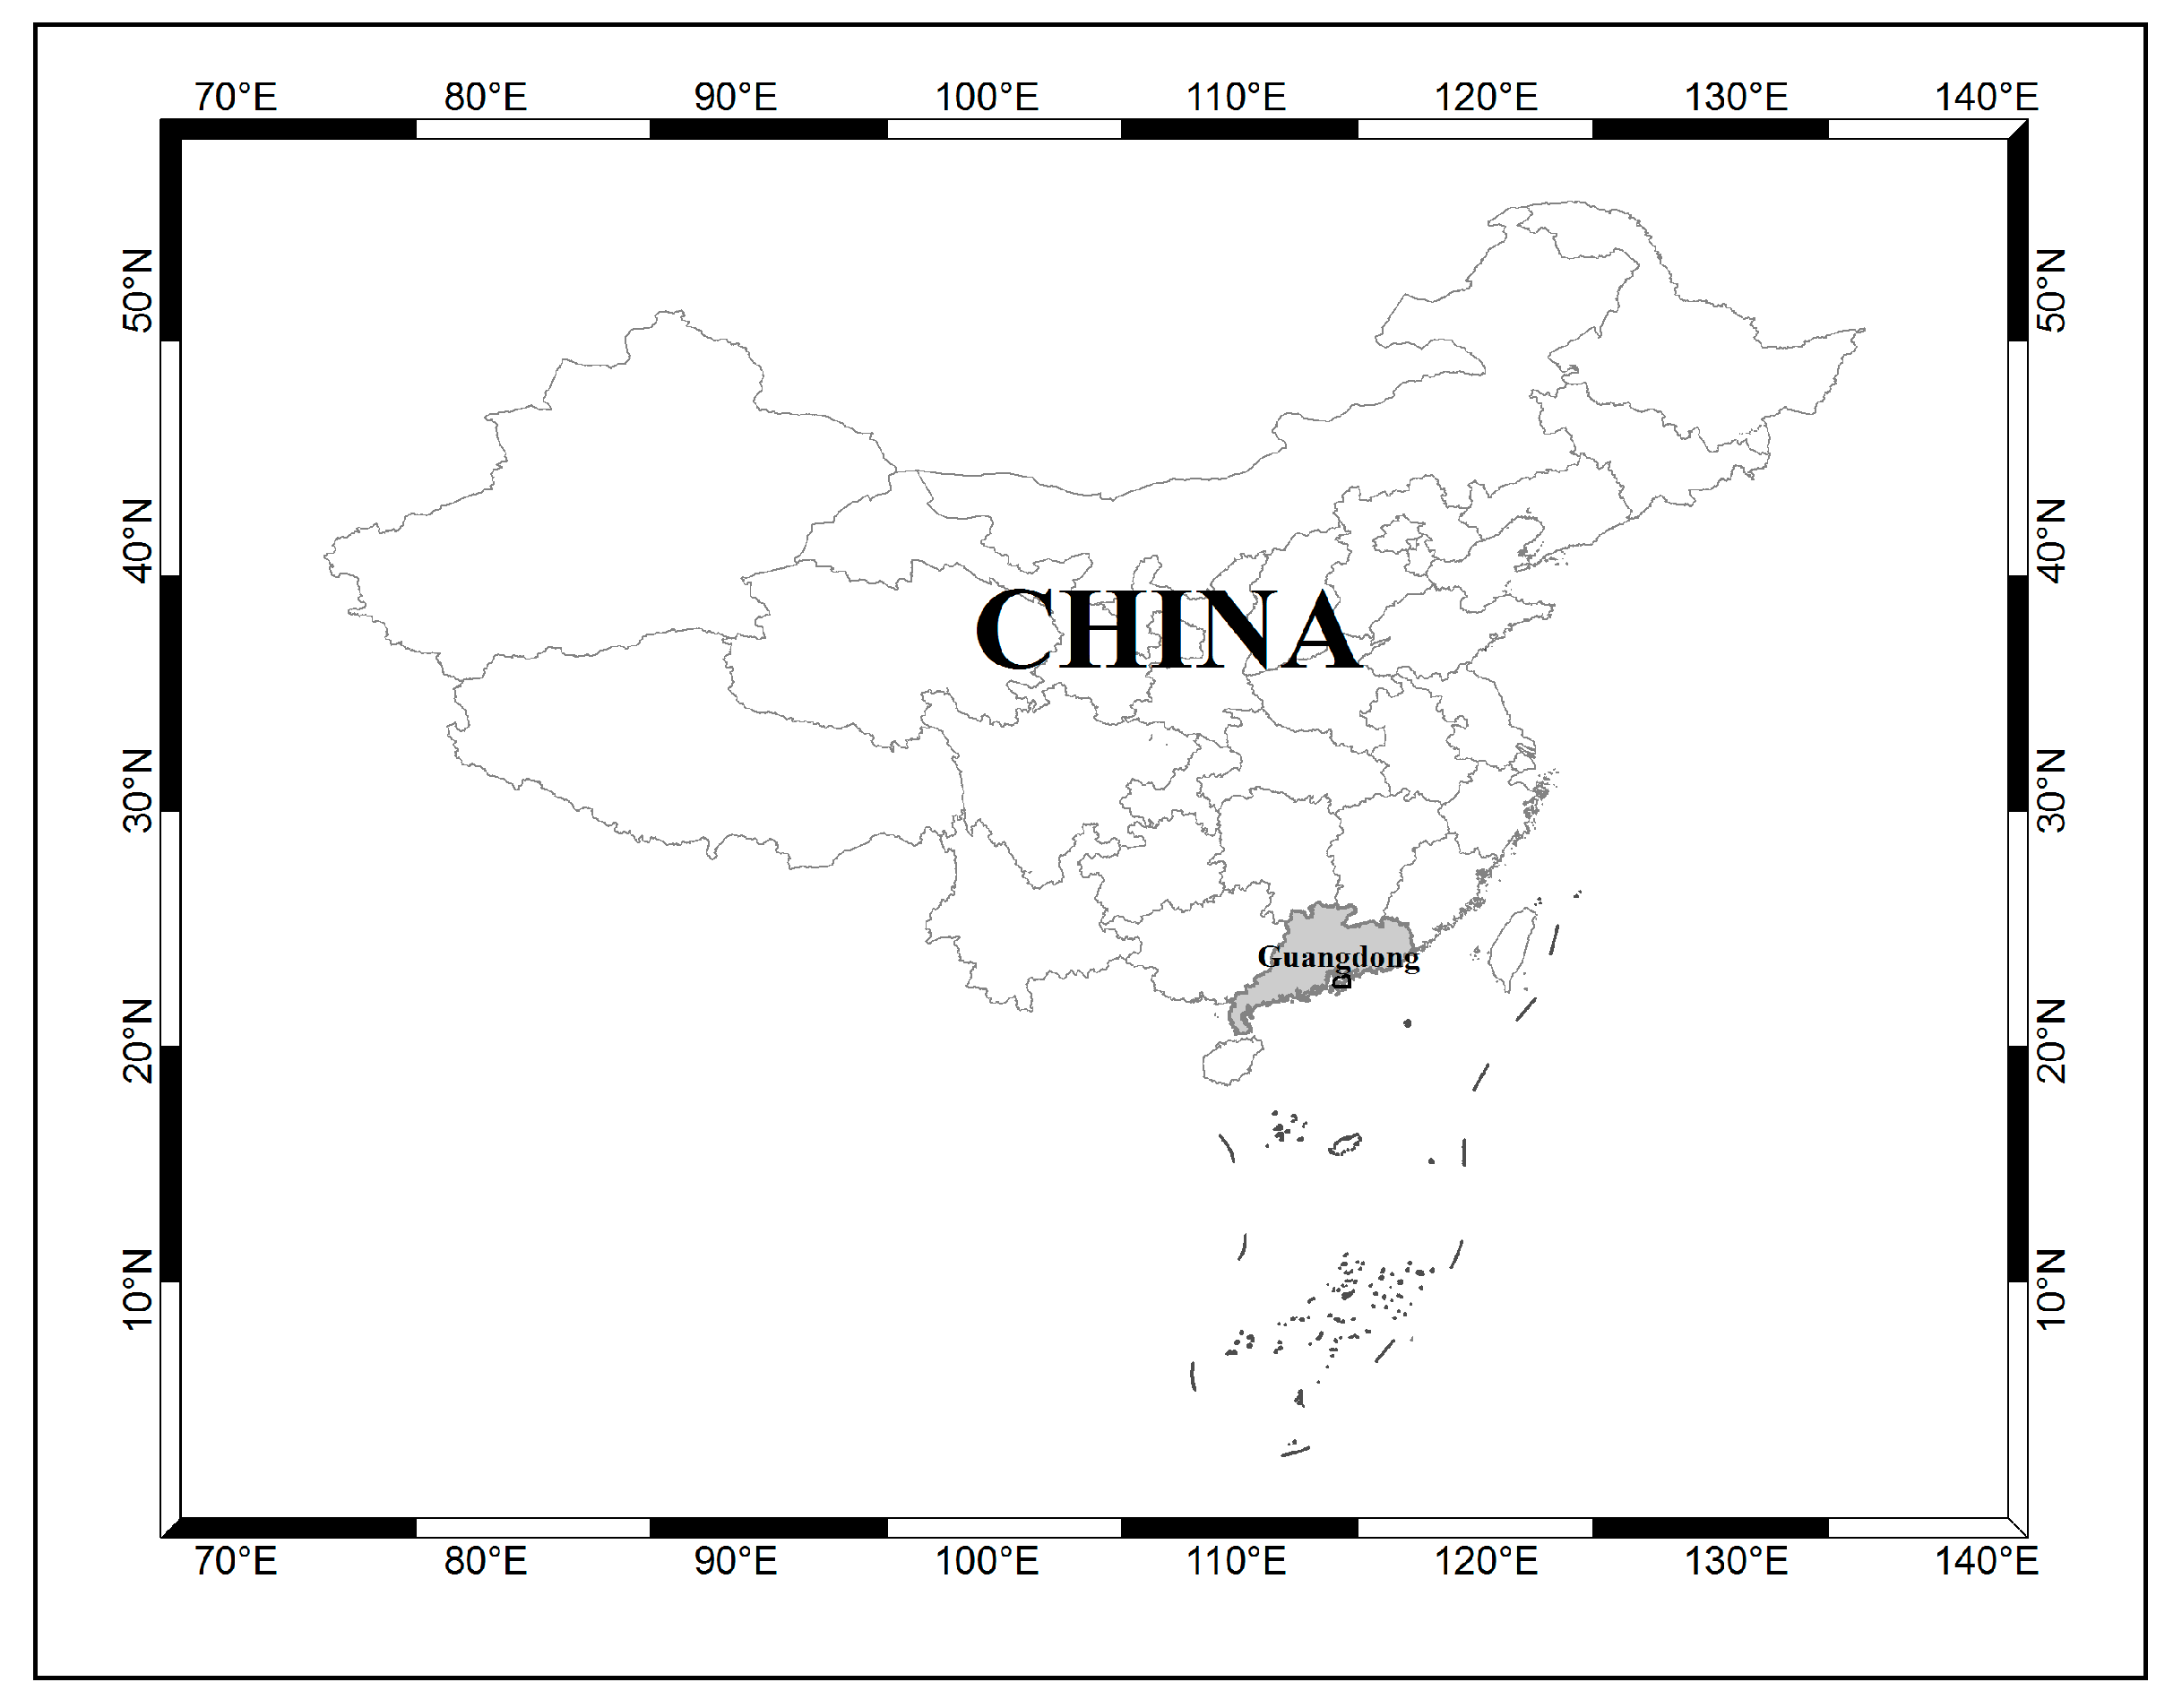
2.7. Data Sources and Processing

The data were sourced from publicly available documents and statistical materials, including national and Guangdong Provincial statistical yearbooks, government planning documents, and other official publications. This study primarily employed three analytical tools—the coupling coordination model, the Tapio decoupling model, and the Monte Carlo model; Statistical Product and Service Software Automatically (SPSSAU) was used for data processing.

3. Results

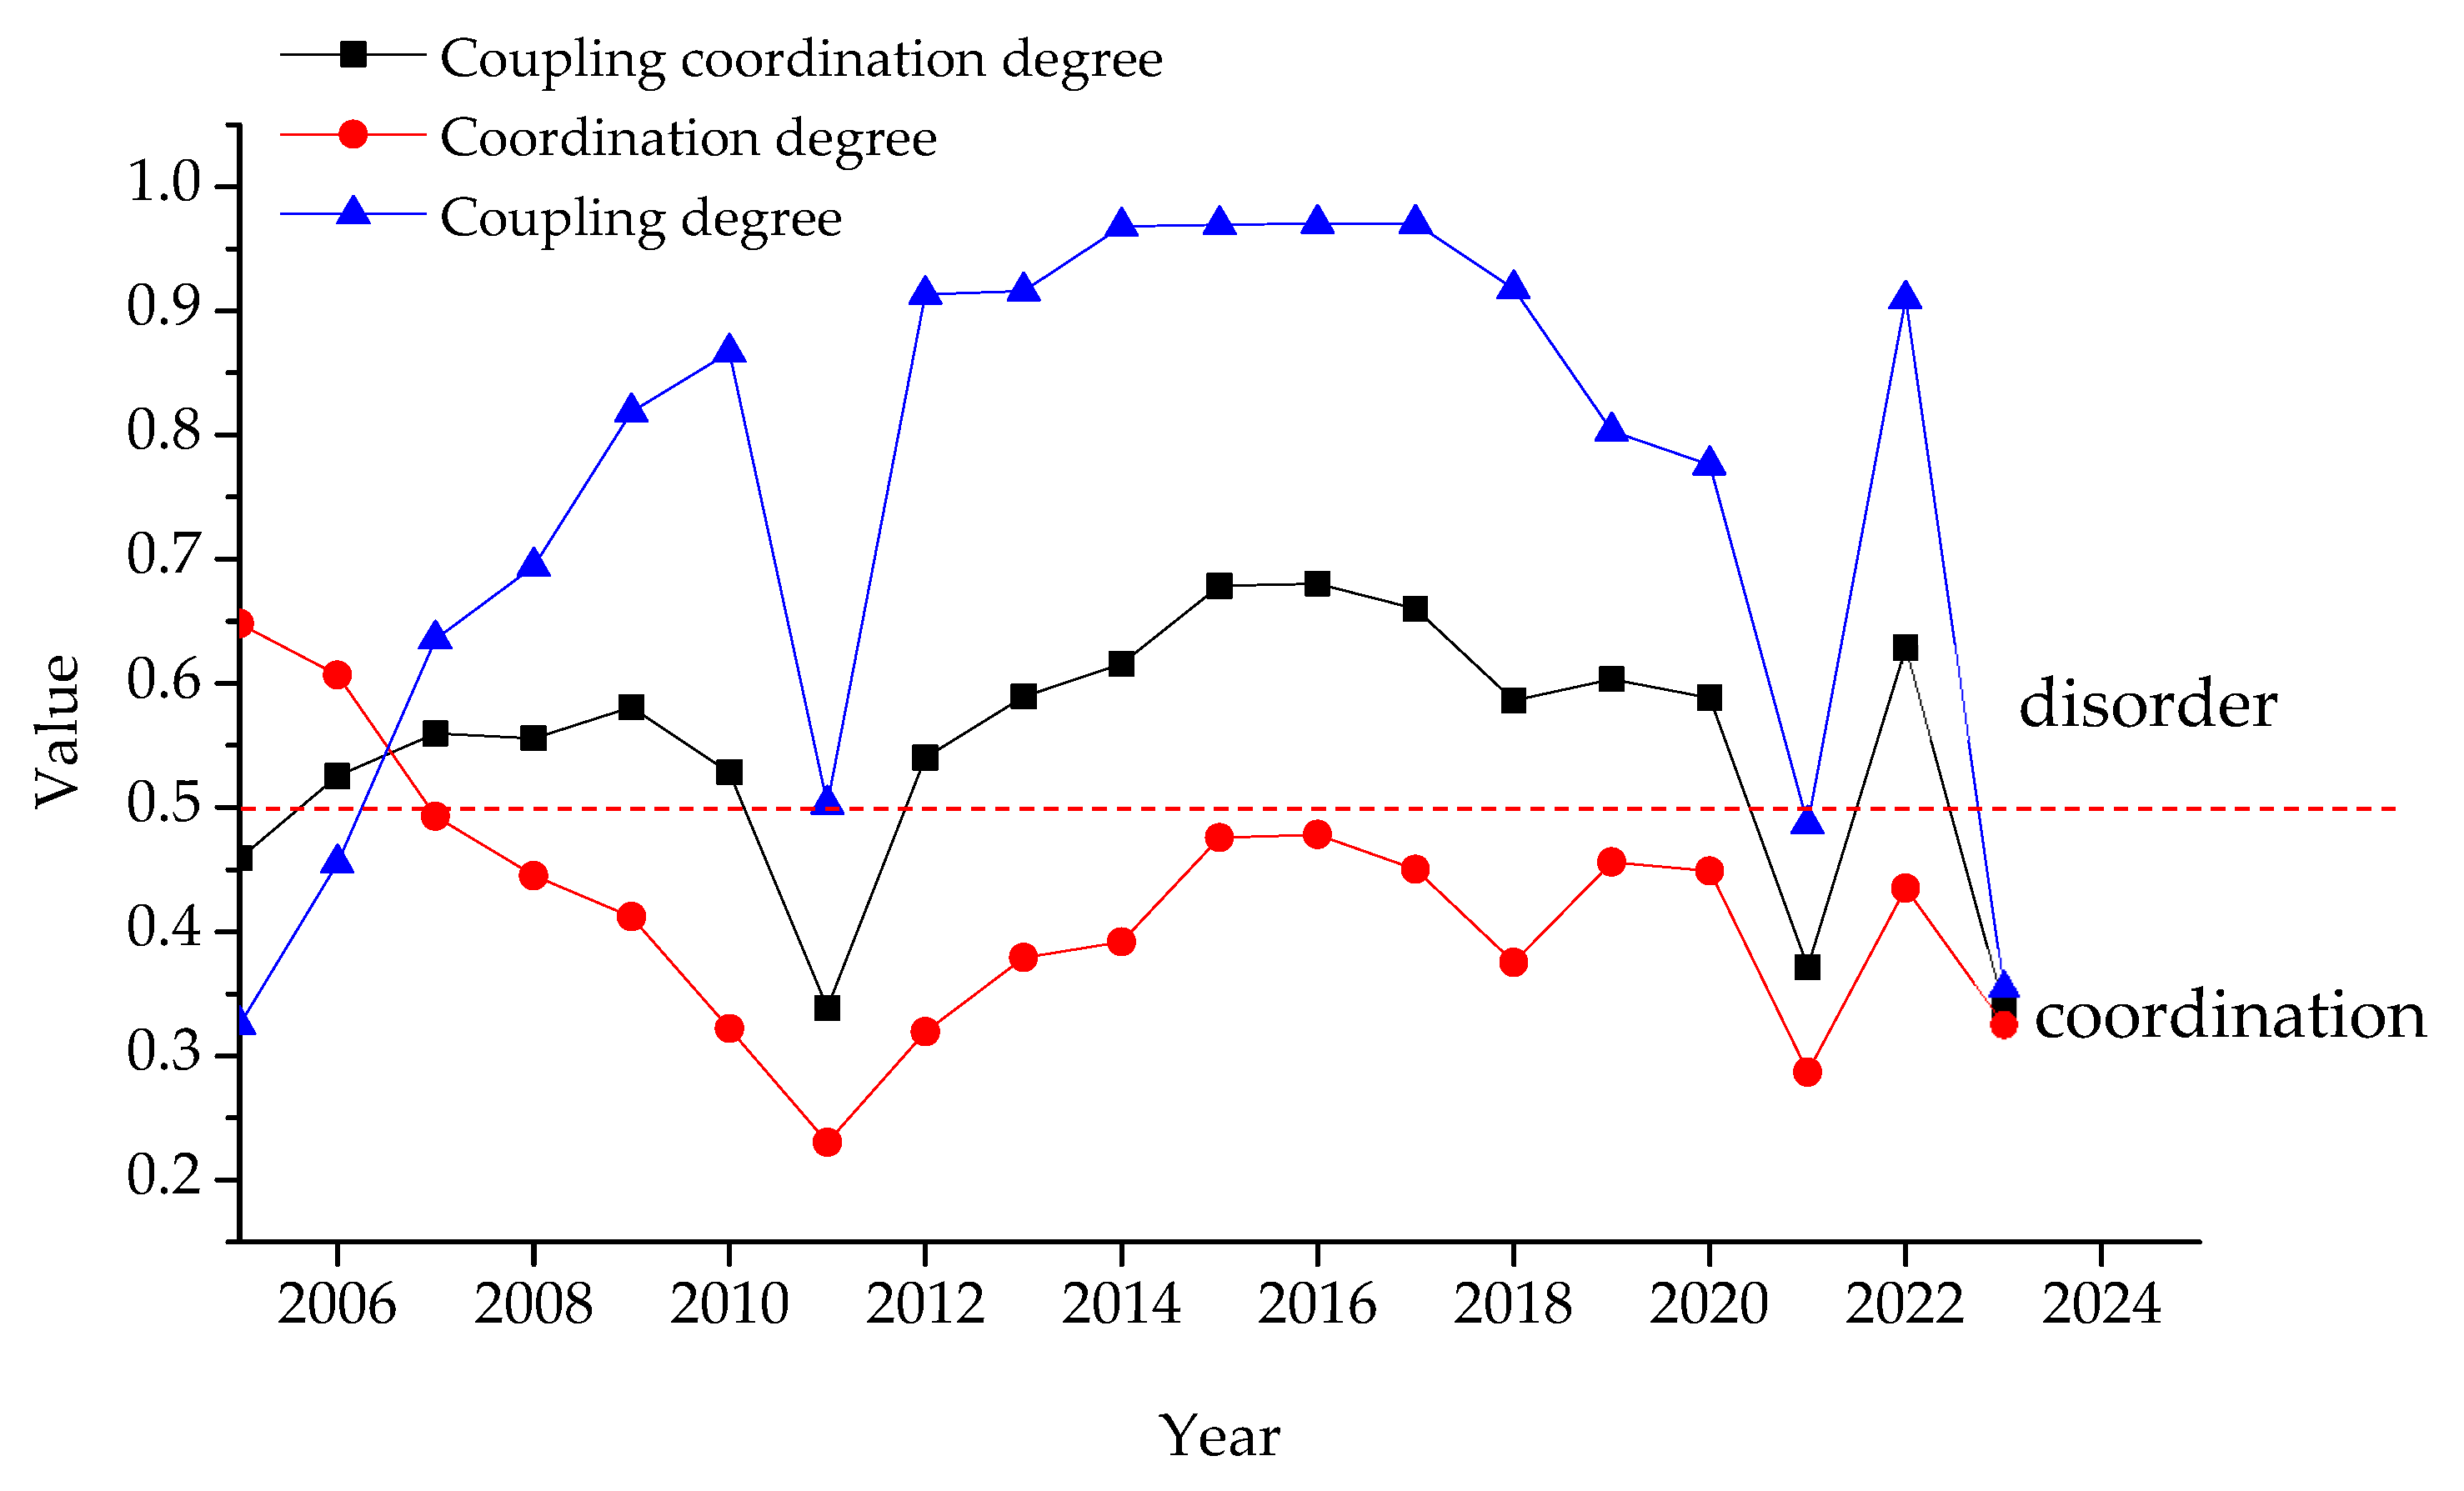
3.1. Evolution of 3E System Coupling Coordination Development

(1)
Historical evolution patterns of 3E system coordination
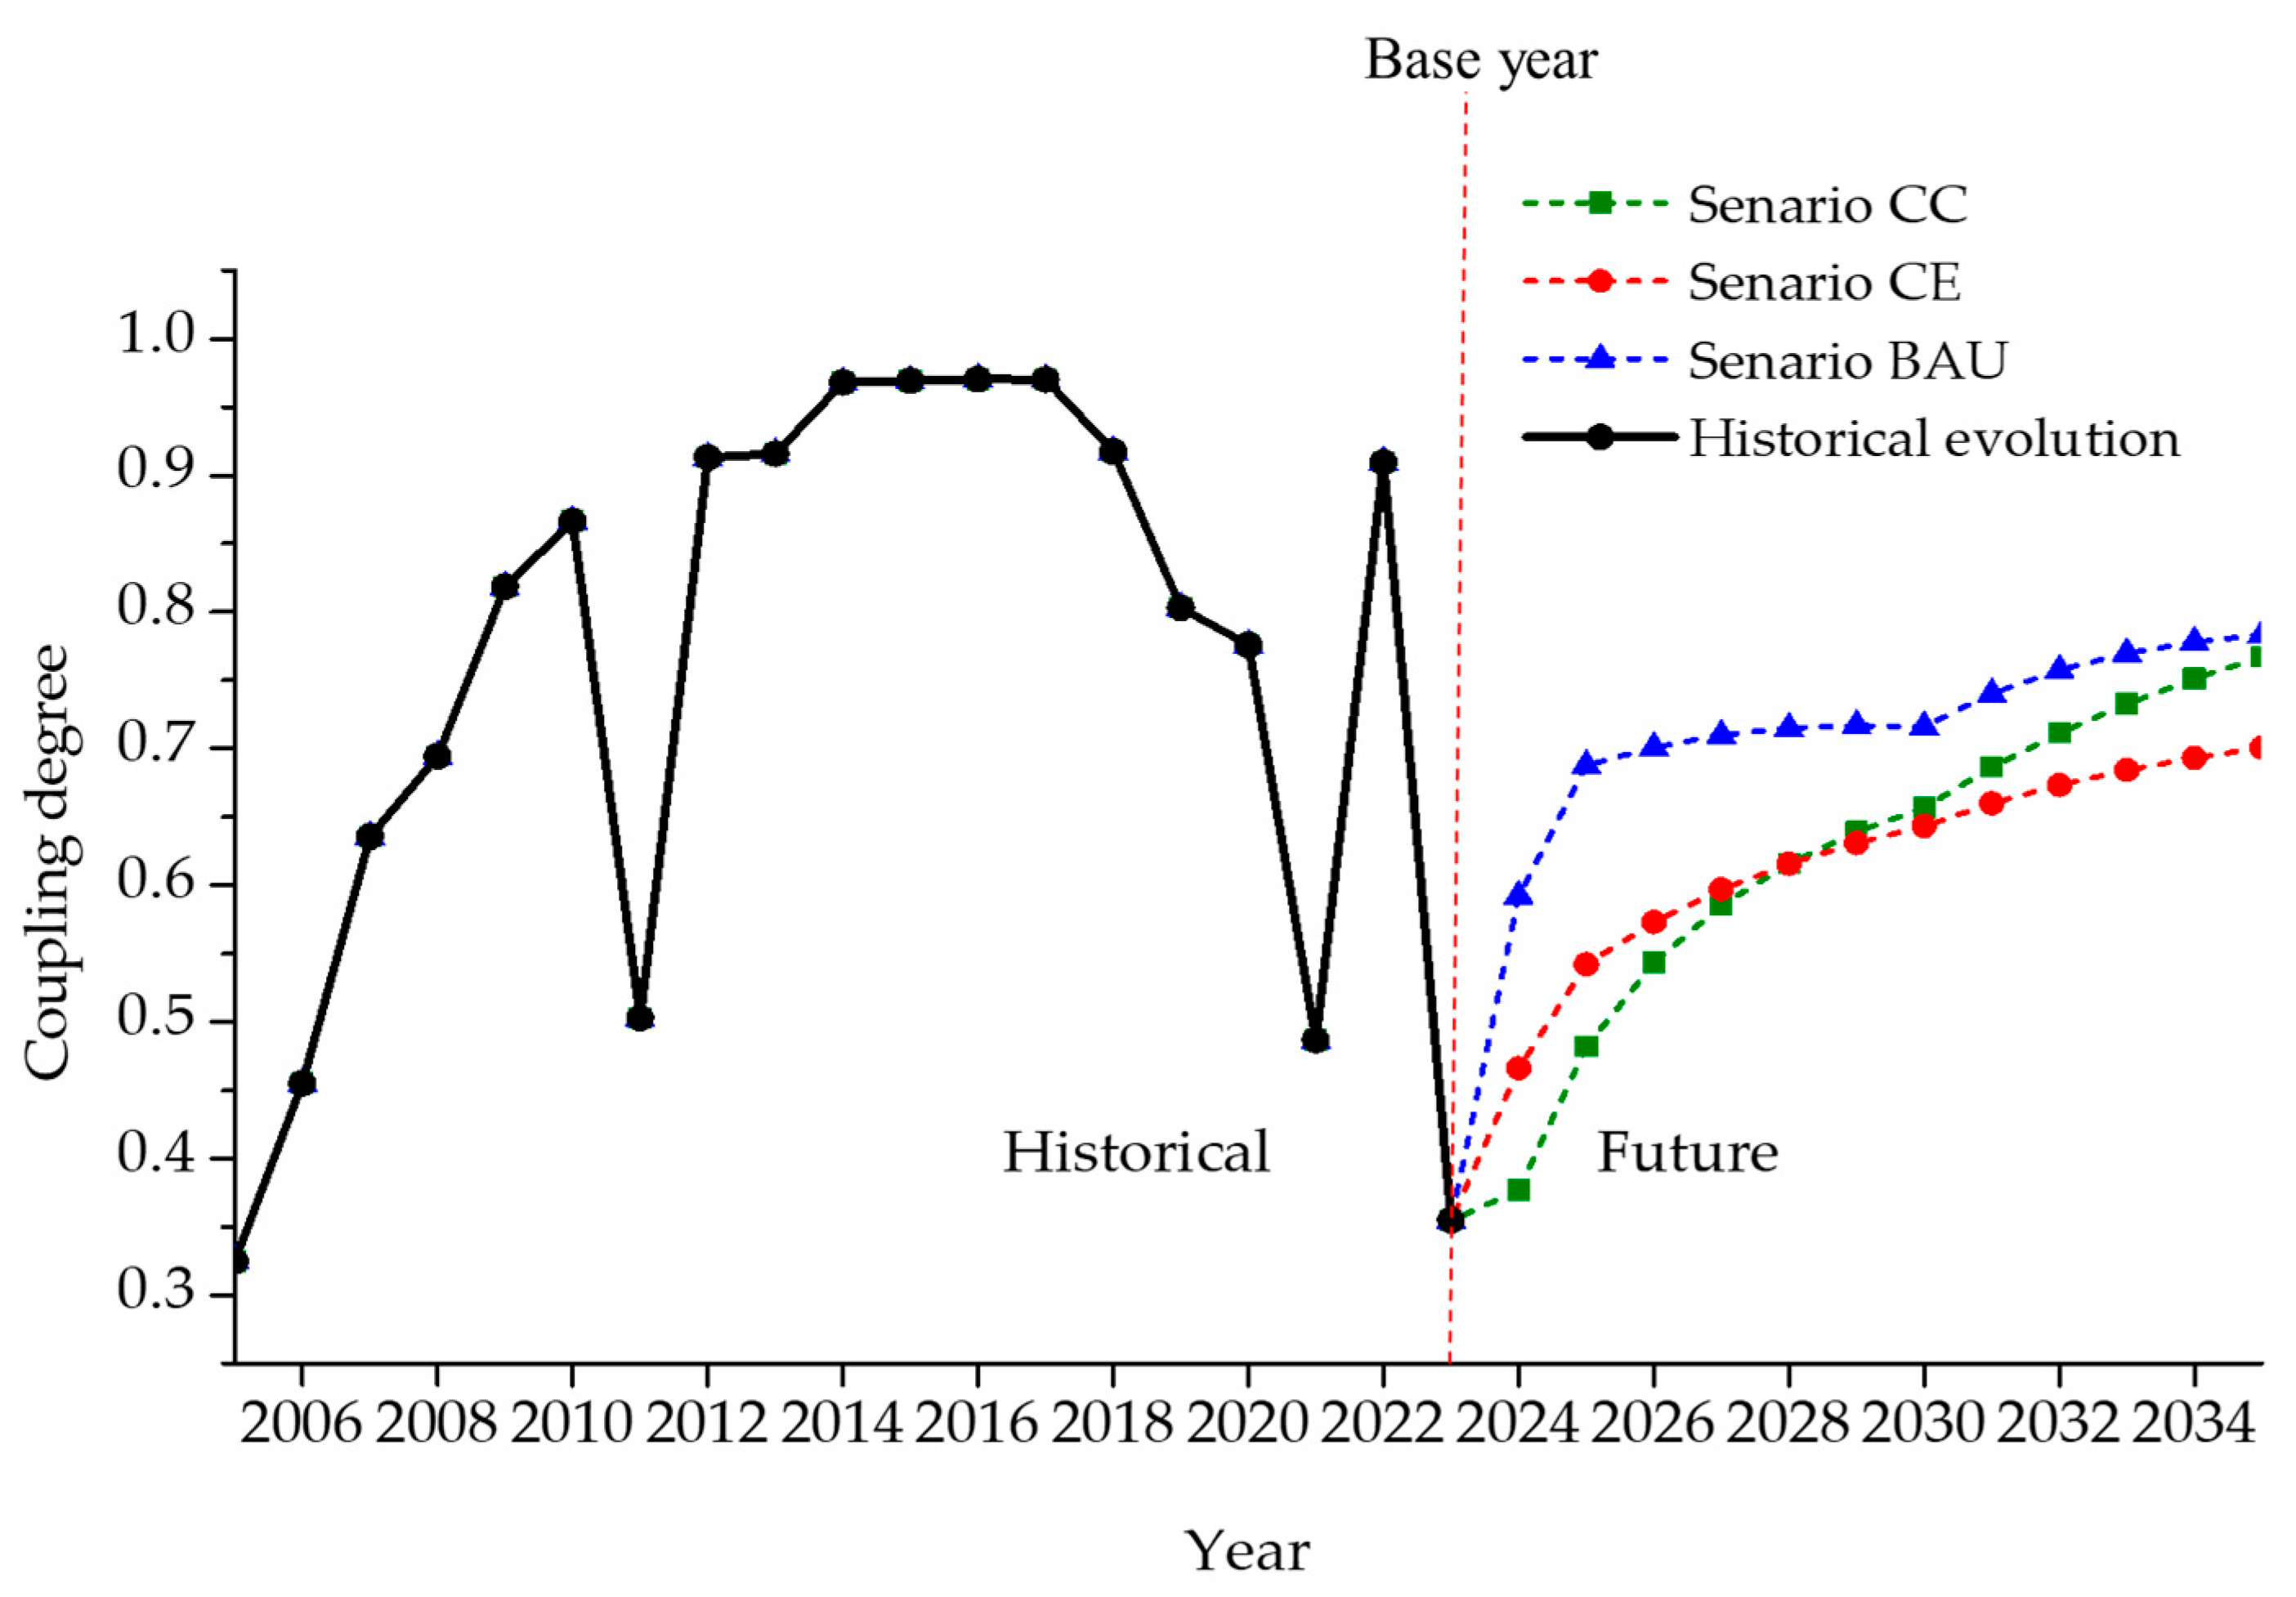
Since the implementation of a dual energy consumption control policy in 2005, the coupling coordination level of Guangdong’s 3E system demonstrated a steady improvement from 2005 to 2016 (except in 2011, which was primarily due to a significant decline in energy self-sufficiency rate caused by reduced primary electricity production that year) (Figure 3). The coupling coordination indicator peaked at 0.67, reaching the primary coordination stage, indicating that energy control policies significantly promoted the coordinated development of Guangdong’s 3E system. Notably, the high degree of coupling among the three subsystems reflected strong interdependence and mutual constraints. From 2005 to 2011, the degree of coordination declined markedly, suggesting diminished benign coupling within the 3E system—a phenomenon attributable to initial challenges in adaptation to the new policy framework. In 2011, the dual energy consumption control policy was formally implemented nationwide, achieving significant energy-saving and emission-reduction outcomes. The coupling coordination degree of the 3E system began increasing year by year, reaching a temporary peak by 2016. Since 2016, when China’s economy entered a period of rapid development, surging energy demands have led the dual energy consumption control policy to force clean energy industries to compress production capacity—despite their products offering significant carbon reduction benefits. This “one-size-fits-all” approach has exposed conflicting priorities between energy consumption control and carbon reduction goals. Within the environmental system, diminishing the marginal effectiveness of dual energy consumption control has exacerbated issues like carbon emissions and environmental pollution. Consequently, the coupling coordination level of the 3E system declined, dropping to 0.39 by 2023 and shifting into a state of mild disorder.
(2)
Development trends under different policy scenarios
All three policy scenarios exhibit upward trends in relation to the 3E system coupling coordination levels (Figure 4), yet with significantly divergent growth rates. The baseline scenario (BAU) demonstrates higher coordination levels than the enhanced dual energy consumption control scenario (EC), indicating that intensifying energy controls fails to substantially improve 3E system coordination. The dual carbon emissions control scenario (CC) achieves the highest coordination level, with the most rapid progression, confirming that carbon-focused policies markedly enhance 3E system synergy. By 2035, under CC, the degree of coordination will rise to 0.71, transitioning from mild discordance (2023) to intermediate coordination. Regarding the degree of coordination (Figure 5), CC significantly strengthens positive coupling, outperforming the other scenarios. As concerns the degree of coupling (Figure 6), although CC initially lags behind during the 15th Five-Year Plan period (2026–2030), its accelerated growth surpasses EC by 2028 and nearly closes the gap with BAU by 2035. This progression reveals that, after a decade-long adaptation period, carbon control policies progressively tighten inter dependencies within the 3E system.

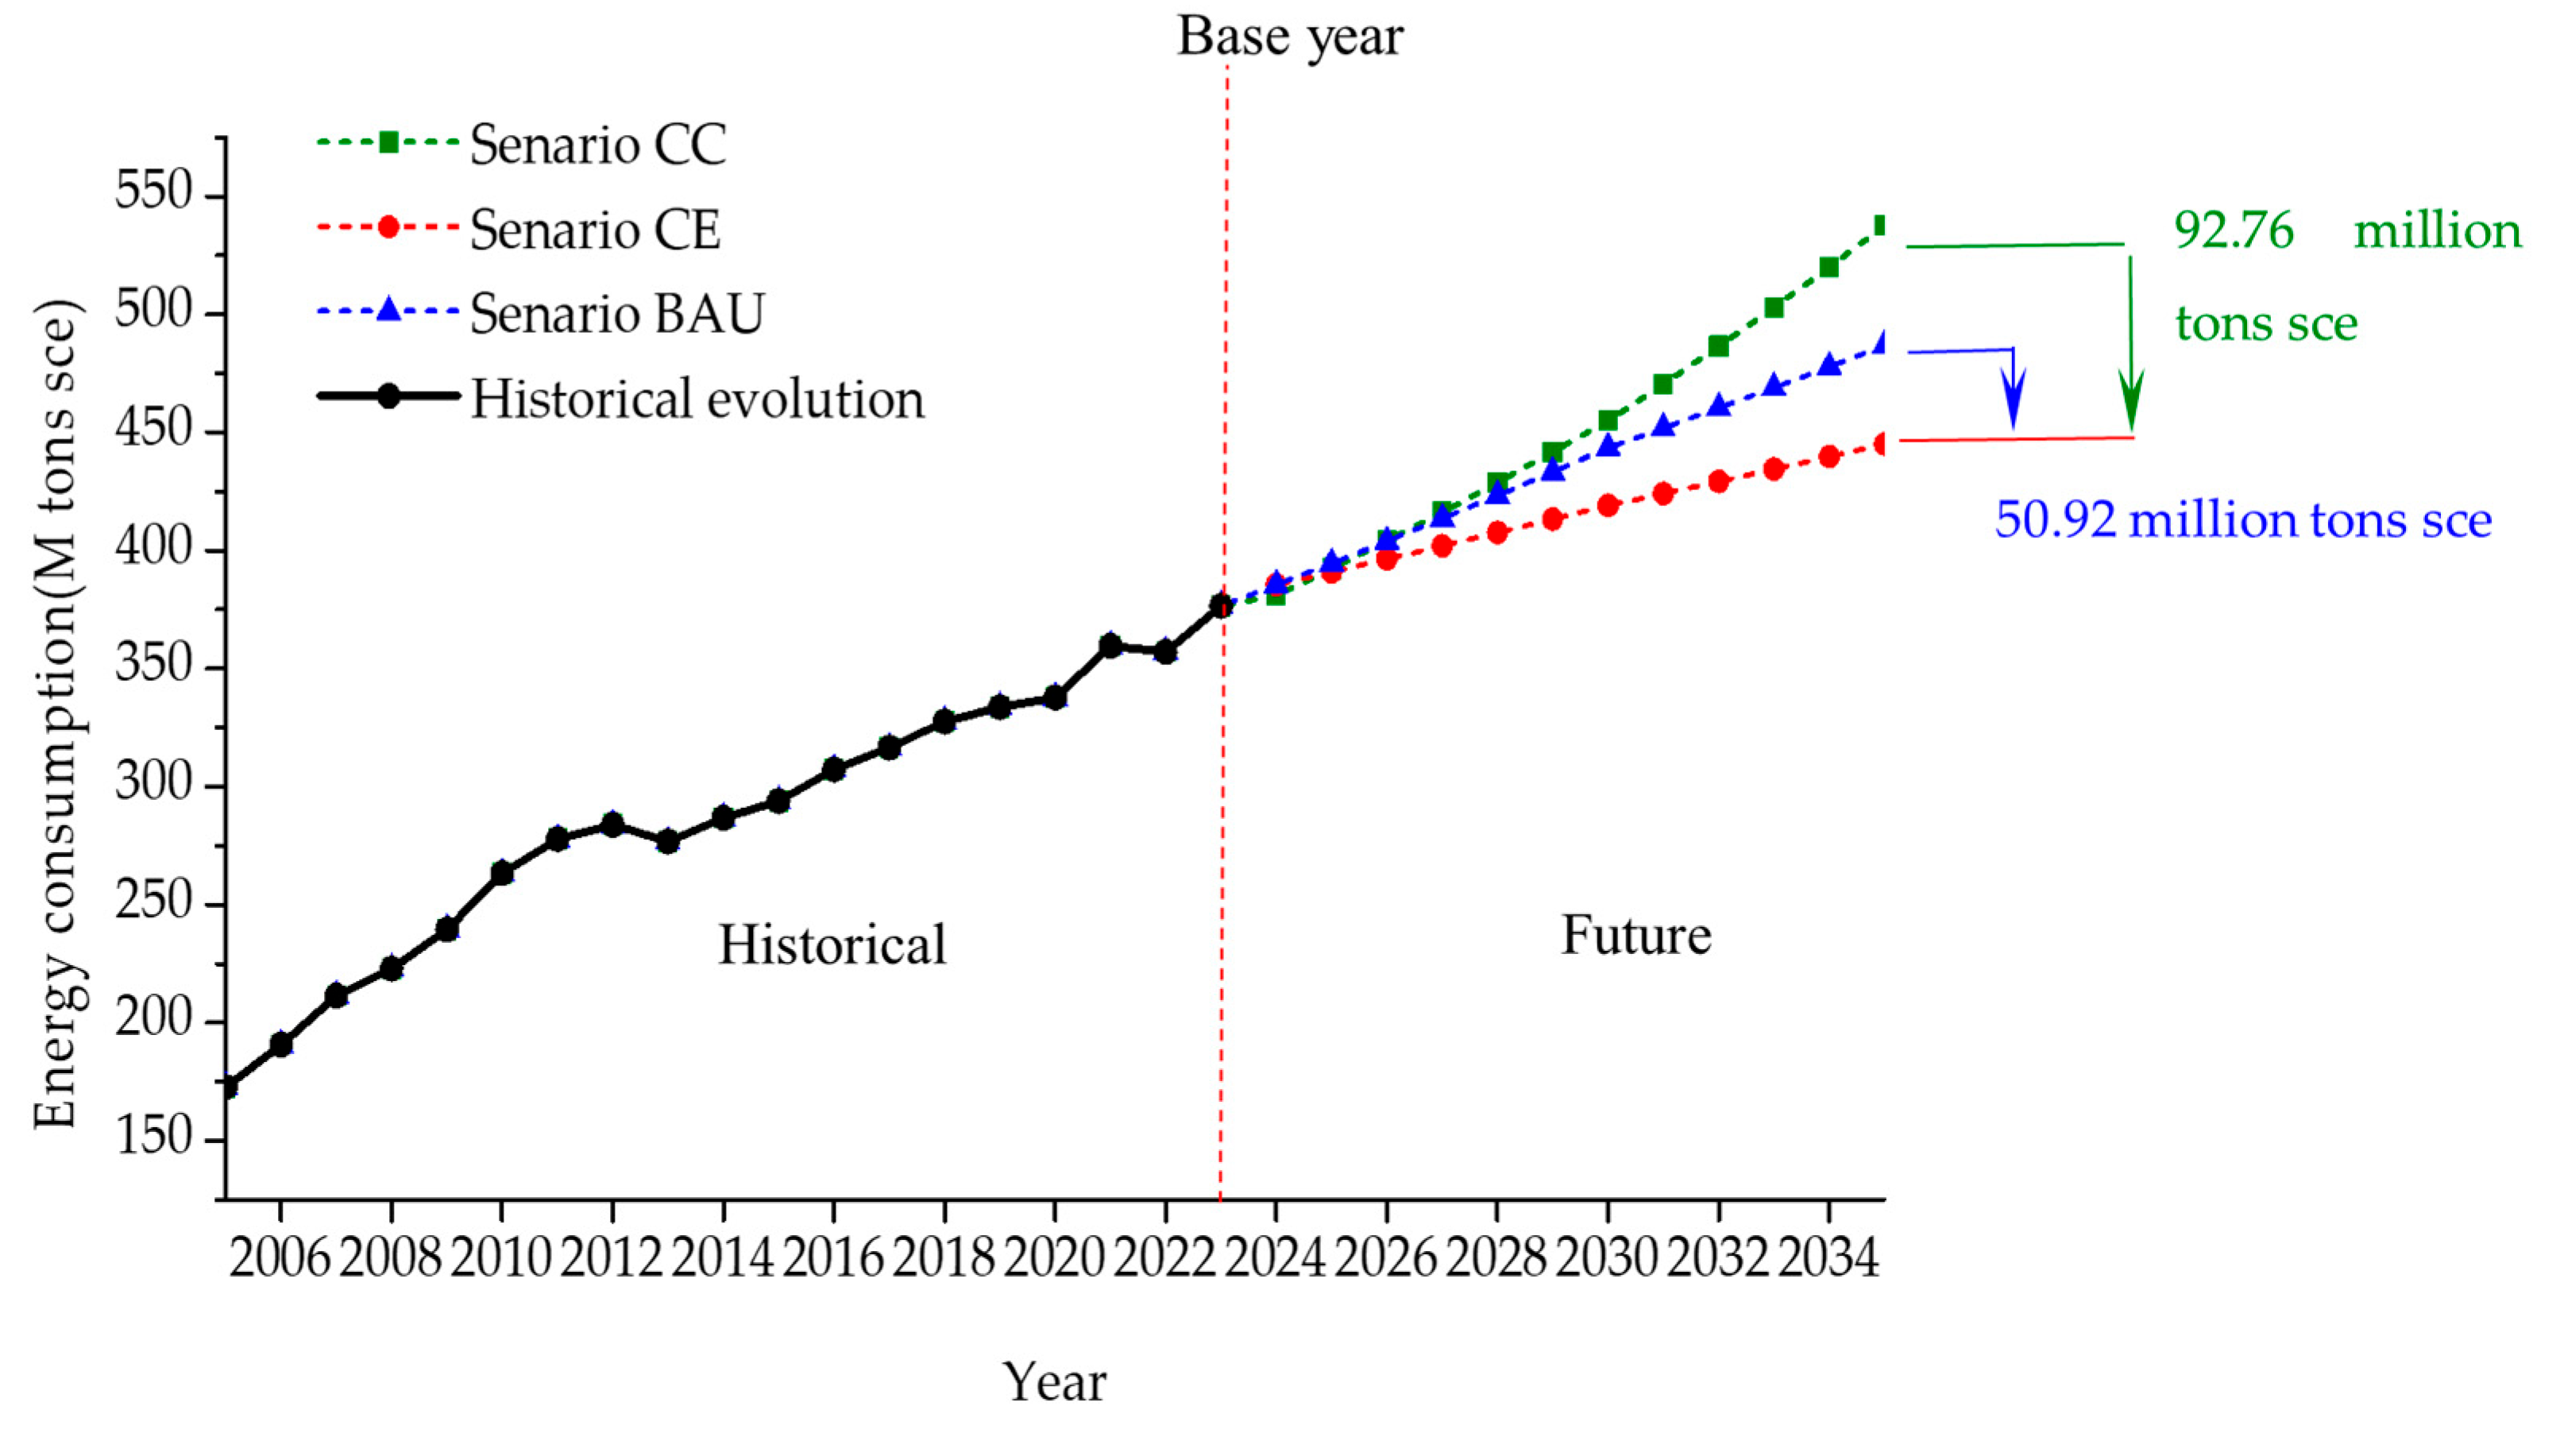
3.2. Differential Analysis of Energy Conservation and Emission Reduction Under Policy Scenarios

(1)
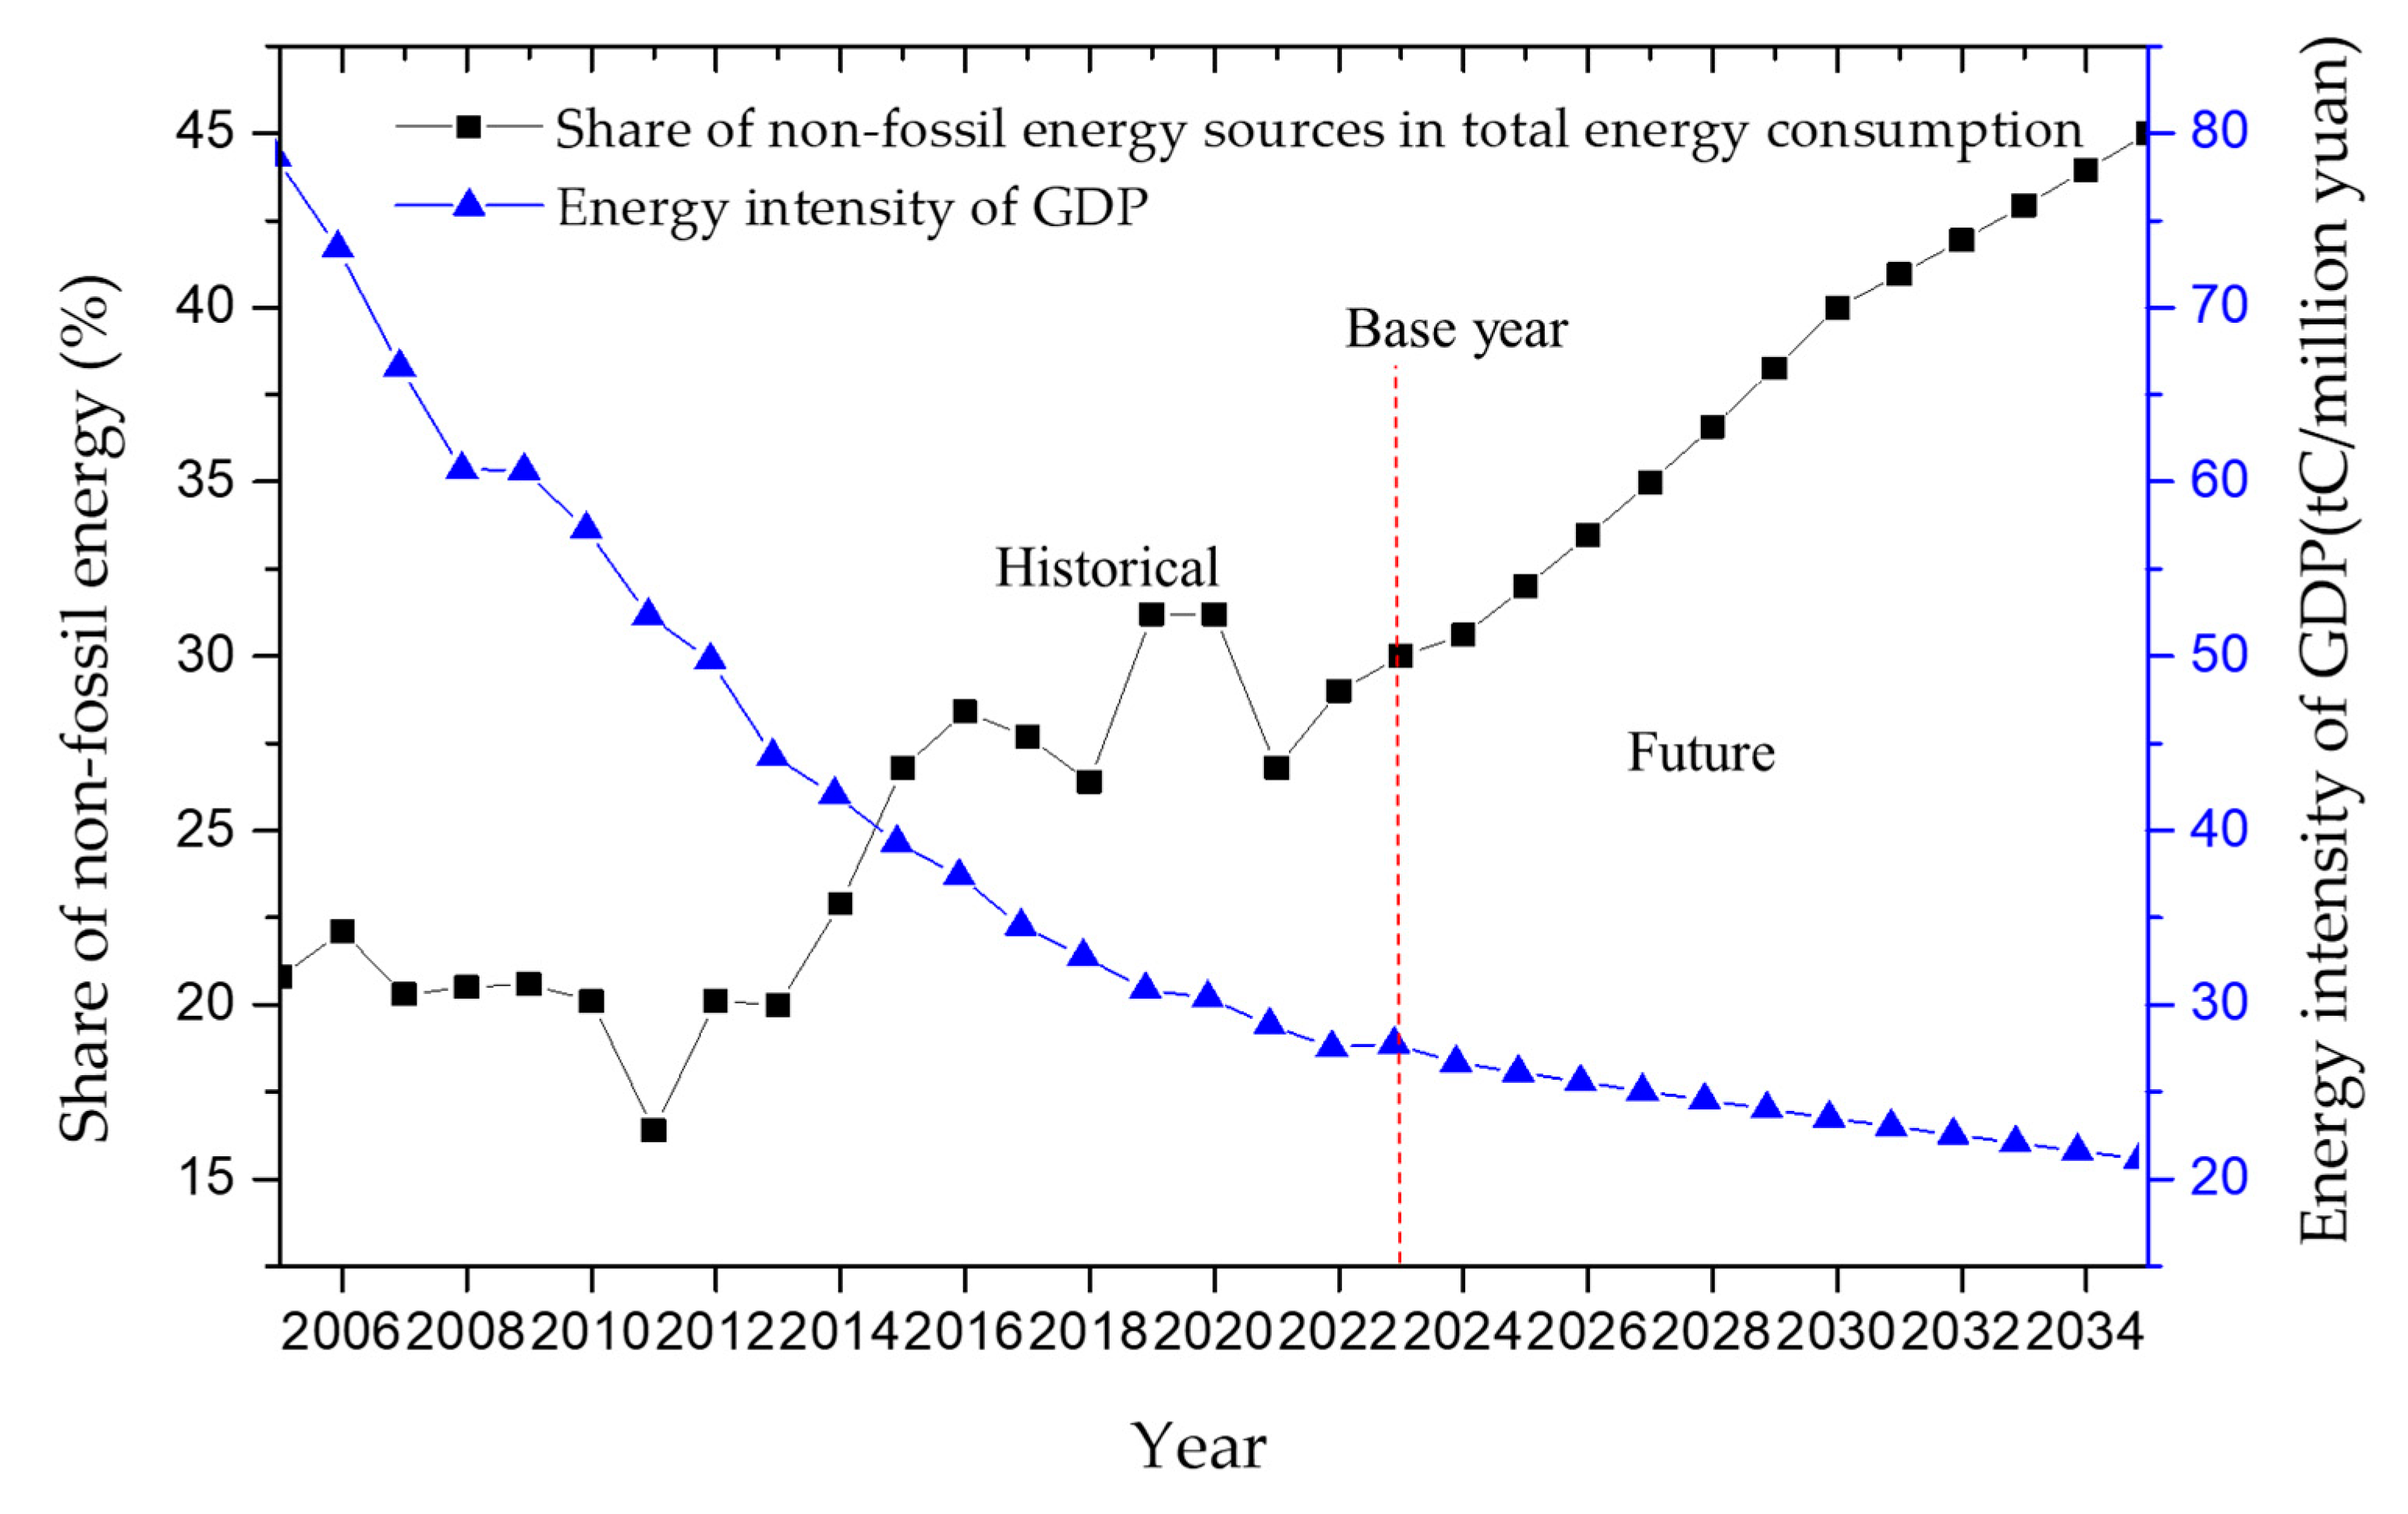
Energy consumption trajectories
From 2005 to 2023, total energy consumption exhibited persistent annual growth (Figure 7). For 2024–2035, all three scenarios maintain this upward trend, with the CC scenario registering the highest consumption (e.g., the mean total energy consumption reaches 538 [524–552] million tonnes of standard coal equivalent (sce) (90% confidence interval)). This stems from the discontinuation of dual energy consumption control assessments under carbon-focused policies, creating additional consumption space for renewable energy enterprises. Consequently, energy demand expands alongside rapid economic development, exceeding BAU by 50.92 million tons sce and exceeding EC by 92.76 million tons sce in 2035.
(2)
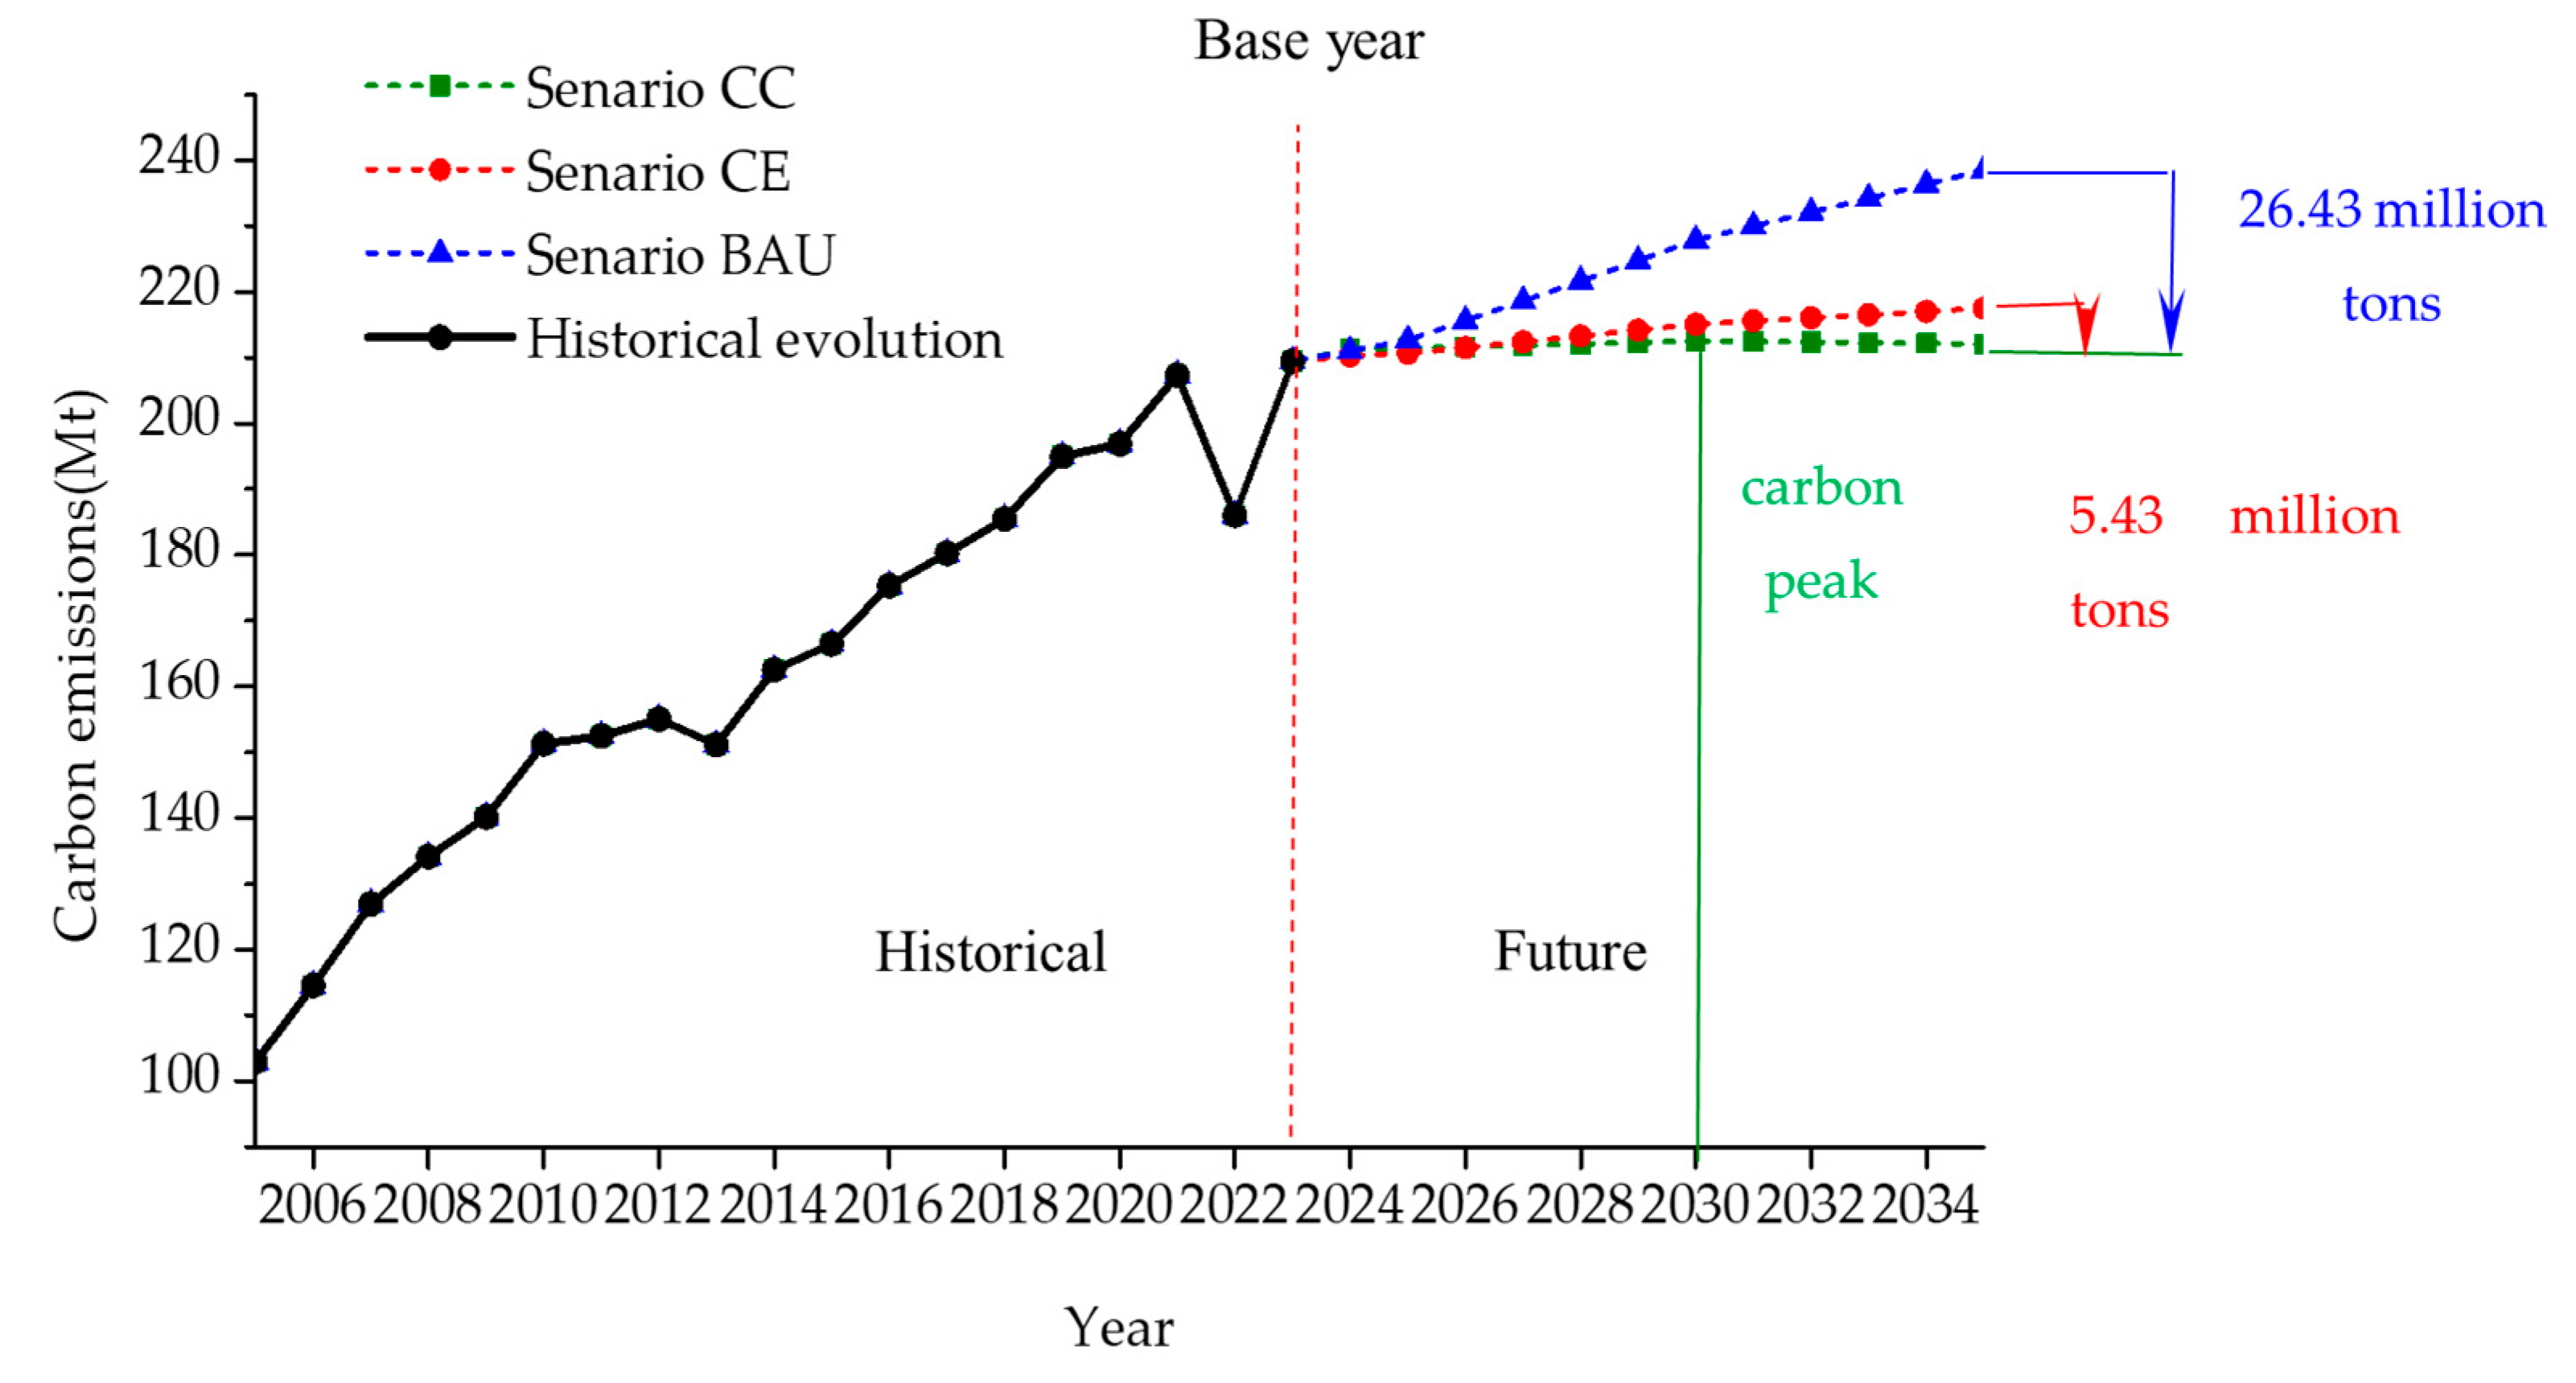
Carbon emission dynamics
The BAU and EC scenarios show continuously rising emissions, without discernible peaks during the study period (Figure 8). In contrast, the CC scenario reaches its carbon peak in 2030 (212.5 [201.3, 222.9] (90% confidence interval) million tons), fulfilling China’s national carbon neutrality timeline. Post-peak emissions decline steadily, resulting in 5.43 million tons less carbon than EC and 26.43 million tons less than BAU by 2035. At the 2035 average carbon trading price of CNY 180/ton, the CC scenario incurs CNY 977 million and CNY 4.757 billion higher carbon costs than the EC scenario and the BAU scenario, respectively.
(3)
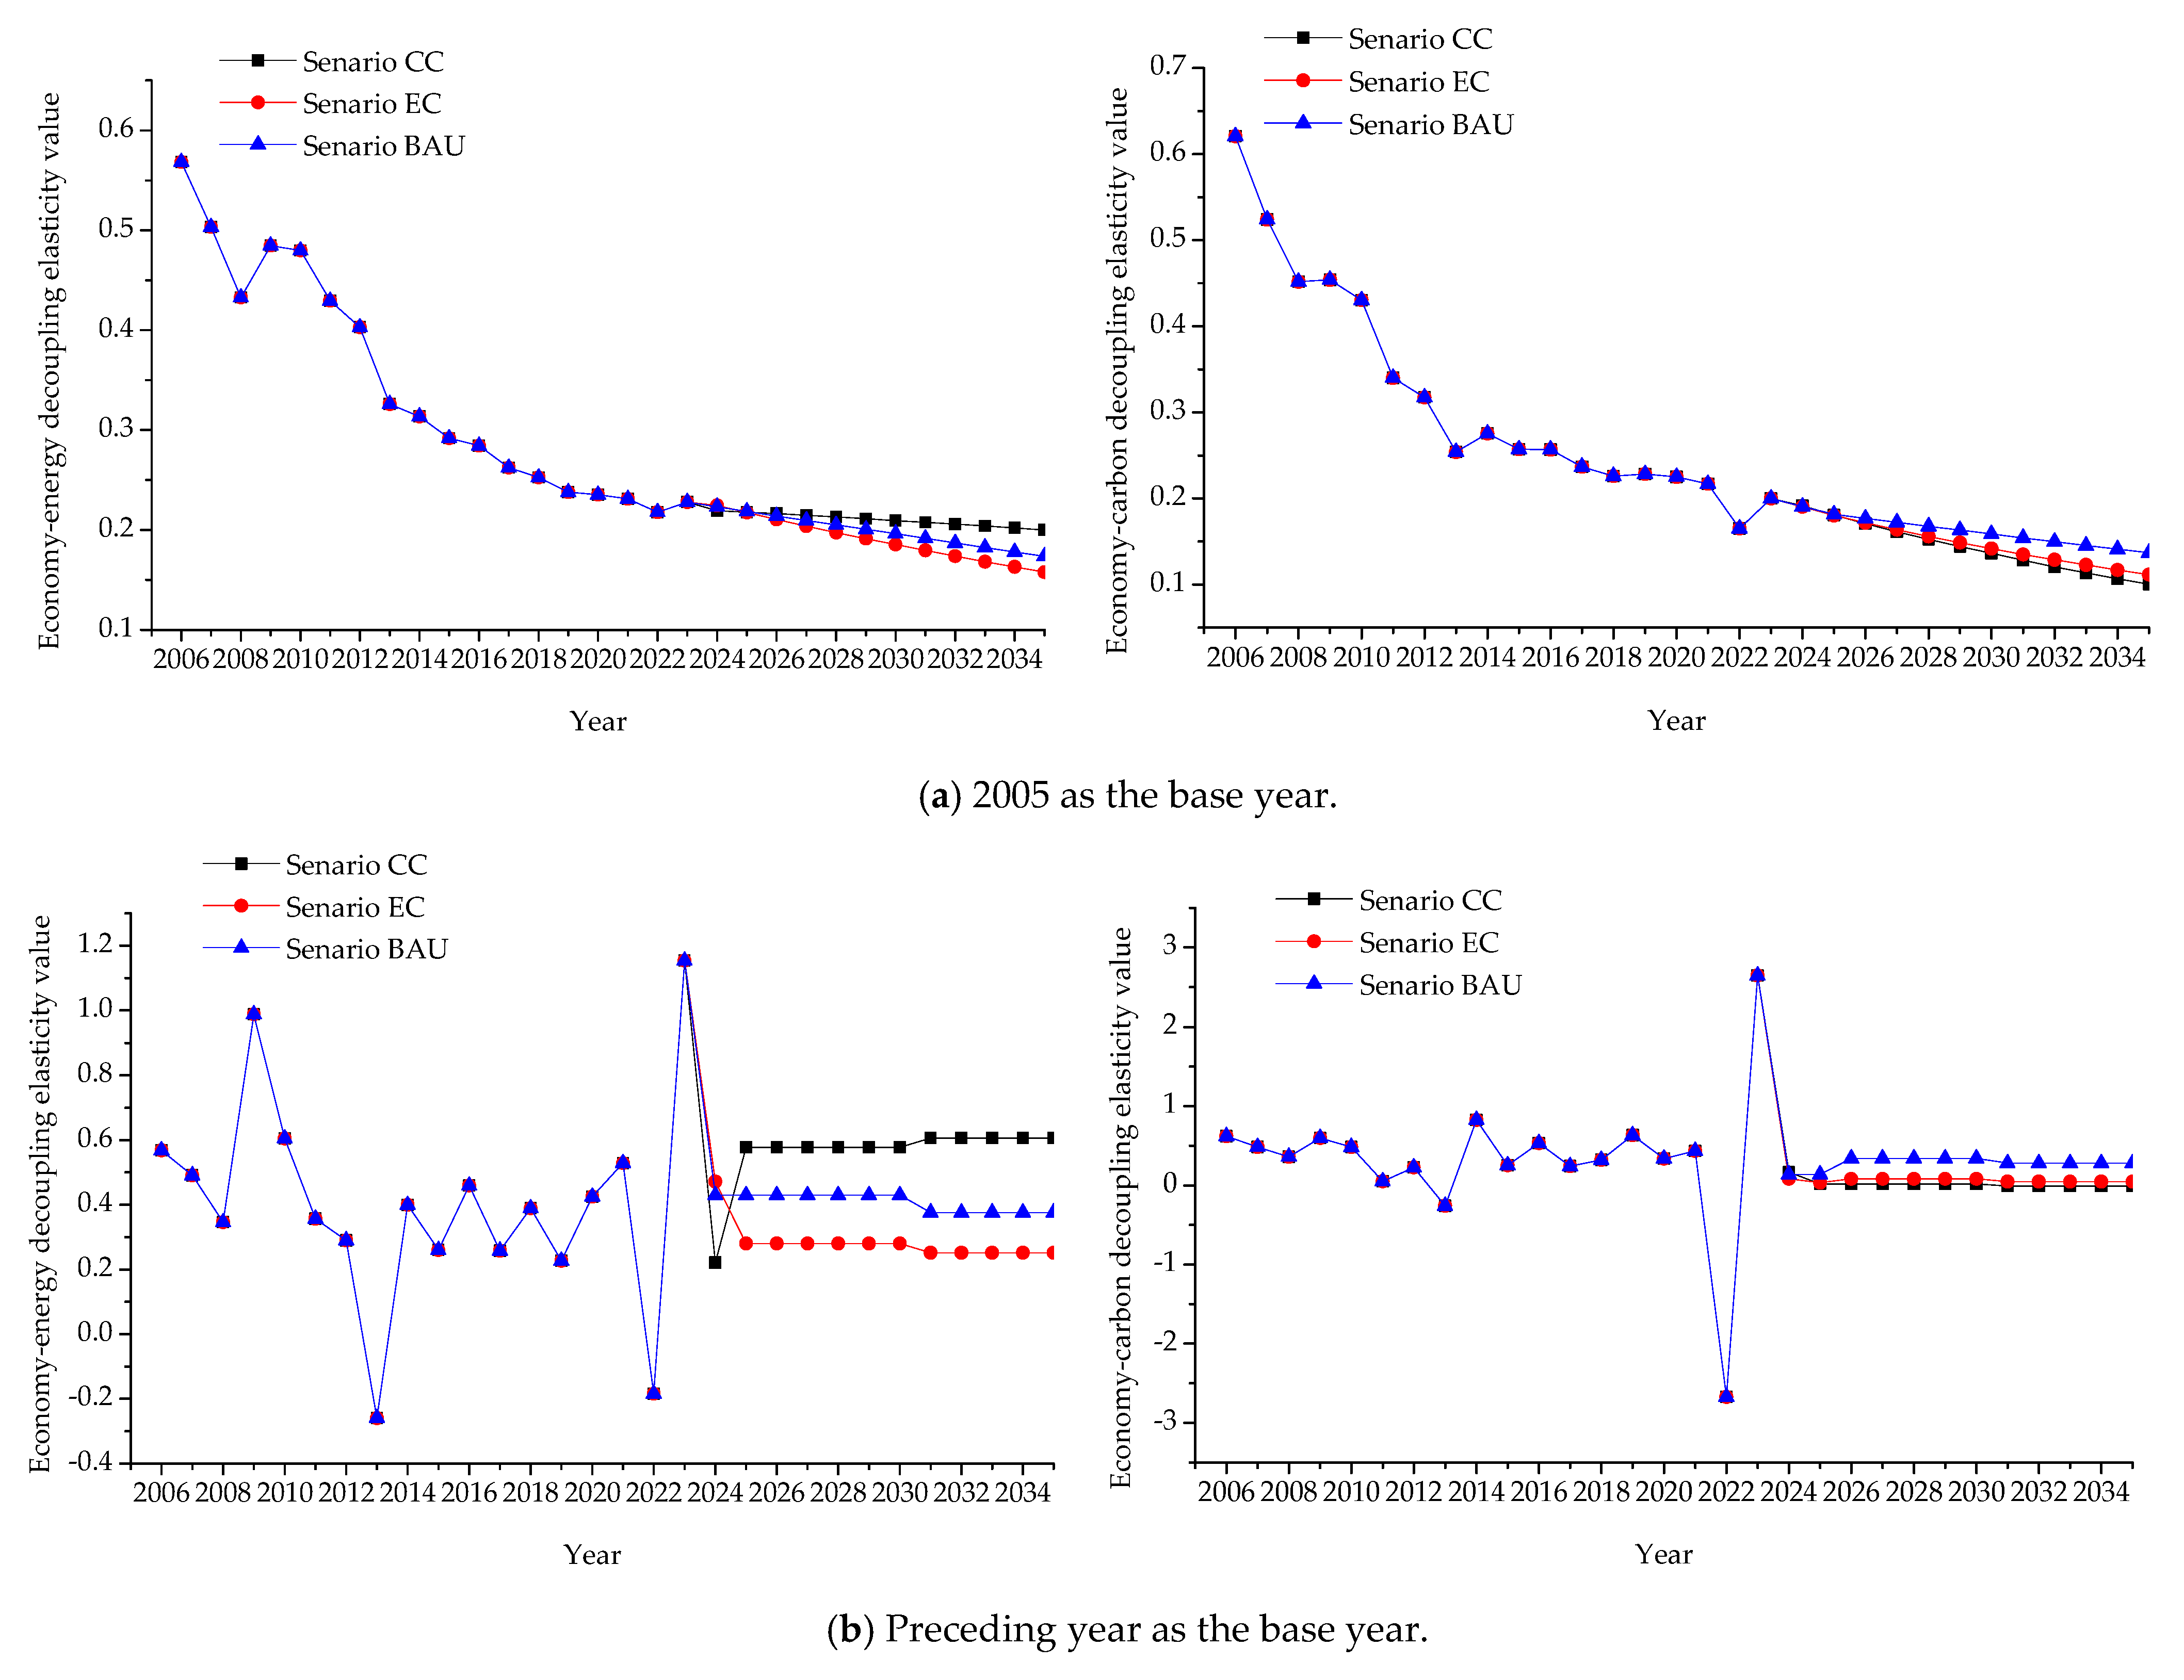
Decoupling evolution analysis
From the perspective of the status of decoupling between the economy, energy, and carbon emissions, the results with 2005 as the base year (Figure 9a) show that, from 2005 to 2035, the decoupling elasticity values between the economy and energy, as well as between the economy and carbon emissions, have been decreasing year by year. This indicates that the implementation of energy-consumption policies is conducive to the decoupling of the economy in respect to energy and carbon emissions. However, after 2025, under the CC scenario, the decline rate of the decoupling elasticity value between economy and energy slows down significantly, while the decline rate of the decoupling elasticity value between the economy and carbon emissions accelerates. This suggests that the implementation of the dual carbon control policy slows down the decoupling process between the economy and energy, due to the release of clean-energy consumption space; however, this accelerates the decoupling process between the economy and carbon emissions.
The results with the previous year as the base year show that there were significant abnormal points in the decoupling between the economy and energy in 2009, 2013, 2022, and 2023, as well as in the decoupling between the economy and carbon emissions in 2022 and 2023 (Figure 9b). The abnormal point in 2009 was caused by the increased energy demand during the economic recovery after the 2008 financial crisis. In 2013, Guangdong Province issued the “12th Five-Year Plan for Energy Conservation and Emission Reduction in Guangdong Province”. Meanwhile, the carbon emission trading market in Guangdong Province officially started operating, resulting in strong decoupling between the economy and energy. Affected by the COVID-19 pandemic, there was a significant “boom–bust” situation in 2022 and 2023. That is, in 2022, the pandemic led to a substantial decline in energy consumption and carbon emissions, resulting in a strong decoupling between the economy, energy, and carbon emissions. In 2023, with the rapid economic recovery, energy demand increased rapidly and carbon emissions rose accordingly, showing a strong correlation between the economy, energy, and carbon emissions. Therefore, using the previous year as the base year can capture the immediate impacts of policies, emergencies, or economic fluctuations.
The results with a five-year base period show that from 2005 to 2015, the decoupling elasticity values between the economy and energy, as well as between the economy and carbon emissions, decreased (Figure 9c). From 2015 to 2025, the decoupling elasticity value between the economy and energy rebounded and increased, while the decoupling elasticity value between the economy and carbon emissions first increased and then decreased, but both were in a weak decoupling state. From 2025 to 2030, the implementation of the dual-carbon control policy slowed down the decoupling between the economy and energy consumption but accelerated the decoupling between the economy and carbon emissions. In particular, from 2030, the CC scenario will achieve a strong decoupling between the economy and carbon emissions.
In essence, carbon-focused policies effectively constrain emissions while liberating energy consumption space for economic growth, enabling robust economy–emissions decoupling.

4. Discussion

Under the dual carbon emissions control policy framework, the 3E system establishes dynamic coupling through three interconnected triangular mechanisms (Figure 10). Specifically, carbon control policies synergize with energy-saving technologies and market mechanisms to act upon the energy subsystem. This integrated approach progressively approximates the optimal solution to the Energy Trilemma. Consequently, it drives the sustainable development of the central triangle (the 3E system itself). Ultimately, this process achieves high-order coupling within the 3E system.

4.1. Dual Carbon Emissions Control Policy’s Resolution of the Energy Trilemma (Internal Triangle)

Through dynamic adjustments integrating the dual carbon emissions control policy with energy-saving technologies and market mechanisms, it progressively approximates the optimal solution to the Energy Trilemma, thereby resolving this long-standing paradox. Regarding cleanliness, the policy explicitly excludes non-fossil energy sources from total energy consumption assessments, removing constraints on clean energy development and liberating clean energy consumption space for economic growth. Under the CC scenario, the share of non-fossil energy consumption increases annually from 2025 to 2035, reaching 45% by 2035. Carbon emissions will decrease by 26.43 million tons compared to the BAU scenario, as well as by 5.43 million tons relative to the EC scenario. Strong decoupling is achieved between economic development and carbon emissions. The energy cleanliness level significantly improves, with notable effectiveness in carbon reduction. For economic cost balancing, carbon market quota trading, green electricity transactions, and green finance (e.g., carbon reduction loans) reduce corporate low-carbon transition costs. Carbon pricing signals guide technological upgrades in energy-intensive industries. Regarding security assurance, promoting energy storage applications and grid flexibility retrofits addresses renewable energy intermittency. This enhances the resilience of the energy system.

4.2. Reconstruction Logic of Dual Carbon Emissions Control Policy for 3E System (Central Triangle) Coupling Relationships

The dual carbon emissions control policy drives the systemic reconstruction of the 3E system through low-carbon restructuring of the energy system, structural reshaping of the economic system, and synergistic improvement of the environmental system, thereby promoting high-order coupling within the 3E system.
(1)
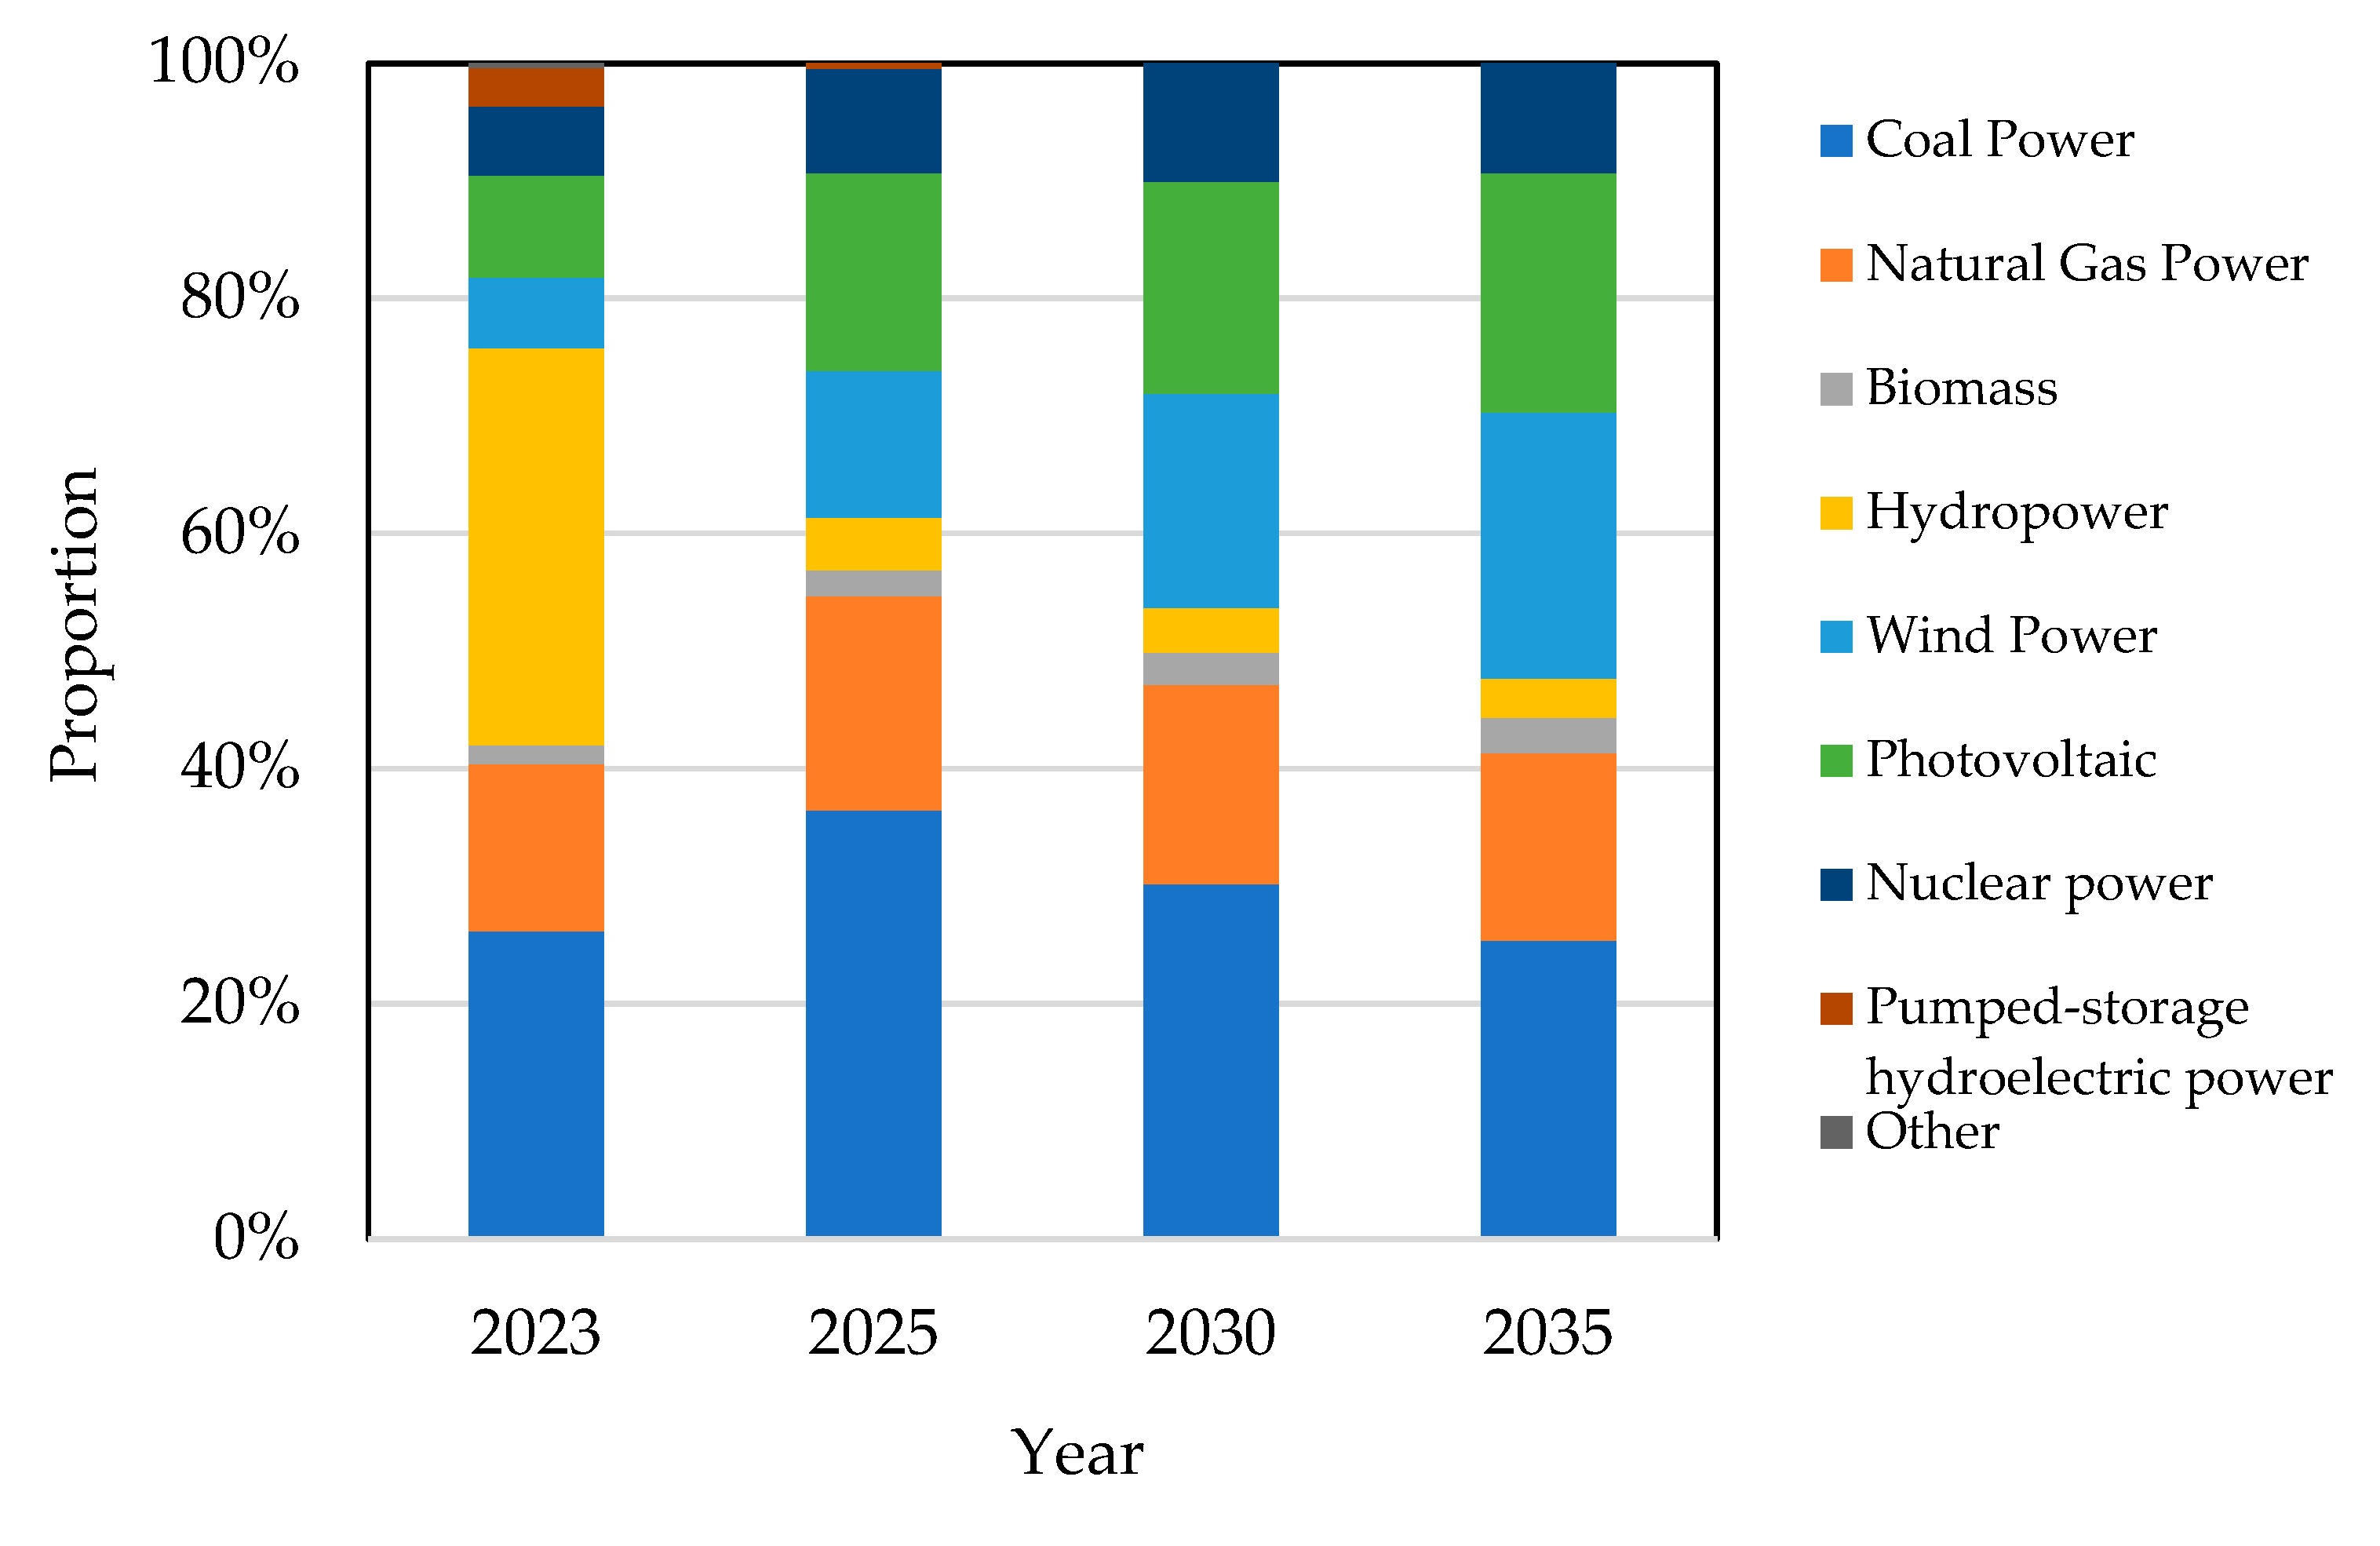
Low-carbon restructuring of energy system
Carbon emission controls accelerate energy structure transformation through “non-fossil energy exemption” and “multi-energy complementarity” mechanisms. Under the impetus of the policy, Guangdong’s non-fossil energy consumption share will increase from 30% in 2023 to 45% by 2035 (Figure 11); installed thermal power capacity and its proportion will decrease annually (Figure 12), while the share of non-fossil energy power generation will rise progressively. The energy structure and power generation mix will achieve higher levels of cleanliness. By 2035, Guangdong’s energy intensity will drop by 19% below 2020 levels, while energy utilization efficiency will demonstrate continuous optimization. In the near term, increased investments in new energy sources will drive up energy use costs. However, in the long term, advancements in energy storage technologies and carbon market revenues will gradually reduce this cost pressure. Consequently, energy security and cost equilibrium remain effectively safeguarded.
(2)
Structural reshaping of the economic system
The dual carbon emissions control policy compels industrial upgrades and technological innovation through “exempting clean energy from energy consumption assessments” and “strengthening constraints on high-carbon industries”. The proportion of tertiary industry will increase from 55% in 2023 to 60% by 2035. Using carbon emission intensity as a binding indicator, it drives decoupling between GDP growth and carbon emissions (see Figure 9 for details).
(3)
Synergistic improvement of the environmental system
Under the dual carbon emissions control policy, the environmental system will transition from end-of-pipe treatment to source control. Guangdong Province will achieve its carbon peak by 2030, after which total carbon emissions will enter a sustained decline phase. Through implementing this policy, the carbon intensity in Guangdong is projected to decrease by 40.7% by 2035 compared to 2025, declining by 76.56% compared to 2005 levels (Figure 13). Via the forest carbon sink trading mechanism, Guangdong’s annual carbon sequestration increment would average 50 million tons during 2025–2035. The emission reduction contribution will remain stable at approximately 23%. This would enable a positive feedback loop between environmental protection and economic development.

4.3. Analysis of the Supporting Role of Dual Carbon Emissions Control Policy on the External Triangle

China has designed a “three-phase implementation path” for the dual carbon emissions control policy—improving the accounting system before 2025, prioritizing intensity control during the 15th Five-Year Plan period (2026–2030), and transitioning to total carbon emission control post peak (after 2030). The late stage of the 14th Five-Year Plan and the 15th Five-Year Plan period will focus on policy articulation, establishing synergy mechanisms between carbon dual-control and carbon markets to prevent the occurrence of dual assessment conflicts.
At the technical level, the dual carbon emissions control policy requires supporting policies to advance technological breakthroughs in hydrogen energy (“production, storage, transportation, and utilization”) and CCUS. For example, the low current carbon price in Guangdong (approximately CNY 70/ton) fails to reach the economic inflection point for CCUS, resulting in sluggish adoption rates. Under the dual carbon emissions control policy, carbon allowance allocations will be further tightened, which may drive carbon prices above the critical threshold (CNY 180/ton). This would trigger the economic inflection point for CCUS technology, enabling large-scale application and subsequent growth in adoption rates. Ultimately, a stable system featuring “moderate carbon pricing (CNY 200–350/ton) + moderate technology penetration (15–25%)” will emerge.
At the market level, both national and provincial carbon markets are progressively expanding, guiding corporate emission reductions through carbon quota trading. As of May 2025, emission-regulated enterprises covered by the national carbon market include those in the power, steel, cement, and electrolytic aluminum sectors. The Guangdong Provincial Carbon Emission Trading Market encompasses power, petrochemicals, papermaking, textiles (selected enterprises), ceramics (construction and sanitary), transportation (ports), civil aviation, and data centers. The coordinated development of market mechanisms and dual carbon emissions control policy instruments forms a “policy–market” dual-driver approach that will effectively enhance energy conservation and carbon reduction.

4.4. Negative Impacts of the Dual Carbon Emissions Control Policy Within the “Triangular Trinity” Framework

Within the complex mega-system of energy–economy–environment, the rigid implementation of the dual carbon emissions control policy’s targets may induce multi-layered disruptions to the inherent balance and evolutionary dynamics of the “Triangular Trinity”. For instance, the stringent constraints of the policy, which directly target the energy system’s decarbonization goals, could threaten energy security and economic viability if not supported by complementary policies, thereby exacerbating the contradictions within the “Energy Trilemma”.
While the policy aims to enhance the environmental dimension by reducing carbon emissions, its mandatory intervention risks destabilizing the intricate interplay and progressive synergy between energy, economy, and environment. Additionally, the policy’s inherent rigidity, uncertainty, and design flaws may stifle technological innovation, distort market efficiency, and hinder virtuous interactions among policy, technology, and market forces.
Consequently, the key to effective implementation lies in seeking a dialectical balance and dynamic optimization—a core intention of the “Triangular Trinity” theoretical framework. Only by acknowledging and mitigating the policy’s potential negative impacts within this framework can the dual carbon emissions control policy evolve into a robust engine for driving systemic energy transitions and fostering green, low-carbon, and high-quality development, rather than becoming a new source of systemic risk.

5. Conclusions

Based on the constructed “Triangular Trinity” theoretical framework, this study employs quantitative models and methods—including degree of coupling coordination, decoupling analysis, and scenario prediction—to examine how the transition from dual energy consumption control to dual carbon emissions control will impact the coupling coordination relationship within the 3E system. It further discusses the reconstruction logic and mechanisms of the dual carbon emissions control policy for 3E system coupling relationships. The main conclusions are as follows:
(1) During 2005–2016, the dual energy consumption control demonstrated remarkable energy-saving and emission reduction outcomes, significantly promoting coordinated development within Guangdong’s 3E system. Since 2017, limitations arising from solely controlling total energy consumption have become apparent, leading to a notable decline in 3E system coordination. Conversely, implementing carbon dual control policies can substantially elevate 3E system coordination levels.
(2) The shift from dual energy consumption control to dual carbon emissions control effectively decouples economic growth from carbon emissions, while temporarily slowing economic–energy consumption decoupling. This transition provides Guangdong’s low-carbon transformation with a clean-energy flexibility space equivalent to 50.92 million tonnes of coal equivalent (Mtce), reducing carbon emissions by 26.43 million tonnes, thereby facilitating high-quality economic development.
(3) Integrating with external triangle elements (energy-saving technologies and market mechanisms), carbon dual control policies optimize solutions for the “Energy Trilemma” constraints, driving the systematic reconstruction of the sustainable development triangle and achieving advanced coupling within the 3E system.
The “Triangular Trinity” theoretical framework developed in this study integrates fragmented energy contradictions, developmental goals, and driving factors into a dynamically evolving complex system. Through the configurational alignment of multidimensional policy tools, technological innovation, and market mechanisms, it enables a paradigm shift from the “Energy Trilemma” to the “Sustainable Triangle”. Based on this theoretical framework, we aim to establish a generally applicable research paradigm for China’s energy transition, to explain the logic behind China’s energy transition. Different provinces and regions implement identical policies through distinct pathways tailored to local conditions. In this study, we focused on Guangdong Province—characterized by “low energy self-sufficiency and high energy load density”—to analyze the impacts of the dual carbon emissions control policy. The findings provide transferable insights for regions with similar energy profile needs, to resolve the contradictions within the 3E system globally, while regions with divergent energy characteristics require “context-specific investigations” aligned with their unique energy endowments.

Author Contributions

Y.X. and W.W. contributed equally to this work. Y.X.: data curation, methodology. W.W.: conceptualization, writing-original draft, visualization, validation. X.Y.: data curation. G.C.: methodology. L.C.: validation. H.C.: data curation. Z.L.: validation. All authors have read and agreed to the published version of the manuscript.

Funding

This research was funded by Special Project on Power Planning (0301002024030301QY00016) of Guangdong Power Grid Co., Ltd.

Data Availability Statement

The data presented in this study are available on request from the corresponding author.

Conflicts of Interest

Authors Yuan Xu, Xuwen Yan, Liping Chen, Haifeng Cen and Zihan Lin are affiliated with Guangzhou Power Supply Bureau of Guangdong Power Grid Co., Ltd. The authors declare no conflicts of interest.

Appendix A

Table A1. Degree of coupling coordination classification standard.
Interval Value of Degree of Coupling Coordination Coordination LevelDegree of Coupling Coordination
[0.0~0.1)1Extreme disorder
[0.1~0.2)2Barely coordinated
[0.2~0.3)3Moderate disorder
[0.3~0.4)4Mild disorder
[0.4~0.5)5Verging on disorder
[0.5~0.6)6Barely coordinated
[0.6~0.7)7Primary coordination
[0.7~0.8)8Intermediate coordination
[0.8~0.9)9Good coordination
[0.9~1.0]10High-quality coordination
Table A2. The weight of each indicator in the 3E system.
SubsystemIndicatorWeight (%)
BAU ScenarioEC ScenarioCC Scenario
Economic subsystem (3)Gross GDP (+)
Proportion of tertiary industry (+)
Per Capita Gross Domestic Product (+)
37.97
28.07
33.95
37.7
28.73
33.58
37.23
29.51
33.26
Energy subsystem (3)Total energy consumption (−)
Share of non-fossil energy (+)
Self-sufficiency rate of energy (+)
40.26
31.85
27.89
43.94
29.94
26.13
29.14
36.97
33.89
Environment subsystem (3)Carbon emissions (−)
Forest carbon storage (+)
PM2.5 (−)
45.14
33.03
21.83
61.64
22.9
15.46
66.51
19.8
13.69
Note: “+” represent positive indicator; “−” represent negative indicator.
Table A3. Eight decoupling states defined by Tapio.
Decoupling Elasticity Value (Dt)ΔC/CΔGDP/GDPDecoupling StateDescription
Dt < 0<0>0Strong DecouplingEconomic growth with decreasing carbon emissions
0 ≤ Dt < 0.8>0>0Weak DecouplingEconomic growth rate is higher than carbon emission growth rate
0.8 ≤ Dt ≤ 1.2>0>0Expansive CouplingEconomic growth rate is relatively synchronized with carbon emission growth rate
Dt > 1.2>0>0Expansive Negative DecouplingEconomic growth rate is lower than carbon emission growth rate
Dt < 0>0<0Strong Negative DecouplingEconomic decline with increasing carbon emissions
0 ≤ Dt < 0.8<0<0Weak Negative DecouplingEconomic decline rate is greater than carbon emission decline rate
0.8 ≤ Dt ≤ 1.2<0<0Recessive CouplingEconomic decline rate is relatively synchronized with carbon emission decline rate
Dt > 1.2<0<0Recessive DecouplingEconomic decline rate is lower than carbon emission decline rate

References

  1. State Council. Notice on the Division of Work for Implementing the Main Objectives and Tasks of the “Outline of the Eleventh Five-Year Plan for National Economic and Social Development of the People’s Republic of China”. Gaz. State Counc. People’s Repub. China 2006, 29, 30–36. [Google Scholar]
  2. Xinhua News Agency. Central Economic Work Conference Held, Xi Jinping and Li Keqiang Deliver Important Speeches. Available online: https://www.gov.cn/xinwen/2021-12/10/content_5659796.htm (accessed on 20 May 2025).
  3. State Council of the People’s Republic of China. Outline of the 14th Five-Year Plan for National Economic and Social Development and the Long-Range Objectives Through the Year 2035. 2021. Available online: https://www.gov.cn/xinwen/2021-03/13/content_5592681.htm (accessed on 1 April 2025).
  4. State Council of the People’s Republic of China; National Development and Reform Commission; National Energy Administration. Notice on Printing and Distributing the “14th Five-Year Plan for Modern Energy System”: Development and Reform Energy [2022] No.210. 2022. Available online: https://www.gov.cn/zhengce/zhengceku/2022-03/23/content_5680759.htm (accessed on 29 March 2025).
  5. General Office of the State Council. Notice on Printing and Distributing the “Work Plan for Accelerating the Construction of the Carbon Emission Dual Control System”: Guobanfa [2024] No. 39. 2024. Available online: https://www.gov.cn/zhengce/zhengceku/202408/content_6966080.htm (accessed on 20 March 2025).
  6. Aldy, J.E.; Stavins, R.N. The Promise and Problems of Pricing Carbon: Theory and Experience. J. Environ. Dev. 2012, 21, 152–184. [Google Scholar] [CrossRef]
  7. Gawel, E.; Strunz, S.; Lehmann, P. A public choice view on the climate and energy policy mix in the EU—How do the emissions trading scheme and support for renewable energies interact? Energy Policy 2014, 64, 175–182. [Google Scholar] [CrossRef]
  8. Dai, H.C.; Xie, Y.; Liu, J.Y.; Masui, T. Aligning renewable energy targets with carbon emissions trading to achieve China’s INDCs: A general equilibrium assessment. Renew. Sustain. Energy Rev. 2018, 82, 4121–4131. [Google Scholar] [CrossRef]
  9. Pahle, M.; Quemin, S.; Osorio, S.; Guenther, C.; Pietzcker, R. The emerging endgame: The EU ETS on the road towards climate neutrality. Rresource Energy Econ. 2025, 81, 101476. [Google Scholar] [CrossRef]
  10. Liao, L.P.; Kong, S.N.; Du, M.Z. The effect of clean heating policy on individual health: Evidence from China. China Econ. Rev. 2025, 89, 102309. [Google Scholar] [CrossRef]
  11. Zhou, S.; Qi, T.Y.; Zhao, X.G. Realization of global representative concentration pathways emission scenarios and its regional impacts. Syst. Eng.-Theory Pract. 2017, 37, 2091–2101. [Google Scholar]
  12. Wang, B.B.; Jotzo, F.; Qi, S.Z. Expost cap adjustment for China’s ETS: An applicable indexation rule, simulating the Hubei ETS, and implications for a national scheme. Clim. Policy 2018, 18, 258–273. [Google Scholar] [CrossRef]
  13. Tian, H.D.; Wang, W.; Luo, B.H.; Peng, Q.S. Internal logic and realization path of transformation from “double control” of energy consumption to “double control” of carbon emission under the “double carbon” strategy. Energy Res. Manag. 2023, 15, 16–22. [Google Scholar]
  14. Xie, D.; Gao, Y.J.; Lu, X.B.; Liu, T.Y.; Zhao, L.; Zhao, Y. Implementation path study of the transition from energy consumption “dual control” to carbon emission “dual control”. Compr. Smart Energy 2022, 44, 73–80. [Google Scholar]
  15. Xuan, X.W. From “dual control” of energy consumption to “dual control” of carbon: Challenges and countermeasures. Urban Environ. Stud. 2022, 3, 42–55. [Google Scholar]
  16. Jang, C.H.; Yan, Z.H.; Wang, M. From dual control of energy consumption to dual control of carbon emissions under the constraints of carbon peaking and carbon neutrality goals: Regulatory tools, effect simulation and policy evaluation. China’s Ind. Econ. 2024, 11, 5–23. [Google Scholar]
  17. Tang, L.; Wang, P.; Ren, S.Y. From dual control of energy consumption to dual control of carbon: A comparative study of policies from multiple perspectives. Sci. Technol. Eng. 2024, 24, 11019–11029. [Google Scholar]
  18. Tang, F.; Dai, H.C.; Zhang, N.; Wu, Y.; Xue, M.M.; Chen, R. Effect analysis and promotion path design for transformation from energy consumption “dual control” to carbon “dual control”. Electr. Power 2023, 56, 255–261. [Google Scholar]
  19. Yang, F. Some thoughts on the transition from dual control of energy consumption to dual control of carbon emissions in Inner mongolia. Environ. Dev. 2023, 35, 18–22. [Google Scholar]
  20. Li, C.L.; Chang, X.Q.; Lu, H. Analysis and forecast of the shift from double control of energy consumption to double control of carbon emissions in Xinjiang. Power Gener. Technol. 2024, 45, 1114–1120. [Google Scholar]
  21. An, K.X.; Liu, M.K.; Fan, S.T.; Wang, C. Impact of transition from the energy consumption “dual control” to the carbon “dual control”: A CGE-based case study of Anhui. China Environ. Sci. 2024, 44, 1795–1804. [Google Scholar]
  22. Li, Z.C.; Pan, J.R.; Zhong, L. Research on promoting the shift from dual control of energy consumption to dual control of carbon emissions and striving to achieve peak carbon dioxide emissions and carbon neutrality: A case study of Jiangxi. Prices Mon. 2025, pp. 1–13. Available online: https://link.cnki.net/urlid/36.1006.F.20250522.1103.008 (accessed on 29 March 2025).
  23. Wang, C.; Ye, J.H.; Zhang, T.Y.; Huang, W. Research on the coal reduction path in Zhejiang Province under the background of transforming “Amount and Intensity Control of Energy Consumption” to “Amount and Intensity Control of Carbon Emission”. Environ. Pollut. Control. 2023, 45, 1307–1311. [Google Scholar]
  24. Wu, L.P. Considerations on Shanghai taking the lead in promoting the transition from “dual energy consumption control” to “dual carbon emissions control”. Shanghai Energy Conserv. 2023, 5, 546–552. [Google Scholar]
  25. Chang, W.; Lu, L.F.; Cao, D.Y. Analysis of development status and suggestions on response paths for the automotive industry under carbon emission dual control requirements. Automob. Parts 2024, 24, 24–28. [Google Scholar]
  26. Sun, W.J.; Zhang, S.J.; Men, X.J. Impact and countermeasures of the shift from dual control of energy consumption to dual control of carbon emissions on the oil and gas industry. Oil Gas New Energy 2024, 36, 34–40. [Google Scholar]
  27. Xu, H. Enterprise adaptation strategy under policy from dual control of energy consumption to dual control of carbon emission. Energy Energy Conserv. 2024, 4, 68–71. [Google Scholar]
  28. Hu, M.Y.; Gao, H.W.; Liao, J.; Liu, J.P.; Jiang, Q. Research on response strategies for petrochemical enterprises under the trend of “dual carbon emissions control” policy. Green Pet. Petrochem. 2023, 8, 10–14. [Google Scholar]
  29. Guangdong Provincial People’s Government. Notice of Guangdong Provincial People’s Government on Printing and Distributing the Implementation Plan for Carbon Peaking in Guangdong Province (Yuefu [2022] No. 56). 2022. Available online: http://www.gd.gov.cn/zwgk/gongbao/2023/4/content/post_4091315.html (accessed on 21 March 2025).
  30. Guangdong Provincial Committee of the Communist Party of China; Guangdong Provincial People’s Government. Implementation Opinions on Fully, Accurately and Comprehensively Implementing the New Development Concept to Promote Carbon Peaking and Carbon Neutrality Work. 2022. Available online: https://www.eesia.cn/contents/113/1701.html (accessed on 20 March 2025).
  31. Guangdong Provincial Development and Reform Commission. Notice on Further Strengthening the Energy Security for High-Quality Development in the Province (Yuefa Gai Neng Yuan Han [2023] No.491. 2023. Available online: http://drc.gd.gov.cn/ywtz/content/post_4169964.html (accessed on 20 March 2025).
  32. Cen, H.; Wang, W.; Chen, L.; Hao, W.; Guan, Z.; Lu, J.; Cai, G. Multi-Scenario Research on the Coupled and Coordinated Development of the Economic–Energy–Environmental (3E) System under the Reconstruction of the Power System—New Exploration Based on the “Dual Triangle” Theory. Energies 2024, 17, 3468. [Google Scholar] [CrossRef]
  33. Zhang, S.F.; Hu, T.T.; Li, J.B.; Cheng, C.; Song, M.L.; Xu, B.; Tomas, B. The effects of energy price, technology, and disaster shocks on China’s energy-environment-economy system. J. Clean. Prod. 2019, 207, 204–213. [Google Scholar] [CrossRef]
  34. Zhang, X.G.; Zhang, M.Y.; Zhang, H.; Jiang, Z.G.; Liu, C.H.; Cai, W. A review on energy, environment and economic assessment in remanufacturing based on life cycle assessment method. J. Clean. Prod. 2020, 255, 120160. [Google Scholar] [CrossRef]
  35. Lu, G.; Xu, S.Z.; Wang, P. Strategic Thinking of the Path for Electric Power Carbon Peak and Carbon Neutrality on Basis of Energy-Economy-Environment Relations. Pet. Sci. Technol. Forum 2020, 1, 57–62. [Google Scholar]
  36. Yang, L.; Sun, Z.C. The Development of western new type urbanization level evaluation based on entropy method. Econ. Probl. 2015, 3, 115–119. [Google Scholar]
  37. Zhao, A.W.; Li, D. Empirical analysis of the decoupling relationship between carbon emissions and economic growth in China. J. Technol. Econ. 2013, 32, 106–111. [Google Scholar]
  38. Guangdong Provincial Bureau of Statistics. Guangdong Statistical Yearbook 2024. 2025. Available online: http://stats.gd.gov.cn/gdtjnj/content/post_4626161.html (accessed on 15 March 2025).
  39. People’s Government of Guangdong Province. Implementation Plan of Guangdong Province for Energy Conservation and Emissions Reduction During the 14th Five-Year Plan Period (Yuefu [2022] No. 68). 2022. Available online: https://www.gd.gov.cn/zwgk/jhgh/content/post_4013726.html (accessed on 21 March 2025).
  40. People’s Government of Guangdong Province. Outline of the Construction Plan for a Beautiful Guangdong (2024–2035) (Yuefu [2024] No.231). 2024. Available online: https://www.gd.gov.cn/zwgk/jhgh/content/post_4608410.html (accessed on 20 March 2025).
  41. People’s Government of Guangdong Province. Action Plan for Energy Conservation and Carbon Emission Reduction from 2024 to 2025 (Yuefu [2024] No. 80). 2024. Available online: https://www.gd.gov.cn/zwgk/gongbao/2024/29/content/post_4638030.html (accessed on 21 March 2025).
Figure 1. The geographical location of Guangdong Province in China (sketch map).
Energies 18 03735 g001
Figure 2. “Triangular Trinity” theoretical framework.
Energies 18 03735 g002
Figure 3. Evolution patterns of the 3E system degree of coupling coordination (2005–2023).
Energies 18 03735 g003
Figure 4. Evolution of the 3E system degree of coupling coordination under three the policy scenarios.
Energies 18 03735 g004
Figure 5. Evolution of the 3E system degree of coordination under the three policy scenarios.
Energies 18 03735 g005
Figure 6. Evolution of the 3E system degree of coupling under the three policy scenarios.
Energies 18 03735 g006
Figure 7. Evolution patterns and future trajectory of Guangdong’s total energy consumption (2005–2035).
Energies 18 03735 g007
Figure 8. Evolution patterns and future trajectory of Guangdong’s carbon emissions (2005–2035).
Energies 18 03735 g008
Figure 9. Evolution patterns of decoupling status between economy–energy and economy–emissions in Guangdong (2005–2035).
Energies 18 03735 g009aEnergies 18 03735 g009b
Figure 10. Transmission pathway of the 3E system coupling coordination mechanism via the triple-triangle framework.
Energies 18 03735 g010
Figure 11. Energy structure and efficiency under the dual carbon emissions control (CC) scenario.
Energies 18 03735 g011
Figure 12. Power installed capacity structure under the dual carbon emissions control (CC) scenario.
Energies 18 03735 g012
Figure 13. Trends in carbon intensity and carbon sinks during 2005–2035.
Energies 18 03735 g013
Table 1. System indicators of the 3E system.
Subsystem3E System Indicator
Economic subsystem (3)Gross Domestic Product (GDP) (+)
Proportion of tertiary industry (+)
Per Capita Gross Domestic Product (+)
Energy subsystem (3)Total energy consumption (−)
Share of non-fossil energy (+)
Self-sufficiency rate of energy (+)
Environment subsystem (3)Carbon emissions (−)
Forest carbon storage (+)
PM2.5 (−)
Note: “+” represents positive indicators; “−” represents negative indicators.
Table 2. Description of scenario parameters.
ScenariosScenario DescriptionParameter Setting
Business-as-Usual (BAU)Continuation of existing policies with maintained dual energy consumption control mechanisms.
(1)
Economic Targets
Affected by the COVID-19 pandemic, the average GDP growth rate from 2015 to 2023 was 6% [38]. The dual energy consumption control policy will moderately slow economic growth. It is assumed that the annual average GDP growth will be 5.5% from 2025 to 2030 and 5% from 2030 to 2035. The proportion of tertiary industry is projected to rise steadily at the average growth rate of the 14th Five-Year Plan period.
(2)
Energy Constraints
During the 14th Five-Year Plan period, energy intensity decreased by 14% [39]. It is assumed that this reduction rate will remain at 14%. According to the Outline of the Construction Plan for a Beautiful Guangdong (2024–2035) (Yuefu [2024] No. 231) [40], the Action Plan for Energy Conservation and Carbon Emission Reduction from 2024 to 2025 (Yuefu [2024] No. 80) [41], and the Implementation Plan for Carbon Peak in Guangdong Province (Yuefu [2022] No. 56) [29], the share of non-fossil energy is expected to reach ≥40% by 2035. Under this scenario, non-fossil energy consumption is assumed to reach 40% by 2035.
(3)
Environmental Boundaries
Carbon emission intensity decreased by 20.5% during the 14th Five-Year Plan period [39]. It is assumed that the reduction rate will be slightly lower (i.e., 18%) in the future. Based on Guangdong’s forest stock calculations [38], the annual average increase in carbon storage was 33.38 million tons from 2005 to 2023. Under this scenario, an annual increase in carbon storage of 30 million tons is assumed. The PM2.5 concentration will drop to 19 μg/m3 by 2035.
Enhanced dual energy consumption control (EC) Building upon the BAU scenario, this intensifies dual energy consumption control targets.
(1)
Economic Targets
Strengthening the “Dual Energy Control” policy will slow GDP growth. It is assumed that the annual average GDP growth will be 5% from 2025 to 2030 and 4.8% from 2030 to 2035. The proportion of tertiary industry will remain consistent with the baseline scenario.
(2)
Energy Constraints
The reduction rate of energy intensity increases compared to the BAU scenario, reaching 16%. The share of non-fossil energy consumption rises slightly above the BAU level, achieving 42% by 2035.
(3)
Environmental Regulations
The reduction rate of carbon emission intensity increases compared to the baseline scenario, which is assumed to be 20%. Enhanced ecological restoration efforts are projected to raise annual forest carbon storage by 35 million tons. The PM2.5 concentration will drop to 17 μg/m3 by 2035.
Dual carbon emissions control (CC)Comprehensive implementation of the dual control of carbon emissions (total volume and intensity).
(1)
Economic Trajectory
GDP annual growth averages 5.2% during 2025–2030, increasing to 5.6% during 2030–2035. The service sector proportion increases steadily.
(2)
Energy Constraints
Although assessments of total energy consumption and intensity are discontinued, carbon intensity reduction drives energy intensity down by approximately 10%. The share of non-fossil energy consumption rises steadily relative to BAU.
(3)
Environmental Targets
Carbon intensity declines by 22% during 2026–2030 and by 24% during 2031–2035. Enhanced ecological restoration efforts are projected to increase annual forest carbon storage by 40 million tons. The PM2.5 concentration will drop to 15 μg/m3 by 2035.
Disclaimer/Publisher’s Note: The statements, opinions and data contained in all publications are solely those of the individual author(s) and contributor(s) and not of MDPI and/or the editor(s). MDPI and/or the editor(s) disclaim responsibility for any injury to people or property resulting from any ideas, methods, instructions or products referred to in the content.

