1. Introduction
The global shift toward sustainable energy systems has highlighted the critical need for accurate forecasting of renewable energy sources, particularly photovoltaic (PV) power. In systems with high solar penetration, forecast errors can deteriorate grid stability, increase operational costs, and limit the integration of renewable energy into national and regional energy markets. This challenge is even more pronounced in isolated power networks, where the absence of large-scale interconnections amplifies the importance of precise PV output prediction [
1].
Cyprus, located in the Eastern Mediterranean, represents a pertinent test case for advanced solar forecasting solutions. As an island system with growing reliance on PV installations, Cyprus is actively working toward meeting its national energy target of 50% renewable electricity production by 2030. Ensuring the reliability of PV power forecasts in such a system is essential for balancing supply and demand, optimizing energy dispatch and supporting further PV expansion.
Traditional forecasting approaches mainly rely on core meteorological inputs, such as solar irradiance, ambient temperature, and cloud coverage. However, emerging evidence suggests that broader atmospheric conditions, including wind characteristics, relative humidity, and aerosol presence, can significantly influence PV efficiency. In particular, the Mediterranean region is frequently affected by intense dust intrusions originating from North Africa, resulting in reduced solar radiation due to scattering and absorption, as well as panel soiling from particulate deposition.
Despite the established physical impact of dust and complex air composition on solar energy generation, their integration into AI-based PV forecasting models remains largely unexplored. This study addresses this gap by developing an AI-enhanced framework that incorporates a comprehensive set of atmospheric parameters, including cross-continental dust events and detailed air composition features, into a regression tree-based predictive model. The proposed methodology also introduces a novel clustering approach to group and evaluate input parameters based on statistical correlation with PV power output, improving both model accuracy and interpretability.
1.1. Literature Survey
Accurate forecasting of PV power generation is essential for the integration of solar energy into modern electricity grids, especially in isolated or small-scale systems with limited storage or interconnection capacity. In recent years, artificial intelligence and machine learning (ML) methods have become widely used for solar power prediction due to their ability to model complex, nonlinear relationships between environmental inputs and PV output.
A variety of ML techniques, including artificial neural networks (ANNs), support vector machines (SVMs), random forests, and regression trees, have been applied to solar forecasting problems. Among these, tree-based methods such as decision trees, gradient boosting, and regression trees have gained popularity due to their interpretability, efficiency, and robustness against overfitting, especially when dealing with high-dimensional or noisy data [
2,
3]. The majority of existing PV forecasting models incorporate common meteorological variables, such as solar irradiance, ambient temperature, and cloud cover. These inputs primarily influence the amount of solar radiation reaching the PV modules and are typically derived from either ground-based sensors, satellite imagery, or numerical weather prediction (NWP) outputs.
Recent advancements in artificial intelligence and machine learning have significantly improved photovoltaic power forecasting accuracy. Traditional methods, including autoregressive models and NWP-based approaches, have been widely used for day-ahead or longer-term forecasts. However, their performance often suffers due to the complexity of modeling nonlinear dependencies between environmental inputs and PV output, especially in real-time applications. On the contrary, data-driven approaches such as ANN; SVM; and ensemble methods, like random forests and gradient boosting, have demonstrated higher adaptability and improved performance across different forecast horizons [
4,
5,
6]. More recently, deep learning models such as long short-term memory (LSTM) and hybrid architectures have gained traction for their ability to model temporal sequences and capture spatiotemporal dependencies in short-term and ultra-short-term forecasting scenarios [
7,
8].
Forecasting frameworks in the literature are typically divided into direct and indirect methods. Direct forecasting models predict PV output directly using historical PV and meteorological data, while indirect models forecast solar radiation or irradiance first and subsequently estimate PV power. Across both frameworks, a wide range of input features are employed, including solar irradiance, ambient and module temperature, wind speed and direction, relative humidity and cloud cover. In some cases, advanced pre-processing techniques such as principal component analysis (PCA), self-organizing maps (SOM), and feature clustering have been used to enhance parameter selection and reduce redundancy. Hybrid models combining decomposition techniques like empirical mode decomposition (EMD) with ML algorithms have also been shown to improve forecasting accuracy by isolating distinct signal components [
9].
Despite the progress in model sophistication, the vast majority of forecasting studies still rely on a limited set of conventional meteorological inputs, with minimal incorporation of atmospheric composition parameters or soiling factors. However, the impact of dust deposition and particulate matter on PV performance has been well-documented in experimental and observational studies, showing reductions in output ranging from 10% to over 40% in dust-prone environments. Yet, such parameters remain underrepresented in AI-based forecasting frameworks. This omission is particularly critical for regions affected by frequent transboundary dust transport, such as the Mediterranean, where PV output can be substantially degraded during dust events [
10].
Global reviews and meta-analyses have quantified the average energy yield losses from dust deposition at between 2% and 50%, depending on geographical location, environmental conditions, and system characteristics [
11]. In extreme cases, such as in arid or semi-arid regions, losses of up to 80% have been reported for uncleaned PV systems exposed over extended periods [
12,
13]. A techno-economic analysis by Klemens et al. [
14] emphasized that soiling is not just a technical but also a major economic issue, especially for large-scale solar farms.
Moreover, the nature of the dust (e.g., particle size and chemical composition), environmental dynamics (e.g., wind speed and humidity), and panel tilt angle play significant roles in determining the extent and variability of soiling losses [
15]. For instance, Hussein et al. [
11] found that fine particles like fly ash and soot tend to adhere more strongly to surfaces, resulting in more persistent power degradation compared to larger, sand-based particles. Likewise, Roman et al. [
16] demonstrated how dust storms and volcanic ash could significantly alter the spectral transmittance of incoming solar radiation, disproportionately affecting PV output during such events.
Despite this extensive body of work, most AI-based PV forecasting models still neglect soiling-related variables, relying predominantly on conventional meteorological inputs such as irradiance, temperature, and cloud cover. As noted by Mani and Pillai [
13], this omission presents a significant blind spot, especially in regions frequently affected by transboundary dust transport, such as the Middle East and Mediterranean basin.
1.2. Objective and Contribution
A notable limitation in the current literature is the lack of integration of atmospheric composition parameters that can directly affect PV efficiency beyond irradiance attenuation. This gap underlines the pressing need to integrate dust-related parameters, such as PM concentrations, aerosol optical depth, or deposition forecasts, into predictive frameworks. Incorporating such features into machine learning models not only reflects the true operational dynamics of PV systems but also enhances the forecasting reliability under real-world dusty conditions. For example, particulate matter (PM)—including PM10 and PM2.5—and aerosols can scatter and absorb solar radiation, reducing the effective irradiance reaching the PV panels. Additionally, dust deposition on panel surfaces during intense transport events can significantly reduce power output by creating a physical barrier to light absorption. These effects are especially relevant in regions prone to transboundary dust transport, such as the Mediterranean basin, yet they remain underrepresented in predictive modeling efforts.
While several studies highlight the seasonal and climatic influence of soiling on PV efficiency, most treat these factors as post-event observations rather than real-time forecasting variables. There is also limited research into the correlation structure among environmental inputs or the use of clustering methods to optimize input parameter grouping. These techniques could enhance model performance by improving feature relevance and reducing redundancy.
Another critical shortcoming is the reliance on costly or proprietary data sources. Many forecasting systems depend on commercial weather services or private satellite data, thus limiting scalability and reproducibility. Models that leverage open-access, internet-based data—while still delivering high forecast accuracy—are rare but increasingly important for supporting widespread PV adoption. Despite these findings, the integration of dust-related parameters into AI-based PV forecasting models remains limited. Most existing models do not account for the dynamic effects of dust accumulation and atmospheric composition variability, which can lead to significant forecasting errors, especially in regions prone to dust events.
The current work addresses the aforementioned research gap by integrating air composition variables—retrieved entirely from public datasets—into a regression tree-based forecasting framework, enhanced by a novel input clustering and feature correlation strategy. This approach contributes a replicable and interpretable model to the field of solar forecasting, offering significant potential for implementation in other dust-affected regions. It presents an AI-enhanced forecasting framework based on regression trees, integrating not only classical meteorological parameters but also dust transport indicators and air composition variability. It introduces (a) a novel clustering method to evaluate input parameter correlations; (b) a fully open-data-driven approach using internet-available sources; and (c) a real-world application in an isolated Mediterranean system (Cyprus), where the impact of transboundary dust is especially pronounced.
To investigate both spatial and seasonal relationships between varying irradiance levels and PV power output, the model integrates a diverse set of predictors derived from publicly accessible and reliable online platforms. These inputs enable the estimation of renewable energy generation while capturing the influence of key environmental variables. The forecasting framework simultaneously addresses the power outputs of both PV parks and residential systems, incorporating a broad spectrum of input features. Its performance is evaluated across multiple real-world case studies, with results showing variation due to dynamic weather patterns and short-term fluctuations. These changes are used to iteratively adjust model parameters—such as weights and biases—in support of nonlinear regression. The overarching goal is to deliver a robust day-ahead forecasting tool for PV output that relies entirely on accessible, realistic datasets. This model is designed to serve as a reference framework, adaptable to different geographical settings, temporal scales, and training methodologies. While advanced AI techniques like deep reinforcement learning [
17] and hierarchical reinforcement learning have demonstrated effectiveness in complex decision-making contexts, their application in energy forecasting is often hindered by high computational demands and increased dimensionality [
18]. The growing integration of weather-sensitive and renewable technologies further complicates the forecasting landscape. Therefore, to handle the inherent uncertainty associated with cross-continental dust intrusions and fluctuating atmospheric composition, this study adopts regression tree algorithms for their interpretability and efficiency.
In contemporary energy systems, each independent power producer is required to submit their expected generation schedule to the corresponding system operator one day in advance. Aggregators managing distributed PV and residential systems coordinate with distribution system operators (DSOs), while utility-scale PV plants are accountable to transmission system operators (TSOs) for reporting hourly production forecasts. A bidirectional exchange of information between DSOs and TSOs enables the calculation of residual load, facilitating optimal unit commitment and economic dispatch planning for conventional thermal units connected at either the transmission or distribution level. Concurrently, load forecasts are independently generated by DSOs, emphasizing the necessity for accurate predictions—particularly for demand-side actors, such as prosumers, participants in demand–response programs, and those engaged in demand-side management. Within this framework, day-ahead PV power forecasting plays a pivotal role for TSOs, as it supports the consolidation of generation and demand profiles, accounting for both system losses and exogenous variables such as temperature, wind speed, and time of day. Additionally, the forecasting process must ensure the privacy of sensitive information across diverse stakeholders, including consumers, prosumers, renewable and conventional energy producers, aggregators, and grid operators. Consequently, the quality, selection and management of historical data emerge as critical factors in enhancing forecasting reliability and operational efficiency.
Table 1 accommodates the most recent research carried out in PV power forecasting.
The rest of this paper is organized as follows.
Section 2 presents a focused analysis of (a) PV generation patterns and their temporal profiles, (b) meteorological variables relevant to irradiance availability and PV system efficiency, and (c) the influence of dust transport events and particulate matter on power output degradation. The clustering approach for data harvesting purposes is explained in
Section 3, while the forecast model and the underlying mathematical framework are presented in
Section 4. Finally, conclusions are drawn in
Section 5.
2. Problem Formulation
A robust PV power forecasting model must account for a wide range of dynamic factors that influence photovoltaic generation. These include intrinsic system characteristics, such as the temporal behavior of PV generation itself; external atmospheric drivers, including temperature, humidity, and cloud cover; and highly influential phenomena such as dust transport and deposition. In this section, the forecasting problem is defined by analyzing these three core dimensions. The objective is to identify and characterize the input variables most strongly correlated with PV output fluctuations in the context of the Mediterranean region, where meteorological variability and transboundary dust events frequently disrupt solar-to-electricity performance.
2.1. Photovoltaic Generation
Photovoltaic systems convert solar radiation directly into electrical energy through semiconductor materials. The amount of electricity generated by a PV array depends primarily on the conversion efficiency of the modules (ηPV), the incoming global solar irradiance (GA), and the surrounding ambient temperature (Ta). To estimate the actual power output of a system, several standard reference conditions are used, typically provided by manufacturers. These include the reference solar irradiance (GSC, usually 1000 W/m2), standard temperature (TSC, typically 25 °C), and the temperature coefficient of the PV module (CT), which quantifies the efficiency drop per degree increase above TSC.
Under these conditions, the nominal output of a PV system (
PSC) can be adjusted for actual environmental conditions using the following relationship:
This expression captures the reduction in performance associated with elevated ambient temperatures, which can reduce conversion efficiency by approximately 0.3–0.5% per degree Celsius increase, depending on the module’s temperature sensitivity [
27,
28].
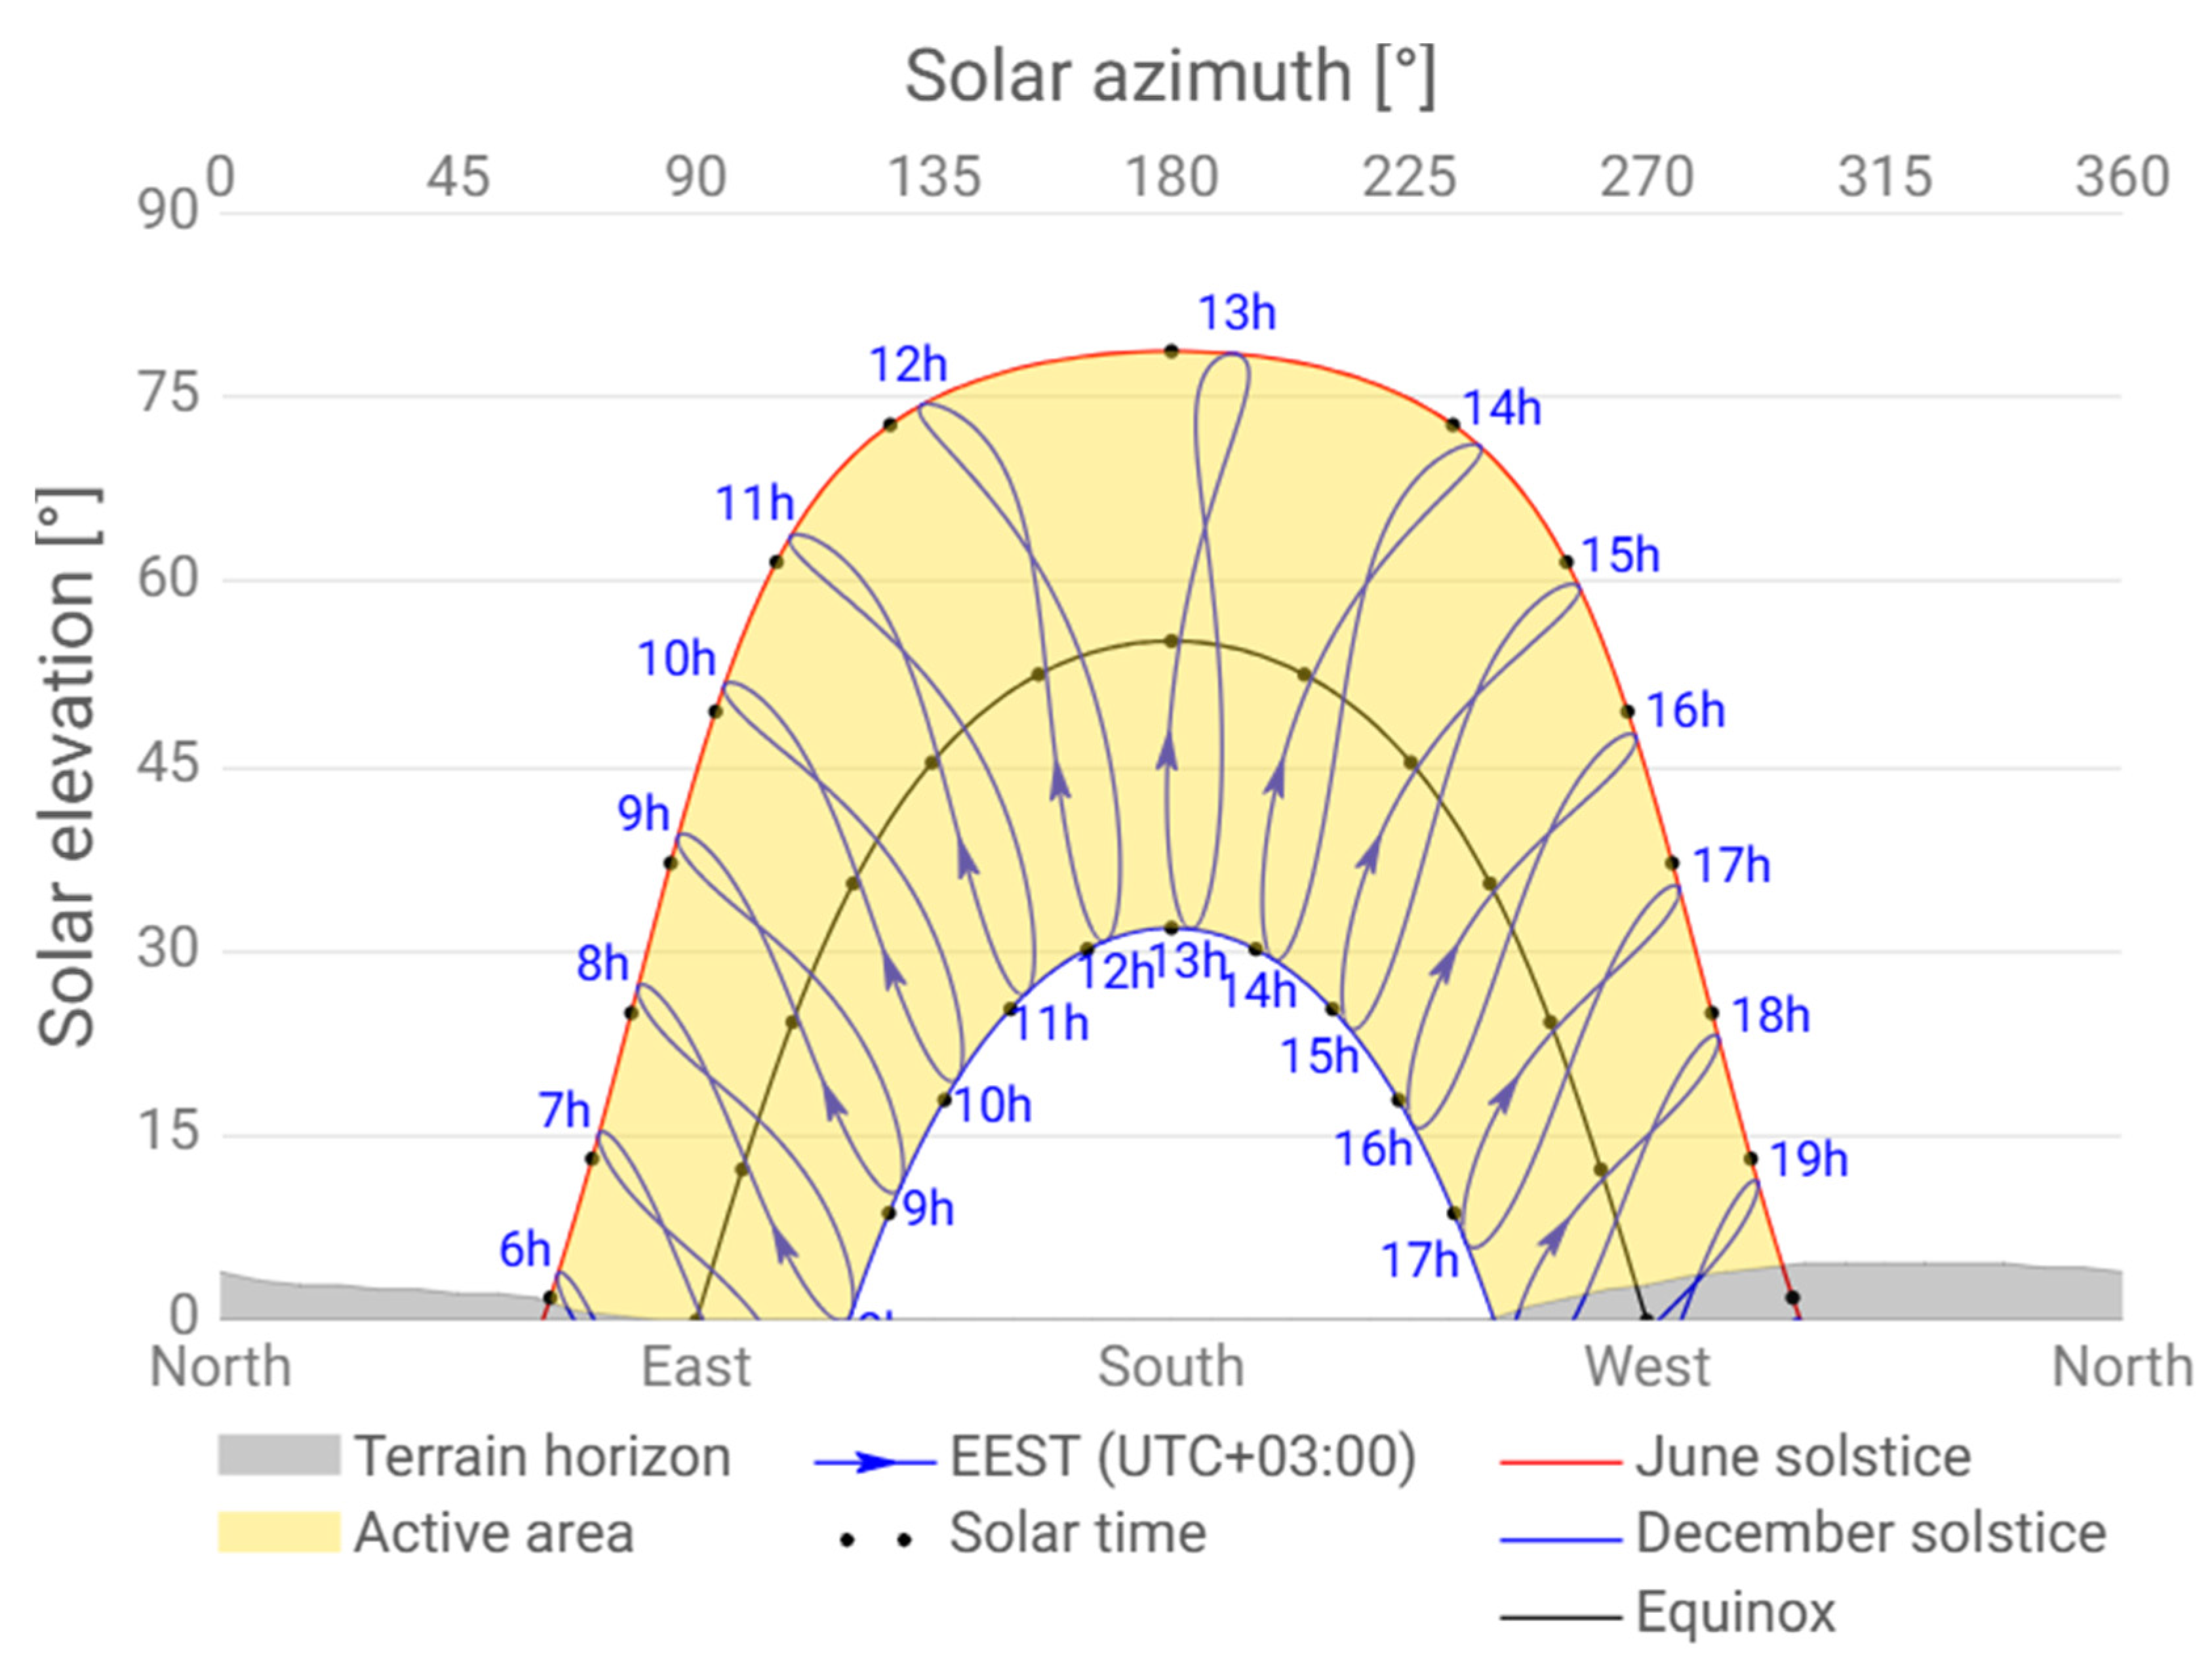
In Cyprus, the seasonal variation in solar azimuth and elevation angles governs the sun’s apparent path across the sky, resulting in higher solar elevation and longer daylight periods during summer months, and lower elevation with shorter days during winter, which directly influences the incident irradiance on PV surfaces throughout the year.
Figure 1 depicts the sun path throughout a year in Cyprus.
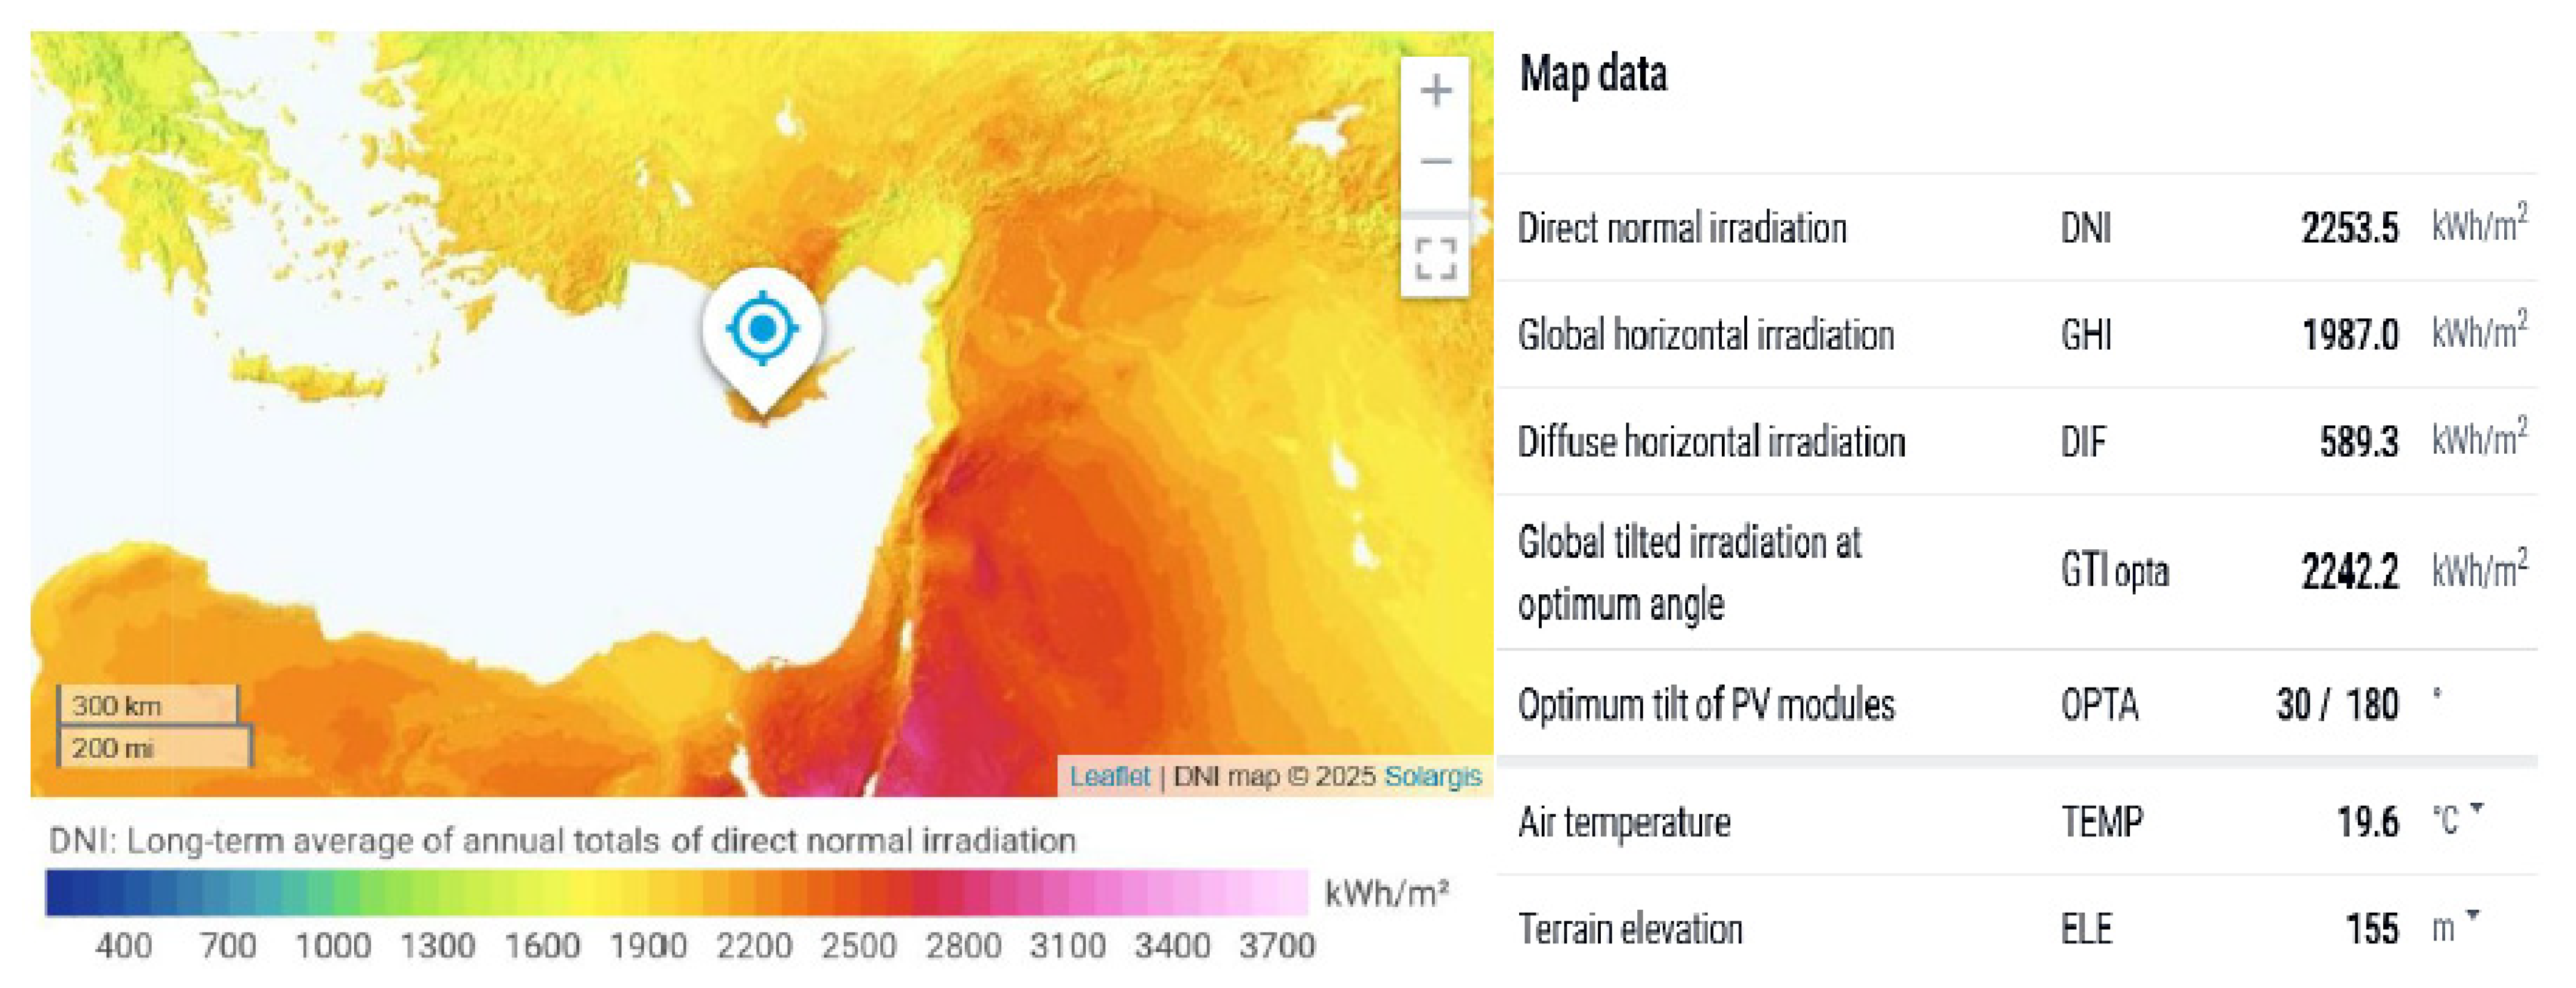
The orientation and movement of PV panels relative to the sun also play a vital role in determining daily and seasonal energy yield. Tilted modules experience variable angles of solar incidence throughout the day and year. Dual-axis tracking systems, which adjust the tilt in both horizontal (β) and vertical (α) planes, can significantly enhance solar capture by maintaining optimal alignment with the sun’s position. While β changes throughout the day, ranging from 0° to 180°, α adjusts seasonally from 0° to 90°, enhancing performance during winter and summer extremes [
30]. Based on extensive measurements on direct solar irradiation at a particular site in Cyprus (coastal area of Limassol), the average values for some critical parameters can be observed in
Figure 2.
The specific location was selected as a representative case study due to its semi-arid Mediterranean climate, frequent cross-continental dust events, and rapidly expanding solar PV capacity, which pose unique challenges for accurate power forecasting. These conditions are shared by numerous regions across Southern Europe, North Africa, and the Middle East, making the proposed methodology directly transferable to other dust-prone, high-solar-resource environments. As such, the model developed and validated in this study offers a replicable solution for similar power systems aiming to integrate high shares of renewables while minimizing grid uncertainty and reserve dependency.
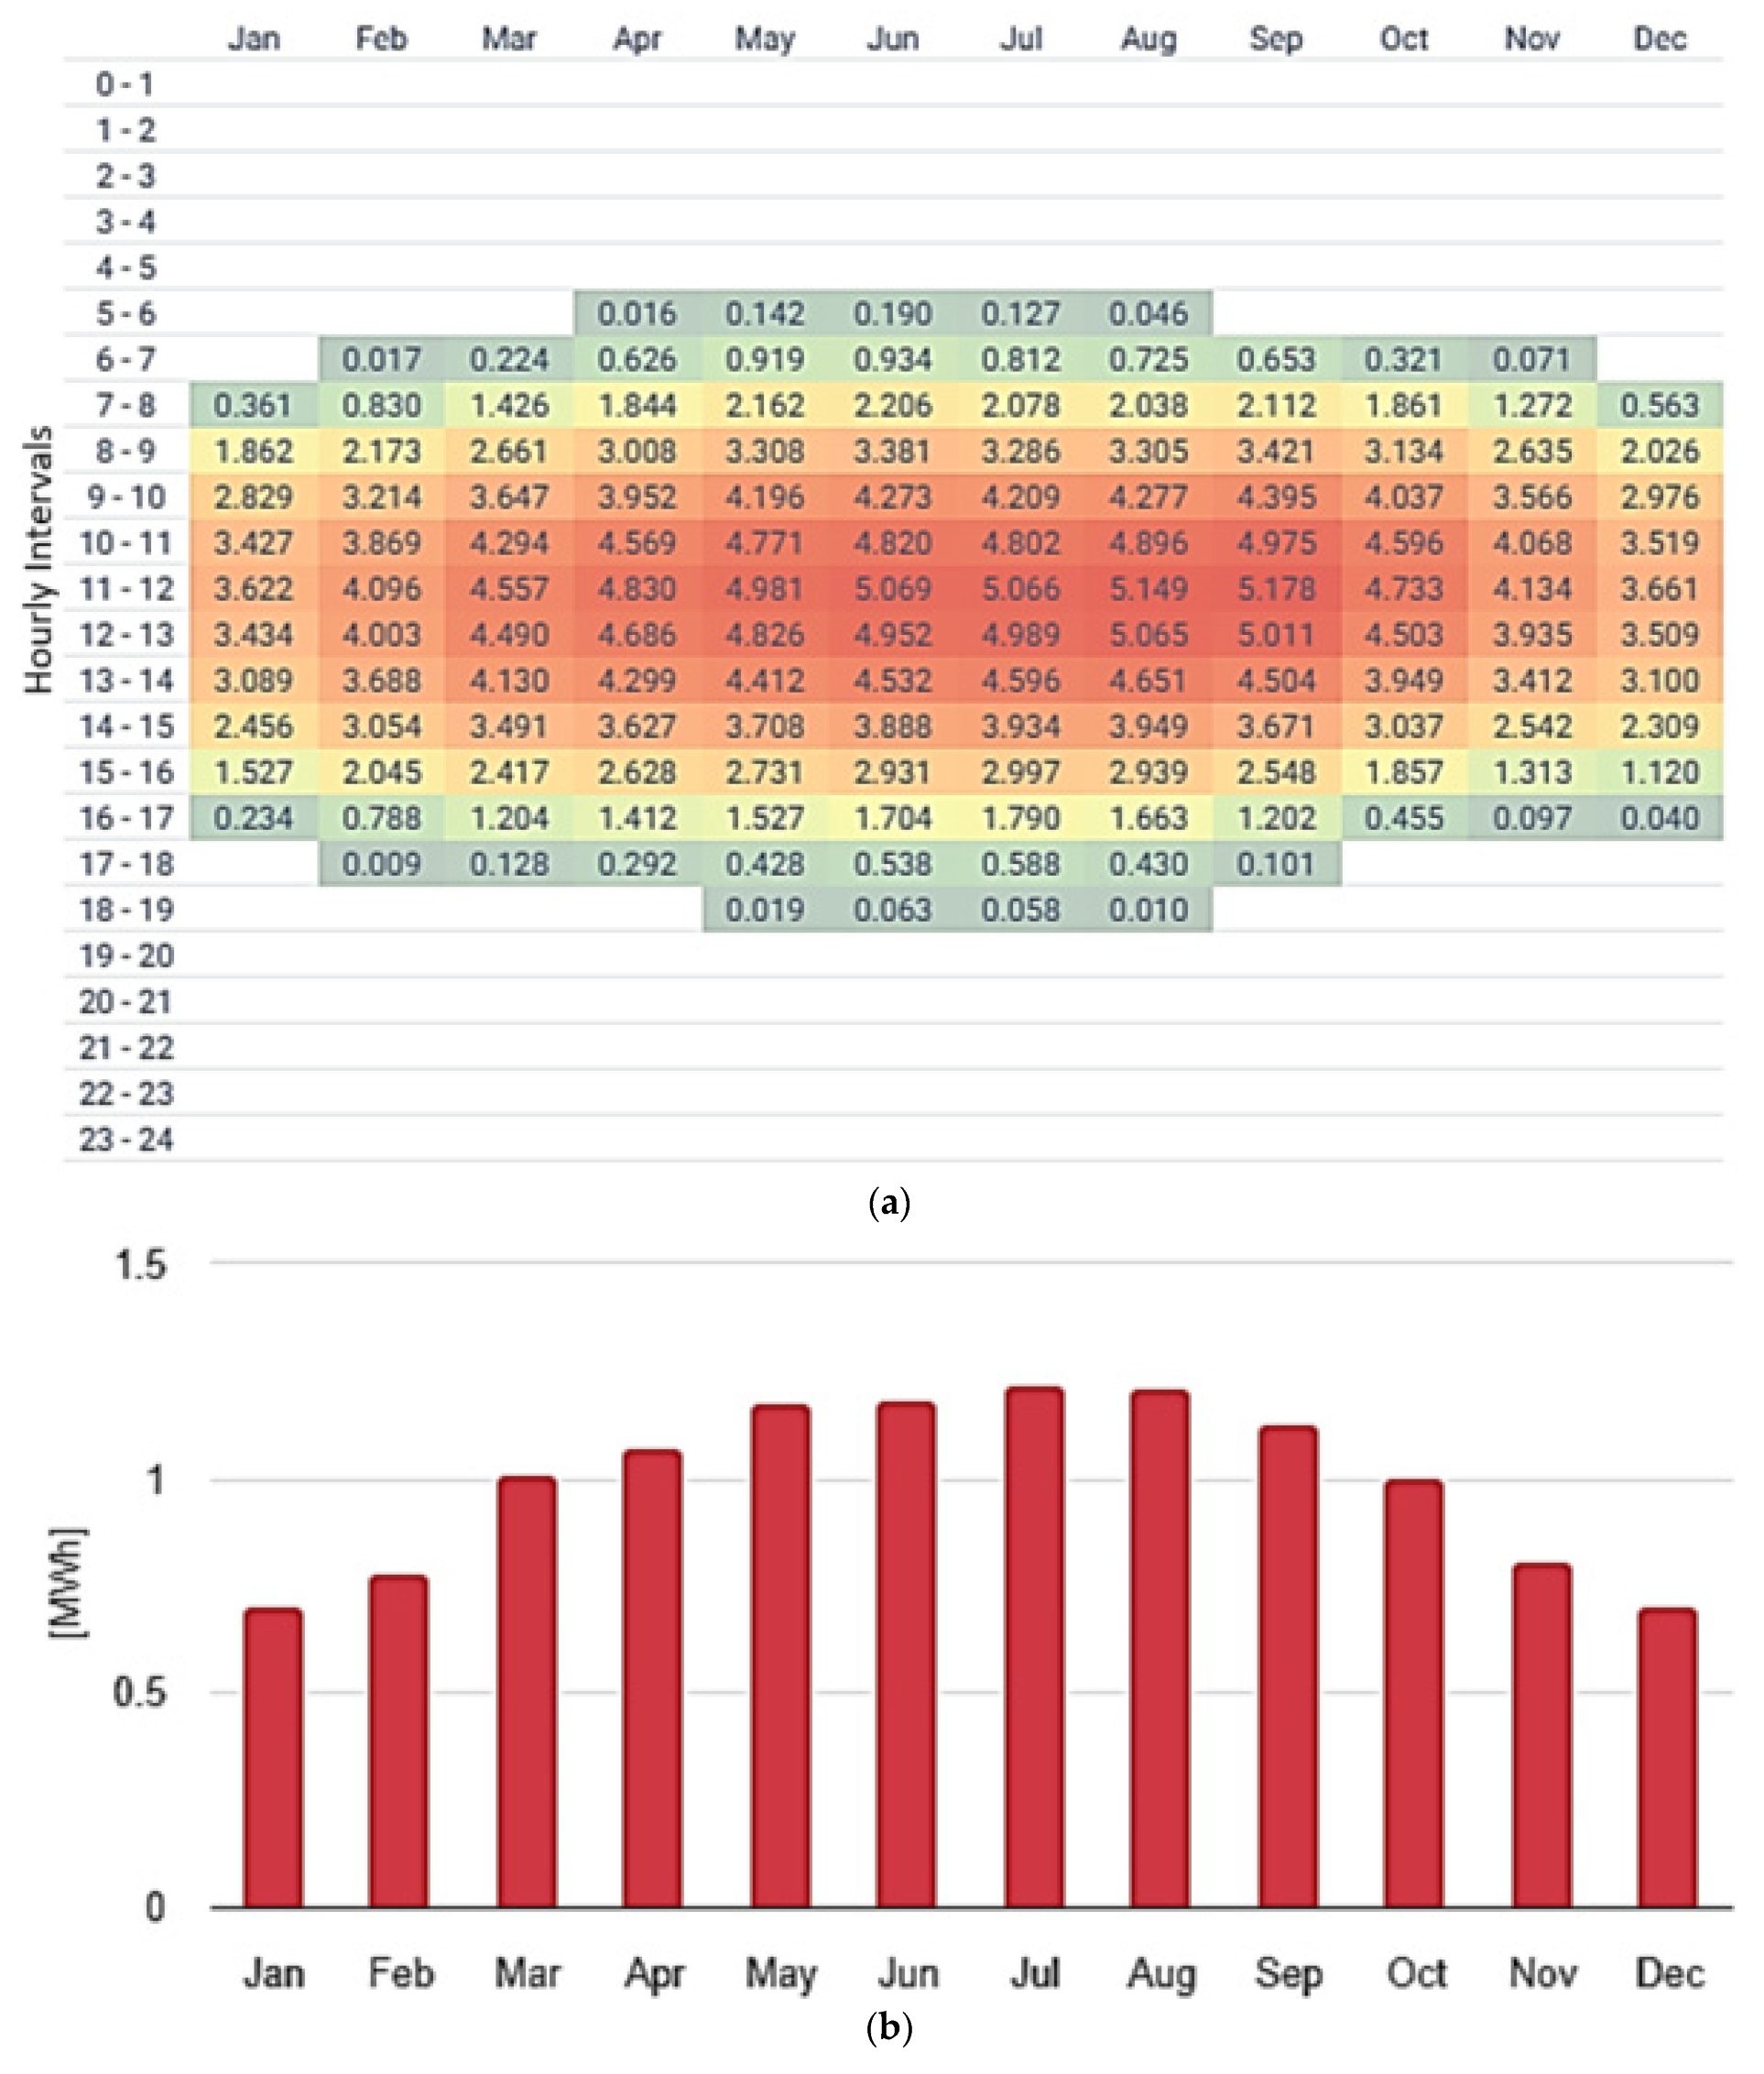
Solar irradiance itself is subject to substantial temporal variability, often influenced by atmospheric conditions such as cloud cover. To quantify the transparency of the atmosphere, a dimensionless clearness index is often employed. This index typically ranges from 0.25 (indicating overcast skies) to 0.75 (clear-sky conditions), reflecting the fraction of sunlight that reaches the Earth’s surface after atmospheric attenuation. In addition to clouds, airborne pollutants and dust particles further diminish irradiance by scattering and absorbing sunlight. Studies suggest that total PV energy losses due to both suspended particulate matter and deposited dust can reach up to 17–25%, highlighting the significance of air composition in PV performance assessment [
31]. Considering a residential rooftop PV system of 7 kW installed capacity at the specified location, the hourly averaged and total photovoltaic power output is given in
Figure 3 by month.
Temperature effects add another layer of complexity to forecasting, as high irradiance often coincides with increased temperatures, which in turn degrade module efficiency. These competing effects necessitate accurate temperature modeling to avoid overestimating generation during peak sunlight hours. Besides these primary drivers, other factors, such as inverter efficiency, shading, soiling surface, and panel degradation over time, also introduce variability. These physical and environmental uncertainties underscore the need for advanced modeling strategies that can incorporate real-time data and account for spatial and temporal variation in solar resource availability.
2.2. Meteorological Variables
Meteorological conditions play a critical role in photovoltaic energy conversion, as they govern both the availability of solar radiation and the operational efficiency of PV modules. In addition to solar irradiance itself, variables such as ambient temperature, wind speed and direction, relative humidity, and cloud index significantly affect the PV power output. These variables influence either the thermal balance of the PV modules or the transmittance of solar energy through the atmosphere, and their impacts vary across both daily (diurnal) and seasonal time scales.
PV-module efficiency decreases with increasing cell temperature, which is influenced by ambient temperature and radiative conditions, as per the modified form of the standard PV power output equation, Equation (1). The thermal loss becomes more significant during midday and in summer, when irradiance and ambient temperatures are highest. These losses exhibit a diurnal pattern, peaking in early afternoon, and a seasonal pattern with higher degradation observed in warmer months. Research confirms that every 1 °C rise above 25 °C can lead to an efficiency drop of 0.3–0.5%, depending on the panel material (e.g., silicon vs. thin-film technologies) [
32].
Wind contributes to convective cooling of PV modules, thereby indirectly improving their efficiency by reducing cell temperature. The heat transfer from the panel to the surrounding air can be approximated by Newton’s law of cooling:
Here, the convective heat transfer coefficient,
h, increases with wind speed,
v, resulting in more efficient cooling and thus higher PV output. A common empirical equation used to estimate
h for air in natural environments is
[
33]. Wind direction further affects this cooling mechanism, especially for fixed-tilt systems, where airflow can vary significantly depending on panel orientation relative to wind vectors. Empirical studies have shown that moderate wind speeds (2–5 m/s) can improve PV output by 1–3% under high irradiance conditions [
34].
Relative humidity influences solar radiation transmittance through aerosol–water interactions, which lead to increased scattering and absorption. High RH is often associated with haze, fog, or high dew point temperatures—all of which reduce the optical clarity of the atmosphere. While RH does not directly affect module performance, it correlates with reduced global irradiance and increased likelihood of condensation or surface moisture, which can temporarily degrade PV efficiency. These effects are more pronounced in the early morning and late afternoon and seasonally, during transitional periods like spring and autumn [
35].
Clouds significantly alter the incident solar radiation on PV systems by both attenuating direct irradiance and enhancing diffuse irradiance under certain conditions. The clearness index is defined as follows:
where
G0 is the extraterrestrial solar irradiance; it serves as a proxy for cloud coverage and is widely used in PV performance modeling. Values close to 1 indicate clear-sky conditions, while lower values denote cloudier skies. The impact of clouds follows a strong diurnal cycle, with rapid fluctuations possible within minutes, and varies seasonally depending on cloud climatology (e.g., frequent winter cloud cover in Mediterranean coastal areas). Accurate estimation of the cloud index enables more responsive and adaptive PV forecasting models, especially when derived from satellite imagery or sky cameras [
36].
Figure 4 illustrates a meteorological representation of the critical variables discussed.
Meteorological variables introduce both short-term variability and long-term trends in PV generation. Their influences are nonlinear and interdependent, reinforcing the need for their inclusion in machine learning-based forecasting frameworks. Ambient temperature and wind modify system efficiency, while humidity and cloud cover primarily modulate irradiance availability. Understanding their temporal behavior, both within the day and across seasons, is crucial to building robust, generalizable forecasting models.
Effectively managing the uncertainties tied to both seasonal and diurnal variability is essential for achieving accurate photovoltaic power forecasting. Solar irradiance and related meteorological factors follow distinct daily cycles and undergo noticeable seasonal fluctuations, which demand resilient and adaptive modeling strategies. Additionally, uncertainties arise from the availability and reliability of input data, including both historical records and real-time observations. These may be affected by measurement errors, missing values, or limitations in sensor technologies. The potential influence of climate change on solar radiation patterns is an emerging challenge that could affect the long-term consistency of forecast models. Furthermore, integrating PV power into the grid requires careful assessment of uncertainties stemming from transmission constraints and system-level dynamics. Finally, inherent aspects of the forecasting methodology—such as model architecture, forecast horizon, and update intervals—play a significant role in determining the overall predictive reliability of PV power forecasts.
2.3. Dust Impact
Cyprus is a pioneer in the field of electricity production utilizing photovoltaic technology. It constantly provides incentives to consumers through a variety of support schemes and fully understands the importance of green transition. Although the electricity storage market is completely absent, the prosumers are incentivized via net metering, net billing, virtual net metering, and virtual net billing schemes to continuously increase the residential PV installations. Recently, bigger PV systems have been planned to be installed on terraces of the majority of schools in the island [
37,
38].
Figure 5 shows the distribution of these systems per size.
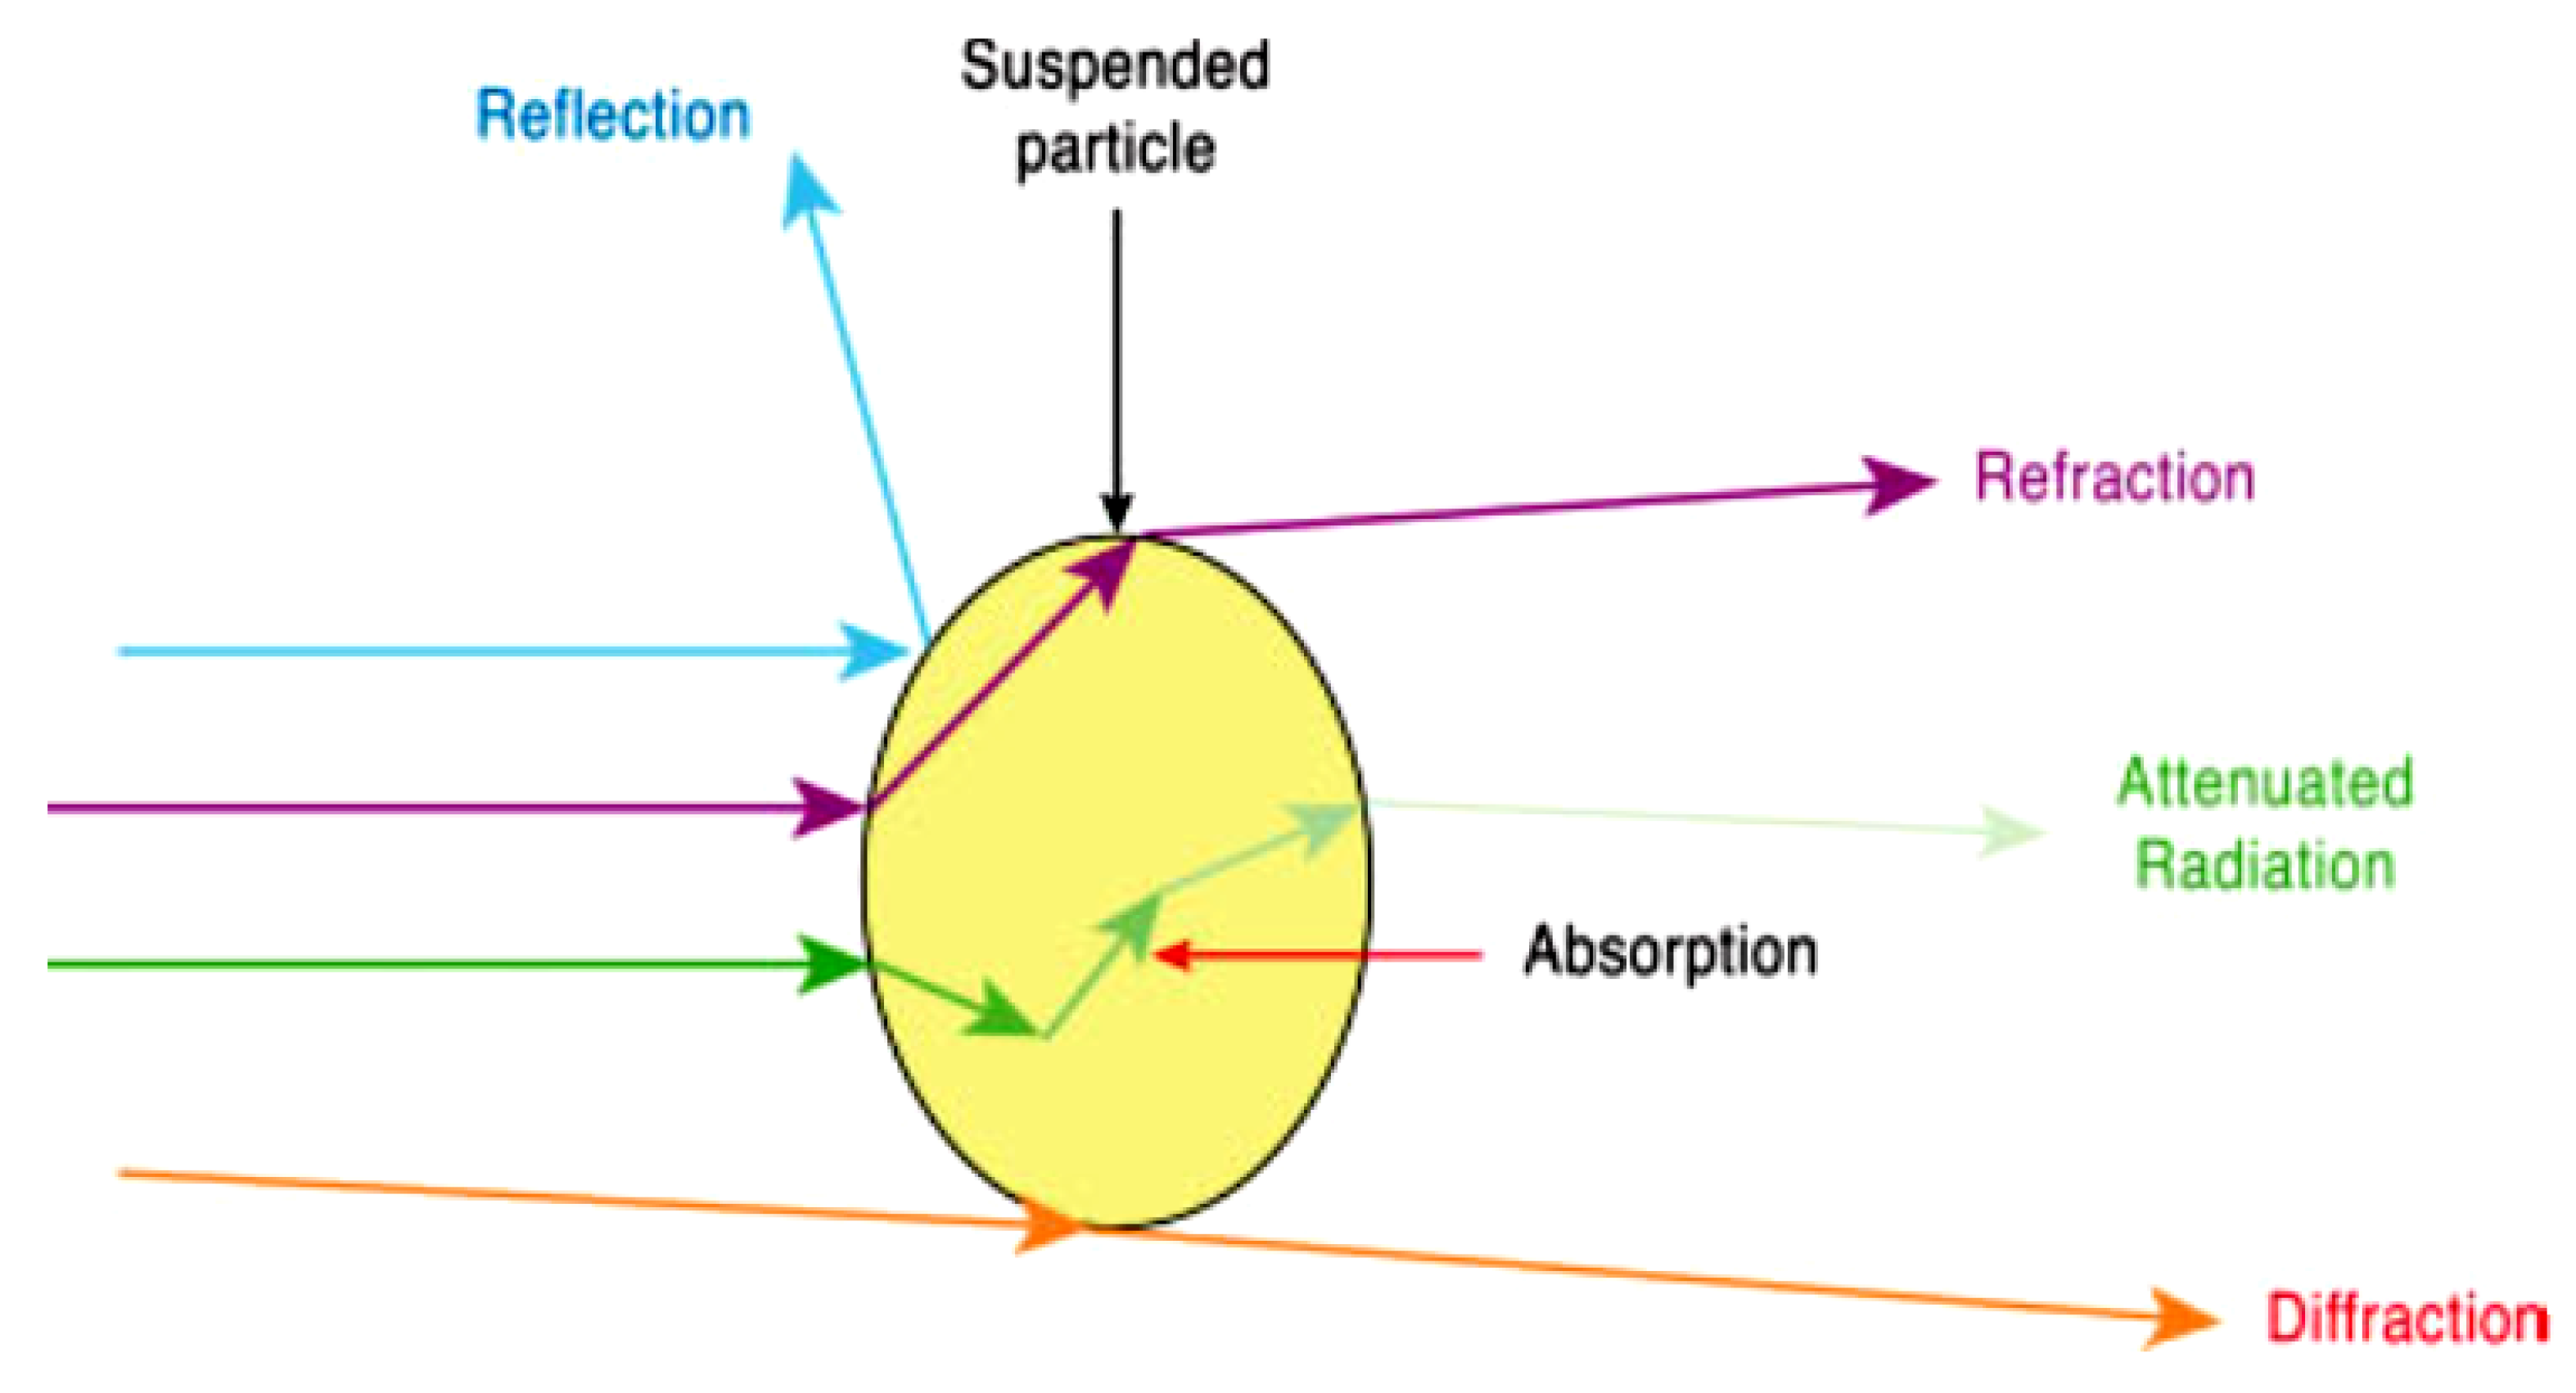
Accurate PV power forecasting is of great importance for the seamless integration of the ever-increasing PV systems into the islanded electrical grid in order to reduce the need for backup power sources. Dust in the atmosphere is a type of air pollution that consists of small particles of solid matter suspended in the air. These particles can come from a variety of sources and can vary in size, composition, and concentration. Although the incident radiation on a particle may exhibit reflection, refraction, diffraction, and absorption, the amount of its reduced energy is estimated as the sum of scattering and absorption [
39].
Figure 6 shows the interaction of radiation with suspended matter. Atmospheric particulate matter, encompassing both suspended aerosols and deposited dust on PV modules, significantly influences solar energy conversion efficiency. The attenuation of solar radiation by PM occurs primarily through scattering and absorption processes, which alter the spectral composition and intensity of the incident irradiance.
The attenuation of solar radiation due to PM can be quantitatively described using the Beer–Lambert law, which models the exponential decrease in irradiance as it traverses an absorbing and scattering medium:
where
I represents the transmitted irradiance;
I0 is the incident irradiance at the top of the atmosphere; and
τ denotes the optical depth, a dimensionless parameter that encapsulates the cumulative effects of absorption and scattering by atmospheric constituents, including PM. In general, the vertical optical depth,
τ(
λ), from some height, z, and above can be written as follows:
where the coefficient
β(
λ,
z) is equal to the attenuation resulting from scattering and absorption. The total optical depth of the atmosphere,
τ, is wavelength-dependent and can be expressed as the sum of individual contributions in the ultraviolet range:
In this context, SO
2 due to urban pollution, water vapor (H
2O), and ozone (O
3), together with the uniformly mixed gases (UMGs) which mainly refer to CO
2 and O
2, only absorb, whereas exclusive scattering is observed by molecular O
2 and N
2 (Rayleigh phenomenon or molecular scattering).
τaerosol specifically accounts for the attenuation due to aerosols that absorb and scatter, which is directly influenced by PM concentration levels. The aerosol optical depth (AOD) is a critical parameter in assessing the impact of PM on solar radiation and is often derived from ground-based measurements or satellite observations. The scattering and absorption of solar radiation by PM not only reduce the total irradiance reaching the PV modules but also modify their spectral distribution. This spectral shift can lead to suboptimal performance of PV systems, especially those sensitive to specific wavelength ranges. Studies have shown that PM concentrations, particularly PM
10, significantly affect the spectral power distribution (SPD) of solar radiation, with notable reductions observed in the range from 380 to 540 nm [
40].
Figure 7 depicts a representative paradigm of radiance attenuation with a comparative snapshot during a normal day and a sudden dust storm.
In addition to atmospheric effects, the deposition of dust particles on the surface of PV modules—commonly referred to as soiling—further exacerbates energy losses. Soiling leads to the formation of a dust layer that scatters and absorbs incoming light before it reaches the photovoltaic cells, thereby diminishing the effective irradiance and, consequently, the power output. The extent of soiling-induced losses depends on various factors, including dust composition; particle size distribution; deposition rate; and environmental conditions such as humidity and wind speed [
42].
In regions like Cyprus, characterized by arid climates and frequent dust events, understanding and modeling the impact of PM on PV systems are crucial for accurate energy forecasting and efficient system operation. Incorporating real-time PM data and predictive models into PV performance assessments can enhance the reliability of solar energy generation and support the integration of renewable energy sources into the power grid. Deserts are one of the main sources of sand and dust. Cyprus is significantly affected by dust events, primarily due to its geographical position at the crossroads of Europe, Asia, and Africa. The most critical sources of particulate matter, especially PM
10 and PM
2.5, impacting Cyprus include the Sahara Desert, Middle-Eastern deserts, and North African deserts. Dust from the Sahara, particularly from regions in Libya and Egypt, is a major contributor to PM levels in Cyprus [
43]. These dust particles are transported across the Mediterranean, often during spring and summer months, leading to elevated PM
10 concentrations. Arid regions in the Middle East, including parts of Syria, Jordan, Iraq, and Saudi Arabia, also contribute to dust events in the island. These events are often associated with specific meteorological conditions that facilitate the long-range transport of dust particles. Desert areas in Chad, Algeria, and Libya constitute additional sources of dust. Depending on wind direction and weather systems, dust from these regions can reach the island, particularly during the spring months [
44]. The main deserts are found in the “dust-belt” in the northern hemisphere, and a worldwide representation is offered in
Figure 8.
The finest dust particles can be transported over long distances from these sources by the winds. To model the combined effects of atmospheric PM and soiling on PV performance, comprehensive frameworks that integrate aerosol transmittance functions and soiling ratio metrics must be developed. These models will facilitate the prediction of PV output under varying environmental conditions and inform maintenance strategies, such as optimal cleaning schedules, to mitigate the adverse effects of dust accumulation.
3. Methodology
The accuracy and reliability of PV power-forecasting models depend heavily on the quality and relevance of the input variables. In this section, the selection of features was grounded in physical and environmental factors known to influence PV system behavior. These inputs fall into three main categories: (a) weather-related parameters; (b) temporal factors capturing solar geometry; and (c) PV system output characteristics, including operational history and capacity scaling.
A feature clustering strategy is proposed to enhance the interpretability and efficiency of the forecasting task by grouping meteorological and temporal inputs with similar statistical behavior. This clustering stage supports more robust predictor handling by identifying patterns, reducing redundancy, and improving model generalization. Then, the data harvesting and processing phase is described, where key predictors are selected based on a dual-criterion approach using Pearson correlation coefficients and mutual information metrics. Both methods are applied to historical datasets to quantify the relevance and predictive strength of each input variable with respect to the PV power output, both on an annual and seasonal basis. The combined methodology ensures that only the most informative and non-redundant features are retained for training the forecasting model, contributing to the accuracy and stability of the final predictive results.
3.1. Feature Clustering
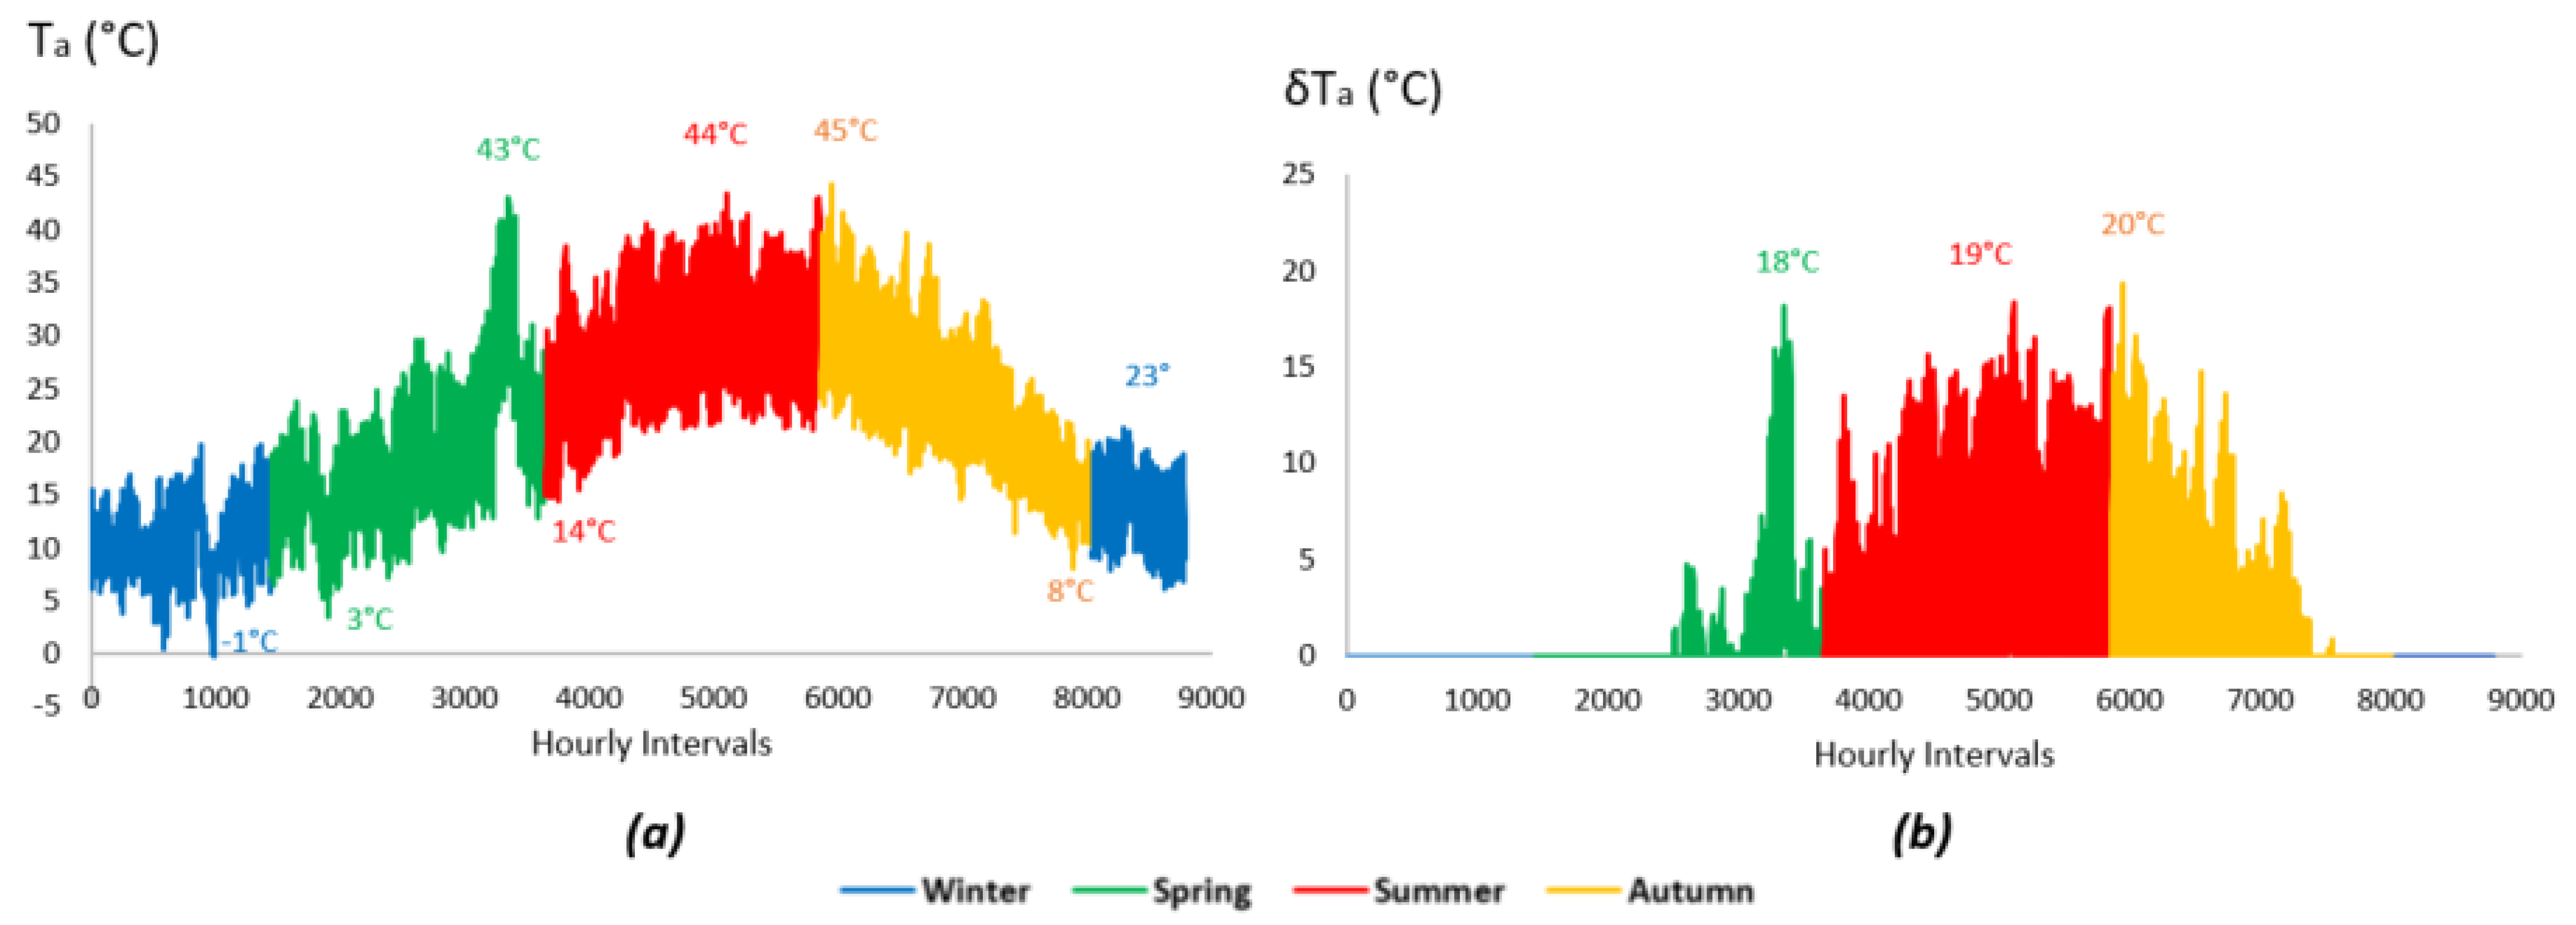
Meteorological and atmospheric variables are primary drivers of PV system performance. The PV-module temperature, closely related to ambient temperature and influenced by wind cooling, directly affects conversion efficiency—typically reducing output by 0.3–0.5% per degree Celsius above standard test conditions (25 °C). Based on this direction, ambient temperatures (
Ta) are imported as a positive deviation from 25 °C for each hourly interval,
t, so that we have the following:
Depending on the season, ambient temperature exhibits greater fluctuation during spring, summer, and autumn, and lower fluctuation in winter. These fluctuations can be observed with the aid of
Figure 9.
A completely different behavior occurs with humidity, which may vary from minimum to maximum during the course of a day. Relative humidity modifies atmospheric transmittance by influencing light scattering and absorption due to moisture-laden air. Higher humidity is often correlated with cloud presence or haze, thereby reducing direct irradiance.
Figure 10 shows the annual fluctuation of relative humidity in Cyprus per season.
Wind speed and direction influence the convective heat loss from the panel surface, with optimal airflow enhancing efficiency through cooling, particularly during periods of high solar irradiance. To investigate whether the wind direction,
WD(
t), can affect the overall PV performance, the cardinal direction,
CD(
t), was taken into consideration. To avoid intense computational complexity, the ranging directions between 0 °C and 360 °C were normalized using Equation (8), exploiting the compass points, north (0), east (90), south (180), and west (270), as reference.
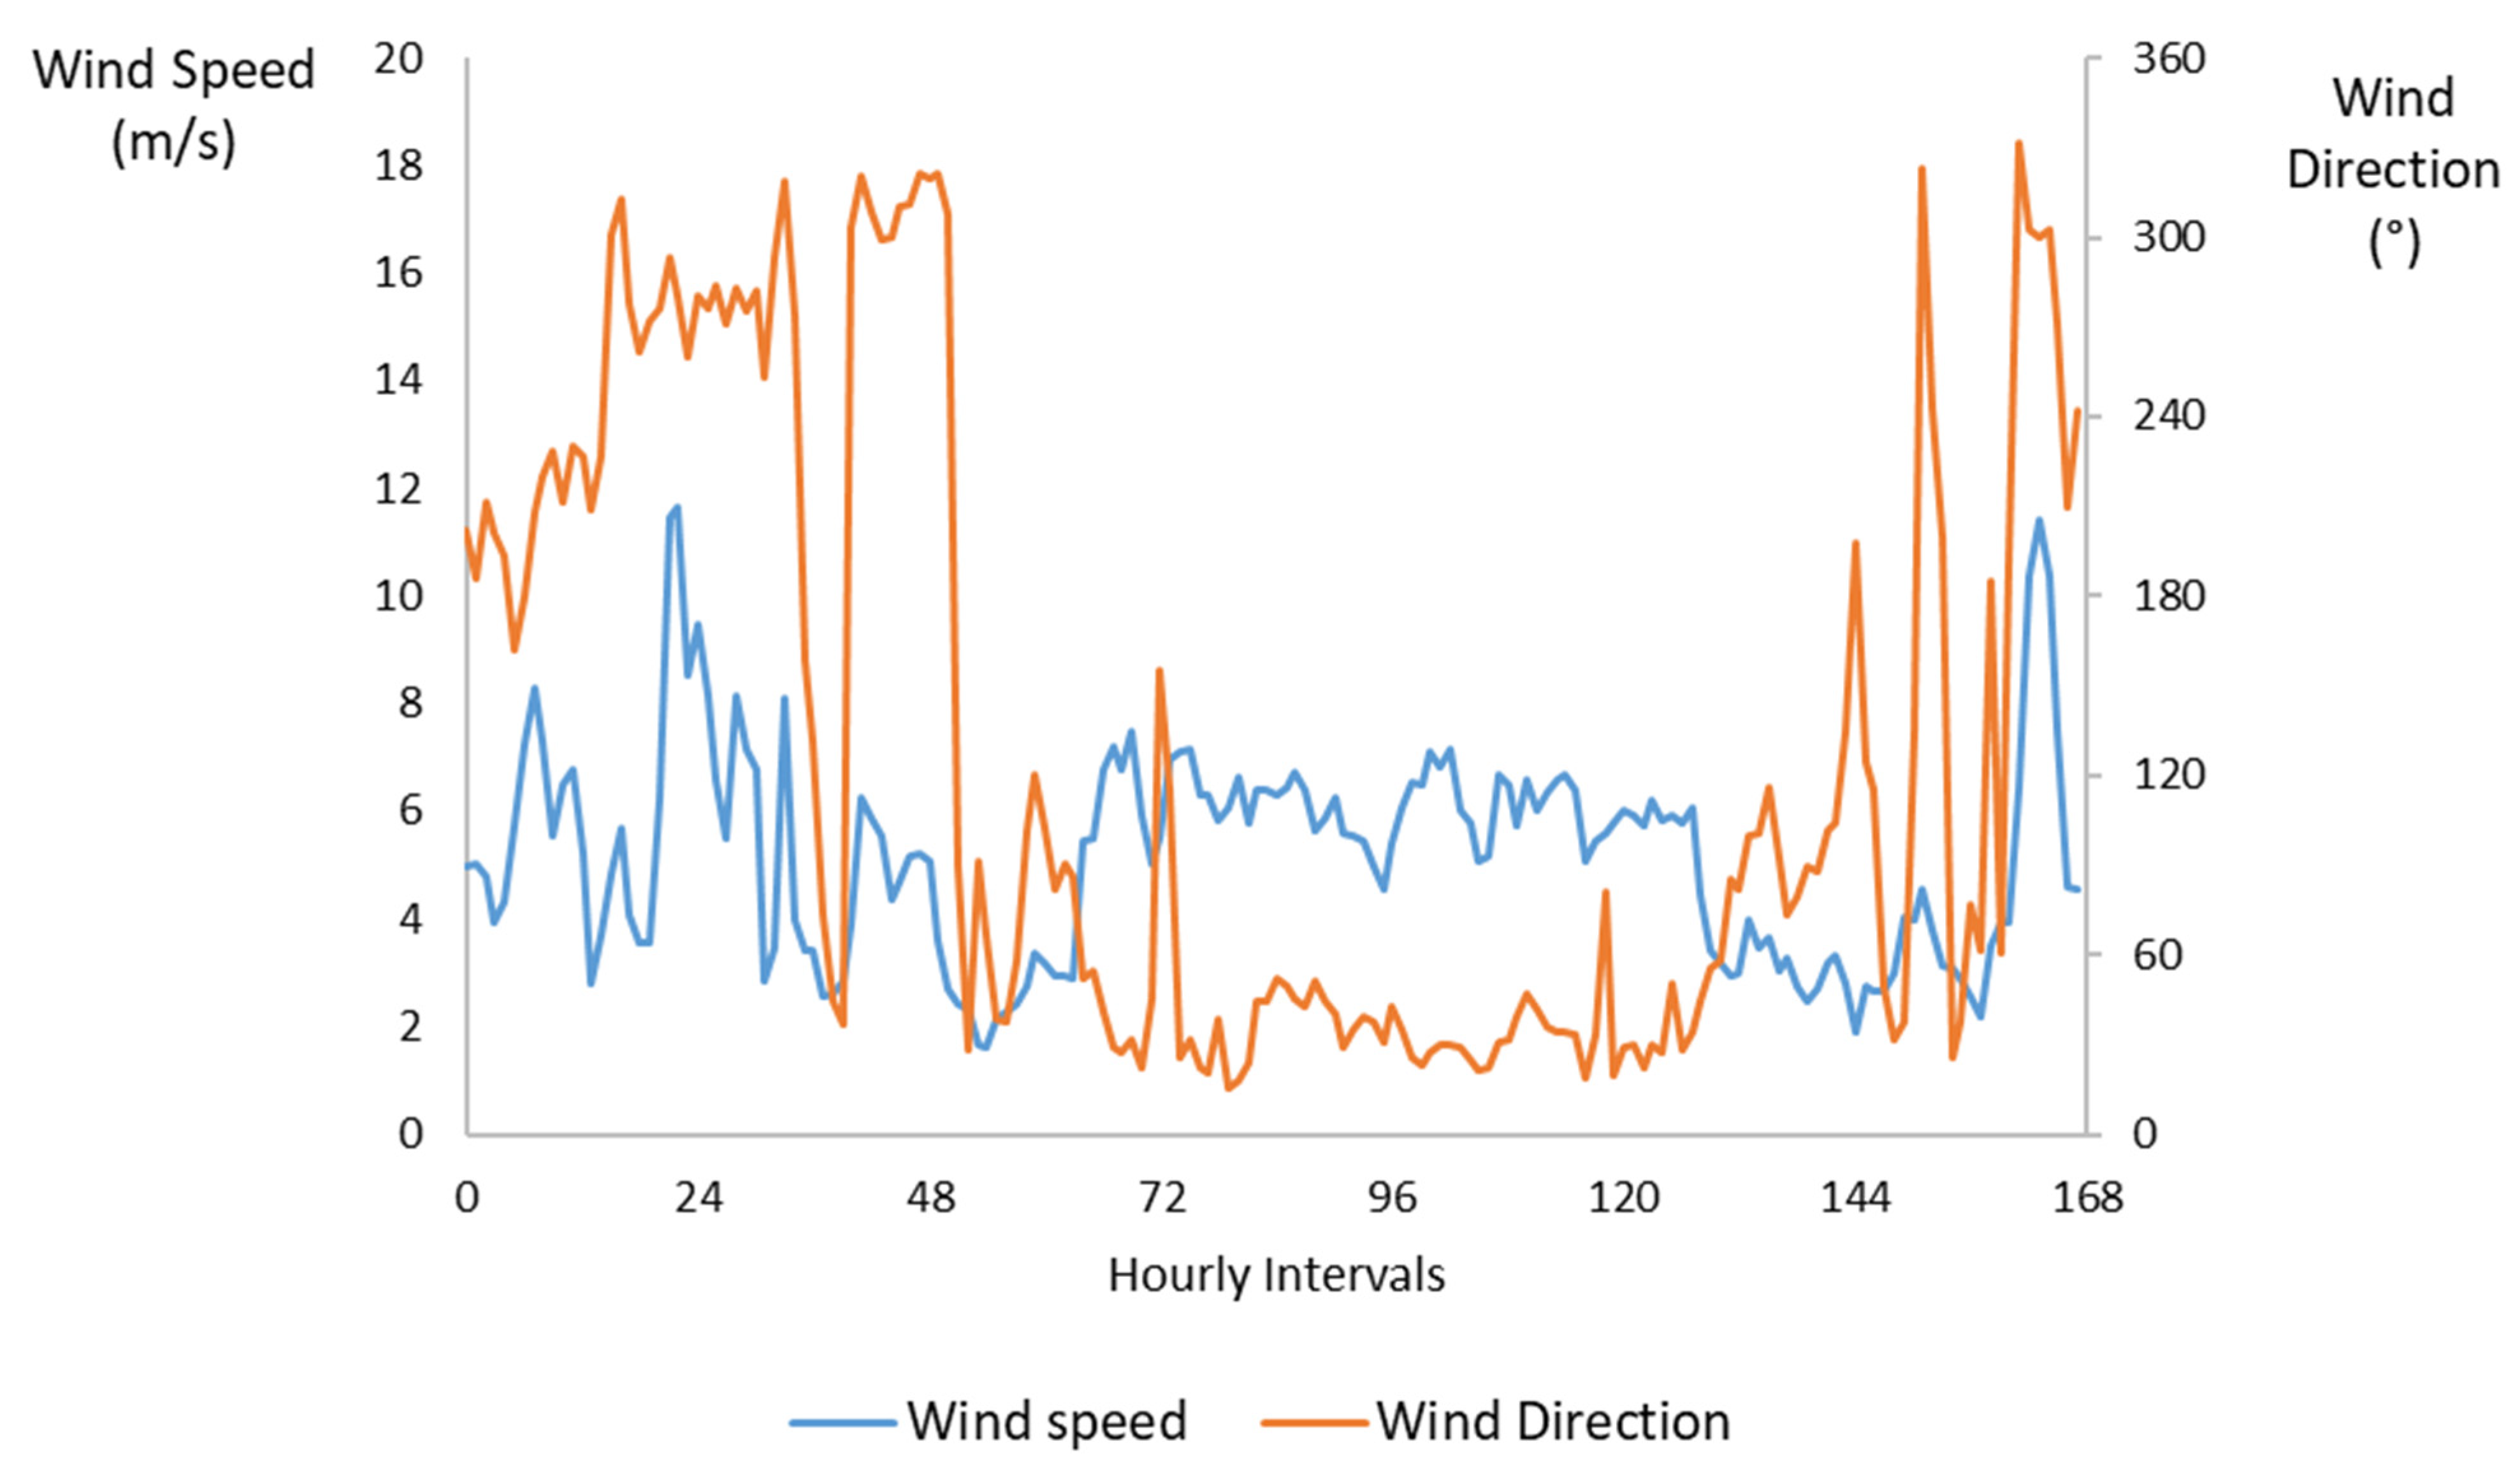
The stochastic behavior of wind speed across the wind direction is depicted in
Figure 11, whereas the normalized cardinal values are shown in
Figure 12. Both figures refer to the wind-speed and wind-direction variability during the selected week of 15–21 May 2024. This specific period was chosen because it exhibited unusually intense and rapidly shifting wind conditions, making it ideal for evaluating the sensitivity of PV performance to convective cooling effects and directional wind patterns. The observed fluctuations ranged from near-calm conditions to wind speeds exceeding seasonal norms, combined with significant directional variability across different hours and days. Such dynamic behavior is particularly relevant for PV forecasting, as wind not only influences panel temperature through cooling but can also interact with localized dust resuspension and deposition processes.
Cloudiness is a dominant factor in irradiance variability, introducing significant fluctuations in available solar energy within short time scales. The cloud index (
CI) is a metric used to quantify the effect of cloud cover on the availability of solar irradiance on the Earth’s surface. It is defined as the ratio of the actual solar irradiance to the clear-sky solar irradiance at a specific geographic location and time. This index provides insight into the degree of solar attenuation caused by atmospheric conditions, primarily clouds, and is essential for evaluating solar resource variability and forecasting photovoltaic (PV) system performance. To estimate the cloud index based on PV system output, one must measure both the electrical power generated by the PV modules and the incident solar irradiance using a calibrated solar radiation sensor, typically expressed in watts per square meter (W/m
2). The cloud index can then be computed using the following equation:
Here, PV-module efficiency refers to the manufacturer’s rated efficiency under standard test conditions, as provided in the module’s datasheet. It is important to note that this calculation assumes optimal operating conditions, specifically that the modules are functioning at their maximum power point (MPP) and that environmental factors such as temperature remain constant. Deviations from these assumptions, such as thermal fluctuations or partial shading, can introduce inaccuracies in the calculated cloud index. In this regard, the hourly
CI(
t) is calculated as a percentage deviation of the actual generated PV power from its monthly average equivalent:
Subsequently, a normalization process is applied to the resulting values to define clear, partly cloudy, and mostly cloudy weather as follows.
The monthly average over the actual generated PV power during a representative week is presented in
Figure 13a, while the respective cloud index is illustrated in
Figure 13b.
Dust extent, often quantified through particulate matter concentrations (e.g., PM
2.5 and PM
10), attenuates incoming solar radiation through both atmospheric scattering and surface deposition, leading to short-term losses and long-term soiling effects. As the number of fine particles increases, more light is absorbed and scattered, resulting in less clarity, color, and visual range. Light absorption by gases and particles is sometimes the cause of discolorations in the atmosphere but usually does not contribute very significantly to visibility degradation at the ground level. Haze is traditionally an atmospheric phenomenon in which dust, smoke, and other dry particulates suspended in air obscure visibility and the clarity of the sky. PM pollution is the major cause of reduced visibility (haze) in parts of the island. To model both the atmospheric scattering in terms of hourly PM concentration,
QPM(
t), and panel-surface deposition,
DPM(
t), the actual and previous PM concentrations are taken into account. This way, the deposition is estimated by means of the previous day and the previous two days’ measures, resulting in the following expression:
Exploiting Equation (12), the actual PM concentrations, along with their deposited impact on PV panels for a representative week, are shown in
Figure 14.
The dust extent is normalized based on a typical air quality index (AQI) categorization which assigns the value 1 to clean, 0.75 to light, and 0.5 to dense dust in the atmosphere, according to Equation (13) [
45].
Temporal factors are essential for capturing the cyclical nature of solar-energy availability. Hourly and daily time resolutions were selected to model diurnal and seasonal solar variations. The position of the sun changes throughout the day (solar elevation and azimuth) and year (declination angle), affecting the angle of incidence on the PV surface and, thus, the effective irradiance. Hourly resolution allows the model to capture intraday dynamics, while daily aggregates help reflect broader trends influenced by seasonality and cloud climatology.
PV power output is not only a function of external conditions but also of the system’s historical performance and installed capacity. The generation at the previous hour reflects system inertia and operational lag in irradiance response, while previous-day values provide insights into daily meteorological patterns and persistent atmospheric conditions. Additionally, the effects of permanent factors such as fixed panel-tilt angles, efficiency degradation, and nearby shading obstacles—which influence irradiance incidence and remain constant over time—are implicitly captured through these historical generation features. By learning from past generation behavior under similar environmental conditions, the model can internalize location-specific and system-specific characteristics that are otherwise difficult to quantify explicitly. Furthermore, as PV capacity on the island of Cyprus has been expanded over the study period, the installed generation capacity acts as a scaling factor that must be accounted for to normalize or calibrate forecast outputs over time.
3.2. Temporal Data Harvesting and Processing
All hourly data relating to the prevailing weather conditions during 2023, including ambient temperature, relative humidity, wind speed, wind direction, and cloudiness, were collected from the official website of BBC weather [
46] and verified by the Cyprus Meteorology Department. Regarding the air-quality historical data, the World Air Quality Index website [
47] was utilized, and the values were checked and modified appropriately with the aid of Cyprus Air Quality Monitoring Network. To gain a broader overview, the concentration of various pollutants is given in
Figure 15 as hourly and daily alternations.
It is worth noting that the indicated sources are internet-based platforms that provide publicly accessible, day-ahead-forecasted meteorological values. This feature is particularly important, as it enables their direct integration as input data into the proposed AI-enhanced prognosis tool, supporting its applicability for operational planning and real-time decision-making. Finally, all necessary information pertaining to the PV power (both actual and estimated mean) was retrieved by Global Solar Atlas [
29] and cross-checked with those regularly reported by the Energy Regulatory Authority, Distribution System Operator, and Electricity Authority of Cyprus.
Before introducing the model developed by leveraging modern machine learning technologies, all aforementioned variables must be evaluated to define their importance and overall impact on PV-power forecasting. Due to the non-parametric input–output relationship, sensitivity and uncertainty analyses constitute less preferable methods. On the other hand, feature-selection techniques, including principal component analysis, stepwise regression, and random forest, offer untraceable solutions toward optimization, increasing the computational efforts and complicating overall tasks. This way, correlation analysis based on mathematical process becomes advantageous and provides a more rigorous mechanism for rapid inference.
To ensure the model is trained with the most informative predictors, a systematic feature evaluation process was applied. This process combines two complementary statistical techniques, namely Pearson correlation coefficient and mutual information (MI), to assess both linear and nonlinear dependencies between input variables and the target PV power output. This dual approach improves the robustness of feature selection by accounting for direct correlations, as well as more complex, non-monotonic relationships [
48].
The Pearson correlation coefficient (
ρ) is used to measure the strength and direction of the linear relationship between each predictor,
xi, and the target variable,
Y (i.e., PV power output). Using Equations (14) and (15),
ρ is defined as the covariance between two variables divided by the product of their standard deviations.
where
xi,j is the
j-th sample of predictor
xi;
Yj is the corresponding PV output value;
and
are the sample means of the predictor and output, respectively; and
n is the total number of data points. The Pearson coefficient
ρ ∈ [−1, +1], where values close to ±1 indicate strong positive or negative correlation, respectively. In this study, features with an absolute correlation above 0.10 (i.e., ∣
ρ∣ ≥ 0.10) were considered sufficiently relevant for model training.
To complement this linear measure, mutual information was used to quantify the mutual dependence between input variables and the PV output. MI is capable of capturing nonlinear relationships by measuring the reduction in uncertainty of one variable given knowledge of another. Assuming the input–output pair (
X,
Y) is treated as a joint random variable with discrete states,
Sn and
Sm, the mutual information,
I(
X;
Y), is defined as follows:
where
is the joint probability distribution of
X and
Y, whereas
and
are the marginal distributions. Mutual information is non-negative (i.e., I ∈ [0, +∞)), and higher values reflect stronger statistical dependency. For the purposes of this analysis, an MI threshold of 0.25 or greater was used to retain features with significant influence on PV output.
By applying both methods across the selected feature set, including ambient temperature, wind speed, wind direction, relative humidity, cloud index and PM concentration, previous hour/day PV output, and time indicators, the most relevant variables were identified for inclusion in the forecasting model. This hybrid filtering approach ensures that only the features contributing meaningful predictive value are used in the training process, improving model performance and interpretability. To further enhance the robustness of the feature-selection process, the correlation and mutual information analyses were conducted not only on an annual basis but also separately for each season. The categorized results are tabulated in
Table 2.
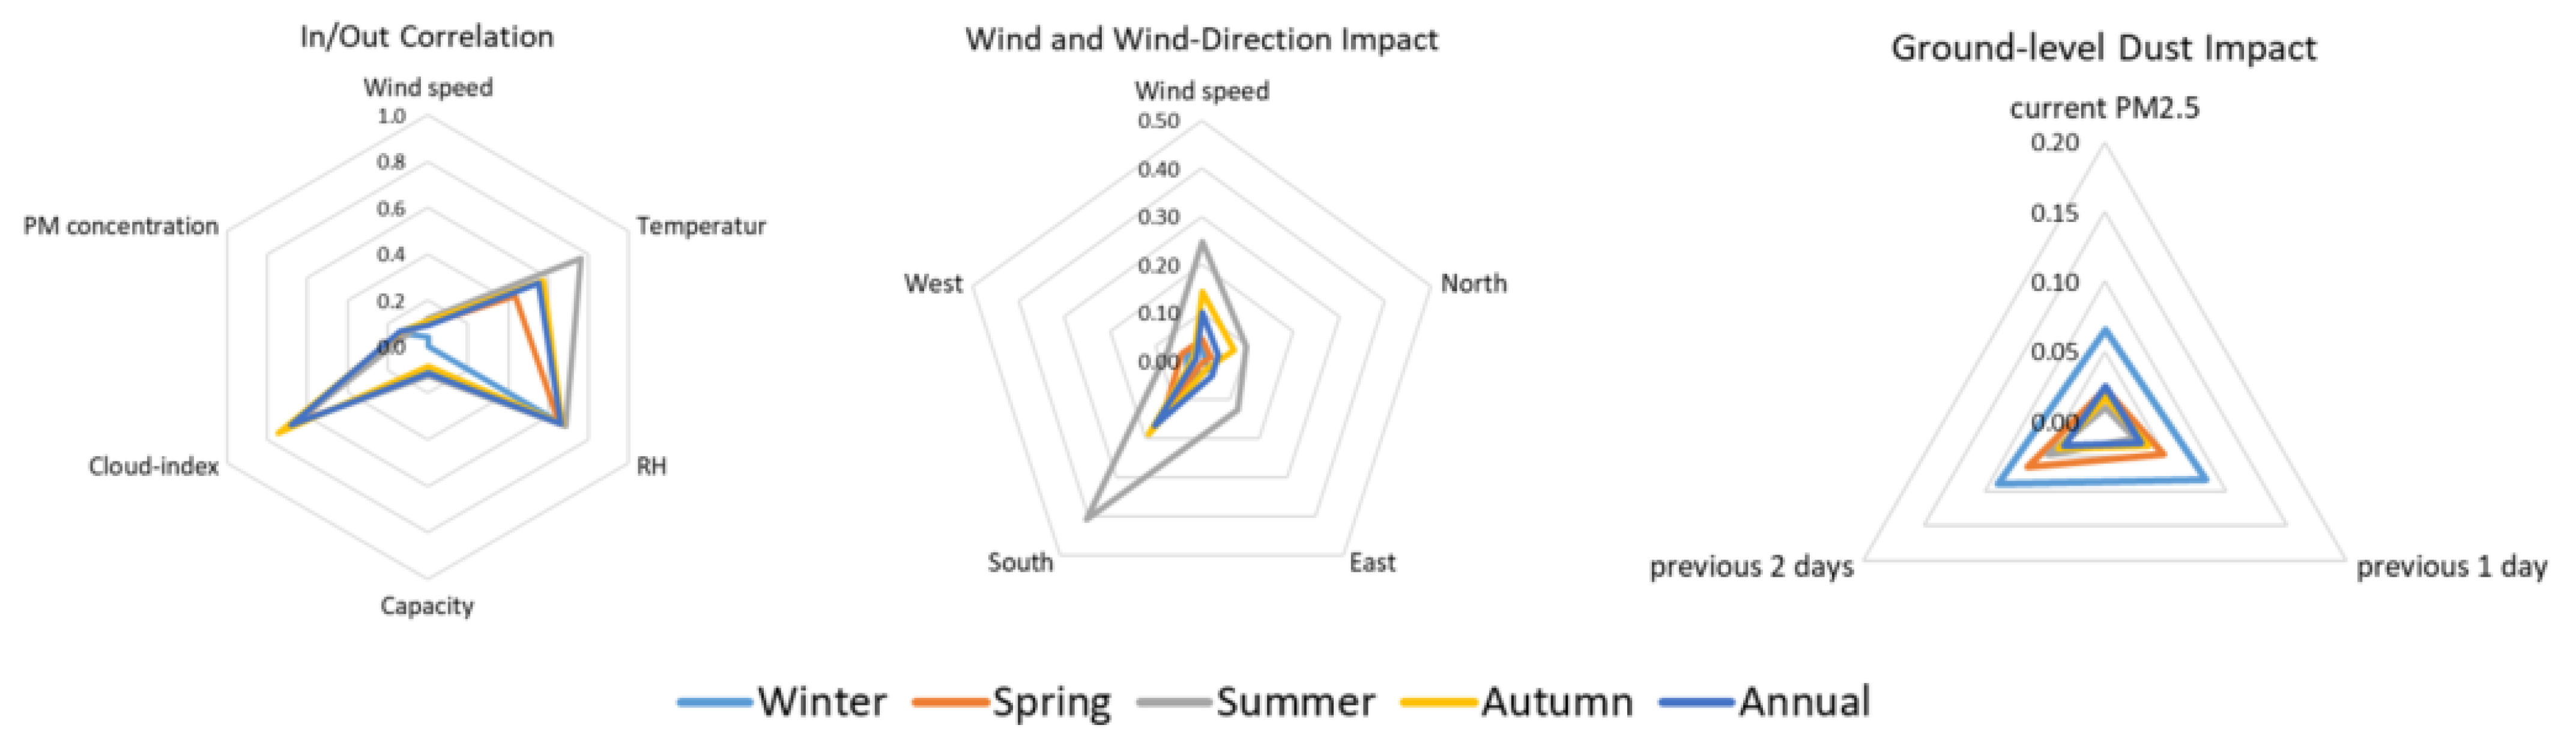
The results confirmed distinct, seasonally varying relationships. Cloud cover exhibited the strongest negative correlation with PV output (–0.68 annually), reflecting its dominant role in attenuating solar irradiance, particularly during autumn months (–0.75). Ambient temperature showed a moderate inverse correlation (–0.25), more pronounced in summer (–0.40), consistent with the known thermal losses in PV efficiency at higher temperatures. Wind speed, which contributes to convective cooling of the PV modules, displayed a weak-to-moderate positive correlation (+0.12), supporting its role in partially offsetting heat-induced efficiency drops during high-irradiance periods. Relative humidity showed a noticeable negative correlation (–0.66), indicating its indirect effect on PV performance, possibly via increased scattering and moisture-related soiling. These findings support the inclusion of all four variables in the model, not only due to their physical relevance but also their quantitative linkage to PV output variability, which is essential for robust day-ahead forecasting.
Observing the resulting coefficients, one can seen that only wind adds a positive effect on PV production. Apart from the expected impact of cloudiness, relative humidity acts negatively, though its effect is indirect and often secondary compared to factors like solar irradiance and temperature. High relative humidity is associated with increased water vapor and cloud cover, which scatter and absorb sunlight. Water vapor in humid air increases the scattering and absorption of solar radiation before it reaches the PV panels. The negative influence of temperature becomes superior in summer, when the greatest values are presented and maintained for the longest period overall. Consequently, wind speed appears to be very helpful in energy production during summer, mitigating the temperature ranges on PV panels.
Figure 16 offers a demonstration of the obtained coefficients by category and season.
Regarding the directions of wind, north provides almost no effect mainly due to the orientation of PV panels in order to receive maximum irradiance. South is the most advantageous wind, and west has little to insult, as it coincides with mitigated wind speeds during late afternoon. Finally, although dense PM concentrations definitely strangle PV performance, the dust deposition presents a higher negative impact since it acts additively and increases by consecutive light and/or dense concentrations in the atmosphere.
4. Regression-Based Architecture and Performance Evaluation
This section presents the proposed data-driven model for day-ahead forecasting of photovoltaic power generation using regression tree algorithms. Unlike deep neural networks, which often require extensive training and large datasets, regression trees offer an interpretable, computationally efficient alternative that is well-suited to medium-sized, uncertain, and weather-dependent data environments like those characterizing the power system of Cyprus [
49]. The model leverages both historical PV generation and meteorological features, with its performance tested over multi-year datasets under real environmental conditions.
Analytical models for renewable forecasting are often computationally intensive and require explicit physical modeling of all system components. In contrast, machine learning techniques like regression trees enable the discovery of patterns and relationships within observed data without requiring predefined structural assumptions. A regression tree recursively partitions the input space using conditional rules of the form, xi ≤ c or xi > c, producing a set of terminal nodes (leaves), each corresponding to a specific subset of the data and a constant predicted output.
Formally, let
represent a d-dimensional input vector of predictors (e.g., temperature, humidity, wind speed, and cloud index) and
denote the target PV output. The regression tree grows from a learning set,
, by selecting splits that minimize the within-node variance of
y. The recursive process creates
M terminal region, with the prediction function defined as follows:
where
Rm is the m-th region (leaf),
cm is the average PV output in region
Rm, and
I is the indicator function. In a more generalized form, the regression tree function can also be expressed using product splines:
where
Lm is the number of splits (depth) leading to region,
m and
cl,m represents the threshold values at each internal node.
Hyperparameters such as the maximum tree depth, minimum leaf size, and splitting criteria (e.g., least-squares minimization) are tuned during training to prevent overfitting and improve generalization. More advanced techniques such as boosted regression trees or ensemble methods (e.g., gradient boosting) may be adopted to enhance predictive accuracy further. The input dataset includes meteorological predictors (ambient temperature, wind speed/direction, humidity, cloud index, and PM concentration), time indices (hour, day, month, season, etc.), and past PV generation (previous hour and day). Constants such as tilt angle and permanent shading conditions are inherently reflected in historical generation patterns and therefore do not need to be explicitly modeled.
The model is structured as a multi-input, single-output regressor:
xi → yi, where each
xi is a feature vector of dimension,
d, and
yi is the PV output for the forecasted hour. Data were collected at an hourly resolution, ensuring the model could capture diurnal and seasonal cycles. To reduce residual errors due to unpredictable noise, particularly during days with steep irradiance fluctuations caused by dust or cloud anomalies, a post-processing step was applied. Forecasted daily PV outputs were grouped using k-means clustering based on their diurnal profiles (i.e., 24-dimensional vectors per day), aiming to minimize intra-cluster variance as follows:
where
k ≤ n is the number of clusters;
is the set of points in cluster
i; and
and
are a data point and the centroid (mean) of
, while
constitutes the squared Euclidean distance between them. A linear correlation was then applied within each cluster to refine predictions as follows:
In Equation (21), the coefficients
a and
b are optimized via least-squares fitting between predicted and observed values within the cluster. This step accounts for systematic biases that are temporally or meteorologically induced. The evaluation of the proposed model is realized using real-world data from the island of Cyprus (2023–2024), a region particularly impacted by transboundary dust transport and seasonal atmospheric variability. In addition, monthly PV capacity increments were integrated to normalize generation levels. The model performance is assessed by making use of both seasonal and annual metrics, including mean absolute error (MAE), root mean square error (RMSE), and mean absolute range normalized error (MARNE).
The actual PV production (
Pa) over the predicted (
Pp) is depicted in
Figure 17. As can be seen, the proposed model based on regression trees consistently captured intra-day variations and responded well to PM and cloud-related fluctuations, making it especially suitable for environments with rapid weather changes and limited data infrastructure. For comparison purposes, the performance metrics are listed in
Table 3. Importantly, only daylight hours were included in the analysis, thereby excluding nighttime intervals, where PV output is zero by definition. This adjustment guarantees that performance metrics reflect the model’s true forecasting capability during solar-generation windows and are not artificially improved by periods of zero-output predictability.
The model achieved annual mean absolute errors of 1.44 and 1.61 in 2023 and 2024, respectively, indicating low forecast deviation even under varying environmental and operational conditions. The mean absolute relative normalized error values decreased significantly from 0.73 in 2023 to 0.34 in 2024, highlighting the model’s growing generalization capability as more data were assimilated. Seasonal results confirmed the model’s adaptability to the highly dynamic Mediterranean climate, with peak performance during summer months (e.g., MARNE of 0.27 in summer 2024), when stable solar conditions prevail, and only modest degradation in accuracy during dust-prone spring or cloud-heavy winter periods.
A detailed comparison of root mean square error across seasons further supports the model’s robustness, with values remaining below 0.11 in all scenarios and as low as 0.03 annually in 2023. This indicates effective mitigation of both bias and variance in PV power predictions. The seasonal granularity of the evaluation also confirmed the effectiveness of the post-processing correction mechanism, which significantly stabilized performance during transitional periods, such as spring and autumn. Notably, the slight performance drop from 2023 to 2024 in winter MARNE (from 0.89 to 0.41) may be attributed to the higher variability in dust and humidity levels observed in early 2024. Nevertheless, the model retained an exceptionally low relative error, showcasing its capacity to maintain reliability across years and datasets.
The seasonal breakdown underscores the model’s robustness across a range of weather conditions. Notably, the model maintains high predictive accuracy during summer, when irradiance is stable and predictable and performs reasonably well in spring and autumn, where atmospheric dust and intermittent cloud cover introduce significant variability. The winter period shows slightly reduced accuracy, primarily due to increased cloud cover and lower irradiance levels, though the model still maintains acceptable performance. The model’s performance during high-PM days shows a moderate increase in MAE and MAPE during dust episodes. However, the inclusion of PM concentration as a predictor variable, coupled with the post-processing correction step via clustering and linear adjustment, successfully mitigated a substantial portion of the forecast error.
The model’s ability to maintain accuracy under high temporal and seasonal variability, particularly during dust-prone spring months and cloudy winter periods, highlights the superiority of regression tree algorithms in operational PV forecasting. These findings further support the adoption of regression trees in forecasting frameworks where interpretability and agility are key, such as isolated or weakly interconnected grids with rising renewable energy shares.
5. Conclusions
In this work, a robust forecasting framework for day-ahead PV power prediction was presented. The interpretable and data-efficient tool was tailored to the environmental and operational characteristics of an isolated Mediterranean power system. The model offers a powerful alternative to conventional black-box approaches, such as artificial neural networks and Gaussian process regression. Through a detailed analysis incorporating meteorological inputs, particulate matter concentrations, temporal indicators, and historical generation profiles, the proposed mechanism has demonstrated both high predictive accuracy and practical scalability.
A key strength of this approach lies in its interpretability and computational efficiency. Unlike deep learning methods, which require extensive tuning and are often opaque in their decision-making, regression trees provide a clear decision path for each prediction, enabling real-time traceability. This is especially critical in operational environments where transparency and accountability are prerequisites for grid management. Additionally, the regression tree model delivers competitive and, in many cases, superior performance with fewer computational resources, making it well-suited for deployment in regions with limited data infrastructure or real-time processing capabilities. The experimental evaluation across multiple years and seasons revealed the model’s resilience to environmental variability, including conditions affected by transboundary dust transport. The integration of air composition metrics, particularly PM2.5 and PM10 concentrations, significantly improved the model’s responsiveness to real-world disturbances that typically degrade PV output but are overlooked in conventional forecasting approaches. Furthermore, the application of a post-processing correction layer using clustering and linear adjustments enabled the model to correct systematic biases and enhance short-term precision, especially during episodes of high atmospheric variability. The scalability of this framework means it can be readily adapted to other regions with similar climatic or infrastructural conditions, serving as a blueprint for accelerating clean energy integration while maintaining grid reliability.
Future directions to research could focus on hybridizing regression trees with probabilistic techniques, such as quantile regression forests or tree-based ensemble learning with Bayesian updates. This would enable the provision of confidence intervals alongside point forecasts, equipping system operators with uncertainty-aware predictions. Furthermore, expanding the model to jointly forecast multi-source renewable portfolios, including PV, wind, and demand-side response, within a single, unified framework would enhance its system-level applicability. Incorporating real-time satellite imagery and sky-camera data through feature-fusion techniques may also further improve intra-hour resolution and cloud-event detection. The proposed regression tree-based model constitutes a flexible, high-performing tool for PV power forecasting and offers a replicable solution for other RES-dominant power systems aiming to balance accuracy, efficiency, and interpretability in the transition toward a cleaner energy world.


