Article

Comparative Analysis of Energy Efficiency and Position Stability of Sub-250 g Quadcopter and Bicopter with Similar Mass Under Varying Conditions

Department of Technical Systems Operation and Maintenance, Faculty of Mechanical Engineering, Wroclaw University of Science and Technology, 27 Wybrzeże Wyspiańskiego Str., 50-370 Wroclaw, Poland
*
Author to whom correspondence should be addressed.
Energies 2025, 18(14), 3728; https://doi.org/10.3390/en18143728
Submission received: 2 June 2025 / Revised: 4 July 2025 / Accepted: 10 July 2025 / Published: 14 July 2025
(This article belongs to the Section B: Energy and Environment)

Abstract

This paper investigates the energy efficiency and positional stability of two types of ultralight unmanned aerial vehicles (UAVs)—bicopter and quadcopter—both with mass below 250 g, under varying flight conditions. The study is motivated by increasing interest in low-weight drones due to their regulatory flexibility and application potential in constrained environments. A comparative methodology was adopted, involving the construction of both UAV types using identical components where possible, including motors, sensors, and power supply, differing only in propulsion configuration. Experimental tests were conducted in wind-free and wind-induced environments to assess power consumption and stability. The data were collected through onboard blackbox logging, and positional deviation was tracked via video analysis. Results show that while the quadcopter consistently demonstrated lower energy consumption (by 6–22%) and higher positional stability, the bicopter offered advantages in simplicity of frame design and reduced component count. However, the bicopter required extensive manual tuning of PID parameters due to the inherent instability introduced by servo-based control. The findings highlight the potential of bicopters in constrained applications, though they emphasize the need for precise control strategies and high-performance servos. The study fills a gap in empirical analysis of energy consumption in lightweight bicopter UAVs.

1. Introduction

Unmanned aerial vehicles (UAVs) are widely used in a growing number of fields, such as agricultural cultivation, infrastructure inspection photogrammetry, rescue, hobbies, and military operations. With the rapid growth of drone operations, the importance of parameters such as range, flight time, and energy efficiency, which are often the decisive parameter for the utility of a UAV, is increasing. Particularly in industrial environments, total energy used (Wh) and additional weight are becoming key factors affecting the cost of operation and mission reliability.
With regulations categorizing drones based on their weight, we can determine the maximum takeoff weight for different applications. Thus, in many countries, including the European Union, the least restrictive regulations are for drones weighing up to 250 g. By increasing the number of rotors, we thereby increase the weight; hence, four-rotor drones dominate this weight category. However, there are designs with fewer rotors, which, however, are not as well described and are considered much more difficult to implement. In this type of drone, not only does the weight associated with the number of motors decrease but also the number of components that consume significant amounts of energy. This paper focuses on investigating the differences in power consumption and stability in ultralight (sub-250 g) two- and four-rotor drones.
Four-rotor (quadcopter) drones use the properties derived from the rotors used for movement, as shown in Figure 1. In drones with fewer rotors, additional servos are needed to perform movement. For example, in helicopters, it is possible to use a change in the angle of attack of the blades during rotation to induce tilting forces in specific directions. Unfortunately, this involves the use of a complicated control disc mechanism that moves with the rotor and additionally needs two servos to perform the full range of motions. In twin rotors (bicopter), additional servos are also needed to perform the movement, but here they induce a change in the angle of attack of the entire rotor, which eliminates the need for the control disc and reduces the range of motion of the entire mechanism, eliminating fatigue. Swinging both rotors forward causes a forward tilt and vice versa, while pointing them in opposite directions allows rotation around the z axis, as shown in Figure 2.

2. Related Work and Background

Bicopters are a special type of multi-rotor drone equipped with two propellers arranged in tandem, usually with a rotor tilt mechanism. Reducing the number of rotors reduces size and aerodynamic drag, which can translate into energy savings, as suggested in [1]. Bicopters are up to about 30% more energy efficient than traditional quadcopters of the same mass. On the other hand, the two-rotor system is strongly underactuated and has a peculiar pivoting design, which makes flight stabilization difficult [2], but with appropriate PID settings, it has been possible to perform flight with small deviations from the set trajectory. A number of dynamic models of bicopters have been described in the literature, from the first Newton-Euler models to models that take into account the moment of inertia of the rotors and the non-uniformity of the servos [3]. Other works extended the design with additional degrees of freedom [4] and developed models for lift control. Thus, there is a rich base of mathematical models for bicopters, with typically nonlinear dynamics and with difficult control of motion in the axis of tilt.
One of the newer directions in the development of drones with fewer rotors is a swashplateless mechanism for changing the angle of attack of the blade, using the moment of inertia of the blade to perform movement. Such a mechanism used in [5] allows for increased flight time while reducing the complexity of the design, but it is a larger scale bi-rotor, weighing 1.8 kg and using larger, high-performance rotors, although the authors note its small size at this weight. However, there is still a lack of other works that describe the energy consumption of the studied design well.
In many papers describing bicopters, the authors focus on determining the PID controller settings, but they lack analysis of energy consumption. Thus, in paper [6], the authors focus on describing the flight simulation of a bicopter without experimentation. In paper [7], despite the performance of calculations of regulator settings, the authors emphasize that determining the full and correct configuration required at least 8 h of flight to fully and correctly determine the settings. This allows us to conclude that the determination of settings is mainly done empirically, and the settings are difficult or impossible to determine using only analytical methods. In [8], the authors found the most optimal algorithm, which turned out to be Event Triggered Impulsive Super Twisting Terminal Sliding Mode Control (ETISTT-SMC). The authors of this work also conducted tests on a microcontroller and confirmed the simulation results.
In many works, the focus is on finding the best control model for specific types of drones. Efforts are being made to create a universal tool to predict the movement of different types of drones, as in [9]. It is particularly difficult to develop such a model for an unbalanced UAV, hence in [10], the authors developed a model of a Vertical Take-off and Landing (VTOL) bicopter that can significantly lower its center of gravity by folding its wings, which, when unfolded, significantly reduce energy consumption in progressive motion. In unmanned rotorcraft, lowering the center of gravity improves stability [11]. However, most VTOL aircraft retain the classic multi-rotor layout, such as the X UAV with a trirotor layout presented in paper [12]. This allows for greater stability but requires installation of an additional rotor.
A relatively small number of papers focus on examining the position displacement of a bicopter. One example is the work [13], in which the mean square deviation of a 0.6 kg bicopter is 20 cm. This means that these drones have no problem determining position with the optical flow sensor. In addition, the authors showed that the proposed nonlinear control algorithm effectively tracks trajectories in real conditions, which confirms its practical usefulness. Still, most work focuses on theoretical calculations of the in-flight behavior of such a structure, as in [14]. In this work, the authors presented that the backstepping controller they designed exhibits better noise immunity compared to classical PID controllers and those based on Lyapunov theory, as confirmed by the results of simulations carried out in the presence of different types of noise. A good solution resistant to interference would be H∞ filtering, which also copes well with data packet loss [15]. However, this solution would require a complete rewrite of the drone control software, which was not the aim of this work.
More works focus on the study of quadcopters and their energy consumption. There are some comparisons of energy consumption depending on wind speed and direction [16]. It turns out that depending on the direction from which the wind is blowing, higher wind speeds can result in lower energy consumption. Similar results were obtained in [17], where the relationship holds true at constant wind speed, although when the critical speed is exceeded, energy consumption increases significantly. The authors explain this by the increased lifting power of the rotors at higher wind speeds.
Also of interest to researchers is the possibility of reducing the UAV’s energy consumption, which directly affects flight longevity. One of the parameters affecting it is the efficiency and effectiveness of the propulsion system used [18]. It is important to determine the characteristics of the propulsion system for a particular application. In propeller-driven aircraft, there is an additional velocity component of the incoming air, which can increase the efficiency of the propulsion system, additionally providing more lift with the use of wings; hence, it is the preferred long-range design [19]. Designs that require hovering consume significantly more energy, although they allow for a greater variety of missions [20].
Another way to increase flight time is to use photovoltaic panels, as presented in paper [21]. The authors of the paper managed to achieve nearly 22 h of flight time. The use of solar panels requires a large area of the drone, so their use in classic multi-rotors is problematic, as they would require significant modification of the design [22], which would further increase the weight of the drone.
Considering the regulations being introduced in the European Union or the US, ultralight drones weighing sub-250 g allow the most freedom of movement. Some works try to find solutions other than photography for such lightweight drones. The paper [23] examines solutions to the use of structural elements that significantly reduce the weight of the structure, such as by using very light servomotors for the gimbal or using PCBs with electronics as part of the structure. Some photo drones with low weight can also be used to do photogrammetry [24]. With the development of drone technology, a number of electronic solutions for building lightweight units have appeared on the market. In the work [25], the authors explain the process of selecting electronic components for these types of drones. Nowadays, there is also greater access to All In One (AIO) type flight controllers with integrated Electronic Speed Controllers (ESCs).
While previous works have explored advanced control or modeling of individual UAV configurations, they rarely attempt a direct experimental comparison between structurally distinct platforms using real prototypes. This study aims to address that gap by focusing on practical energy and stability outcomes in two competing rotorcraft designs. The primary objective of this study was to compare two fundamentally different UAV architectures—bicopter and quadcopter—using physical prototypes in the sub-250 g category. To the best of our knowledge, such a comparison has not been published before. The quadcopter was chosen as a baseline for comparison due to its popularity, maturity, and well-understood dynamics.

3. Methods

3.1. Choosing Research Criteria

In order to allow a credible comparison between a bicopter and a quadcopter, it was assumed that both designs should meet the following criteria:
  • Similar total weight, containing less than 250 g;
  • Analogous electronic components—both designs use the same processor, IMU, barometer and optical flow sensor;
  • Identical power source;
  • Identical propulsion kit—BLDC motor + propeller.
With the above assumptions, and assuming identical test conditions, any differences in measurement results can be attributed solely to the propulsion configuration and control method and not to differences in weight or type of components. Finally, a UAV equipped with the following components was built for testing:
  • BLDC motors Happymodel EX1404 3500 kv with Gemfan 4024 propellers;
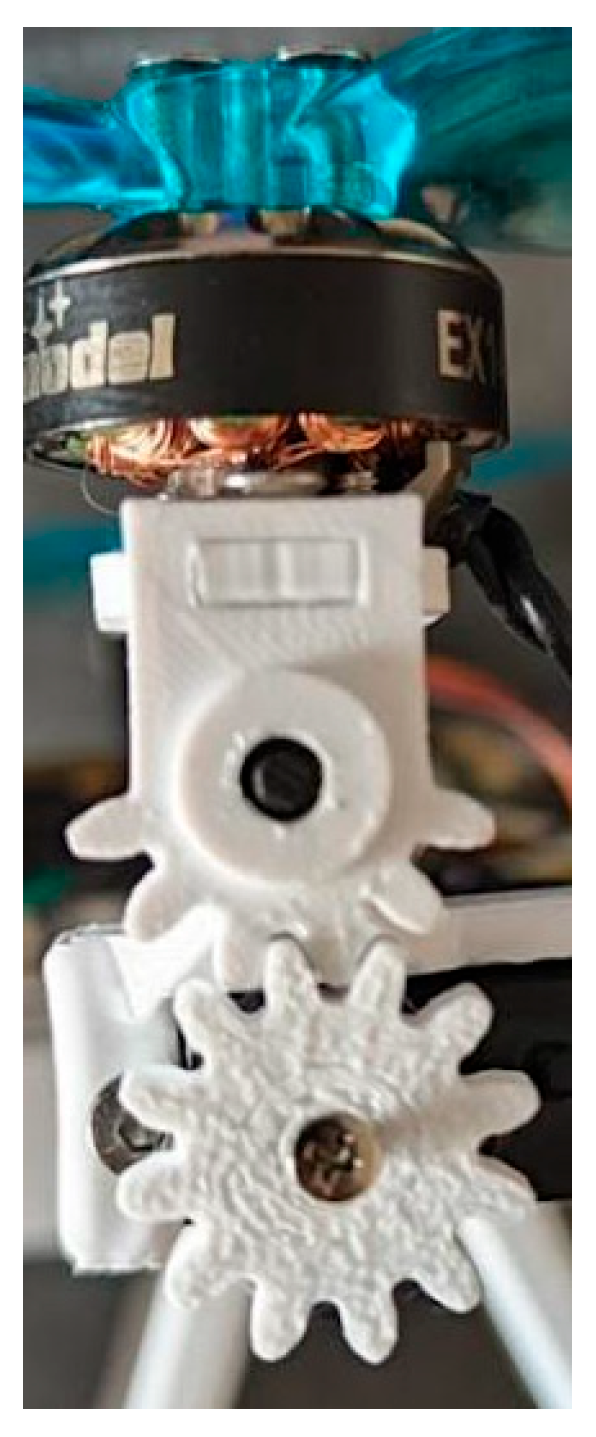
  • PowerHD DSM44 Servomotors controlled directly from flight controller with Pulse-Width Modulation (PWM), steering drive unit rotation mechanism, as seen on Figure 3;
  • Speedybee f405 AIO flight controller (for quadcopter) and Speedybee f405 wing mini (for bicopter);
  • Mothers optical flow sensor 3901-L0X;
  • 3s 1300 mAh battery;
  • FrSky control with XM receiver;
  • INAV 8.0.1 software.
The differences in the type of flight controller are due to the need for it to have at least two PWM outputs for servos, where the Speedybee f405 AIO has only one output, but both Flight Controllers (FCs) have the same electronic components. Table 1 summarizes all the characteristics of the two drones under study, and Figure 4 shows the finished, configured version of both designs. The difference in weight was less than 1%.
Table 2 presents the estimated cost of individual components (for one unit each). For the purpose of cost comparison, a different flight controller—MicoAir743-AIO-35A—was selected instead of the ones previously used in the experiments. This controller supports both quadcopter and bicopter configurations and provides sufficient PWM outputs. Unfortunately, this board was not available during prototype development. The observed cost difference favors the bicopter configuration, which costs $189, while the quadcopter costs $200. This corresponds to a 5.5% reduction in cost. The comparison does not include the cost of the airframe structure, and the difference is based solely on the propulsion system: two propellers, two BLDC motors, and two servos for the bicopter, versus four propellers and four BLDC motors for the quadcopter.

3.2. Test Conditions

Drones, by design, should be able to fly outdoors where there are wind gusts and other environmental factors. For this reason, both designs were tested in both windless conditions and those with wind gusts induced by an airflow generator. Both tests were performed with an optical flow sensor and in PosHold mode (maintain position and altitude) with the surface modifier enabled. The surface mode allows the UAV to maintain position relative to a fixed ground texture using optical flow data. For this reason, the test surface had to be made of a material with sufficient texture and contrast to be reliably detected by the optical flow sensor. Position maintenance tests without wind were conducted over a 1 m × 1 m test area, as shown in Figure 5. The tests took place in an enclosed room of at least 5 m × 5 m × 3 m, without external drafts, having evenly diffused natural and artificial light. For × wind measurements, a fan generating airflow was used, the velocity of which was determined to be (3 ± 0.5) m/s using a UNI-T UT363 anemometer at the location where the drone maintained position. The experimental tests were performed in two series: a series without wind and a series with wind. Each flight test lasted 30 s, which was sufficient to capture representative average power consumption. This duration balances the need to observe natural fluctuations in current draw with the ability to compute stable mean values, while minimizing the influence of short-term power consumption spikes or sensor noise on the final results.

3.3. Test Scenarios

In order to evaluate positional stability and energy consumption under different environmental conditions, a series of controlled flight tests were performed. Each test scenario was designed to simulate realistic use cases, both with and without wind, using consistent procedures for both drone types. The individual series in particular consisted of the following steps:
  • Series 1: Maintaining position without wind
1.
Drones were launched in angle mode (automatic stabilization of the drone in each axis);
2.
After stabilization, the PosHold mode was activated with the surface modifier for optical flow;
3.
The drones were manually positioned to stay as much as possible in the center of the test field;
4.
The flight of maintaining the position over the test field for 30 s was recorded;
5.
After the flight, the center of the drone’s position was marked with dots every second for 30 s on the recording;
6.
After the flight, the drone’s parameters from the blackbox were read for 30 s of stable flight.
  • Series 2: Maintaining position with wind
1.
Drones launched in angle mode;
2.
After stabilization, the PosHold mode was activated with the surface modifier for optical flow;
3.
The fan was turned on, and the measurement was started;
4.
After the flight, the drone’s parameters from the blackbox were read for 30 s of stable flight.

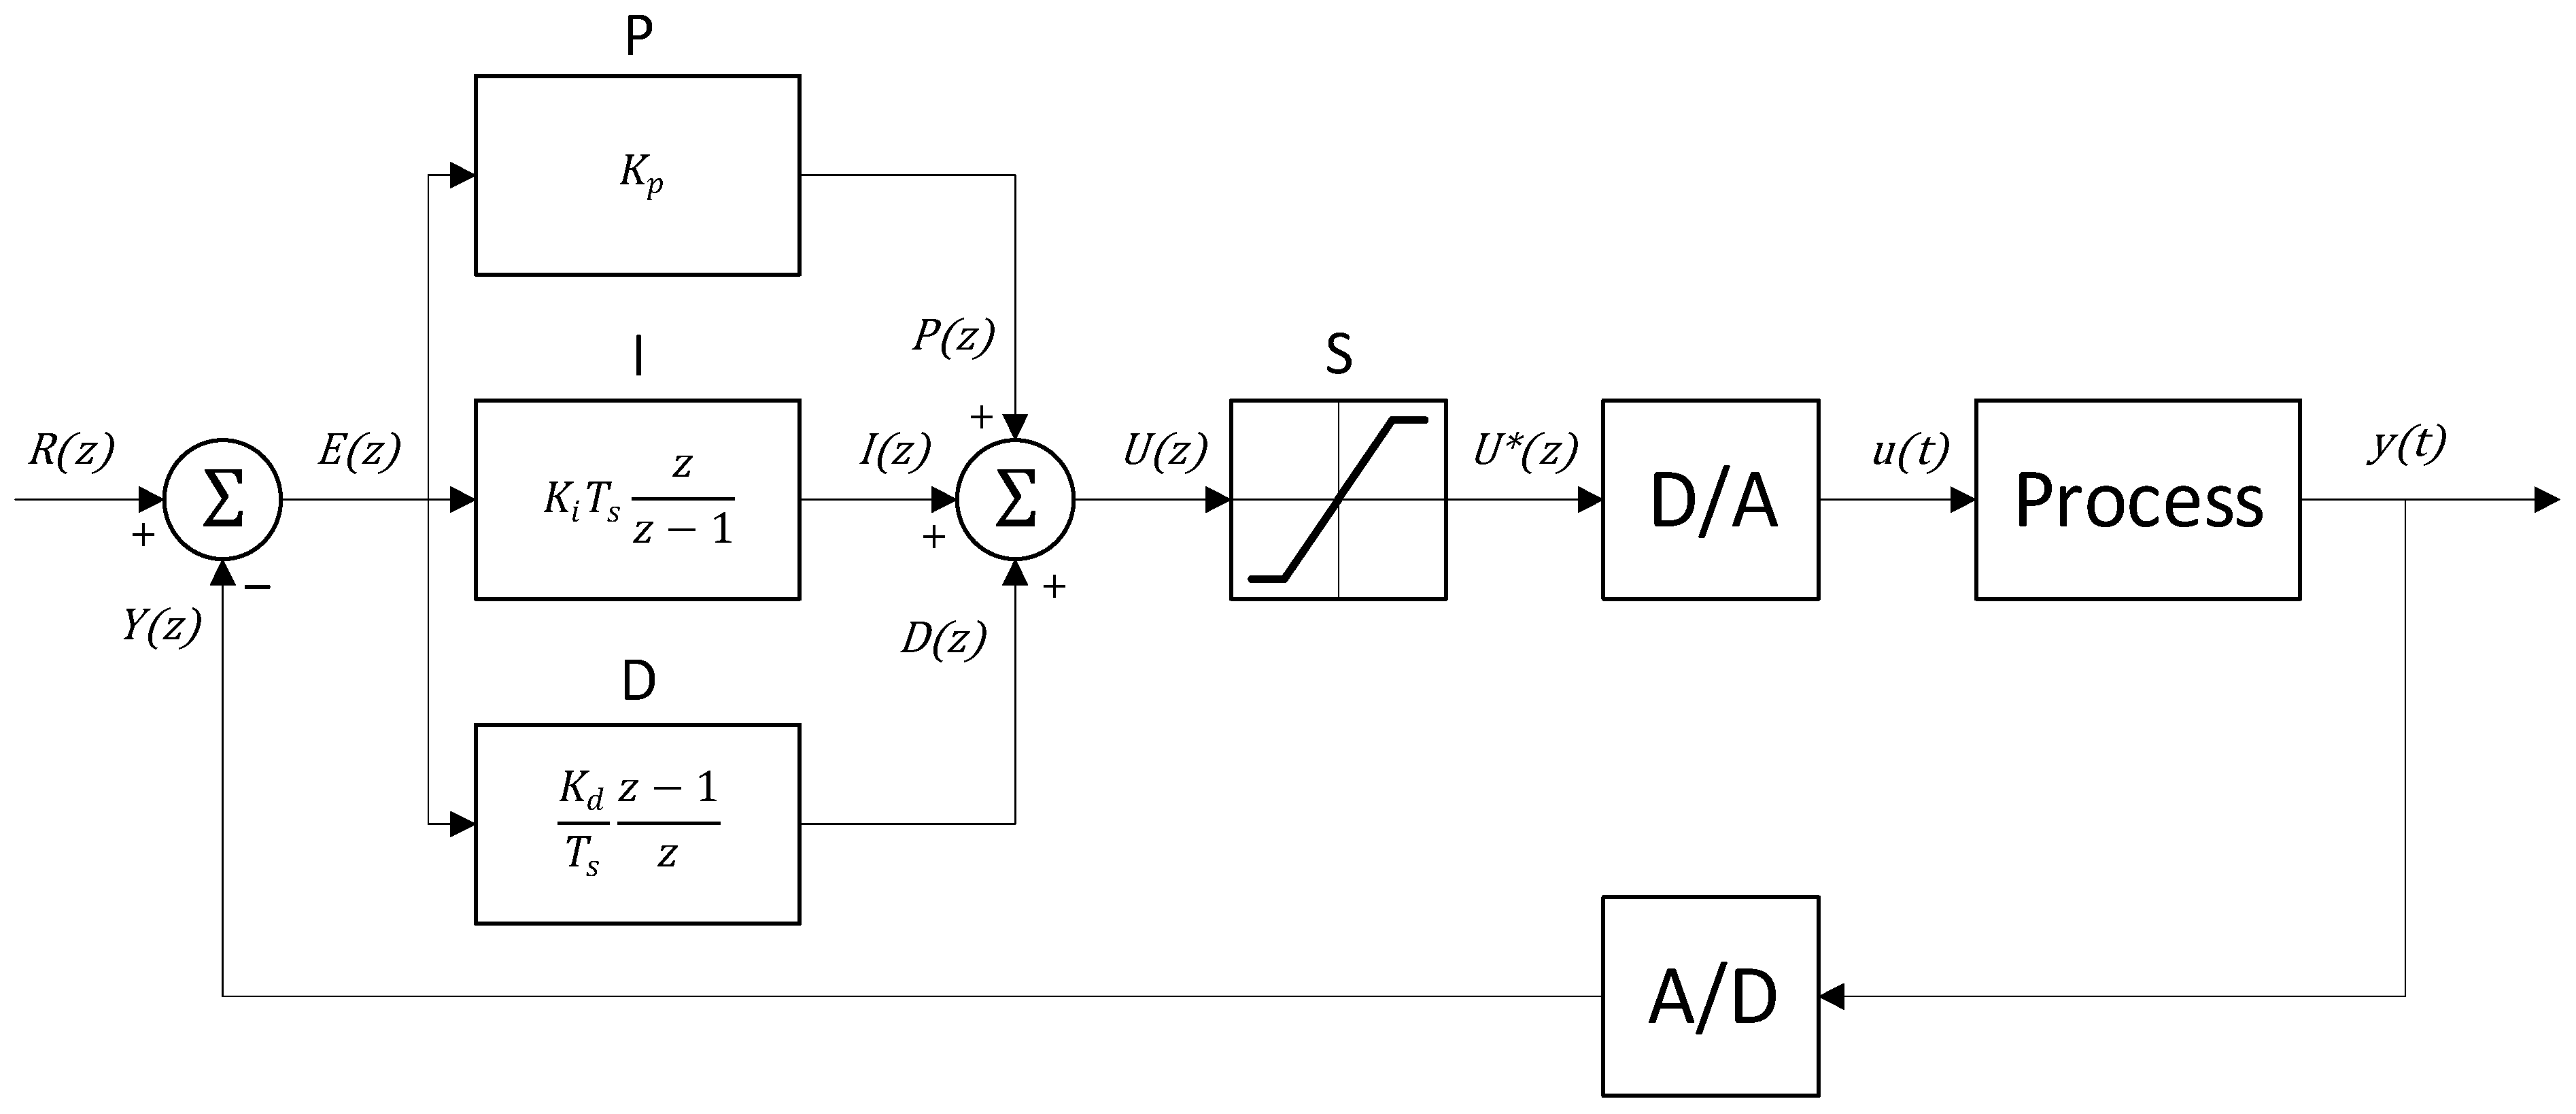
3.4. PID Controller Settings

This study focuses on foundational experimental comparison between two UAV configurations. The aim was not to evaluate advanced control strategies but to analyze differences in positional stability and energy consumption using a commonly supported PID controller. During the tests, the basic controller settings for the quadcopter were used, as listed in Table 3. In the bicopter, these settings were changed to achieve stable flight. The PID gains were initially set using INAV’s default recommendations, then adjusted empirically during test flights to achieve stable hover and response for which more than 200 launches were needed. This trial-and-error method is widely used in lightweight UAVs due to their sensitivity to minor variations and the lack of reliable dynamic models at a sub-250 g scale. PIDs were adjusted to achieve the highest stability of flight without an overly aggressive reaction to disturbances. Adjustments were made according to an algorithm: increasing the proportional (P) settings until vibration appeared, and then decreasing until it stopped. Increases in the differential settings (D) were then made to dampen the oscillations and soften the response of the system. This value is sensitive to noise, which is particularly present in the bicopter. Finally, the integral value (I) was raised until the desired position was maintained [26]. In the bicopter configuration, rotor tilt control was implemented using the custom mixer functionality available in INAV firmware. The tilt servos did not operate under separate PID loops but instead followed standard multirotor control logic. The throttle and roll axes were assigned entirely (100%) to the motor outputs, while the tilt servos were configured to control pitch and yaw. While only one gain set was used for the final experiments, future studies will explore the sensitivity of performance to various PID tuning configurations. Output saturation (S) was applied to the control signals by limiting servo output ranges to 40% on pitch and 18% on yaw. This was implemented in software to keep the actuator commands within safe mechanical limits and to prevent overshoot or instability caused by excessive control effort. The implementation of the settings with their formulas is shown in Figure 6 according to the discrete transform [27].
In INAV itself, the system response using the controller settings is as follows:
  • Calculating error:
E z = R z Y z ,
where
  • E z —error in time step z
  • R z —set value
  • Y z —current measured value, obtained by sampling the signal y ( t )
2.
Proportional component (P)
P z = K p · E z
3.
Integrating component (I)
I z = I z 1 + K i · E z · T s ,
where
  • T s —sampling period (set as default 500 μs)
4.
Differential component (D)
D z = K d · E z E z 1 T s
5.
PID controller output
U z = P z + I z + D z
The sampling period T s was set to the default looptime recommended by the firmware, equal to 500 µs. This value is set to default by the manufacturer and not intended to be modified. The sampling period directly affects the responsiveness and stability of PID control, influencing how frequently control corrections are applied.
During testing, a positive effect of higher PID controller settings on the stability of the bicopter’s design was noted, but this was associated with the drone’s tendency to fall into servo oscillations caused by oscillations of movement around the y axis (pitch) and to respond too aggressively to these variables. In addition, higher P and D settings for pitch and yaw caused the BLDC motors to heat up, thereby increasing power consumption, which in critical cases was higher by up to 50%. Similar phenomena occurred when increasing the range of motion for the servos in the mixer in the INAV. Taking into account the above observations, the settings were set lower than would result from airborne stabilization alone, and a particularly important parameter was the goal of not overheating the BLDC motors. In addition, in the quadcopter, the settings were set to basic for this type of design, and their experimental testing proved their effectiveness. Finally, the PID settings for the bicopter and for the quadcopter were set as in Table 3.
The PID settings for the position hold controller along the x, y, and z axes were identical for both the bicopter and quadcopter configurations to ensure a fair comparison. The proportional gain ( K p ) was set to 100 for all position axes, while the integral ( K i ) and derivative ( K d ) gains were set to 0, following the recommendations of both the optical flow sensor manufacturer and the INAV firmware documentation. To describe the control process, it is useful to define the full state vector of the UAV. Control can be performed in three axes with six degrees of freedom, including 12 physical quantities that fully characterize the system behavior:
x = p n   p e   p d   u   v   w   φ   ϑ   ψ   p   q   r T
where:
  • p n , p e , p d —linear positions in the North (N), East (E), and Down (D) directions
  • u , v , w —linear velocities along the body-frame x, y, and z axes
  • φ , ϑ , ψ —Euler angles
  • p , q , r —angular velocities around the x, y, and z axes
  • Euler angles: The three angles ( φ , ϑ , ψ ) define the orientation of the UAV with respect to the reference frame. They correspond to rotations around the following axes:
  • φ —roll: rotation around the longitudinal axis (x)
  • ϑ —pitch: rotation around the lateral axis (y)
  • ψ —yaw: rotation around the vertical axis (z)

3.5. Power Registration and Measurement Methods

Prior to flight testing, energy consumption and thrust were measured on a Mayatech MT10Pro dynamometer with different types of propellers and voltages, the measurement graphs of which are shown in the chart in Figure 7. This allowed the most energy-efficient system to be determined, which at the same time would be capable of lifting the drone. A high-efficiency system is understood to be one where, on this scale, the ratio of thrust to power consumed is higher than 2 g/W, such as Flywoo nin 2104 1800 kv motor, which is considered long range with energy efficiency > 2 g/W [28]. The power consumed directly affects the longevity of the flight, so there should be an effort to minimize its consumption. Finally, the dynamometer results were compared with the actual power consumption results of the tested UAVs. In flight tests, the blackbox was activated at each flight with a logging frequency of 50% (every other signal). The following real-time data were recorded:
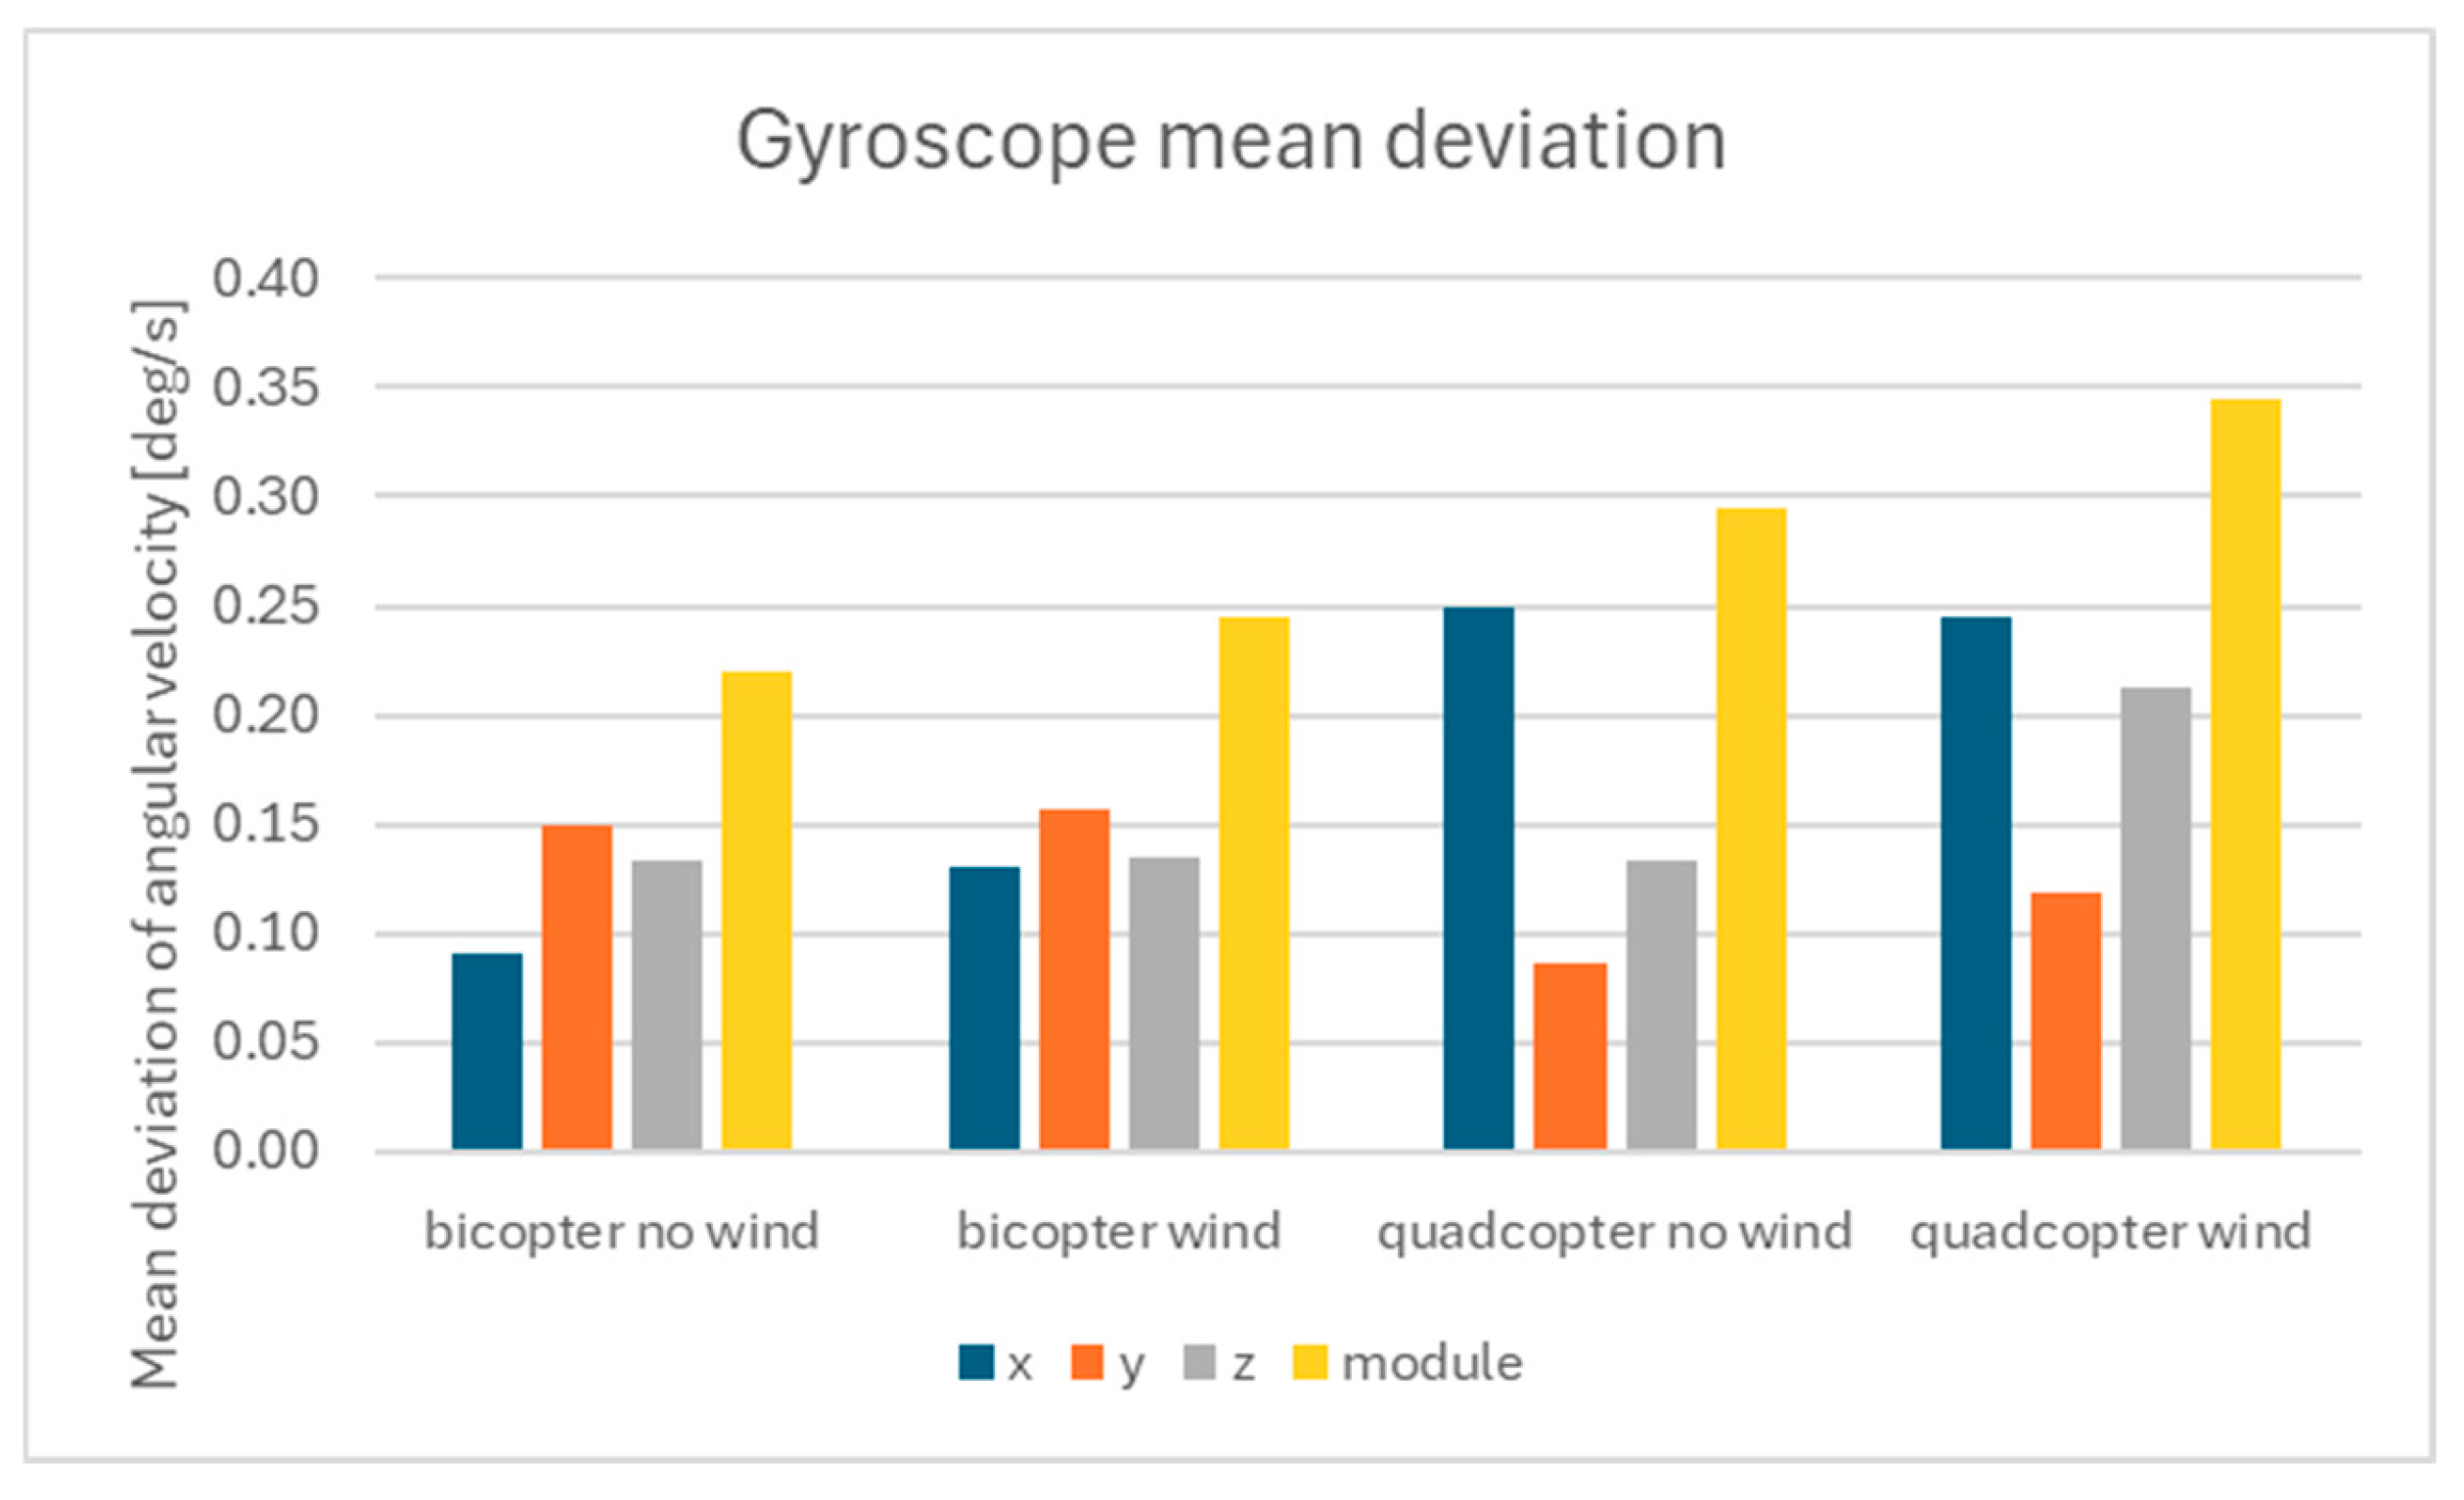
  • Angular velocities from gyroscopes;
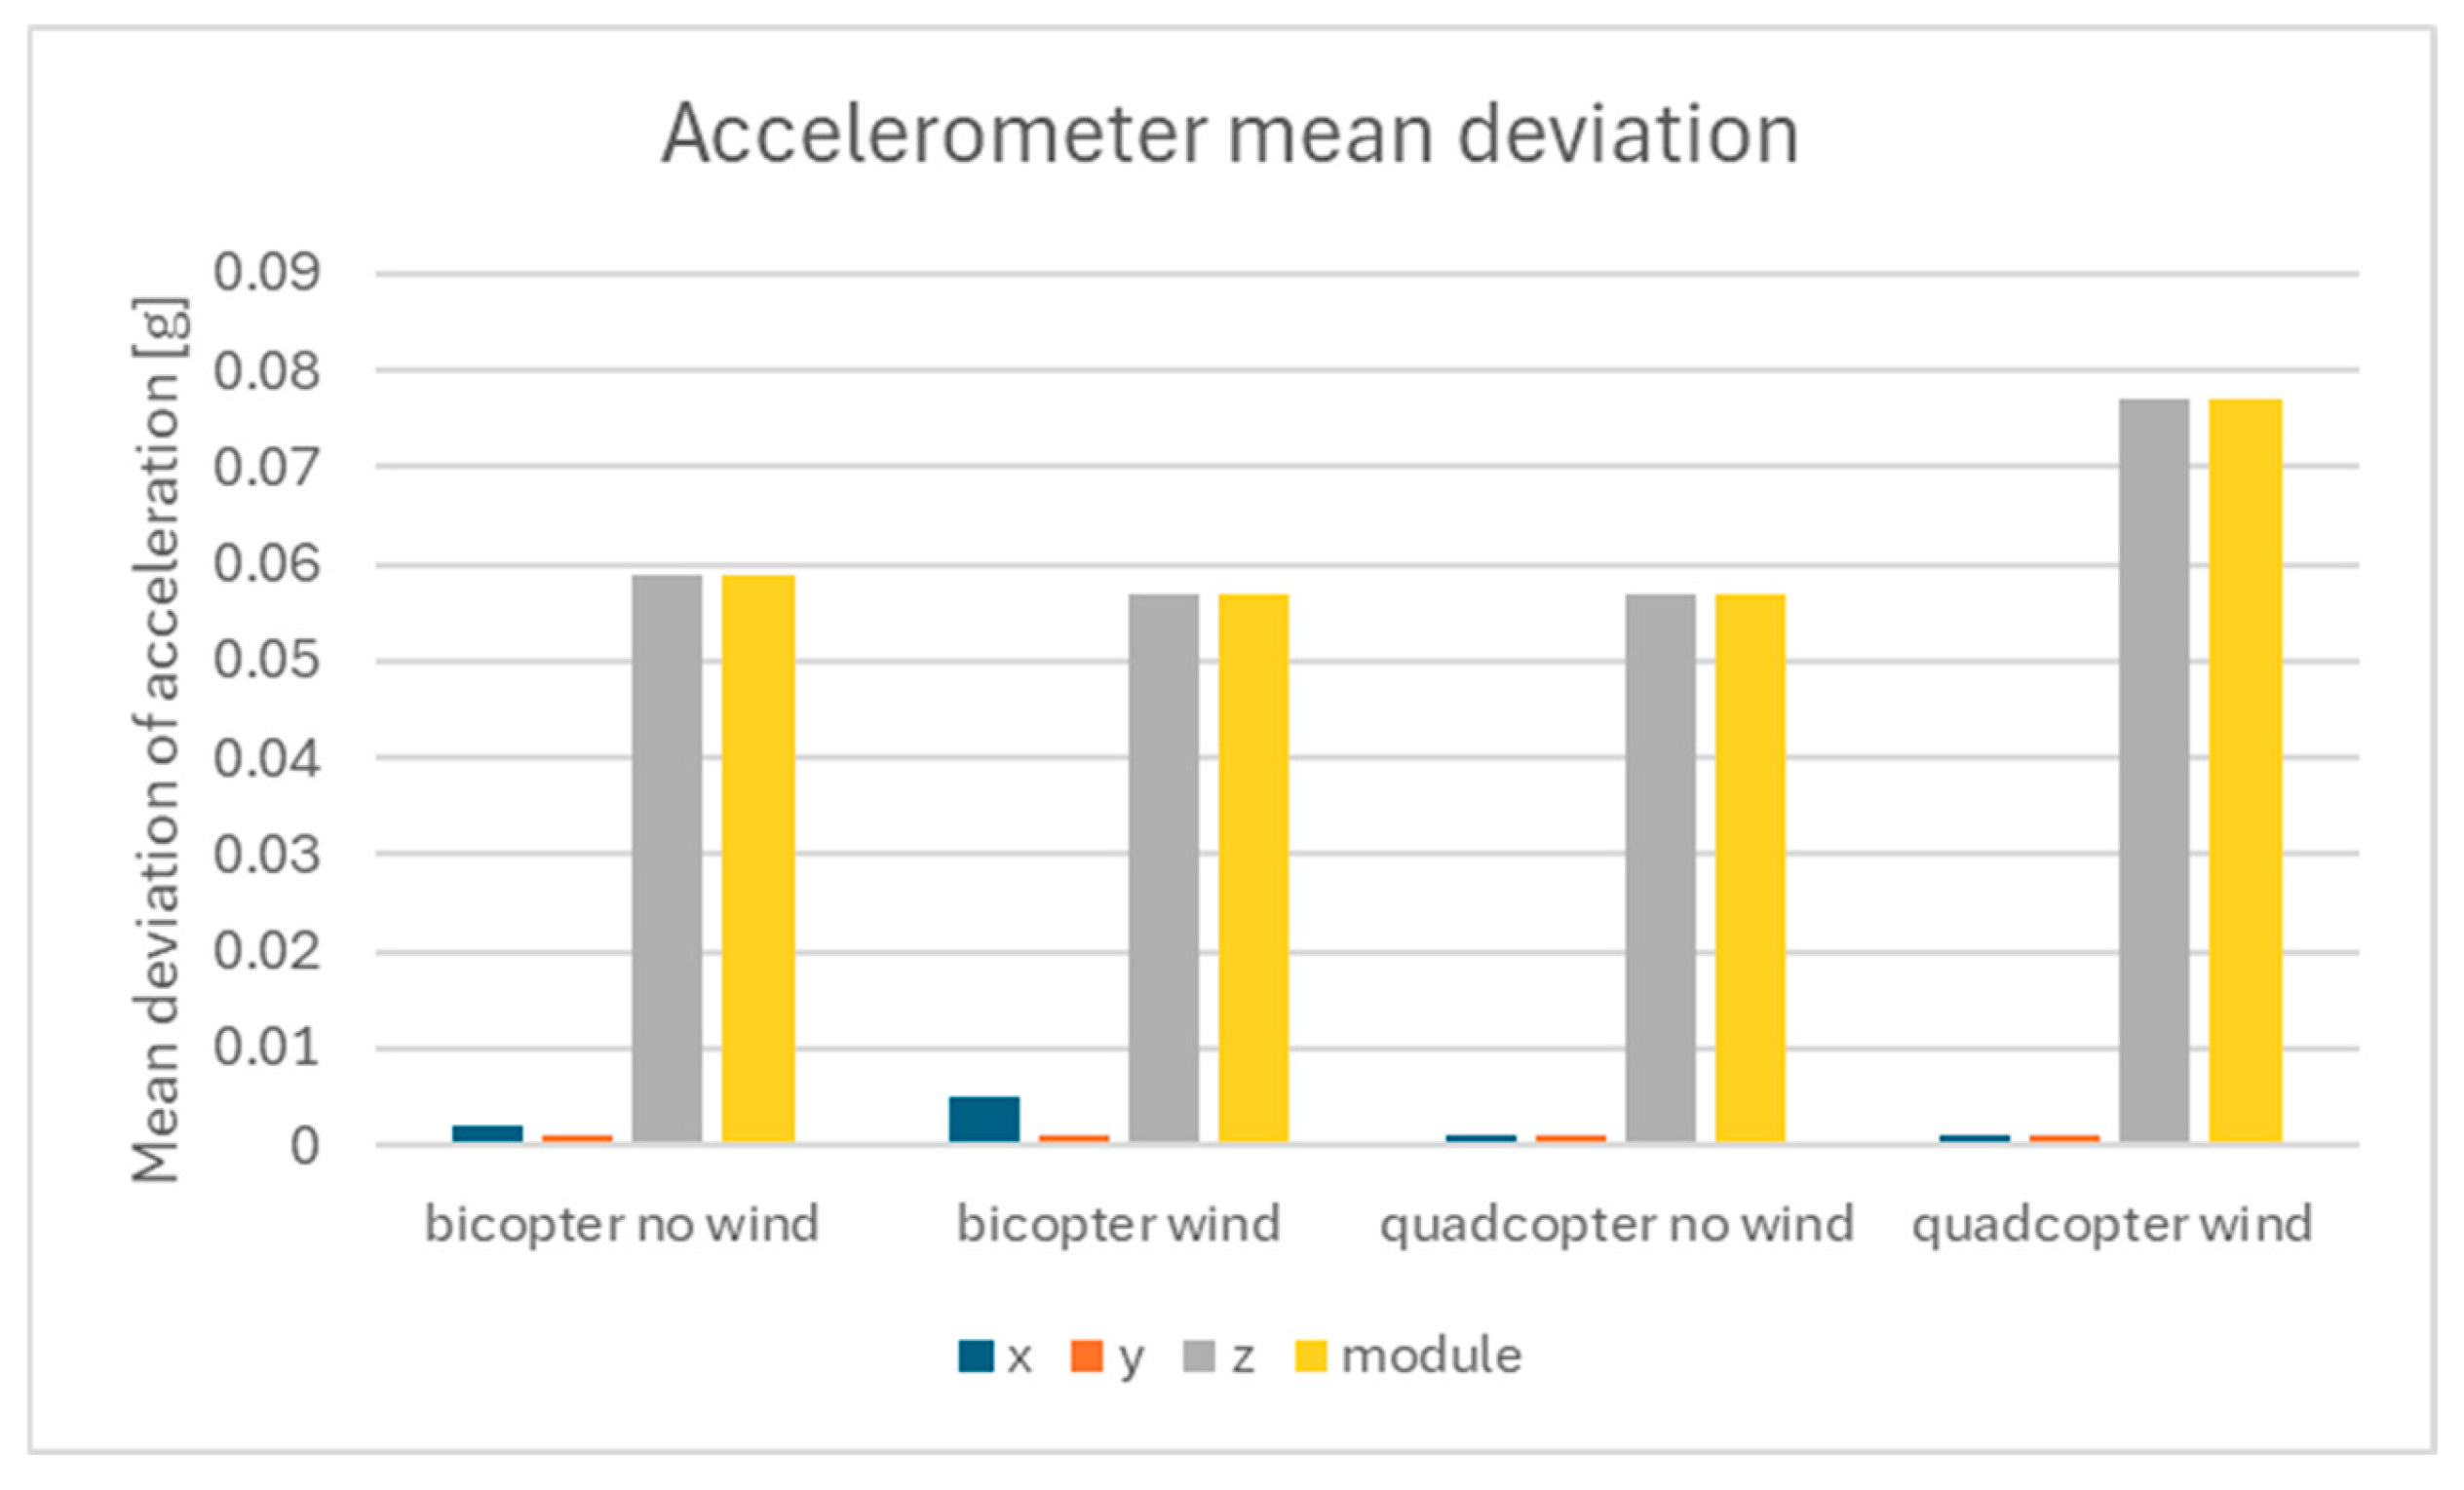
  • Accelerations from accelerometers;
  • PWM signal values on motors;
  • Voltage U and current I drawn by the entire drone.
The recorded voltage and current were used to calculate the power consumption (see Formula (6)). The measurements were taken from the battery using the flight controller’s built-in monitoring system.
P = I   ·   U
The recorded data was downloaded from the blackbox as flight log text files, which were then converted into CSV files using blackbox decode, INAV’s dedicated software. The power consumption of the UAV was read, and a graph of power versus time was made. The power consumed by the drone for 30 s of stable flight was taken into account. The measurement of energy consumption was obtained by multiplying the voltage and current by each other, which divided by the mass of the drone allows the determination of the energy efficiency of the entire UAV. The results of all flights are presented in a graph to compare the average energy consumption.

3.6. Stability Registration and Measurement Methods

The study of deviation from a preset position point was investigated using a test rig like the one in Figure 5. Each flight was recorded using a smartphone camera, and dots marking the center of the drone’s position were applied to the recording every second for 30 s. The position of the dots in the x and y axes was determined, and then the mean position and mean deviation of the mean were calculated. This allows one to determine how the drone swung from a given position and compare the two designs visually and numerically.

4. Experimental Results

4.1. Engine Tests on the Dynamometer

In order to determine the most optimal propulsion system configuration, engine thrust was tested with different propellers and battery voltages. Gemfan LR 4024 and Gemfan Hurricane 3018 two-blade propellers and DAL New Cyclone T3028 three-blade propellers were used for dynamometer tests. The whole system was tested using 2s, 3s, and 4s batteries (7.4 V; 11.1 V; 14.8 V, respectively). The results are shown in Figure 7.
From the graphs, it can be concluded that the highest thrust is given by a system with a 4024 propeller and 3s and 4s batteries. However, due to the heating of the motor when using a higher voltage, it was decided to use a 3s battery. Assuming the weight of the unmanned aircraft to be 230 g, one quad-rotor motor should have a thrust of 57 g at free hover, while a twin-rotor should have a thrust of 115 g. Reading the power from the chart for these values and multiplying it by the number of motors, we get a power consumption of 40 W for the quadcopter and 48 W for the bicopter.

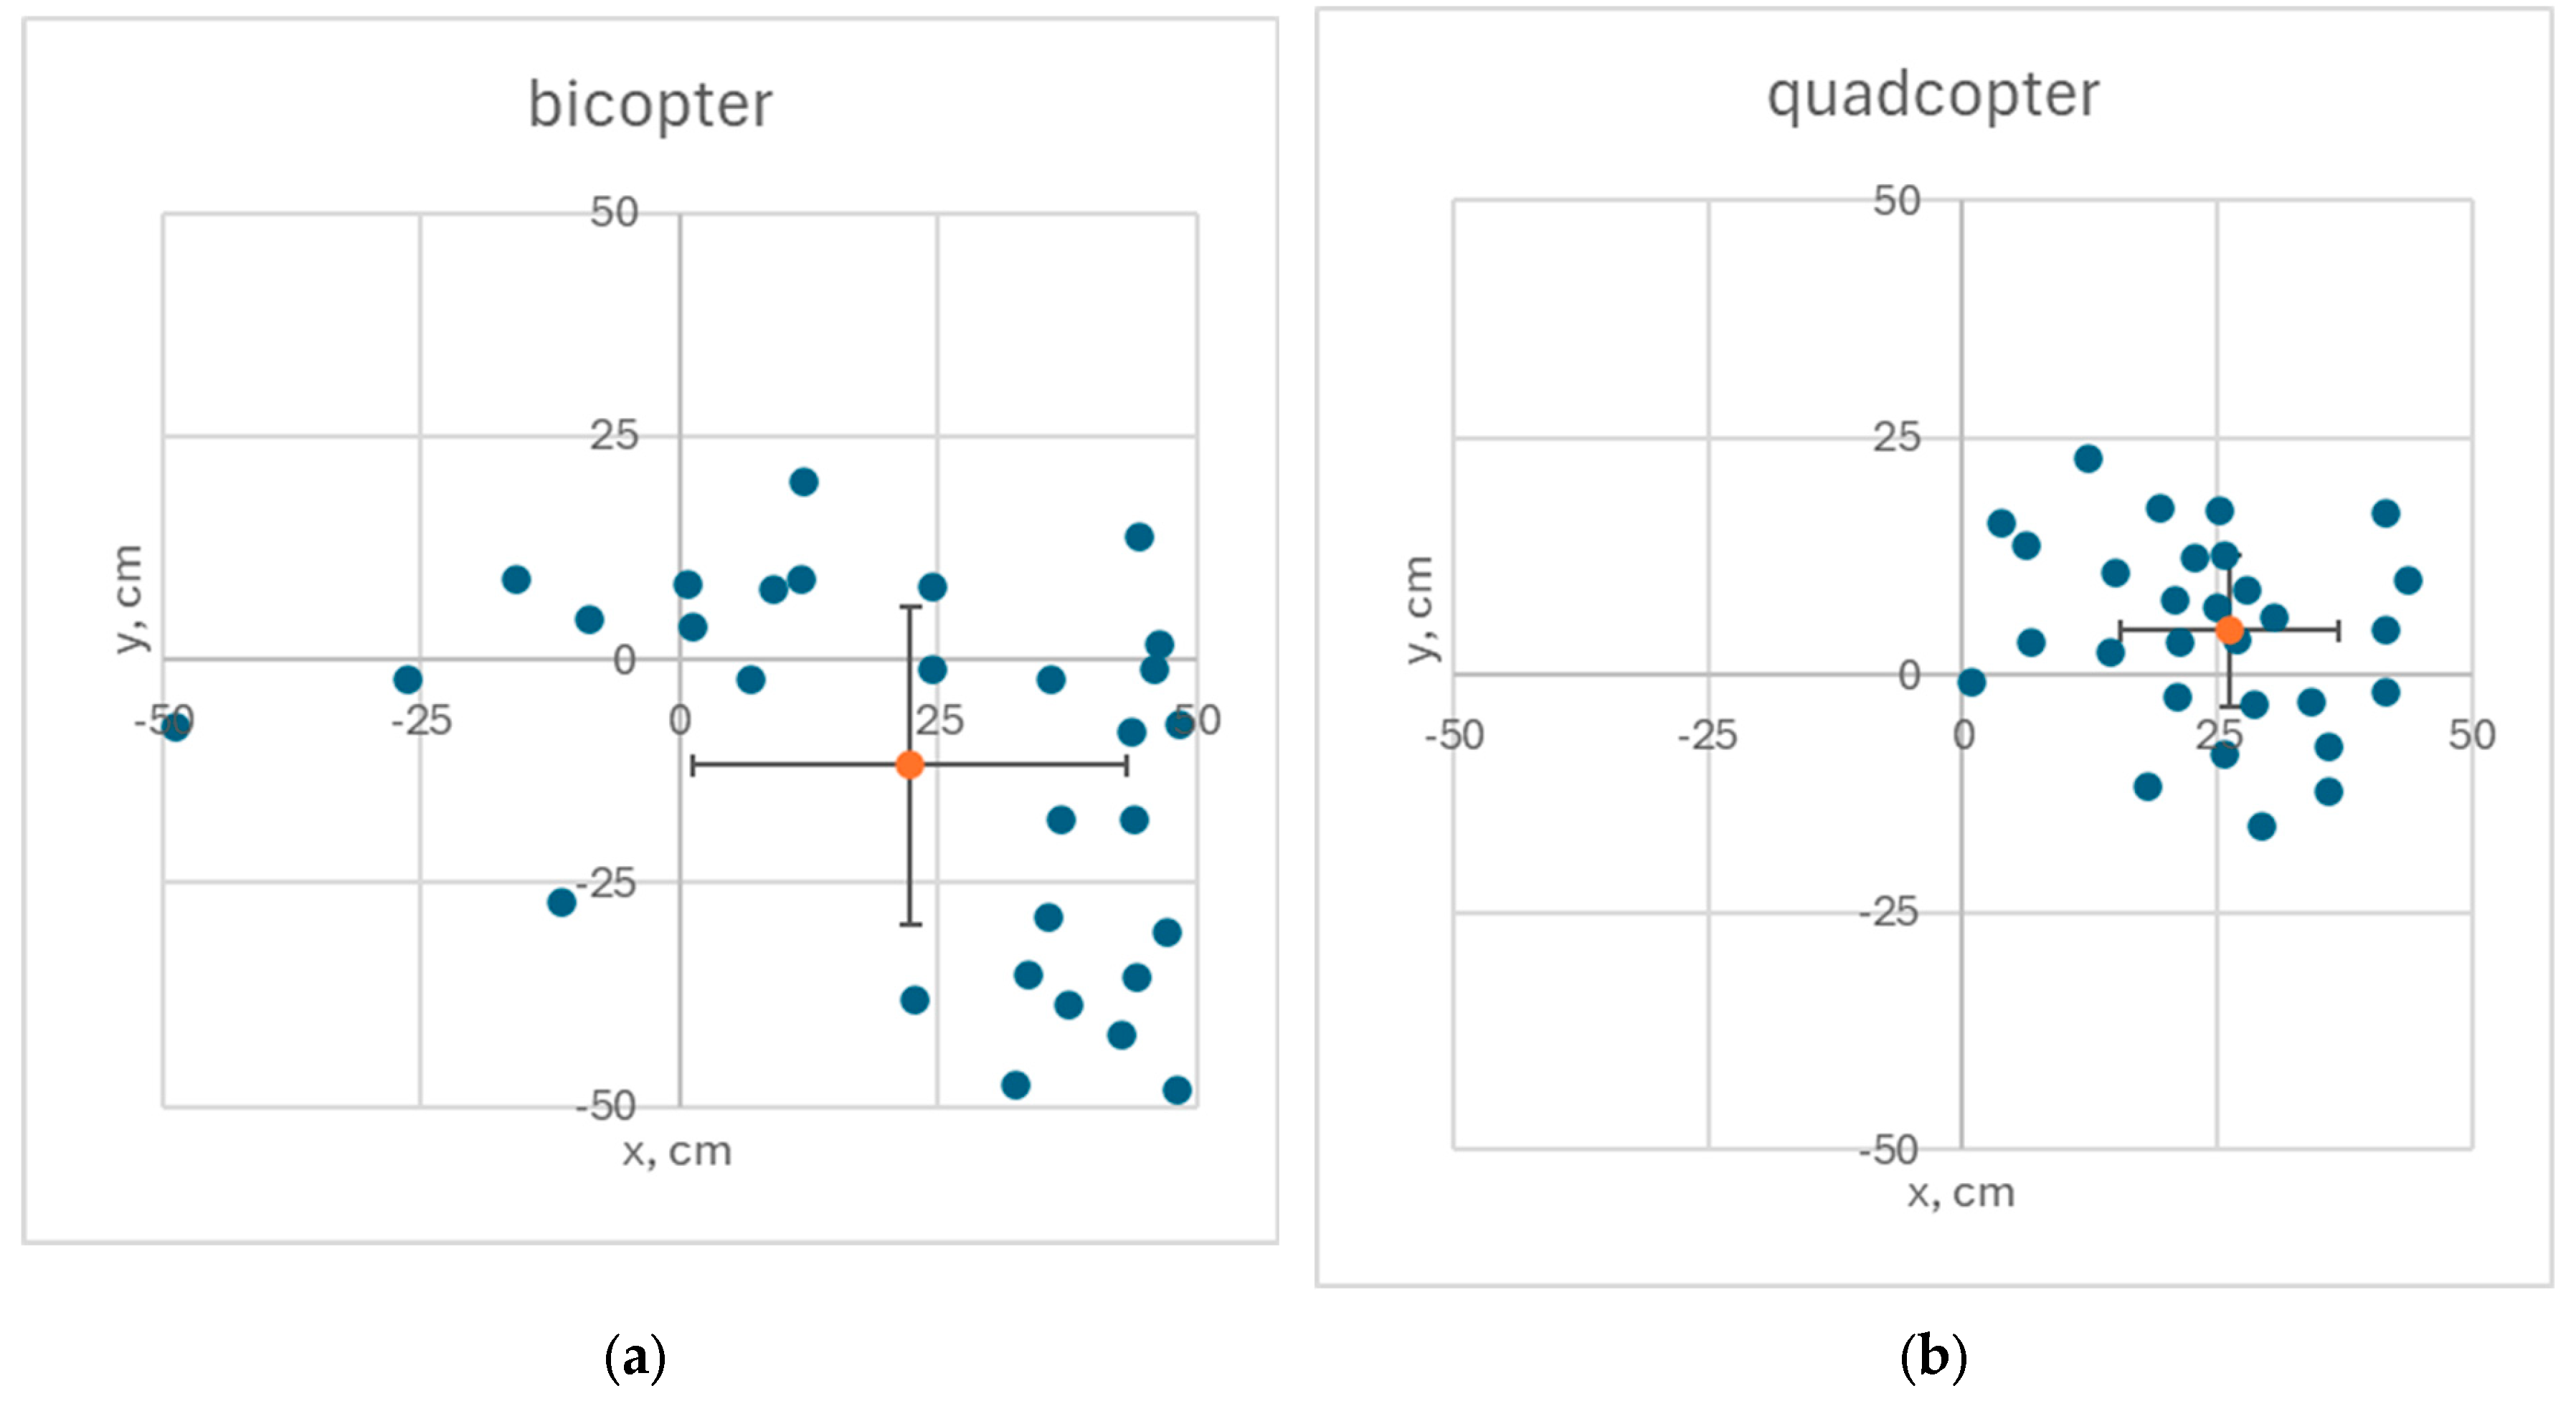
4.2. Wind-Free Positioning Tests

Figure 8 and Figure 9 show the results of the position maintenance test for the bicopter and quadcopter. The average energy consumption in the no-wind stability test was 46.6 W for the bicopter and 43.9 W for the quadcopter. The mean deviations from the mean x and y position were 21 cm and 17.7 cm for the bicopter and 10.8 cm and 7.9 cm for the quadcopter, respectively.

4.3. Wind Stabilizzation Tests

The graph in Figure 10 shows the results of energy consumption for both tested designs in windless and wind conditions. The average energy consumption in the wind test for the bicopter was 49.6 W, and for the quadcopter, it was 40.4 W. The graphs in Figure 11 and Figure 12 present the mean absolute deviation ( M A D x , M A D y , M A D z ) of each spatial component in the Euclidean space for both designs, based on the gyro and accelerometer readings. Additionally, a simplified global value (module) was calculated according to Equation (7):
M A D g l o b a l = M A D x 2 + M A D y 2 + M A D z 2
Graphs indicate that the quadcopter shows higher mean absolute deviations in both gyroscope and accelerometer readings. This results from its more aggressive reaction to angular deviations and positional disturbances, allowing it to maintain position more tightly. However, this tighter control results in larger instantaneous corrections, which is reflected in the higher mean sensor deviations. In the graphs above, you can see the higher mean deviation of the gyroscope for the quadcopter, which may be due to its faster response to disturbances. For the accelerometer, the changes are small and particularly noticeable for the z-axis (vertical), and they are mainly due to the measurement accuracy of the optical flow distance sensor. The highest deviations are for the quadcopter in the wind test, which is due to its more rapid response to gusts by increased lift. All of the determined parameters are in Table 4.
The power variance values of the bicopter and quadcopter under windless conditions differ significantly (0.26 W and 1.46 W, respectively) in a statistical sense. The F-statistic for the variance test is F = 5.63. The p-value is 0, indicating that the variances are statistically different. When comparing the power variance values of the bicopter and quadcopter under windy conditions, the variances also differ significantly (19.09 W and 11.76 W, respectively). The F-statistic for the variance test is F = 1.623. The p-value is close to 0, confirming that the variances are statistically different. It is worth noting that the power standard deviation for the bicopter is approximately nine times higher under windy conditions compared to windless operation. In the case of the quadcopter, this difference is nearly threefold. Statistically significant differences in variance under both windless and windy conditions confirm that the bicopter and quadcopter exhibit distinct energy profiles and stabilization dynamics.

5. Discussion

The presented comparison of energy consumption and flight characteristics of the quadcopter and bicopter under different operating conditions shows several important differences in the two designs. The following remarks are intended to summarize the most important observations, clarify the observed effects, and identify possible avenues for optimization and further research.
In all the tests conducted, energy consumption was lower for the quadcopter than for the bicopter, but the biggest difference appears in the wind tests. The quadcopter in this situation, forced to compensate for the lateral gust, leaned in the direction of the airflow, leading to a situation in which part of the aerodynamic force acted as an element of “reflection” of the structure from the incoming airflow, by increasing the lifting power of the propellers, thus consuming less energy. This phenomenon may not have occurred in the bicopter through the higher speeds at which the propellers operated, which exceeded critical speeds with the incoming airflow, and their efficiency decreased. It was also not insignificant that the rotors were constantly deflected in both directions in order to compensate for yaw and thus not use the increased lift. In the end, the difference in energy consumption was 6–22% higher for the bicopter compared to the quadcopter. The use of a propulsion system in which the maximum energy efficiency would coincide with the practical requirements of the drone (i.e., the operating point corresponding to the average load) could positively affect the bicopter’s energy consumption. Achieving this goal, however, would require a detailed study of the moment-speed curves of the BLDC motor and their adjustment to flight conditions.
Both designs are able to correctly maintain attitude, but it is definitely easier to achieve greater stability for the quadcopter than the bicopter. This was largely due to the fact that the quadcopter configuration is widely described in the literature and in the hobby community—ready-made PID algorithms, proven controller parameters, and numerous tutorials supporting tuning are available. The objective of this study was not to implement advanced control strategies such as LQR, H∞, or fuzzy logic, as doing so would require fully rewriting or replacing the drone’s firmware. Instead, the focus was placed on the widely used PID controller, which is standard in commercial UAV systems and supported by the INAV platform used in this work. As shown on Figure 11 and Figure 12, the mean deviation for angular speed reading from gyroscope and mean deviation from acceleration for accelerometer are higher for the quadcopter, as this drone has higher reaction time, so the speeds it opposes interferences in are higher, as well as mean deviation. In the case of a bicopter, the need for two servos to tilt the rotors introduced additional degrees of freedom and instabilities. In addition, it is extremely important to select the right servos for a bicopter. Practical tests showed that simple analog SG90 servos with 50 Hz refresh rates proved insufficient at the static test stage, not allowing even a short flight. Similarly, analog, metal MG-90s gave only very short, unstable behavior in the air. Only the use of PowerHD DSM44 digital metal servos with a 330 Hz refresh rate made it possible to achieve satisfactory control precision and enabled stable flight of the bicopter. It follows that the selection of higher-quality servos with less backlash and a high refresh rate is crucial to achieving decent stability. Table 5 summarizes the parameters of the mentioned servos. According to the manufacturer, the selected PowerHD DSM44 digital servo has a stall current of approximately 600 mA at 5 V supply voltage [29]. With two servos installed in the bicopter, this would correspond to a theoretical maximum power consumption of around 6 W, which represents approximately 13% of the total power draw during flight. However, this value reflects a worst-case scenario under continuous full load. In practice, the servos operate under partial load and in short bursts, so their actual contribution to overall energy consumption is expected to be significantly lower. Despite the use of high-performance servos, the bicopter’s design still features some backlash in the tilt mechanism, which makes it even more difficult to accurately select PID settings. The process of calibrating the controllers was mainly done by an empirical method, based on iterative flight tests and manual parameter tuning. This poses a significant limitation, as it forces multiple test flights to achieve the most stable flight with minimal energy consumption.
One of the undoubted advantages of the bicopter is the lower production cost, primarily due to the lower number of BLDC motors (two instead of four) and the need for only two propellers. In the presented design, the difference in the price of the finished drone was about $12 in favor of the bicopter. This cost can be further reduced by using cheaper servos or manufacturing them. Another advantage of the bicopter is the slimmer, elongated shape of the fuselage, which, with the use of an AIO flight controller, makes it possible to significantly reduce the size of the device. The smaller size can be particularly important in indoor applications or where limited space is required.

6. Conclusions

This work provides one of the first physical experimental comparisons between a bicopter and a quadcopter platform in the sub-250 g UAV class. Unlike most prior studies based solely on simulations or larger-scale systems, this paper evaluates real prototypes and their energy use and stability under comparable conditions. Future work will focus on optimizing the bicopter configuration for specific applications and on evaluating alternative control strategies and more advanced flight scenarios. Two main conclusions can be drawn from the considerations presented:
  • Energy consumption: In tests conducted, the quadcopter showed 6–22% lower energy consumption than the bicopter, especially in gusts of wind (Figure 10), although these do not fully reflect actual urban turbulence, which should be taken into account in future tests. The energy efficiency of the bicopter can be improved by using a propulsion system whose highest efficiency is achieved for higher thrusts (those in which flight is performed)
  • Flight stability: The quadcopter provides easier stability due to widely available controller settings and better understood mechanics (Figure 9). Nevertheless, it is possible to configure a stable bicopter. In future work, it is recommended to use servos with the highest possible refresh rate and the lowest possible backlash.
For applications where energy efficiency and stability in variable wind conditions are a priority, a quadcopter is recommended. If minimal cost and compact size while being willing to devote more man-hours to tuning are key, a bicopter with digital servos is a reasonable alternative. In addition, it is noted that there is a possibility of developing this design towards building VTOL tailsitter aircraft or increasing the lifting power in progressive motion by using airfoils on the arms of the bicopter. In addition, bicopters may be preferable in confined environments or low-cost missions, where compactness and simplicity are critical. Quadcopters, offering greater stability, are better suited for general outdoor use and operation in wind. Future work may focus on optimizing each configuration for these specific application scenarios.

Author Contributions

Conceptualization, A.K., M.W., and P.B.; methodology, A.K., M.W., and P.B.; software, M.W.; formal analysis, M.W.; investigation, M.W.; resources, M.W.; data curation, M.W. and P.B.; writing—original draft preparation, M.W.; writing—review and editing, M.W. and P.B.; visualization, M.W.; supervision, A.K. All authors have read and agreed to the published version of the manuscript.

Funding

This research received no external funding.

Data Availability Statement

Dataset available on request from the authors.

Conflicts of Interest

The authors declare no conflicts of interest.

References

  1. Qin, Y.; Xu, W.; Lee, A.; Zhang, F. Gemini: A Compact yet Efficient Bi-Copter UAV for Indoor Applications. IEEE Robot. Autom. Lett. 2020, 5, 3213–3220. [Google Scholar] [CrossRef]
  2. Zhang, Q.; Liu, Z.; Zhao, J.; Zhang, S. Modeling and Attitude Control of Bi-Copter. In Proceedings of the 2016 IEEE International Conference on Aircraft Utility Systems (AUS), Beijing, China, 8–14 October 2016; IEEE: Piscataway Township, NJ, USA, 2016. [Google Scholar]
  3. Li, Y.; Qin, Y.; Xu, W.; Zhang, F. Modeling, Identification, and Control of Non-Minimum Phase Dynamics of Bi-Copter UAVs. In Proceedings of the 2020 IEEE/ASME International Conference on Advanced Intelligent Mechatronics (AIM), Boston, MA, USA, 6–9 July 2020; IEEE: Piscataway Township, NJ, USA, 2020. [Google Scholar]
  4. Hu, A.; Zhao, X.; Xu, D. Modeling and Hovering Control of 5-DoF Tilt-Birotor Robot. In Proceedings of the 2020 16th International Conference on Control, Automation, Robotics and Vision (ICARCV), Shenzhen, China, 13–15 December 2020; IEEE: Piscataway Township, NJ, USA, 2020. [Google Scholar]
  5. Qin, Y.; Chen, N.; Cai, Y.; Xu, W.; Zhang, F. Gemini II: Design, Modeling, and Control of a Compact Yet Efficient Servoless Bi-Copter. IEEE/ASME Trans. Mechatron. 2022, 27, 4304–4315. [Google Scholar] [CrossRef]
  6. Albayrak, O.B.; Ersan, Y.; Bagbasi, A.S.; Turgut Basaranoglu, A.; Arikan, K.B. Design of a Robotic Bicopter. In Proceedings of the 2019 7th International Conference on Control, Mechatronics and Automation (ICCMA), Delft, The Netherlands, 6–8 November 2019; IEEE: Piscataway Township, NJ, USA, 2019. [Google Scholar]
  7. Hrecko, L.; Slacka, J.; Halas, M. Bicopter Stabilization Based on IMU Sensors. In Proceedings of the 2015 20th International Conference on Process Control (PC), Strbske Pleso, Slovakia, 9–12 June 2015; IEEE: Piscataway Township, NJ, USA, 2015. [Google Scholar]
  8. Jadoon, A.N.; Mughees, A.; Ahmad, I.; Sherazi, H.I. Optimal Novel Nonlinear Control Law for Attitude and Heading Control of a Bi-Copter System with Controller-in-Loop. Expert. Syst. Appl. 2025, 272, 126554. [Google Scholar] [CrossRef]
  9. Tolba, M.; Shirinzadeh, B. Generic Modeling and Control of Unbalanced Multirotor UAVs. Aerosp. Sci. Technol. 2022, 121, 107394. [Google Scholar] [CrossRef]
  10. Beliautsou, V.; Beliautsou, A. Prop-Plane—New Convertible VTOL UAV as a Combination of a Longitudinal Bicopter and a Flying Wing with a Tilt-Rotor Powertrain. Aerosp. Sci. Technol. 2024, 155, 109650. [Google Scholar] [CrossRef]
  11. Kumutham, A.R.; Pratihar, D.K.; Deb, A.K. Impact of CoM Placement on Quadcopter’s Performance and Controller Development. In Proceedings of the 2024 36th Conference of Open Innovations Association (FRUCT), Lappeenranta, Finland, 30 October–1 November 2024. [Google Scholar] [CrossRef]
  12. Durán-Delfín, J.E.; García-Beltrán, C.D.; Guerrero-Sánchez, M.E.; Valencia-Palomo, G.; Hernández-González, O. Modeling and Passivity-Based Control for a convertible fixed-wing VTOL. Appl. Math. Comput. 2024, 461, 128298. [Google Scholar] [CrossRef]
  13. He, X.; Wang, Y. Design and Trajectory Tracking Control of a New Bi-Copter UAV. IEEE Robot. Autom. Lett. 2022, 7, 9191–9198. [Google Scholar] [CrossRef]
  14. Abedini, A.; Bataleblu, A.A.; Roshanian, J. Robust Backstepping Control of Position and Attitude for a Bi-Copter Drone. In Proceedings of the 2021 9th RSI International Conference on Robotics and Mechatronics (ICRoM), Tehran, Iran, 17–19 November 2021; IEEE: Piscataway Township, NJ, USA, 2021. [Google Scholar]
  15. Chang, X.-H.; Liu, Y. Robust H Filtering for Vehicle Sideslip Angle With Quantization and Data Dropouts. IEEE Trans. Veh. Technol. 2020, 69, 10435–10445. [Google Scholar] [CrossRef]
  16. Jacewicz, M.; Żugaj, M.; Głębocki, R.; Bibik, P. Quadrotor Model for Energy Consumption Analysis. Energies 2022, 15, 7136. [Google Scholar] [CrossRef]
  17. Olejnik, D.A.; Wang, S.; Dupeyroux, J.; Stroobants, S.; Karasek, M.; De Wagter, C.; de Croon, G. An Experimental Study of Wind Resistance and Power Consumption in MAVs with a Low-Speed Multi-Fan Wind System. In Proceedings of the 2022 International Conference on Robotics and Automation (ICRA), Philadelphia, PA, USA, 23–27 May 2022; IEEE: Piscataway Township, NJ, USA, 2022. [Google Scholar]
  18. Gholami, A.H.; Haeri, M.; Tipi, A.R.D. Experimental Comparison of Thrust Performance of Two Low and Medium-Speed Motors by Wind Tunnels and Obtaining the Flight Time of a Specific Drone. J. Aerosp. Sci. Technol. 2020, 13, 10–17. [Google Scholar]
  19. Laghari, A.A.; Jumani, A.K.; Laghari, R.A.; Nawaz, H. Unmanned Aerial Vehicles: A Review. Cogn. Robot. 2023, 3, 8–22. [Google Scholar] [CrossRef]
  20. Kierzkowski, A.; Dziewoński, B.; Kaliszuk, K.; Kucharski, M. Evaluation of Light Electric Flying-Wing Unmanned Aerial System Energy Consumption During Holding Maneuver. Energies 2025, 18, 1300. [Google Scholar] [CrossRef]
  21. Hong, T.-K.; Lin, C.-Y.; Lin, H.-J.; Ruseno, N. Taiwan Solar-Powered UAV Flight Endurance Record. Drone Syst. Appl. 2024, 12, 1–14. [Google Scholar] [CrossRef]
  22. Lin, C.; Lin, T.; Liao, W.; Lan, H.; Lin, J.; Chiu, C.; Danner, A. Solar Power Can Substantially Prolong Maximum Achievable Airtime of Quadcopter Drones. Adv. Sci. 2020, 7, 2001497. [Google Scholar] [CrossRef] [PubMed]
  23. Silvestro, S. Optimization of an Ultralight Autonomous Drone for Service Robotics. Doctoral Dissertation, Politecnico di Torino Politecnico di Torino, Turin, Italy, 2019. [Google Scholar]
  24. Adami, A.; Fregonese, L.; Gallo, M.; Helder, J.; Pepe, M.; Treccani, D. Ultra light UAV systems for the metrical documentation of cultural heritage: Applications for architecture and archaeology. Int. Arch. Photogramm. Remote Sens. Spat. Inf. Sci. 2019, XLII-2/W17, 15–21. [Google Scholar] [CrossRef]
  25. Putsep, K.; Rassolkin, A. Methodology for Flight Controllers for Nano, Micro and Mini Drones Classification. In Proceedings of the 2021 International Conference on Engineering and Emerging Technologies (ICEET), Istanbul, Turkey, 27–28 October 2021; IEEE: Piscataway Township, NJ, USA, 2021. [Google Scholar]
  26. Valavanis, K.P.; Vachtsevanos, G.J. Handbook of Unmanned Aerial Vehicles; Springer: Berlin/Heidelberg, Germany, 2014. [Google Scholar]
  27. Mandal, J.K. Z-Transform-Based Reversible Encoding; Springer: Berlin/Heidelberg, Germany, 2020. [Google Scholar]
  28. Available online: https://flywoo.net/products/nin-2104-ultralight-fpv-motor-1750kv-3000kv-silver (accessed on 1 June 2025).
  29. Available online: https://www.pololu.com/product/2142/resources (accessed on 1 June 2025).
Figure 1. Quadcopter movement.
Energies 18 03728 g001
Figure 2. Bicopter movement. Darker color means that propeller is closer to observer from above.
Energies 18 03728 g002
Figure 3. Propeller drive unit rotation mechanism made from PLA+.
Energies 18 03728 g003
Figure 4. Finished, built, and configured structures of (a) bicopter and (b) quadcopter.
Energies 18 03728 g004
Figure 5. Dimensions of the test field for both test structures. The test field had the dimensions of a 1 m × 1 m square with a smaller square inside (0.5 m × 0.5 m).
Energies 18 03728 g005
Figure 6. Block diagram of PID controller for discrete system.
Energies 18 03728 g006
Figure 7. Dependence of energy consumption with thrust for the tested motor with different voltages and propellers.
Energies 18 03728 g007
Figure 8. Position test of (a) bicopter and (b) quadcopter. Red dots indicate the drone’s location.
Energies 18 03728 g008
Figure 9. Position test of (a) bicopter and (b) quadcopter with marked positions on axes, mean position, and mean deviation. Blue dots indicate the drone’s position over the test field.
Energies 18 03728 g009
Figure 10. Graph of energy consumption for both structures in static test and with wind.
Energies 18 03728 g010
Figure 11. Graph of mean absolute deviation for angular speed reading from gyroscope.
Energies 18 03728 g011
Figure 12. Graph of mean absolute deviation from acceleration for accelerometer reading.
Energies 18 03728 g012
Table 1. Summary of characteristics of the analyzed UAVs.
ComponentBicopterQuadcopter
Engine2x EX1404 3500 kv4x EX1404 3500 kv
Servo2x PowerHD DSM44none
Flight controllerSpeedybee f405 wing miniSpeedybee f405 AIO
Optical flowmatek 3901-L0Xmatek 3901-L0X
Battery3s 1300 mAh 100C3s 1300 mAh 100C
Weight231 g233 g
Dimensions (no propellers) [mm]140 × 200 × 72125 × 125 × 55
Dimensions (with propellers) [mm]140 × 270 × 72215 × 215 × 55
Table 2. Cost of individual components.
Units per Configuration
ComponentModelSingle Unit CostBicopterQuadcopter
BLDC motorHappymodel EX1404 3500 Kv$1524
PropellerGemfan 4024$0.5024
ServoPowerHD DSM44$1120
Flight controllerMicoAir743-AIO-35 A$6011
Optical flow sensormatek 3901-L0X$3511
BatteryLi-Pol 3s 1300 mAh CNHL$1411
ReceiverFrSky Xm+$2511
Table 3. PID controller settings for bicopter and quadcopter.
BicopterQuadcopter
RollPitchYawRollPitchYaw
K p 6590100404045
K i 75105110757580
K d 3060023230
Table 4. List of all the parameters determined for bicopter and quadcopter in both tests.
BicopterQuadcopter
No WindWindNo WindWind
Mean power [W]46.5649.5643.8940.40
Power standard deviation [W]0.514.371.213.43
Power variation [W]0.2619.091.4611.76
Position x mean deviation [cm]20.98 10.76
Position y mean deviation [cm]17.727.94
Gyroscope mean deviation [deg/s]0.220.240.300.34
Accelerometer mean deviation [g]0.060.060.060.08
Table 5. Servo parameters.
ModelTypeQualityGearFrequencyWeightTorqueSpeed
SG90AnalogLowPlastic50 Hz9 g0.177 Nm0.1 s/60°
MG-90AnalogMediumMetal50 Hz13.5 g0.177 Nm0.1 s/60°
DSM44DigitalHighMetal330 Hz6 g0.117 Nm0.09 s/60°
Disclaimer/Publisher’s Note: The statements, opinions and data contained in all publications are solely those of the individual author(s) and contributor(s) and not of MDPI and/or the editor(s). MDPI and/or the editor(s) disclaim responsibility for any injury to people or property resulting from any ideas, methods, instructions or products referred to in the content.

