Article

A Comparative Study of Customized Algorithms for Anomaly Detection in Industry-Specific Power Data

Department of Computer Engineering, Hanbat National University, Daejeon 12613, Republic of Korea
*
Author to whom correspondence should be addressed.
Energies 2025, 18(14), 3720; https://doi.org/10.3390/en18143720
Submission received: 21 June 2025 / Revised: 9 July 2025 / Accepted: 11 July 2025 / Published: 14 July 2025
(This article belongs to the Special Issue Machine Learning in Renewable Energy Resource Assessment)

Abstract

This study compares and analyzes statistical, machine learning, and deep learning outlier-detection methods on real power-usage data from the metal, food, and chemical industries to propose the optimal model for improving energy-consumption efficiency. In the metal industry, a Z-Score-based statistical approach with threshold optimization was used; in the food industry, a hybrid model combining K-Means, Isolation Forest, and Autoencoder was designed; and in the chemical industry, the DBA K-Means algorithm (Dynamic Time Warping Barycenter Averaging) was employed. Experimental results show that the Isolation Forest–Autoencoder hybrid delivers the best overall performance, and that DBA K-Means excels at detecting seasonal outliers, demonstrating the efficacy of these algorithms for smart energy-management systems and carbon-neutral infrastructure

1. Introduction

In the Fourth Industrial Revolution era, rising energy consumption and the resulting increase in carbon emissions are accelerating global warming, making the achievement of carbon neutrality a top global priority [1]. Because electricity accounts for a very large share of total energy use—and the industrial sector represents a significant portion of that—systematic energy savings based on robust power data management are especially critical in industry [2]. In this context, energy-management platforms that originated in the United States, such as Green Button, have attracted attention as key tools for carbon reduction [3]. Green Button enables energy consumers to monitor their real-time usage and receive insights into their consumption patterns; when adopted in industrial processes, it can reduce greenhouse gas emissions and energy costs by optimizing electricity use. However, the massive volumes of power data generated in industrial settings often include outliers caused by various environmental factors or abnormal operations, and these outliers can undermine the reliability and efficiency of energy management [4]. Numerous prior studies have already reported outlier-detection techniques tailored to the characteristics of real industrial data. While most existing studies focus on analyzing the characteristics of a single industry, there is a notable lack of research that provides a cross-sectoral comparative analysis of outlier-detection strategies. This narrow focus limits the generalizability of findings and overlooks the potential for developing integrated energy-management strategies. Building on this background, our research addresses this gap by applying customized outlier-detection techniques to power-usage data from the metal, chemical, and food industries, and quantitatively comparing each method’s performance. By doing so, we aim to propose a more generalized and robust strategy for industrial outlier detection.
The main contributions of this work are as follows. For the metal industry’s power data, we employ the traditional statistical Z-Score method to detect outliers and propose an optimization strategy that adjusts the detection threshold so that the proportion of normal data matches a weighted average of expected normality. In the food industry, we design two hybrid models that combine clustering and deep learning: one applies an Autoencoder after K-Means clustering, and the other removes outliers with Isolation Forest before training an Autoencoder. We compare the outlier-detection performance of these two approaches [5,6,7]. For the chemical industry’s power data, we introduce an outlier-detection methodology based on DTW-Barycenter-Averaging K-Means (DBA K-Means), which accounts for temporal distortions in time-series data. Drawing on the Euclidean-mapping and DTW-mapping schemes illustrated in Figure 1a,b, our algorithm finds the optimal alignment path between time series via DTW and computes a central pattern via barycenter averaging, enabling time-aware outlier detection. Through these approaches, we enhance both the accuracy and efficiency of industrial power data analysis and outlier detection, thereby supporting carbon-neutral goals and advances in energy-management technology [8,9].

2. Related Work

2.1. Overview of Outlier-Detection Techniques

Outlier-detection techniques identify abnormal data points within a dataset. Methods range from traditional statistical approaches to machine learning and deep learning algorithms. Improving the accuracy and efficiency of outlier detection requires first understanding a dataset’s structural and statistical characteristics, then selecting and applying the most appropriate algorithm. In this study, we analyze the characteristics of industrial power-usage data and apply optimal algorithms to detect outliers.

2.1.1. Traditional Statistical-Based Methods

Statistical methods assume that data follow a known distribution (e.g., normal distribution) and use metrics such as the mean and standard deviation to flag outliers. A representative example is the Z-Score method, which measures how many standard deviations each sample lies from the mean. Because its computational complexity is only O(n), it can be applied quickly even to very large datasets. The advantages of statistical methods include ease of implementation and clear detection criteria; however, their performance degrades when data do not follow the assumed distribution or exhibit strong temporal correlations. To address the limitations of single-metric approaches, some studies have combined multiple statistical measures for time-series outlier detection.

2.1.2. Machine Learning and Deep Learning-Based Methods

Machine learning and deep learning methods do not require a prior assumption about data distribution; instead, models learn normal patterns from the data and identify deviations as outliers. Among machine learning approaches, clustering algorithms (e.g., K-Means) group data points and label those lying far from any cluster center as outliers. Ensemble methods such as Isolation Forest build randomized decision trees and consider samples that become isolated with few splits as anomalies. Autoencoders—a deep learning technique—compress inputs into a low-dimensional “latent” space and then reconstruct them; samples with large reconstruction errors are flagged as outliers in an unsupervised manner. These ML/DL methods capture complex patterns and have been applied successfully in areas such as manufacturing-process monitoring and sensor-data anomaly detection. For example, convolutional-clustering models have detected anomalies in time-series sensor streams, and hybrid Isolation Forest + deep-Autoencoder models have been used on industrial production data. In smart-metering systems integrated with battery storage or EV charging, anomaly-detection techniques have improved energy-management efficiency. In steel-making processes, combining Isolation Forest with Autoencoder models has demonstrated the potential for industrial-energy-data outlier detection. However, ML/DL methods often require substantial computation time and resources to train on large datasets and demand careful hyperparameter tuning. To mitigate these drawbacks, recent research has focused on hybridizing statistical approaches with ML/DL or assembling multiple algorithms to boost both accuracy and efficiency.

2.1.3. Case Studies of Industrial Power Data Analysis

To understand power-consumption patterns and anomalies across industry sectors, several studies have analyzed energy data by sector. One study used the Log Mean Divisia Index (LMDI) decomposition to examine drivers of power-consumption changes in the overall and manufacturing industries nationwide; it found that while expanded production and shifts in industrial structure increased consumption, improvements in efficiency also had a measurable effect [10]. Within manufacturing, increased output drove higher consumption, but the transition toward high-value-added sub-sectors led to some consumption reductions [11]. Another study classified power-usage characteristics according to the Korean Standard Industrial Classification (KSIC) and applied time-series forecasting to data from energy-intensive industries, suggesting methods to inform future demand-management strategies [12].
These previous works have primarily focused on quantifying or predicting consumption patterns by industry. From an outlier-detection perspective, however, it is crucial to detect abnormal patterns early in each industrial process to improve energy efficiency and reduce operational risk. With the spread of smart-factory and advanced energy-management systems, there is growing demand for real-time anomaly detection and response in operational settings.

2.1.4. Study Objectives and Contributions

Building on this background, our research applies domain-knowledge-driven outlier-detection techniques to power-usage data from the metal, chemical, and food industries, and quantitatively compares each method’s performance. Whereas existing studies have tended to focus on a single sector or technique, our work empirically evaluates multiple algorithms across several industries to propose a more generalizable strategy for industrial outlier detection.
In this study, we developed outlier-detection models tailored to the characteristics of three industry sectors—metal, food, and chemical—using their power-consumption data. We first review the scope of data collection and the key features of each industry’s dataset, and then describe in detail the outlier-detection algorithms applied to each sector and how they are configured.

3. Methodology

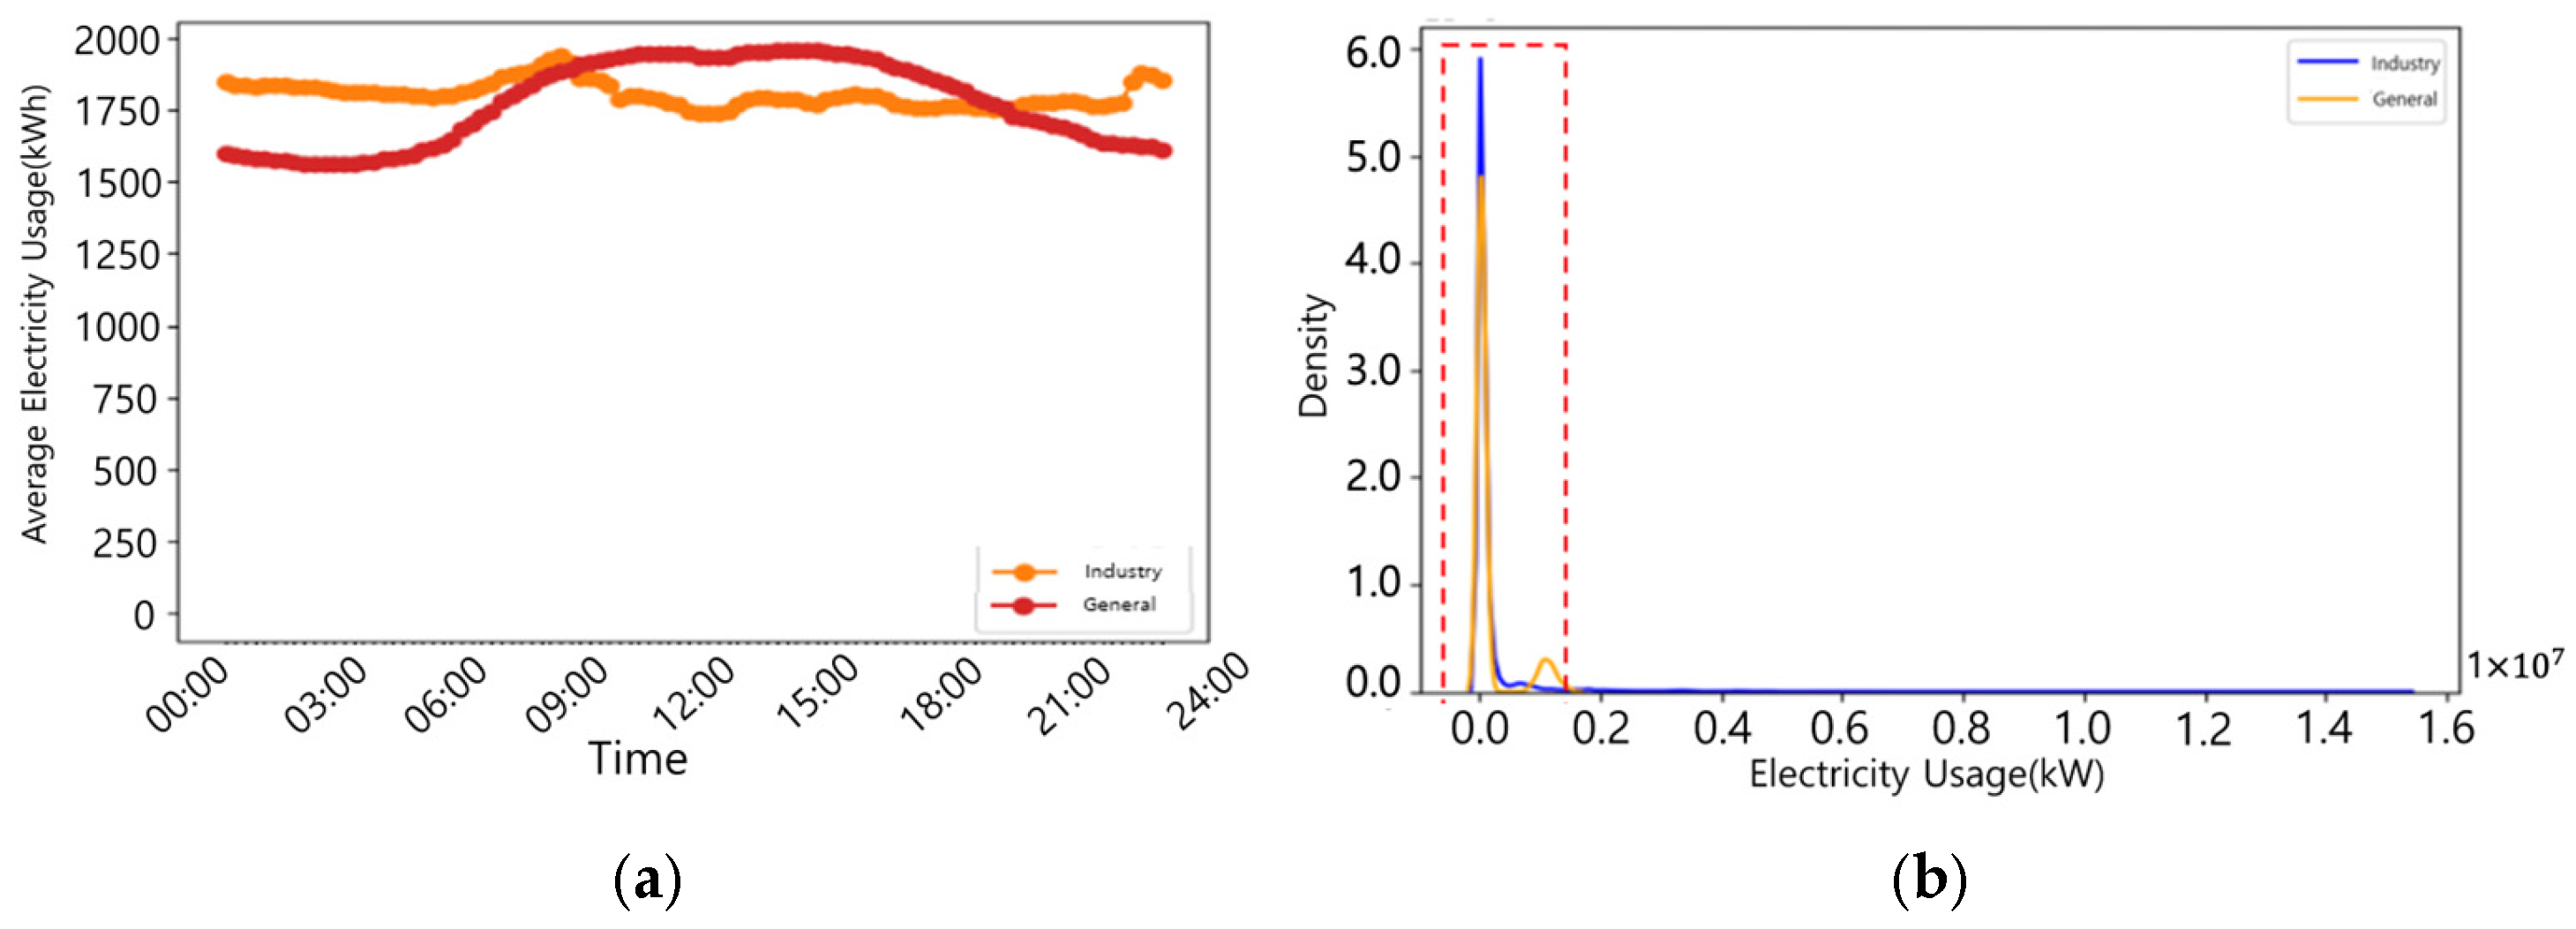
3.1. Dataset Composition and Characteristics

The power-usage data used in this study consist of 15 min interval measurements recorded from January 2020 through December 2022. However, the utilization period was adjusted by industry: for the metal and food sectors, we used only the 2022 data, whereas for the chemical sector we employed the full three-year span (2020–2022) to capture longer-term seasonal trends. The datasets used in this study contain proprietary industrial power-consumption data and cannot be made publicly available due to confidentiality agreements. However, the detailed methodology, preprocessing steps, and model parameters provided in this paper are intended to ensure that the experiments can be reproduced on comparable time-series datasets.
As shown in Figure 2, the metal-industry dataset is divided by end-use: industrial, general, nighttime, and agricultural. These categories account for approximately 98.2%, 1.6%, 0.1%, and 0.1% of total consumption, respectively, confirming the overwhelming dominance of industrial power. Actual usage likewise peaks in the industrial category. During preprocessing, the three primary categories (excluding agricultural) contained daily missing values and occasional outliers. Because nighttime data are collected only between 22:00 and 08:00, all other time slots were marked as missing to enable consistent day-to-day comparisons. We removed days with predominantly missing or solely outlier values, then imputed remaining gaps by averaging the same timestamp on the previous and following days. For outlier detection, we analyzed each end-use category separately, and compared daily power-usage patterns based on the mean total consumption in the metal sector.
In Figure 3, the food-industry data exhibit pronounced weekday–weekend differences: weekday consumption is higher, reflecting production-activity variations. For the food-industry data, missing values (NaN), which often result from measurement errors, were imputed using the forward-fill method. This approach, which carries the last valid observation forward, is appropriate since power-consumption changes continuously over time [13]. Furthermore, to account for distinct consumption patterns, the data were categorized using seasonal (spring, summer, fall, winter) and weekly (weekday, weekend) tags based on the date of each data point. This allowed for a more granular analysis of operational characteristics. Finally, we applied Min–Max normalization to rescale all values into the [0, 1] range to handle scale disparities between different time intervals. Anticipating that certain series would share similar patterns, we performed clustering to group like-behaving time series before applying anomaly-detection models. By fitting each cluster with its own detector, we achieved more precise detection across heterogeneous usage patterns.
Figure 4 illustrates how the chemical-industry data were prepared to highlight seasonal effects. We first extracted only weekday data—excluding weekends and holidays—to focus on active production days. We then plotted average consumption curves for summer versus winter, finding that both seasons peak between 12:00 and 15:00, with winter showing a notably higher spike due to increased heating and process-heating demands. To concentrate our analysis, we selected the 12:00–15:00 segment as the representative time series for anomaly detection. In the chemical-industry dataset, any rows with missing values were removed entirely. This was based on the assumption that the data were Missing Completely at Random (MCAR), where the data loss is unrelated to other variables [14]. For normalization, we applied TimeSeriesScalerMeanVariance, which standardizes each time point independently. This method preserves the characteristics of the time series by maintaining the pattern at each point, transforming each data point using a Z-Score approach so that the entire sequence has a standard deviation of approximately ±2. This was crucial for eliminating seasonal mean shifts while emphasizing fluctuation patterns.
To quantitatively validate the assumption that the power-consumption patterns of the three industries are fundamentally different, we performed a two-sample Kolmogorov–Smirnov (K-S) test on the entire time-series data distributions for each pair of industries. The test yielded a K-S statistic of 0.8031 for Chemical vs. Food, 0.5262 for Chemical vs. Metal, and 0.5416 for Food vs. Metal. In all comparisons, the p-value was effectively 0. This result provides clear statistical evidence that the power-consumption distributions of the three industries are significantly different from one another. This finding establishes a strong justification for the approach taken in this study—designing and applying customized anomaly-detection algorithms tailored to the unique characteristics of each industry, rather than relying on a single, generalized model.

3.2. Comparison and Application of Outlier-Detection Algorithms

3.2.1. Z-Score-Based Outlier Detection

For the metal-industry dataset, we applied the Z-Score method to identify outliers. The Z-Score quantifies how many standard deviations each data point lies from the mean; typically, any observation whose absolute Z-Score exceeds a predefined threshold is deemed an outlier. Formally, the Z-Score Z is defined as
i f           Z = X μ σ > T h r e s h o l d A n o m a l y
In the case of metal-industry data, as noted above, the proportions of data by usage are highly imbalanced, so applying a single threshold across the entire dataset can lead to outliers being concentrated in a particular usage class (e.g., industrial). To address this, we introduced the concept of a weighted expected ratio to optimize the threshold. The expected ratio for a given threshold is defined as the proportion of data classified as normal when that threshold is applied, mathematically expressed as
E x p e c t e d   R a t i o = 1 N u m b e r   o f   O u t l i e r s   D e t e c t e d T o t a l   N u m b e r   o f   D a t a   P o i n t s
W e i g h t e d   A v e r a g e   E x p e c t e d   R a t i o = i = 1 n k i k t o t a l × E x p e c t e d   R a t i o i  
= i = 1 n k i k t o t a l × 1 N u m b e r   o f   O u t l i e r s i k i
where n is the number of usage categories, and k1, k2, k3, k4 are usage of general, industrial, nighttime, agricultural, respectively. That is, by multiplying each usage category’s normal data ratio by that category’s share of the dataset and summing, we obtain an overall normal-ratio that reflects the underlying class imbalance. Our proposed threshold-optimization method then varies the threshold to find the point at which the difference between the expected ratio and the weighted average expected ratio is minimized. Selecting that point as the optimal threshold aligns the overall normal-classification rate with the usage-weighted normal rate, thereby minimizing the bias introduced by class imbalance.

3.2.2. K-Means–Autoencoder Hybrid Mode

For the food-industry power-consumption data, we first apply K-Means clustering with K clusters, pre-classifying as outliers any points that lie far from their cluster centroids. We determine the optimal K via the Elbow method, then perform clustering: points at large distances from their centroids are marked as anomalies. We exclude those detected outliers and use only the remaining normal data to train the Autoencoder, ensuring it learns the genuine normal-operation patterns effectively.

3.2.3. Isolation Forest–Autoencoder Hybrid Model

The second hybrid approach combines Isolation Forest (IF) with an Autoencoder. In the preprocessing stage, IF isolates and removes anomalies before Autoencoder training. IF is an unsupervised algorithm that recursively partitions the data—based on random-forest principles—so that samples easily separated from the bulk of the data are labeled as outliers. Its main hyperparameter, contamination, specifies the fraction of the dataset expected to be anomalous. We vary contamination to adjust the removal rate and select the value yielding the best downstream performance. For example, setting contamination = 0.10 excludes the top 10% of points deemed anomalous. Training the Autoencoder only on the remaining normal data enables it to concentrate on reconstructing genuine patterns. In the final detection step, we flag points with high reconstruction loss as anomalies, since normal points are reconstructed with low error while anomalies incur substantially larger loss.

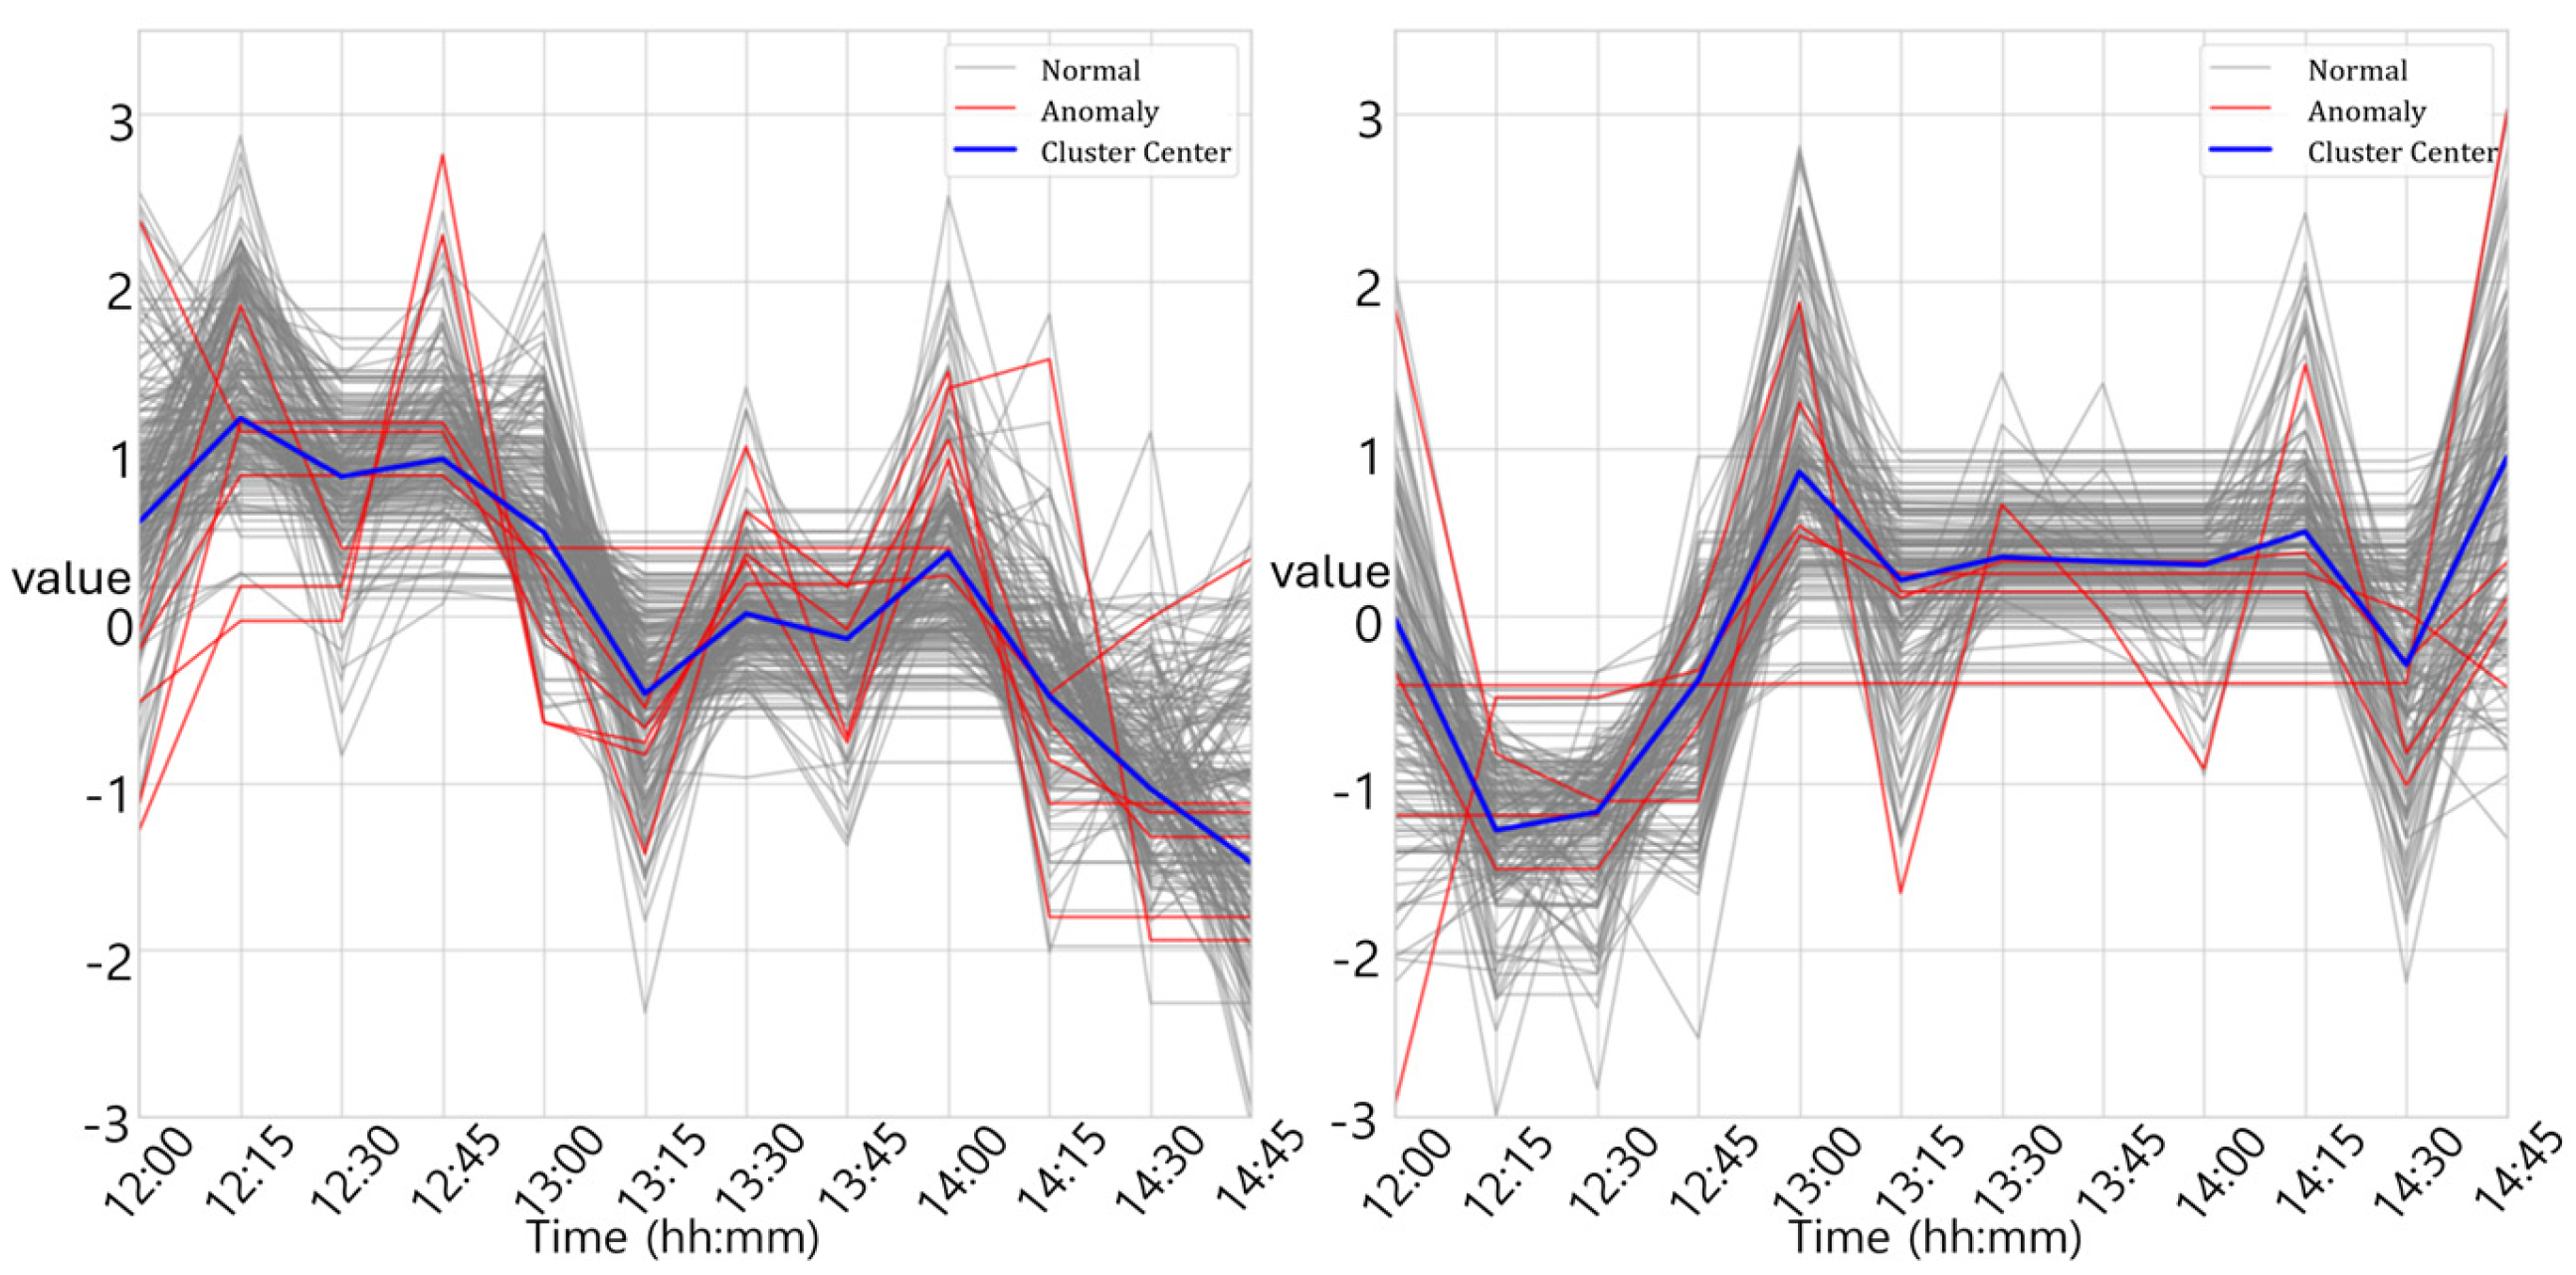
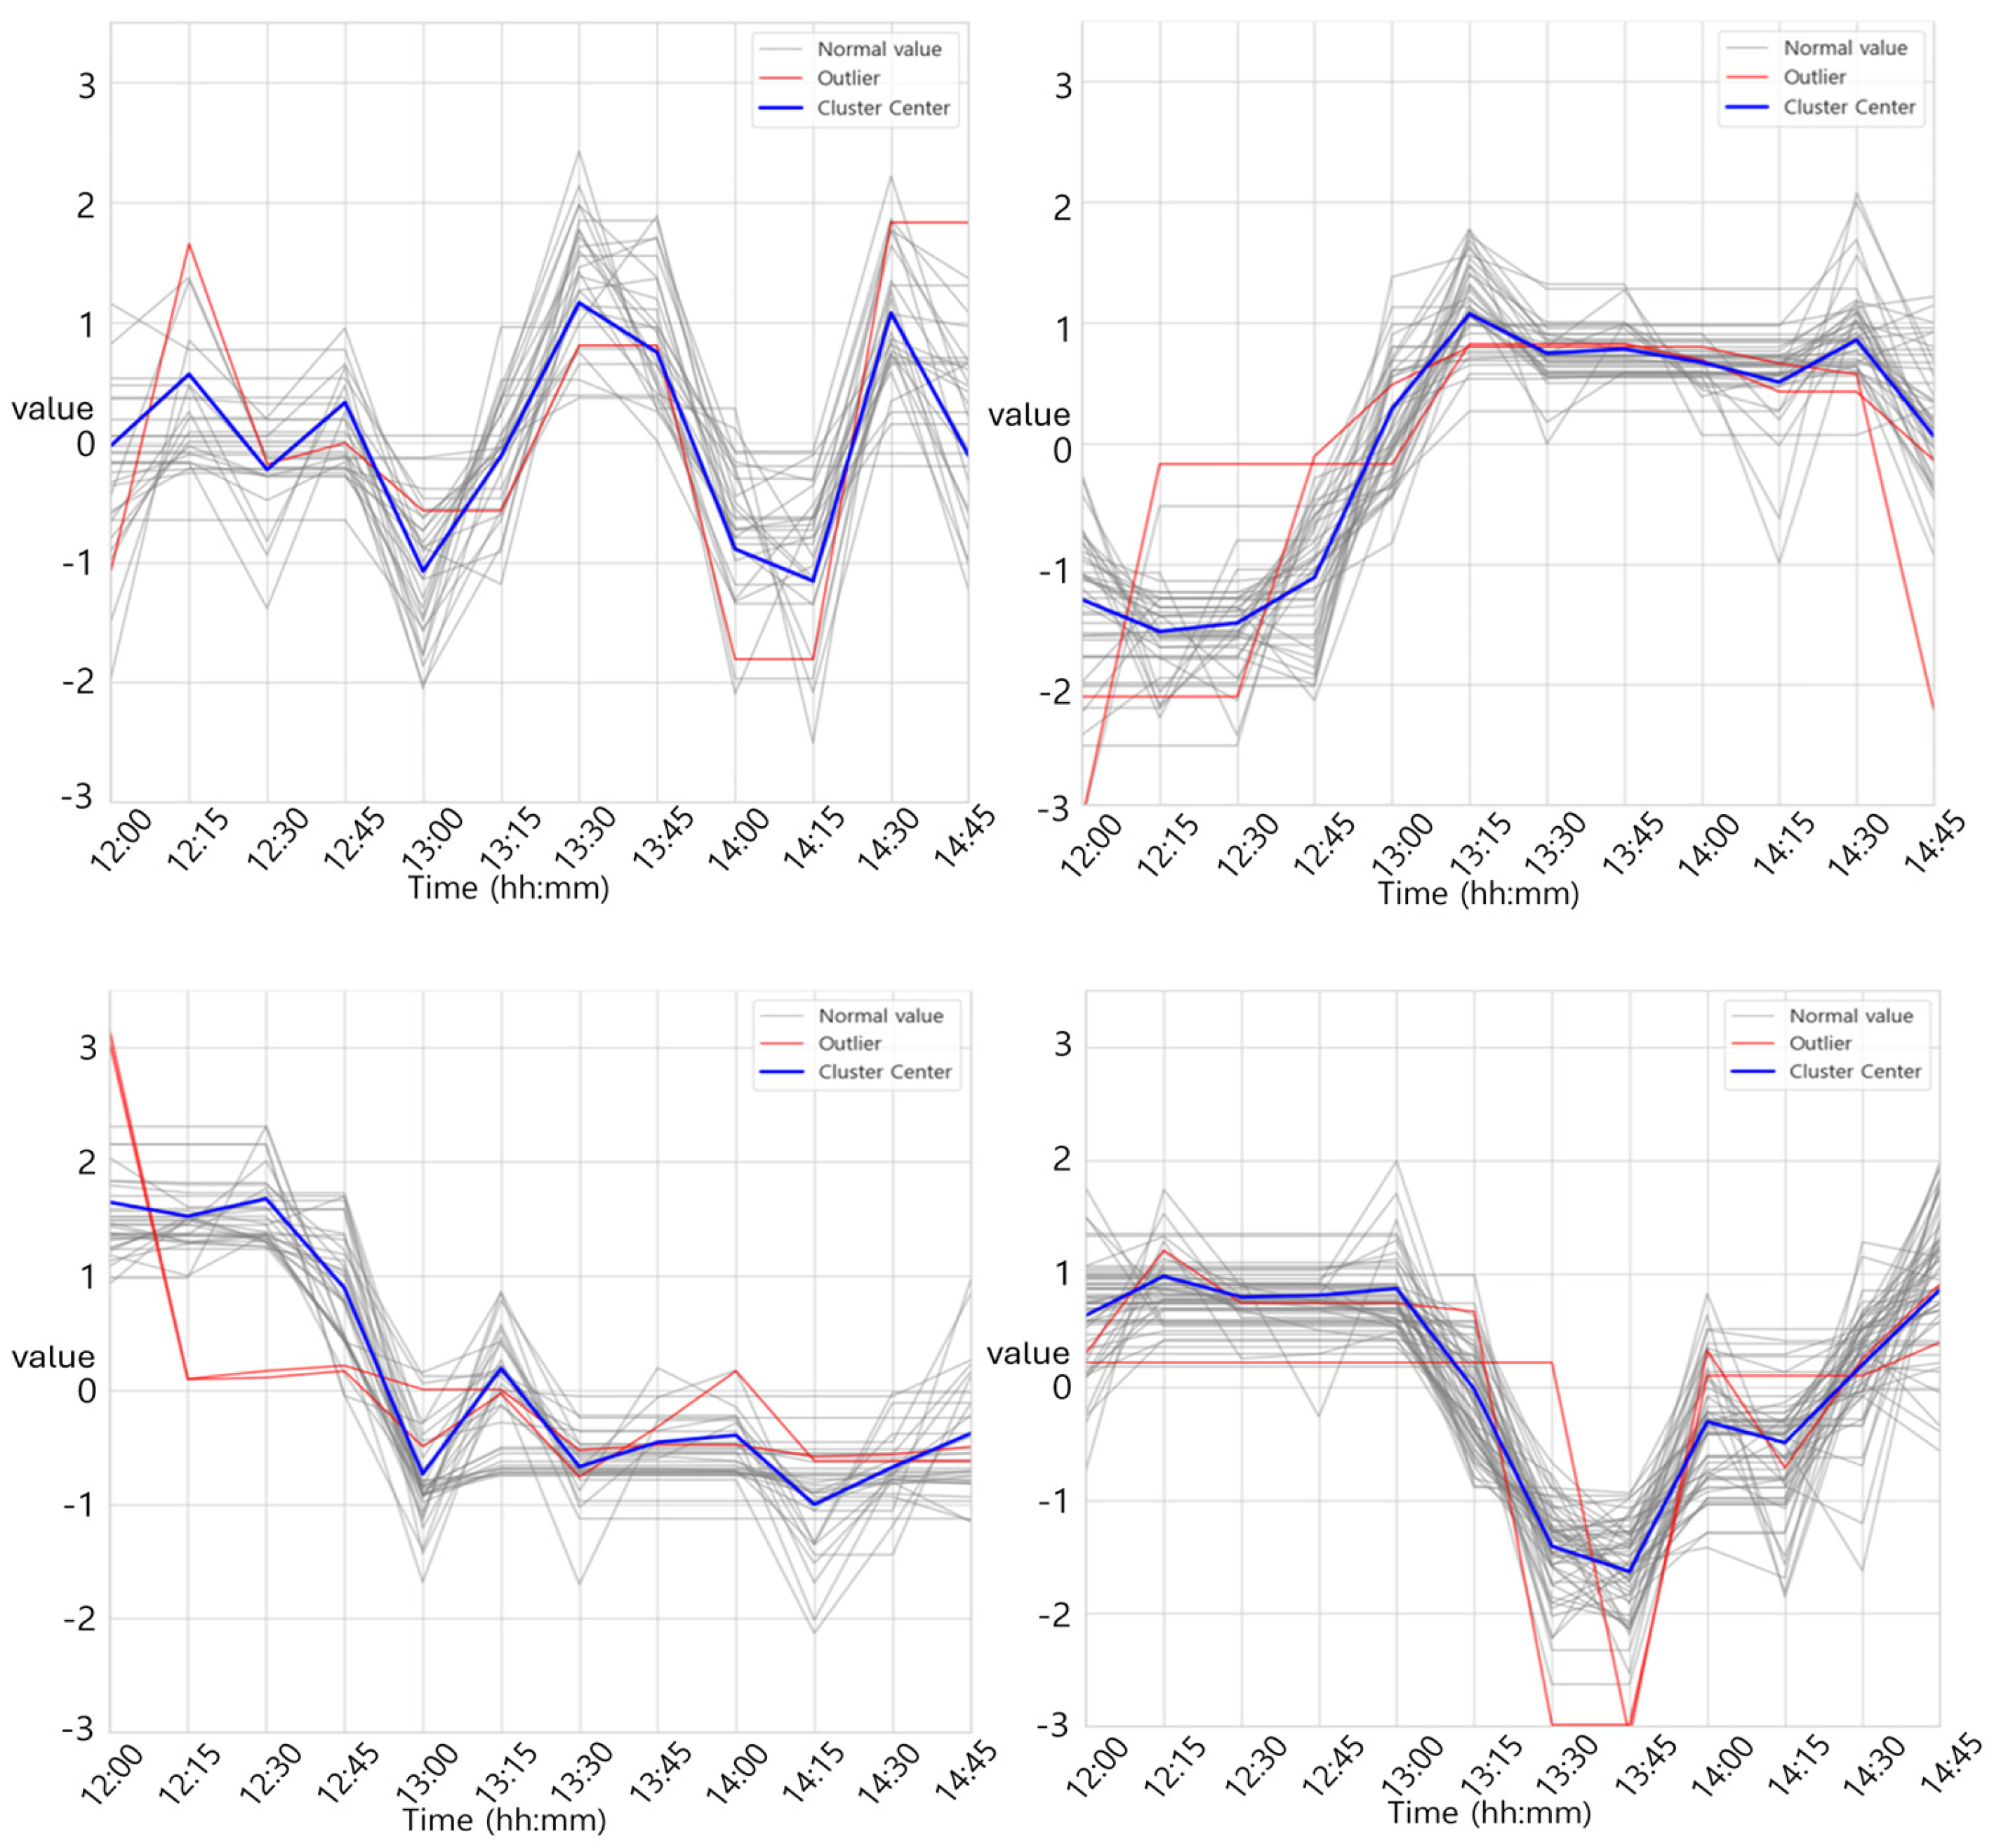
3.2.4. Application of DBA K-Means Clustering

For the standardized power-consumption data from the chemical industry, we apply the DBA K-Means clustering algorithm. A key hyperparameter for this algorithm is the number of clusters, which we determined by selecting the value that maximized the silhouette score. To improve clustering efficiency, we used the K-Means++ technique for initialization [15] and set the number of iterations for barycenter computation to three, balancing cluster cohesion with convergence speed. Given that DTW has a time complexity of O(n2), we leveraged parallel processing by setting n_jobs = −1 to utilize all available CPU cores. Further details on all hyperparameters are available in Appendix A.
D A i ,   B j = δ a i ,   b j + min D A i 1 ,   B j 1 D A i ,   B j 1   D A i 1 ,   B j
where the subsequence of the first i elements of sequence A (and similarly for Bj), is the accumulated distance between those subsequences, and is the point-wise distance at time step i of A and j of B.
By optimizing this path, DBA aligns the temporal patterns before averaging, yielding centroids that capture complex, time-warped features. Unlike the Euclidean-distance K-Means, DBA K-Means delivers robust clustering performance on data with nonlinear temporal distortions.

3.3. Threshold Optimization and Evaluation Metrics

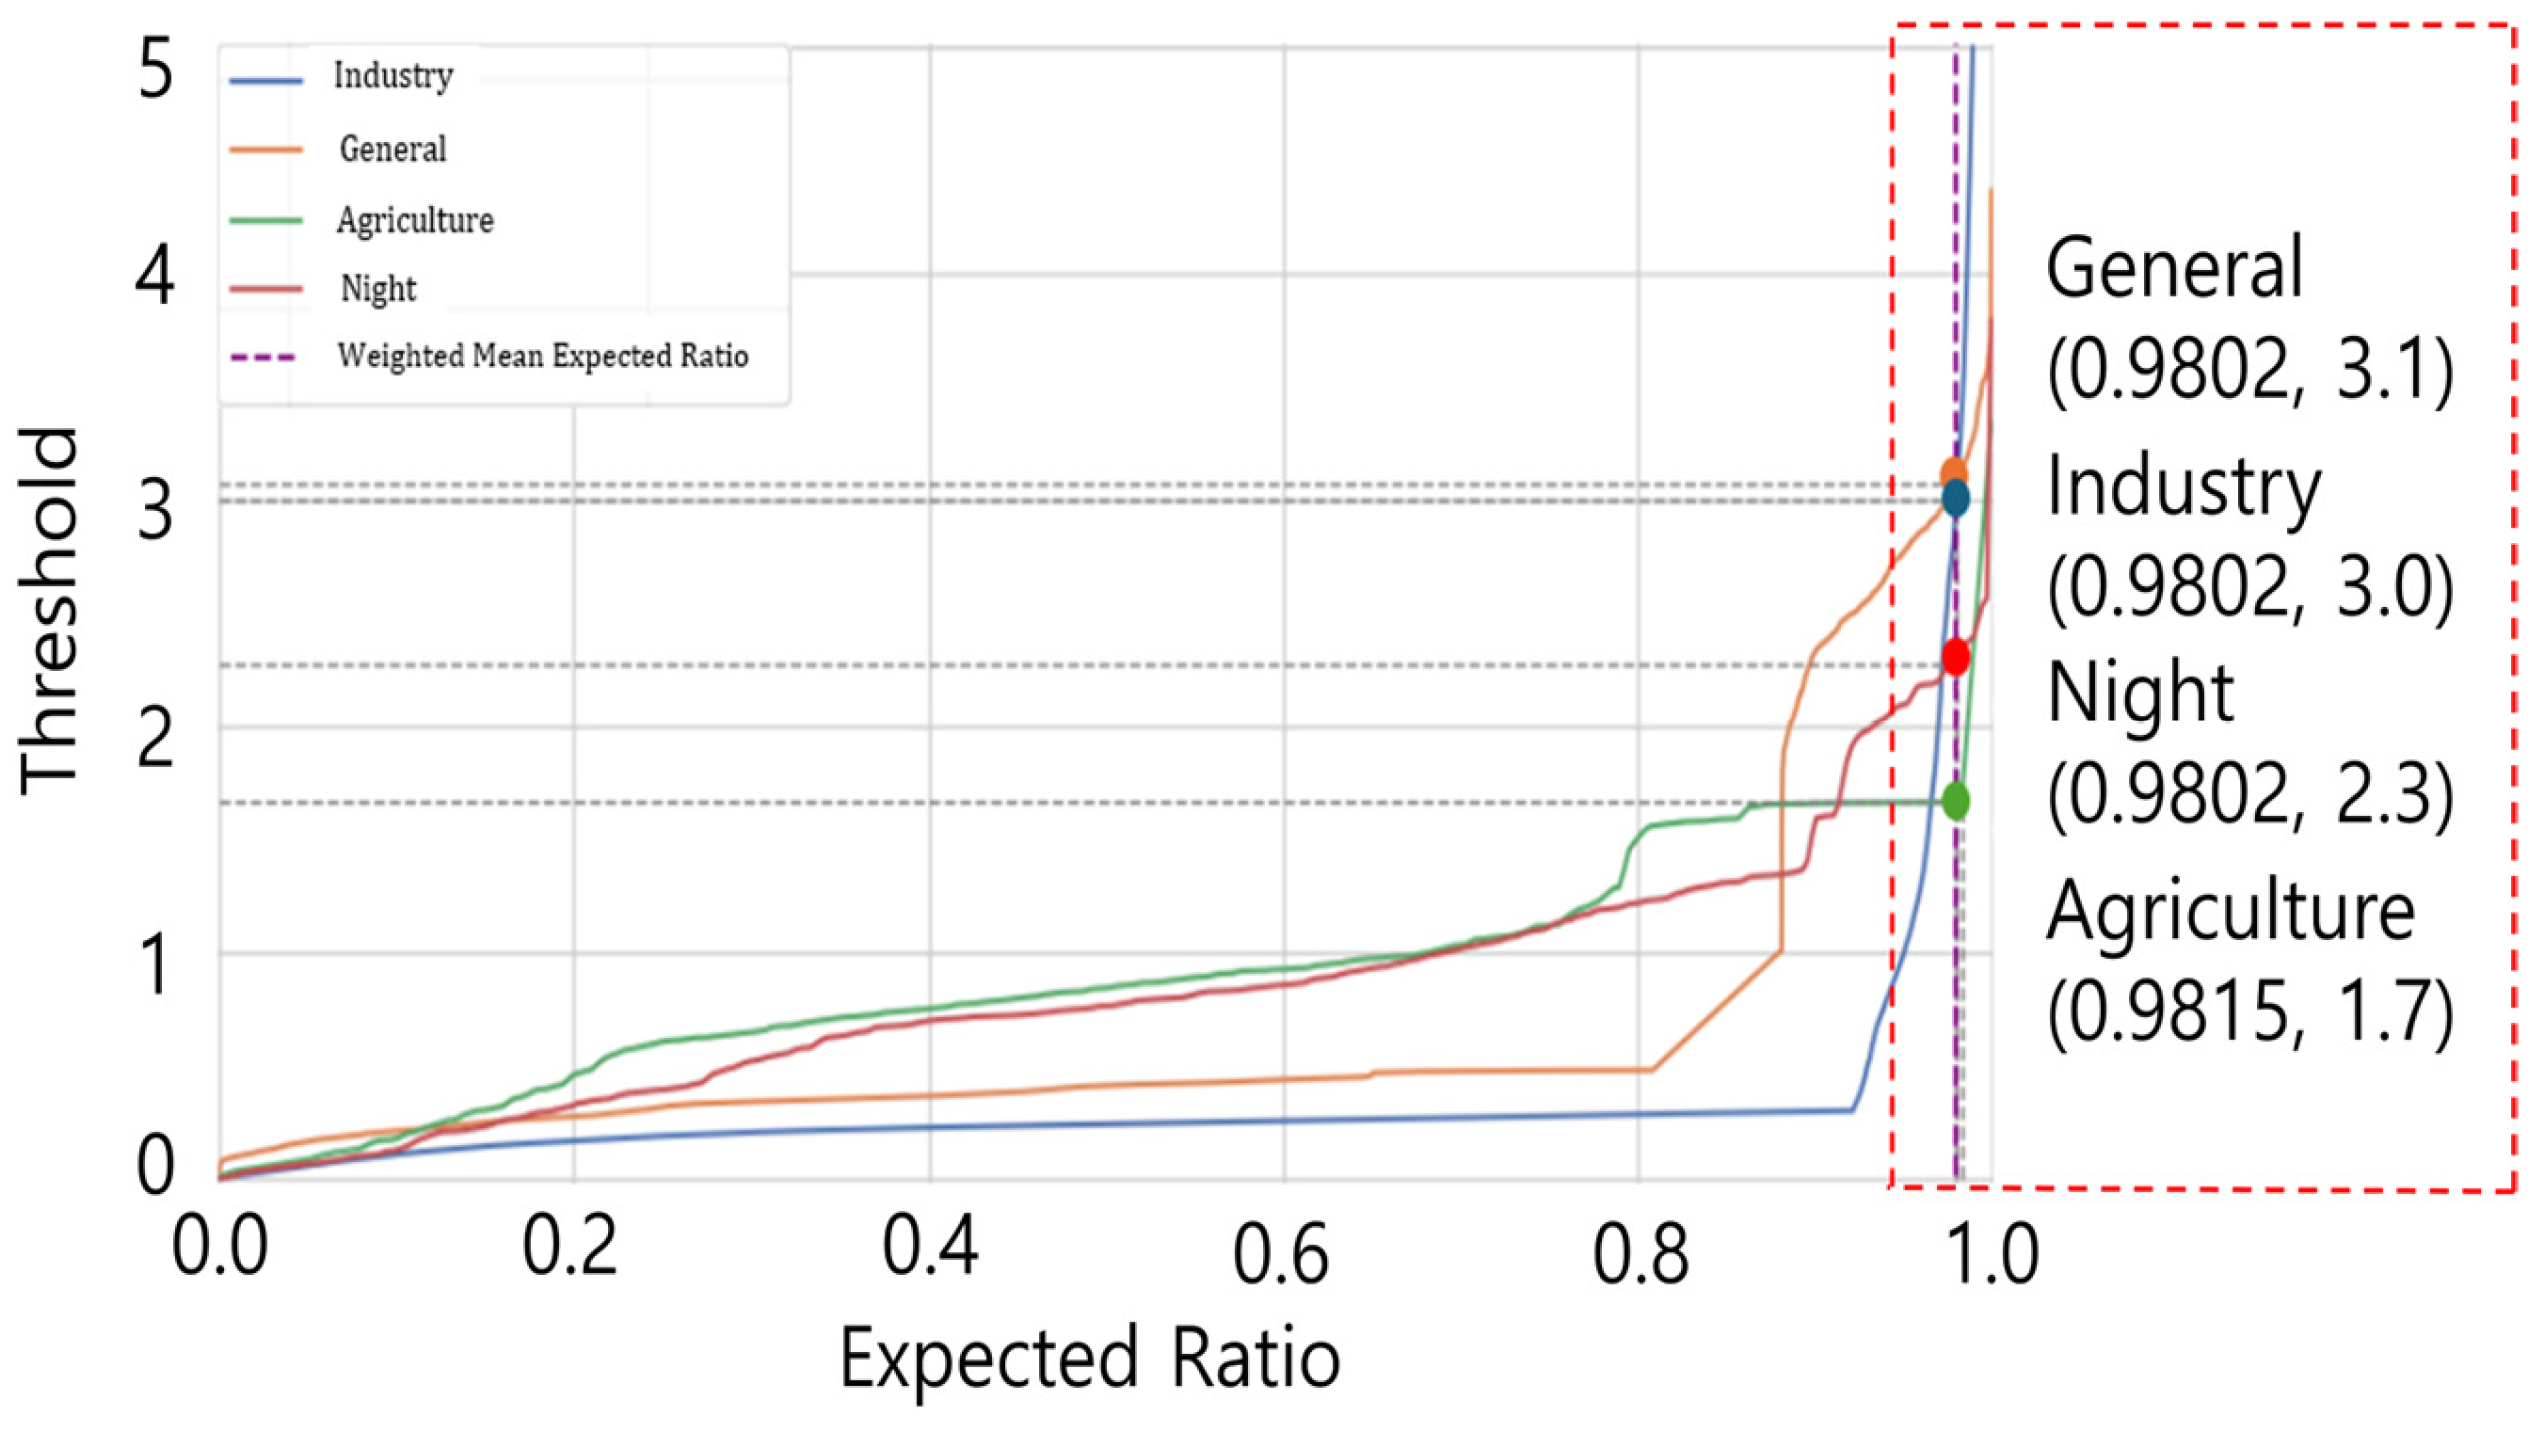
3.3.1. Z-Score Application

For the metal-industry dataset, we set the Z-Score threshold to 3 and compared the distribution and proportion of detected outliers. When applied to the entire power-consumption dataset, all outliers are detected in the industrial-usage class (Figure 5). However, when the data are separated by usage category, outliers appear as red markers in both the industrial (Figure 6a) and general (Figure 6b) classes. These results indicate that the imbalance in distribution and proportion across usage categories affects the choice of threshold. We therefore focus on adjusting the threshold according to each category’s data proportion to optimize the Z-Score threshold for the metal-industry dataset.

3.3.2. Contamination Optimization Method

In the food-industry dataset, the Isolation Forest parameter contamination represents the expected proportion of outliers. To identify the optimal value, we varied contamination from 0.05 to 0.20 and compared the resulting detection performance using the Area Under the Curve (AUC) as the primary evaluation metric. Through this process, we identified that contamination = 0.05 delivered the highest AUC, as detailed in our results (Table 1), and thus selected it to maximize outlier-detection accuracy.

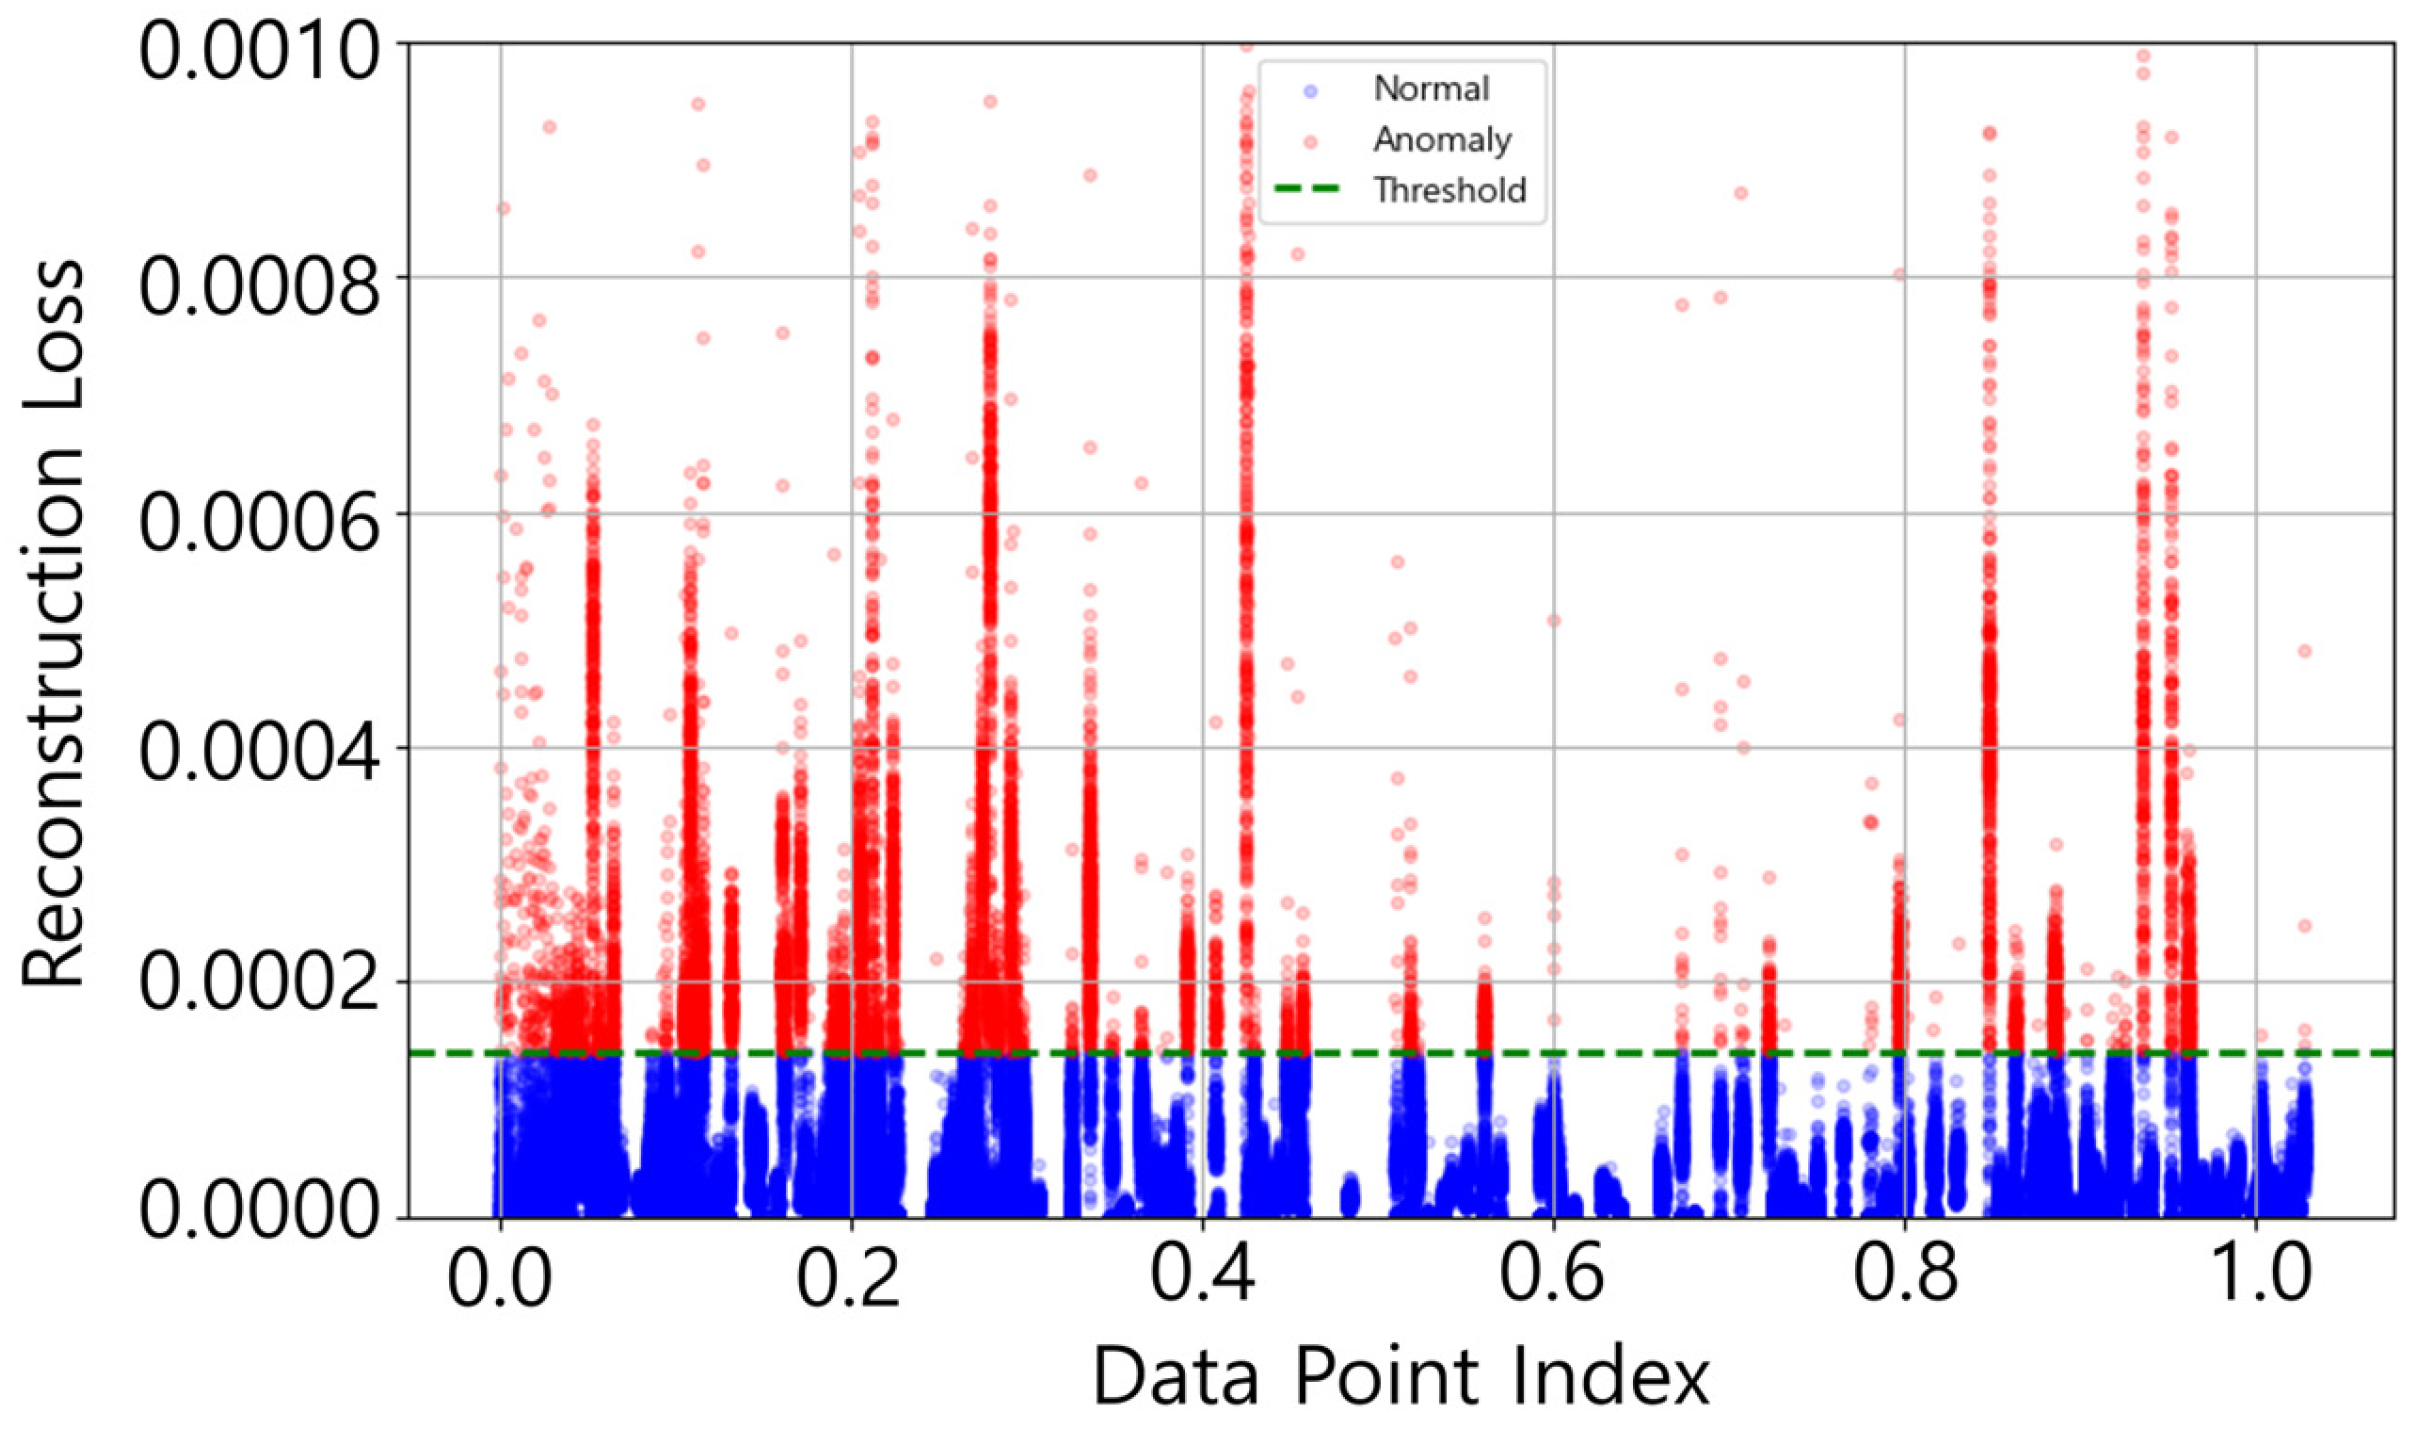
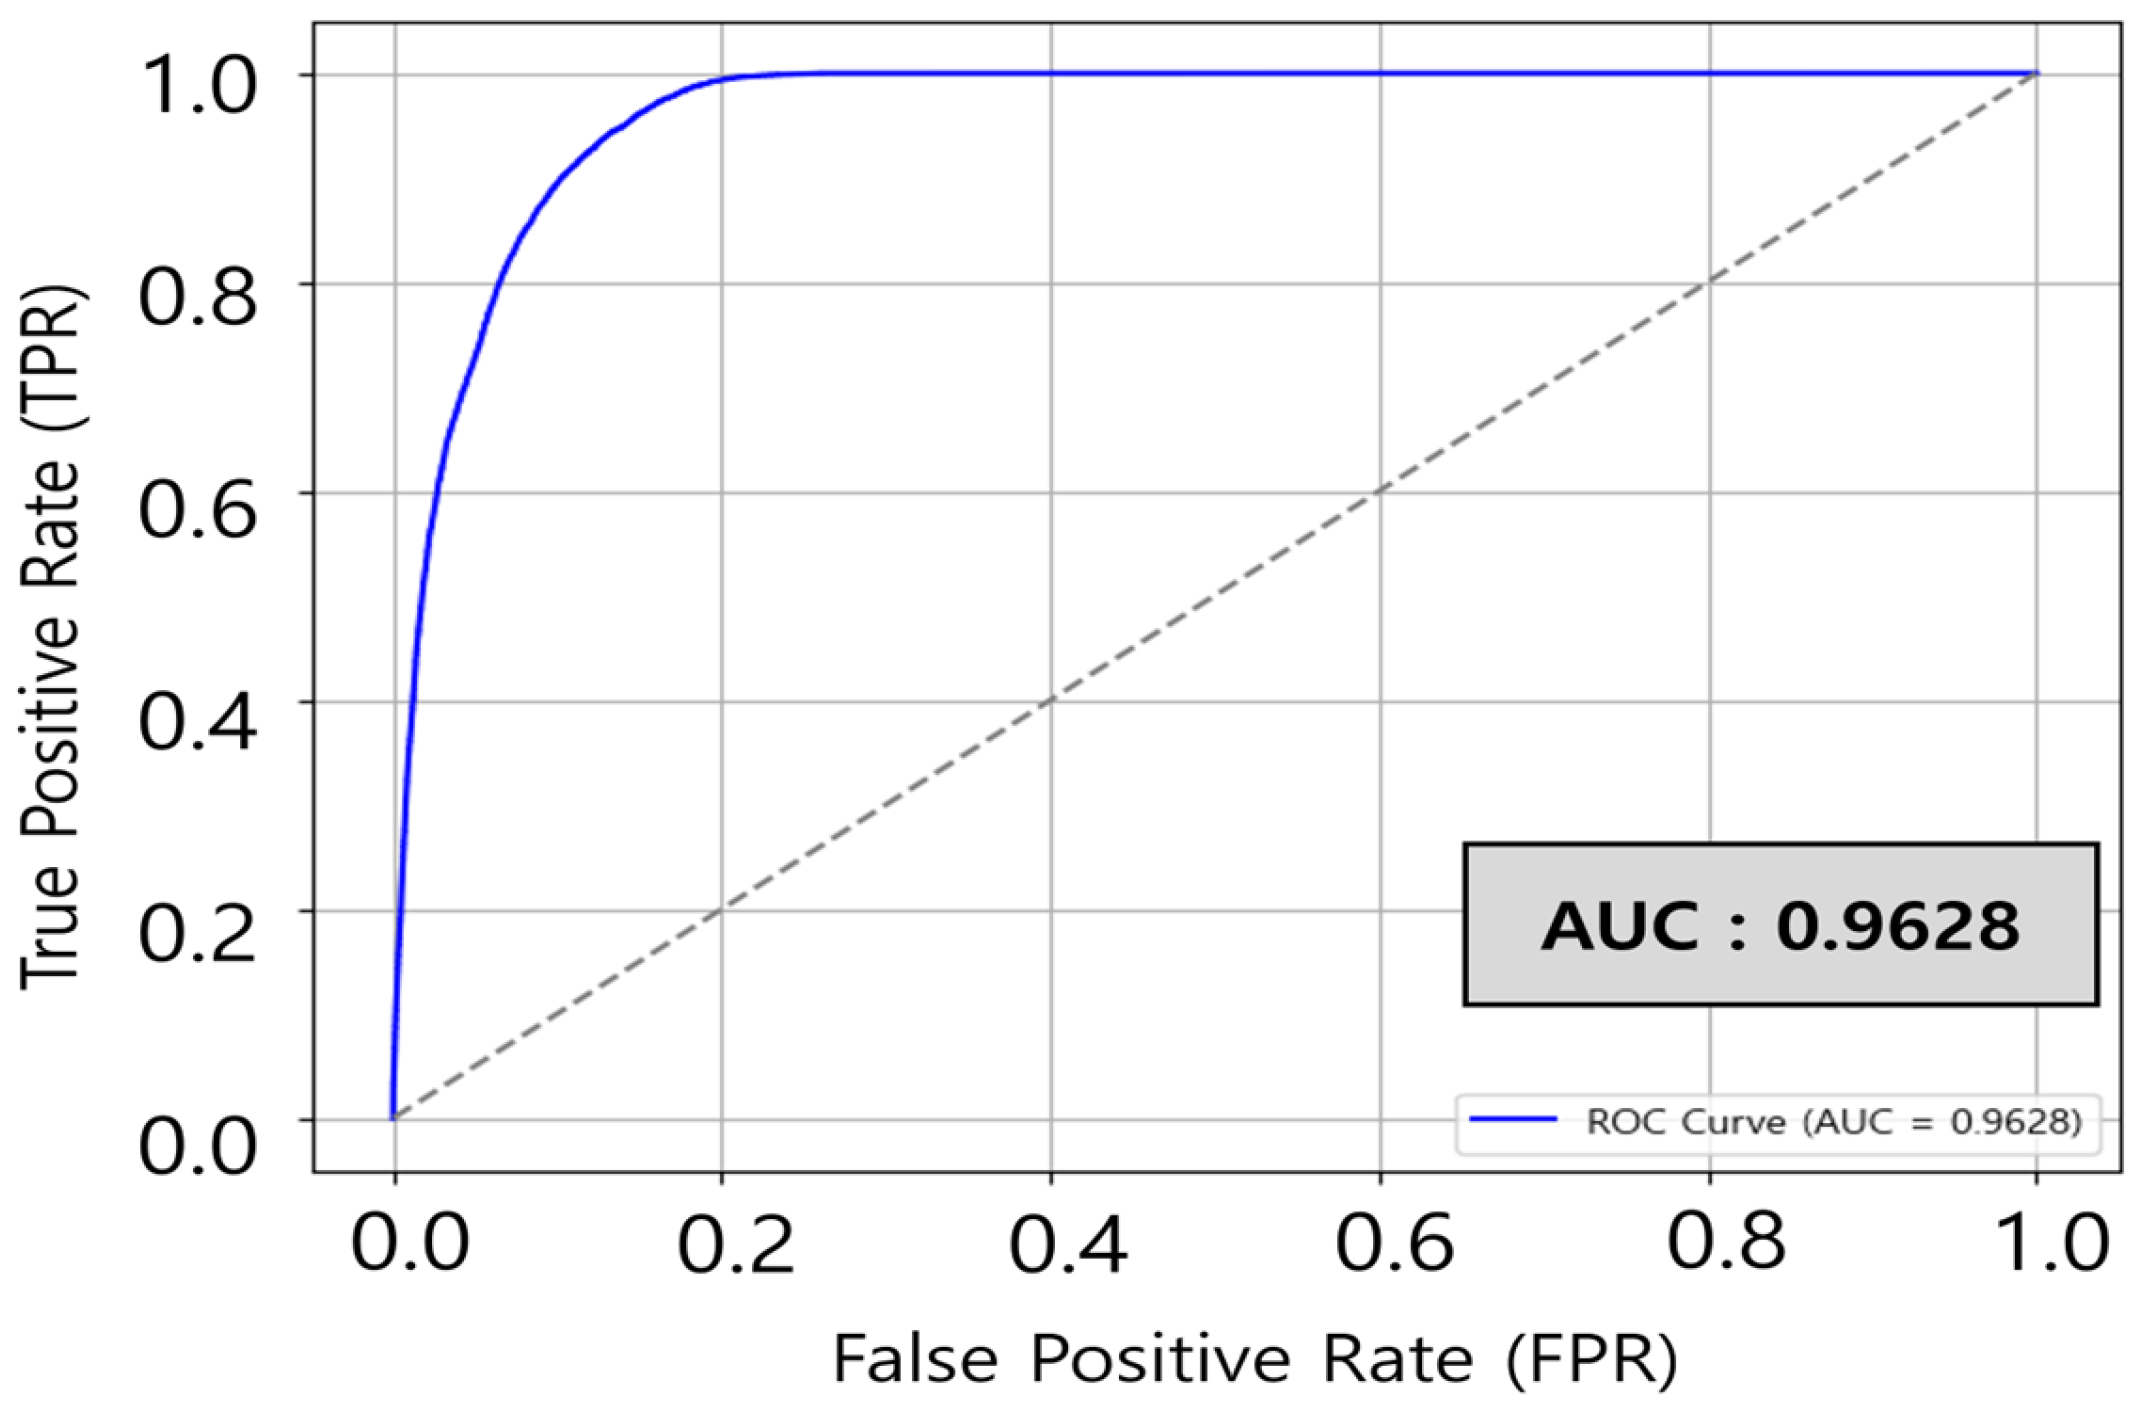
3.3.3. Use of AUC and Reconstruction Loss

We evaluate model performance using both the area under the ROC curve (AUC) and reconstruction loss. The AUC, derived from the ROC curve, provides a numerical measure for comparing detection performance. In the Autoencoder model, reconstruction loss quantifies how well the model compresses and then restores input data. Normal samples, which follow learned patterns, incur low reconstruction loss, whereas anomalies deviate from those patterns and incur high loss. Any sample whose reconstruction loss exceeds a predefined threshold is thus classified as an anomaly.

3.3.4. Use of Silhouette Score

For the chemical-industry dataset, we determine the optimal number of clusters using the silhouette score (Figure 7). We select the cluster count at which the silhouette score reaches its maximum; if no clear maximum exists, we default to two clusters. Consequently, we use two clusters for summer data and seven clusters for winter data.

4. Conclusions

4.1. Industrial Outlier-Detection Performance Comparison

4.1.1. Metal Industry

We evaluated outlier-detection performance over a threshold range of 0 to 5, using the weighted average expected ratio of 0.9802, with results shown in Figure 8. As illustrated, the optimal thresholds—for general usage (3.1), industrial usage (3.0), nighttime (2.3), and agricultural usage (1.7)—tend to increase in proportion to each category’s share of the dataset.
To validate these values, we compared detection accuracy when applying Figure 9a, a common threshold equal to the overall mean optimal threshold (2.525), to Figure 9b, the category-specific optimal thresholds. Under the common threshold, accuracies were 0.9569 for industrial usage, 0.9765 for general usage, and 0.7159 for nighttime usage. By contrast, applying the weighted, category-specific thresholds yielded improved accuracies of 0.9621 (industrial), 0.9658 (general), and 0.7232 (nighttime). These results confirm the effectiveness of our optimized thresholds. Notably, the relatively high optimal thresholds for general usage (3.1) and industrial usage (3.0)—despite their differing data shares—suggest that more uniform distributions can drive the optimal threshold upward.
Figure 9a compares the mean power consumption for industrial versus general usage, showing very similar averages. Figure 9b presents kernel density estimates: the general-usage distribution exhibits a lower peak density than the industrial distribution. Further, the interquartile range (IQR) for general usage (75,883) exceeds that for industrial usage (68,908), indicating a more uniform spread. Because their means align but the general-usage data are more evenly distributed, the optimal threshold for general usage is consequently higher.

4.1.2. Food Industry

Two hybrid models—K-Means + Autoencoder and Isolation Forest + Autoencoder—were applied to the food-industry dataset to compare their performance.
In the K-Means + Autoencoder model, only inlier samples were first selected by K-Means clustering, and the Autoencoder was trained exclusively on these “normal” data to detect anomalies. Examining the resulting reconstruction-error distribution showed that the majority of normal samples exhibited low reconstruction error, whereas a subset of points yielded markedly high errors and were thus identified as anomalies. As visualized in Figure 10, the regions corresponding to normal and anomalous patterns were clearly separated, and the ROC curve in Figure 11 produced an AUC of 0.9628, confirming high detection accuracy. This success is attributed to the effective grouping of the data distribution by K-Means—which prefilters outliers—and the consequent ability of the Autoencoder to learn normal patterns stably, achieving excellent reconstruction fidelity.
The Isolation Forest + Autoencoder model instead performs a preliminary anomaly removal using Isolation Forest before training the Autoencoder. Varying the Isolation Forest contamination parameter between 0.05 and 0.20 revealed that contamination = 0.05 yielded the best detection performance. Under this optimal setting, the model’s ROC curve again rose steeply, and its AUC exceeded that of the K-Means + Autoencoder model. Furthermore, when the Autoencoder trained only on the remaining normal samples was applied to the full dataset, most inliers were reconstructed faithfully, while anomalies that escaped the Isolation Forest stage produced large reconstruction errors—demonstrating the added precision of this two-stage approach. Overall, both hybrids achieved high anomaly-detection accuracy on food-industry data, but the Isolation Forest + Autoencoder model offered slightly higher AUC and more stable performance, indicating it as the more promising choice for this domain.
When deploying these models in practice, performance evaluation is crucial. While quantitative metrics such as sensitivity (or recall) and precision are standard, their calculation requires ground-truth labels, which are often unavailable in real-world industrial datasets suited for unsupervised learning. Consequently, this study could not directly compute these metrics.
Instead, we assessed the model’s practical sensitivity by qualitatively analyzing the detected anomalies and discussing the trade-off between false positives (FPs) and false negatives (FNs). For instance, many anomalies identified by the Isolation Forest + Autoencoder model corresponded to sharp, transient spikes or dips uncharacteristic of typical operational patterns, demonstrating the model’s ability to flag potentially significant process deviations. Furthermore, the contamination hyperparameter in Isolation Forest effectively functions as a sensitivity control knob for practitioners. As shown in Table 1, adjusting this value allows for a direct trade-off; a higher contamination setting flags more data points as anomalous, thus increasing detection sensitivity, though potentially at the cost of a higher false positive rate. This tunability is essential for adapting the model to specific industrial contexts where the tolerance for false alarms versus missed anomalies may differ.
Figure 12 shows the ROC curve of the Isolation Forest–Autoencoder model, together with the reconstruction-error distribution and corresponding ROC curve obtained by applying the trained Autoencoder to the full dataset. By first removing primary outliers with Isolation Forest and then feeding the remaining data into the Autoencoder, this hybrid approach delivers superior anomaly-detection performance and enhanced robustness.
By tuning the contamination parameter, the model’s performance can be further optimized. Both hybrid approaches—K-Means + Autoencoder and Isolation Forest + Autoencoder—exhibited strong detection capabilities. In particular, the Isolation Forest + Autoencoder model with an optimized contamination level achieved the most robust performance and the highest AUC, confirming its superiority.

4.1.3. Chemical Industry

For the chemical-industry dataset, we applied the DBA K-Means clustering algorithm to detect season-specific anomalies. As determined by our silhouette analysis, summer data were partitioned into two clusters and winter data into seven clusters. The summer electricity-usage profiles fell into two relatively simple patterns, suggesting that production processes remain uniformly active during the warmer months. In contrast, winter data formed seven distinct clusters, reflecting more varied usage patterns driven by increased heating demand and end-of-year production fluctuations.
We computed the DTW distance between each time series and its cluster centroid and labeled the top 3% of highest-distance points as anomalies. In summer, anomalies were confined to just a few clusters, with most data tightly grouped around their centroids. In winter, however, anomalies appeared across multiple clusters, and the total number of outliers rose—indicating greater intrinsic variability and a higher anomaly frequency in the colder season.
Visualizations in Figure 13 and Figure 14 corroborate these findings: summer clusters show only a handful of points highlighted in anomaly colors, whereas winter clusters display widely scattered anomalous points across many clusters. To evaluate the DBA K-Means approach, we examined both silhouette scores and detection stability. Silhouette scores remained strong in both seasons, demonstrating clear intra-cluster cohesion and inter-cluster separation—even with a larger number of winter clusters.
When compared against real-world operations, summer anomalies likely correspond to rare events (e.g., unplanned equipment stoppages), while winter anomalies align with expected heating-load surges or production-schedule shifts. Overall, our experiments confirm that the DBA K-Means algorithm effectively uncovers meaningful cluster structures in chemical-industry time series and reliably identifies sequences that deviate from those patterns.
Using silhouette scores to determine the optimal number of clusters, we found that summer data form two simple clusters, whereas winter data yield seven more complex clusters (Figure 13 and Figure 14). This seasonal variation reflects differences in chemical-industry process operations.

4.2. Algorithm Performance Evaluation

In this section, we compare the performance of the outlier-detection algorithms applied to each industry, select the best overall model, and discuss avenues for further improvement.
From the perspective of traditional statistical methods versus machine learning approaches, the Z-Score method applied to the metal-industry data offers simplicity and very fast computation. Because it flags outliers solely by comparing a statistical score against a threshold, it scales well to large datasets and works effectively when the data distribution is approximately Gaussian. Although our weighted-expected-ratio threshold optimization partially mitigates Z-Score’s limitations, the method still struggles with complex temporal patterns or non-Gaussian distributions; indeed, performance degraded when usage-category imbalances were not taken into account.
By contrast, machine learning (e.g., Isolation Forest, K-Means)- and deep learning (Autoencoder)-based detectors learn complex data structures directly and thus require no distributional assumptions, adapting readily to diverse patterns given sufficient training data. In the food-industry experiments, both Isolation Forest and K-Means hybrids surpassed the statistical approach in detection accuracy and sensitivity to abnormal patterns. However, these models demand greater computational resources and careful tuning of hyperparameters (contamination level, cluster count, etc.) for reliable deployment.
From a cost–benefit perspective, the three approaches offer a clear trade-off between computational cost and detection capability. The Z-Score method is computationally inexpensive, with a linear O(n) complexity, making it ideal for real-time processing and initial screening on large datasets where data generally follow a known distribution. In contrast, the Isolation Forest + Autoencoder hybrid, while demanding significant training time and resources (e.g., GPU), delivers superior performance (AUC > 0.99) on complex data by learning nonlinear patterns. This justifies its cost in scenarios where high accuracy is critical to prevent costly operational failures. The DBA K-Means approach sits between these two, with its O(n2) complexity for DTW computations making it more expensive than Z-Score. However, its ability to handle temporal distortions provides unique value for analyzing periodic or seasonal time-series data, a task where both Z-Score and standard deep learning models might falter.
Among the three primary techniques—Isolation Forest, K-Means, and Autoencoder—the Isolation Forest + Autoencoder hybrid achieved the best overall performance. By leveraging the rapid anomaly separation of Isolation Forest and the high-dimensional pattern learning of the Autoencoder, this model delivers both efficiency and precision. Isolation Forest’s randomized tree partitioning identifies outliers faster than K-Means clustering in high-dimensional spaces and prefilters many anomalies, thereby streamlining the Autoencoder’s training. Because the Autoencoder is trained only on the filtered “normal” data, it internalizes complex nonlinear relationships and detects subtle anomalies via reconstruction error. Table 1 shows how easily tuning hyperparameters like contamination adjusts model sensitivity—an advantage for meeting operational detection requirements. For these reasons, the Isolation Forest + Autoencoder model proved the most robust and highest-performing across all industrial datasets and was selected as our optimal model.
The DBA K-Means model, meanwhile, demonstrated notable strengths on chemical-industry time series. By accommodating nonlinear temporal distortions, it uncovered meaningful cluster structures corresponding to seasonal load changes and periodic process variations. Its winter-data results, which identified multiple detailed patterns and detected associated anomalies, confirm DBA K-Means as an effective time-series detector. However, DBA K-Means requires a predetermined cluster count and computes DTW distances for many data pairs, incurring higher computational costs. For large-scale, real-time monitoring, DTW’s worst-case O(n2) time complexity can be prohibitive, and the quality of clusters—hence detection performance—depends critically on selecting the optimal number of clusters for the data at hand.
The Z-Score method incurs only linear O(n) computational cost and is extremely simple to implement, making it well suited for real-time processing of large datasets. However, it does not account for temporal (time-series) patterns and its performance degrades if the data deviate from a Gaussian distribution. DBA K-Means, by contrast, employs DTW-based clustering to capture complex seasonal and periodic time-series patterns, enabling meaningful anomaly detection even in imbalanced datasets; its drawbacks are the need to preset the number of clusters and the worst-case O(n2) cost of DTW computations. The Isolation Forest–Autoencoder hybrid learns nonlinear structures in large, high-dimensional data and achieves the highest AUC and robustness, but it requires lengthy training times and a more complex model architecture, which increases resource demands. Based on this comparison, the Isolation Forest–Autoencoder approach was selected as the optimal model for stable, precise anomaly detection across diverse industrial datasets.
To further enhance performance, we propose a three-stage hybrid pipeline. First, apply the Z-Score filter to remove extreme outliers and noise, stabilizing the data distribution. Second, use DBA K-Means clustering to reflect seasonal and periodic time-series patterns, flagging clusters or individual samples with pronounced deviations as additional anomaly candidates. Third, employ Isolation Forest to perform a secondary outlier removal and then train an Autoencoder solely on the remaining normal data, detecting final anomalies via reconstruction error. This multi-stage strategy combines the real-time efficiency of Z-Score filtering, the time-series sensitivity of DBA K-Means, and the nonlinear learning capacity of the Isolation Forest–Autoencoder hybrid—delivering both high accuracy and computational efficiency to reinforce the reliability of industrial energy-management systems.

4.3. Discussion on Model Selection and Limitations

Our study employed customized algorithms tailored to each industry’s power data. For the chemical industry’s seasonal time-series data, we chose DBA K-Means. While state-of-the-art deep learning models like LSTM-Autoencoders or Temporal Convolutional Networks (TCNs) excel at learning long-range sequential dependencies, their primary strength lies in modeling data where the exact temporal order is critical. In our case, the key challenge was to group daily patterns that were similar in shape but could be slightly misaligned or warped in time due to operational shifts. DBA K-Means, with its foundation in Dynamic Time Warping (DTW), is specifically designed to measure similarity between time series irrespective of such temporal distortions, making it particularly suitable for identifying characteristic seasonal shapes [16]. This provides a more robust clustering of operational modes than models that rely on a fixed time axis.

5. Future Work

5.1. Research Summary and Key Findings

In this study, we analyzed electricity-usage data from the metal, chemical, and food industries and applied a variety of anomaly-detection techniques tailored to each sector’s characteristics. For the metal industry, we employed a traditional Z-Score-based detector and introduced an optimal-threshold derivation using a weighted average expected-ratio metric to mitigate bias arising from imbalanced sub-usage proportions. The optimal thresholds were found to be 3.1 for general-purpose, 3.0 for industrial, 2.3 for nighttime, and 1.7 for agricultural use, confirming that more uniformly distributed data yield higher threshold values. We also uncovered exceptional cases—such as a higher general-purpose threshold than the industrial threshold—underscoring the importance of reflecting data-distribution characteristics in statistical anomaly detection.
In the chemical industry, we focused on power-usage data between noon and 3 PM in summer and winter, which exhibited distinctly different patterns. Applying the DBA K-Means clustering algorithm, we obtained an optimal configuration of two clusters in summer and seven clusters in winter, as determined by silhouette score analysis (Figure 7). This significant structural disparity serves as strong evidence that winter consumption patterns are far more complex and varied. Rather than relying on a single statistical test, this result provides a robust, non-parametric basis for concluding that the underlying data distributions differ fundamentally between seasons, a finding visually corroborated by the distinct cluster visualizations in Figure 13 and Figure 14. By labeling the top 3% of DTW-distance values from each cluster centroid as anomalies and visualizing the results, we verified that the model adapts to seasonal pattern shifts. This confirms the effectiveness of time-series clustering for anomaly detection in energy data with strong seasonal characteristics.
For the food industry, we compared two hybrid models: K-Means + Autoencoder and Isolation Forest + Autoencoder. The K-Means + Autoencoder approach effectively captured data distribution via clustering and trained the Autoencoder on selected inliers, achieving high reconstruction accuracy. The Isolation Forest + Autoencoder model, employing unsupervised learning [17] and optimized contamination settings, demonstrated superior anomaly-detection performance—particularly in high-dimensional contexts—yielding a higher AUC. We also discussed the practical impact of false positives (FPs) and false negatives (FNs): FPs can trigger unnecessary maintenance costs, while FNs risk undetected process failures. Consequently, we emphasized the need for model evaluation that jointly considers FP/FN rates and called for further research to optimize this trade-off.

5.2. Industry-Specific Applicability and Deployment

Although the metal, chemical, and food industries differ in production processes and energy-usage profiles, all can benefit from smart energy-management platforms (e.g., Green Button) to enhance efficiency and operational stability.
Food Industry: Real-time monitoring and analysis of refrigeration, freezing, and processing energy can eliminate waste and identify optimal operating conditions tied to quality metrics like temperature and humidity. This dual focus on freshness maintenance and production efficiency reduces costs and enhances eco-friendly branding.
Metal Industry: Processes such as smelting, casting, and heat treatment consume vast amounts of thermal energy. By leveraging reliable power-usage data to optimize equipment schedules and shift peak loads, facilities can control energy costs and emissions, bolster operational reliability, and strengthen competitiveness under international environmental regulations.
Chemical Industry: Continuous high-temperature, high-pressure reactions demand intensive energy. Integrating precise, process-level energy measurements into a real-time control system enables the balancing of reaction rates against energy input. This can proactively identify inefficiencies or safety risks from aging equipment, improving both safety and cost-effectiveness while reducing carbon emissions.
Across all three sectors, deploying an integrated smart-energy-management strategy will realize three key benefits: improved cost efficiency, stabilized operations, and enhanced environmental sustainability.
Across all three sectors, the primary contribution of these advanced anomaly-detection methods to carbon-neutral goals is the direct reduction of energy waste stemming from operational inefficiencies or equipment malfunctions. For example, consider a food processing plant where the proposed Isolation Forest + Autoencoder model identifies a previously undetected, intermittent fault in a refrigeration unit. If this fault causes the unit to consume 15% more energy for several hours each day, its early detection and correction could lead to significant annual energy savings. Extrapolated across multiple facilities, such efficiency gains translate directly into substantial reductions in operational costs and, more importantly, a measurable decrease in carbon emissions, thereby supporting broader environmental sustainability targets. Thus, the value of these algorithms extends beyond process optimization to become a key enabler of greener industrial practices.

5.3. Future Research Directions

Future work will extend anomaly-detection validation to additional industries—such as energy generation and pulp and paper—by applying and benchmarking the techniques developed here. We will analyze factors that influence detection performance, identify optimal parameter combinations, and explore model improvements. In particular, we plan to investigate LSTM-Autoencoder architectures for deeper time-series anomaly detection and to evaluate other algorithms both individually and in hybrid combinations to achieve even stronger performance. To optimize the FP/FN trade-off, we will experiment with threshold tuning, expanded training data ranges, and other strategies that refine the model’s ability to distinguish between normal and anomalous patterns. Through these efforts, we aim to enhance the precision and reliability of anomaly detection across a broader range of industrial energy datasets.
Furthermore, deploying these models in real-world industrial settings requires addressing scalability for large-scale and real-time data processing. Future work should explore the integration of these algorithms with distributed computing frameworks to handle the massive data volumes generated by numerous sensors. For real-time monitoring, stream processing platforms could be employed to apply detection algorithms as data arrives. This would necessitate optimizing model complexity, for instance, by using a multi-stage pipeline where a lightweight statistical method like the Z-Score acts as a first-stage filter, allowing more computationally expensive models to be applied only to a smaller subset of potential anomalies.

Author Contributions

Conceptualization, S.L.; Methodology, M.J. and S.L.; Software, H.J. and S.L.; Validation, W.K.; Investigation, J.S. and S.L.; Resources, S.P.; Data curation, S.L.; Writing—original draft, B.P. and J.P.; Project administration, D.Y. All authors have read and agreed to the published version of the manuscript.

Funding

This research received no external funding.

Data Availability Statement

The original contributions presented in this study are included in the article. Further inquiries can be directed to the corresponding author.

Conflicts of Interest

The authors declare no conflict of interest.

Appendix A

Appendix A.1. Hyperparameter Configurations

Table A1. Hyperparameters for Autoencoder Models.
ParameterValue
Encoder Architecture
Input LayerInput Features
Hidden Layer 1Dense(64), ReLU
Hidden Layer 2Dense(32), ReLU
Latent SpaceDense(16), ReLU
Decoder Architecture
Hidden Layer 1Dense(32), ReLU
Hidden Layer 2Dense(64), ReLU
Output LayerDense(N), Sigmoid *
* N = number of input features
Training Parameters
OptimizerAdam
Loss FunctionMean Squared Error
Epochs10
Table A2. Key Hyperparameters for DBA K-Means.
ParameterValue
n_clustersDetermined by Silhouette score
initK-Means++
metricDTW
max_iter_barycenter3
n_jobs−1
random_stateA fixed seed was used for reproducibility

References

  1. Kim, D.S. International Trends and Korea’s Legal and Policy Responses for Achieving Carbon Neutrality through the Utilization of Biological Resources. J. Int. Econ. Law 2023, 21, 199–228. [Google Scholar]
  2. Korea Energy Economics Institute (KEEI). Monthly Energy Statistics 2024; KEEI: Ulsan, Republic of Korea, 2024. [Google Scholar]
  3. Lee, S.; Jin, H.; Nengroo, S.H.; Doh, Y.; Lee, C.; Heo, T.; Har, D. Smart metering system capable of anomaly detection by bi-directional LSTM autoencoder. In Proceedings of the 2022 IEEE International Conference on Consumer Electronics (ICCE), Las Vegas, NV, USA, 7–9 January 2022. [Google Scholar]
  4. Ribeiro, D.; Matos, L.M.; Moreira, G.; Pilastri, A.; Cortez, P. Isolation forests and deep autoencoders for industrial screw tightening anomaly detection. Computers 2022, 11, 54. [Google Scholar] [CrossRef]
  5. Jamshidi, E.J.; Yusup, Y.; Kayode, J.S.; Kamaruddin, M.A. Detecting outliers in a univariate time series dataset using unsupervised combined statistical methods: A case study on surface water temperature. Ecol. Inform. 2022, 69, 101672. [Google Scholar] [CrossRef]
  6. Chadha, G.S.; Islam, I.; Schwung, A.; Ding, S.X. Deep convolutional clustering-based time series anomaly detection. Sensors 2021, 21, 5488. [Google Scholar] [CrossRef] [PubMed]
  7. Liu, H.; Zhan, Q.; Yang, C.; Wang, J. Characterizing the spatio-temporal pattern of land surface temperature through time series clustering: Based on the latent pattern and morphology. Remote Sens. 2018, 10, 654. [Google Scholar] [CrossRef]
  8. Lee, S.; Nengroo, S.H.; Jin, H.; Doh, Y.; Lee, C.; Heo, T.; Har, D. Anomaly detection of smart metering system for power management with battery storage system/electric vehicle. ETRI J. 2023, 45, 650–665. [Google Scholar] [CrossRef]
  9. Xiong, Z.; Zhu, D.; Liu, D.; He, S.; Zhao, L. Anomaly detection of metallurgical energy data based on iForest-AE. Appl. Sci. 2022, 12, 9977. [Google Scholar] [CrossRef]
  10. Park, J.; Jin, T.; Lee, S.; Woo, J. Industrial electrification and efficiency: Decomposition evidence from the Korean industrial sector. Energies 2021, 14, 5120. [Google Scholar] [CrossRef]
  11. Lund, H.; Østergaard, P.A.; Connolly, D.; Mathiesen, B.V. Smart energy and smart energy systems. Energy 2017, 137, 546–555. [Google Scholar] [CrossRef]
  12. Lee, J.; Cho, Y. National-scale electricity peak load forecasting: Traditional, machine learning, or hybrid model? Energy 2022, 239, 122366. [Google Scholar] [CrossRef]
  13. Kamalov, F.; Sulieman, H. Time series signal recovery methods: Comparative study. In Proceedings of the 2021 International Symposium on Networks, Computers and Communications (ISNCC), Dubai, United Arab Emirates, 31 October–2 November 2021. [Google Scholar]
  14. Little, R.J.A.; Rubin, D.B. Statistical Analysis with Missing Data, 3rd ed.; Wiley: Hoboken, NJ, USA, 2019. [Google Scholar]
  15. Arthur; Vassilvitskii, S. k-means++: The advantages of careful seeding. In Proceedings of the Eighteenth Annual ACM-SIAM Symposium on Discrete Algorithms, New Orleans, LA, USA, 7–9 January 2007; pp. 1027–1035. [Google Scholar]
  16. Petitjean, F.; Ketterlin, A.; Gançarski, P. A global averaging method for dynamic time warping, with applications to clustering. Pattern Recognit. 2011, 44, 678–693. [Google Scholar] [CrossRef]
  17. Campos, G.O.; Zimek, A.; Sander, J.; Campello, R.J.G.B.; Micenková, B.; Schubert, E.; Assent, I.; Houle, M.E. On the Evaluation of Unsupervised Outlier Detection: Measures, Datasets, and an Empirical Study. Data Min. Knowl. Discov. 2016, 30, 891–927. [Google Scholar] [CrossRef]
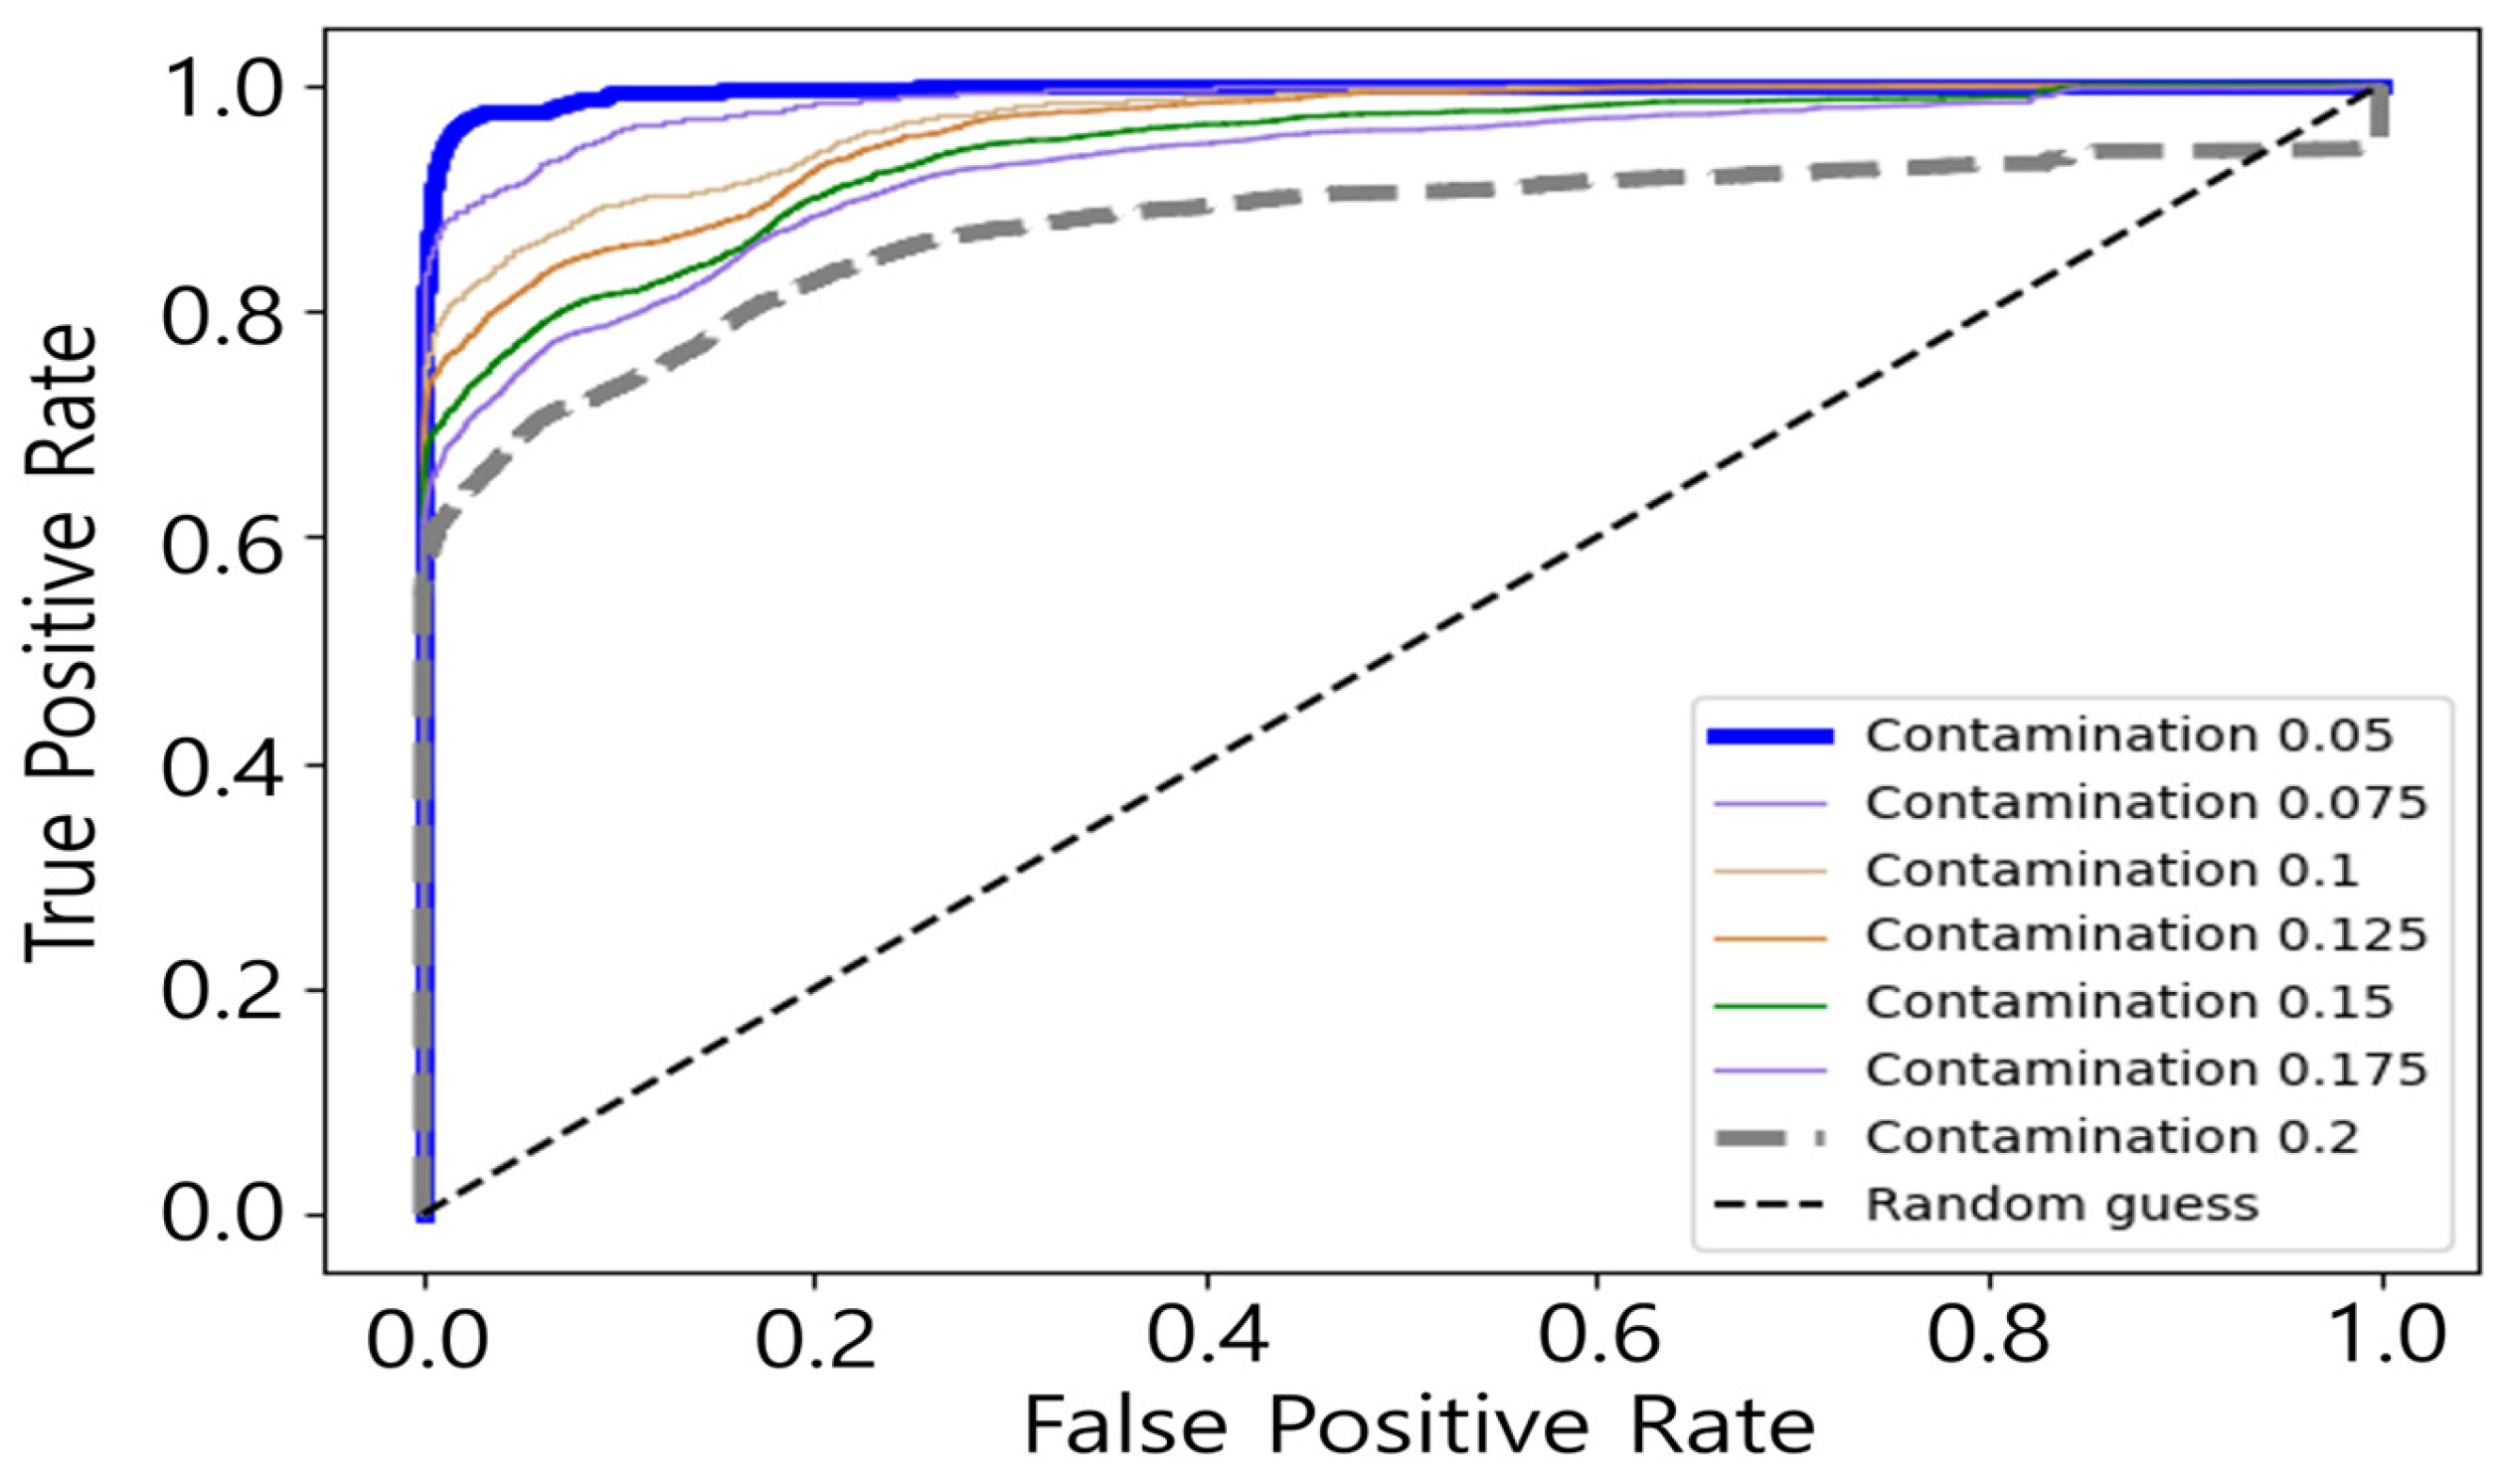
Figure 1. (a) Euclidean-mapping scheme; (b) DTW-mapping scheme.
Energies 18 03720 g001
Figure 2. (a) Data proportion by application in metal industry; (b) average power data.
Energies 18 03720 g002
Figure 3. Average power data in the food industry.
Energies 18 03720 g003
Figure 4. Average power data in the chemical industry.
Energies 18 03720 g004
Figure 5. Outlier detection results for the entire power data of the metal industry.
Energies 18 03720 g005
Figure 6. (a) Power consumption and outliers for industrial usage; (b) general usage at various Z-Score thresholds.
Energies 18 03720 g006
Figure 7. Silhouette scores by cluster.
Energies 18 03720 g007
Figure 8. Weighted mean expected ratio and optimal thresholds for power data by application.
Energies 18 03720 g008
Figure 9. (a) Average power data for industrial and general usage; (b) kernel density estimation plot.
Energies 18 03720 g009
Figure 10. AUC values of K-Means-Autoencoder.
Energies 18 03720 g010
Figure 11. Outlier detection results after visualization of reconstruction loss values in K-Means-Autoencoder.
Energies 18 03720 g011
Figure 12. ROC curve for outlier detection in the Isolation Forest–Autoencoder Hybrid model.
Energies 18 03720 g012
Figure 13. Outlier detection results for summer power data: normal (gray), anomaly (red), cluster Center (blue).
Energies 18 03720 g013
Figure 14. Outlier detection results for winter power data: normal (gray), anomaly (red), cluster center (blue).
Energies 18 03720 g014aEnergies 18 03720 g014b
Table 1. AUC and reconstruction loss values by contamination.
ContaminationAUCReconstruction Loss Value
0.0500.99640.0055
0.0750.98730.0148
0.1000.97030.0380
0.1250.96030.0286
0.1500.94190.0300
0.1750.92920.0282
0.2000.87320.0212
Disclaimer/Publisher’s Note: The statements, opinions and data contained in all publications are solely those of the individual author(s) and contributor(s) and not of MDPI and/or the editor(s). MDPI and/or the editor(s) disclaim responsibility for any injury to people or property resulting from any ideas, methods, instructions or products referred to in the content.

