Article

Detailed Forecast for the Development of Electric Trucks and Tractor Units and Their Power Demand in Hamburg by 2050

Faculty of Electrical Engineering, Helmut-Schmidt-University, Holstenhofweg 85, 22043 Hamburg, Germany
*
Authors to whom correspondence should be addressed.
Energies 2025, 18(14), 3719; https://doi.org/10.3390/en18143719
Submission received: 19 May 2025 / Revised: 30 June 2025 / Accepted: 1 July 2025 / Published: 14 July 2025

Abstract

The global urgency to mitigate climate change by reducing transport-related emissions drives the accelerated electrification of road freight transport. This paper presents a comprehensive meta-study forecasting the development and corresponding power demand of electric trucks and tractor units in Hamburg up to 2050, emphasizing the shift from conventional to electric vehicles. Utilizing historical registration data and existing commercial and institutional reports from 2007 to 2024, the analysis estimates future distributions of electric heavy-duty vehicles across Hamburg’s 103 city quarters. Distinct approaches are evaluated to explore potential heavy-duty vehicle distribution in the city, employing Mixed-Integer Linear Programming to quantify and minimize distribution uncertainties. Power demand forecasts at this detailed geographical level enable effective infrastructure planning and strategy development. The findings serve as a foundation for Hamburg’s transition to electric heavy-duty vehicles, ensuring a sustainable, efficient, and reliable energy supply aligned with the city’s growing electrification requirements.

1. Introduction

Electrification of the road freight transport sector is crucial for achieving climate neutrality and complying with regulatory targets such as the European Green Deal and the new EU heavy-duty vehicles act, which specifies the required share of zero-emission trucks by 2030 and beyond [1]. The transition from conventional heavy-duty trucks and tractor units to zero-emission electric vehicles (EVs) and the deployment of reliable charging infrastructure, particularly in densely populated cities such as Hamburg, are central to meeting these goals. This transformation aims to reduce emissions and support a more sustainable urban energy and logistics system through the integration of environmentally friendly technologies [2]. This paper evaluates the impact of electrifying heavy-duty vehicles on Hamburg’s future power demand across city quarters.
Long-term forecasts of transport electrification are vital for strategic planning by government, industry, and commerce, as they enable stakeholders to anticipate developments in vehicle electrification and infrastructure expansion [3,4]. Such forecasts highlight potential implications for power grid load, environmental sustainability, urban energy management, and emission reduction goals. In addition, accurate long-term forecasting supports efficient infrastructure investments and informed decision-making on energy system planning.
The level of spatial detail in the commercial and institutional reports [4,5,6,7,8,9,10,11,12] is largely focused on national or regional scales and lacks small-scale urban modeling. Previous studies on Hamburg [13] focus on passenger transport and do not contain sufficient data on heavy-duty vehicles. Although the German national study [2] describes electrification options for road freight transport, it lacks spatial resolution. However, the wide range of research work on transportation modeling and forecasting of vehicle distribution, charging demand, and charging infrastructure deployment remains largely international in scope and methodologically relevant. For example, Then et al. developed a distribution network planning framework for medium- and heavy-duty EV chargers, addressing substation utilization and power quality issues through feeder design strategies [14]. Similarly, the multistage model from [15] integrates EV delivery routing and charging management with power distribution system constraints, using incentive-based optimization and a bi-level programming approach to minimize operational and charging costs under varying demand, generation, and pricing scenarios. Finally, a simulation-based methodology from [16] evaluates and plans demand-oriented charging infrastructure for battery electric trucks in Germany, highlighting the need for both high-power and overnight charging to enable large-scale electrification of long-distance freight transport by 2030. Nevertheless, the question of solutions for road freight transport in Hamburg remains open.
In contrast to the valuable sources mentioned above [4,5,6,7,8,9,10,11,12,13,14,15,16], this paper presents a model for estimating the high-resolution distribution of road freight vehicles to 103 quarters of Hamburg. This work integrates van, truck, and tractor unit forecasting with spatial distribution and power demand estimation approaches, integrating heterogeneous data sources and an optimization-based distribution framework to them. Bridging the gap between national policy modeling and local infrastructure planning, this paper complements and extends existing research, providing a set of solutions for broad application in the context of other cities.

1.1. Classification of Trucks and Tractor Units

Vehicles of various types are widely adopted for road freight transportation, both for tasks of local importance and as global solutions at the international level. For a clear definition of such heavy-duty vehicles, this report presents the classification according to Directives 2007/46/EC [17] and 97/27/EC [18]. The classification distinguishes three classes intended for the transportation of goods:
  • Class N1: vehicles with a permissible total mass of up to 3.5 tons. Small delivery vans and light trucks are the most common in this category.
  • Class N2: vehicles with a permissible total mass from 3.5 to 12 tons. Medium-sized trucks and commercial vehicles used for urban distribution are the most common.
  • Class N3: vehicles with a permissible total mass over 12 tons. Heavy trucks, tractor units for large trailers, and long-haul transport vehicles are the most common.
N1/N2/N3 vehicles include the following:
  • Trucks: motor vehicles for freight transport or with a specific purpose.
  • Vans: trucks with integrated driver cabins.
  • Semi-trailer tractors: tractors intended primarily for towing semi-trailers.
  • Road tractors: tractors intended primarily for towing trailers, besides semi-trailers.
To avoid confusion about classification systems, the system presented in this study is widely used in the EU and several other countries. However, there are other classifications. The American classification system based on gross vehicle weight rating (GVWR) includes classes 1 to 8. Specifically, the N1 class in the EU corresponds to the U.S. classes 1, 2, and 3 covering light-duty vehicles. N2 class vehicles correspond to U.S. classes 4, 5, and 6, which cover medium-duty vehicles. N3 corresponds to U.S. classes 7 and 8, covering heavy vehicles such as large trucks and tractor-trailers. In the context of analyzing heavy-duty vehicles in Germany, this report considers the European classification system and distinguishes between three main groups within the N class of transport: N1, N2, and N3 vehicles.

1.2. Contribution of the Paper

The methodology in this paper is validated and presented through a detailed case study of the Free and Hanseatic City of Hamburg, but is fully adaptable to any city in the world. The comprehensive analysis presents a meta-study using available scientific and commercial reports on ramp-up scenarios [4,5,6,7,8,9,10,11,12], including the electrification of truck and tractor units. Three distinct future scenario groups for Hamburg up to 2050 are derived. Accordingly, the forecast for the number of N1 and N2/N3 vehicles includes the following:
  • Main scenarios (SN1 and SN2/N3), including the electrified part (E-SN1, E-SN2/N3);
  • Pessimistic scenarios (SN1 +15% and SN2/N3 +15%), including the electrified part (E-SN1 +15%, E-SN2/N3 +15%);
  • Optimistic scenarios (SN1 −15% and SN2/N3 −15%), including the electrified part (E-SN1 −15%, E-SN2/N3 −15%).
The 15% below and 15% above main scenarios are introduced to show the impact of regulatory, geopolitical, and other influential factors that may change over time.
The scenarios forecast the expected distribution of electric N vehicles in 103 city quarters of Hamburg (excluding the island of Neuwerk), considering geographical distribution based on industrial area allocation, addresses of companies, and satellite imagery. Combining the distribution of industrial and commercial zones across the city and satellite imagery is critical for the development of realistic spatial forecasts of N vehicle distribution and their power demand. Industrial zones identify the major sources of freight transportation demand. The distribution of companies reflects the actual locations of operation and the potential for deployment in a particular industry. Analysis of satellite imagery ensures that the forecast takes into account the physical availability of space suitable to accommodate truck depots and charging infrastructure. This integration of multiple sources creates a practical, high-resolution model that matches the actual structure of Hamburg’s freight and logistics ecosystem.
Overcoming the limitations of a single data source for spatial distribution, this study uses a Mixed-Integer Linear Programming (MILP) optimization approach to generate a balanced, near-realistic distribution of electric N vehicles across Hamburg’s 103 quarters. The optimization minimizes the weighted sum of the absolute deviations between the number of N vehicles calculated by the optimizer for each quarter and three initial distributions: based on industrial and commercial area, allocation of companies, and the satellite-identified number of vehicles per quarter. For each vehicle type (N1, N2, N3), the model calculates the optimal proportion of vehicles in each quarter such that the total deviation from the three source distributions is minimized. The balanced distribution reflects industrial importance, the presence of operational activities, and the spatial appropriateness of logistics.
In addition, the paper presents detailed E-N1/E-N2/E-N3 projections under scenarios estimating the power demand of electric trucks and tractors at the city-quarter level, including potential load profiles of different N vehicles. The forecasts are intended to analyze time-dependent charging behavior and to evaluate peak load implications. The synthetic load profiles are determined using daily average energy consumption values derived from recent experimental and empirical studies [11,19,20], which are vehicle-type-specific and reflect urban freight transport charging patterns.
The final focus of this paper is on power peaks and potential daily load profiles, and the results are visualized in the form of load. Therefore, generated load profiles represent the average power demand within each hourly interval. This representation is particularly relevant for grid operators and infrastructure planners, who typically assess system performance and dimensioning based on instantaneous or interval-based power.
To enhance the interpretability of the results, color maps are generated for this study to visualize both the number of electric heavy-duty vehicles and the estimated charging load across Hamburg’s city quarters. These maps apply a color gradient, where red indicates higher values and green indicates lower values. Different value scales are deliberately applied for N1, N2, and N3 vehicle classes and peak scenarios to better emphasize spatial differences within each category separately. This applies to both the vehicle distribution maps and the corresponding peak load scenarios. For geographical reference, the city’s main autobahns are marked in blue, although they are not included in the underlying calculations.
The backbone of the whole concept is shown in Figure 1. The contribution is clearly defined as follows:
  • Prediction of N class vehicle development in Hamburg up to 2050, based on a comprehensive meta-study approach.
  • Development of a methodology for analyzing the geographical distribution of electric heavy-duty vehicles at a granular city-quarter level.
  • Detailed forecast of power demand associated with electric heavy-duty vehicles for each of Hamburg’s 103 city quarters by 2050.
These contributions facilitate a smoother transition to sustainable transportation, enhancing the overall efficiency and sustainability of Hamburg’s energy and logistics systems. The granular forecast enables precise infrastructure planning and strategic development within Hamburg’s broader energy transition framework.

1.3. Organization of the Paper

In order to provide context for the current situation of N vehicles in Hamburg, Section 2 examines detailed statistics on vehicle registrations, road freight activities, and the economic significance of trucks and tractor units within the urban logistics system. The historical data offers a comprehensive overview of the transportation landscape, forming the basis for understanding challenges and long-term trends. Future developments are then forecast using scenario-based projections derived from a combination of external studies, expert assessments, and official reports. Section 3 analyzes the projected spatial distribution of electric road freight transport across Hamburg’s city quarters, using four distinct methodological approaches. The optimal spatial allocation is derived using an MILP optimizer, which minimizes deviations between the three non-optimized distribution methods. Section 4 provides a long-term forecast for the number of electric N vehicles up to 2050, highlighting their expected deployment patterns across different urban zones. Finally, Section 5 evaluates the resulting power demand for each city quarter by 2050, providing insight into the future load profile and implications for electricity infrastructure planning in Hamburg.

2. Historical Data and Statistics

This study forecasts the distribution of N vehicles in Hamburg and their power demand of electric units in the city by 2050, integrating multiple data sources and statistics to identify vehicle allocation and load profiles at a granular city-quarter level [4,5,6,7,8,9,10,11,12]. The work includes data on commercial and industrial areas, company addresses, satellite imagery, historical data, commercial and institutional reports, commuter statistics, traffic data, and scientific papers. Distribution data is processed through an MILP optimizer, which distributes future truck and tractor units based on geographical and economic factors. The results include geospatial distribution maps, predicting the highest N1 and N2/N3 vehicle activity zones, power demand forecasts, identifying peak charging loads, and comprehensive load profiles, combining depot and on-route charging trends. In addition, to strengthen the concept and understand the overall context of freight transportation, the article considers statistical data on N vehicle utilization by economic sector [21,22]. By integrating these insights, this paper enables strategic infrastructure planning, ensuring Hamburg’s energy grid is prepared for the transition to electrified road freight transport.

2.1. Trend of New Registrations

The German Federal Motor Transport Authority (KBA) provides insights [21,22,23,24] into the historical numbers of registered trucks and tractor units, distribution by vehicle ownership type, and interregional truck movements into Hamburg, covering the period from 2007 to 2024.
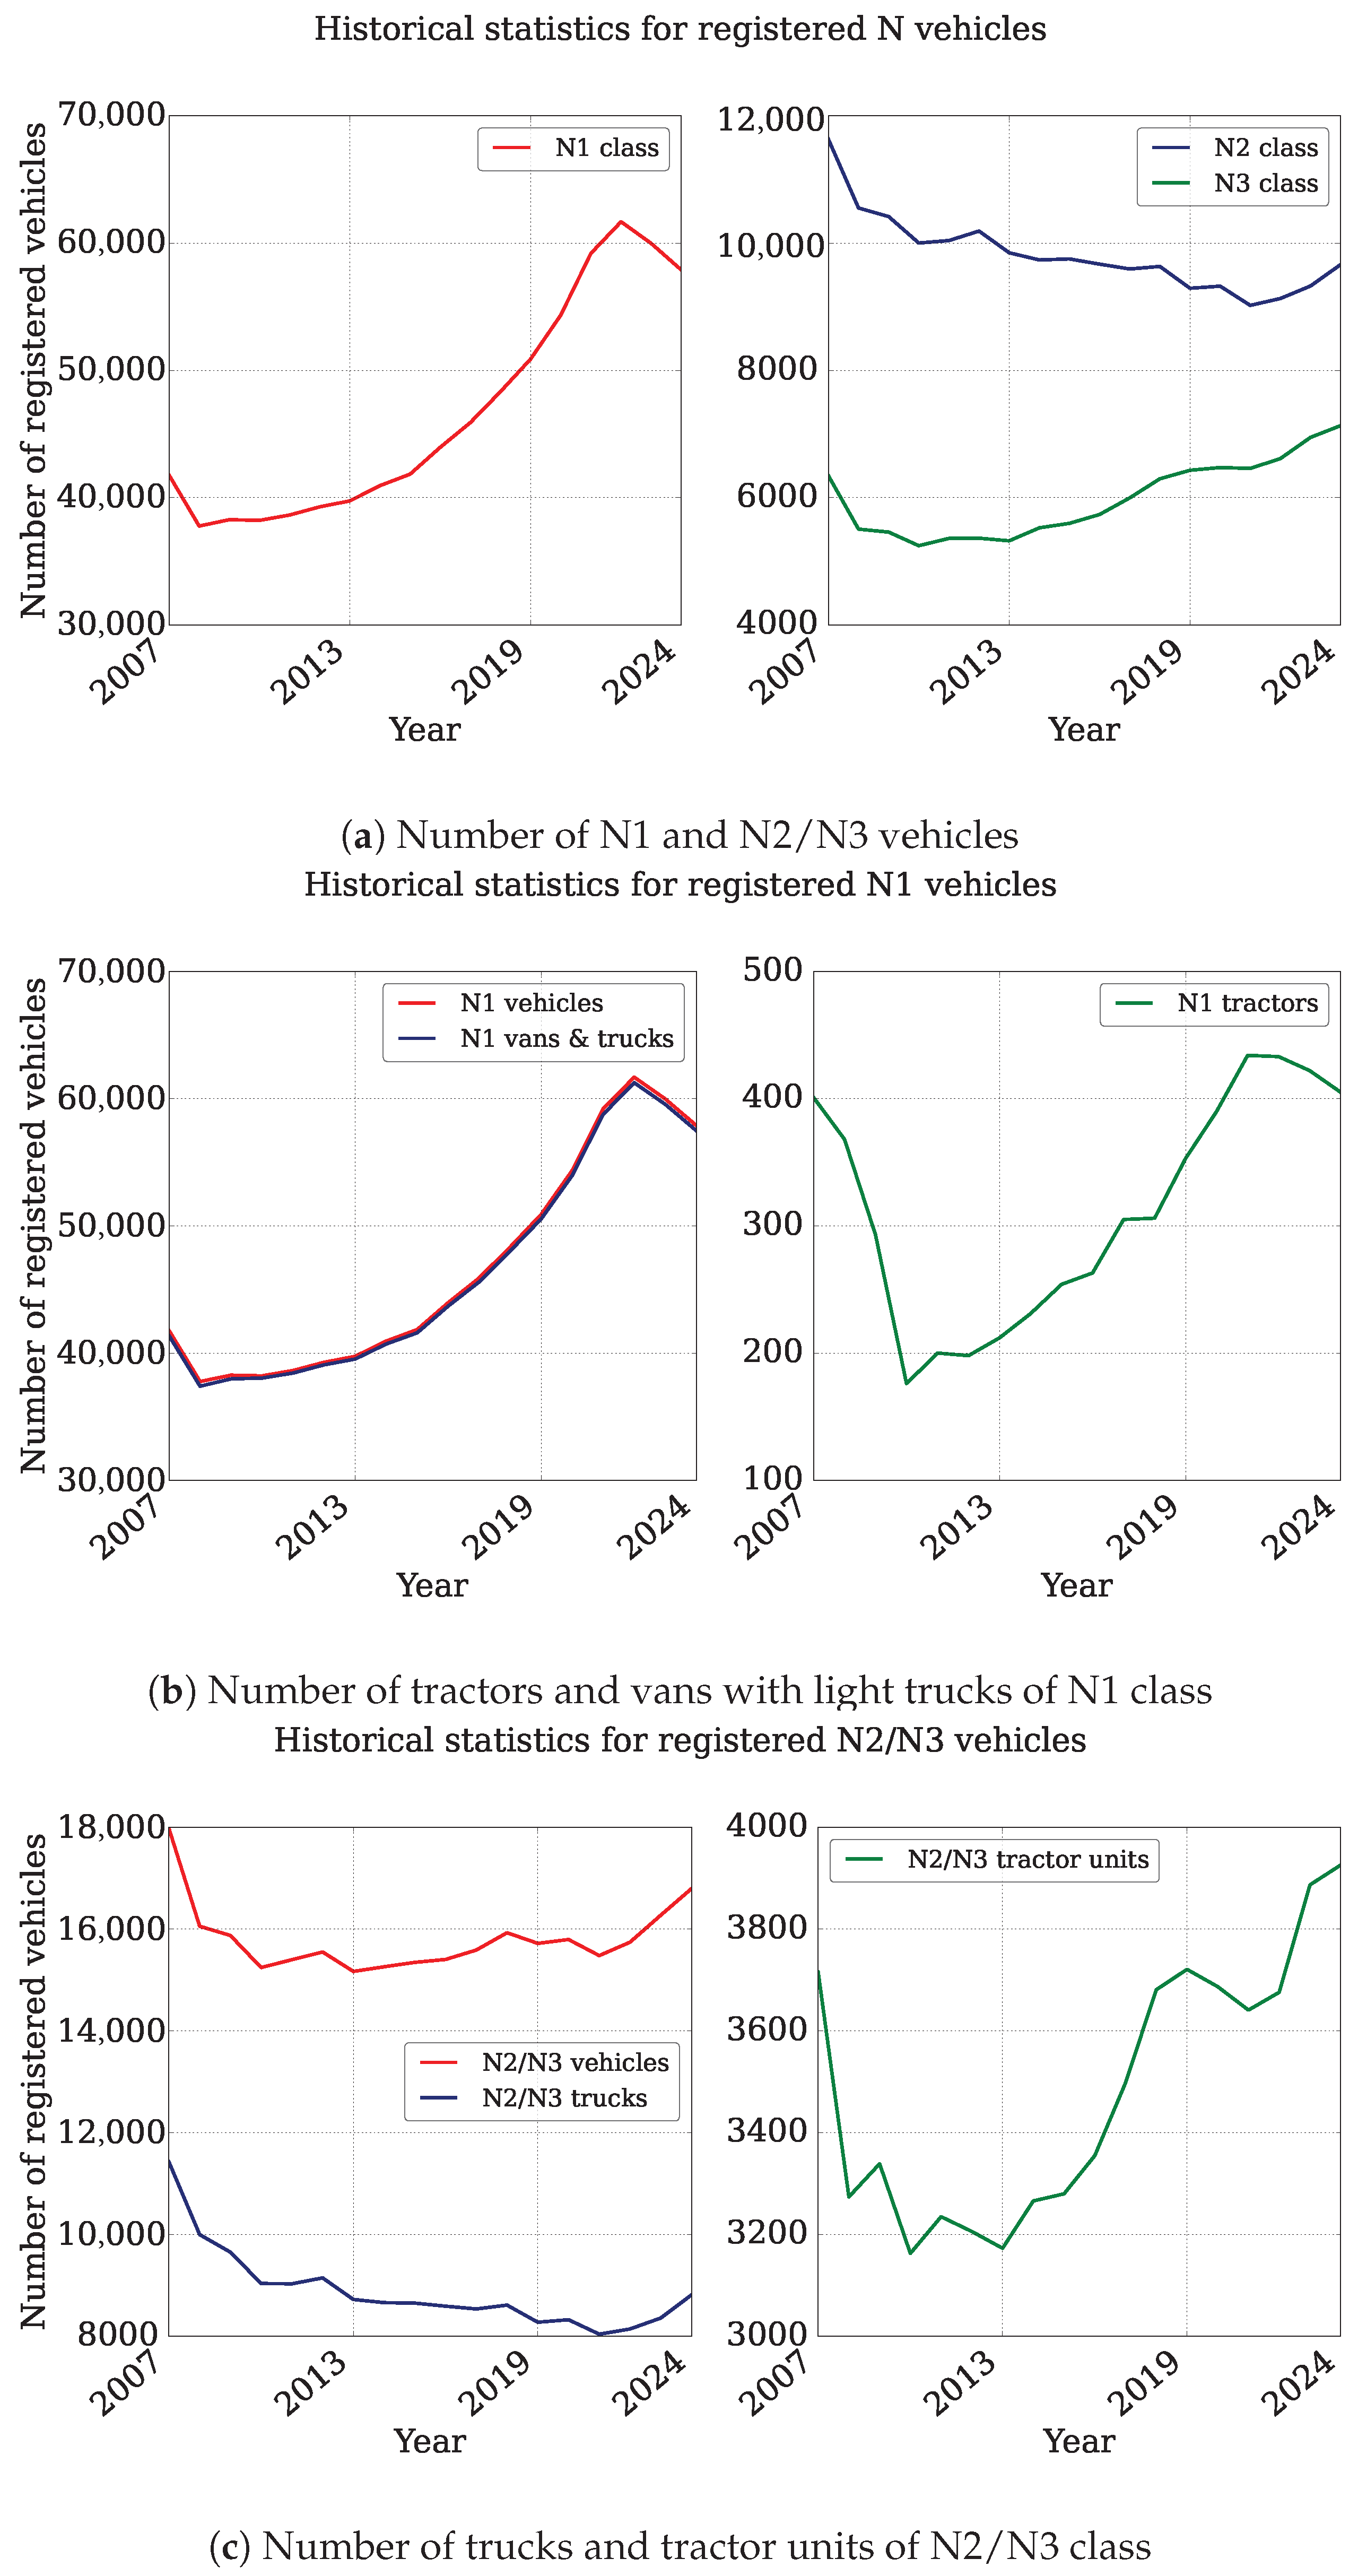
Light commercial vehicles (N1 vehicles), which include vans and small trucks, consistently represent the majority of registrations (78%) at present. In contrast, heavy commercial vehicles (N3), including semi-trailer trucks and larger tractor units, account for approximately 10% of registrations, showing a steady increase over the analyzed period. Medium-duty vehicles (N2) exhibit a general declining trend, with a recent slight increase in registrations observed over the last two years. Notably, fluctuations in the registration numbers, particularly the recent decrease in N1 vehicles, reflect broader economic, political, and social dynamics, such as the global economic crises, geopolitical tensions, and regulatory impacts [25,26,27].
The annual number of registered vehicles in Hamburg, categorized into N1 and N2/N3 classes, is illustrated in Figure 2. Figure 2a shows a clear upward trend in the number of N1 class vehicles—including light vans and small trucks—increasing from approximately 41,000 in 2007 to a peak of nearly 63,000 in 2022, before slightly declining in 2024. It differentiates the trends within the N2 and N3 classes: while registrations of medium-duty N2 vehicles have generally declined over the years from approx. 11,000 to 9000, the number of N3 vehicles has steadily increased from nearly 5000 to 7000 after 2010 particularly—suggesting a shift toward heavier-duty transport solutions.
Figure 2b provides a more detailed breakdown of the N1 class, highlighting the total number of N1 vehicles and the N1 van, truck, and tractor subsets. Vans and trucks are the dominant units of N1 vehicles and are distinguished mainly by body type. From 2008, the number grew rapidly until 2022 from an estimated 37,000 to 61,000. However, the number has now started to decrease and has reached about 57,000. The trend of N1 tractor registrations has shown a significant increase since 2009, but a slow decline since 2022. Nevertheless, the number of such tractors is only in the range of 400 units in Hamburg.
In Figure 2c, a more detailed view of N2/N3 vehicles, including trucks and tractor units, shows a gradual increase in the number of registered vehicles from 2021. In the past 4 years, the number of N2/N3 trucks has grown from about 8000 to 9000 and long-haul tractors from about 3600 to almost 3900 by 2024—this is in line with the expansion of regional and long-haul trucking in Hamburg.
In contrast to the fluctuations observed locally in Hamburg, the overall trend for vehicle registrations across Germany shows consistent growth for all N vehicle classes. Specifically, in 2024, truck registrations increased by 2.6%, and tractor units grew by 1.1%, including a 0.6% rise in tractor-trailer registrations, compared to 2023 [24]. This national upward trend aligns with broader optimistic forecasts from both industry and academia regarding the future demand for road freight transport. Factors such as the continued expansion of logistics, e-commerce, and construction sectors, as well as advances in automotive technologies and tighter emissions regulations, are expected to support sustained growth in demand for these vehicles. Multiple studies confirm these projections, indicating a positive long-term trajectory in registrations of N class vehicles throughout Germany [24].
Despite periodic fluctuations influenced by various economic, social, and political conditions, the overall trend for industrial and commercial development, including heavy-duty transportation, remains positive up to 2050. N1 vehicles experienced significant variations, notably declining during economic downturns such as the 2008 financial crisis. Despite the short-term decline through 2021, the overall long-term trend is upward. Such historical patterns are indicative of changing demands in Hamburg’s heavy-duty transport sector and serve as a basis for future vehicle electrification strategies in the city.
In the context of electric N vehicle registration, the fleet of electric trucks and tractor units (classes N1, N2, and N3) in Hamburg showed a noticeable increase between 2020 and 2024, especially in the segment of N1 electric vehicles, particularly vehicles with a payload of less than 2 tons. In particular, the total number of N1 electric vehicles increased from 319 in 2020 to 1472 in 2024 [22]. Nevertheless, the adoption of electric heavy-duty trucks (N2/N3 vehicles) in Hamburg remains limited, with only 22 registered vehicles in 2024, indicating a gradual entry into the market [25]. The number of electric tractor-trailers and semi-trailers in Hamburg increased slowly, from just 2 vehicles in 2020 to 13 by 2024, reflecting initial progress in the electrification of long-haul heavy-duty transportation [25]. Although the introduction of electric N vehicles has begun, their share of total heavy-duty transportation in Hamburg and Germany remains minimal [3]. The growth trajectory of electric heavy-duty vehicles in the future largely depends on advancements in battery technology, the expansion of charging infrastructure, and governmental incentives accelerating the transition to zero-emission heavy-duty transport [5].
Section III analyzes the projected spatial distribution of electric road freight transport across Hamburg’s city quarters, using four distinct methodological approaches: distribution based on industrial and commercial land use, registered company locations, classification through satellite imagery, and an MILP-based optimization model.

2.2. Distribution by Economic Sector

The economic sector classification of heavy-duty vehicles (N1, N2, and N3) provides valuable insights into the primary utilization patterns of different vehicle categories within Hamburg [21], as summarized in Table 1. N1 vehicles, commonly used for small-scale transport and service activities, are predominantly registered under private or employee-related usage (38.9%), followed by specific commercial services (23.6%), illustrating their role primarily in light commercial and personal transport. N2 vehicles, serving mid-sized logistics and commercial sectors, show significant usage among economically active entities (26.6%), specific commercial services (17.1%), and transportation (10.2%), indicating their critical role in medium-scale service industries. In contrast, heavy-duty N3 vehicles, essential for freight and heavy logistics, are heavily utilized for miscellaneous service provision (50.8%), transportation and warehousing (17.5%), and manufacturing sectors (10.5%). This distribution highlights the significant role of N3 vehicles in key industrial and logistic activities. Conversely, sectors like agriculture, forestry, and fishing exhibit minimal usage (less than 2.3% across all N classes), suggesting specialized transportation solutions. Understanding this economic distribution further justifies the inclusion of commercial and industrial areas in the spatial analysis, as they serve as the primary hubs for heavy-duty vehicle activity. By considering this economic sector data with geographic distribution, this study ensures a more precise assessment of where electrification efforts should be prioritized, enhancing the accuracy of power demand forecasting at the city-quarter level.
The diverse use cases and operational scenarios for trucks and tractor units require early identification of suitable electrification strategies and charging infrastructure solutions [1,2]. The electrification of freight depots represents a critical strategic decision for businesses, policymakers, and infrastructure providers, influencing investment planning, policy frameworks, and infrastructure upgrades necessary for the transition toward zero-emission commercial transportation.

2.3. Traffic Activity and Commuters

Analysis of vehicle traffic patterns is essential to justify areas and periods of intensive heavy-duty vehicle activity within Hamburg, thus supporting accurate forecasts of electric vehicle adoption. In the context of electrification, this data indicates where on-route charging can take place. This study considers a city-specific traffic model developed by the Authority for Traffic and Mobility Transition (BVM) [28], enabling accurate representation of intra-city destination goals. It provides the empirical groundwork necessary to rigorously evaluate the current vehicle landscape and supports robust predictions regarding electric heavy-duty vehicle distribution within Hamburg’s city quarters.
Historical traffic data from various institutional sources [2,28,29,30,31] provides insights into the temporal and spatial distribution of vehicle operations across the city, indicating the preferred parking locations for N vehicles. The precise geographical and temporal resolution in forecasting allows stakeholders to strategically plan infrastructure that matches actual electrification needs and supports efficient energy system management.
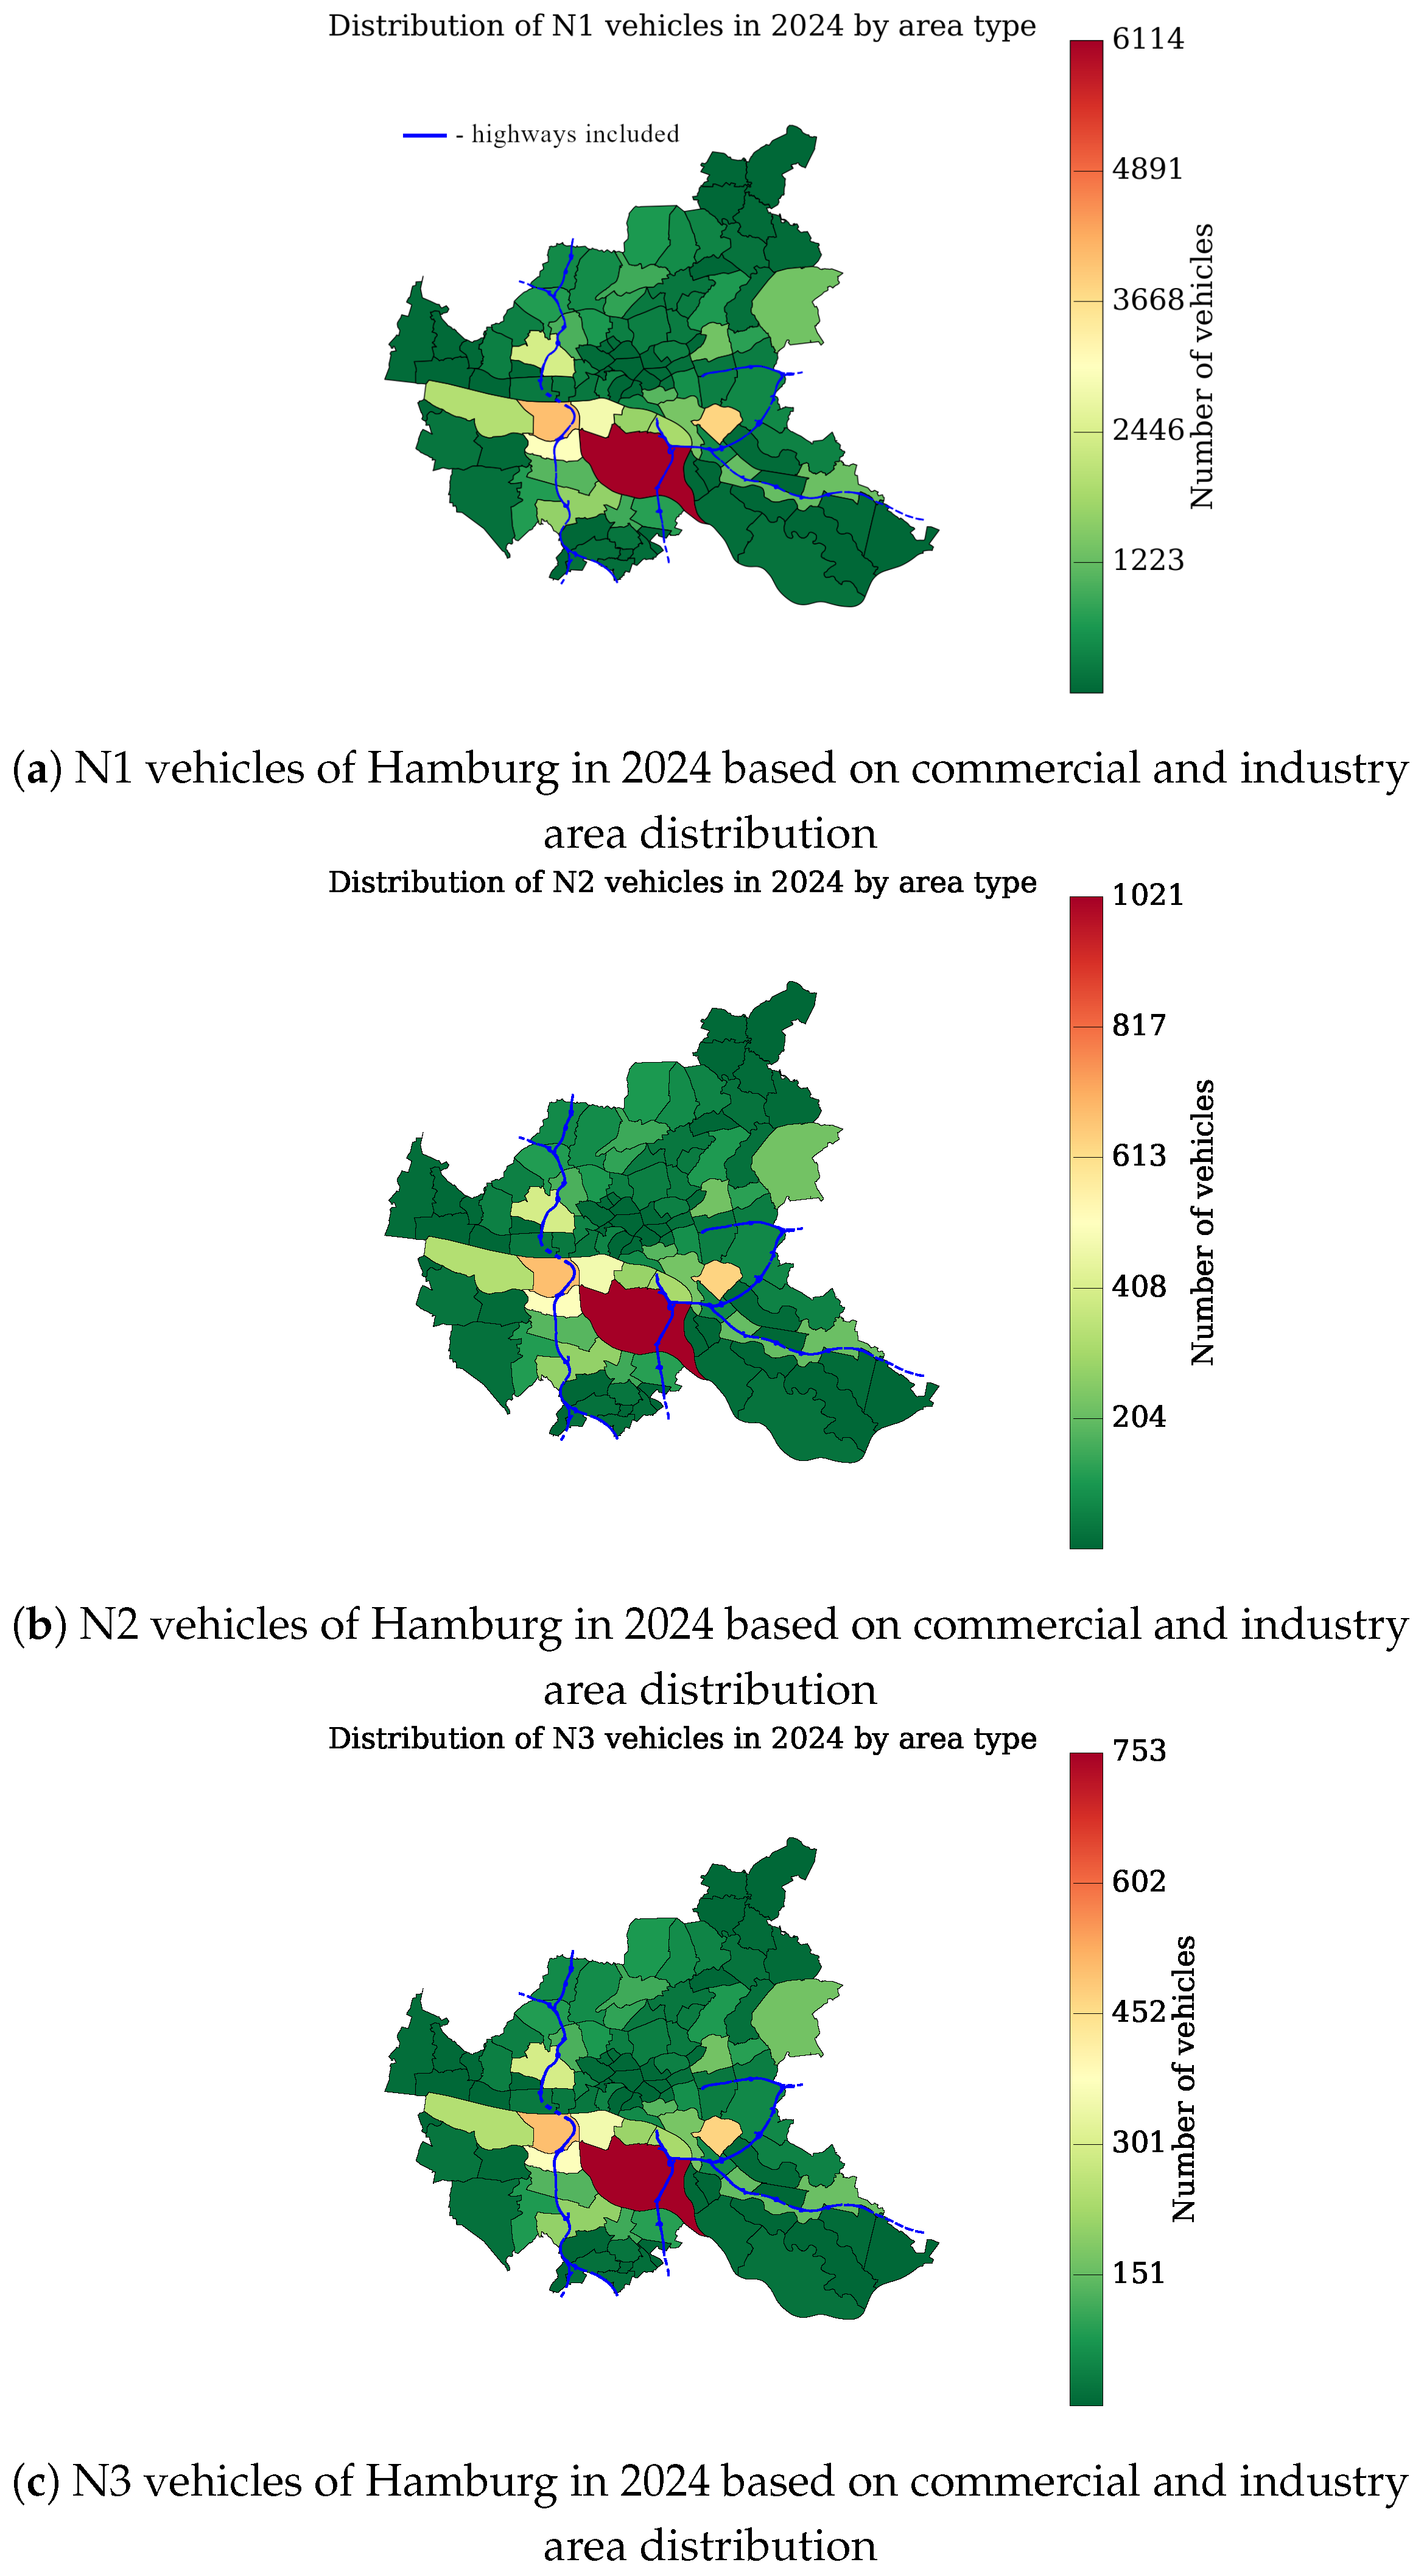
Figure 3 shows color maps representing the spatial distribution of destination goals of different N vehicles in Hamburg, derived from the BVM traffic model [28]. The maps indicate areas with a concentration of parked vehicles. These color maps reflect the daily vehicle distribution within city quarters with parking options, providing insight into the geographic patterns needed to assess future infrastructure needs associated with the electrification of heavy-duty vehicles.
The N1 color map shows the distribution of N1 vehicles, such as vans and small commercial trucks. These vehicles exhibit the highest overall presence, with peak densities exceeding 3100 vehicles in key commercial and business districts. Hamburg-Hammerbrook, Hamburg-Winterhude, and St. Pauli display intense N1 vehicle activity, reflecting their role as central retail, service, and business hubs. Additionally, Hafen City and Wilhelmsburg, known for their logistics and industrial functions, also register high traffic loads of N1 vehicles. In contrast, residential areas within Hamburg’s city limit have much lower population densities, indicating less commercial activity in these areas.
The N2 color map highlights the distribution of medium-sized heavy-duty vehicles (N2 class). N2 vehicles are used primarily for regional freight and logistics across Hamburg. Compared to N1 vehicles, N2 vehicles demonstrate notably lower overall vehicle numbers, with peak concentrations reaching approximately 500 vehicles per city quarter. The highest densities are observed predominantly in commercially and industrially intensive areas such as Hamburg-Hammerbrook, St. Pauli, and Wilhelmsburg. These areas host significant commercial activity, thus attracting higher concentrations of medium-sized trucks.
The N3 color map illustrates the spatial distribution of heavy-duty vehicles of class N3 across Hamburg. The highest concentration of N3 vehicles is observed predominantly in Hamburg’s port area and parts of the city center, correlating closely with industrial and logistics hubs, reflecting their primary function in freight and industrial transport. Wilhelmsburg is aligning with major industrial and logistics centers. Conversely, predominantly residential and commercial districts in the borough of Bergedorf exhibit minimal N3 vehicle activity, primarily due to the lack of industrial demand rather than regulatory or infrastructural restrictions.
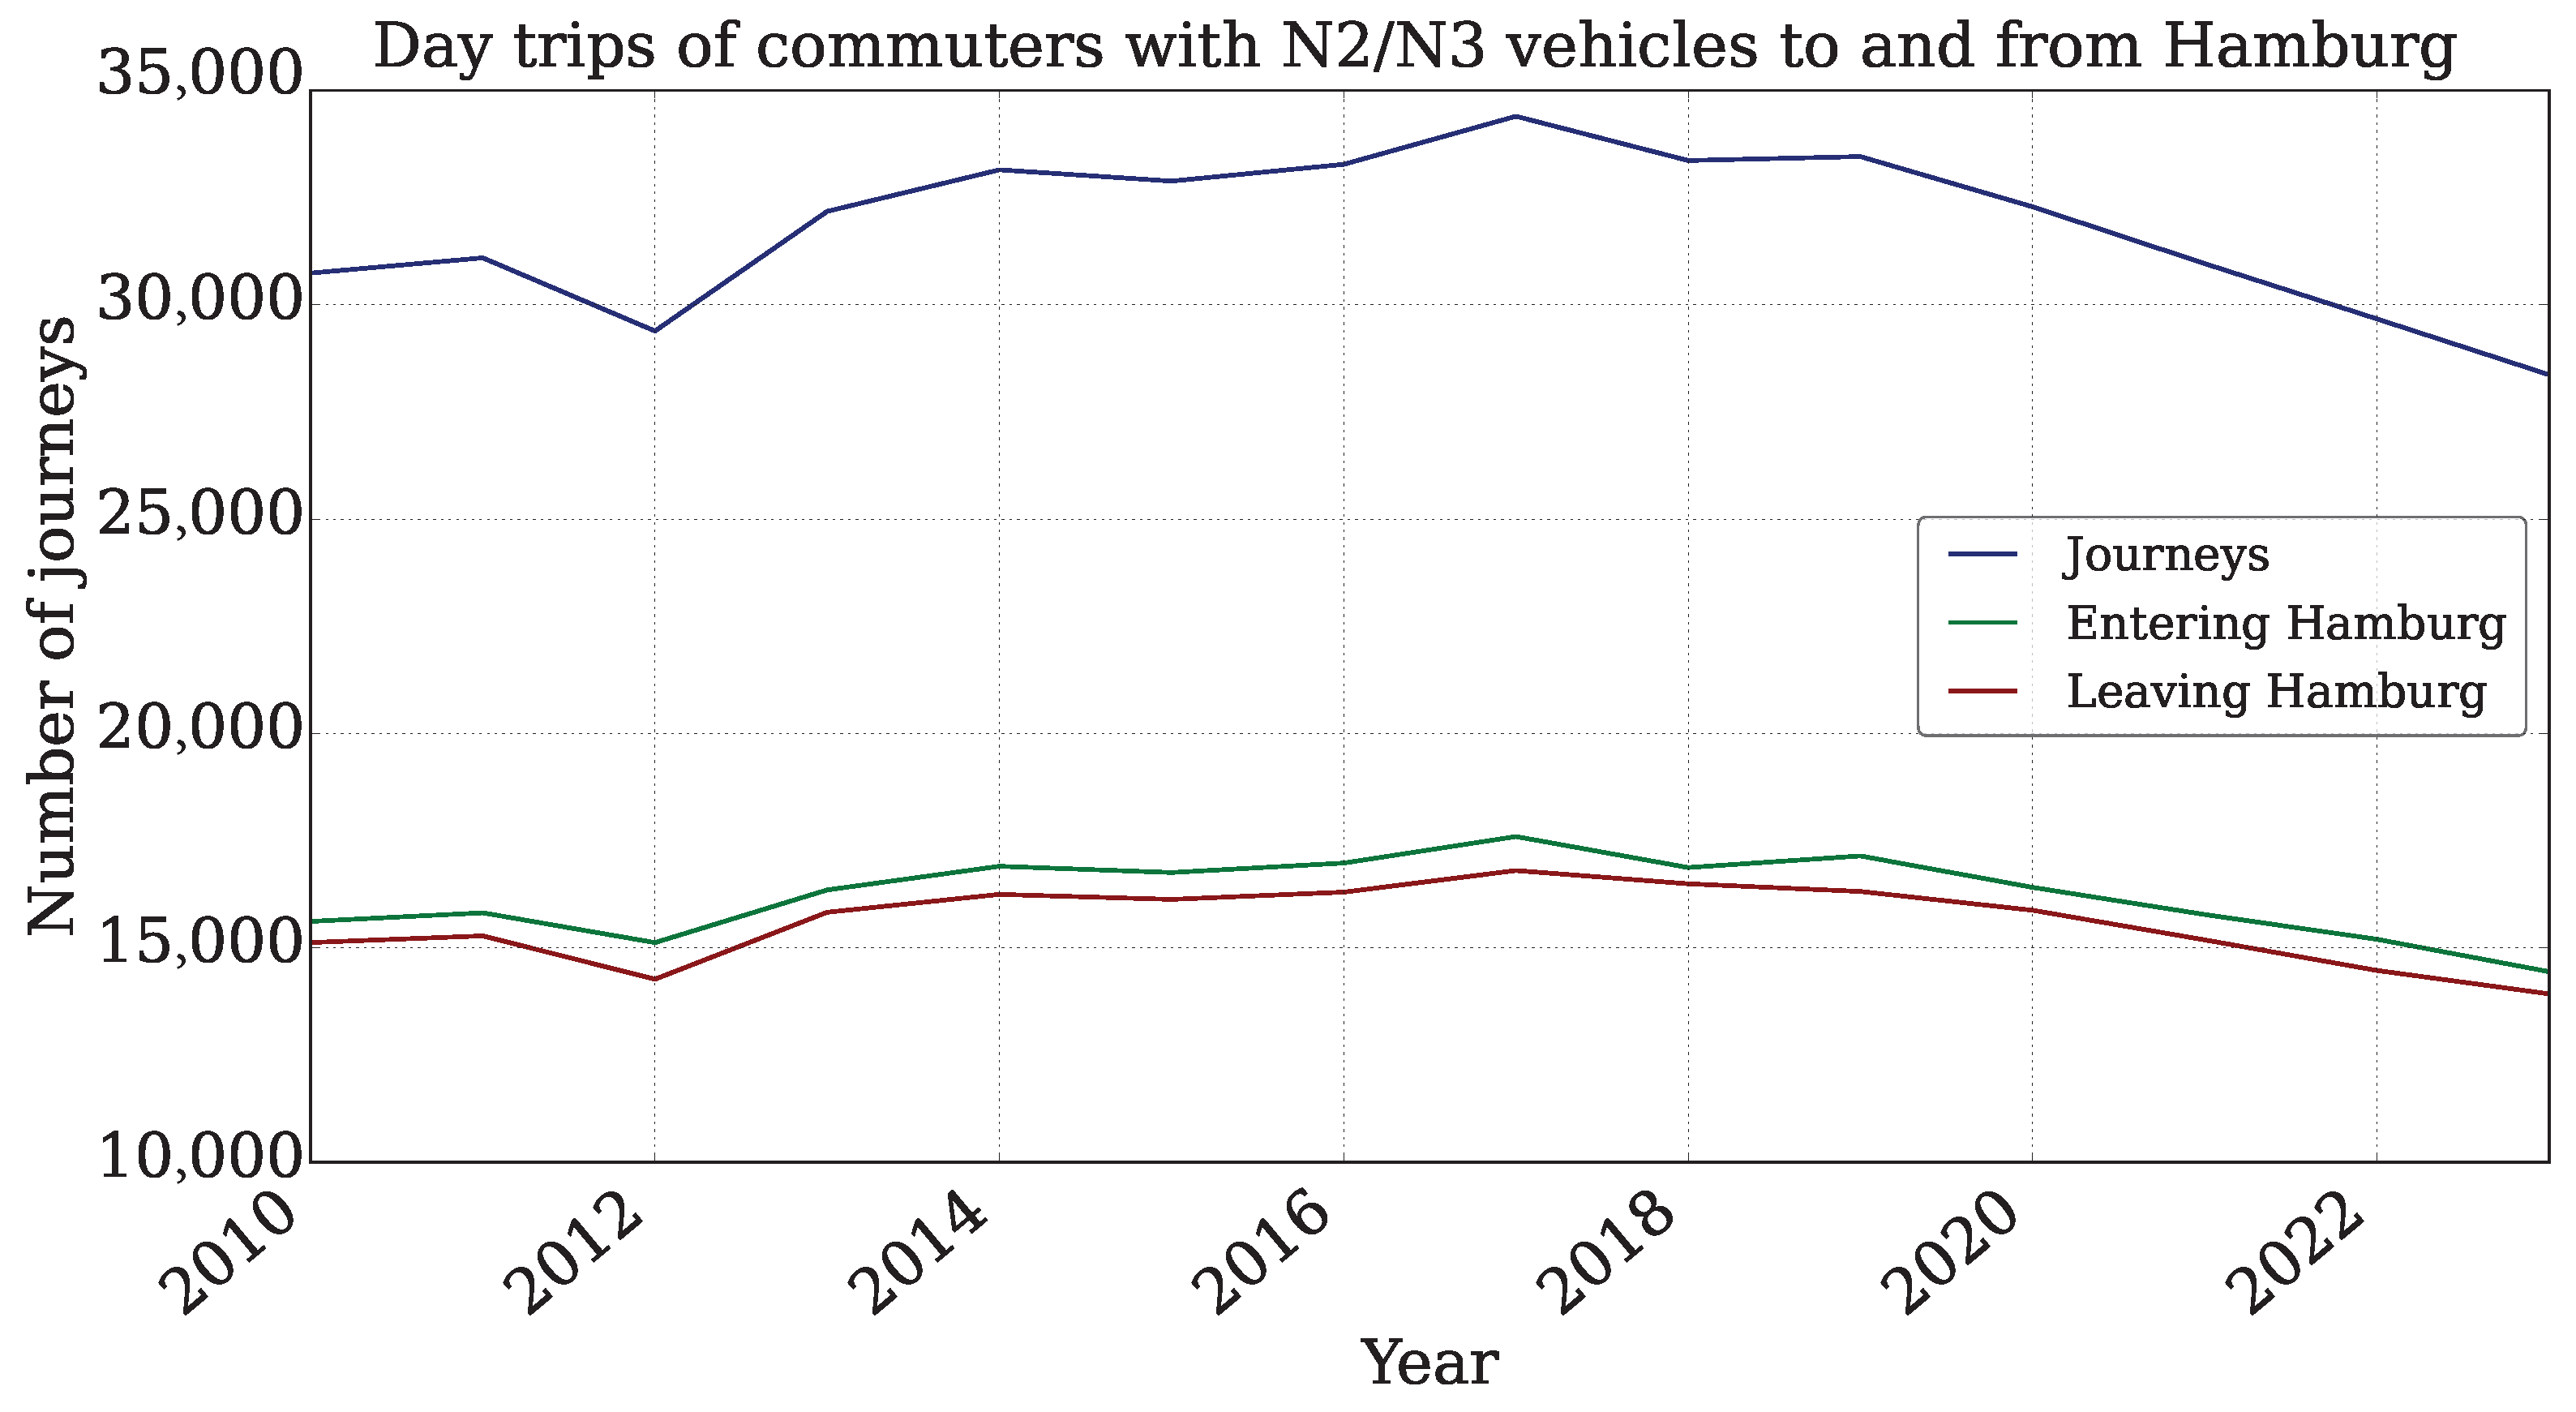
The number of heavy-duty vehicles arriving to Hamburg and departing from Hamburg is considered separately. Due to the significant commuter flow at the Port of Hamburg [29], a large number of N2/N3 vehicles enter the city daily. According to traffic data from KBA, approximately 14,000 heavy-duty N2/N3 vehicles circulate through Hamburg each day (see Figure 4), resulting in an annual total ranging between 28,000 and 35,000 trips. Over recent years, there has been a slight upward trend in these commuter trips. Additionally, a traffic model developed by BVM shows that around 400 light-duty N1 vehicles enter Hamburg daily from surrounding regions [28]. Integrating these commuting traffic flows with the internal city distribution forecasts provides a more comprehensive basis for projecting future power demand on Hamburg’s power network.

3. Distribution by City Quarters

Hamburg is divided into 7 administrative districts and 103 quarters, each characterized by distinct urban and economic structures. As the district where N vehicles are officially registered often differs from their actual operational locations (such as depots or service centers) [23,32], the registration data alone is insufficient for accurate distribution analysis. In accordance with the following, three groups of factors concerning the location of transportation units and their logistics infrastructure in the 103 quarters of Hamburg are taken into account.
Various sources to refine the distribution are applied:
  • Commercial and industrial areas in each quarter from the Hamburg Real Estate Market Report 2020, which provides information on the distribution of these areas [33].
  • Company address data from the Hamburg Telephone Directory [34] for each quarter is examined and taken into account.
  • Estimation of the number of trucks and tractor units parked in parking lots in each quarter using satellite imagery [35]. Truck dealer parking lots are excluded.
Each approach provides a unique perspective, contributing to a comprehensive understanding of vehicle distribution within the city. Combining these datasets provides a comprehensive overview of transport and logistics infrastructure locations in Hamburg, facilitating a precise evaluation of spatial distribution and utilization patterns of N vehicles across the city. Furthermore, a combined distribution scenario derived from these independent datasets through MILP is presented, minimizing deviations between the individual approaches and offering a balanced representation of vehicle distribution.
The first distribution approach E estimates the number of registered N vehicles N T by type T (N1, N2 or N3) distributed proportionally across the commercial and industrial areas W E , T , Q in each quarter Q:
N E , T , Q = W E , T , Q W E , T , Q · N T ,
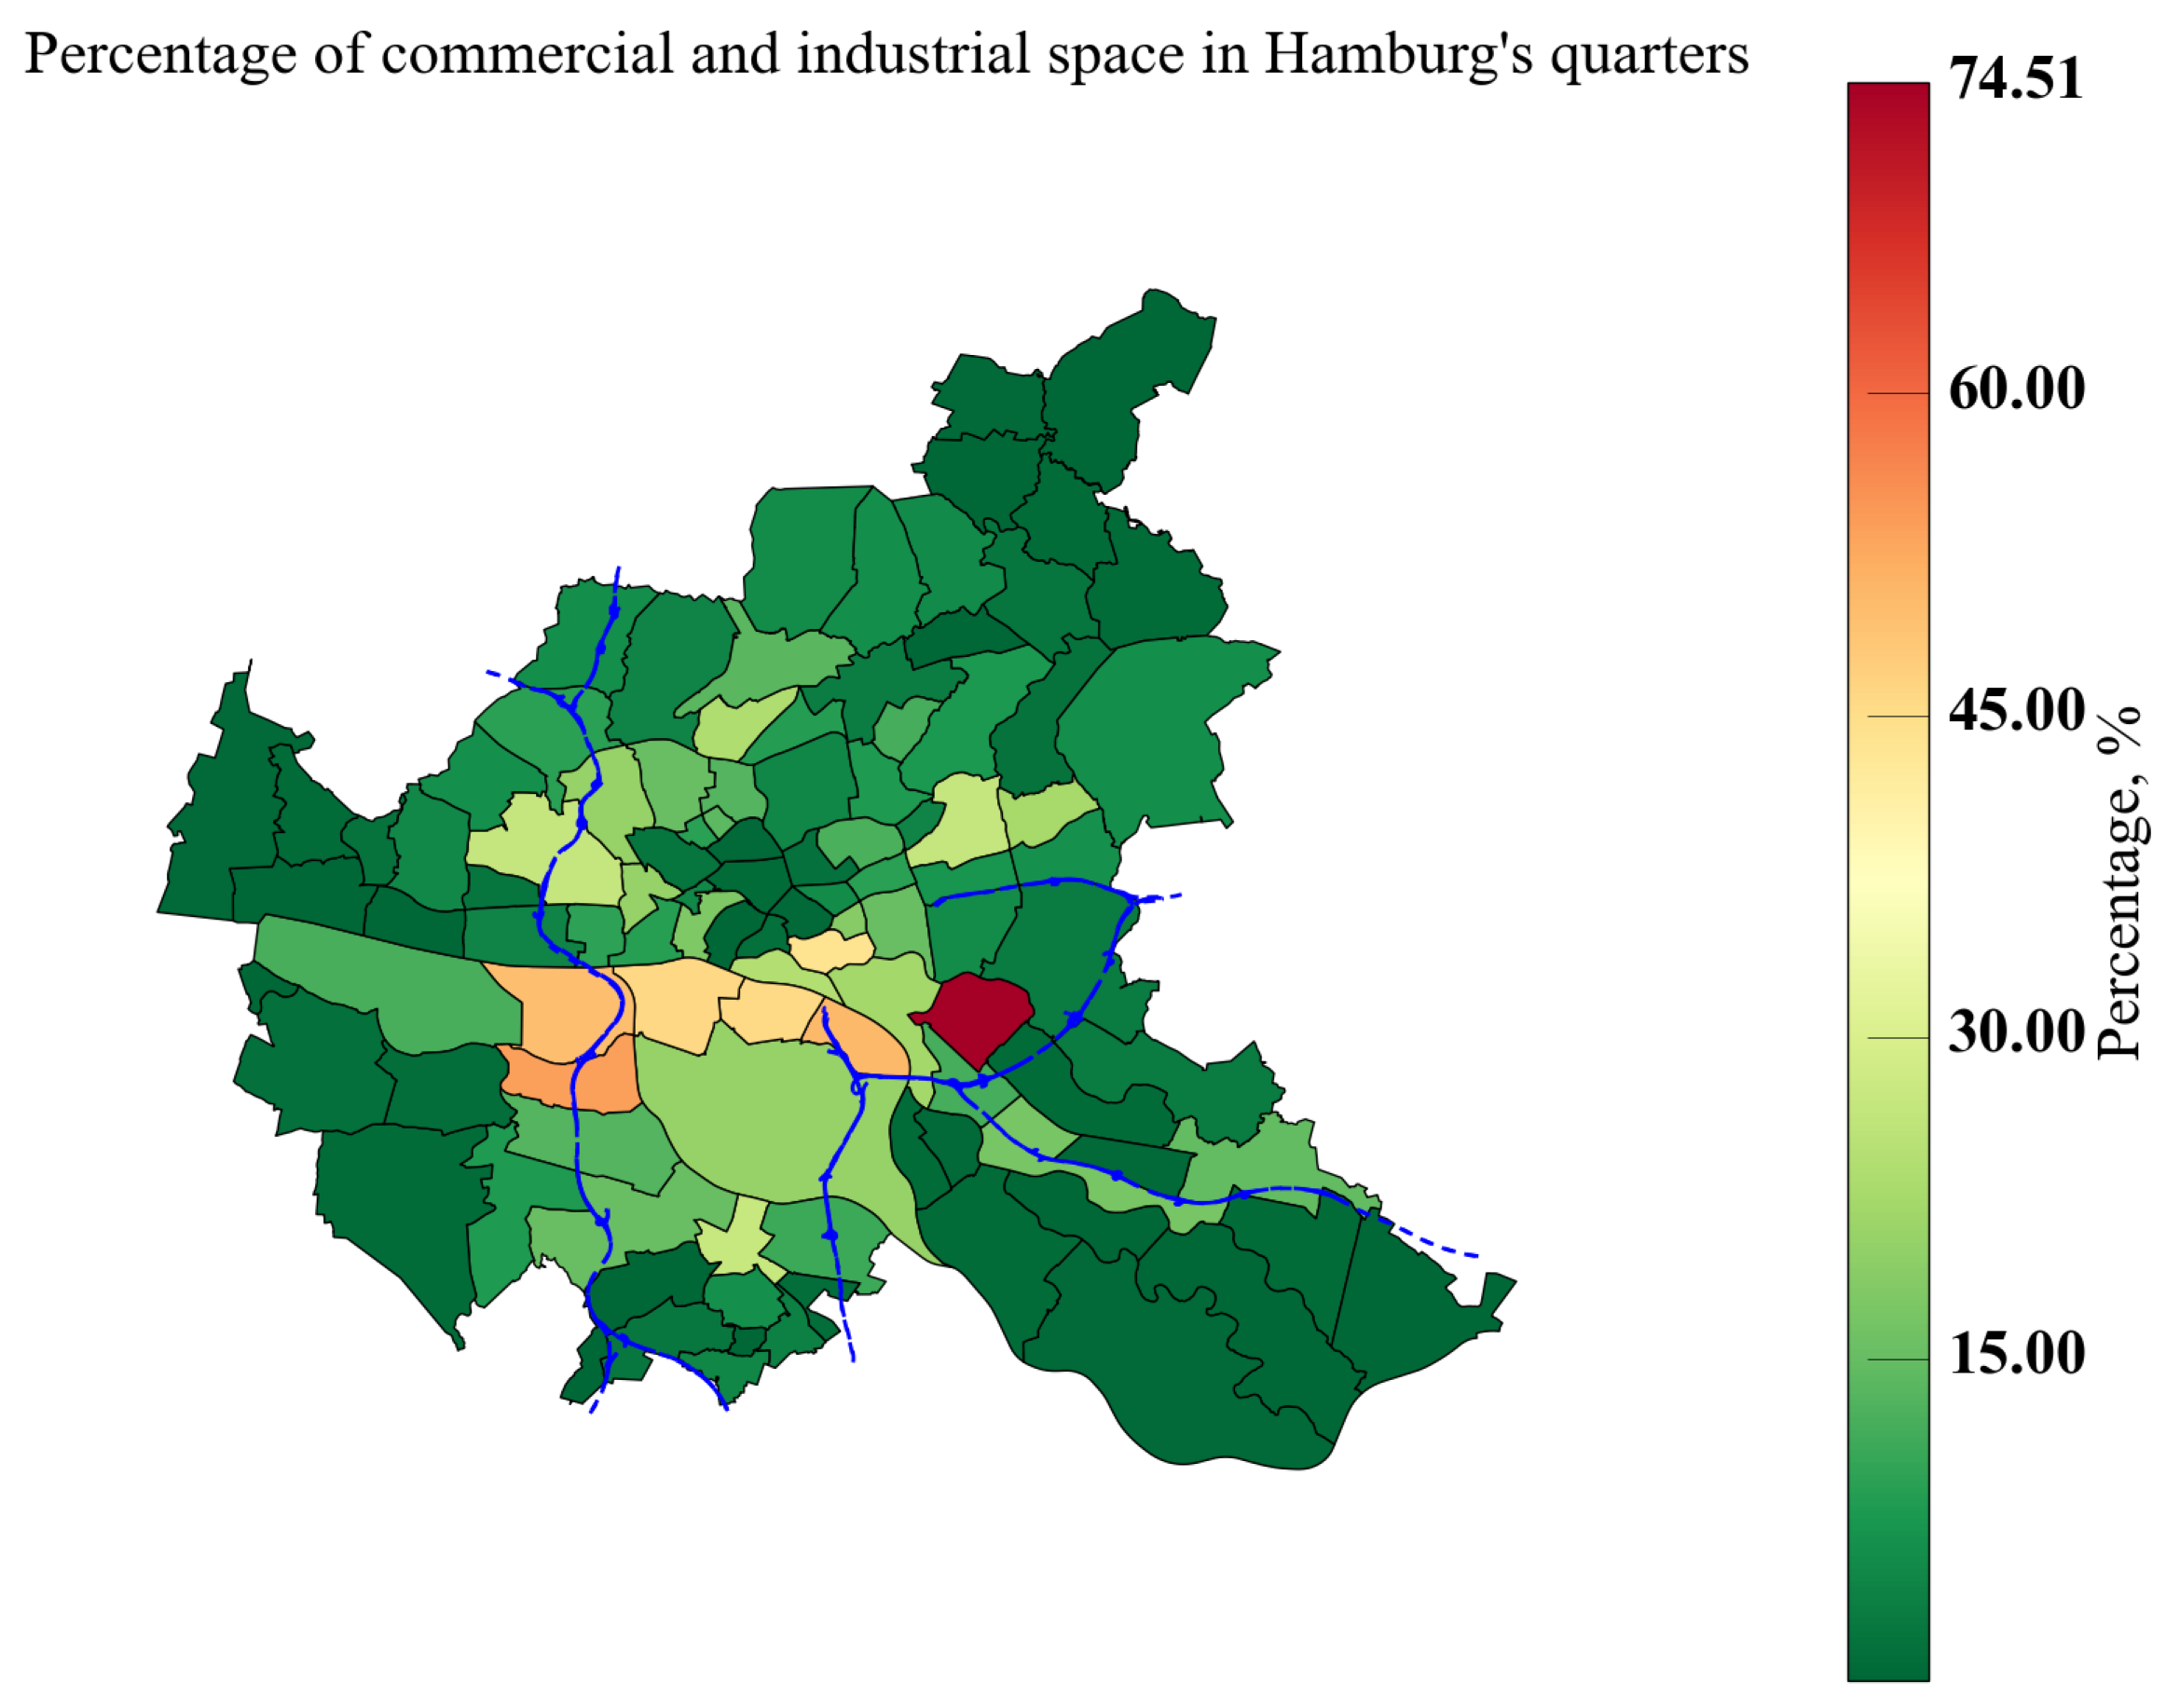
where N E , T , Q is the number of vehicles in city quarter Q when using the approach E. Figure 5 illustrates the percentage of commercial and industrial space, which serves as a foundational parameter for these analyses. The total area designated for commercial and industrial activities in Hamburg is 69 square kilometers, which accounts for approximately 9.2% of the city’s total area. The quarters of Wilhelmsburg, Waltershof, and Billbrook have the largest share of industrial and commercial areas (each over 4 square kilometers) and are part of the Hamburg-Mitte administrative district [33]. In addition, 74% of the entire Billbrook quarter is allocated to such purposes. Wilhelmsburg is the largest area concerning the availability of space for industrial and commercial usage. Based on the commercial information provided, an overall picture (see Figure 6) of the potential truck and tractor location is taken into account.
The second distribution C is based on company address data derived from the city’s commercial directory [34]. The analysis includes counting the number of registered companies by city quarters. Then, the number of registered trucks and tractor units N T is distributed proportionally to the cluster of companies W C , T , Q relative to the distribution by city quarters Q:
N C , T , Q = W C , T , Q W C , T , Q · N T ,
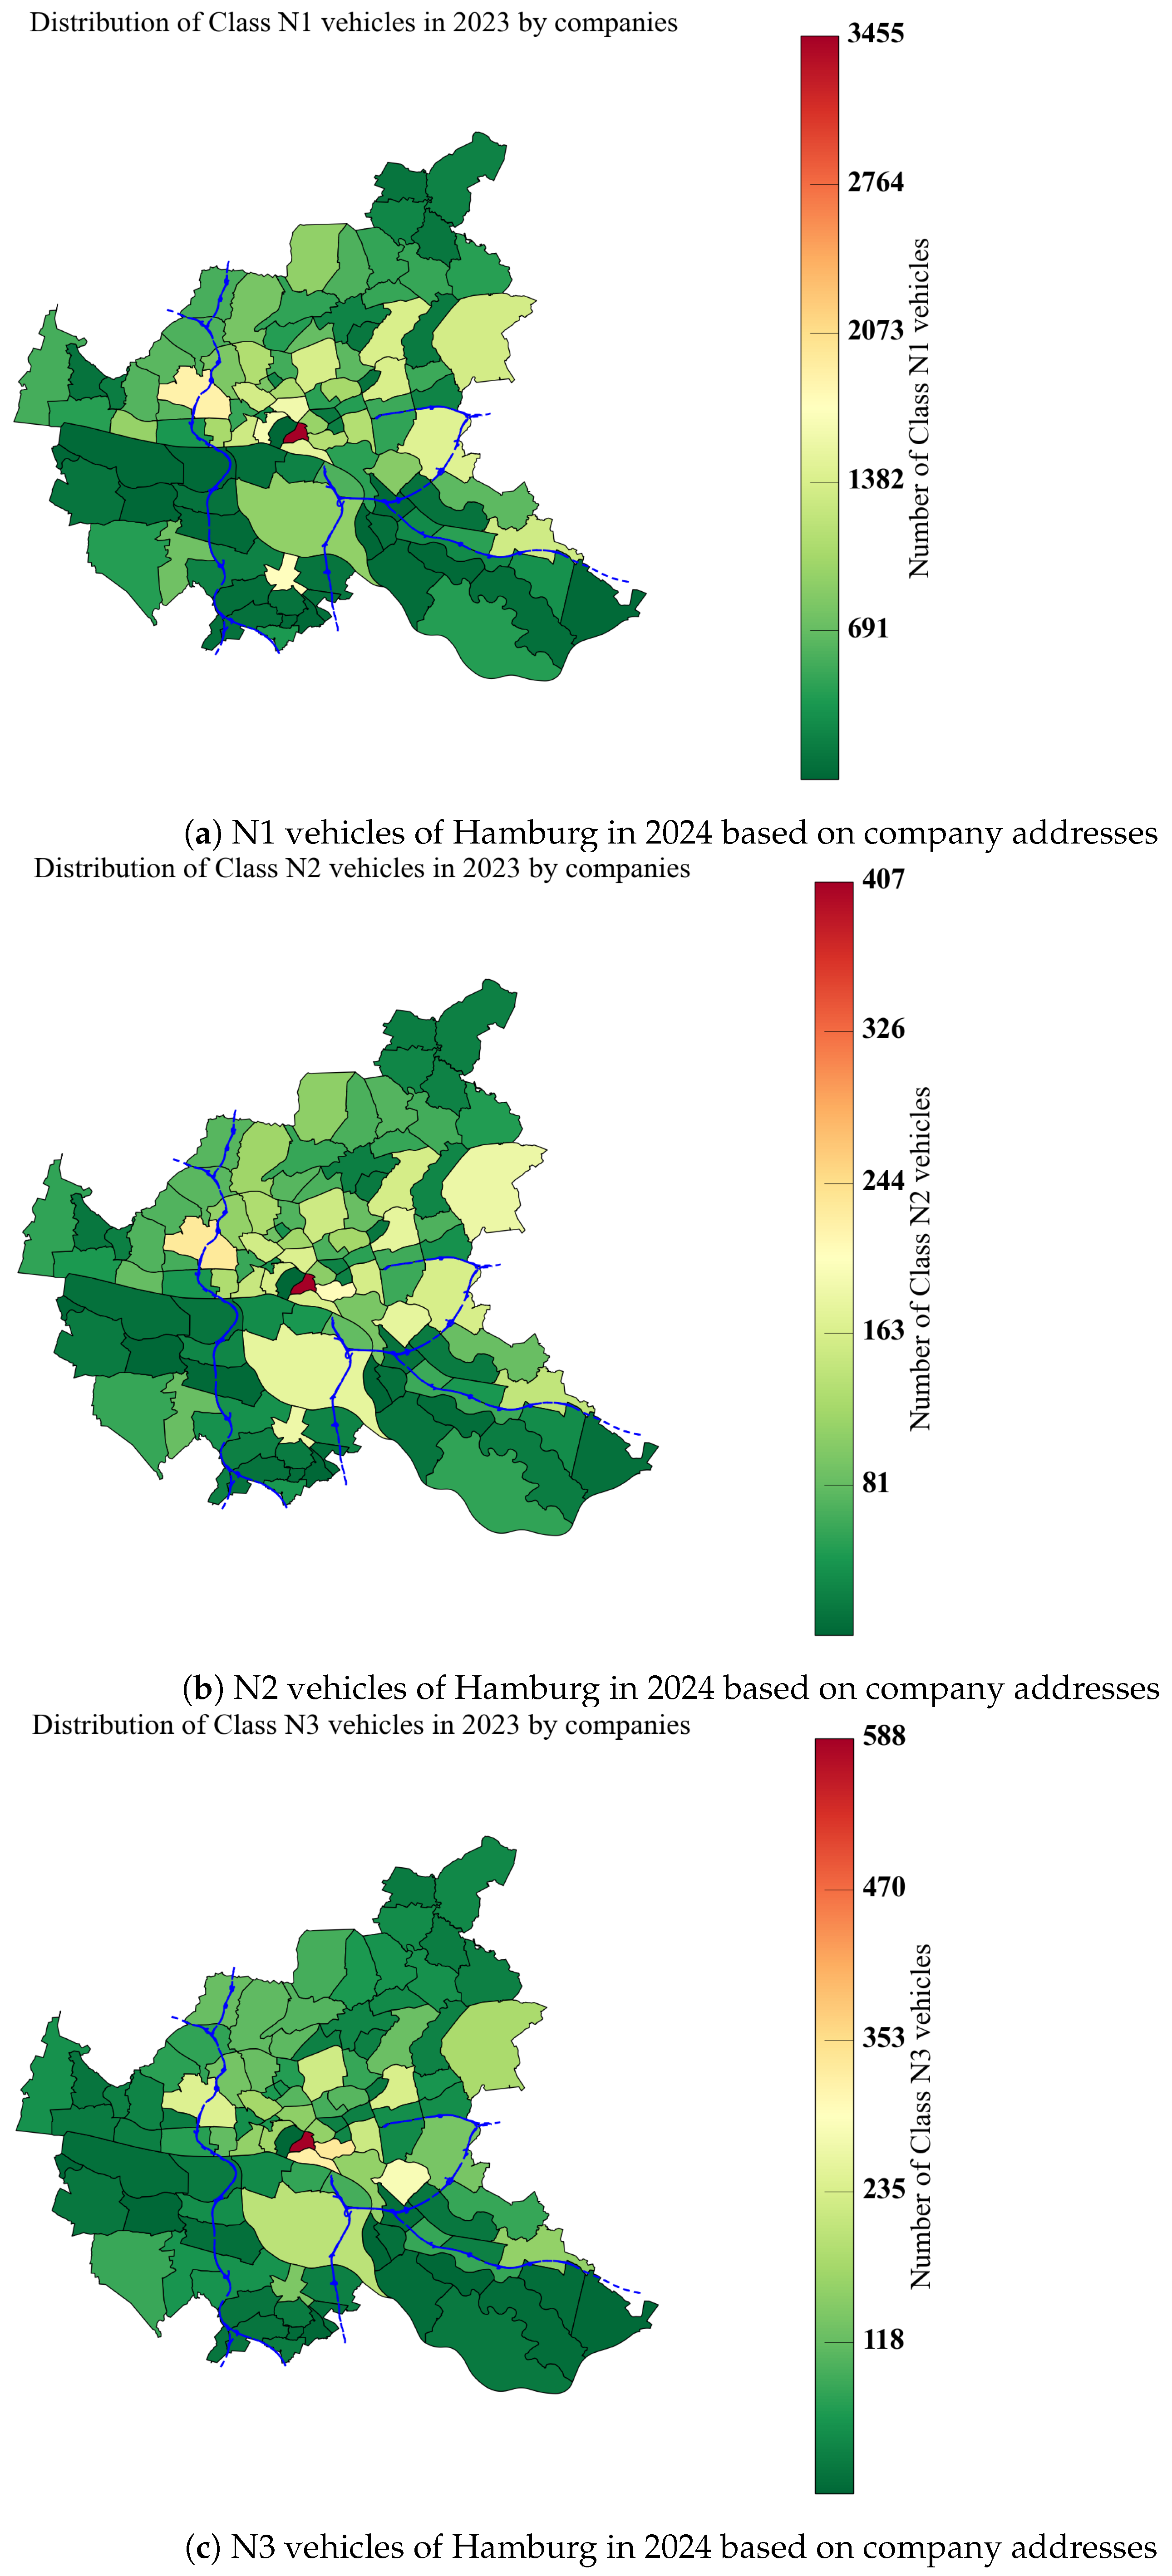
where N C , T , Q is the number of vehicles in city quarter Q when using the approach C. The dataset encompasses over 15,000 logistics, trade, and service companies categorized into more than 21 economic sectors, including construction, trade, warehousing, and agriculture. Moreover, data from the KBA (FZ5 and FZ23) [23] and the Hamburg Chamber of Commerce [36] are included, giving an idea of the concentration and types of businesses in the quarters. Figure 7 illustrates the geographical distribution of heavy-duty vehicles determined through this dataset, highlighting the highest concentrations in central commercial and business-oriented quarters such as Hamburg-Altstadt, Neustadt, and Hafen City.
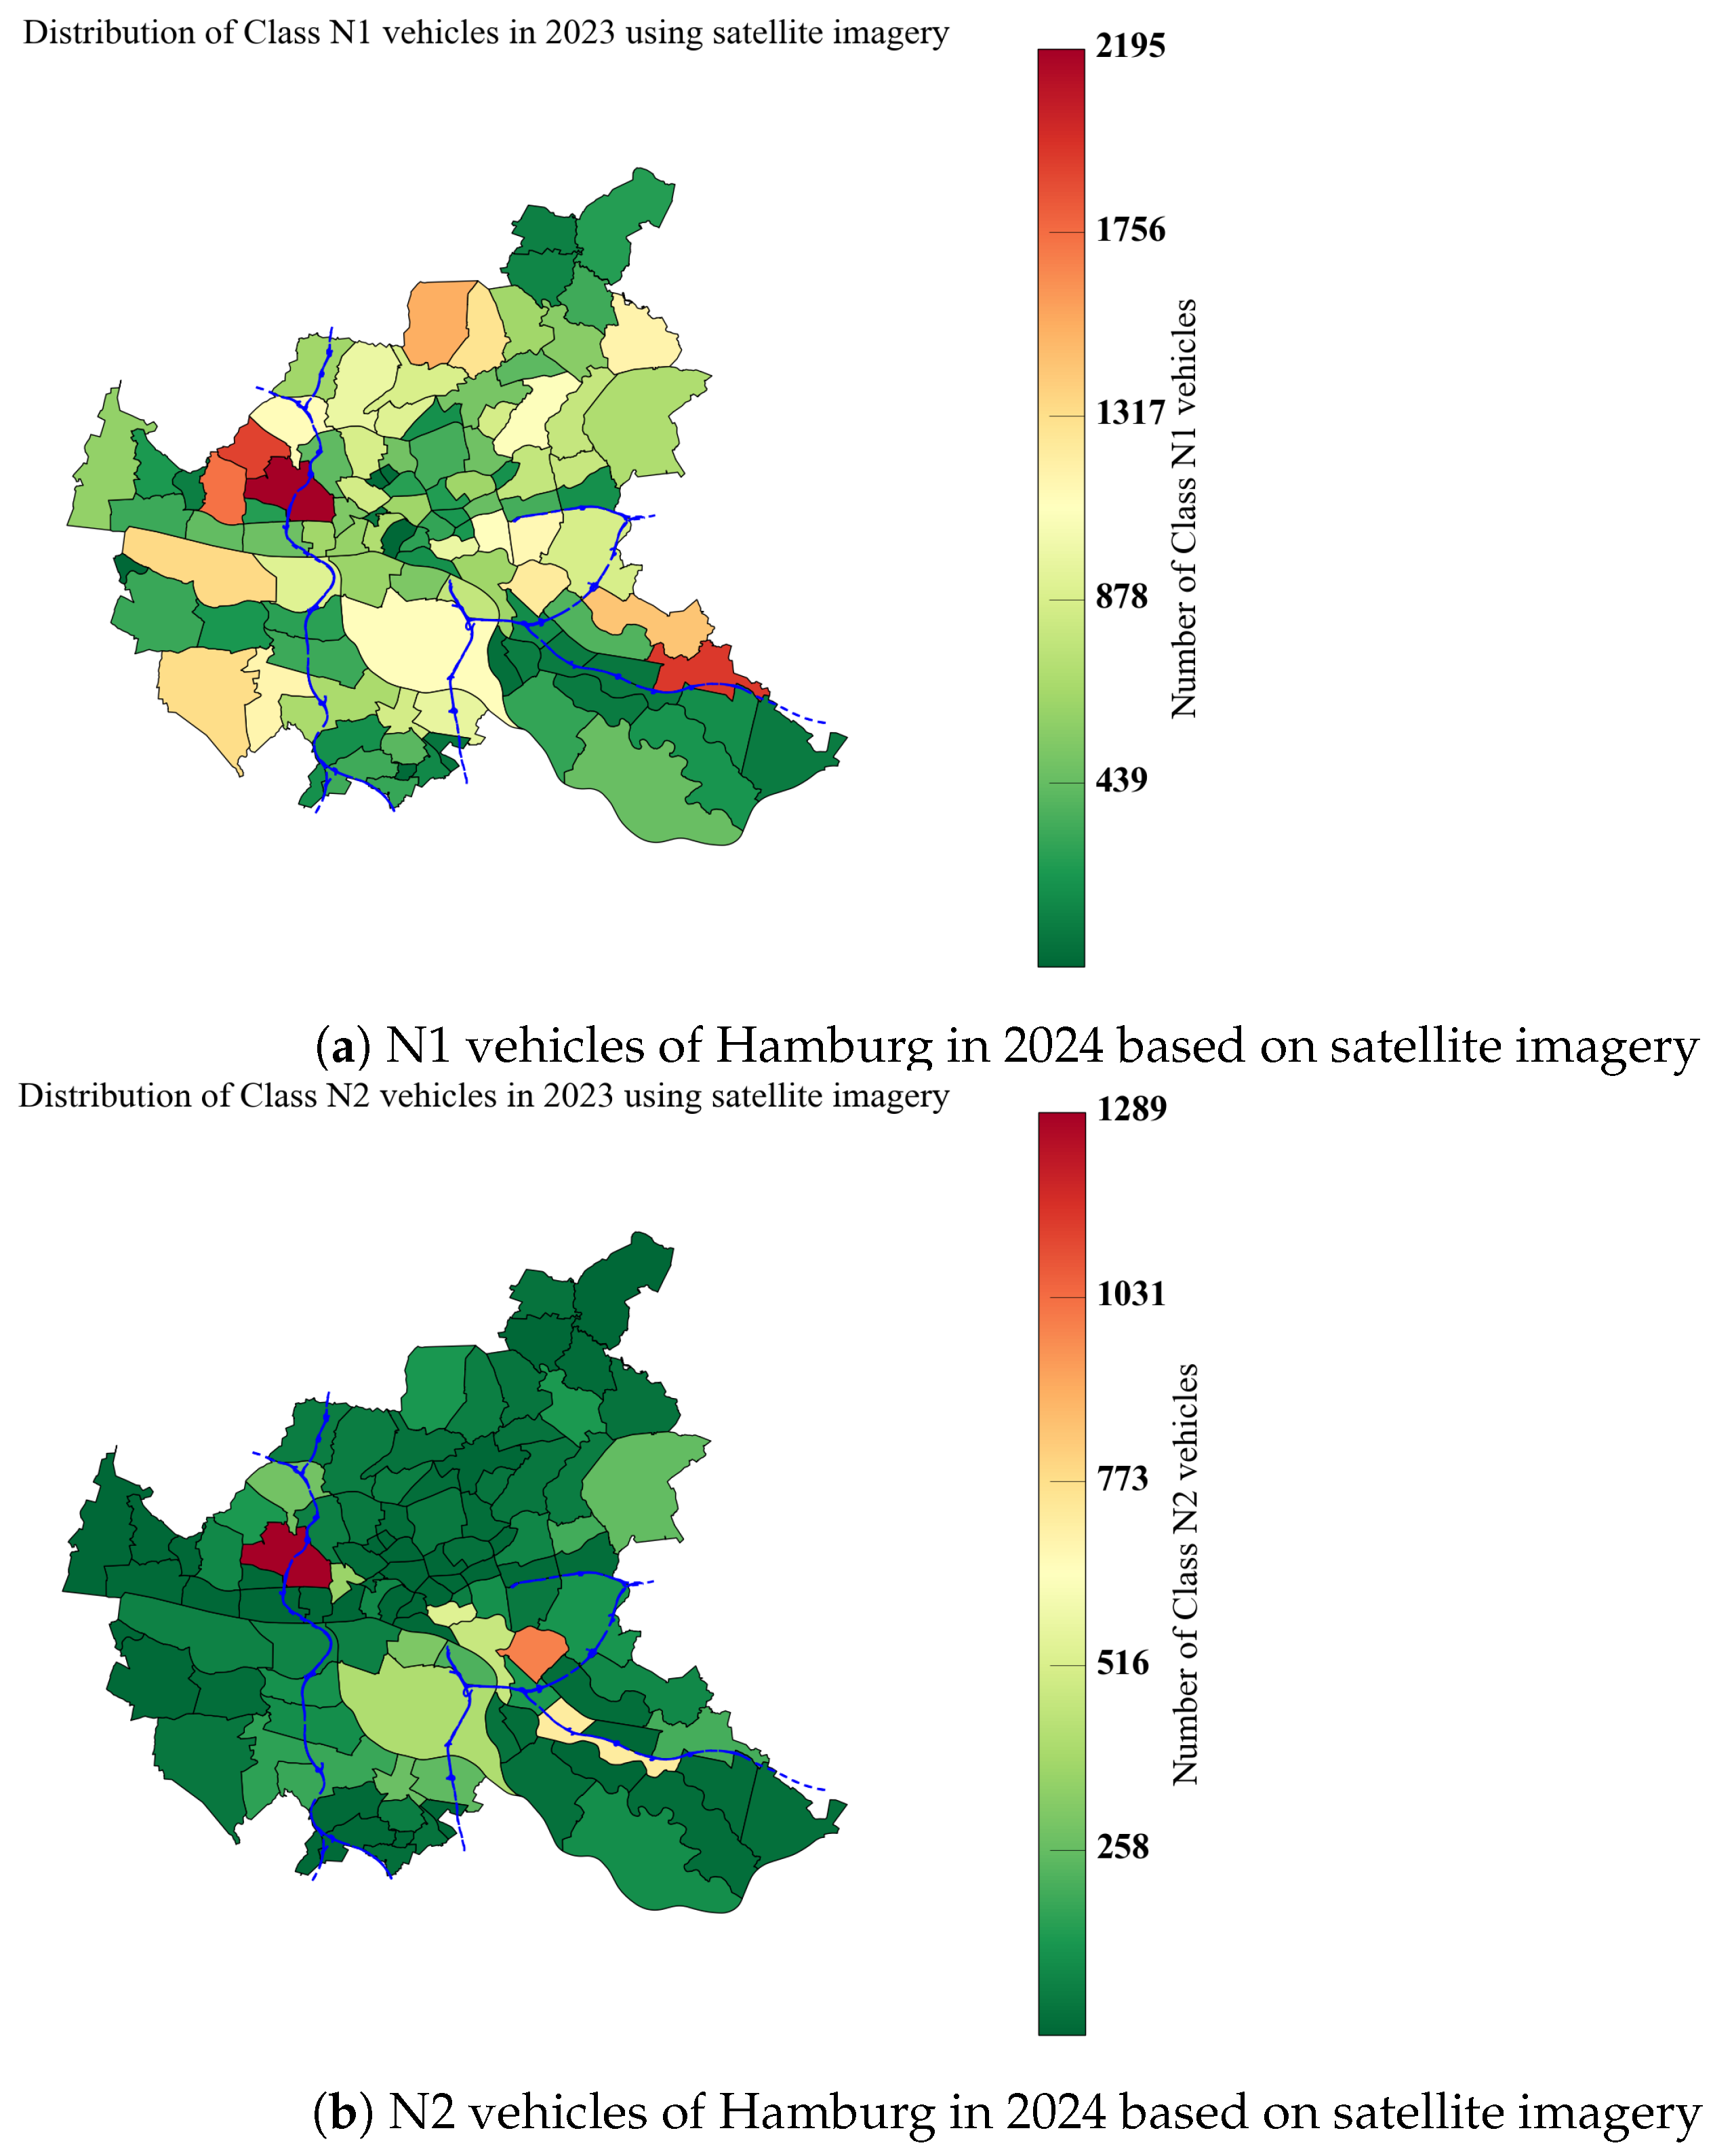
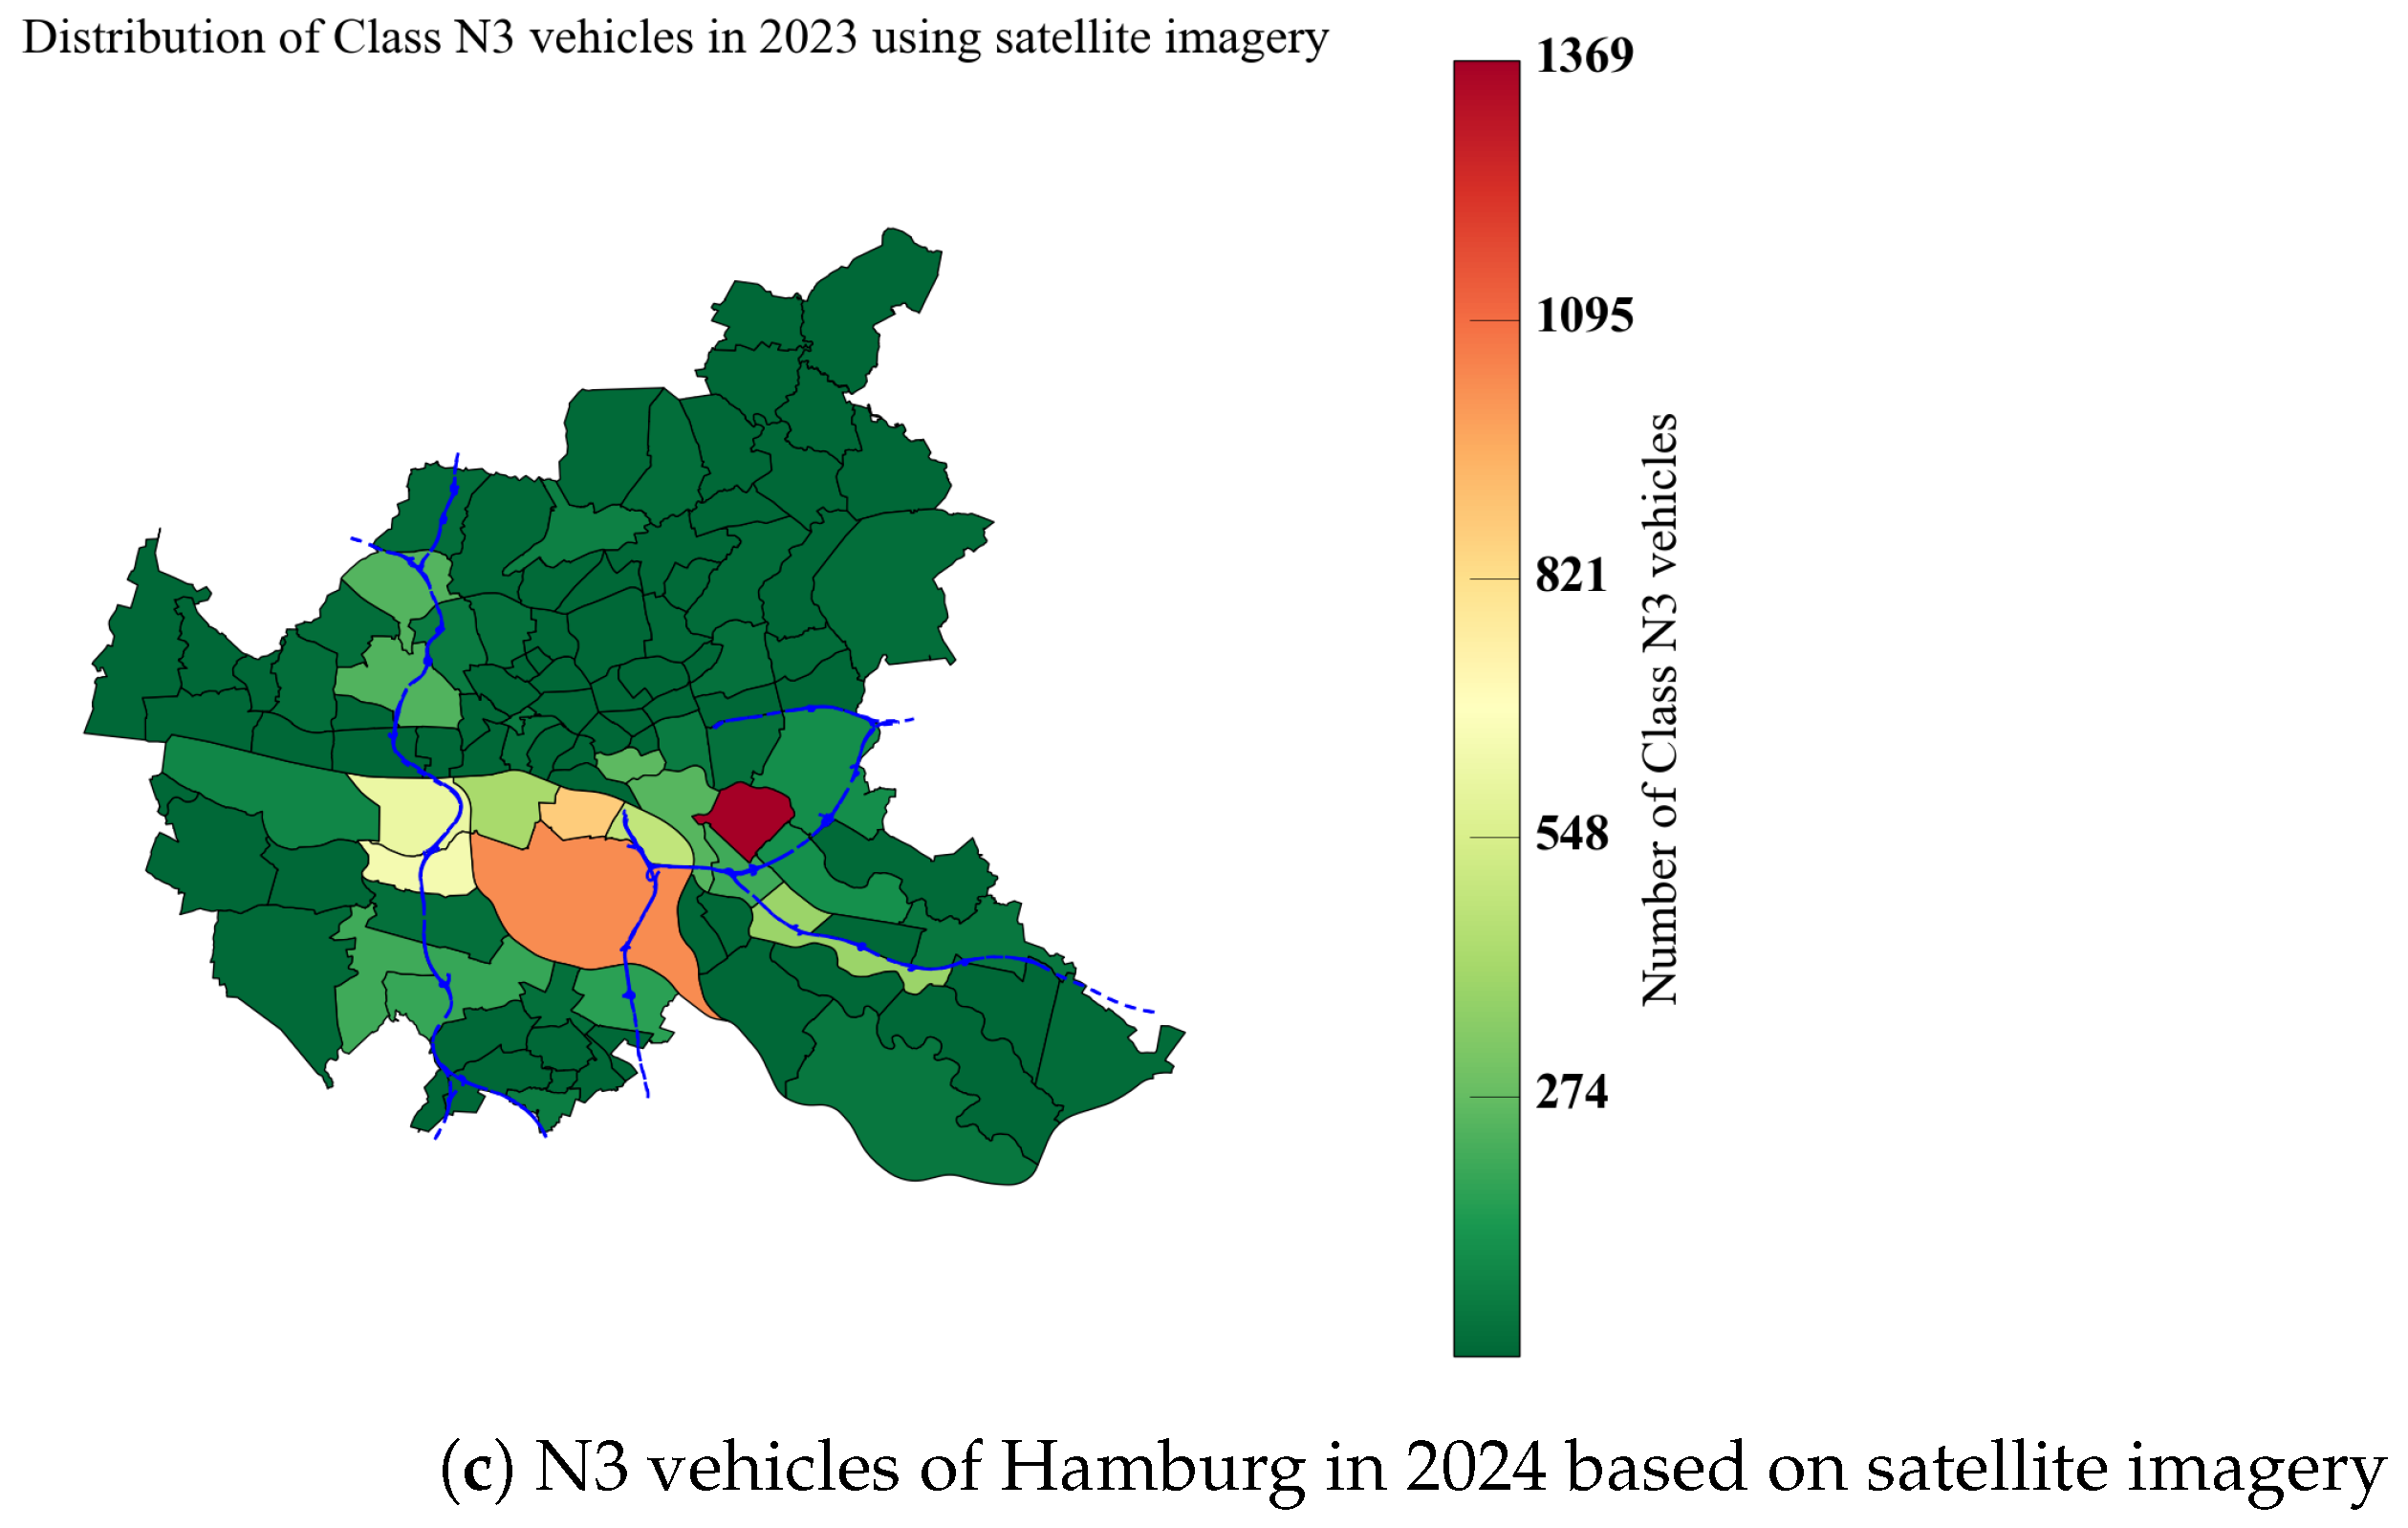
The third approach S includes satellite imagery analysis (see Figure 8), providing a visual assessment of the geographical distribution of N vehicles within Hamburg during daytime, conducted through Google Earth databases [35]. Each quarter Q is manually examined to identify parked vans, trucks, and tractor units, focusing specifically on visible outdoor parking locations. The number of registered trucks and tractor units N T is distributed proportionally to the counted vehicles W S , T , Q in each quarter Q:
N S , T , Q = W S , T , Q W S , T , Q · N T ,
where N S , T , Q is the number of vehicles in the city quarter Q when using the approach S. The visual evaluation indicated the highest concentration of N1 vehicles in Bahrenfeld, while other districts had comparatively fewer observed vehicles. However, Wilhelmsburg showed significant numbers of parked N2/N3 vehicles. It is important to note that satellite image analysis has inherent limitations, as it excludes vehicles parked indoors or under covered structures, thus potentially underestimating the actual vehicle count.

MILP-Based Approach of Distribution by City Quarters

An analysis based only on the distribution of commercial and industrial zones, or the location of registered companies or satellite imagery, is not accurate enough to estimate the actual distribution of N vehicles (vans, trucks, and tractor units). To construct a consistent distribution that accounts for the divergence between the three spatial data sources (commercial and industrial zones E, company locations C, and satellite imagery S), difference arrays D E C , T , Q , D E S , T , Q , D C S , T , Q of the number of vehicles per class T in each city quarter Q are calculated:
D E C , T , Q = E T , Q C T , Q ,
D E S , T , Q = E T , Q S T , Q ,
D C S , T , Q = C T , Q S T , Q ,
The following step presents the continuous weights W E C , T , Q , W E S , T , Q , and W C S , T , Q , which are adaptive coefficients:
W E C , T , Q + W E S , T , Q + W C S , T , Q = 100 % ,
By optimizing these weights from Equation (7), it can be derived how much each pair of data sources E , C , S diverges in estimating the distribution of vehicles. In some quarters, a single source may be less reliable: for example, in a densely populated residential area, a satellite analysis may be more accurate than a distribution by company. Due to continuity, the weights can take any value between 0% and 100%, allowing a flexible and adaptive MILP model to be built instead of rigid pre-defined coefficients. Finally, the Gurobi optimizer [37] solves the objective function:
min W E C , T , Q · D E C , T , Q + W E S , T , Q · D E S , T , Q + W C S , T , Q · D C S , T , Q ,
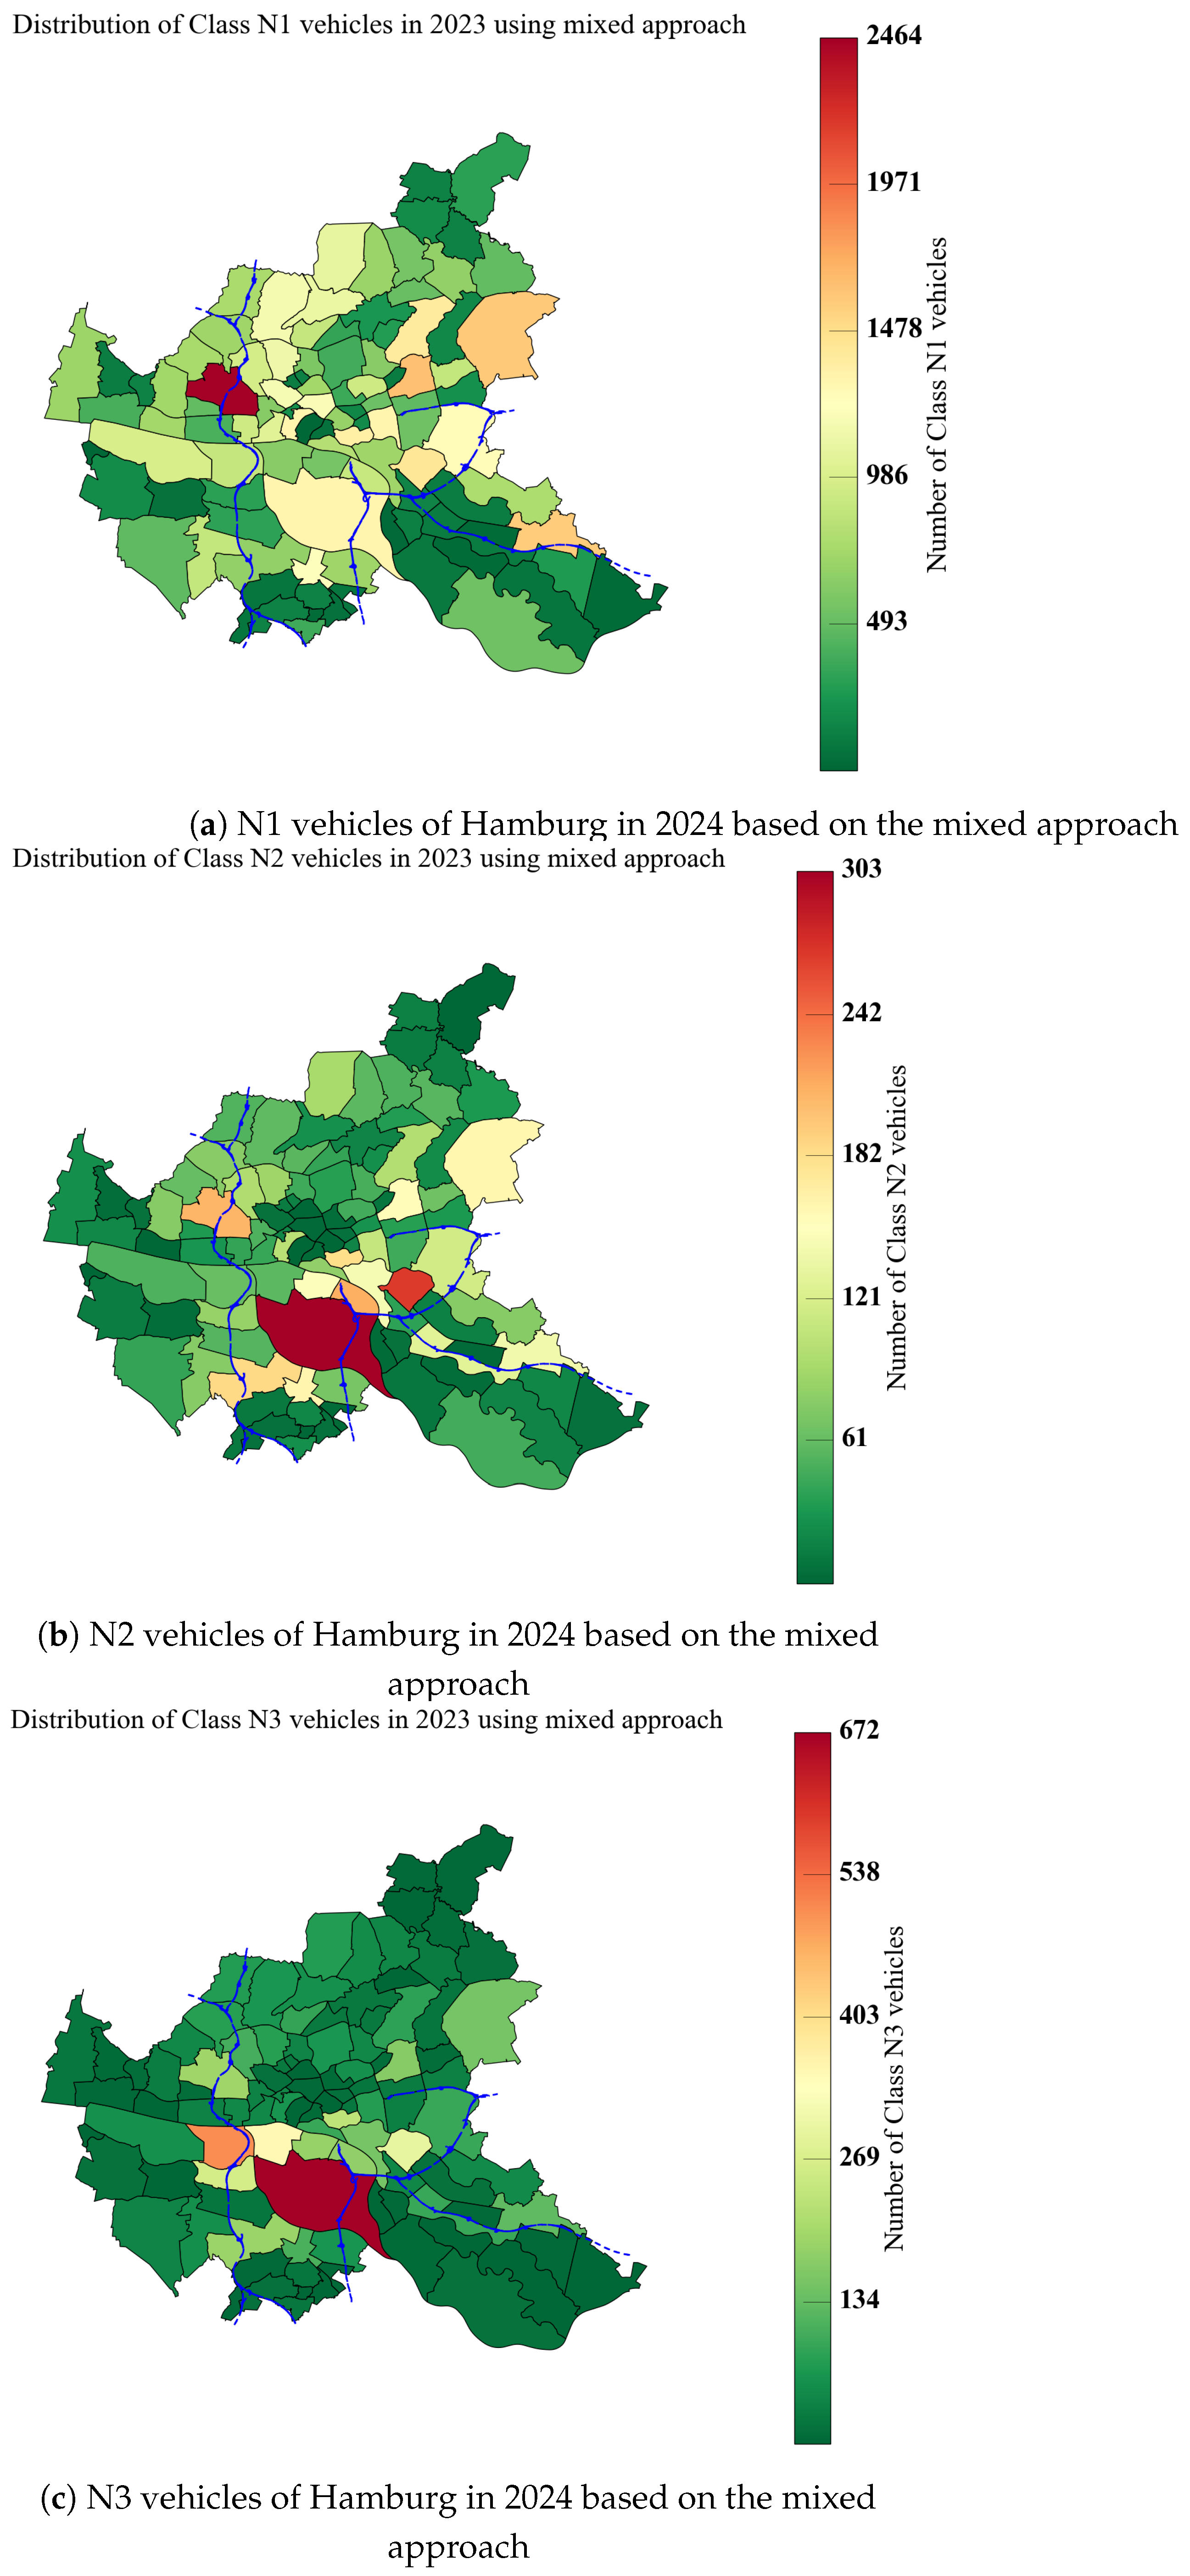
The deviation values from Equations (4)–(6) are input parameters representing the relative share of different class vehicles expected in each city quarter Q according to the three approaches E , C , S . By minimizing this weighted sum from Equation (8), the MILP optimization ensures that the resulting spatial distribution achieves the best compromise between the three independent estimation methods. The final mixed distribution M of truck and tractor units among Hamburg’s city quarters is presented in Figure 9. The total number of vehicles N T registered (for example, in Hamburg as of 2024 [24]) is proportionally distributed to the city quarters Q according to the weights from Equations (7) and (8) calculated by the MILP optimizer:
N M , T , Q = ( W E C , T , Q · D E C , T , Q + W E S , T , Q · D E S , T , Q + W C S , T , Q · D C S , T , Q ) ( W E C , T , Q · D E C , T , Q + W E S , T , Q · D E S , T , Q + W C S , T , Q · D C S , T , Q ) · N T ,
where N M , T , Q is the number of vehicles in the city quarter Q when using the mixed approach M.
The combined distribution M indicates that Hamburg-Mitte has the highest concentration of heavy-duty vehicles, especially in Rothenburgsort, Wilhelmsburg, and Hammerbrook quarters. N1 vehicles constitute the majority citywide and are mainly concentrated in commercial and industrial zones, particularly in Hamburg-Bahrenfeld (over 2300 vehicles) and Hamburg-Rahlstedt (around 1500). These patterns align with earlier traffic studies showing peak logistical activity near the Port of Hamburg [2,29], supporting the validity of the spatial distribution results.

4. Ramp-Up Scenarios in Hamburg

Despite historical fluctuations influenced by economic, social, and regulatory factors, the overall trend in freight transportation indicates continued long-term growth, as supported by numerous forecasts from commercial companies and institutions [4,5,6,7,8,9,10,11] summarized in Table 2. In addition, the increase in the number of electric trucks and tractor units by 2050 is influenced not only by current mobility trends, and political and social factors, but also by the technological progress made recently, as noted in various other studies [1,38]. Therefore, the report presents three groups of scenarios, considering both the main scenario of the studied material and scenarios in which the current situation may change, especially in road and environmental legislation. The prediction channel is −15% for the optimistic growth scenario and +15% for the pessimistic case, respectively. For each scenario, the development of the fleet of trucks and tractor units is modeled separately for N1 vehicles and N2/N3 vehicles.

4.1. Ramp-Up of N1 Vehicles

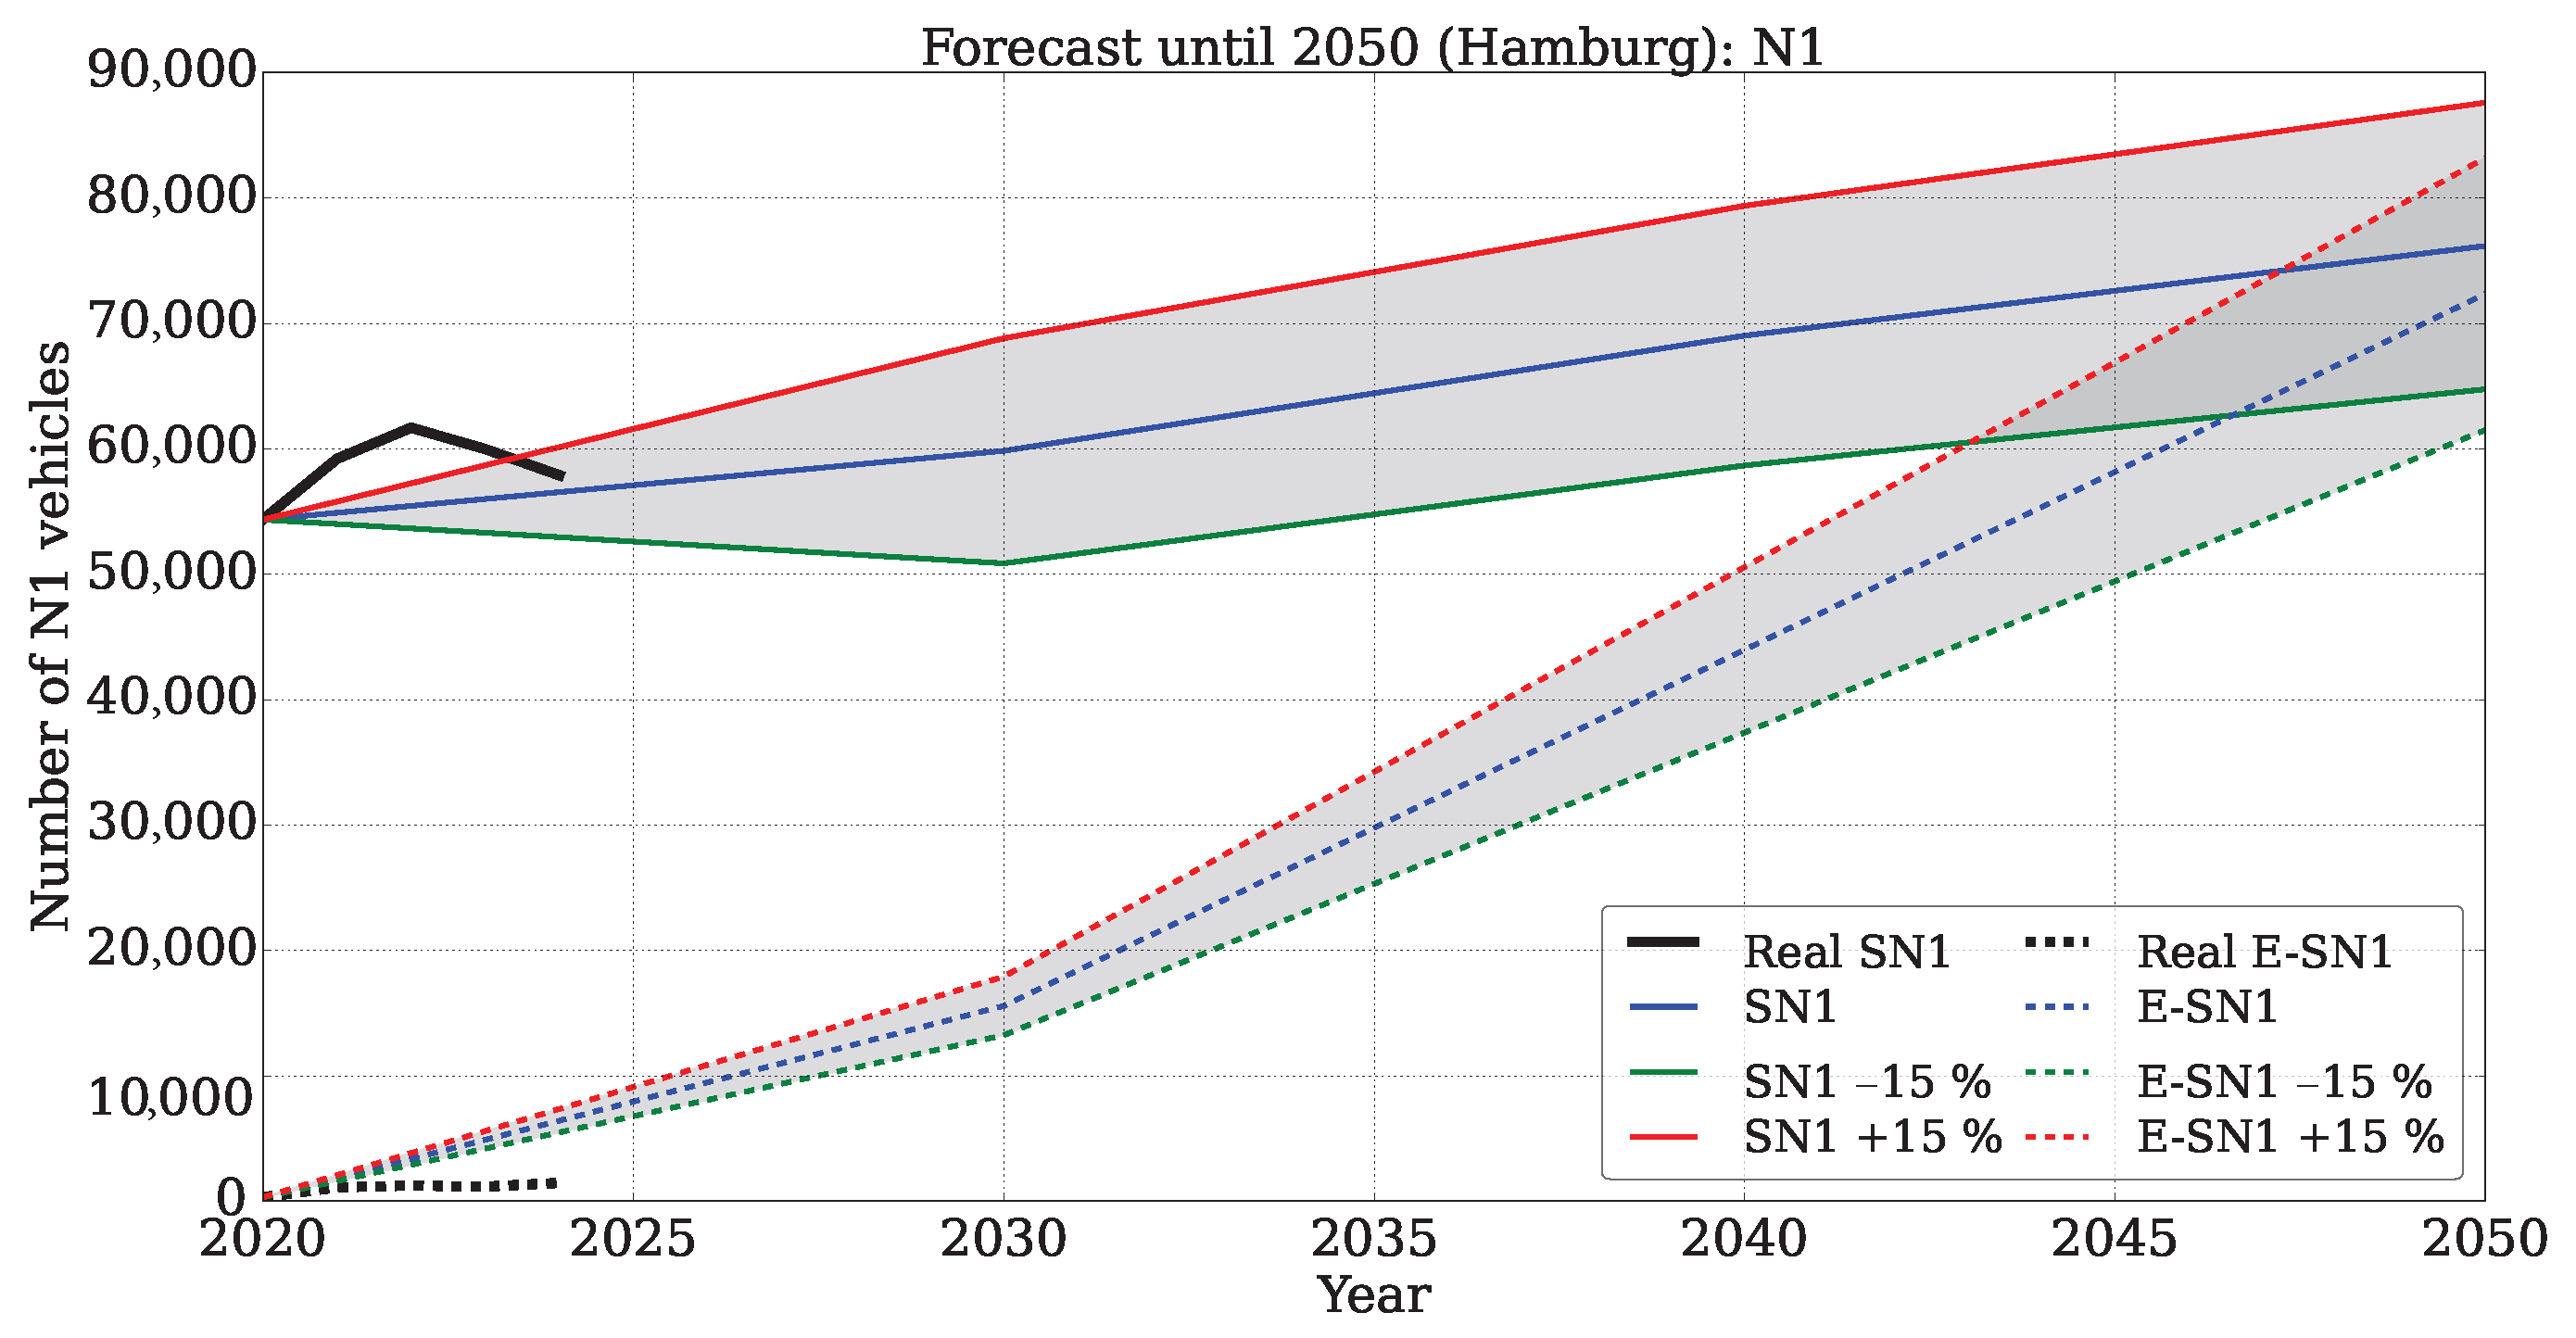
The main scenario for the number of N1 vehicles is calculated based on the sources for Germany and the EU and proportionally scaled for Hamburg. The forecast of changes in the number of N1 vehicles with three scenarios is shown in Figure 10. The share of electrified E-N1 vehicles is also considered within the German and EU data [4,6,8,9,10].
The forecast assumes a steady increase in N1 vehicles under the main and optimistic scenarios, while the optimistic scenario points to a potential decline until 2030, followed by a gradual recovery. In addition, the projected number of E-N1 vehicles shows exponential growth, especially in the optimistic scenario, indicating a significant shift towards electrification. The shaded area shows the range of possible outcomes with higher uncertainty after 2030 and highlights the potential impact of policy measures, technological advances, and the pace of market adoption on the future composition of N1 vehicles in Hamburg. However, current registrations for the last 4 years indicate that the total number of vehicles remains within the forecast, but electrification in Hamburg is progressing significantly slower than expected, indicating the need for change in this area. The report indicates that all the sources studied take a strongly positive and optimistic view of the electrification process.
The forecast for N1 vehicles in Hamburg anticipates an increase to between 65,000 and 88,000 units by 2050, depending on market conditions. The number of electric E-N1 vehicles, initially limited, is expected to reach 61,000–82,000 by 2050, driven by accelerated adoption and policy support. Although electrification is certain, the rate of transition will significantly depend on infrastructure expansion and regulatory incentives.

4.2. Ramp-Up of N2/N3 Vehicles

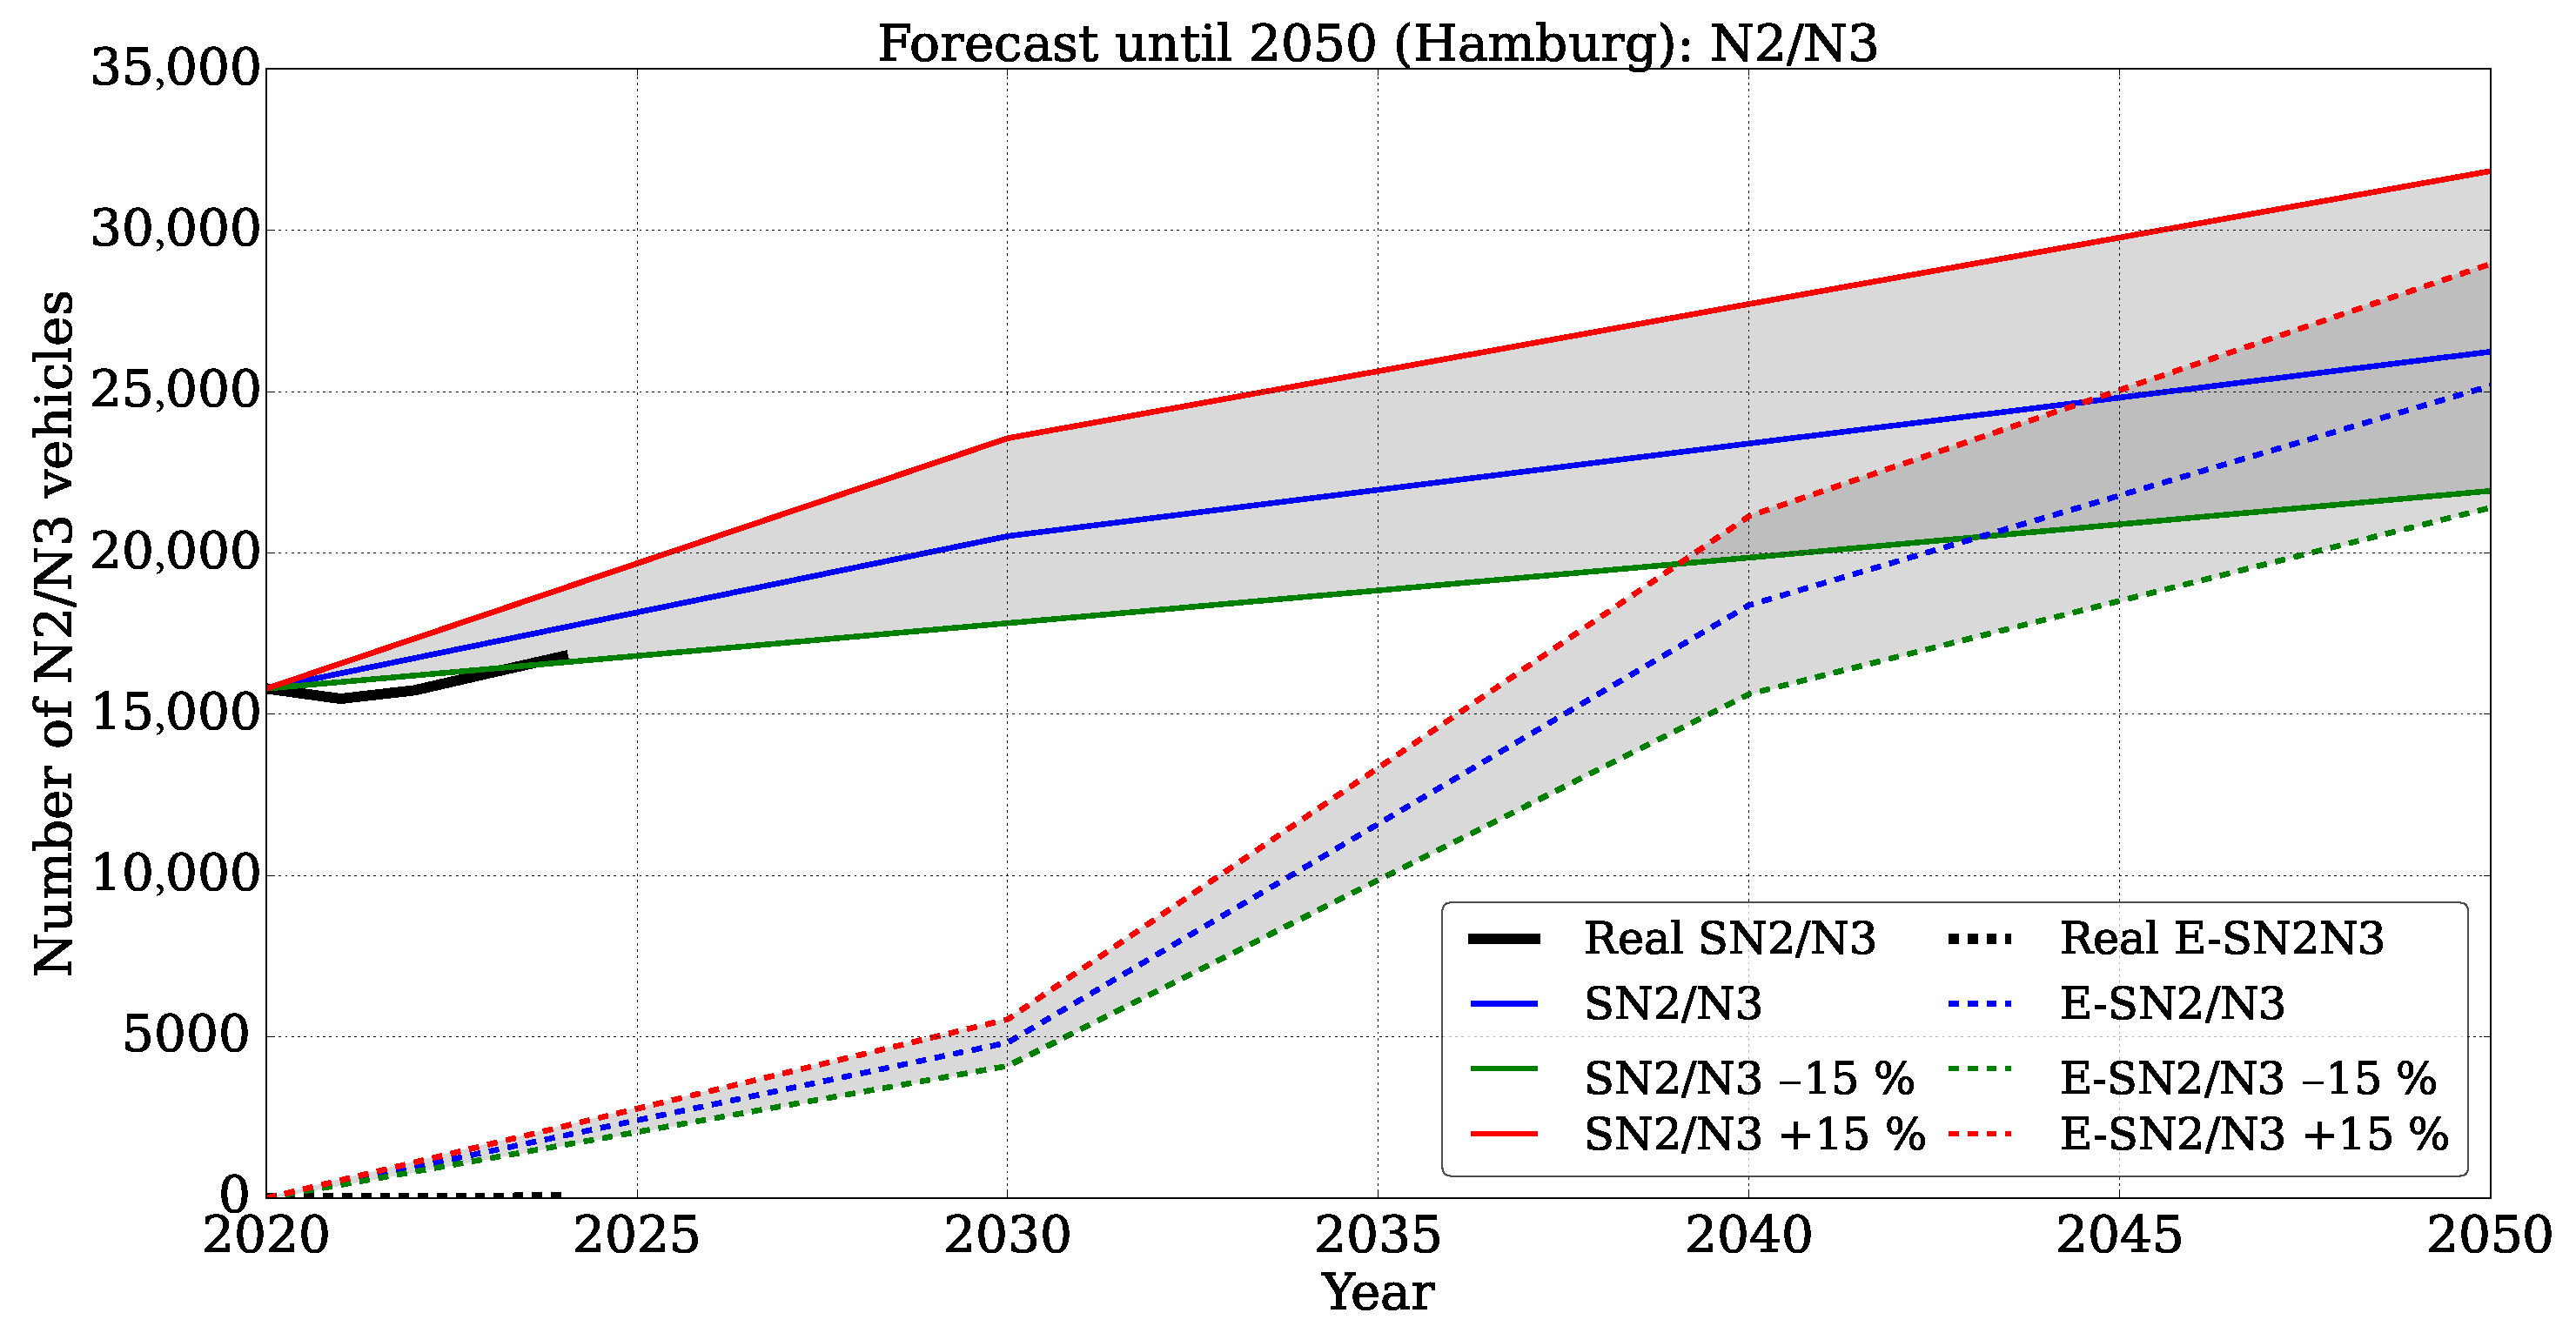
The scenarios for N2/N3 transport are calculated similarly to the N1 scenario in the EU context [2] and German [2,3,4] and proportional to the Hamburg data. The German data also includes the share of electrified vehicles. The forecast of changes in the number of N2/N3 vehicles with three scenarios is shown in Figure 11.
The forecast of the number of N2/N3 vehicles in Hamburg until 2050 illustrates a gradual increase in the number of conventional N2/N3 vehicles and a significant increase in the number of electric N2/N3 vehicles. The number of N2/N3 vehicles is projected to reach between 24,000 and 34,000 units by 2050, depending on various influencing factors. Notably, the growth in the number of E-N2/N3 vehicles is expected to be exponential by 2040 from 18,000 to 30,000 and by 2050 from 23,000 to 32,000. The shaded area represents the range of uncertainty in the projections, with greater variability in later years due to factors such as infrastructure readiness, regulatory support, and technological advances. These results show that while the total number of heavy-duty vehicles in Hamburg will increase, the share of electric vehicles will increase significantly, reinforcing the shift towards decarbonized urban freight mobility.
Nevertheless, the current registration data for Hamburg over the past four years indicate that while the total number of E-N1 and E-N2/N3 vehicles remains within forecast ranges, electrification proceeds significantly slower than projected by prior studies. This discrepancy highlights the necessity for a reassessment of electrification incentives and strategies, despite general optimism regarding future developments. Nevertheless, this paper maintains the three calculated scenarios to capture a comprehensive range of potential outcomes for electric N1 and N2/N3 vehicles.

5. Power Demand Scenarios in Hamburg

The electrification of depots and parking facilities, along with on-route charging opportunities for heavy-duty trucks and tractor units, will require significant energy resources, placing additional demand on the power grid. Studies indicate a clear trend towards depot-based overnight charging for N vehicles [1,2,3,4,5,6,7,8,9,10,11]. Specifically, by 2030, approximately 94% of N1 vehicles and 87% of N2/N3 vehicles are expected to charge predominantly at depots during nighttime, with the remaining vehicles relying on on-route charging infrastructure during operational periods. The remaining 6% will be charged during working hours, especially when the vehicle is at a transfer point or on the road [11]. Synthetic load profiles have been developed based on existing studies [11,39], considering parameters such as typical vehicle activity, average distance traveled, and power demand patterns. These profiles allow for a robust estimation of the future power demand associated with depot and on-route charging, supporting reliable forecasting of grid load.
Synthetic load profiles in this study are used to estimate the hourly power demand of electric N vehicles under various operational and charging scenarios. For E-N1 vehicles, the synthetic profiles are based on experimentally determined average daily energy consumption per vehicle [11,19]. For N2/N3 vehicles, synthetic profiles are adopted from the U.S. Department of Energy’s National Laboratory System, distinguishing between three major supply categories: food, beverage, and non-food transportation. These profiles serve as input for deriving N2/N3 depot and on-route charging loads [20]: 85% of food, 1% of beverage, and 14% of non-food delivery. Figure 12 presents a structured overview of all considered charging profiles, subdivided into four panels for enhanced readability:
  • Figure 12a shows specific unit charging profiles of N2/N3 vehicles based on supply type (beverage, food, and non-food) [20]. Profiles are used as input for constructing the depot and on-route profiles of N2/N3 vehicles.
  • Figure 12b displays unit depot charging profiles for N1, N2, and N3 vehicle classes. These reflect the assumption that the majority of vehicles (94% for N1 and 87% for N2/N3) charge overnight at depot locations.
  • Figure 12c contains unit on-route charging profiles of N vehicles during working hours, assuming a smaller share of vehicles (6% for N1 and 13% for N2/N3) charges outside depots at public or semi-public stations.
  • Figure 12d corresponds to the sum of all the profiles presented.
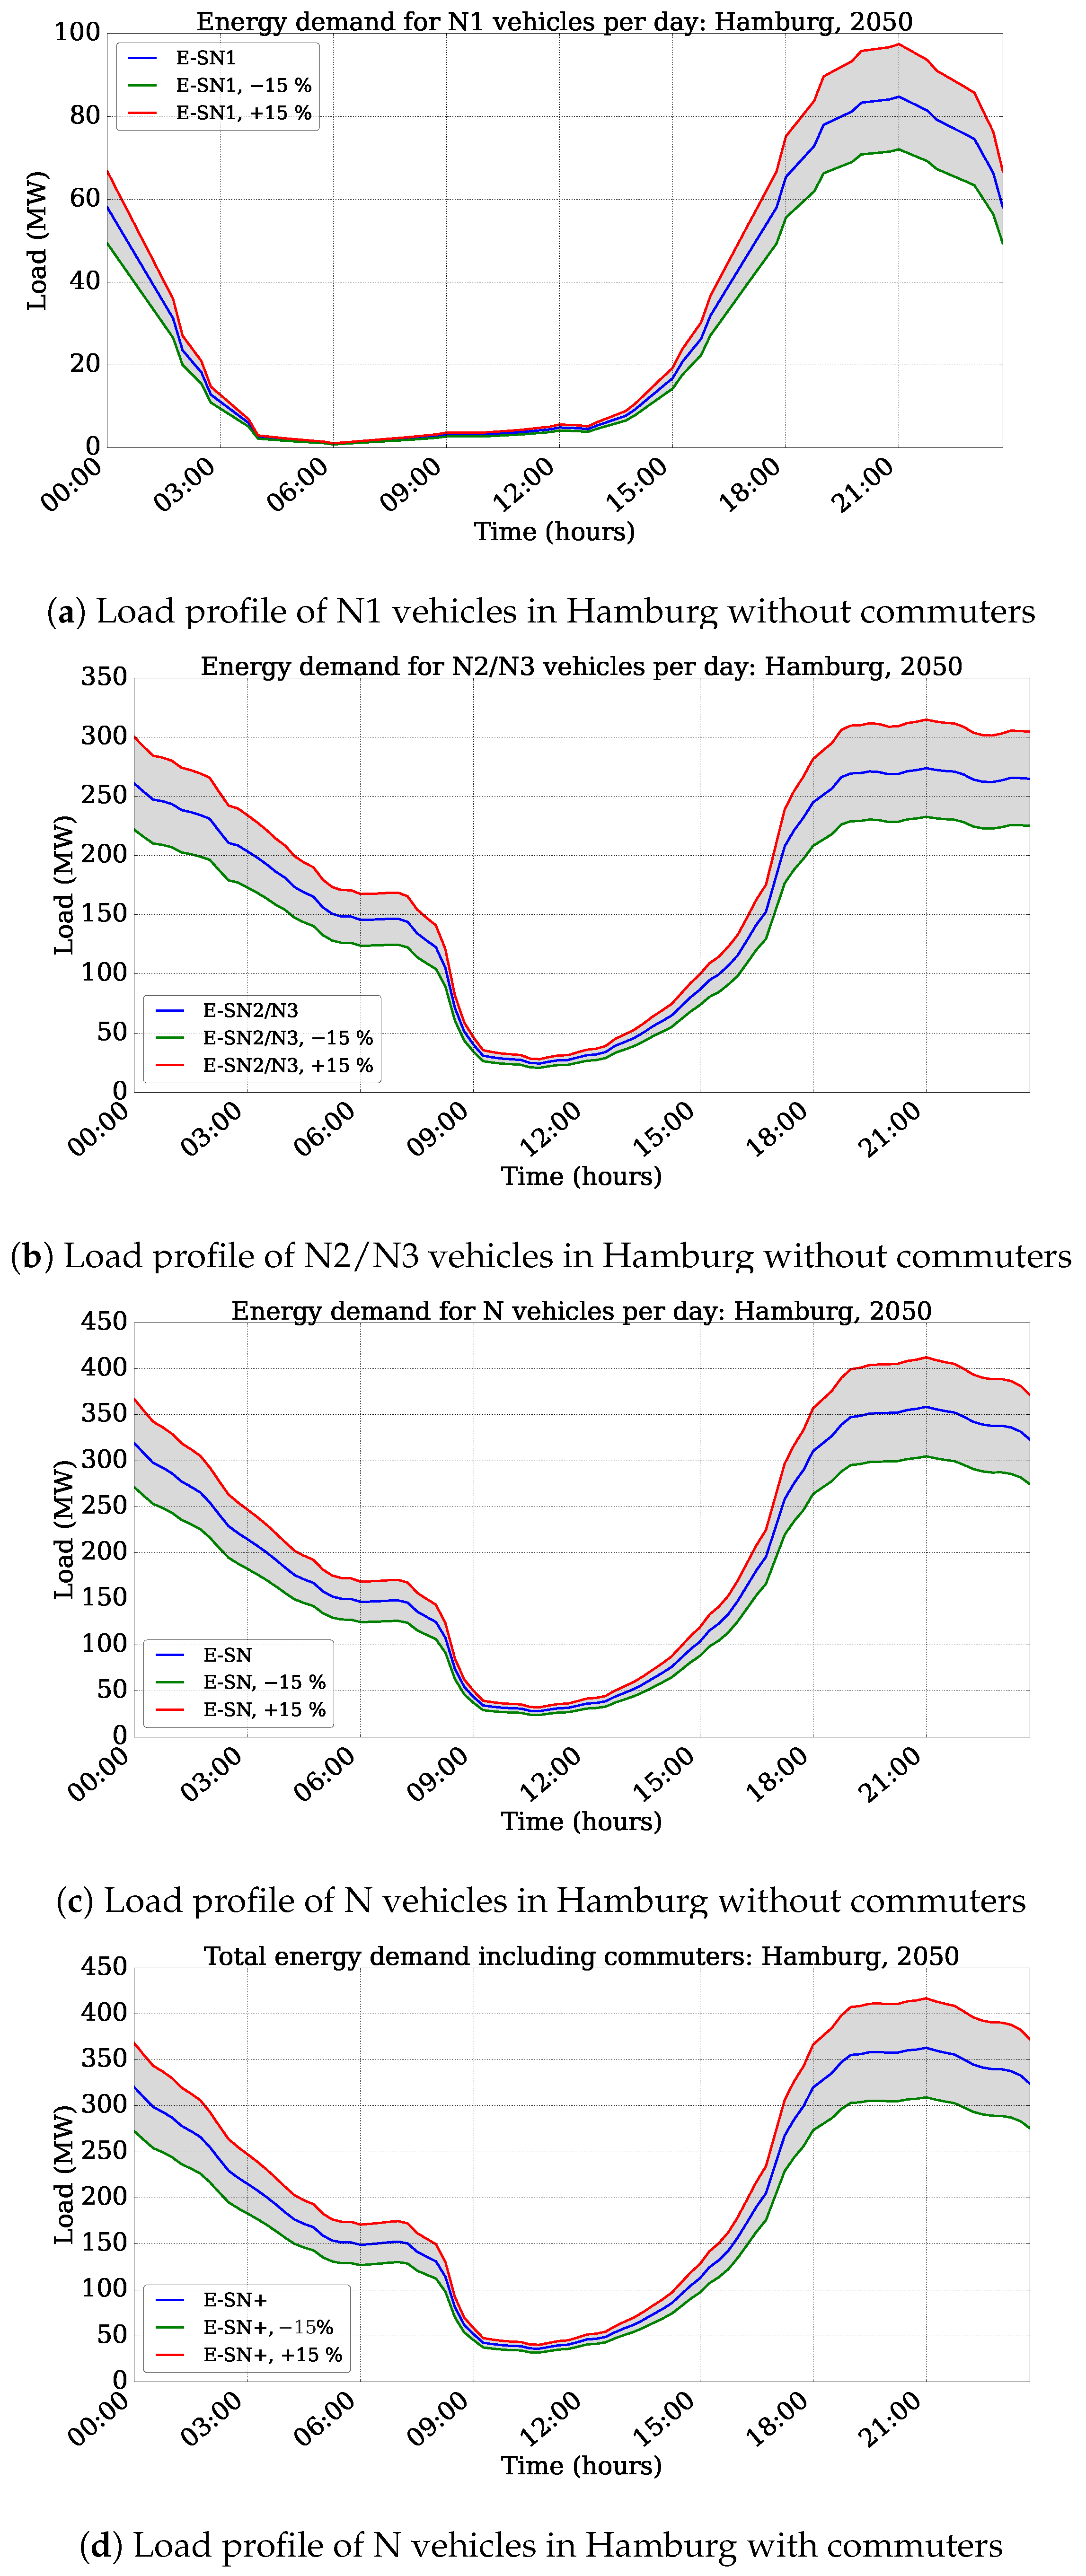
All profiles represent a single vehicle unit. The combined profiles enable quarter-level load forecasting for the year 2050 under different adoption and scenario assumptions. Based on studies [11,20], depot charging, which prioritizes nighttime energy consumption, is the predominant scenario considered. The combined profiles for each vehicle category (N1, N2, N3) are obtained as the sum of depot and on-route charging. The distinction between use-case-based and charging-mode-based profiles allows for flexible integration into both spatial and temporal modeling of Hamburg’s power demand. The hourly resolution of the synthetic load profiles is based on assumptions about typical operational and charging schedules, as derived from prior empirical research [11,20]. The daily load profile per vehicle is distributed across 24 h in accordance with standardized charging behavior (e.g., evening depot charging, midday opportunity charging), resulting in time-series load curves in kilowatts.
Although this study uses synthetic load profiles rather than explicit charging power data, these profiles are parameterized to reflect real world charging behavior. E-N1 vehicles typically have lower battery capacities compared to E-N2/N3 vehicles, making charging stations with capacities ranging from 7 to 50 kW sufficient for these vehicle types [40]. Conventional private light vehicle charging stations are also suitable for E-N1 vehicles, allowing flexible charging at various urban locations, such as warehouses, depots, package delivery hubs, craft businesses, as well as at residential locations of drivers [2,11,41].
The charging infrastructure for E-N2/N3 vehicles includes multiple charging methods: low-power charging (up to 150 kW), fast charging (up to 350 kW), high-power charging (500 kW or more), and overhead lines (approximately 130 kW) [2,6,40]. The choice of charging location for N2/N3 trucks and tractor units is primarily dependent on their operational use [2,42]. Studies indicate that approximately 87% of N2/N3 vehicles charge overnight at depots. On the other hand, 13% of N2/N3 vehicles rely on on-route charging during operational hours [11]. Reports from BMVI [2] and traffic data from the Hamburg Port Authority (HPA) [29] show that a significant part of N2/N3 vehicles often operate in the port area. The demand for charging infrastructure in the Port of Hamburg is therefore very high.
While smart charging, peak load shifting, or AI-assisted scheduling are not explicitly modeled in this study, such techniques are recognized as promising tools to reduce peak grid load and should be considered in future extensions. As battery technology and digital fleet control systems continue to evolve, dynamic load management will become increasingly important for infrastructure planning and resilience.

Total Power Demand by 2050

This study analyzes the expected load due to the charging demand of electric N vehicles across Hamburg’s city quarters, incorporating both vehicles registered within the city and N vehicle commuters. The total power demand forecast is presented in Figure 13, showing variations in charging loads throughout the day and highlighting differences between vehicle classes and commuter inclusion. The resulting load curves display a characteristic “duck curve” pattern [43], with low midday demand and pronounced peaks in the evening. This phenomenon is commonly observed in electrified energy systems, where electricity demand decreases at midday and increases sharply in the evening. In the context of heavy-duty electric vehicle charging, this pattern emerges as a direct result of operational logistics: most trucks return to the depot at the end of the working day and start charging in the early evening and night hours. This behavior leads to a sharp increase in electricity demand between 17:00 and 22:00, while demand remains low in the middle of the day due to limited on-route charging and active vehicle usage. Although these strategies were not explicitly modeled in this study, the predicted load curves can serve as a baseline for assessing the impact of future control measures. Incorporating time-shifted charging strategies, especially for depot-based fleets, can help smooth the evening peak and improve network efficiency. As electric vehicle technology advances and artificial intelligence-based fleet management becomes more prevalent, these solutions are expected to play a key role in smoothing the “duck curve” and increasing the flexibility of urban energy systems.
For N1 vehicles, power demand remains low between 04:00 and 06:00, peaking at 70–100 MW during 17:00–22:00, indicating a dominant evening charging pattern. N2/N3 vehicles follow a similar trend but with a significantly higher peak of 230–320 MW occurring between 18:00 and 00:00, aligning with the completion of daytime freight operations. When combining all N vehicle classes, the period of lowest demand occurs between 09:00 and 12:00, while the highest aggregated demand ranges from 300 to 420 MW during evening and night hours.
Commuter vehicles are integrated into the load calculation based on mobility and registration data. These vehicles contribute additional power demand, primarily through on-route charging during early morning or midday hours. Their inclusion results in a total peak demand of 310–430 MW, with a moderate daytime increase of approximately 20 MW between 09:00 and 12:00. This pattern reflects the overlap between operational and charging schedules of external fleets entering the city. Although the relative share of commuters is lower compared to resident N vehicles, their contribution to the load is non-negligible, particularly in logistics-heavy areas connected to interregional transport.
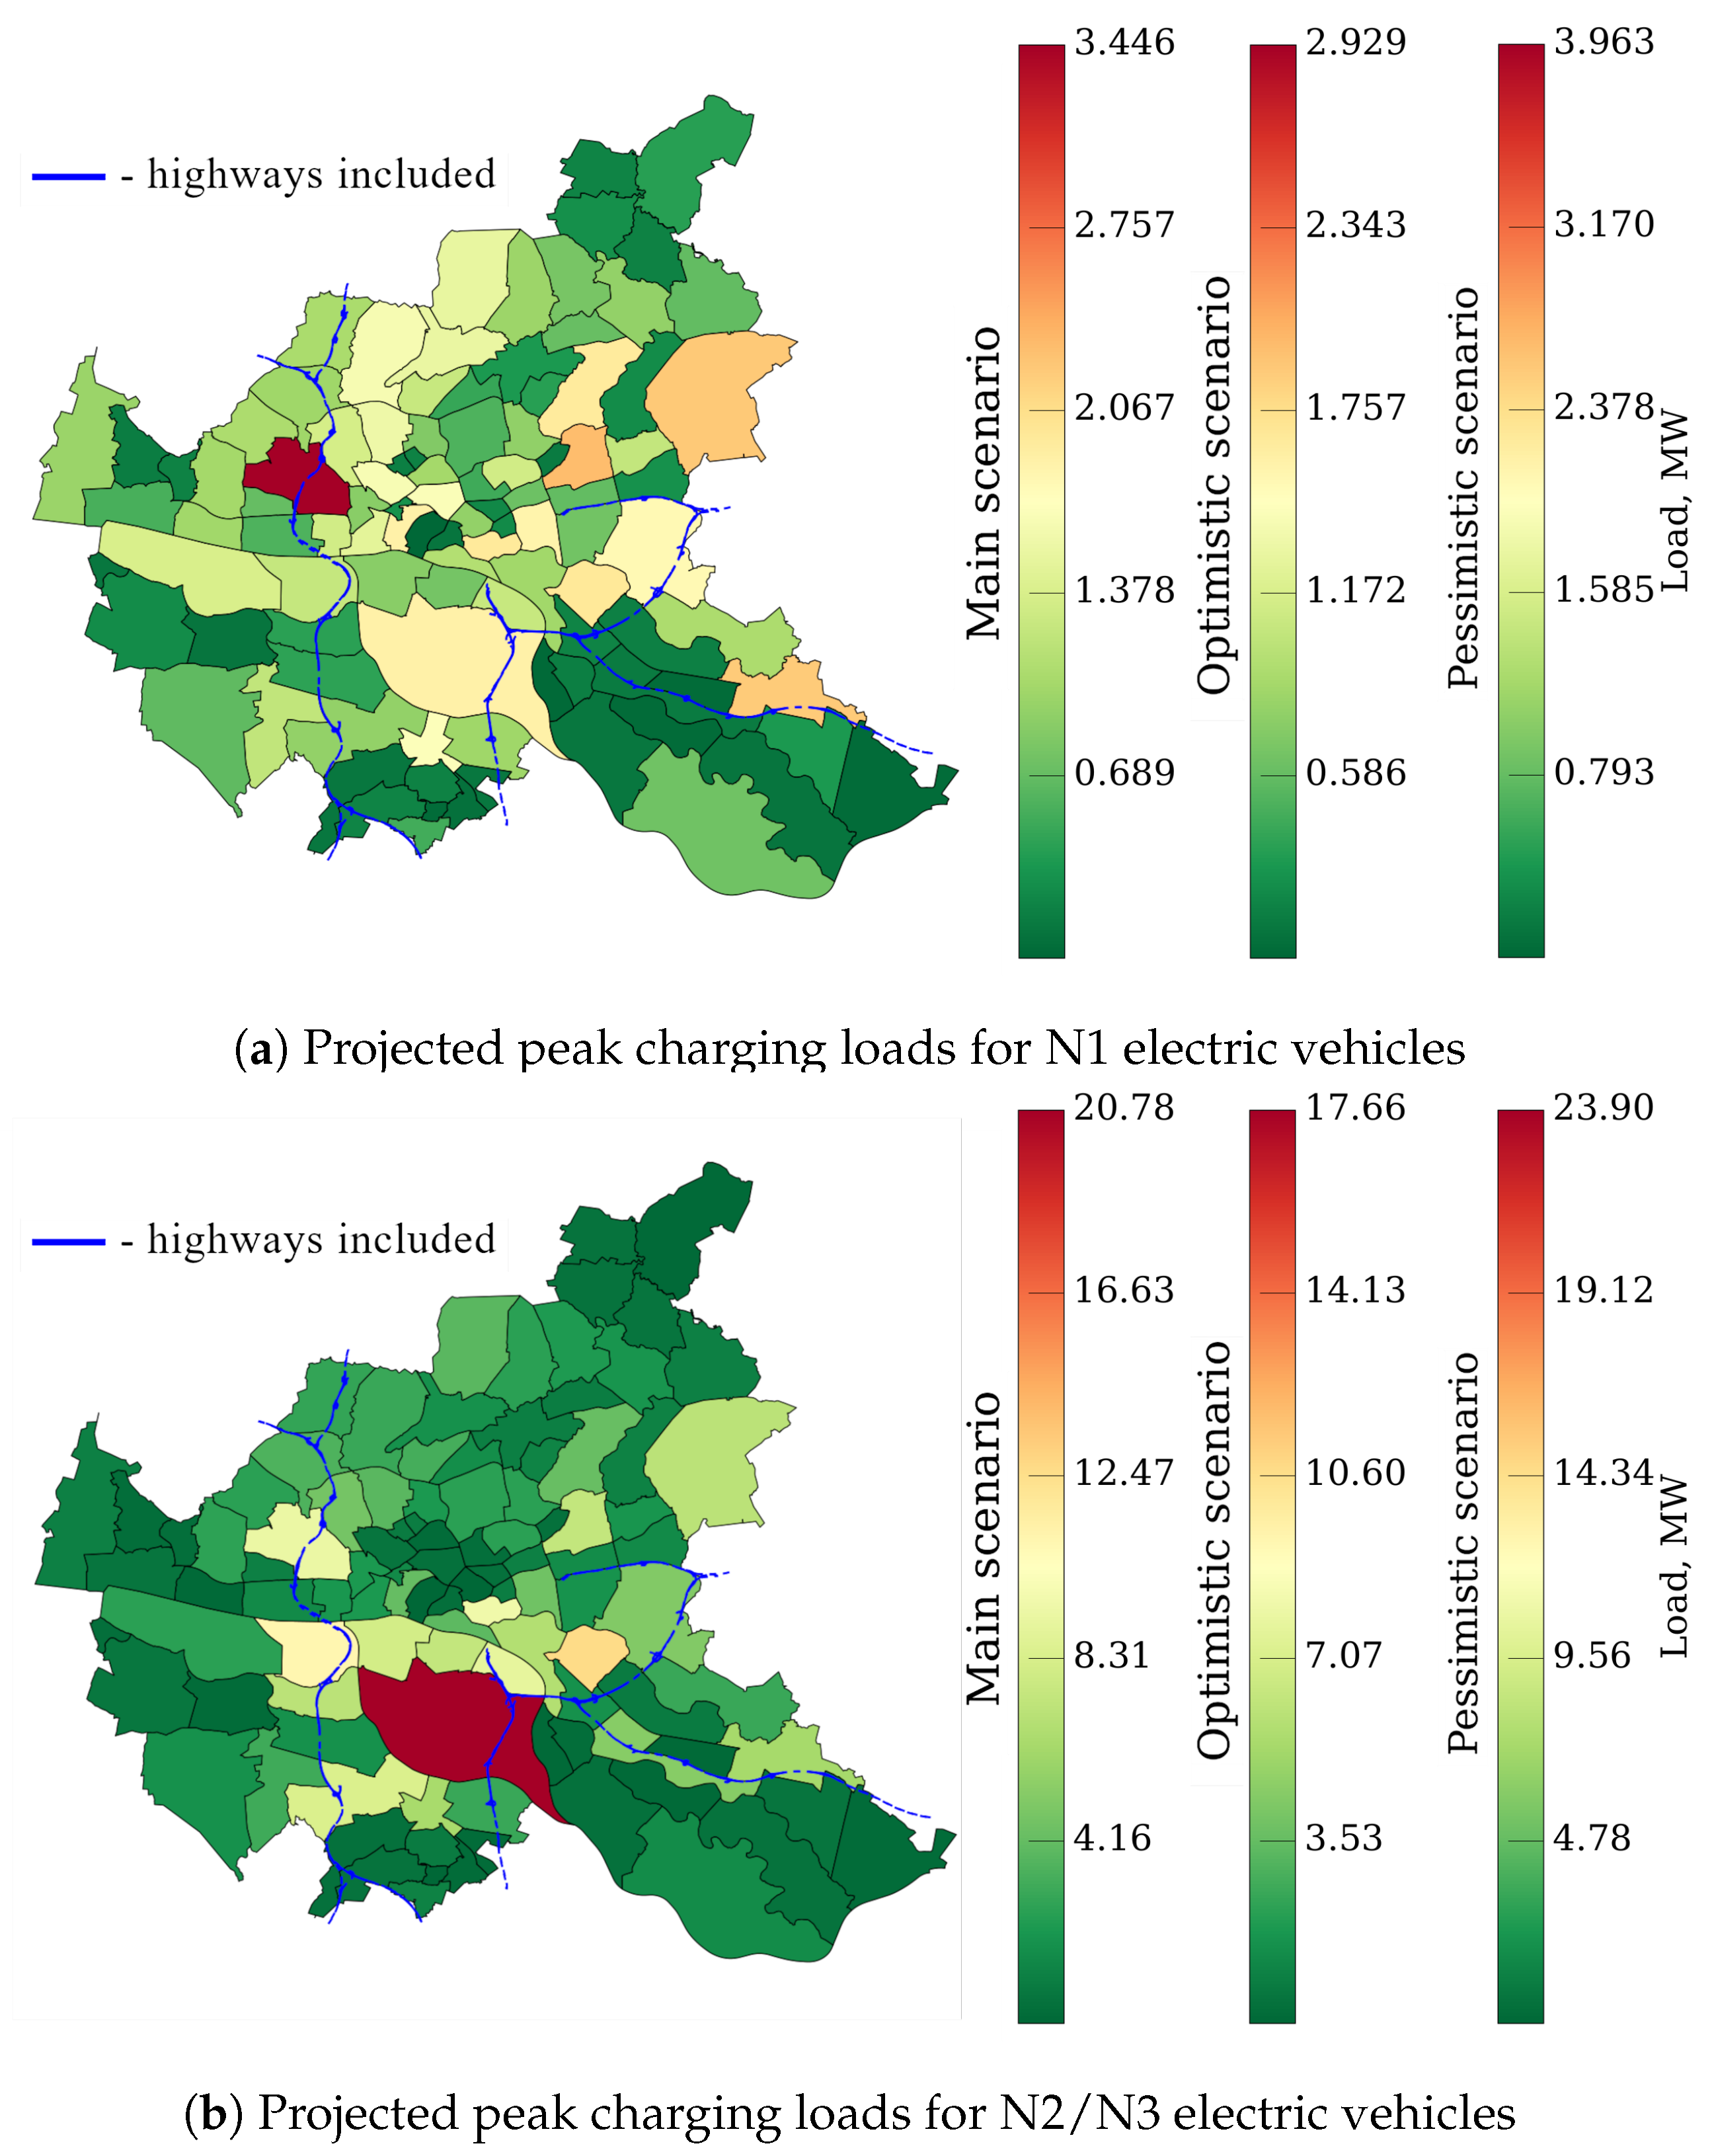
Scenario variations (+15% and −15%) reflect potential fluctuations in total power demand, providing insight into the range of expected charging loads. Taking into account vehicle spatial distribution, traffic patterns, and fleet forecasts, load profiles are derived for each Hamburg quarter. Figure 14a,b illustrate the peak charging loads for N1 and N2/N3 vehicles in 2050 across the three scenarios.
The highest power demand is anticipated in the administrative districts of Hamburg-Mitte, Hamburg-Nord, and Wandsbek. Among individual quarters, Wilhelmsburg is expected to reach peak loads of 3.5 MW for N1 vehicles and up to 24 MW for N2/N3 vehicles, followed by high-demand zones in Waltershof, Billbrook, and Bahrenfeld.

6. Conclusions

This paper presents an advanced geospatial framework for assessing the development of electric heavy-duty vehicles and potential power demand, demonstrated through a comprehensive meta-analysis of road freight transport electrification in the Free and Hanseatic City of Hamburg. The methodology enables the development of long-term ramp-up scenarios for N1, N2, and N3 vehicles up to 2050, accounting for uncertainties related to electric vehicle adoption, policy evolution, and economic factors.
The methodology delivers spatially resolved load forecasts at the city-quarter level, revealing where and when power demand from electric truck and tractor units can be concentrated. Temporal analysis of hourly load patterns shows a distinct evening peak in charging demand. These peaks, reaching up to 3.5 MW for N1 and 24 MW for N2/N3 vehicles per quarter, are especially pronounced in industrial and high-traffic quarters such as Wilhelmsburg, Billbrook, and Bahrenfeld—highlighting the urgency of strategic energy infrastructure planning.
While this methodology provides robust insights, several limitations must be acknowledged. First, the use of static synthetic load profiles constrains the model’s ability to represent dynamic charging behavior and temporal flexibility. Real-world factors such as smart charging, peak load shifting, and adaptive fleet scheduling are not yet integrated into the forecasting model. Second, the study operates at a city-quarter spatial resolution without explicitly modeling the underlying electrical grid infrastructure (e.g., substations, feeders), which may lead to underestimation of localized constraints. Third, vehicle behavior is modeled using average patterns and does not include stochastic variations or behavioral uncertainties.
To address these limitations, future studies should focus on a few key areas. Substation-scale network-level analysis can be conducted by mapping aggregated quarter-level forecasts to the actual distribution network to assess reinforcement needs. Charging infrastructure planning could be improved by optimizing charger placement using geospatial demand patterns, network constraints, and vehicle mobility data. In addition, smart load management strategies including demand response modeling, flexible charging schedules, and AI-assisted optimization should be used to assess their potential to reduce peak demand and improve network efficiency.
By combining high-resolution spatial modeling, dynamic demand-side flexibility, and system-level infrastructure constraints, future work can contribute more effectively to the reliable and sustainable electrification of urban freight transport. Future research directions are proposed to build upon this methodology, including the following:
  • Substation-level grid analysis: analysis in which aggregate quarter-level load forecasts could be mapped onto the distribution network to quantify necessary capacity expansions.
  • Charging infrastructure planning: an optimized charger siting that may be determined by integrating geospatial demand patterns, grid constraints, and vehicle mobility data.
  • Smart load management studies: studies in which the impacts of demand-response mechanisms and charging schedules on peak stability and grid stability could be evaluated.
By enhancing spatial resolution, considering grid-level constraints, and integrating demand-side management, future research can further contribute to the efficient and sustainable electrification of the urban freight transport sector.

Author Contributions

Conceptualization, E.A. and A.J.; methodology, E.A. and A.J.; software, E.A.; validation, E.A. and A.J.; formal analysis, E.A.; investigation, E.A.; resources, E.A., A.J., and D.S.; data curation, E.A. and A.J.; writing—original draft preparation, E.A.; writing—review and editing, A.J. and D.S.; visualization, E.A.; supervision, A.J. and D.S.; project administration, A.J. and D.S.; funding acquisition, A.J. and D.S. All authors have read and agreed to the published version of the manuscript.

Funding

This research is funded by dtec.bw—Digitalization and Technology Research Center of the Bundeswehr—which we gratefully acknowledge [dtec emob]. dtec.bw is funded by the European Union—NextGenerationEU.

Institutional Review Board Statement

Not applicable.

Informed Consent Statement

Not applicable.

Data Availability Statement

The raw data supporting the conclusions of this article will be made available by the authors on request.

Acknowledgments

The authors thank the Authority for Traffic and Mobility Transition (BVM) for their cooperation and support.

Conflicts of Interest

The authors declare no conflict of interest. The funders had no role in the design of the study; in the collection, analyses, or interpretation of data; in the writing of the manuscript, or in the decision to publish the results.

References

  1. Transport and Environment (T&E). A Roadmap for Electric Truck Charging Infrastructure Deployment. 2020. Available online: https://te-cdn.ams3.cdn.digitaloceanspaces.com/files/2020_02_RechargeEU_trucks_paper.pdf (accessed on 10 June 2024).
  2. Wissenschaftliche Beratung und Begleitung des BMVI zur Weiterentwicklung der Mobilitäts- und Kraftstoffstrategie (MKS). Use Cases für Klimafreundliche Nutzfahrzeuge. Available online: https://www.klimafreundliche-nutzfahrzeuge.de/use-cases-zum-aufbau-von-privater-und-oeffentlicher-tank-und-ladeinfrastruktur-fuer-emissionsfreie-nutzfahrzeuge/ (accessed on 7 June 2024).
  3. Statista: Anzahl der Lastkraftwagen mit Alternativen Antrieben in Deutschland in den Jahren 2020 bis 2024. Available online: https://de.statista.com/statistik/daten/studie/259803/umfrage/lkw-bestand-mit-alternativen-antrieben-in-deutschland/ (accessed on 10 February 2025).
  4. Öko-Institut e.V. StratES—Szenarien für die Elektrifizierung des Straßengüterverkehrs. 2024. Available online: https://www.oeko.de/fileadmin/oekodoc/StratES-Szenarien-Elektrifizierung-Strassengueterverkehr.pdf (accessed on 6 June 2024).
  5. Agora Energiewende. Klimaneutrales Deutschland. Available online: https://www.agora-energiewende.de/publikationen/klimaneutrales-deutschland-szenariopfade (accessed on 10 February 2025).
  6. Agora Energiewende. Klimaneutrales Deutschland 2045. Available online: https://www.agora-energiewende.de/publikationen/klimaneutrales-deutschland-2045-1 (accessed on 6 June 2024).
  7. Strategy&. Truck Study 2024. Available online: https://www.strategyand.pwc.com/de/en/industries/transport/truck-study.html (accessed on 10 February 2025).
  8. Statista Market Insights. Commercial Vehicles—Germany. Available online: https://www.statista.com/outlook/mmo/commercial-vehicles/germany (accessed on 10 February 2025).
  9. Verkehrsprognose 2040 im Auftrag des Bundesministeriums für Digitales und Verkehr (BMDV). Available online: https://www.bmv.de/SharedDocs/DE/Anlage/G/BVWP/verkehrsprognose-2040-band-1-1-Z-gesamtueberblick.pdf?__blob=publicationFile (accessed on 10 February 2025).
  10. NOW GmbH. Market Development of Climate-Friendly Technologies in Heavy-Duty Road Freight Transport. Available online: https://www.klimafreundliche-nutzfahrzeuge.de/wp-content/uploads/2023/05/BroschuereNOWCleanroom_ENG_web.pdf (accessed on 10 February 2025).
  11. Climate Change Committee. Analysis to Identify the EV Charging Requirement for Vans. Available online: https://www.theccc.org.uk/wp-content/uploads/2022/09/Analysis-to-identify-the-EV-charging-requirements-for-vans-Element-Energy.pdf (accessed on 10 February 2025).
  12. Gestaltung des MKS Referenzszenarios für die Periode 2021 bis 2035 (REF-2020). Available online: https://m-five.de/publikationsartikel/gestaltung-des-mks-referenzszenarios-fuer-die-periode-2021-bis-2035 (accessed on 10 February 2025).
  13. Dietmannsberger, M.; Meyer, M.F.; Schumann, M.; Schulz, D. Metastudie Elektromobilität—Anforderungen an das Stromnetz Durch Elektromobilität, Insbesondere Elektrobusse; Helmut Schmidt University: Hamburg, Germany, 2017; ISBN 978-3-86818-095-4. [Google Scholar]
  14. Then, J.; Agalgaonkar, A.P.; Muttaqi, K.M. Planning for Medium- and Heavy-Duty Electric Vehicle Charging Infrastructure in Distribution Networks to Support Long-Range Electric Truck. Energies 2025, 18, 785. [Google Scholar] [CrossRef]
  15. Diaz-Cachinero, P.; Contreras, J.; Muñoz-Hernandez, J.I.; Pourakbari-Kasmaei, M.; Lehtonen, M. Electric vehicle routing and charging management in road transportation and power distribution systems: An iterative multistage approach. Expert Syst. Appl. 2025, 290, 128274. [Google Scholar] [CrossRef]
  16. Tietz, T.; Fay, T.-A.; Schlenther, T.; Göhlich, D. Electric Long-Haul Trucks and High-Power Charging: Modelling and Analysis of the Required Infrastructure in Germany. World Electr. Veh. J. 2025, 16, 96. [Google Scholar] [CrossRef]
  17. Richtlinie 2007/46/EG des Europäischen Parlaments und des Rates vom 5. September 2007 zur Schaffung eines Rahmens für die Genehmigung von Kraftfahrzeugen und Kraftfahrzeuganhängern Sowie von Systemen, Bauteilen und Selbstständigen Technischen Einheiten für diese Fahrzeuge. Available online: https://eur-lex.europa.eu/legal-content/DE/TXT/?uri=CELEX:32007L0046 (accessed on 19 April 2023).
  18. Richtlinie 97/27/EG des Europäischen Parlaments und des Rates vom 22. Juli 1997 über die Massen und Abmessungen Bestimmter Klassen von Kraftfahrzeugen und Kraftfahrzeuganhängern und zur Änderung der Richtlinie 70/156/EWG. Available online: https://op.europa.eu/de/publication-detail/-/publication/ae116d9b-10cd-4780-87cb-aad6832ea80a (accessed on 19 April 2023).
  19. Cieslik, W.; Antczak, W. Research of Load Impact on Energy Consumption in an Electric Delivery Vehicle Based on Real Driving Conditions: Guidance for Electrification of Light-Duty Vehicle Fleet. Energies 2023, 16, 775. [Google Scholar] [CrossRef]
  20. Muratori, M.; Borlaug, B. Perspectives on Charging Medium- and Heavy-Duty Electric Vehicles. United States. 2022. Available online: https://www.osti.gov/biblio/1840708 (accessed on 6 June 2024).
  21. Kraftfahrt-Bundesamt (KBA). Bestand nach Haltergruppen und Wirtschaftszweigen (FZ 23). Available online: https://www.kba.de/DE/Statistik/Produktkatalog/produkte/Fahrzeuge/fz23_b_uebersicht.html (accessed on 10 February 2025).
  22. Kraftfahrt-Bundesamt (KBA). Produkte der Statistik. Available online: https://www.kba.de/DE/Statistik/Produktkatalog/produktkatalog_node.html;jsessionid=191556CA8794145E9E8B44B0113485EB.live11293 (accessed on 24 August 2024).
  23. Kraftfahrt-Bundesamt (KBA). Systematisierung von Kraftfahrzeugen und ihren Anhängern. Available online: https://www.kba.de/DE/Statistik/Verzeichnisse/systematische_verzeichnisse_inhalt.html (accessed on 6 June 2024).
  24. Kraftfahrt-Bundesamt (KBA). Pressemitteilung Nr. 08/2024: Der Fahrzeugbestand am 1. Januar 2024. Available online: https://www.kba.de/DE/Presse/Pressemitteilungen/Fahrzeugbestand/2023/pm08_fz_bestand_pm_komplett.html (accessed on 8 June 2024).
  25. Kraftfahrt-Bundesamt (KBA). Bestand nach Fahrzeugklassen und Aufbauarten. Available online: https://www.kba.de/DE/Statistik/Fahrzeuge/fz_methodik/fz_methodische_erlaueterungen_202402_pdf.pdf?__blob=publicationFile&v=2 (accessed on 20 January 2025).
  26. Boehnke, J.; Gholami, E.; Nayak, A. Preparing for a future COVID-19 wave: Insights and limitations from a data-driven evaluation of non-pharmaceutical interventions in Germany. Sci. Rep. 2020, 10, 20084. [Google Scholar] [CrossRef]
  27. Emiliozzi, S.; Ferriani, F.; Gazzani, A. The European Energy Crisis and the Consequences for the Global Natural Gas Market. SSRN Electron. J. 2023, 1–46. [Google Scholar] [CrossRef]
  28. Behörde für Verkehr und Mobilitätswende (BVM): Projekte und Initiativen. 2018. Available online: https://www.hamburg.de/politik-und-verwaltung/behoerden/bvm/projekte-und-initiativen (accessed on 10 February 2025).
  29. Hamburg Port Authority. Straßenverkehrsbericht 2018: Hafenverkehr Erfassen, Verstehen und Verändern. 2019. Available online: https://www.hamburg-port-authority.de/fileadmin/user_upload/Strassenverkehrsbericht2018.pdf (accessed on 8 June 2024).
  30. Metadaten: Verkehrszählstellen Hamburg. Available online: https://suche.transparenz.hamburg.de/dataset/verkehrszaehlstellen-hamburg11 (accessed on 2 July 2025).
  31. Kindl, A.; Niemeier, E.; Wilhelm, S.; Benda, L.; Nöppert, J.; Winter, M.; Steindl, A.; Demtschenko, R. Wissenschaftliche Beratung des BMVI zur Mobilitäts- und Kraftstoffstrategie. Schlussbericht zur Studie Fahrradparken an Bahnhöfen. ORLIS Repositorium, Germany. 2019. Available online: https://orlis.difu.de/items/54bef5d9-7c97-41c8-a275-f8d2d656d6a5 (accessed on 6 June 2024).
  32. Schriftliche Kleine Anfrage des Abgeordneten Dennis Thering (CDU) vom 16.04.19 und Antwort des Senats. 2019. Available online: https://www.buergerschaft-hh.de/parldok/dokument/66450/entwicklung_der_zulassungszahlen_von_pkw_lkw_und_kraftraedern_in_hamburg_im_1_quartal_2019.pdf (accessed on 6 June 2024).
  33. Immobilienmarktbericht Hamburg 2020: Gewerbe- und Industrieflächen. Available online: https://www.hamburg.de/contentblob/13894842/8f3b529e265b0f91e0726750e8c25064/data/d-immobilienmarktbericht-2020.pdf (accessed on 6 June 2024).
  34. Das Telefonbuch. Alles in einem. Available online: https://www.telefonbuch.de/ (accessed on 6 June 2024).
  35. Google Maps. Available online: https://www.google.com/maps (accessed on 6 June 2024).
  36. Hamburger Wirtschaftszahlen. Kammerzugehörige Unternehmen nach Bezirken. Available online: https://www.ihk.de/hamburg/produktmarken/beratung-service/konjunktur-statistik/hamburger-wirtschaft-zahlen/bezirke-3676930 (accessed on 6 June 2024).
  37. Gurobi 11.0: Every Solution, Globally Optimized. Available online: https://www.gurobi.com/ (accessed on 19 June 2024).
  38. BALM. Verkehrsprognose. Available online: https://www.balm.bund.de/DE/Themen/Verkehrswirtschaft/Verkehrsprognose/verkehrsprognose_node.html (accessed on 30 January 2025).
  39. Gao, Z.; Lin, Z.; Franzese, O. Energy Consumption and Cost Savings of Truck Electrification for Heavy-Duty Vehicle Applications. Transp. Res. Rec. 2017, 2628, 99–109. [Google Scholar] [CrossRef]
  40. European Electric Vehicle Charging Infrastructure Masterplan; ACEA. 2023. Available online: https://www.acea.auto/publication/european-electric-vehicle-charging-infrastructure-masterplan/ (accessed on 6 June 2024).
  41. KEP-Studie 2022: Analyse des Marktes in Deutschland. Available online: https://www.forschungsinformationssystem.de/servlet/is/Entry.555924.Display/ (accessed on 6 June 2024).
  42. Handelsdaten.de. Lebensmittelhandel: Anteile der Warengruppen an Fläche, Umsatz und Ertrag Eines Supermarkts in Deutschland im Jahr 2021 (in Prozent). Available online: https://www.handelsdaten.de/lebensmittelhandel/anteile-warengruppen-flache-umsatz-ertrag-supermarkt (accessed on 6 June 2024).
  43. Pitra, G.; Sastry, M. Impact Analysis of Duck Curve Phenomena with Renewable Energies and Storage Technologies. J. Eng. Res. Sci. 2022, 1, 52–60. [Google Scholar] [CrossRef]
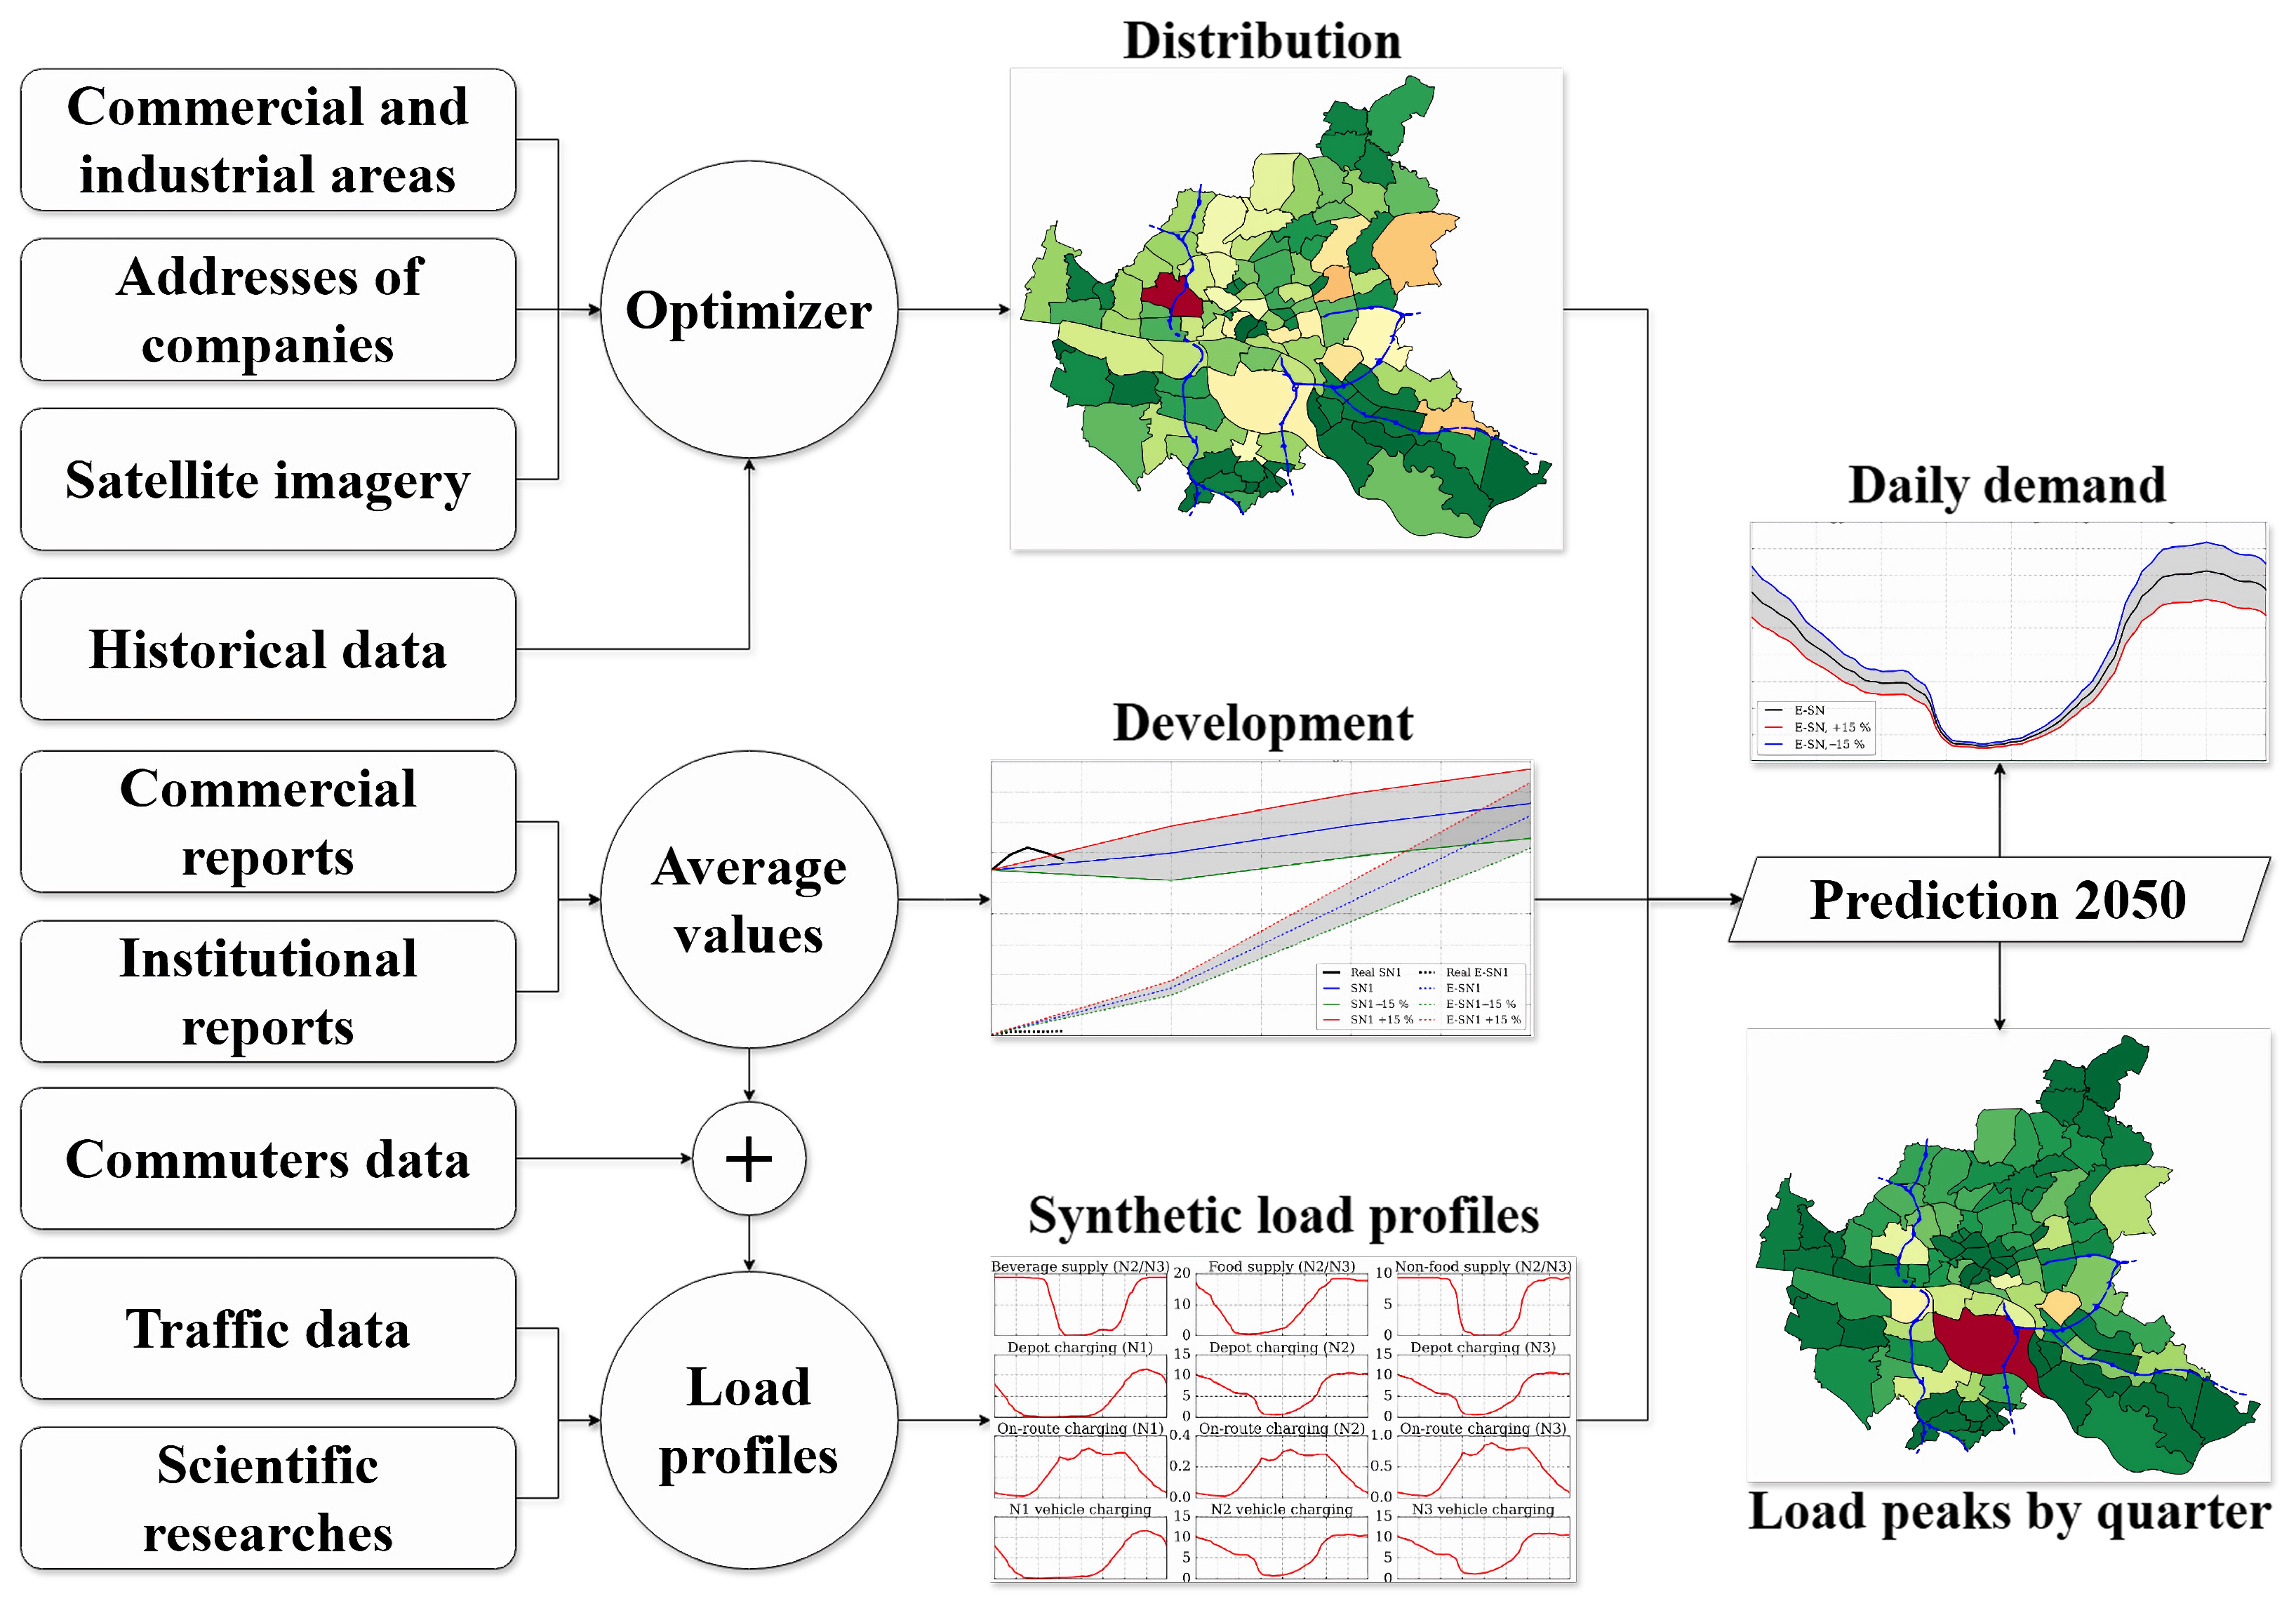
Figure 1. Study concept for electric road freight transport in Hamburg.
Energies 18 03719 g001
Figure 2. The change of N1 and N2/N3 vehicles from 2007 to 2024 in Hamburg.
Energies 18 03719 g002
Figure 3. Destination goals of N1, N2, and N3 vehicles in Hamburg during inter-quarter traffic (the color intensity shows the absolute number of the vehicle depending on the class).
Energies 18 03719 g003
Figure 4. Journeys of N2/N3 commuters to and from Hamburg.
Energies 18 03719 g004
Figure 5. Percentage of commercial and industrial space in Hamburg’s quarters (the color intensity corresponds to the percentage level).
Energies 18 03719 g005
Figure 6. Distribution of N1, N2, and N3 vehicles of Hamburg according to commercial and industrial zone data (the color intensity shows the absolute number of the vehicle depending on the class).
Energies 18 03719 g006
Figure 7. Distribution of N1, N2, and N3 vehicles of Hamburg based on company addresses in 2024 (the color intensity shows the absolute number of the vehicle depending on the class).
Energies 18 03719 g007
Figure 8. Distribution of N1, N2, and N3 vehicles of Hamburg in 2024 using satellite imagery (the color intensity shows the absolute number of the vehicle depending on the class).
Energies 18 03719 g008aEnergies 18 03719 g008b
Figure 9. Distribution of N1, N2, and N3 vehicles of Hamburg in 2024 using a mixed approach (the color intensity shows the absolute number of the vehicle depending on the class).
Energies 18 03719 g009
Figure 10. Forecast for the number of N1 vehicles in Hamburg by 2050.
Energies 18 03719 g010
Figure 11. Forecast for the number of N2/N3 vehicles in Hamburg by 2050.
Energies 18 03719 g011
Figure 12. Average daily load profiles of N vehicles.
Energies 18 03719 g012
Figure 13. Grid load due to charging N vehicles including commuter trips by 2050.
Energies 18 03719 g013
Figure 14. Projected N1/N2/N3 electric vehicle charging load peaks in Hamburg quarters for 2050, where color intensity demonstrates absolute MW values depending on the E-SN scenarios.
Energies 18 03719 g014
Table 1. Proportion of N vehicles by economic sector.
SectorN1N2N3N
Agriculture, forestry, and fishing1.0%2.3%<0.1%0.9%
Mining and quarrying<0.1%<0.1%0.1%<0.1%
Manufacturing, production of goods0.1%9.1%10.5%4.4%
Energy supply2.6%<0.1%<0.1%1.5%
Water supply and disposal0.2%<0.1%4.3%1.3%
Building trade, construction6.6%6.0%3.4%5.6%
Wholesale, retail trade, and repair services5.0%17.6%9.8%8.3%
Transportation, warehousing1.5%10.2%17.5%7.3%
Hospitality, accommodation, gastronomy0.3%<0.1%1.1%0.4%
Information and communication0.5%<0.1%<0.1%0.3%
Financial and insurance services0.1%<0.1%<0.1%0.1%
Real estate, housing1.7%<0.1%<0.1%1.0%
Freelance, scientific and technical services0.1%0.3%0.6%0.3%
Specific commercial services23.6%17.1%0.4%16.0%
Public administration, social security1.4%0.1%<0.1%0.8%
Education and teaching0.1%<0.1%<0.1%<0.1%
Health and social services0.8%<0.1%<0.1%0.5%
Art, entertainment, relaxation0.3%<0.1%<0.1%0.2%
Provision of miscellaneous services15.1%10.8%50.8%24.5%
Extraterritorial organizations0.1%<0.1%<0.1%0.1%
Private and employee-related usage38.9%26.6%1.2%26.3%
Unknown0.1%<0.1%0.2%0.1%
Table 2. Studies and reports utilized for modeling forecasts.
AuthorsTitle and Type of ReportDateVehicleSource
Strategy&ABattery electric trucks
on the rise: Development
September 2024N2/N3[7]
Statista Market
Insights
Trucks: Unit SalesJanuary 2025N2/N3[8]
Statista Market
Insights
Light Commercial Vehicles:
Unit Sales
January 2025N1[8]
Trimode,
Intraplan
“Verkehrsprognose 2040“
(Traffic forecast 2040): Development
October 2024N[9]
Agora
Energiewende
“Klimaneutrales Deutschland“
(Climate-neutral Germany):
Development
December 2024N2/N3[5]
Öko-Institut“StratES”: DevelopmentAugust 2023N2/N3[4]
M-Five GmbH,
Fraunhofer,
TUHH, PTV
“REF-2020”: DevelopmentMarch 2022N[12]
Agora
Energiewende
“Klimaneutrales Deutschland 2045“
(Climate-neutral Germany 2045):
Development
July 2021N1[6]
NOW GmbH“Evaluation of the 2022 Cleanroom
Talks with truck manufacturers”:
Development
May 2023N3[10]
Climate Change
Committee
Analysis to identify the EV charging
requirement for vans: Development
August 2022N1[11]
Disclaimer/Publisher’s Note: The statements, opinions and data contained in all publications are solely those of the individual author(s) and contributor(s) and not of MDPI and/or the editor(s). MDPI and/or the editor(s) disclaim responsibility for any injury to people or property resulting from any ideas, methods, instructions or products referred to in the content.