4.1. Effect of Mesh Fin on the Heat Storage Performance
It was obtained from references [
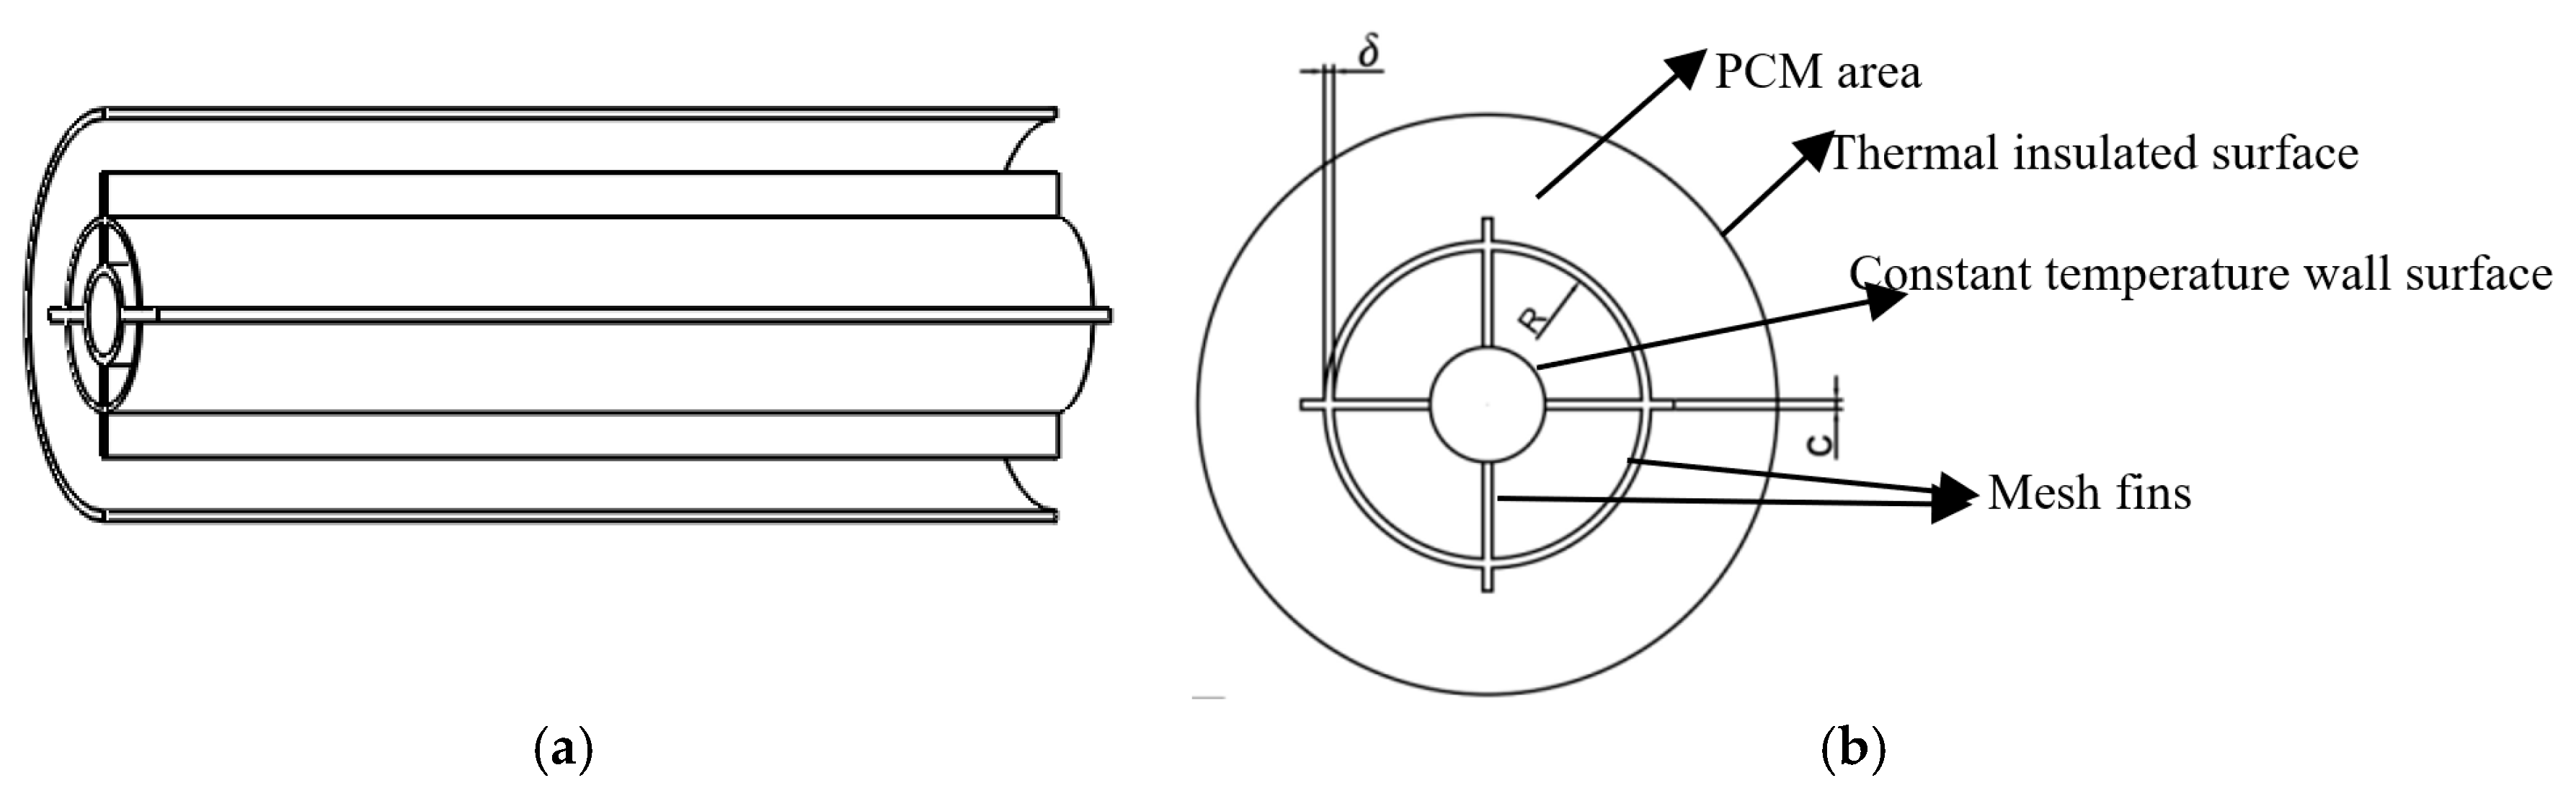
24] that the heat storage time of the concentric sleeve-type phase change heat accumulator decreased first and then increased with the increase in the vertical fin height. When the vertical fin height was 28 mm, the heat storage time was the shortest. Therefore, the subsequent calculation of this paper was carried out at the vertical fin height value of 28 mm. In the numerical simulation model, as shown in
Figure 1, the mesh fin radius was defined as
R, the thickness was
δ, the vertical fin thickness was
c, and the number was
N.
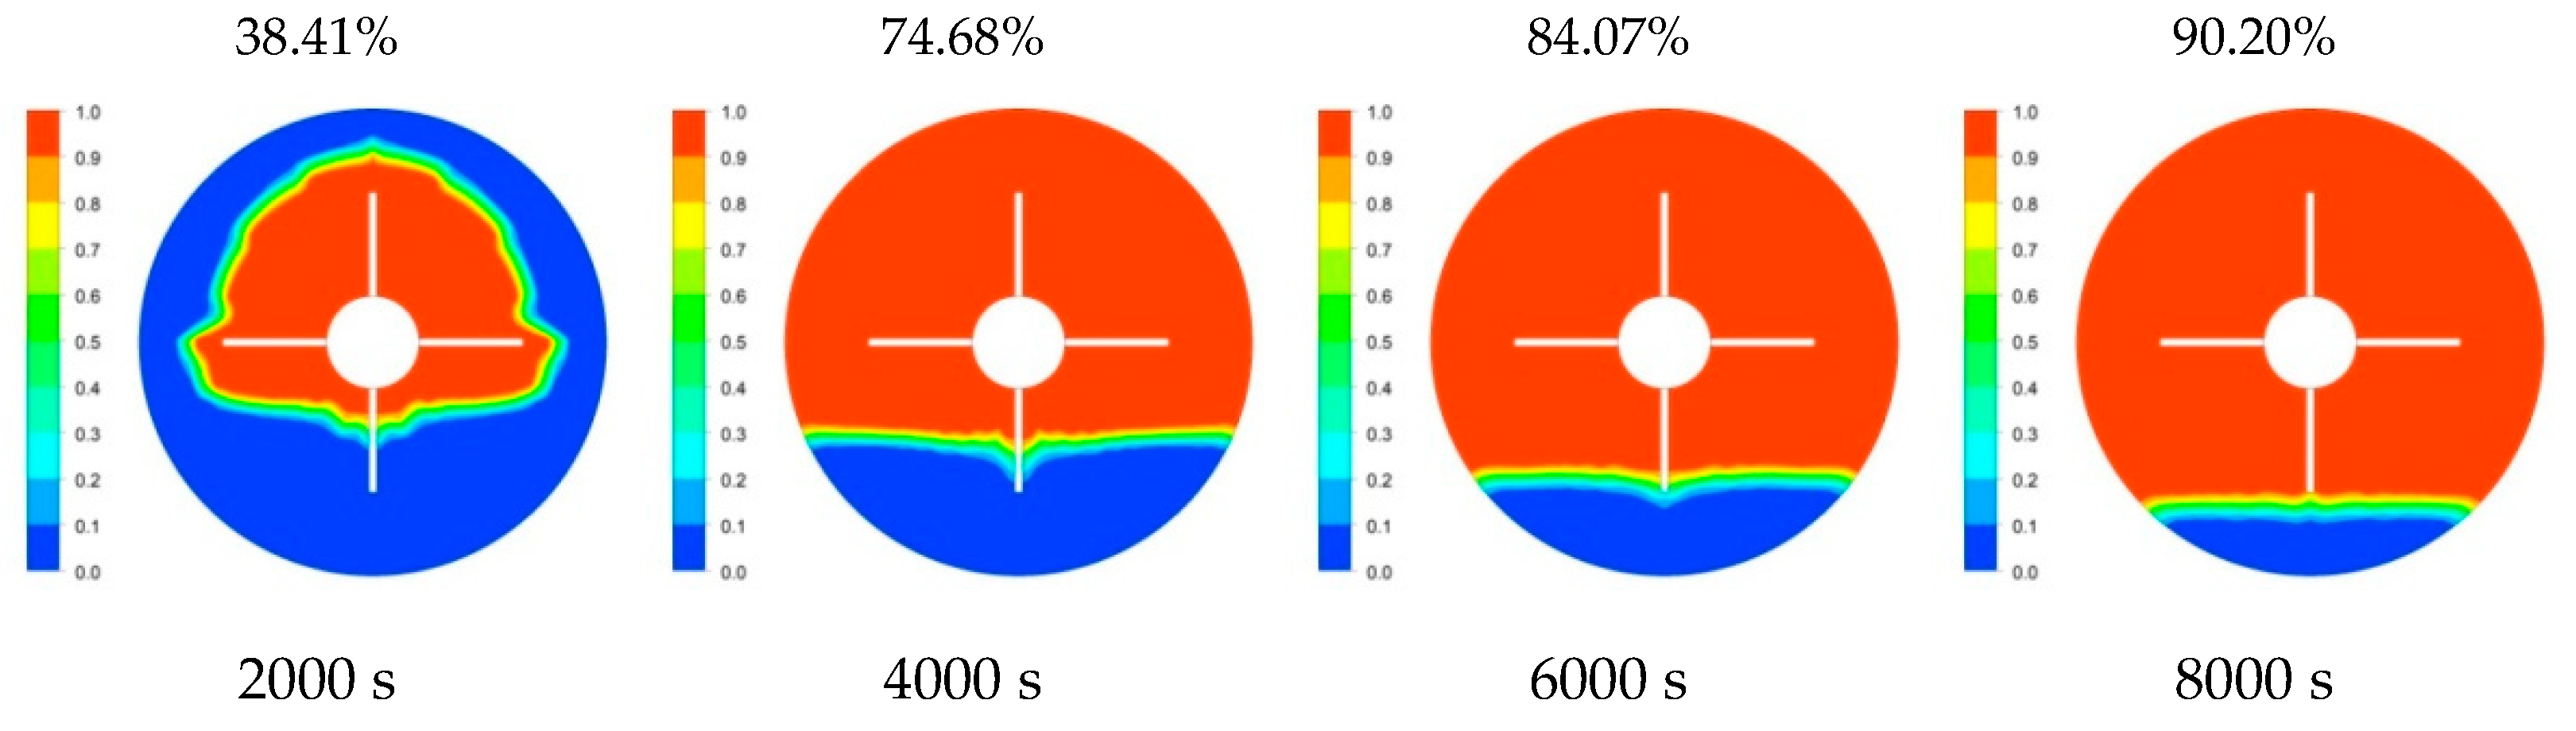
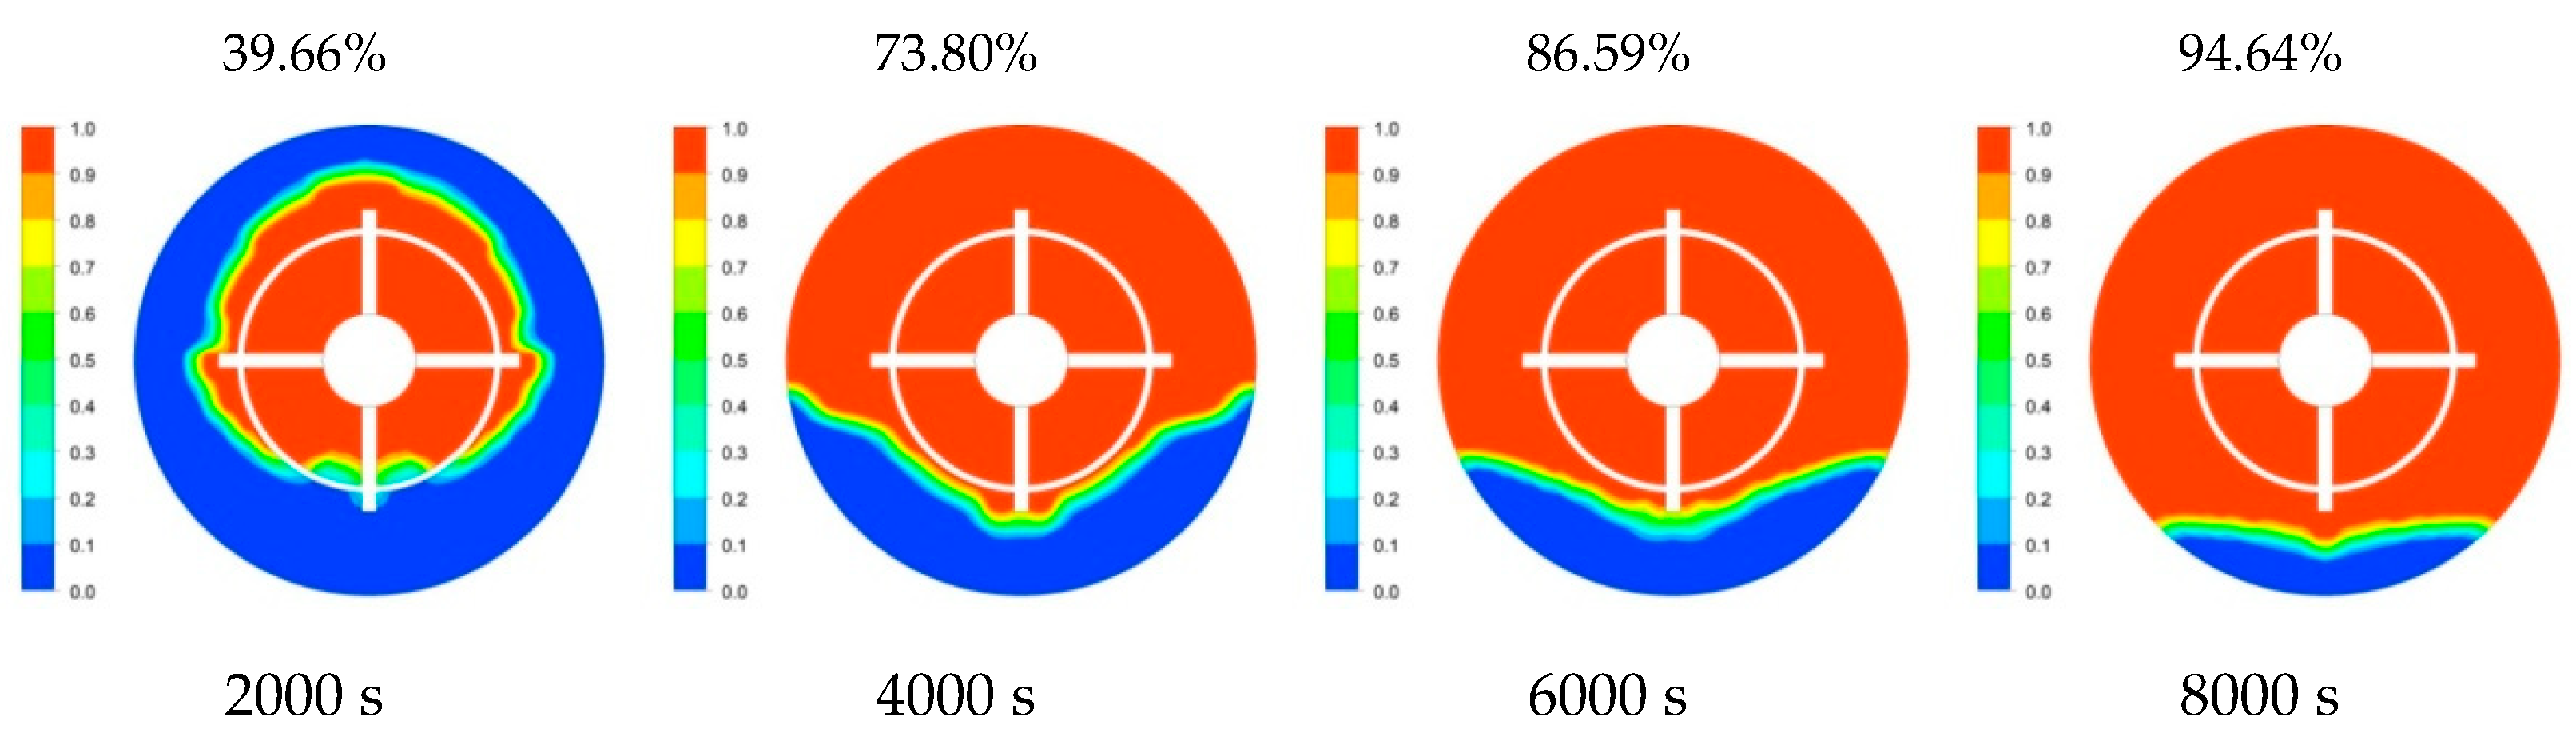
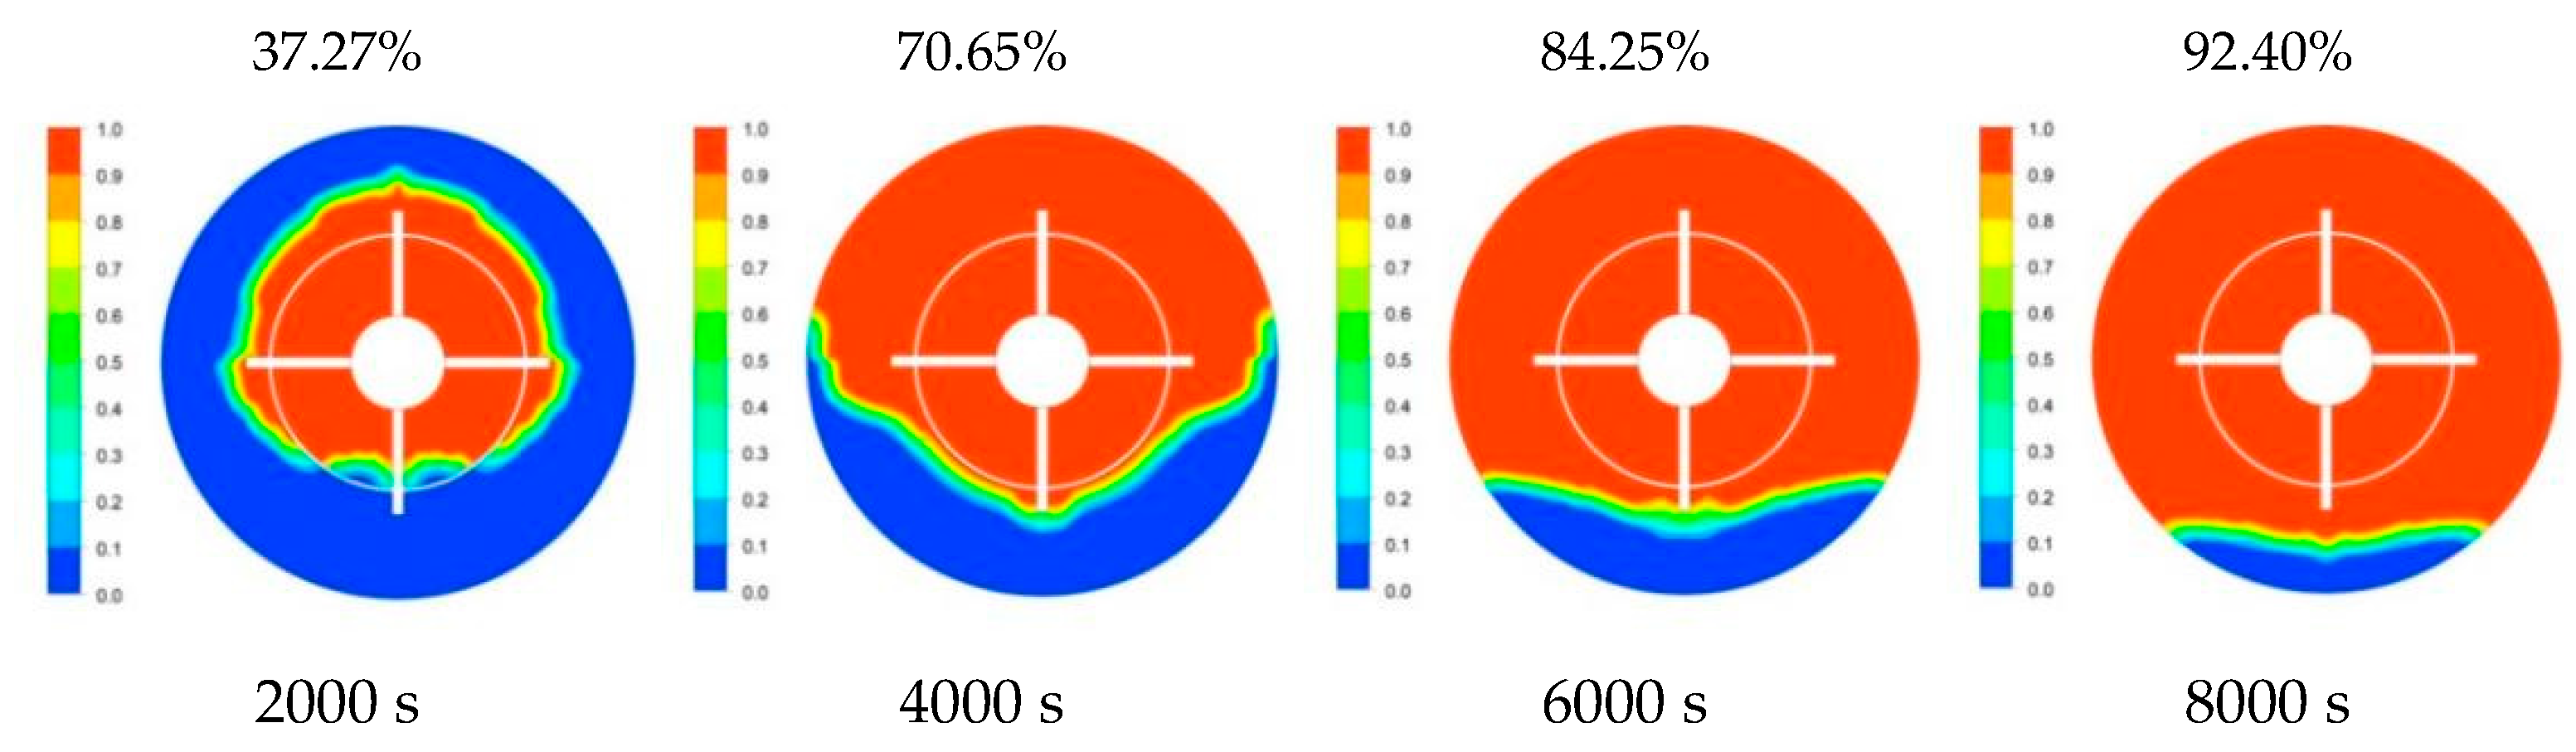
Solid–liquid phase cloud diagrams are shown in
Figure 5 and
Figure 6 at the vertical fin thickness
c = 2 mm, the number of vertical fins
N = 4, the mesh fin thickness
δ = 2 mm, and the mesh fin radius
R = 33.5 mm in the vertical fin accumulator (
Figure 5) and the mesh fin accumulator (
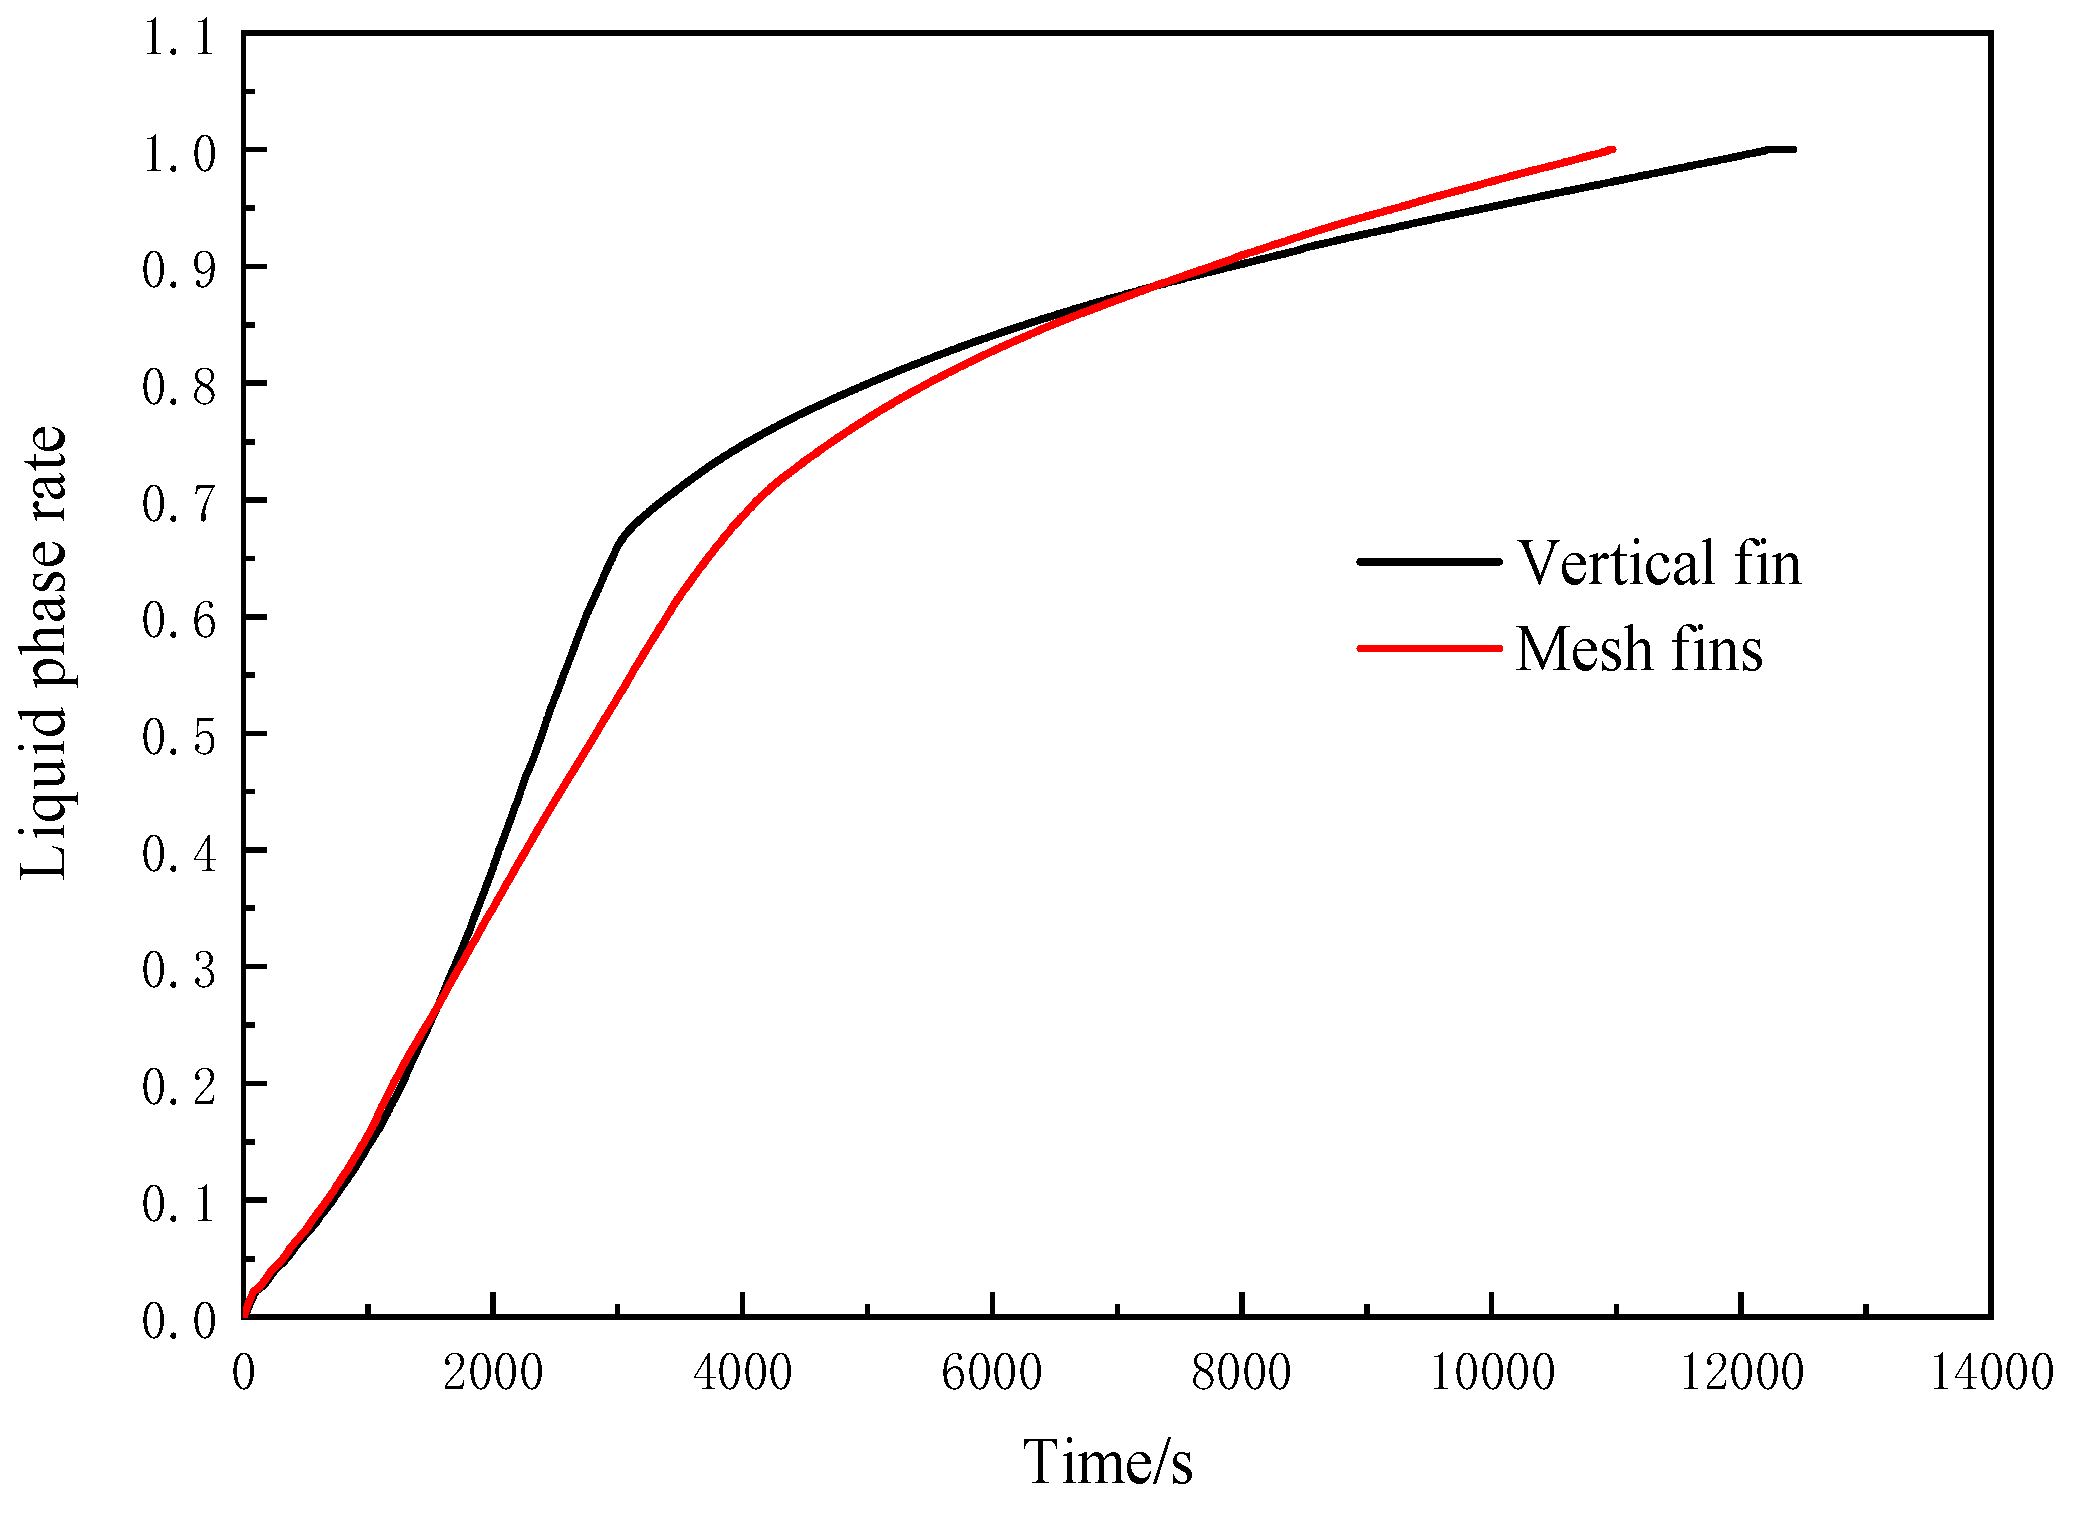
Figure 6) at the same operating parameters and initial conditions. The percentage of the material that melted at each time point is indicated in the upper right corner of the solid–liquid phase cloud diagrams. Liquid fraction curves of mesh fin heat accumulator and vertical fin heat accumulator are shown in
Figure 7.
It can be seen from
Figure 5,
Figure 6 and
Figure 7 that the liquid phase rate distribution curves and the solid–liquid phase area distributions on the cross-section of the two heat accumulators with different structures showed different representations at the same time. Before 2000 s, the volume average liquid phase rate curves of the two heat accumulators were basically the same, but the distribution areas were different. The liquid phase area of the vertical fin heat accumulator was closer to the upper wall. At 2000–4000 s, the liquid phase rate of the vertical fin changed more rapidly, and the liquid phase rate increased rapidly in the early stage and slowly in the later stage, while the liquid phase rate change curve of the mesh fin heat accumulator was more gentle and lower than the liquid phase rate of the vertical fin. The distribution of the liquid phase area on the cross-section of the two heat accumulators was completely different. At 4000 s, the PCM at the upper part of the vertical fin accumulators completely melted into the liquid phase, while the solid–liquid phase cross-section of the mesh fin heat accumulator presented a concave arc shape, and the height of the solid phase at the bottom of the vertical fin heat accumulator was greater than that of the mesh fin heat accumulator. At 4000–6000 s, the liquid phase rates of the two heat accumulators were similar, but the change rate of the liquid phase rate of the mesh fin heat accumulator was slightly faster than that of the vertical fin. When it reached 6000 s, the solid–liquid phase interfaces of the two heat accumulators with different structures were similar, but the solid phase area at the bottom of the mesh fin heat accumulator was obviously smaller than that of the vertical fin. In 6000–8000 s, the liquid phase rate curve of the mesh fin heat accumulator changed faster than that of the vertical fin heat accumulator. At 8000 s, the solid phase area of the mesh fin heat accumulator was much smaller than that of the vertical fin heat accumulator.
In the early stage of melting, thermal conductivity was the main method of heat transfer in the PCM area. For both mesh fin and vertical fin heat accumulators, the PCM around the fins first melted into liquid. Although the contact area between the mesh fins and the PCM was relatively large, due to the low thermal conductivity of paraffin, the change trends of the liquid phase ratio of the two heat accumulators were not much different in the early stage of melting. With the progress of melting, the liquid temperature around the fin was higher than that in other areas. Under the action of the gravity field, the liquid around the fin produced natural convection, which scoured the surrounding solid phase and accelerated the heat transfer in the whole phase change area. However, due to the blocking of the mesh fin, the natural convection of the liquid phase in the mesh fin heat accumulator could not be extended beyond the mesh fin, while the vertical fin did not have the influence of the mesh fin, and the natural convection of the liquid phase had a wider impact on the surrounding solid phase. Therefore, at 2000 s, the liquid phase area in the vertical fin heat accumulator was closer to the upper wall. With the extension of time, because of natural convection, the heat storage material in the upper part of the cross section of the vertical fin heat accumulator was quickly melted, while the natural convection blocked by the mesh fins in the mesh fin heat accumulator was small. At 4000 s, the solid–liquid phase distributions of the two different-structured heat accumulators were different. At 6000–8000 s, the PCM area entered the heat transfer mode dominated by heat conduction once again. The mesh fins had a large heat transfer area with the PCM, and the melting speed of the PCM of the mesh fin heat accumulator was much faster than that of the vertical fin in the later period. The melting speed of PCM in the mesh fin heat accumulator was much faster than that in the vertical fin heat accumulator. From
Figure 7, it can be seen that the time of the full melting of the PCM in the mesh fin heat accumulator was shorter.
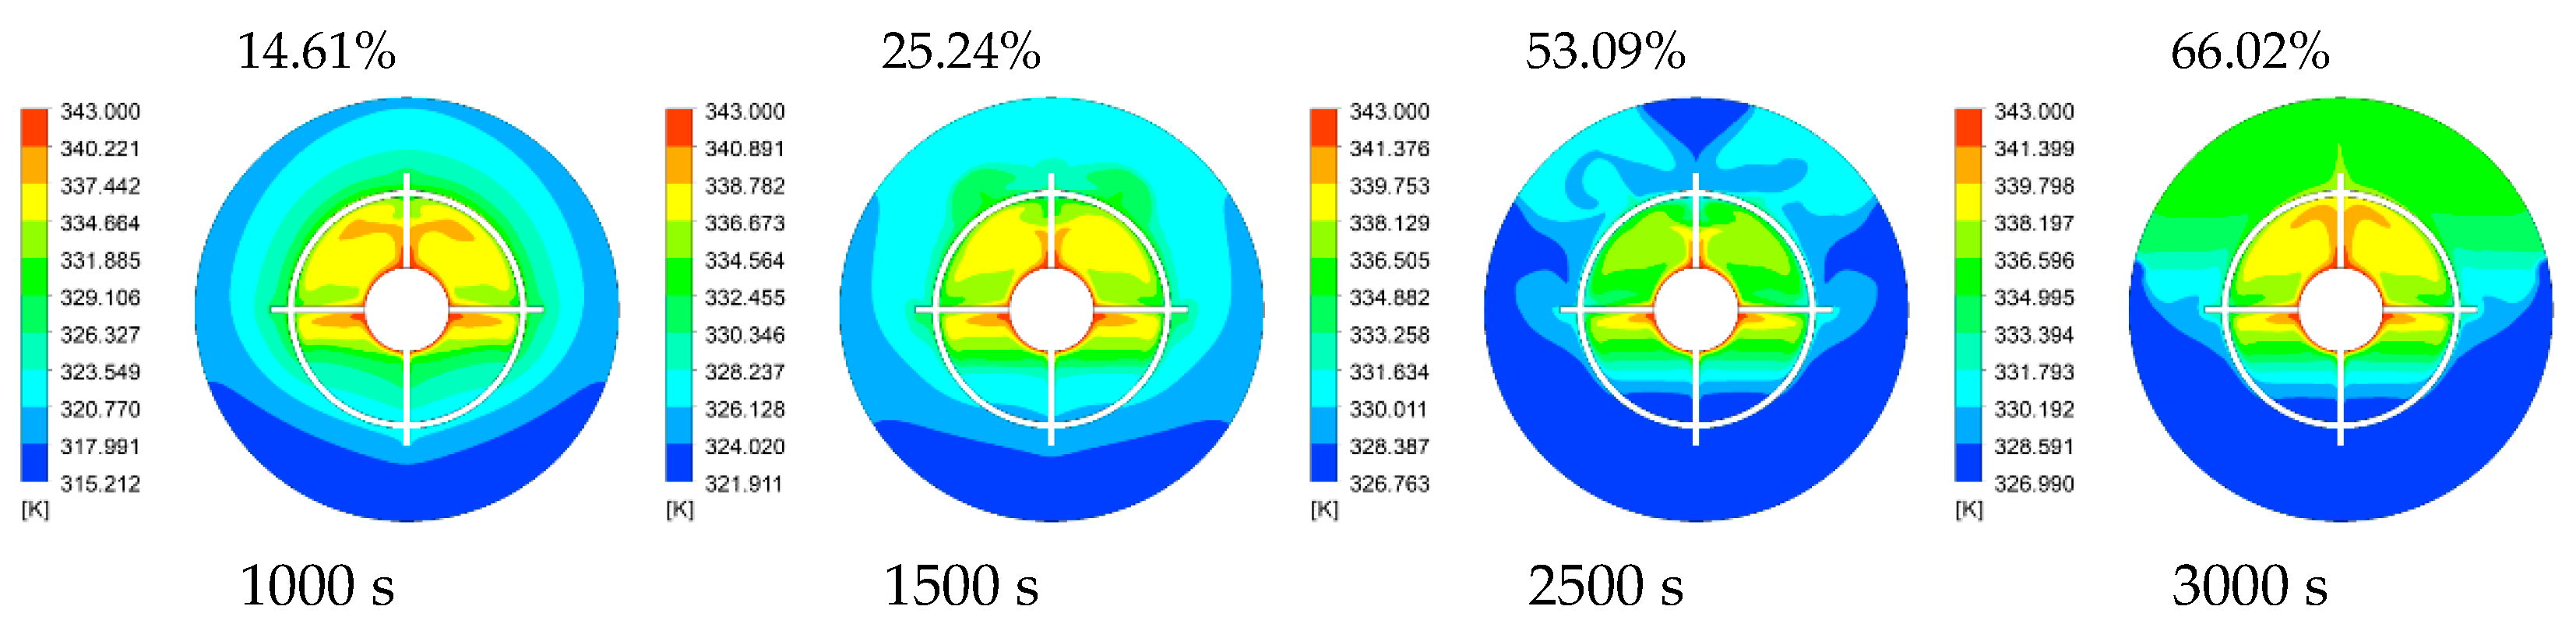
Figure 8 and
Figure 9 are the temperature cloud diagrams of two differently structure heat accumulator sections at different times, obtained under the above simulation conditions. The percentage of the material that melted at each time point has been indicated in the upper right corner of the temperature cloud diagrams. It can be seen that in the heat storage process of the mesh fin heat accumulator and the vertical fin heat accumulator, the temperature distributions of the heat accumulator were basically the same, both of which were higher in the upper part of the heat accumulator and lower in the lower part of the heat accumulator. At 1000 s, under the influence of natural convection, the higher temperature area in the vertical fin heat accumulator was larger, but the average temperature was lower, and the high temperature area was about 334 K. The natural convection of the mesh fin heat accumulator was blocked by the mesh fin, and the strong natural convection occurred in the area surrounded by the mesh fin, while the natural convection outside the mesh fin was weak. Due to the high heat transfer performance of the mesh fins, the temperature in the local area inside the mesh fin was higher and reached about 340 K. At 1500 s, the area of natural convection in the vertical fin heat accumulator continued to expand, but the overall temperature decreased, and the temperature in most of the high-temperature areas was about 332 K, which indicated that the influence of natural convection made the local temperature distribution more uniform. For the mesh fins, due to the strong thermal conductivity and large contact area of the fins, the temperature rose rapidly in the area surrounded by the mesh fins, and most of the temperatures reached about 338 K. However, due to the weak effect of natural convection, the temperatures were low in the area outside the mesh fins, and most of them were only between 326–328 K. At 2500 s, the strong natural convection heat transfer mode of the vertical fin heat accumulator made the temperature of most of the upper PCM area rise to 343 K quickly, and the temperature difference in the upper part of the area was small, which led to the heat transfer mode in the PCM area from the natural convection heat storage mode to the heat conduction heat storage mode. However, the area of the solid phase area at the lower part of the heat accumulator section was still large, resulting in a small change in the temperature and solid–liquid phase area of the vertical fin heat accumulator between 2500 s and 3000 s. For the mesh fin heat accumulator at 2500 s, the temperature difference between the PCMs inside and outside the mesh fin was large, but both reached the liquid phase temperature. Therefore, the natural convection heat transfer effect was gradually enhanced, resulting in a large temperature change in the mesh fin heat accumulator between 2500 s and 3000 s, and the overall temperature of the mesh fin heat accumulator increased rapidly.
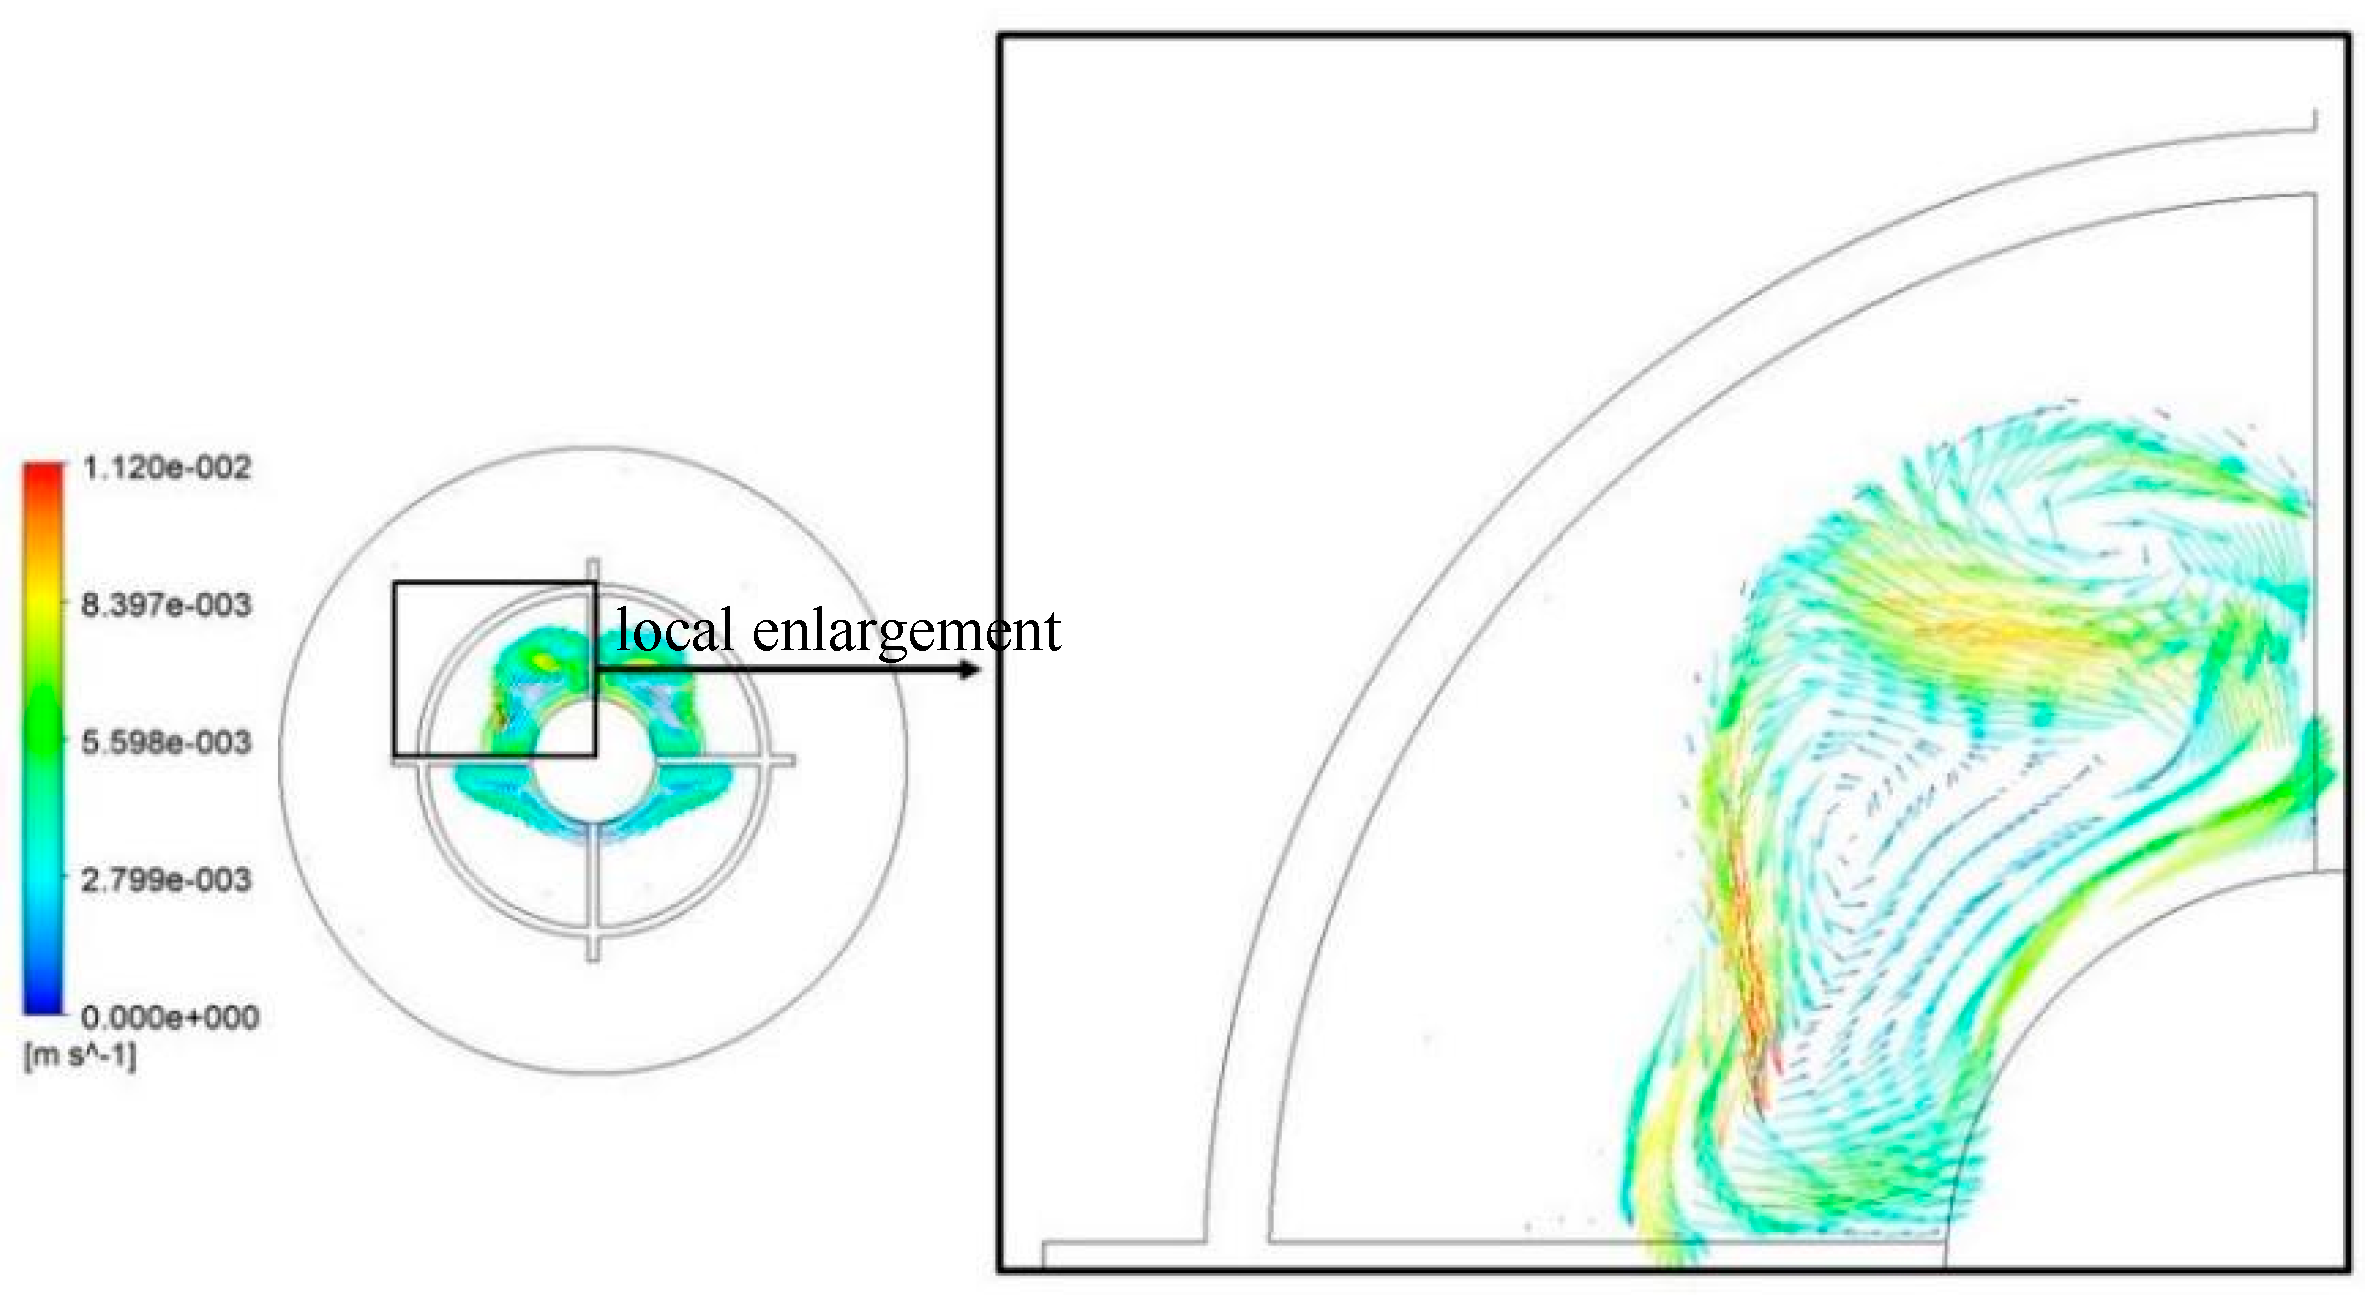
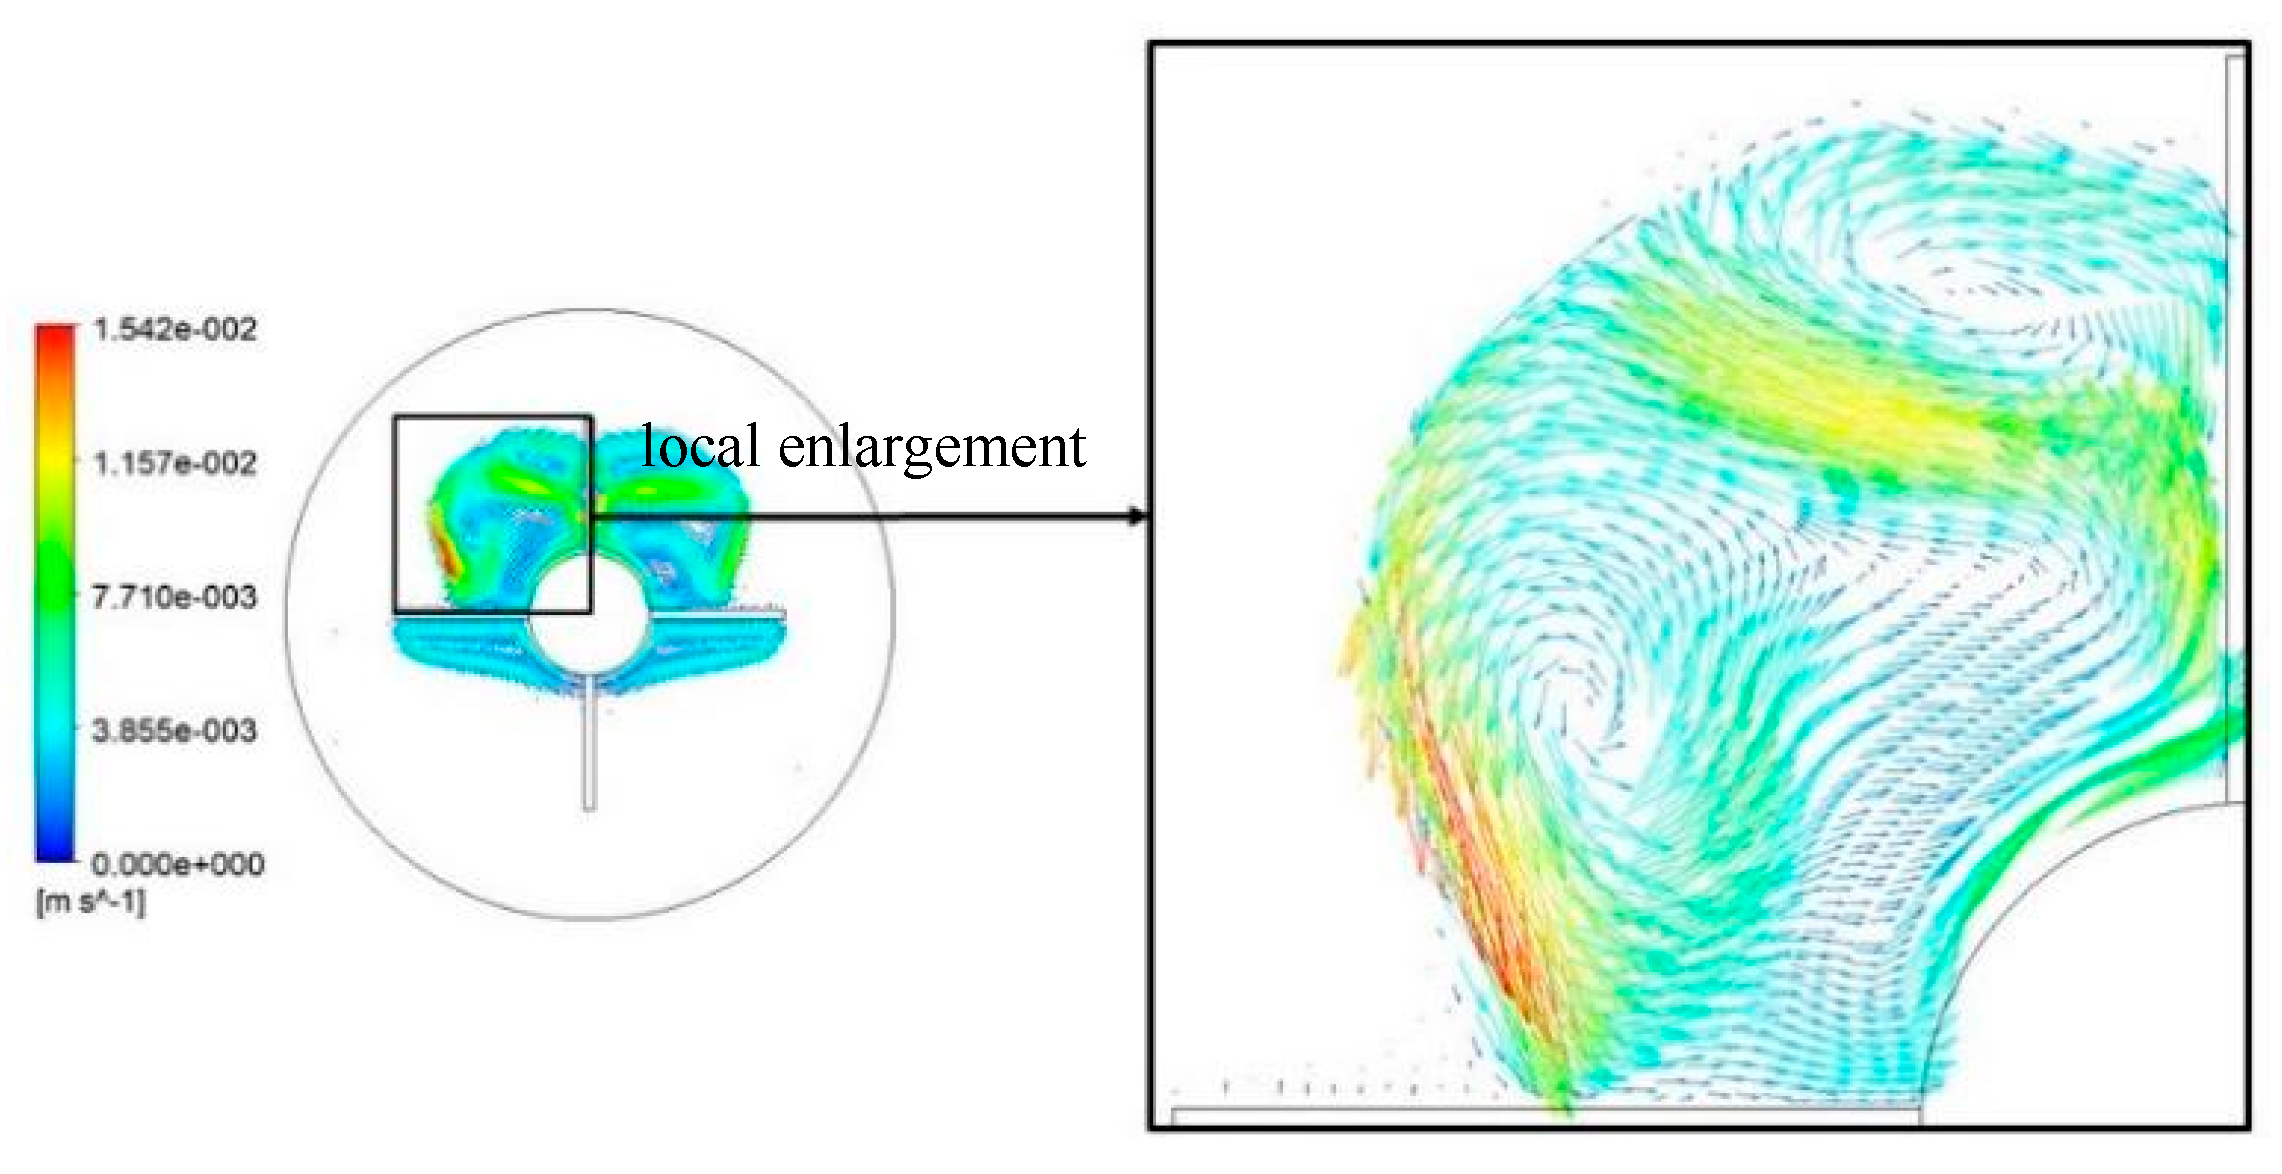
Figure 10 and
Figure 11 are the velocity vector diagrams near the fins of two different heat accumulators at 500 s under the above simulation conditions. The natural convection intensity of the upper half of the heat accumulator section of the two structures was higher than that of the lower half, and the movements of the upper half of the vertical fin heat accumulator and the mesh fin heat accumulator were different. The PCM near the hot wall and the fin of the vertical fin heat accumulator absorbed heat, melted, and formed three vortex flows under the action of the gravity field, which caused natural convection heat transfer, so the solid–liquid interface moved to the left and upper parts of the heat accumulator. The PCM on the upper left side of the mesh fin heat accumulator melted to form approximately two vortex-like flow states. In addition, the fluid velocities of the PCM of the mesh fin were significantly higher than the flow velocities of the vertical fin. Therefore, at 500 s, in the vertical direction, the upward flow of the mesh fin had a stronger scouring ability and a higher swept surface.
Figure 12 and
Figure 13 are the velocity vector diagrams near the fins of two different heat accumulators at 1000 s under the above simulation conditions. Compared with 500 s, the natural convection-swept surface of the two vortex-like flows of the vertical fins gradually became larger. The flow velocities of the fluid were faster, which enhanced the natural convection heat transfer intensity of the vertical fin heat accumulator. At 1000 s, the solid–liquid interface of the mesh fin heat accumulator reached the mesh fin. Due to the blocking of the mesh fin, the natural convection could not diffuse outside the fin. The PCM outside the fin gradually melted and formed a weak natural convection under the heat conduction mode of the fin. The velocities of the fluid in the fin were also lower than that of the fluid at 500 s, so the natural convection heat transfer intensities inside and outside the mesh fin were reduced. This result is consistent with the results of the above-mentioned liquid phase rate distribution and liquid phase area distribution.
Figure 14 shows the liquid phase rate curve of the heat storage process of the mesh fin heat accumulator when the radii
R of the mesh fin were 21.5 mm, 25.5 mm, 29.5 mm, 33.5 mm, and 37.5 mm, respectively, under the above simulation conditions. In the early stage of heat storage, the overall heat storage process took heat conduction as the main heat transfer mode, and the change trends of the liquid phase rate under different fin heights were basically the same. After 1000 s, the heat storage processes entered the natural convection-based heat transfer mode, the liquid phase rates increased rapidly, and when
R = 21.5–33.5 mm, with the increase in
R, the slopes of the liquid phase rate curve gradually increased, indicating that the heat storage speeds of the accumulator gradually accelerated. Then, the final heat storage times gradually became shorter with the increase in
R. When
R = 37.5 mm, the heat storage time increased, compared with other mesh fin radii.
When R was between 21.5–33.5 mm, the natural convection hindered by the upper mesh fins gradually increased with R, and the heat could not be timely transferred to the upper area of the accumulator. More heat was transferred to the lower part of the accumulator, which promoted the melting of the lower PCM and reduced the area of the PCM, depending on heat conduction heat transfer mode in the later stage. At the same time, the increase in the radius of the mesh fin increased the contact area between the fin and the PCM, which effectively improved the apparent thermal conductivity of the phase change area dominated by thermal conductivity in the later stage. When R = 37.5 mm, the mesh fin enhanced the blocking of natural convection, and the melting time of the PCM above the accumulator increased, but the solid–liquid interface of the PCM shifted downward almost unchanged; the heat gradually decayed along the radial direction of the vertical fin. When the radius of the mesh fin increased, although the heat transfer area in the PCM area increased, the energy transferred from the vertical fin to the mesh fin was also attenuated, resulting in an increase in the complete melting time of the PCM, compared to the accumulator with R = 33.5 mm.
4.2. Effect of Vertical Fin Thickness on the Heat Storage Performance
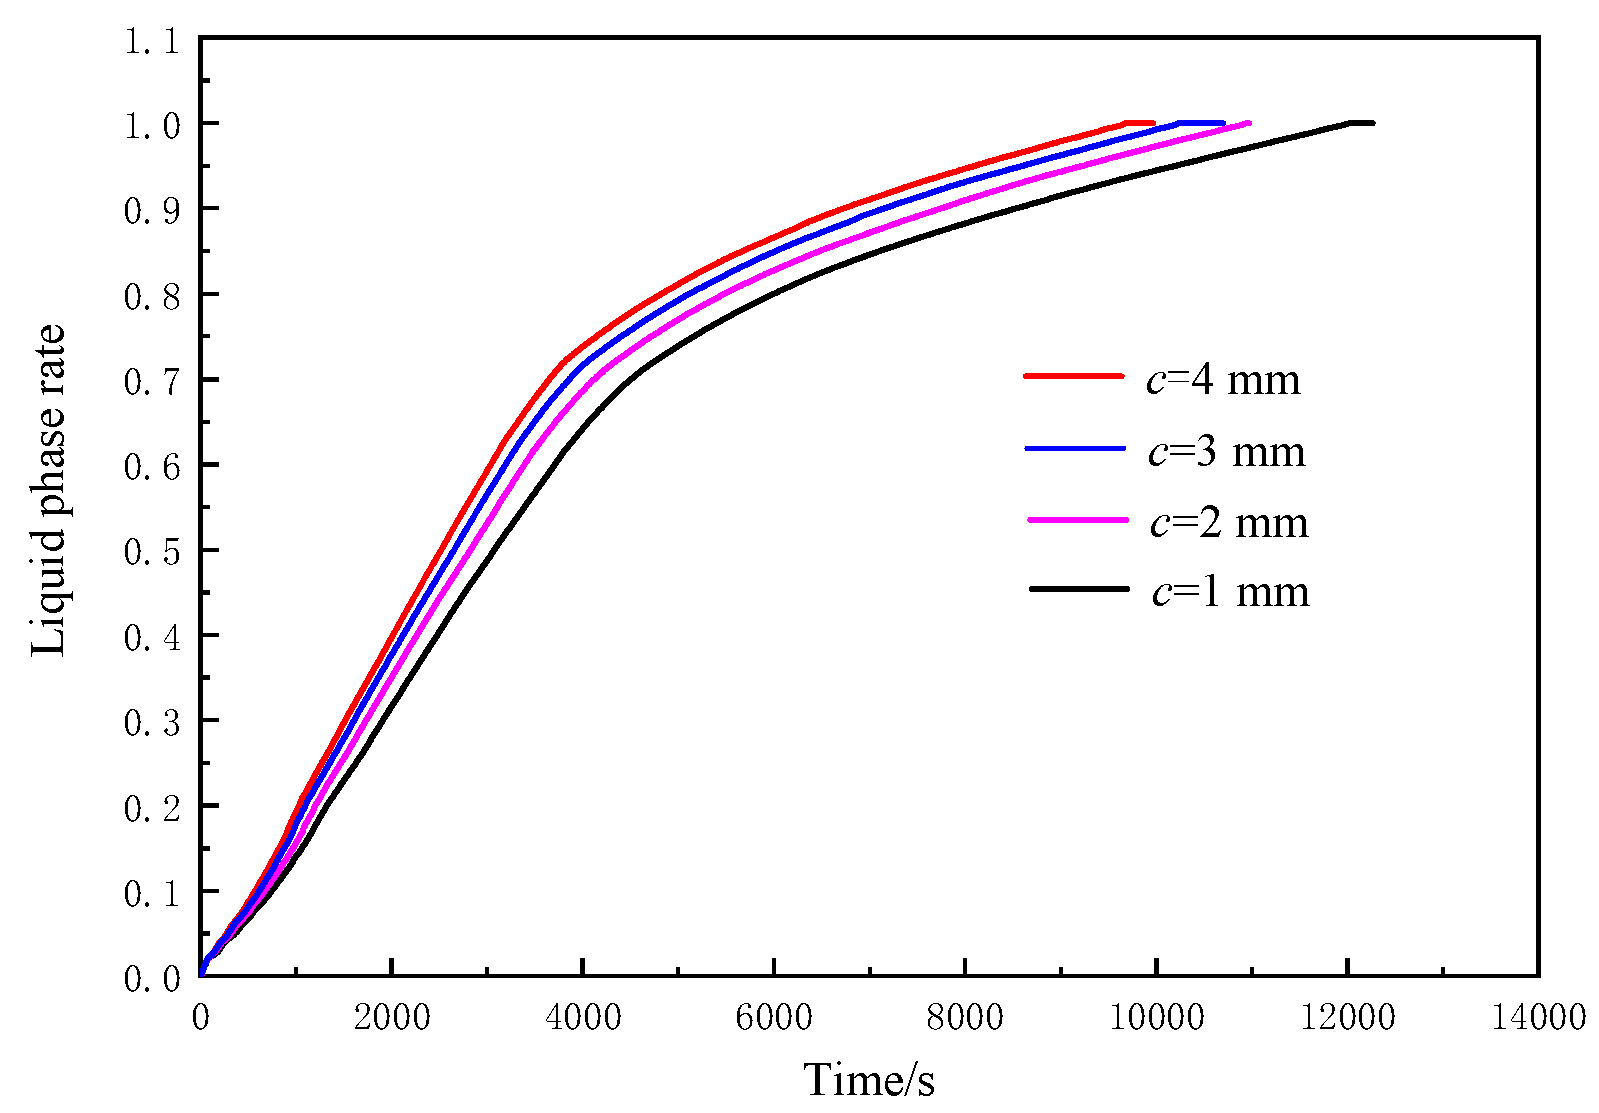
Figure 15,
Figure 16 and
Figure 17 show the solid–liquid phase cloud diagrams and the liquid phase rate curves at different times of the phase change heat accumulator when the radius of the mesh fin was
R = 33.5 mm, the thickness of the mesh fin was
δ = 2 mm, the number of vertical fins was
N = 4, and the thicknesses of the vertical fin were
c = 1 mm, 2 mm, 3 mm, and 4 mm, respectively. The percentage of the material that melted at each time point has been indicated in the upper right corner of the solid–liquid phase cloud diagrams.
From
Figure 15 and
Figure 16, it can be seen that the liquid phase distributions of the melting process of the PCM of the accumulator were basically similar when the vertical fin thicknesses were different. At 2000 s, the PCMs inside the area surrounded by mesh fins in the heat accumulator of
c = 4 mm were all melted, while there were still more solid PCMs in the heat accumulator with
c = 1 mm. At 4000 s, the PCMs on the upper and both sides of the mesh fin heat accumulator with
c = 4 mm all melted, while there were still more solid PCMs on the upper part of the accumulator with
c = 1 mm. After 6000 s, the solid–liquid interface of the accumulator with
c = 4 mm was lower than that of the accumulator with
c = 1 mm. The results showed that whether it was the heat transfer process dominated by heat conduction in the early stage or the heat transfer process dominated by natural convection heat transfer in the middle stage, with the increase in the thickness of the vertical fin, the heat storage rates of the heat accumulator were faster, and the times required were shorter.
It can be seen from
Figure 17 that when
c = 1–4 mm, with the increase in fin thickness, the times of heat conduction mode dominated by heat conduction in the early stage were gradually shortened, and the whole heat storage process could enter the heat transfer process dominated by natural convection heat transfer more quickly. Before 4000 s, the heat storage processes were dominated by natural convection, so the liquid phase rate curves were steeper. After 4000 s, most of the area entered the heat storage process dominated by heat conduction, and the liquid phase rate curves were gentler, consistent with the above liquid phase rate cloud diagram results.
The analysis showed that when the thickness of the fin increased, the thermal resistance of heat conduction of the high-temperature wall through the fin decreased, the temperature difference between the fin from the bottom to the top decreased, and the temperatures at the top of the fin were relatively higher, resulting in greater temperature differences with the surrounding PCMs and a faster heat transfer speed. The PCM around the fin was easier to melt, and it entered the heat storage process dominated by the earlier natural convection heat transfer. In the process of heat conduction and heat storage in the later stage, the thickness of the fin increased, the apparent thermal conductivity inside the whole heat accumulator increased, the heat storage effect was better, and the time required was shorter. When the vertical fin thicknesses c were 1 mm, 2 mm, 3 mm, and 4 mm, respectively, the melting times of PCM were 12,027 s, 10,945 s, 10,238 s, and 9685 s, respectively, and the heat storage times were shortened by 8.9%, 6.6%, and 5.1%. Otherwise, with the increase in vertical fin thickness, the volume of PCM in the accumulator decreased, which also shortened the melting time of PCM (see
Appendix A.1 for relevant calculations). The above melting time reduction ratio came from two aspects: fin-enhanced heat transfer and PCM volume reduction. It can be seen from the calculation that the proportions of melting time shortening caused by the increase in vertical fin thickness were 8.0%, 5.7%, and 4.2%.
4.3. Effect of Mesh Fin Thickness on the Heat Storage Performance
Figure 18,
Figure 19 and
Figure 20 show the liquid phase rate distribution cloud diagram and the liquid phase rate curve of the mesh fin heat accumulator with the mesh fin radius
R = 33.5 mm, the vertical fin thickness
c = 3 mm, the number of vertical fins
N = 4, and the mesh fin thicknesses
δ of 1 mm, 2 mm, 3 mm, and 4 mm, respectively. The percentage of the material that melted at each time point has been indicated in the upper right corner of the solid–liquid phase cloud diagrams.
It can be seen from
Figure 18 and
Figure 19 that before 4000 s, the melting morphologies of the PCMs of the heat accumulator with different mesh fin thicknesses were relatively the same. After 4000 s, the heat storage process of the heat accumulator with
δ = 3 mm was faster than that of
δ = 1 mm. The solid–liquid phase interface of the heat accumulator with
δ = 3 mm was lower than that of the heat accumulator with
δ = 1 mm, which indicated that the PCM of the heat accumulator with
δ = 3 mm was melted faster than that of the heat accumulator with
δ = 1 mm at this stage. In the later 6000 s and 8000 s, the heat accumulator entered the heat storage process dominated by heat conduction. The heat storage rate of the heat accumulator with
δ = 3 mm was faster, and the solid phase area was smaller.
Before about 4000 s, the heat accumulators were in the natural convection heat storage state most of the time, and the slopes of the liquid phase rate curve were larger. After 4000 s, it entered the heat storage process dominated by heat conduction, and the slopes of the liquid phase rate curve became gentler. However, whether it was natural convection or the heat conduction-based heat storage process, the slope of the liquid phase rate curve of heat storage gradually increased with the increase in the thickness of the mesh fin. The thicker the fin thickness, the higher the liquid phase rate value of the heat accumulator at the same time. Whether it was the natural convection heat transfer or the later heat conduction process inside the heat accumulator, with the mesh fin thickness increase, the heat storage effect became better. According to the analysis, the increase in the thickness of the mesh fin increased the thermal conductivity of the heat storage material area, which played a strengthening role in the rapid entry into the natural convection heat transfer process and the later thermal conduction heat storage process. The simulation results showed that when the mesh fin thicknesses
δ were 1 mm, 2 mm, 3 mm, and 4 mm, the melting times of the PCM were 10,446 s, 10,238 s, 9300 s, and 9200 s, respectively, and the heat storage times of the PCM were shortened by 2.1%, 9.1%, and 1.07%. Similarity, with the increase in mesh fin thickness, the volume of PCM in the accumulator decreased, which also shortened the melting time of PCM (see
Appendix A.1 for relevant calculations). The above melting time reduction ratio came from two aspects: fin-enhanced heat transfer and PCM volume reduction. It can be seen from the calculation that the proportions of melting time shortening caused by the increase in mesh fin thickness were 1.7%, 8.7%, and 0.7%.
4.4. Effect of the Number of Vertical Fins on the Heat Storage Performance
Figure 21 and
Figure 22 show the liquid phase rate distribution cloud diagrams and the liquid phase rate change curves of the phase change accumulator, with the radius of the mesh fin
R = 33.5 mm, the thickness of the vertical fin
c = 3 mm, the thickness of the mesh fin
δ = 3 mm, and the numbers of vertical fins
N = 4, 6, 8, and 10, respectively. The percentage of the material that melted at each time point has been indicated in the upper right corner of the solid–liquid phase cloud diagrams.
It can be seen from
Figure 21,
Figure 22 and
Figure 23 that as the number of fins increased, the area of the liquid phase area gradually increased at the same time, and the required heat storage time was greatly reduced. In the early stage of melting, the slope of the liquid phase rate curve of the accumulator with
N = 10 was higher than that of the liquid phase rate curve with
N = 4. With the extension of time, the greater the number of fins, the faster the liquid phase rate increased. At 4000 s, the liquid phase rate of the accumulator with
N = 4 was about 0.7, while the liquid phase rate of the accumulator with
N = 10 reached 0.8.
In the initial stage of heat storage, the heat storage process was dominated by heat conduction. With the number of vertical fins increasing, the heat conduction process in the PCM area could be effectively strengthened. However, due to the blocking of fins, the natural convection heat storage process may be weakened. Due to the low flow rate of the liquid PCM in the initial stage, the natural convection heat transfer intensity was low. While the number of vertical fins increased, the heat storage caused by heat conduction was enhanced. Therefore, both heat conduction and natural convection played a certain role in heat storage. Therefore, at 2000 s, the upper natural convection heat storage and the lower heat conduction heat storage had an equivalent action in the mesh fin heat accumulator with N = 10. The PCMs around the fins were all melted into the liquid phase. With the extension of time, the internal temperature difference in the heat accumulator increased, the intensity of natural convection increased, and the upper PCM melted faster under the erosion of natural convection. The solid phase area of the accumulator with N = 10 was much smaller than that of the accumulator with N = 4.
Figure 24 and
Figure 25 show the velocity contours of heat accumulators with
N = 4 and
N = 10 at different times under the above simulation conditions. The percentage of the material that melted at each time point has been indicated in the upper right corner of the velocity cloud diagrams. At 500 s, the internal velocities of the accumulator with
N = 4 were up to 1.56 × 10
−2 m/s. In the area forming natural convection, most of the fluid velocities were about 7.79 × 10
−3 m/s. The internal velocities of the accumulator with
N = 10 were up to 1.18 × 10
−2 m/s, and most of the fluid velocities in the area forming natural convection were about 5.9 × 10
−3 m/s.
In the initial stage of heat storage, because of the fins’ role of blocking natural convection, with the number of fins increasing, the effect of natural convection heat storage became worse. At 1000 s, the area surrounded by the mesh fins of the heat accumulator with
N = 4 completely entered the natural convection heat storage state. However, due to the influence of the mesh fins, the fluid flow velocity decreased instead. In the heat accumulator with
N = 10, the fins had a greater influence on the natural convection of the PCM. In the upper part, only two small areas surrounded by fins completely entered the strong natural convection state. The fins strengthened heat conduction, the temperature of the PCM around the fins was high, and the temperature differences inside the area separated by the fins were greater, which resulted in the flow velocities inside each area separated by the fins still increasing. At this stage, both heat conduction and natural convection had a certain contribution to heat storage. At 2000 s, the heat gradually diffused outside the fin, the PCM outside the fin gradually melted, and natural convection occurred under the action of the gravity field. The fluid velocities in the upper half of the heat accumulator with
N = 4 were higher, and the natural convection was stronger, while the velocities in most areas of the lower half were close to 0. While the natural convection occurred in the upper half of the heat accumulator with
N = 10, the PCM melted quickly under the influence of multi-fin heat conduction, and the heat storage of natural convection also occurred. The results are consistent with the results obtained from the curve of the liquid phase rate with time in
Figure 21. At 3000 s, the PCM of the upper half of the accumulator with
N = 4 melted completely, the natural convection intensity decreased, the velocities of the fluid gradually decreased, and it entered the heat storage process dominated by heat conduction. However, the PCM of the upper half of the accumulator with
N = 10 still did not completely melt, and there was still natural convection heat storage. The heat conduction of the multi-fins strengthened the natural convection in the lower half of the accumulator again, and the area of the liquid phase area gradually increased. The results are consistent with the results of the liquid phase distribution cloud diagrams in
Figure 21 and
Figure 22.
The calculation results showed that when the numbers of vertical fins
N were 4, 6, 8, and 10, the melting times of the PCM were 9300 s, 8852 s, 8086 s, and 7865 s, respectively, and the melting times of the PCM were shortened by 4.8%, 8.6%, and 2.7%. Otherwise, with the increase in the number of vertical fins, the volume of PCM in the accumulator decreased, which also shortened the melting time of PCM (see
Appendix A.3 for relevant calculations). The above melting time reduction ratio came from two aspects: fin-enhanced heat transfer and PCM volume reduction. It can be seen from the calculation that the proportions of melting time shortening caused by the increase in mesh fin thickness were 3.4%, 7.2%, and 1.3%.


