Article

Spatiotemporal Variations and Driving Factors of Carbon Emissions Related to Energy Consumption in the Construction Industry of China

1
China Railway Academy Group Co., Ltd., Chengdu 610031, China
2
School of Environmental Science and Engineering, Southwest Jiaotong University, Chengdu 610097, China
*
Authors to whom correspondence should be addressed.
Energies 2025, 18(14), 3700; https://doi.org/10.3390/en18143700
Submission received: 16 May 2025 / Revised: 28 June 2025 / Accepted: 9 July 2025 / Published: 14 July 2025
(This article belongs to the Special Issue Low-Carbon Development, Energiewende and Digitalization)

Abstract

As a major contributor to energy consumption and carbon emissions, the low-carbon transformation of the construction industry is crucial for China to achieve its established carbon-emission reduction targets. Therefore, a systematic analysis of the spatial and temporal evolution trends and key drivers of carbon emissions in the construction industry is an important reference for the formulation of emission reduction policies in the industry and the promotion of green and low-carbon development. This study first estimated carbon emissions from direct and indirect energy consumption in China’s construction industry. Spatial and temporal variations in emissions were then analyzed using spatial autocorrelation and kernel density methods. Furthermore, an improved logarithmic mean Divisia index decomposition model, tailored to the characteristics of the construction industry, was applied to quantify the key driving factors. The results reveal that total carbon emissions follow an inverted U-shaped trend, with indirect carbon emissions—mainly from the production of cement and steel—being the dominant contributors. Emissions display a spatially uneven pattern: high in the east and south, low in the west and north, with the high-emission zone gradually expanding from the east to the central regions. Marked regional differences also exist in the evolution of emission intensity. Output intensity and energy intensity are identified as primary drivers of emissions, with their impact particularly prominent in the eastern region. These findings provide a quantitative basis and theoretical support for developing region-specific emission reduction policies, advancing the green and high-quality development of China’s construction industry.

1. Introduction

As an important source of global energy consumption and carbon emissions, the construction industry plays a key role in combating climate change and achieving sustainable development goals. According to the International Energy Agency, global carbon emissions from the construction sector have reached 10 billion tons, accounting for 37% of the global energy-related carbon emissions [1], with the construction and operation phases of buildings being among the primary contributing phases. In China, as an important pillar for the development of the national economy, the construction industry covers a wide range of fields, such as housing, infrastructure, rail transportation, and water conservation projects, and it has shown a high level of development in line with the urbanization process and growth of major infrastructure investment in the country. However, construction is often accompanied by massive energy consumption and usage of construction materials, and the associated carbon emissions have remained high for several years. According to statistics, the total carbon emissions from the construction industry of China are estimated at approximately 5.08 billion tons in 2020, accounting for more than 50.09% of the total carbon emissions in the country [2]. Consequently, achieving the national dual carbon goal at the industry level is challenging. Therefore, an in-depth and systematic analysis of the spatial and temporal patterns of carbon emissions in the construction industry (CECI) and their influencing factors is crucial for formulating scientific and reasonable emission reduction policies and promoting the green transformation of the industry.
Numerous researchers have analyzed CECI, including carbon-emission measurement, spatial and temporal distributions, and influencing factors. Accordingly, various carbon-emission measurement methods have been established for the construction industry, such as the method proposed by the Intergovernmental Panel on Climate Change (IPCC) based on energy consumption [3], the life-cycle assessment method [4], and the input–output model [5]. Zhao et al. used the IPCC carbon-emission accounting method to establish a regional industrial carbon-emission measurement model for the industries of each province in China [6]. Regarding spatiotemporal patterns of carbon emissions from the construction industry, a combination of spatial analysis [7] and numerical modeling [8] is typically used. Chen et al. used spatial statistical analysis to study the spatial distribution characteristics and evolutionary trends in the intensity of carbon emissions from the construction industry in 30 provinces of mainland China [9]. Regarding the factors influencing CECI, researchers have primarily analyzed the impact of economic development, industrial energy consumption, industrial structure, and other factors on carbon emissions. Liu et al. used the logarithmic mean divisible index method to parse factors influencing the changes in carbon emissions from direct energy consumption in the construction industry in the Beijing–Tianjin–Hebei region and analyzed the influencing value and contribution rate of the factors at the macroscopic level [10]. Liu et al. measured the carbon emissions of the construction industry in each province and city, used the logarithmic mean Divisia index (LMDI) model to decompose the factors influencing CECI of China, and proposed countermeasures toward its low-carbon development [11].
Existing research on the spatiotemporal characteristics of CECI is generally limited by a single perspective and method. Most research results adopt only isolated analysis methods and fail to combine multidimensional data with dynamic models, resulting in an insufficient systematic understanding of the evolution of spatiotemporal patterns of carbon emissions. Most relevant research on the factors influencing CECI has focused on traditional factors such as economic growth and energy intensity, whereas quantitative analyses of other key factors, such as policy orientation and industrial structure adjustment, are relatively scarce. This limits the comprehensiveness and accuracy of research findings to a certain extent.
In this study, we investigated the spatiotemporal characteristics and factors influencing CECI across 30 provinces and municipalities in China, excluding Tibet, Hong Kong, Macao, and Taiwan, due to the unavailability of construction industry data. First, based on the panel data of 30 provinces and municipalities from 2010 to 2021, a carbon emission accounting model for the construction industry was established to quantify the carbon emission levels of China and the 30 provinces and municipalities in terms of time; Second, spatial autocorrelation and kernel density estimation are adopted to systematically reveal the spatial and temporal evolution patterns of carbon emissions from the construction industry and the dynamic evolution characteristics of carbon emission intensity, so as to make up for the limitations of the existing studies in terms of spatial scale singularity and the depth of dynamic analysis; Third, by incorporating sector-specific features and introducing the per capita housing completion area as an additional variable, we constructed a decomposition model to quantify the impact of key drivers, such as economic intensity and construction output intensity, on CECI. The research findings provide a scientific basis for formulating regional differentiated emission reduction policies and have important practical significance for promoting the construction industry to achieve the goal of carbon peaking and carbon neutrality. The methodological framework is shown in Figure 1.

2. Data and Methods

2.1. Data Sources

Owing to the lack of data related to the construction industry in Tibet, Hong Kong, Macao, and Taiwan, we considered 30 provinces and cities in China as the study area and grouped them into four economic regions: eastern, western, central, and northeastern regions (Table 1). The data on the consumption of eight types of energy sources considered in this study were obtained from the China Energy Statistical Yearbook, whereas the socioeconomic and consumption of construction materials data were obtained from the China Statistical Yearbook and China Construction Industry Statistical Yearbook, respectively. Moreover, the IPCC Inventory Guide (2006) can be referred to for the carbon-emission coefficients per energy type. All data are available on the China National Knowledge Infrastructure Platform website (https://www.cnki.net/, accessed on 15 October 2024).

2.2. Research Methodology

2.2.1. Measurement of Carbon Emissions in Construction Industry

This study adopted the carbon-emission accounting method provided by the IPCC to calculate the carbon emissions from the construction industry in the study area [12]. Because of the large number of emission sources involved in the upstream and downstream industrial chains of the construction industry, direct and indirect carbon emissions are considered [13]. Direct carbon emissions are the emissions generated by 8 types of energy consumption, such as raw coal, petrol, paraffin, etc., involved in the whole life cycle of the construction industry [14,15,16], and the standard coal coefficients and carbon emission coefficients used in the specific accounting are shown in detail in Table 2. Indirect carbon emissions mainly refer to the emissions generated during the production of five key building materials, cement, glass, steel, aluminum, and wood, used in the building construction process [14,17]; the specific carbon emission coefficients and recycling coefficients are shown in Table 3.
The carbon emissions from the construction industry can be modeled as follows:
C = C D + C I
C D = 44 12 i = 1 8 C i × f i × α i
C I = i = 1 5 M j × Q j × ( 1 β j )
where C , C D , and C I represent the total, direct, and indirect carbon emissions from the construction industry, respectively; C i represents the consumption of the i -th type of energy source; f i represents the conversion factor of the i -th type of energy source to standard coal; α i represents the carbon-emission factor of the i -th type of energy source; 44/12 represents the conversion factor of the relative molecular mass of carbon and CO2; M j represents the consumption of the j -th type of construction material; Q j represents the carbon-emission factor of the j -th type of energy source; and β j represents the recycling factor of the j -th type of building material.

2.2.2. Characterization of Spatial Distribution of Carbon Emissions in Construction Industry

  • Spatial autocorrelation analysis
In this study, spatial autocorrelation analysis was used to assess global and local spatial patterns of carbon emissions from the construction industry across 30 Chinese provinces and cities. Spatial autocorrelation refers to the spatial dependence of a variable on the spatial attributes at different geographical locations [20,21]. The spatial correlation between units in the study area was analyzed and calculated using ArcGIS 10.8, based on the following formulas:
I = n V i = 1 n j = 1 n W i j x i x ¯ x j x ¯ i n x i x ¯ 2
V = i = 1 n j = 1 n w i , j
where I is the global Moran’s index, ranging between −1 and 1. When the absolute value of I is closer to 1, the correlation between regions is stronger, whereas an absolute value of I closer to 0 indicates no correlation between the regions or a random performance. In addition, n is the number of regions, V is the sum of spatial weight matrices, w i j is a spatial weight matrix element, x i is the value of the i -th region, x j is the value of the j -th region, and x is the average across regions.
Local spatial autocorrelation analysis was performed to further investigate intra-regional spatial relationships [22]. The correlation is calculated as follows:
I i = x i x ¯ i x i x ¯ 2 × j n W i j x i x ¯ = Z i j = 1 n W i j Z i
where n is the number of observation units; x i and x j are the observation values of observation units i and j , respectively; x ¯ is the average of the observation values; Z i is the weight matrix that sums to 1 and is asymmetric in each row based on normalization; W i j represents the weight matrix normalized by rows; and I i is the local Murray index. I i > 0 indicates that a region exhibits similar spatial agglomeration characteristics as that around itself, such as high–high or low–low agglomeration, whereas I i < 0 indicates that a region exhibits different spatial agglomeration characteristics as that around itself, such as high–low or low–high agglomeration, and I i = 0 indicates that spatial agglomeration is not significant.
2.
Spatial dynamic analysis of carbon-emission intensity in construction industry
The kernel density estimation method was used to further explore the dynamic evolution of carbon emission intensity in China’s construction industry [23]. The method was used to determine the dynamic evolution trend of the variables through a continuous probability density curve formulated as follows:
f ( x ) = ( 1 n h ) i = 1 n K ( m i m h )
where f ( x ) represents the density function, n is the number of sample observations, h is the bandwidth, m is the sample average, m i represents the i -th sample observation, and K represents the kernel function. To maintain generality, the Gaussian kernel function was selected for dynamic analysis [24]. It is expressed as
K ( x ) = 1 2 π exp ( x 2 2 )

2.2.3. Identification of Factors Affecting Carbon Emissions in Construction Industry

This study constructs a decomposition model of the factors influencing carbon emissions, based on the Kaya identity and using the LMDI method. The LMDI approach offers strong explanatory power, is dimensionless, and yields decomposition results without residuals [25], making it a widely adopted method for analyzing the drivers of carbon emissions [26]. Previous research has demonstrated that population, energy intensity, economic output, and carbon emission intensity all significantly influence carbon emissions [27,28]. Building on this foundation, this paper incorporates construction industry-specific factors—namely, construction output intensity and per capita housing completion area—to develop a carbon emission factor decomposition model tailored specifically to the construction sector. (Since the LMDI model is based on linear assumptions, it is unable to identify non-linear features such as diminishing marginal effects and threshold effects in the factors affecting carbon emissions.) The decomposition formula is as follows:
C = C E × E G D P s × G D P s G D P × G D P S × S P × P
where C represents the carbon emissions of the construction industry (104 tons), E represents the energy consumption (104 million tons), G D P represents the gross domestic product (104 yuan), G D P s represents the construction industry output (104 yuan), S represents the area of completed housing construction in the construction industry (104 m2), and P represents the regional population (104 people).
C I = C E ;   E N I = E G D P s ;   E C I = G D P s G D P ;   C O = G D P S ;   P D = S P ;   P S = P
where C I is the ratio of construction industry carbon emissions to energy consumption, indicating the carbon-emission intensity factor of the construction industry; E N I is the ratio of the total energy consumption to construction industry output, indicating the energy intensity factor; E C I is the ratio of the construction industry output to the gross domestic product, indicating the economic intensity factor; C O is the ratio of the gross domestic product to the completed floor area of construction industry buildings, indicating the construction industry output intensity factor; P D is the ratio of completed floor area of construction industry buildings to the resident population, indicating the per capita housing completion factor; and P S is the resident population, indicating the population scale factor.
In this study, the LMDI additive decomposition model was used to quantify the factors affecting CECI [29]. The total amounts of carbon emissions at the beginning and end of period t are denoted as C 0 and C t , respectively, and the total amount of carbon-emission changes in the construction industry during the study period is denoted as Δ C M and calculated as follows:
Δ C M = C t C 0 = Δ C I + Δ E N I + Δ E C I + Δ C O + Δ P D + Δ P S
where Δ C I , Δ E N I , Δ E C I , Δ C O , Δ P D and Δ P S denote the contributions of the indicators C I , E N I , E C I , C O , P D and P S to carbon emissions, respectively, which can be calculated using Equations (12)–(17), respectively.
Δ C I = C t C 0 ln C t ln C 0 × ln ( C I t C E 0 )
Δ E N I = C t C 0 ln C t ln C 0 × ln ( E N I t E N I 0 )
Δ E C I = C t C 0 ln C t ln C 0 × ln ( E C I t E C I 0 )
Δ C O = C t C 0 ln C t ln C 0 × ln ( C O t C O 0 )
Δ P D = C t C 0 ln C t ln C 0 × ln ( P D t P D 0 )
Δ P S = C t C 0 ln C t ln C 0 × ln ( P S t P S 0 )

3. Results and Analysis

3.1. Temporal Variations in Carbon Emissions from Construction Industry

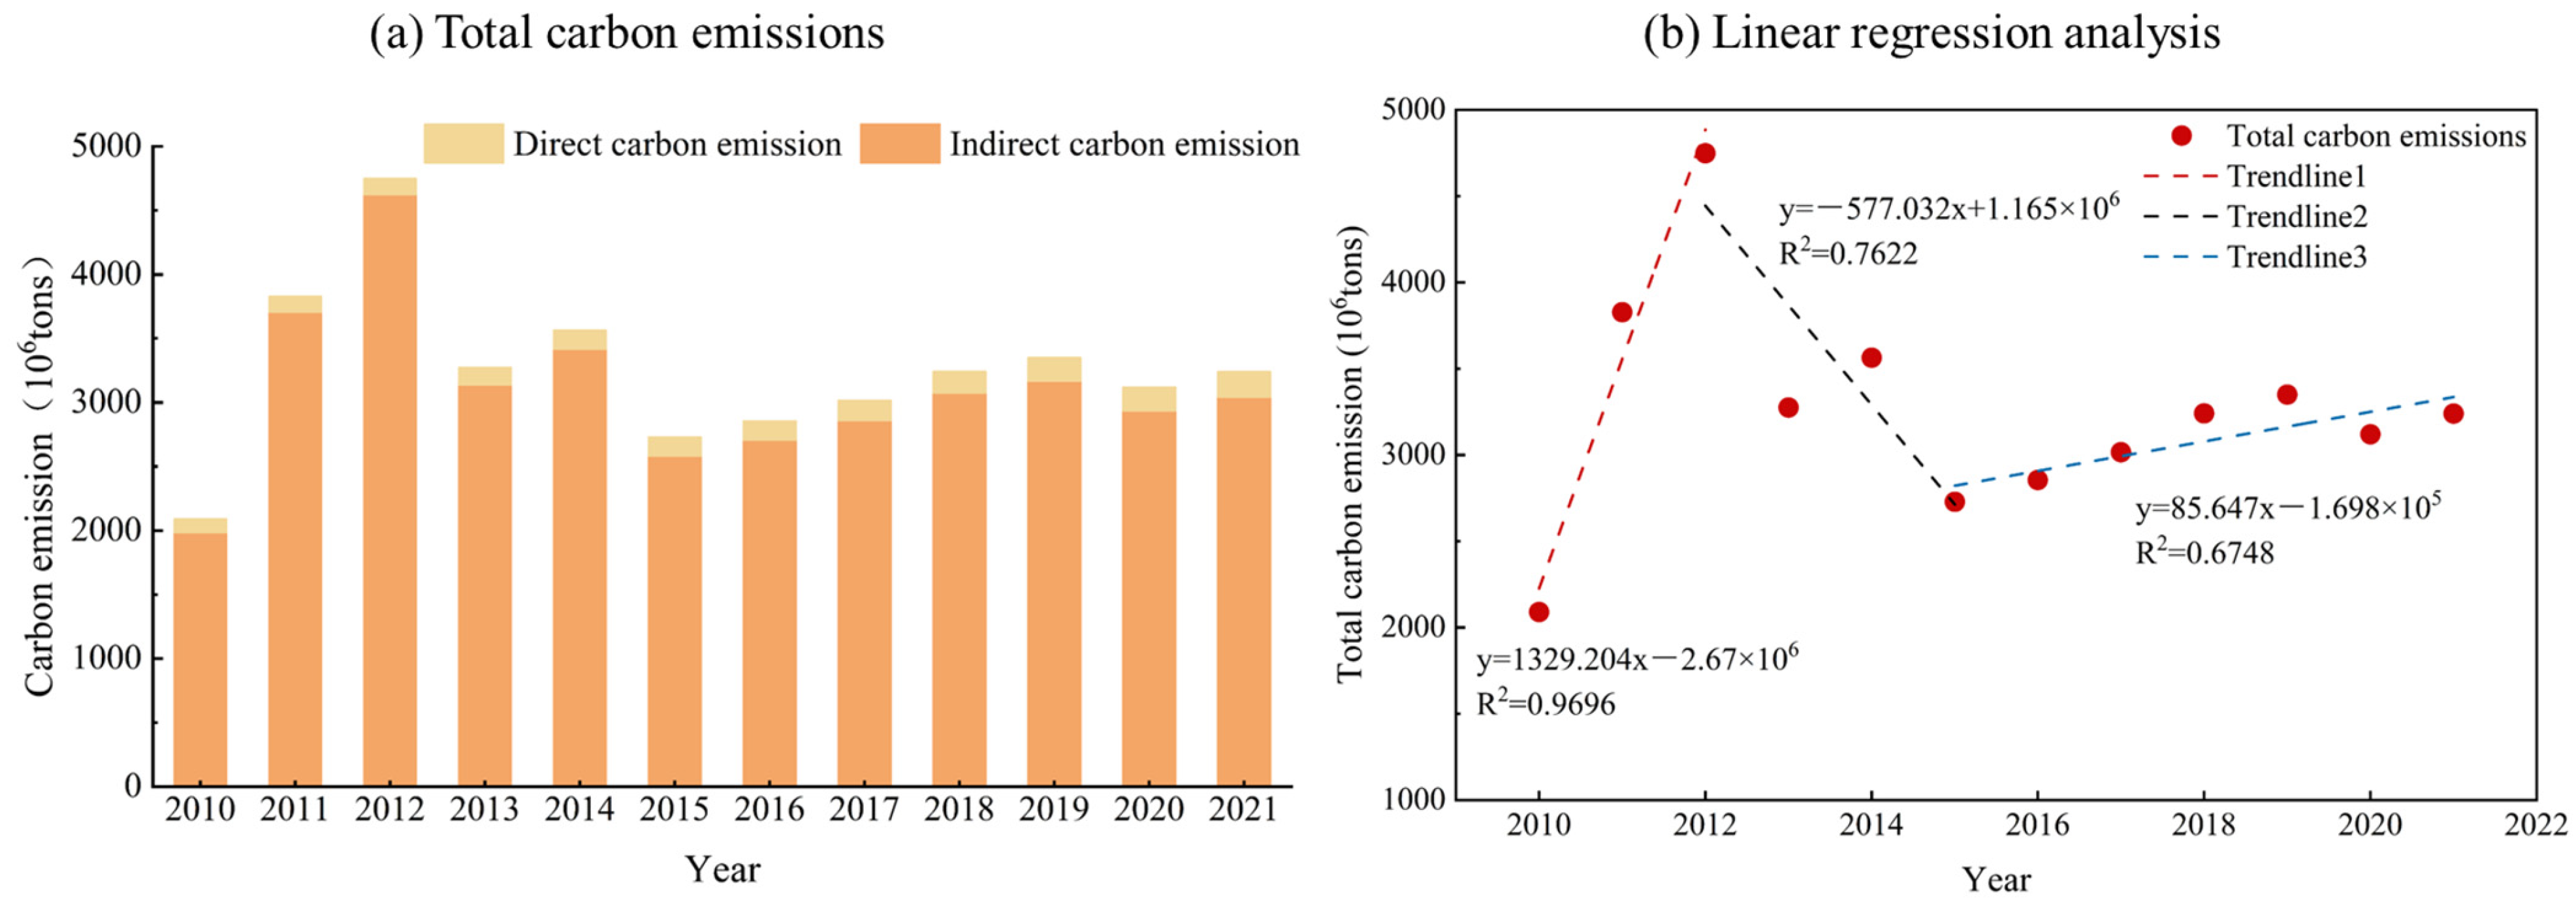
Between 2010 and 2021, China’s total CECI exhibited an upward trend followed by a decline (Figure 2a), with an overall increase of 1150.245 million tons, representing a 55.02% rise and an average annual growth rate of 4.06%. According to the linear regression analysis (Figure 2b), from 2010 to 2012, carbon emissions from the construction industry grew steadily, with an average annual growth rate of 1329.202 million tons, reaching a peak in 2012. This period marked the growth phase of the construction industry, with an average annual growth rate of 3–5% in terms of floor space, accompanied by a relatively high demand for energy and materials, leading to an increase in carbon emissions. From 2013 to 2015, CECI experienced a fluctuating downward trend, particularly in 2013, when carbon emissions dropped sharply by 30.05% year-on-year. This decline was primarily due to the successive issuance of green building policies and standards in China, which guided the industry to reduce its negative environmental impact while ensuring building functionality and comfort [30]. These measures effectively improved the energy and material utilization efficiency of the construction industry and reduced its carbon emissions. From 2015 to 2021, carbon emissions exhibited a slow upward trend, with an overall change of only 2.90% per year. This trend was driven by policy regulation and industry expansion. During the 13th Five-Year Plan period, the implementation of emission reduction policies such as the “Green Building Action Plan” and the “Energy Conservation and Emission Reduction 13th Five-Year Plan” significantly improved building energy efficiency standards [31], promoted the replacement of high-carbon building material production capacity, and curbed the rapid growth of carbon emissions. However, the expansion of building scale exerted countervailing pressure, as the total output value of the construction industry continued to increase and construction areas expanded continuously, leading to a growth in carbon emissions. In this context, material structural optimization appropriately mitigated the pressure on carbon emissions from scale expansion, highlighting the key role of policy regulation in guiding the low-carbon transformation of the construction industry [32].
In terms of carbon-emission structure, indirect CECI consistently dominated direct carbon emissions, accounting for over 90% of total CECI during the study period. This finding aligns with the development trend discovered by Zhou et al. [14]. The carbon emissions of construction materials such as cement and steel were among the highest indirect carbon emissions (Figure 3). The total indirect carbon emissions of cement and steel were 112.83% in 2021. Notably, wood offset 13.9% of the indirect carbon emissions and was the only renewable carbon-negative material among the five specified materials. The carbon emissions released during the production and transportation of construction materials should also not be underestimated. Thus, the green and low-carbon transformation and sustainable development of the construction industry can be promoted by improving the production process, adopting low-carbon construction materials, and optimizing the production and transportation of construction materials.
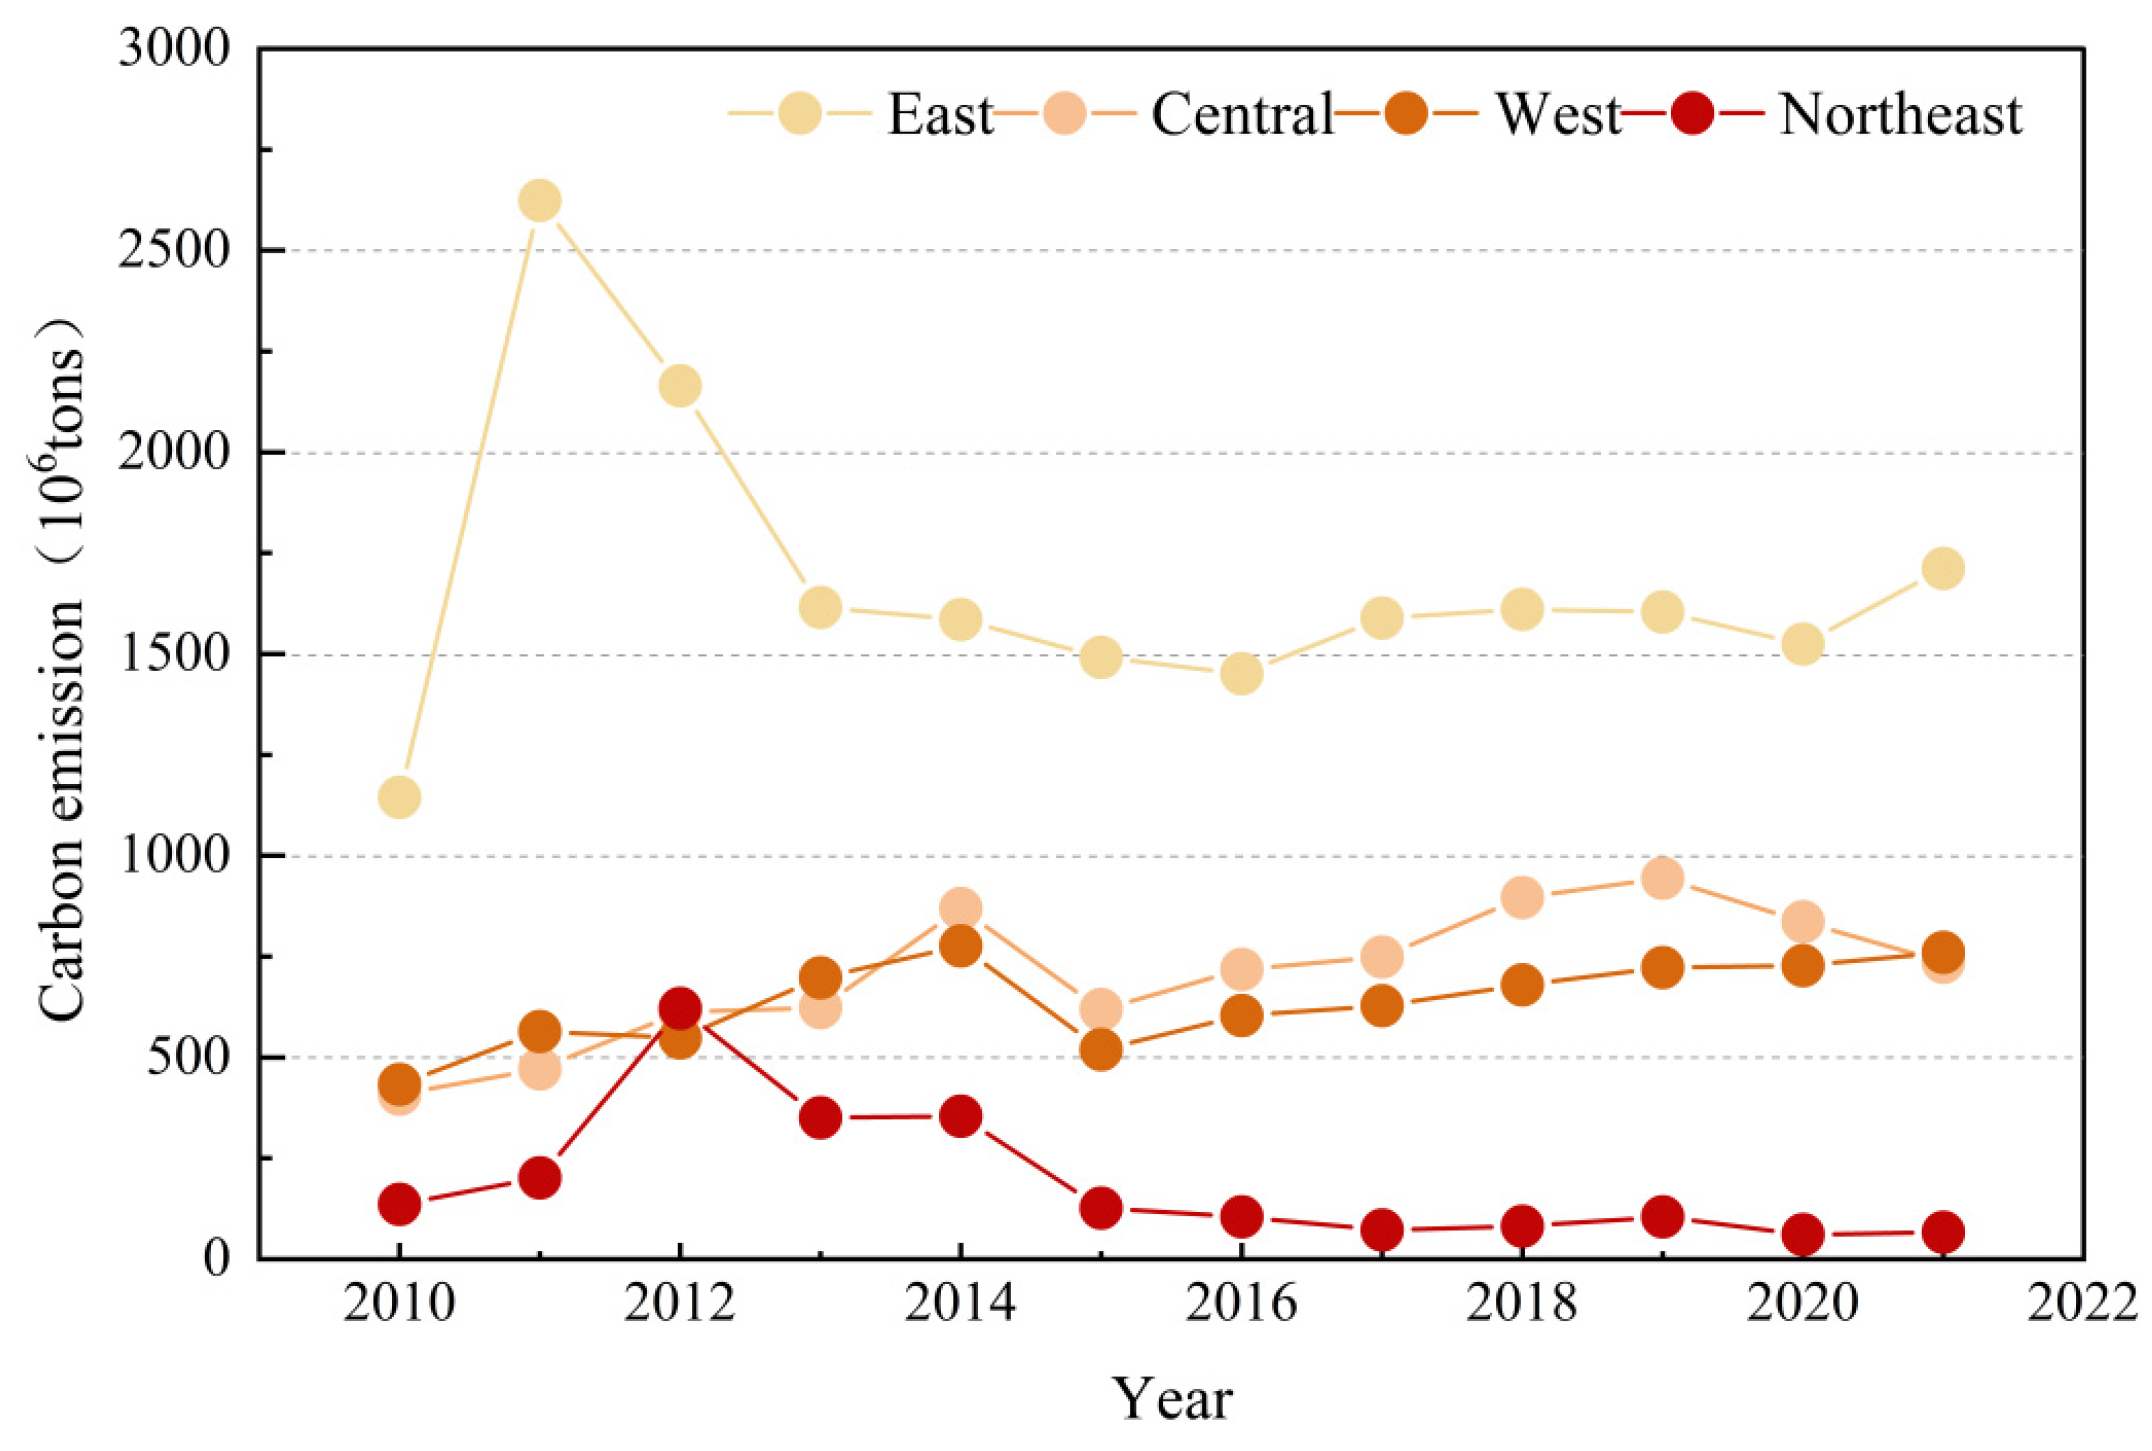
Regional trends in carbon emissions from the construction industry in the four regions from 2010 to 2021 closely mirrored the national pattern (Figure 4), exhibiting an initial increase followed by a decline. This trend was largely driven by robust national policy interventions [33]. During the study period, the eastern region accounted for the largest share of CECI due to its massive economic scale and high construction volume, contributing over 40% of China’s total CECI. This dominance stemmed from its large economic scale, high construction volume, industrial agglomeration, and economies of scale. The central region ranked second, where CECI exhibited stable or even negative growth driven by industrial transformation. However, regional differences were significant, creating a complex landscape of competition and collaboration between cities. Despite having a relatively low overall carbon emissions level, the western region experienced continuous growth in emissions due to the infrastructure investment boom driven by the Western Development Strategy. Sichuan Province, with an average contribution rate of 35.7%, emerged as the primary contributor to regional emissions, with technological lag and policy delays further exacerbating emission pressures. The northeastern region, constrained by economic recession, a single-industry structure, and population outflow, has consistently maintained a carbon emissions share of less than 10%. The high stock of outdated buildings and insufficient funds for transformation further hinder low-carbon development. This study revealed significant gradient differences among cities within regions in terms of construction industry development levels, technological application capabilities, and effectiveness in controlling carbon emissions.

3.2. Spatial Characteristics of Carbon Emissions in Construction Industry

3.2.1. Spatial Distribution and Correlation of Carbon Emissions in the Construction Industry

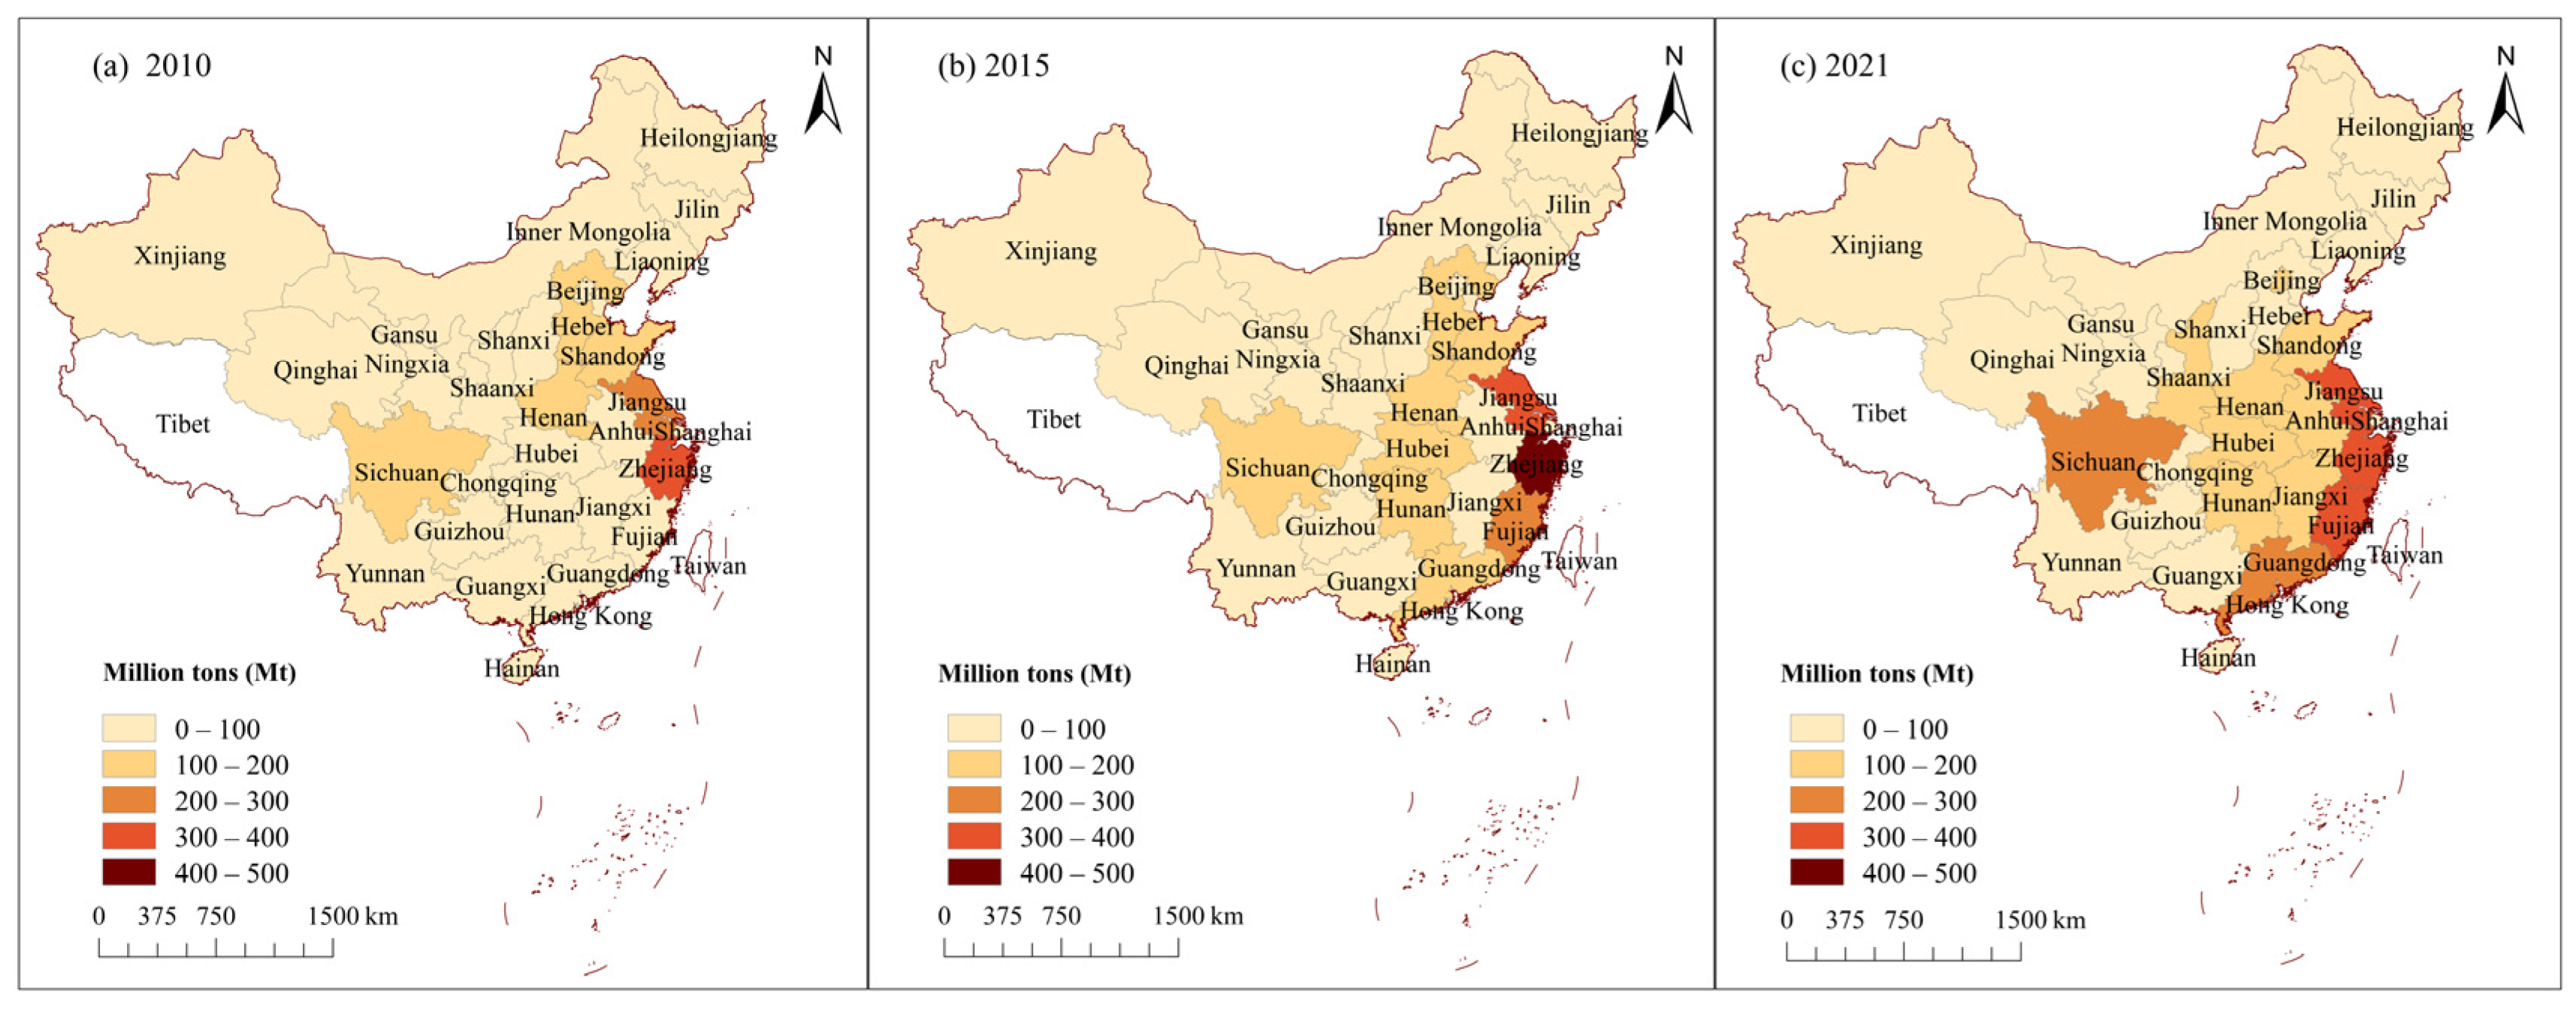
Overall, carbon emissions from China’s construction industry exhibited spatial disparities, characterized by higher emissions in the east and south and lower emissions in the west and north (Figure 5). In 2010, Zhejiang Province in the eastern region recorded the highest carbon emissions at 318.265 million tons, while other provinces and municipalities remained in the low-carbon phase due to limited infrastructure development. By 2015, provinces such as Jiangsu and Fujian had begun to transition toward high-carbon emission stages, with carbon emissions reaching 325.067 million tons and 203.835 million tons, respectively. Meanwhile, central provinces such as Hebei and Hunan experienced a surge in emissions driven by industrial transfers from the east and rising demand for construction materials, including steel and cement. In 2021, Zhejiang implemented policies such as the Building Carbon Efficiency Code System and expanded prefabricated construction [34], resulting in a gradual decline in emissions to 332.891 million tons. However, emissions continued to rise in provinces like Anhui and Jiangxi, which rely on traditional construction methods and operate with outdated building practices and low energy efficiency. These regional disparities suggest that core eastern provinces must accelerate technology-driven emissions reduction, while industrial-transfer regions should limit high-carbon capacity expansion and enhance energy efficiency to address the complex spatial patterns of carbon emissions.
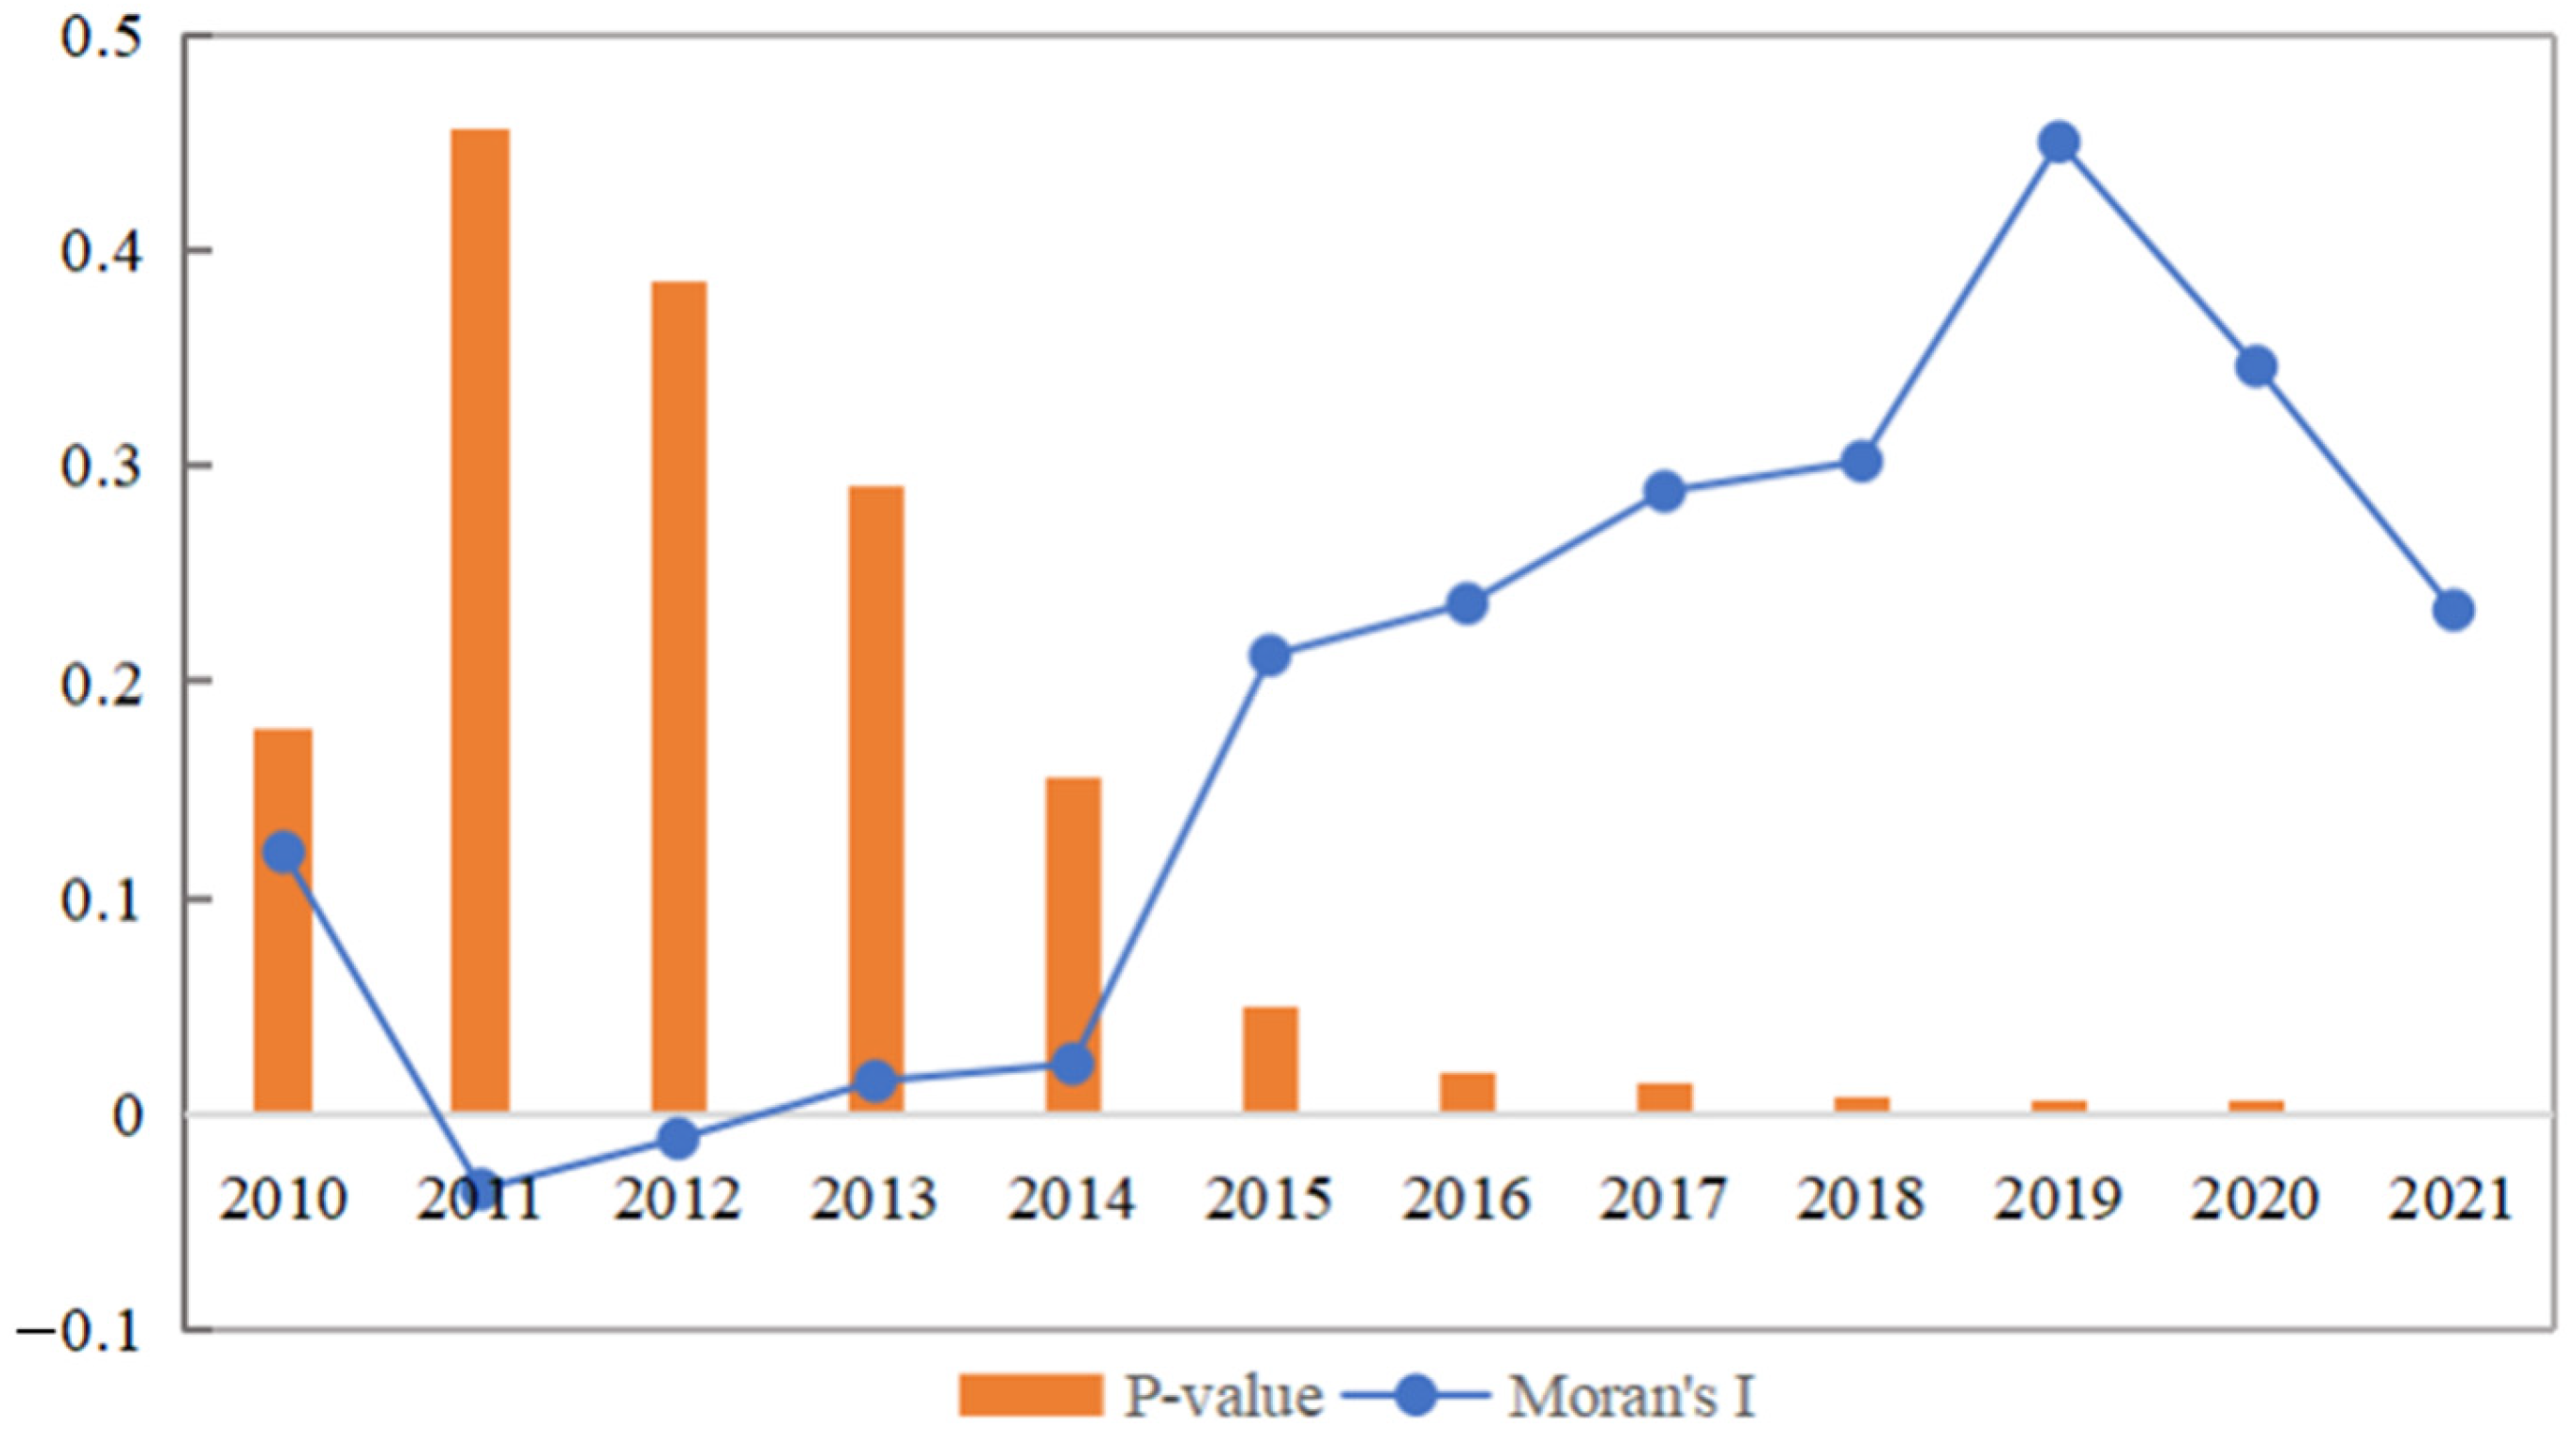
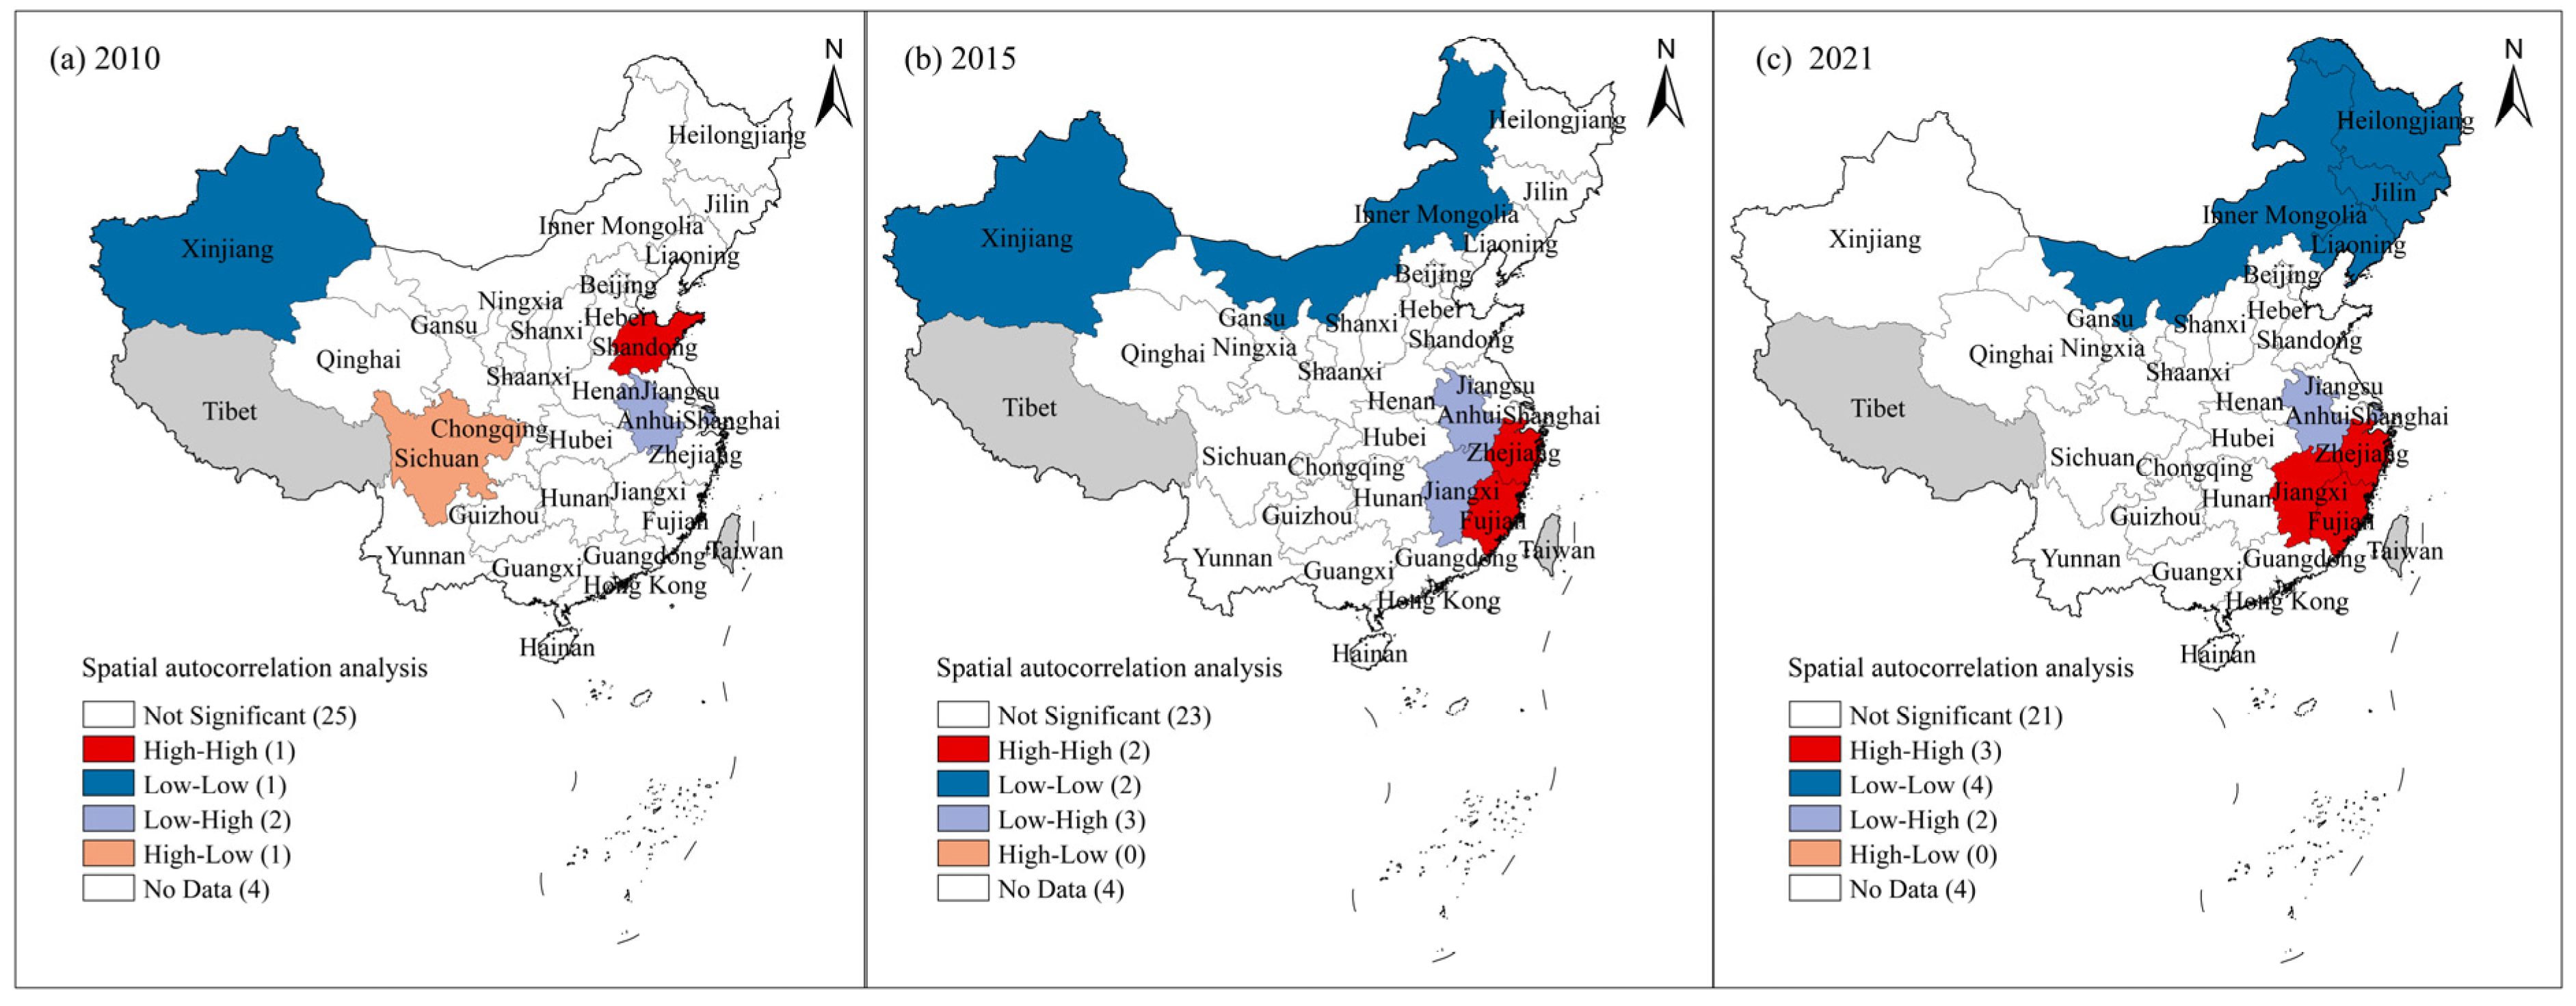
The p-values and Moran’s I indices for the period 2010–2021 were calculated to assess spatial correlation (Figure 6). Between 2010 and 2014, Moran’s I indices fluctuated between −0.035 and 0.121, with p-values exceeding 0.1, indicating no significant spatial autocorrelation. From 2015 to 2021, the index significantly increased to a range of 0.212 to 0.45, with p-values for all years below 0.05 (in 2021, p = 0.00196 passed the 1% significance test), indicating a significant positive correlation. The following analysis focuses on the years 2010, 2015, and 2021. In 2010, a typical “east high, west low” pattern emerged (Figure 7a). Shandong province exhibited high–high agglomeration, surrounded by high-carbon-emitting provinces such as Jiangsu and Shanxi. This clustering reflected rapid economic development, as well as the concentration of energy-intensive industries such as steel and cement in the eastern region. Conversely, the low–low agglomeration in Xinjiang reflected lagging economic development in the western region. In 2015, southeastern coastal provinces such as Zhejiang and Fujian had become high–high agglomeration areas (Figure 7b), while Inner Mongolia remained in a low–low agglomeration. This shift reflects the gradual transfer of energy-intensive industries from traditional concentration areas to surrounding areas, such as Shandong and Anhui, and the effectiveness of regional differentiated energy efficiency policies implemented during the 12th Five-Year Plan period. In 2021, low–low agglomeration continued to shift toward the northeastern region (Liaoning, Jilin, Heilongjiang) (Figure 7c), while carbon emissions from the construction sector in central regions experienced notable growth in high–high agglomeration. This indicates that Jiangxi Province absorbed high-energy-consuming industries overflowing from eastern regions, increasing carbon emissions. In summary, this study revealed that carbon emissions in China’s construction sector exhibit distinct path dependence and gradient transfer characteristics. The high-carbon concentration effect in the eastern regions continues to spread to surrounding areas, while spatial heterogeneity in policy implementation constrains national emission reduction coordination.

3.2.2. Spatial Dynamic Analysis of Carbon-Emission Intensity in Construction Industry

In this study, the MATLAB 2023a software was used to draw kernel density estimation maps of carbon-emission intensity in the eastern, central, western, and northeastern regions (Figure 8). In terms of spatial distribution, the eastern region exhibited a “multipolar” pattern (Figure 8a), with the main peak shifting to the 0.5–1.0 intensity range during the observation period and reaching a peak value of 2.9. This shift reflects the emission reduction achievements of the region through industrial structure upgrading and strengthened environmental regulations, particularly the leading role of economically developed provinces in promoting the green transformation of high-energy-consuming enterprises [35]. In the central region, the main peak shifted leftward and became narrower (Figure 8b), with a decline in the peak value. This trend corresponds with the construction industry resource integration policy implemented during the 12th Five-Year Plan. However, a discontinuity in carbon emission intensity in 2012 indicates policy implementation challenges [36], underscoring the need for a more stable, long-term regulatory framework. The western region displayed a “one main peak and multiple secondary peaks” distribution (Figure 8c). The main peak remained stable within the 0.4–0.6 range, while the secondary peaks gradually weakened, with their peaks falling below 4. This reflects the energy efficiency improvements resulting from the Western Development Policy and highlights the development gap between energy-producing provinces and other provinces, necessitating the establishment of a more refined provincial regulatory system. In the Northeast region, the distribution pattern evolved from multiple peaks to a single peak, with a broadening peak width (Figure 8d), and the intensity range stabilized at 0.3–0.5 in the later period. This reflects the complex interplay between traditional development models and emerging factors during the region’s deep industrial restructuring process, highlighting the urgent need for a differentiated carbon management mechanism tailored to the characteristics of the transition period.
Overall, although carbon-emission intensity in China’s construction industry has declined, significant regional differences exist. The eastern region exhibits a multi-peak pattern, with varying degrees of progress in low-carbon transformation within the region; the central region lacks momentum for emissions reduction due to policy coordination issues and industrial transition pressures; the western region faces development imbalances between central cities and remote areas, with varying levels of technology application; and the northeastern region experiences significant fluctuations in carbon emissions intensity due to the impact of traditional industrial transformation.

3.3. Factors Affecting Carbon Emissions in Construction Industry

This study decomposes the factors influencing carbon emissions in China’s construction industry using Formulas (9)–(17). Factors that promote CECI are represented by positive values, while factors that inhibit CECI are represented by negative values. The results are as follows:
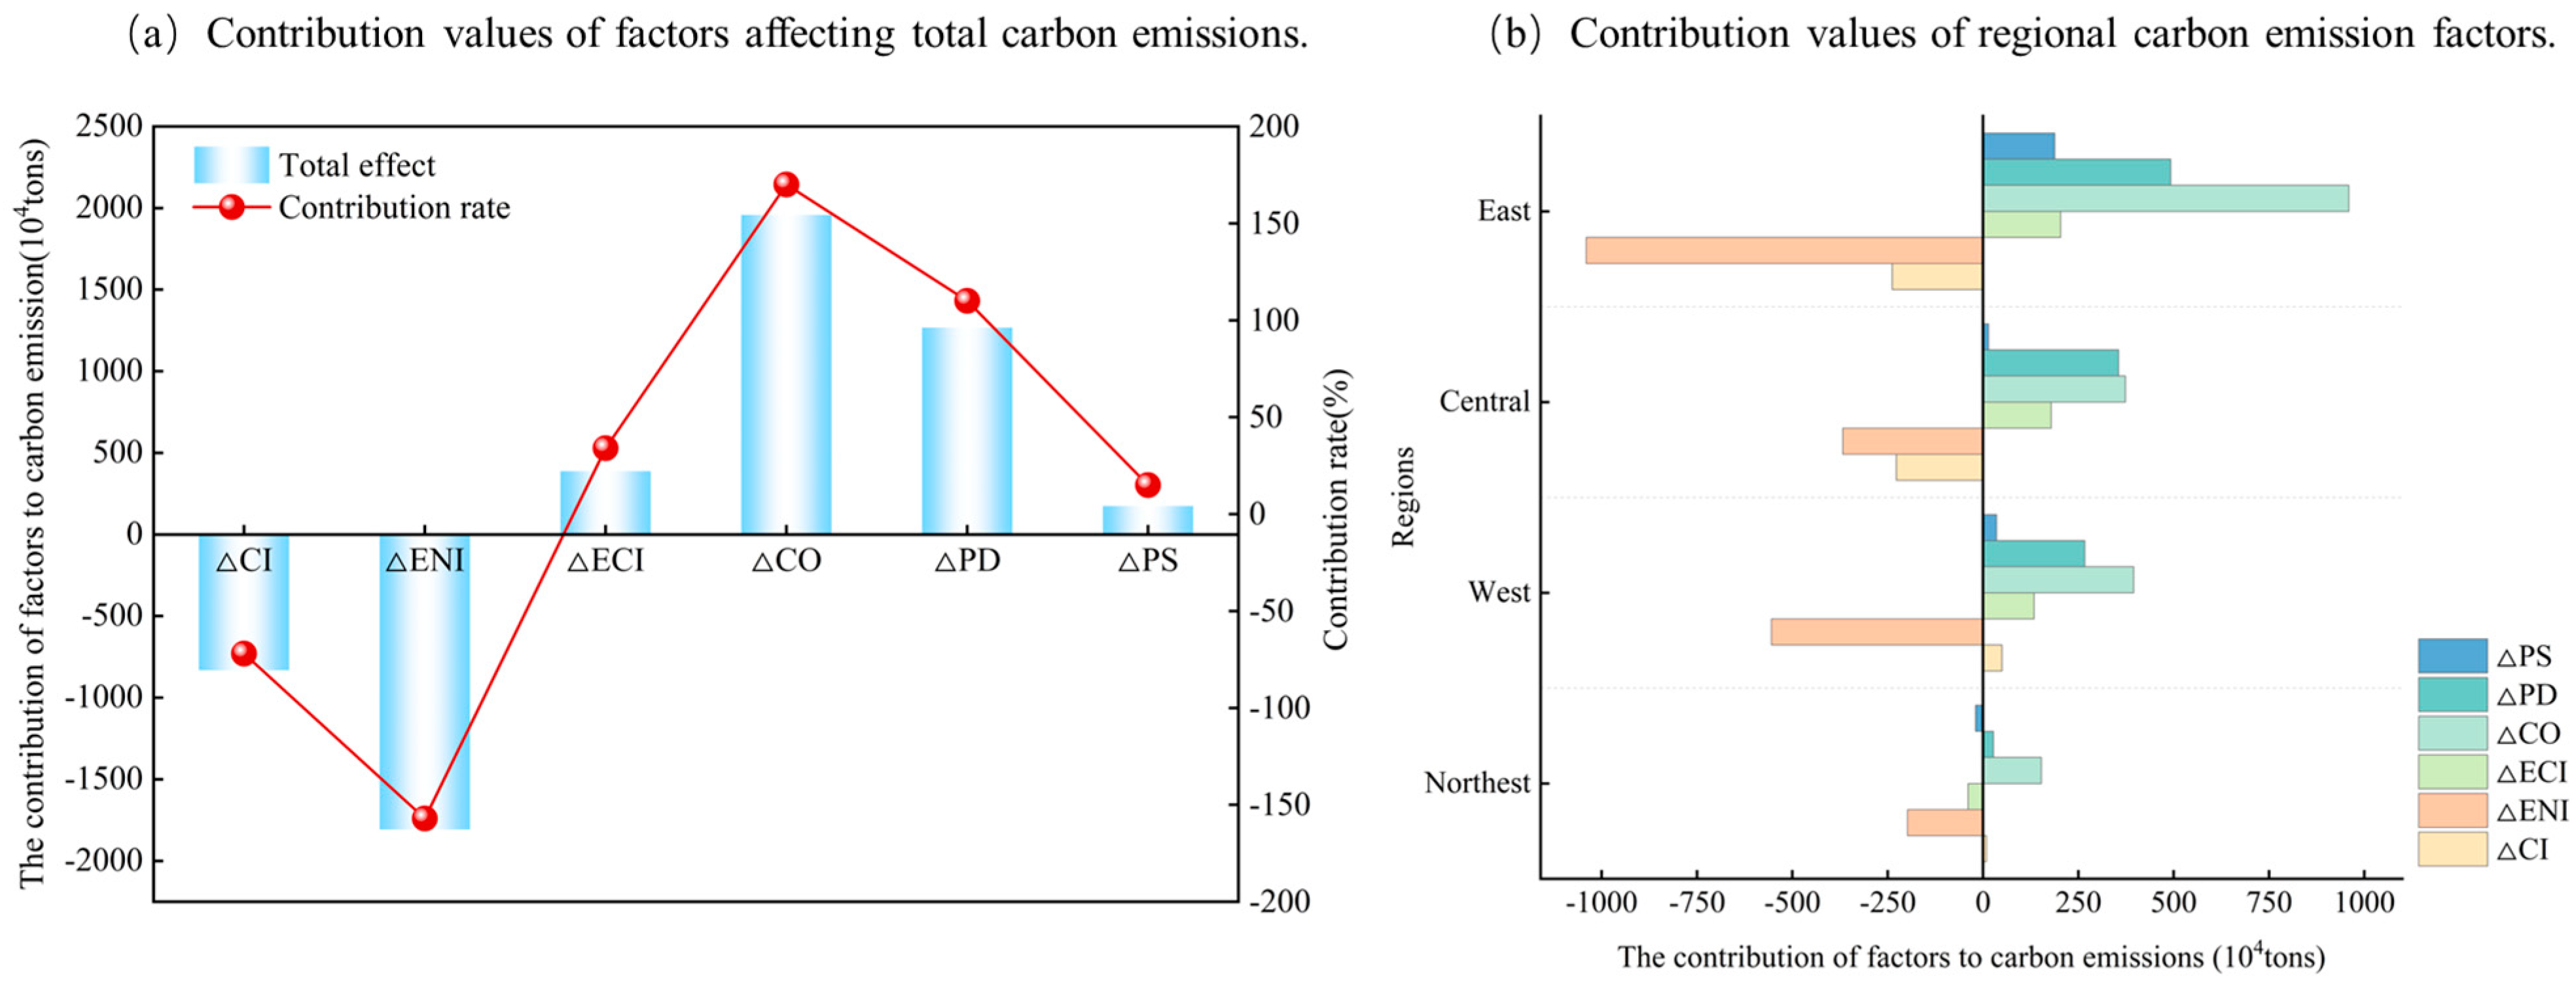
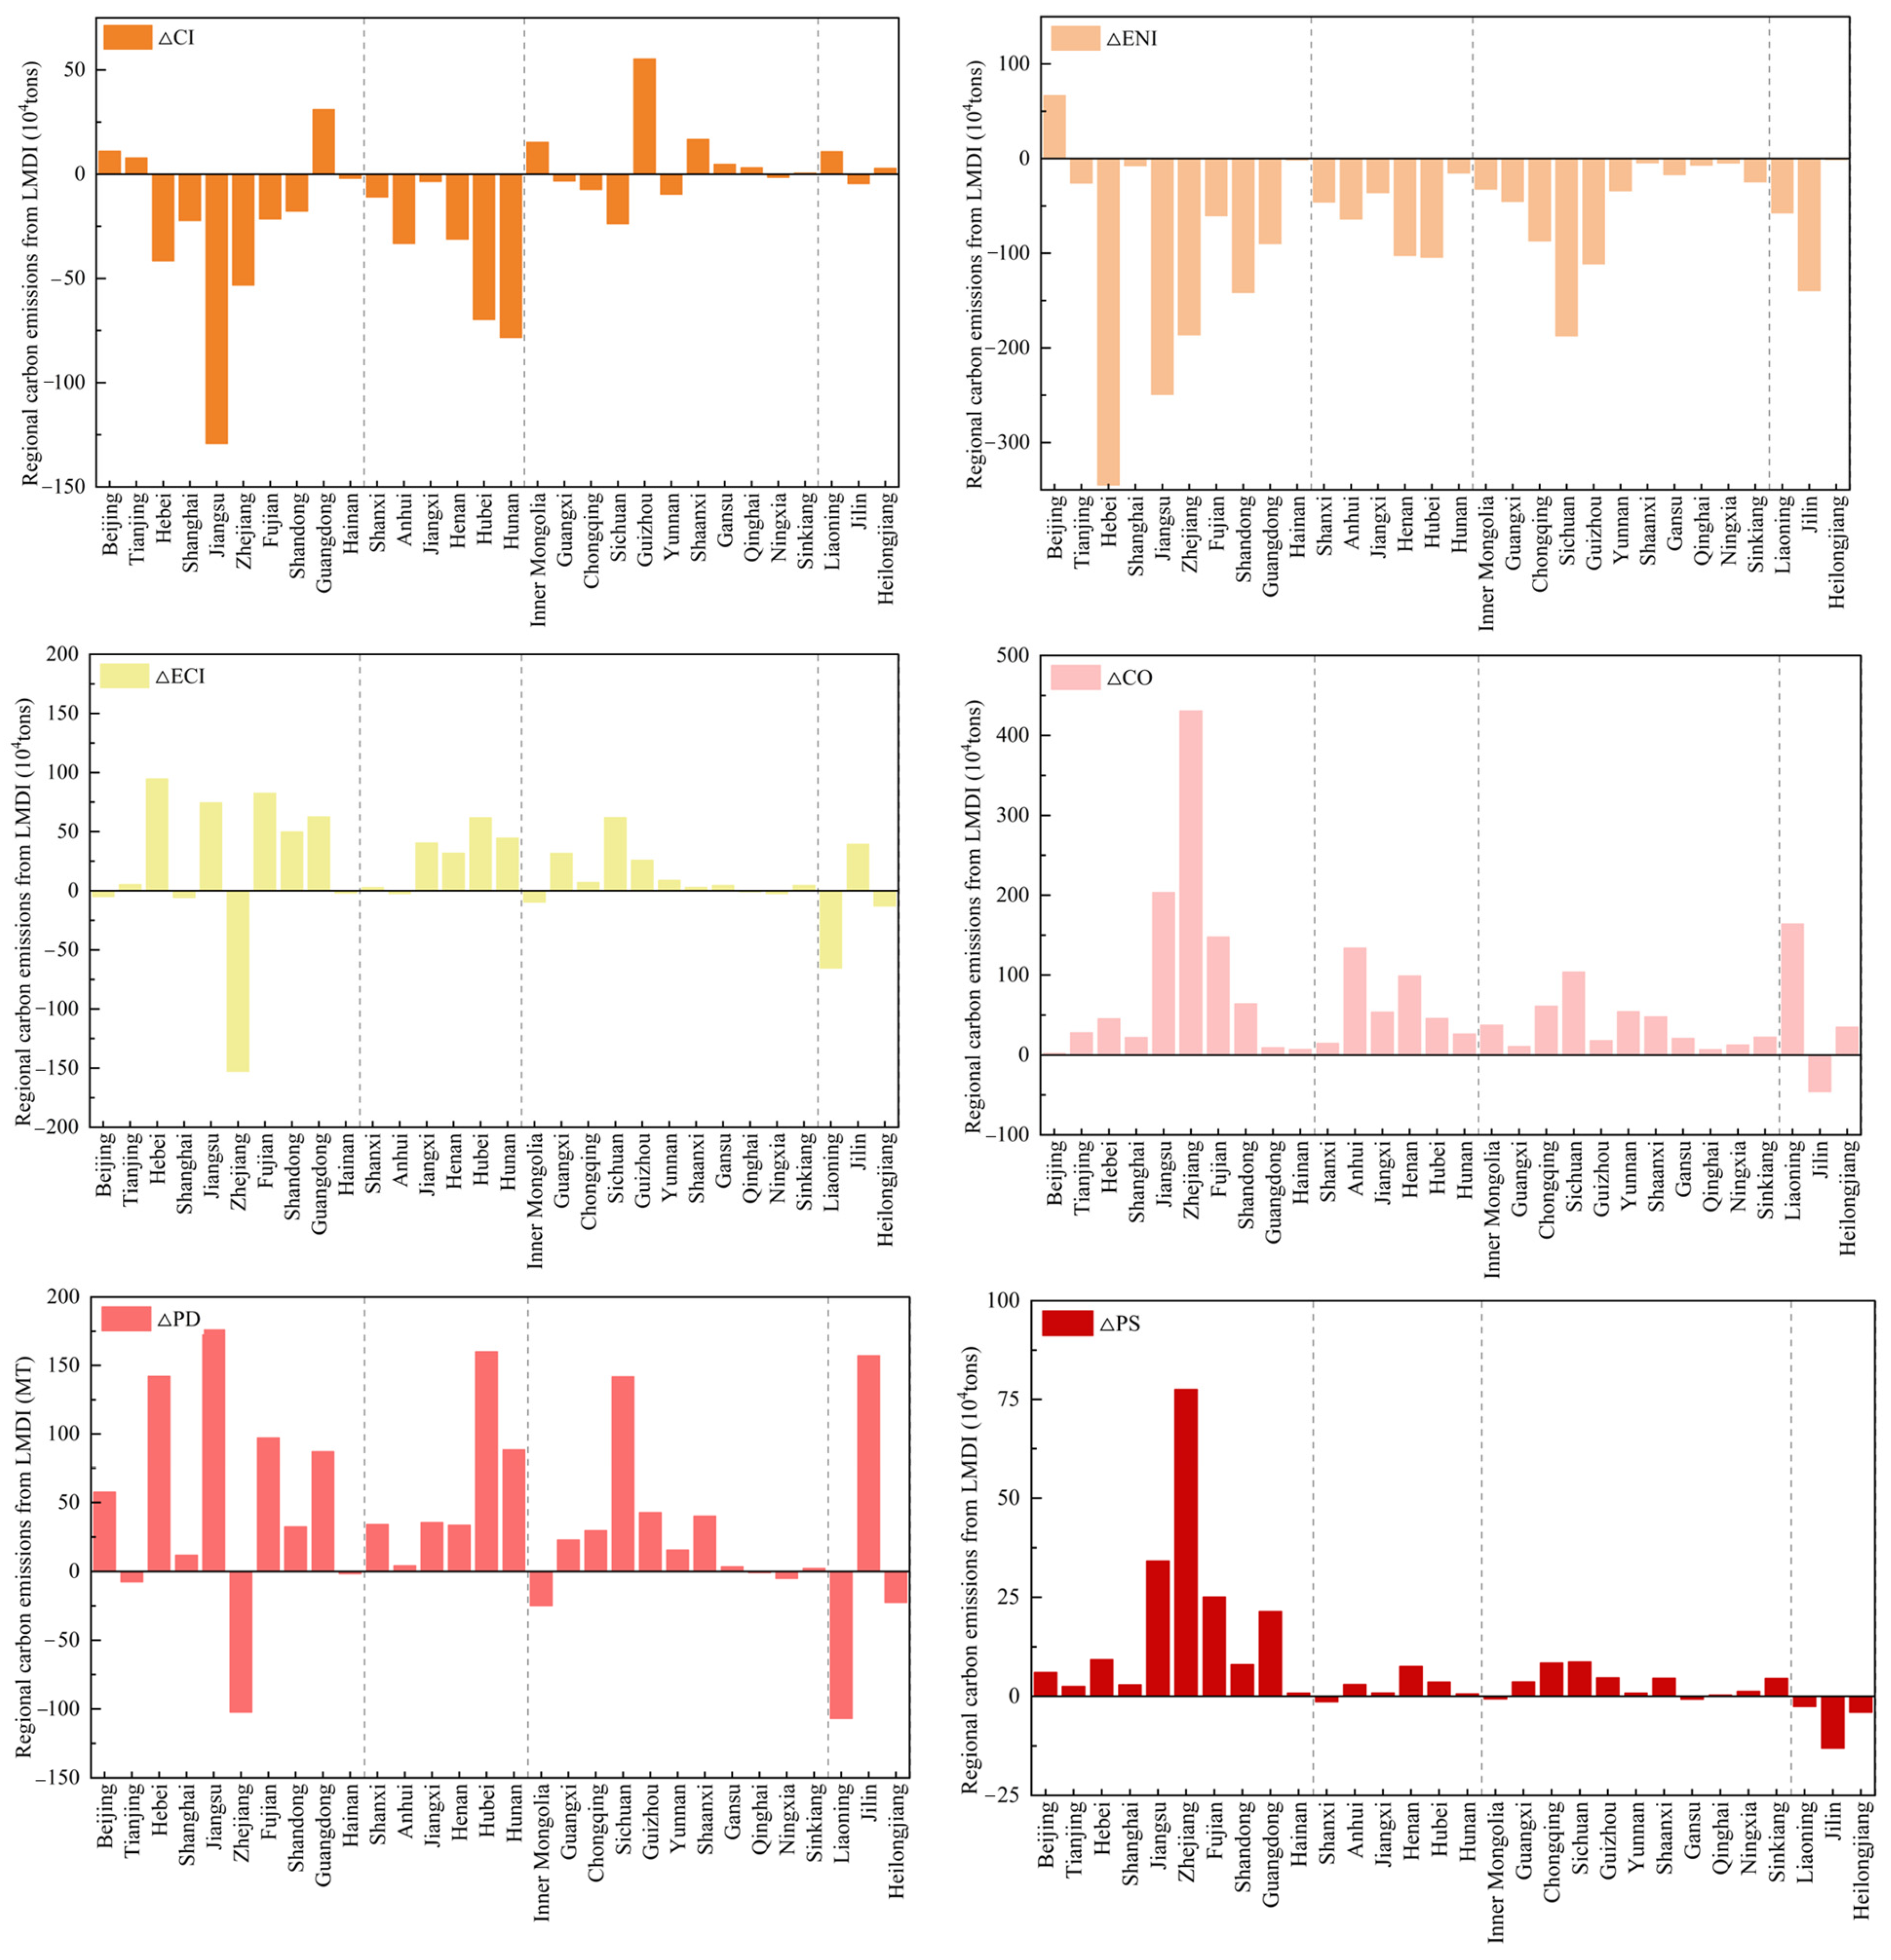
  • Carbon-emission intensity: During the study period, this factor had a negative impact on carbon emissions in China’s construction industry, contributing 832.069 million tons, with a contribution rate of 72.34% (Figure 9a). It had both positive and negative effects on the four regions, but overall had a negative impact. It primarily suppressed carbon emissions in the eastern and central regions (Figure 9b), particularly in Jiangsu, Hunan, and Hubei provinces (Figure 10), with contribution amounts of 129.201 million tons, 78.319 million tons, and 69.673 million tons, respectively. Due to the relatively low levels of carbon emissions and energy consumption in the construction industry in the western and northeastern regions, the impact of this factor on carbon emissions in these regions was minimal.
2.
Energy intensity: During the study period, this influencing factor had a negative impact on carbon emissions in China’s construction industry, cumulatively suppressing carbon emissions by 1806.947 million tons, with a contribution rate of 157.09%. Among the four regions, the negative impact on carbon emissions was most significant in the eastern region, primarily concentrated in Hebei Province, Jiangsu Province, and Zhejiang Province, with emission reductions of 344.858 million tons, 249.262 million tons, and 186.317 million tons, respectively. This highlights the critical role of improving energy efficiency in controlling and reducing CECI [37], making it a key factor in carbon emission reduction. Therefore, by scientifically adjusting and managing energy utilization efficiency, the contribution rate to carbon emission reduction in the construction industry can be maximized.
3.
Economic intensity: During the study period, it had a positive impact on carbon emissions in China’s construction industry, cumulatively promoting carbon emissions of 387.624 million tons, with a contribution rate of 33.70%. Notably, the eastern and central regions demonstrated significant positive impacts, such as Hebei Province, Fujian Province, and Jiangsu Province, with contribution values of 94.650 million tons, 82.510 million tons, and 74.344 million tons, respectively. It was worth noting that this factor had a negative impact on carbon emissions in Zhejiang Province’s construction industry, contributing 152.753 million tons. This indicates that a higher level of economic development has strengthened policy enforcement, enabling low-carbon policies such as carbon emissions trading and green building standards to be more effectively implemented in the construction industry [38]. Therefore, reasonably adjusting the internal economic structure of the industry is particularly important.
4.
Construction industry output intensity: This influencing factor had a significant positive impact on carbon emissions in China’s construction industry and is also a relatively critical influencing factor. Its contribution to carbon emissions is 1958.819 million tons, with a contribution rate of 170.30%. Its contribution to carbon emissions in the eastern region is particularly notable, exhibiting a positive impact, such as in Zhejiang Province and Jiangsu Province, with contribution values of 430.728 million tons and 203.332 million tons, respectively (Figure 9). As the construction industry in the eastern region continues to expand, its energy consumption levels are bound to rise, leading to an increase in carbon emissions. In contrast, the western and northeastern regions, due to limited investment in the construction industry, have a relatively low promotional effect on carbon emissions. The eastern region is transitioning from scale-driven to technology-driven development, and the central and western regions are still in the stage of scale accumulation. This regional disparity underscores the need for differentiated emission reduction pathways in the future.
5.
Per capita housing completion: This factor had a positive impact on carbon emissions in China’s construction industry, with a contribution value of 1267.513 million tons and a contribution rate of 110.2%. Among the four regions, this influencing factor exhibits a gradually decreasing positive impact from east to west, primarily concentrated in Jiangsu Province, Hubei Province, and Sichuan Province, with contribution values of 176.006 million tons, 160.041 million tons, and 141.698 million tons, respectively. The expansion of completed floor area drives carbon emissions across the entire supply chain, including building material production, logistics, transportation, and construction. Example with Jiangsu Province, the “scale effect” generated by the agglomeration of the construction industry and the intensive production mode formed by the concentration of a large number of construction enterprises have increased the spatial concentration of demand for building materials, resulting in a high degree of concentration of carbon emissions in each link of the supply chain, which has further increased the value of the per capita area of housing completed in the region in terms of its contribution to carbon emissions. Therefore, it is important to build a differentiated building area control mechanism to coordinate the synergistic development of regional industrial structure adjustment, energy consumption optimization, and low-carbon technology innovation.
6.
Population scale: This factor had a positive impact on carbon emissions in China’s construction industry. However, the effect of promoting carbon emissions was low, with a contribution of 175.305 million tons and a rate of 15.24%. Owing to the higher level of economic development in the eastern region, the population is also denser, and the changes and migration of the population resulted in the development of the industry [39], causing changes in carbon emissions. The construction industry must attract high-quality talent to achieve the transformation of resource input to industrial efficiency output.
In summary, the construction industry output intensity was the most significant driver of increased carbon emissions, while energy intensity had the strongest suppressive effect. These two factors emerged as core drivers of changes in carbon emissions in the industry. Moreover, the impact patterns across China’s four regions were largely consistent with the overall trend in China, with the eastern region exhibiting the most pronounced effects across all factors.

4. Discussion

This study systematically reveals the spatial and temporal distribution of carbon emissions from China’s construction industry and its influencing factors from 2010 to 2021, making breakthroughs in theoretical methodology and practical application. On the basis of exploring the spatial distribution of carbon emissions from China’s construction industry, this study utilizes the kernel density estimation method to reveal the dynamic evolution of regional carbon emission intensity, and further combines the characteristics of the industry to construct a decomposition model of carbon emission influencing factors. This study finds that the carbon emissions of China’s construction industry show an “inverted U-shape” trend in time, and a significant feature of “high in the east and low in the west” in space; at the same time, the key influencing factors of the construction industry’s output intensity and energy intensity are identified. In addition, from the perspective of regional influencing factors, the eastern region has the most prominent performance among the influencing factors. The results of this study provide a scientific basis for the development of differentiated carbon emission reduction strategies for the construction industry.
In the context of China’s pursuit of carbon peaking and carbon neutrality, it is crucial to establish a scientifically sound and reliable carbon emissions calculation model and verify its accuracy. The results of this study align with those from other regions in China [40,41], indicating the reliability of the current calculations. Additionally, indirect carbon emissions account for a significantly higher proportion of the construction industry’s total carbon emissions than direct emissions, with the proportion remaining above 90% throughout the study period. These indirect emissions primarily originate from cement and steel production, playing a major role in the industry’s carbon emissions. This aligns with the view held by Western countries that the construction industry has grown at the expense of high energy consumption [42]. Regions with more developed construction and economies generate higher carbon emissions, while less developed regions generate lower emissions [43].
This study confirms a persistent “east-high, west-low” spatial distribution pattern, consistent with the findings of Ni et al. [40,44]. However, unlike earlier studies, this work extends the analysis by exploring the dynamic evolution of regional emission intensity using kernel density estimation. The eastern region exhibits a “multipolar” distribution pattern, suggesting that emission reduction measures, including industrial upgrading and stricter environmental regulations, are gradually yielding results. In contrast, the central region shows a significant leftward shift in its main peak, although a policy discontinuity in 2012 suggests lapses in policy implementation. This finding validates the spatial differentiation conclusions of previous studies [45] and reveals the temporal differences in the evolution of regional carbon emission intensity through dynamic intensity analysis.
This study identifies energy intensity and carbon emission intensity as key factors influencing carbon emissions in the construction sector, consistent with previous research findings [40,43]. Furthermore, Ruihua et al.’s empirical study, which utilized the LMDI model in Shandong Province, further confirms that energy intensity is a crucial factor in mitigating carbon emissions in the construction sector [46]. Building on this, this study also revealed that the per capita housing completion had a positive impact on carbon emissions in the construction sector. Regarding economic drivers, floor area expansion leads to increased carbon emissions across the entire supply chain, including building material production, logistics, transportation, and construction [47]. Therefore, a differentiated building area control mechanism is recommended, incorporating measures such as promoting green building standards, mandating the use of low-carbon building materials, and applying prefabricated building technologies. These strategies provide a scientific basis for China’s low-carbon transformation in the construction sector and offer insights for optimizing renovation policies in developed countries, contributing to global efforts to achieve net-zero emissions in the construction industry.
Research advantages include the following: Using panel data from 30 Chinese provinces from 2010 to 2021, this study captures the spatiotemporal distribution characteristics of carbon emissions in China’s construction industry and the dynamic evolution of regional carbon emission intensity. By incorporating the industry-specific characteristics of the construction sector, this study introduces the factor of per capita completed floor area and constructs a decomposition model for the influencing factors of CECI, quantifying the contribution levels of different influencing factors. This study can be adjusted and optimized based on the specific circumstances of different countries to ensure that the research methods can precisely align with the actual needs of low-carbon development in the construction industry at the regional level.
Research limitations include the following: Energy indicators in the carbon emission coefficient method may affect the accuracy of calculations, and a standardized calculation system needs to be established in the future. Due to limitations in obtaining regional data, factors such as technological progress and policy effects could not be included in the selection of influencing factors. Future research should focus on constructing a multi-dimensional driving factor-based emission reduction scenario analysis framework, setting different scenarios, and systematically simulating the evolution of CECI under different development paths to more systematically reveal the driving mechanisms of CECI.

5. Conclusions

5.1. Findings

From 2010 to 2021, carbon emissions from China’s construction industry followed an inverted U-shaped trend, increasing by 1150.245 million tons. Rapid growth occurred from 2010 to 2012, then emissions fluctuated downward through 2021, with indirect emissions—mainly from cement and steel—dominating. Regionally, the trends were broadly consistent, with the eastern region accounting for over 40% of total emissions. Spatially, emissions were higher in the east and south, lower in the west and north, reflecting path dependency in industrial transfer. The east formed multipolar reduction clusters through industrial upgrading, while the west continued to face challenges from uneven provincial development. National carbon intensity declined overall; however, substantial regional disparities persisted, underscoring the need for differentiated management approaches. Key factors that increased emissions included economic intensity, construction output intensity, per capita housing completion, and population scale, with construction output intensity having the largest impact; conversely, carbon emission intensity, particularly energy intensity, reduced emissions. Emissions in the eastern region were largely driven by output expansion and floor area completion, underscoring the need to balance scale growth with technological innovation to enhance energy efficiency and achieve coordinated development and emission reductions.

5.2. Policy Recommendations

Based on the above conclusions, this paper puts forward the following suggestions: First, implement regional differentiated control for the spatial distribution characteristics of carbon emissions in the construction industry. Given that Jiangsu shows the highest contribution from output intensity, the eastern region should adopt a ‘red, yellow and green’ carbon warning mechanism, call off high-carbon projects, and rely on Shanghai and Shenzhen for the construction of zero-carbon technology centers. The central region of the industry should take over the region to give priority to the promotion of standardized assembly building technology and mandate the elimination of high-energy consumption of construction equipment. The western and northeastern regions of the wind and light-rich areas should set up technology conversion subsidies to promote zero-carbon technology. For fast-expanding regions such as Sichuan, carbon accounts will be established, and adjustment fees will be levied to realize synergistic regional emission reductions. Second, promote technological innovation along the entire chain, focusing on the dominance of indirect carbon emissions, with cement and steel as the main sources of emissions, and the negative impact of energy intensity on carbon emissions. A special fund has been set up to research low-carbon cement and recycled steel technologies, and value-added tax is refundable for projects that adopt new building materials; a technology pilot base has been constructed in Jiangsu, Zhejiang and other large provinces in the construction industry to accelerate the industrialization of ultra-low-energy-consumption building technologies and reduce carbon emissions along the whole industrial chain. Lastly, in response to the positive impact on carbon emissions of the construction industry’s output intensity and the area of completed construction per capita, a “double-control, double-improvement” strategy has been implemented. A linkage mechanism between building scale and carbon emissions has been established across the country, with land use targets cut for areas exceeding the standards, and assessment and assembly rate supervision implemented in Jiangsu and other high-output areas; green building standards have been incorporated into urban planning, and financial subsidies and plot ratio incentives have been given to projects that meet the three-star green building standard, so as to promote the transformation of the construction industry from scale expansion to quality and energy-efficiency enhancement. This framework supports targeted, precise policies addressing output and energy intensity, promoting synergistic innovation and governance.

Author Contributions

Conceptualization, M.L.; methodology, Y.Z. and J.S.; software, Y.Z. and J.L.; validation, L.L.; investigation, J.L. and X.X.; resources, L.L.; data curation, M.L.; writing—original draft preparation, Y.Z.; writing—review and editing, X.X. and Y.W.; supervision, Y.W. All authors have read and agreed to the published version of the manuscript.

Funding

This research was supported by the Open Fund of Sichuan Province Cyclic Economy Research Center (No. XHJJ-2310), Science and Technology Research and Development Program Project of China railway group limited (No. CRA 2022-Major-01, 2023-Major-06, 2025-Major-05).

Data Availability Statement

The related data on the consumption of the eight types of energy sources considered in this study were obtained from the China Energy Statistical Yearbook, whereas the socioeconomic and consumption of construction materials data were obtained from the China Statistical Yearbook and China Construction Industry Statistical Yearbook, respectively. Moreover, the IPCC Inventory Guide (2006) can be referred to for the carbon-emission coefficients for each energy type. All data are available in the China National Knowledge Infrastructure Platform (https://www.cnki.net/, (accessed on 15 October 2024)).

Conflicts of Interest

Authors Yue Zhang, Min Li, Jiazhen Sun, Jie Liu, Yinsheng Wang, Li Li were employed by the company China Railway Academy Group Co., Ltd. The remaining authors declare that the research was conducted in the absence of any commercial or financial relationships that could be construed as a potential conflict of interest.

Abbreviations

The following abbreviations are used in this manuscript:
IPCCIntergovernmental Panel on Climate Change
LMDILogarithmic mean Divisia index
CECICarbon emissions in the construction industry

References

  1. Fathi, M. Sustainability and energy efficiency in buildings: A review. J. Leg. Aff. Disput. Resolut. Eng. Constr. 2024, 16, 03123002. [Google Scholar] [CrossRef]
  2. Lu, Y.; Chen, X. Digital economy, new-type urbanization, and carbon emissions: Evidence from China. Environ. Prog. Sustain. Energy 2023, 42, e14045. [Google Scholar] [CrossRef]
  3. Peter, C.; Fiore, A.; Hagemann, U.; Nendel, C.; Xiloyannis, C. Improving the accounting of field emissions in the carbon footprint of agricultural products: A comparison of default IPCC methods with readily available medium-effort modeling approaches. Int. J. Life Cycle Assess. 2016, 21, 791–805. [Google Scholar] [CrossRef]
  4. Zhang, X.; Wang, F. Life-cycle carbon emission assessment and permit allocation methods: A multi-region case study of China’s construction sector. Ecol. Indic. 2017, 72, 910–920. [Google Scholar] [CrossRef]
  5. Jiang, M.; Hao, X. Adjusting the intermediate input sources for global carbon emission reduction: An input–output optimization model. Sci. Total Environ. 2022, 835, 155582. [Google Scholar] [CrossRef]
  6. Zhao, K.; Cui, X.; Zhou, Z.; Huang, P. Impact of uncertainty on regional carbon peak paths: An analysis based on carbon emissions accounting, modeling, and driving factors. Environ. Sci. Pollut. Res. 2022, 29, 17544–17560. [Google Scholar] [CrossRef]
  7. Cheng, F.; Yao, J. The effect of the digital economy on carbon emissions in China’s construction industry: Evidence from spatial econometric analysis. Environ. Sci. Pollut. Res. 2024, 31, 63085–63097. [Google Scholar] [CrossRef]
  8. Chang, D.; Tang, S. Research on Low-Carbon Building Development and Carbon Emission Control Based on Mathematical Models: A Case Study of Jiangsu Province. Energies 2024, 17, 4545. [Google Scholar] [CrossRef]
  9. Chen, Y.; Zhang, C. Characteristics of Spatial-Temporal Evolution of Carbon Emissions from Land Use and Analysis of Influencing Factors in Hubao-Eyu Urban Agglomerations, China. Sustainability 2024, 16, 7565. [Google Scholar] [CrossRef]
  10. Liu, W.; Ren, D.; Ke, C.; Ying, W. Carbon Emission Influencing Factors and Scenario Prediction for Construction Industry in Beijing-Tianjing-Hebei. Adv. Civ. Eng. 2023, 2023, 2286573. [Google Scholar]
  11. Liu, Y.; Gan, L.; Cai, W.; Li, R. Decomposition and decoupling analysis of carbon emissions in China’s construction industry using the generalized Divisia index method. Environ. Impact Assess. Rev. 2024, 104, 107321. [Google Scholar] [CrossRef]
  12. Wu, Y.; Pu, W.; Dong, J.; Dai, W.; Wang, Y. Analysis of land use gravity center change and carbon emission impact in chengdu plain of China from 2006 to 2022. Land 2024, 13, 873. [Google Scholar] [CrossRef]
  13. Huang, L.; Krigsvoll, G.; Johansen, F.; Liu, Y.; Zhang, X. Carbon emission of global construction sector. Renew. Sustain. Energy Rev. 2018, 81, 1906–1916. [Google Scholar] [CrossRef]
  14. Zhou, Y.; Hu, D.; Wang, T.; Tian, H.; Gan, L. Decoupling effect and spatial-temporal characteristics of carbon emissions from construction industry in China. J. Clean. Prod. 2023, 419, 138243. [Google Scholar] [CrossRef]
  15. Xiao, Y.; Huang, H.; Qian, X.M.; Zhang, L.Y. Can new-type urbanization reduce urban building carbon emissions? New evidence from China. Sustain. Cities Soc. 2023, 90, 104410. [Google Scholar] [CrossRef]
  16. Zhou, Y.; Miao, H.; Li, C.; Ding, L. Spatio-temporal patterns and impact mechanisms of CO2 emissions from China’s construction industry under urbanization. Sustain. Cities Soc. 2024, 106, 105353. [Google Scholar] [CrossRef]
  17. Li, C.; Zhang, L.; Gu, Q.; Guo, J.; Huang, Y. Spatio-temporal differentiation characteristics and urbanization factors of urban household carbon emissions in China. Int. J. Environ. Res. Public Health 2022, 19, 4451. [Google Scholar] [CrossRef]
  18. Min, J.; Yan, G.; Abed, A.M.; Elattar, S.; Khadimallah, M.A.; Jan, A.; Ali, H.E. The effect of carbon dioxide emissions on the building energy efficiency. Fuel 2022, 326, 124842. [Google Scholar] [CrossRef]
  19. Yin, X.; Lin, K. Spatial-temporal characteristics and driving factors of carbon emissions from the construction industry in the Belt and Road region of China. Front. Environ. Sci. 2024, 12, 1398328. [Google Scholar] [CrossRef]
  20. Li, H.; Calder, C.A.; Cressie, N. Beyond Moran’s I: Testing for spatial dependence based on the spatial autoregressive model. Geogr. Anal. 2007, 39, 357–375. [Google Scholar] [CrossRef]
  21. Wu, H.; Zheng, X.; Zhou, L.; Meng, Y. Spatial autocorrelation and driving factors of carbon emission density of crop production in China. Environ. Sci. Pollut. Res. 2024, 31, 27172–27191. [Google Scholar] [CrossRef]
  22. Xu, Z.; Chen, H.; Song, W. Spatial-Temporal Pattern of Urban Land Green Use Efficiency and Its Influencing Factors in Guizhou Province, China, Based on County Units. Land 2024, 13, 2140. [Google Scholar] [CrossRef]
  23. Raczyński, L.; Wiślicki, W.; Krzemień, W.; Kowalski, P.; Alfs, D.; Bednarski, T.; Białas, P.; Curceanu, C.; Czerwiński, E.; Dulski, K.; et al. Calculation of the time resolution of the J-PET tomograph using kernel density estimation. Phys. Med. Biol. 2017, 62, 5076. [Google Scholar] [CrossRef]
  24. Zhang, H.; Zhang, Y.; Meng, H.; Lim, J.B.; Yang, W. A novel global modelling strategy integrated dynamic kernel canonical variate analysis for the air handling unit fault detection via considering the two-directional dynamics. J. Build. Eng. 2024, 96, 110402. [Google Scholar] [CrossRef]
  25. Wang, D.; Pan, W.Q.; Liu, Q.; Gao, X.D. Factors decomposition of CO2 emission in China’s industries: Based on LMDI model. Syst Eng Theory Pr. 2012, 32, 1193–1203. [Google Scholar]
  26. Sun, Q.; Chen, H.; Long, R.; Zhang, J.; Yang, M.; Huang, H.; Ma, W.; Wang, Y. Can Chinese cities reach their carbon peaks on time? Scenario analysis based on machine learning and LMDI decomposition. Appl. Energy 2023, 347, 121427. [Google Scholar] [CrossRef]
  27. Zhang, S.; Liu, X. Tracking China’s CO2 emissions using Kaya-LMDI for the period 1991–2022. Gondwana Res. 2024, 133, 60–71. [Google Scholar] [CrossRef]
  28. Song, M.; Wang, Y.; Wang, C.; Musakwa, W.; Ji, Y. Spatial and Temporal Characteristics of Carbon Emissions from Construction Industry in China from 2010 to 2019. Sustainability (2071-1050) 2024, 16, 5927. [Google Scholar] [CrossRef]
  29. Lu, Y.; Cui, P.; Li, D. Carbon emissions and policies in China’s building and construction industry: Evidence from 1994 to 2012. Build. Environ. 2016, 95, 94–103. [Google Scholar] [CrossRef]
  30. Liu, G.; Li, X.; Tan, Y.; Zhang, G. Building green retrofit in China: Policies, barriers and recommendations. Energy Policy 2020, 139, 111356. [Google Scholar] [CrossRef]
  31. Zhao, C.Z.; Liu, Y.; Ren, S.W.; Quan, J. Testing and green assessment technology for ready-mixed concrete. Key Eng. Mater. 2018, 768, 306–313. [Google Scholar] [CrossRef]
  32. Wang, Q.; Appolloni, A.; Liu, J. Does “low-carbon pilot policy” affect the carbon intensity of construction industry? Exploring the implementation mechanism and effectiveness in China. Eng. Constr. Archit. Manag. 2024, 31, 3222–3248. [Google Scholar] [CrossRef]
  33. Wang, W.; Hao, S.; Zhong, H.; Sun, Z. How to promote carbon emission reduction in buildings? Evolutionary analysis of government regulation and financial investment. J. Build. Eng. 2024, 89, 109279. [Google Scholar] [CrossRef]
  34. Li, Q.Y.; Zhang, Y.; Hu, M.Q.; Yu, J. Provincial Practice of Achieving the” Dual Carbon” Target: Taking Zhejiang Province as an Example. J. Ecol. Rural Environ. 2024, 40, 191–204. [Google Scholar]
  35. Liu, Y.B.; Deng, W.F.; Luo, K.; Tang, M.Y. Impact of environmental taxation on financial performance of energy-intensive firms: The role of digital transformation. Emerg. Mark. Financ. Trade 2024, 60, 598–616. [Google Scholar] [CrossRef]
  36. Wang, D.; Chen, C.; Findlay, C.; Huang, J.; Lin, J.Y.; Abedullah; Alam, M.J.; Hussain, A.; Nuryartono, N.; Sudaryanto, T.; et al. Stage Segmentation of Rural Transformation and Comparisons Among Bangladesh, China, Indonesia, and Pakistan: Combining Machine Learning and New Structural Economics to Facilitate International Agricultural Development and Policy Design. Asia Pac. Policy Stud. 2025, 12, e70016. [Google Scholar] [CrossRef]
  37. Zhang, L.; Chen, S.; Zhu, Y.; Xu, X.W. The measurement of carbon emission effect of construction land changes in Anhui Province based on the extended LMDI model. J. Resour. Ecol. 2013, 4, 186–192. [Google Scholar]
  38. Xie, A.; Liu, L.; Qin, L. Fuzzy comprehensive evaluation of happiness index of nine cities in pearl river delta based on AHP. J. Math. 2021, 2021, 7732095. [Google Scholar] [CrossRef]
  39. Qiao, X.N.; Peng, L.Z. Carbon Peaking, Carbon Neutrality and Green and Low-Carbon Development of China’s Economy. Economics 2022, 17, 290–324. [Google Scholar]
  40. Ni, G.; Fang, Y.; Niu, M.; Lv, L.; Song, C.; Wang, W. Spatial differences, dynamic evolution and influencing factors of China’s construction industry carbon emission efficiency. J. Clean. Prod. 2024, 448, 141593. [Google Scholar] [CrossRef]
  41. Zhang, P.; Hu, J.; Zhao, K.; Chen, H.; Zhao, S.; Li, W. Dynamics and decoupling analysis of carbon emissions from construction industry in China. Buildings 2022, 12, 257. [Google Scholar] [CrossRef]
  42. Seyedabadi, M.R.; Karrabi, M.; Shariati, M.; Karimi, S.; Maghrebi, M.; Eicker, U. Global building life cycle assessment: Comparative study of steel and concrete frames across European Union, USA, Canada, and Australia building codes. Energy Build. 2024, 304, 113875. [Google Scholar] [CrossRef]
  43. Jiang, T.; Li, S.; Yu, Y.; Peng, Y. Energy-related carbon emissions and structural emissions reduction of China’s construction industry: The perspective of input–output analysis. Environ. Sci. Pollut. Res. 2022, 29, 39515–39527. [Google Scholar] [CrossRef] [PubMed]
  44. Sun, K.; Han, J.; Sun, W.; Yan, T.; Liu, C.; Yang, Z.; He, W.; Xie, W.S. The efficiency evaluation and the spatiotemporal differences of CO2 emissions in China’s construction industry. J. Clean. Prod. 2023, 426, 139205. [Google Scholar] [CrossRef]
  45. Li, Z.; Wang, F.; Kang, T.; Wang, C.; Chen, X.; Miao, Z.; Zhang, L.; Ye, Y.; Zhang, H. Exploring differentiated impacts of socioeconomic factors and urban forms on city-level CO2 emissions in China: Spatial heterogeneity and varying importance levels. Sustain. Cities Soc. 2022, 84, 104028. [Google Scholar] [CrossRef]
  46. Sun, R.; Yand, M. A Study on the Influencing Factors of Carbon Emissions in Provincial Construction Industry Based on LMDI Model–Taking Shandong Province as an Example. In Proceedings of the Tenth International Forum of Decision Sciences, Harbin, China, 2–3 July 2022; Springer: Singapore, 2022; pp. 249–263. [Google Scholar]
  47. Liang, H.; Bian, X.; Dong, L. Towards net zero carbon buildings: Accounting the building embodied carbon and life cycle-based policy design for Greater Bay Area, China. Geosci. Front. 2024, 15, 101760. [Google Scholar] [CrossRef]
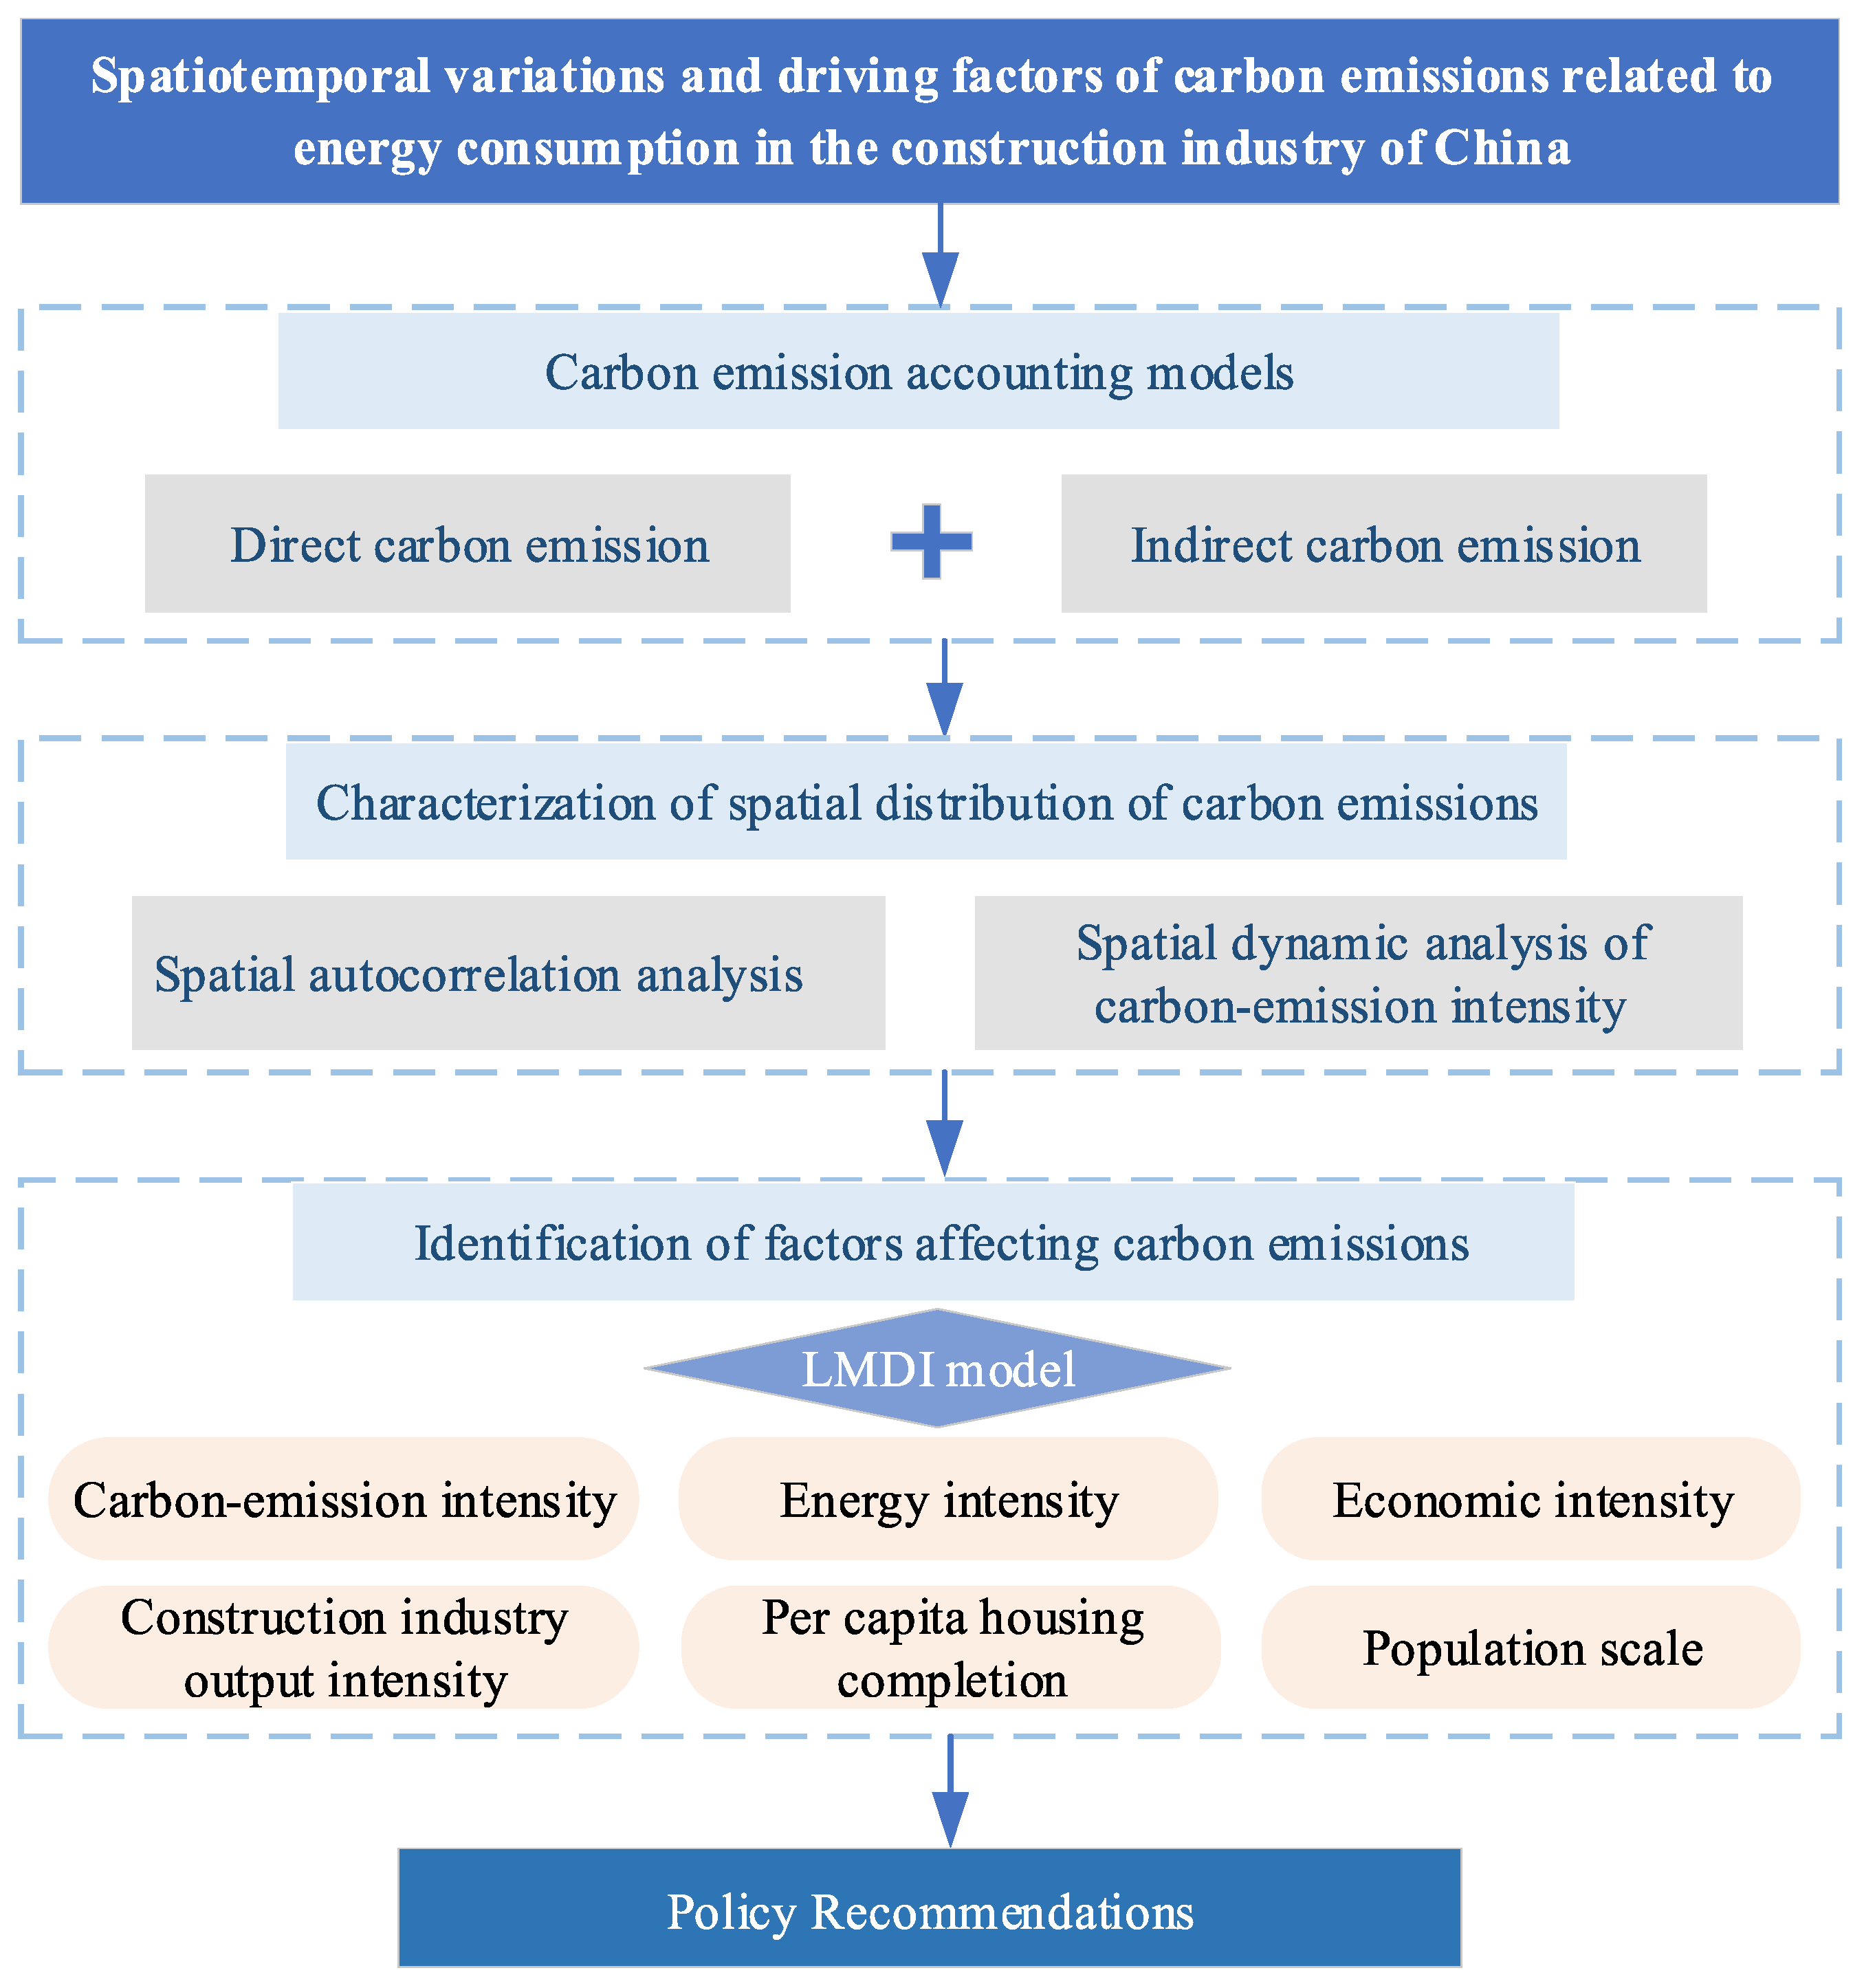
Figure 1. The method framework for this study.
Energies 18 03700 g001
Figure 2. Trends in carbon emissions in construction industry of China.
Energies 18 03700 g002
Figure 3. Share of indirect carbon emissions in construction industry of China.
Energies 18 03700 g003
Figure 4. Trends in carbon emissions in construction industry for four regions.
Energies 18 03700 g004
Figure 5. Spatial distributions of carbon emissions in construction industry in 2010, 2015, and 2021.
Energies 18 03700 g005
Figure 6. Moran’s index of carbon emissions from the construction industry from 2010 to 2021.
Energies 18 03700 g006
Figure 7. Spatial autocorrelations of carbon emissions in construction industry in 2010, 2015, and 2021.
Energies 18 03700 g007
Figure 8. Kernel density of carbon intensity in construction industry of China.
Energies 18 03700 g008
Figure 9. Contributions of influencing factors of carbon emissions in construction industry of China.
Energies 18 03700 g009
Figure 10. Contributions of influencing factors of carbon emissions in construction industry at the provincial level.
Energies 18 03700 g010
Table 1. Classification of provinces and cities of China into four regions for this study.
EasternCentralWesternNortheastern
BeijingShanxiInner MongoliaLiaoning
TianjingAnhuiGuangxiJilin
HebeiJiangxiChongqingHeilongjiang
ShanghaiHenanSichuan
JiangsuHubeiGuizhou
ZhejiangHunanYunnan
Fujian Shaanxi
Shandong Gansu
Guangdong Qinghai
Hainan Ningxia
Xinjiang
Table 2. Converted standard coal and carbon-emission factors for each direct carbon-emitting energy type.
Energy SourceConversion Factor for Standard Coal (kgce/kg)Carbon-Emission Factor (kgCO2/kgce)
Raw coal0.71430.7559
Petrol1.47140.5538
Paraffin1.47140.5714
Diesel oil1.45710.5921
Fuel oil1.42860.6185
Liquefied petroleum gas1.71430.5042
Natural gas1.33000.4483
Electricity0.12290.2900
Table 3. Indirect carbon emissions and recovery factors for various building materials [18,19].
Building MaterialCementGlassSteelAluminumWood
Carbon emissions factor0.815 kg/kg0.9655 kg/kg1.789 kg/kg2.6 kg/kg−842.8 kg/m3
Recovery factor0.70.80.850.2
Disclaimer/Publisher’s Note: The statements, opinions and data contained in all publications are solely those of the individual author(s) and contributor(s) and not of MDPI and/or the editor(s). MDPI and/or the editor(s) disclaim responsibility for any injury to people or property resulting from any ideas, methods, instructions or products referred to in the content.