1. Introduction
The coordinated development of the Beijing–Tianjin–Hebei (BTH) region represents a pivotal national strategy aimed at fostering a world-class urban agglomeration through the optimization of resource allocation, enhancement of industrial coordination, and establishment of interconnected infrastructure. While substantial progress has been achieved in transportation integration, ecological governance, and industrial relocation, significant challenges persist. These include uneven regional development and inadequate factor mobility, which underscore the necessity of developing more effective and empirically grounded governance mechanisms.
To address these challenges, a growing body of research has employed social network analysis (SNA) as a methodological framework. SNA facilitates the quantification of structural flows and nodal interconnections among factors such as population, capital, and technology. This approach enables the identification of coordination bottlenecks, strategic hubs, and hidden linkages, thereby providing empirical support for regional policy formulation. Specifically, SNA has proven useful in exploring cross-regional corporate investment, talent migration, and the influence of core–periphery dynamics in urban networks. These applications contribute to refining policies related to the relocation of non-capital functions and enhancing multi-level regional collaboration.
In the context of regional economic integration, SNA has become a widely adopted tool to analyze inter-regional economic relationships, spatial resource flows, and urban network structures. The gravity model, as a foundational component of SNA, estimates the intensity of inter-regional interactions based on economic mass and spatial distance. Drawing upon graph theory and network science, SNA models urban systems as networks of nodes and edges, enabling the evaluation of social structures and relational patterns. Key techniques such as centrality analysis and block modeling are commonly used: the former measures nodal influence via degree, closeness, and betweenness centrality [
1,
2]; the latter identifies structural equivalence and partitions nodes into cohesive subgroups to reveal overarching patterns in the network [
3].
However, traditional gravity models primarily rely on static socioeconomic indicators such as population and Gross Domestic Product (GDP). These variables are often affected by statistical delays, data inconsistencies, and price fluctuations, especially in large cities with complex demographic compositions. As a result, such models may fail to fully capture the dynamic and hidden economic linkages between regions. Moreover, the reliance on these traditional indicators constrains the ability of SNA to reflect actual production activity and economic intensity. While SNA continues to demonstrate advantages in examining technological development [
4,
5,
6] and network relationships [
7,
8], its accuracy in representing spatial structures remains limited when key real-time indicators are absent.
To overcome these limitations, recent studies have attempted to enhance SNA models by incorporating alternative indicators. For example, Ref. [
9] examined entrepreneurial networks in Pakistan using a deductive methodology, while Ref. [
10] constructed a spatial network of economic vulnerability and green innovation across Chinese provinces. Other research has explored trends in strategic emerging industries (SEI-GIE) by integrating SNA with input–output indicators and gravity modeling [
11] or investigated the evolution of China’s green shipping policies using centrality and k-core metrics [
12]. Additional studies have analyzed global carbon mobility [
13], the spatial diffusion of new energy vehicle patents [
14], and intercity energy linkages [
2,
3], contributing to the diversification of SNA applications.
Of particular relevance to this study is the integration of electricity consumption data into social network analysis. Electricity usage reflects real-time industrial activity and production intensity, offering a more accurate and dynamic indicator of economic vitality. For instance, Ref. [
14] employed an electricity-augmented gravity model to better capture latent industrial relationships, while Ref. [
15] constructed spatial energy networks but did not assess policy effects. Ref. [
16] examined how ICT capital influences spatial energy networks but lacked pre- and post-policy comparisons. Ref. [
17] showed that integrating socioeconomic and behavioral objectives contributes to reducing energy users’ costs. Consequently, while these studies highlight the methodological value of electricity data, few quantitatively evaluate the structural transformation of regional networks in response to policy interventions. Furthermore, electricity consumption data has recently attracted growing interest as a vital indicator of regional economic activity. Its direct correlation with industrial production, service sector output, and consumer decision-making behavior [
17] makes it a reliable measure of energy usage patterns and regional economic exchanges. Studies across different fields—including socioeconomics [
18,
19], medicine [
20,
21], and environmental science [
22]—have demonstrated the effectiveness of electricity-enhanced network models. For example, Ref. [
23] built an energy city network based on input–output theory. Ref. [
24] combined gravity modeling and SNA to evaluate provincial-level gas networks, and international studies have also shown how electricity network structure reflects regional socio-economic dynamics, including during crises like COVID-19 and geopolitical conflict [
25,
26,
27].
In the BTH region, recent empirical research has confirmed the persistence of core–periphery dynamics, with Beijing and Tianjin maintaining dominant positions. For example, spatial econometric analysis has shown significant imbalances in development and public resource allocation between core and peripheral cities [
28], and economic census data indicates that intra-regional heterogeneity is often obscured due to data aggregation limitations [
29]. Moreover, some studies have criticized the implementation of the BTH coordinated development policy for its limited effectiveness in addressing deep-rooted regional inequalities and administrative fragmentation. For instance, Ref. [
30] notes that the relocation of industries from Beijing to Hebei often lacks supporting infrastructure and long-term planning, leading to low efficiency and policy fatigue. Other scholars point out that inter-provincial coordination remains weak due to inconsistent regulatory standards and fiscal incentives [
31]. These documented limitations highlight a critical gap in the existing literature: although the coordinated development strategy is widely endorsed, few empirical studies have assessed its real impact on transforming the spatial structure of regional economic networks.
To systematically summarize the research gap and clarify the innovation of this study,
Table 1 compares previous studies with the contributions of this paper.
To address these gaps, the present study proposes a methodological enhancement by incorporating electricity consumption into the gravity model framework of SNA. Electricity data serves as a real-time proxy for production activity, enabling the detection of hidden industrial linkages and capturing dynamic regional transformations more effectively than traditional indicators. By comparing traditional and electricity-augmented models, this research evaluates how the spatial structure of the steel industry network in the BTH region evolved in response to policy implementation. The analytical process employs UCINET, a specialized tool for social network analysis, particularly for Lambda set construction and centrality metric computation.
The main contributions of this study are as follows:
Introduces electricity consumption data as a dynamic and objective proxy for economic activity into the gravity model framework of SNA, enhancing the model’s sensitivity to real industrial linkages.
Compares network structures generated by traditional models and electricity-augmented models, revealing hidden dynamics overlooked by conventional approaches.
Provides a network-based empirical assessment of how the BTH coordinated development policy has impacted the spatial structure at the prefecture-city level.
Utilizes UCINET to conduct detailed structural analysis, including centrality metrics and Lambda set decomposition, offering a replicable workflow for regional network analysis.
The remainder of this paper is organized as follows:
Section 2 introduces the research area and data sources;
Section 3 presents the enhanced gravity model and SNA methods used;
Section 4 reports the empirical findings, including centrality and Lambda analyses;
Section 5 provides policy recommendations; and
Section 6 concludes with a discussion of limitations and directions for future research.
3. Methods and Scenario Design
3.1. Theoretical Foundation
The BTH region is a major economic hub in northern China, exhibiting a clear core–periphery structure. Beijing and Tianjin, as the region’s economic, political, and cultural centers, attract resources from surrounding areas, primarily Hebei, leading to a “siphon effect”. Geographic distance further influences the efficiency of resource flow, with greater distances resulting in higher resistance. This aligns with the core assumptions of the Gravity model, which states that the intensity of interaction between two regions is proportional to their economic mass and inversely proportional to their distance.
The gravity model effectively captures the spatial dynamics of the BTH region, quantifying the “siphon effect” and assessing the impact of policy interventions on intercity connectivity. It also allows for tracking changes in economic links, particularly during the relocation of non-capital functions. Integrating social network analysis methods, such as centrality and block modeling, helps identify key cities, their roles, and the structure of regional networks. Core cities, with their strong economic influence, act as leaders in regional development, while peripheral cities must integrate into the broader development framework to enhance their economic transformation.
3.2. Enhanced Gravity Model
The gravity model, as a key tool in social network analysis, originates from the law of universal gravitation in physics. It was later introduced into the field of social sciences by scholars such as Tinbergen (1962) and has since become one of the core analytical methods for studying spatial interactions, including population migration, trade flows, and information dissemination. In this framework, GDP is widely regarded as a fundamental indicator of regional economic output, reflecting market potential and industrial scale, while the employed population directly correlates with the intensity of industrial activity, capturing cross-regional factor mobility. Consequently, traditional gravity models typically incorporate GDP and employed population as “mass” indicators.
However, the conventional model exhibits significant limitations when applied to the Beijing–Tianjin–Hebei region. Electricity, as a unique commodity, possesses distinct spatial characteristics in its production, transmission, and consumption. Strong economic linkages exist between energy-supplying and energy-demanding regions, manifested not only in power transmission and trade but also in related sectors such as equipment manufacturing, technical services, and labor mobility. Since traditional gravity models fail to account for electricity consumption data, they overlook these specialized spatial interdependencies in energy networks, thereby inadequately capturing inter-regional interactions in the energy sector. This limitation restricts the model’s applicability in energy economics and regional energy planning.
Moreover, regional economic development is a dynamic process, with industrial structures and energy consumption patterns evolving over time. Electricity consumption data can promptly reflect these changes—for instance, shifts in power usage patterns due to energy-saving policies or the adoption of renewable technologies may significantly alter inter-regional economic linkages. Traditional gravity models, lacking electricity consumption metrics, cannot detect such dynamic adjustments, impairing their predictive accuracy for future trends in regional interactions.
To address these gaps, this study enhances the traditional gravity model [
36] by incorporating electricity consumption as an additional indicator. The modified formulation is as follows:
In this study, the weights assigned to GDP, employed population, and electricity consumption in the gravity model were assumed to be equal.
The inter-regional distance is calculated using the Haversine formula [
37], with the geographic coordinates of each region’s city hall serving as the reference points. The specific mathematical expression is presented as follows:
3.3. Scenario Design
3.3.1. Scenario Framework
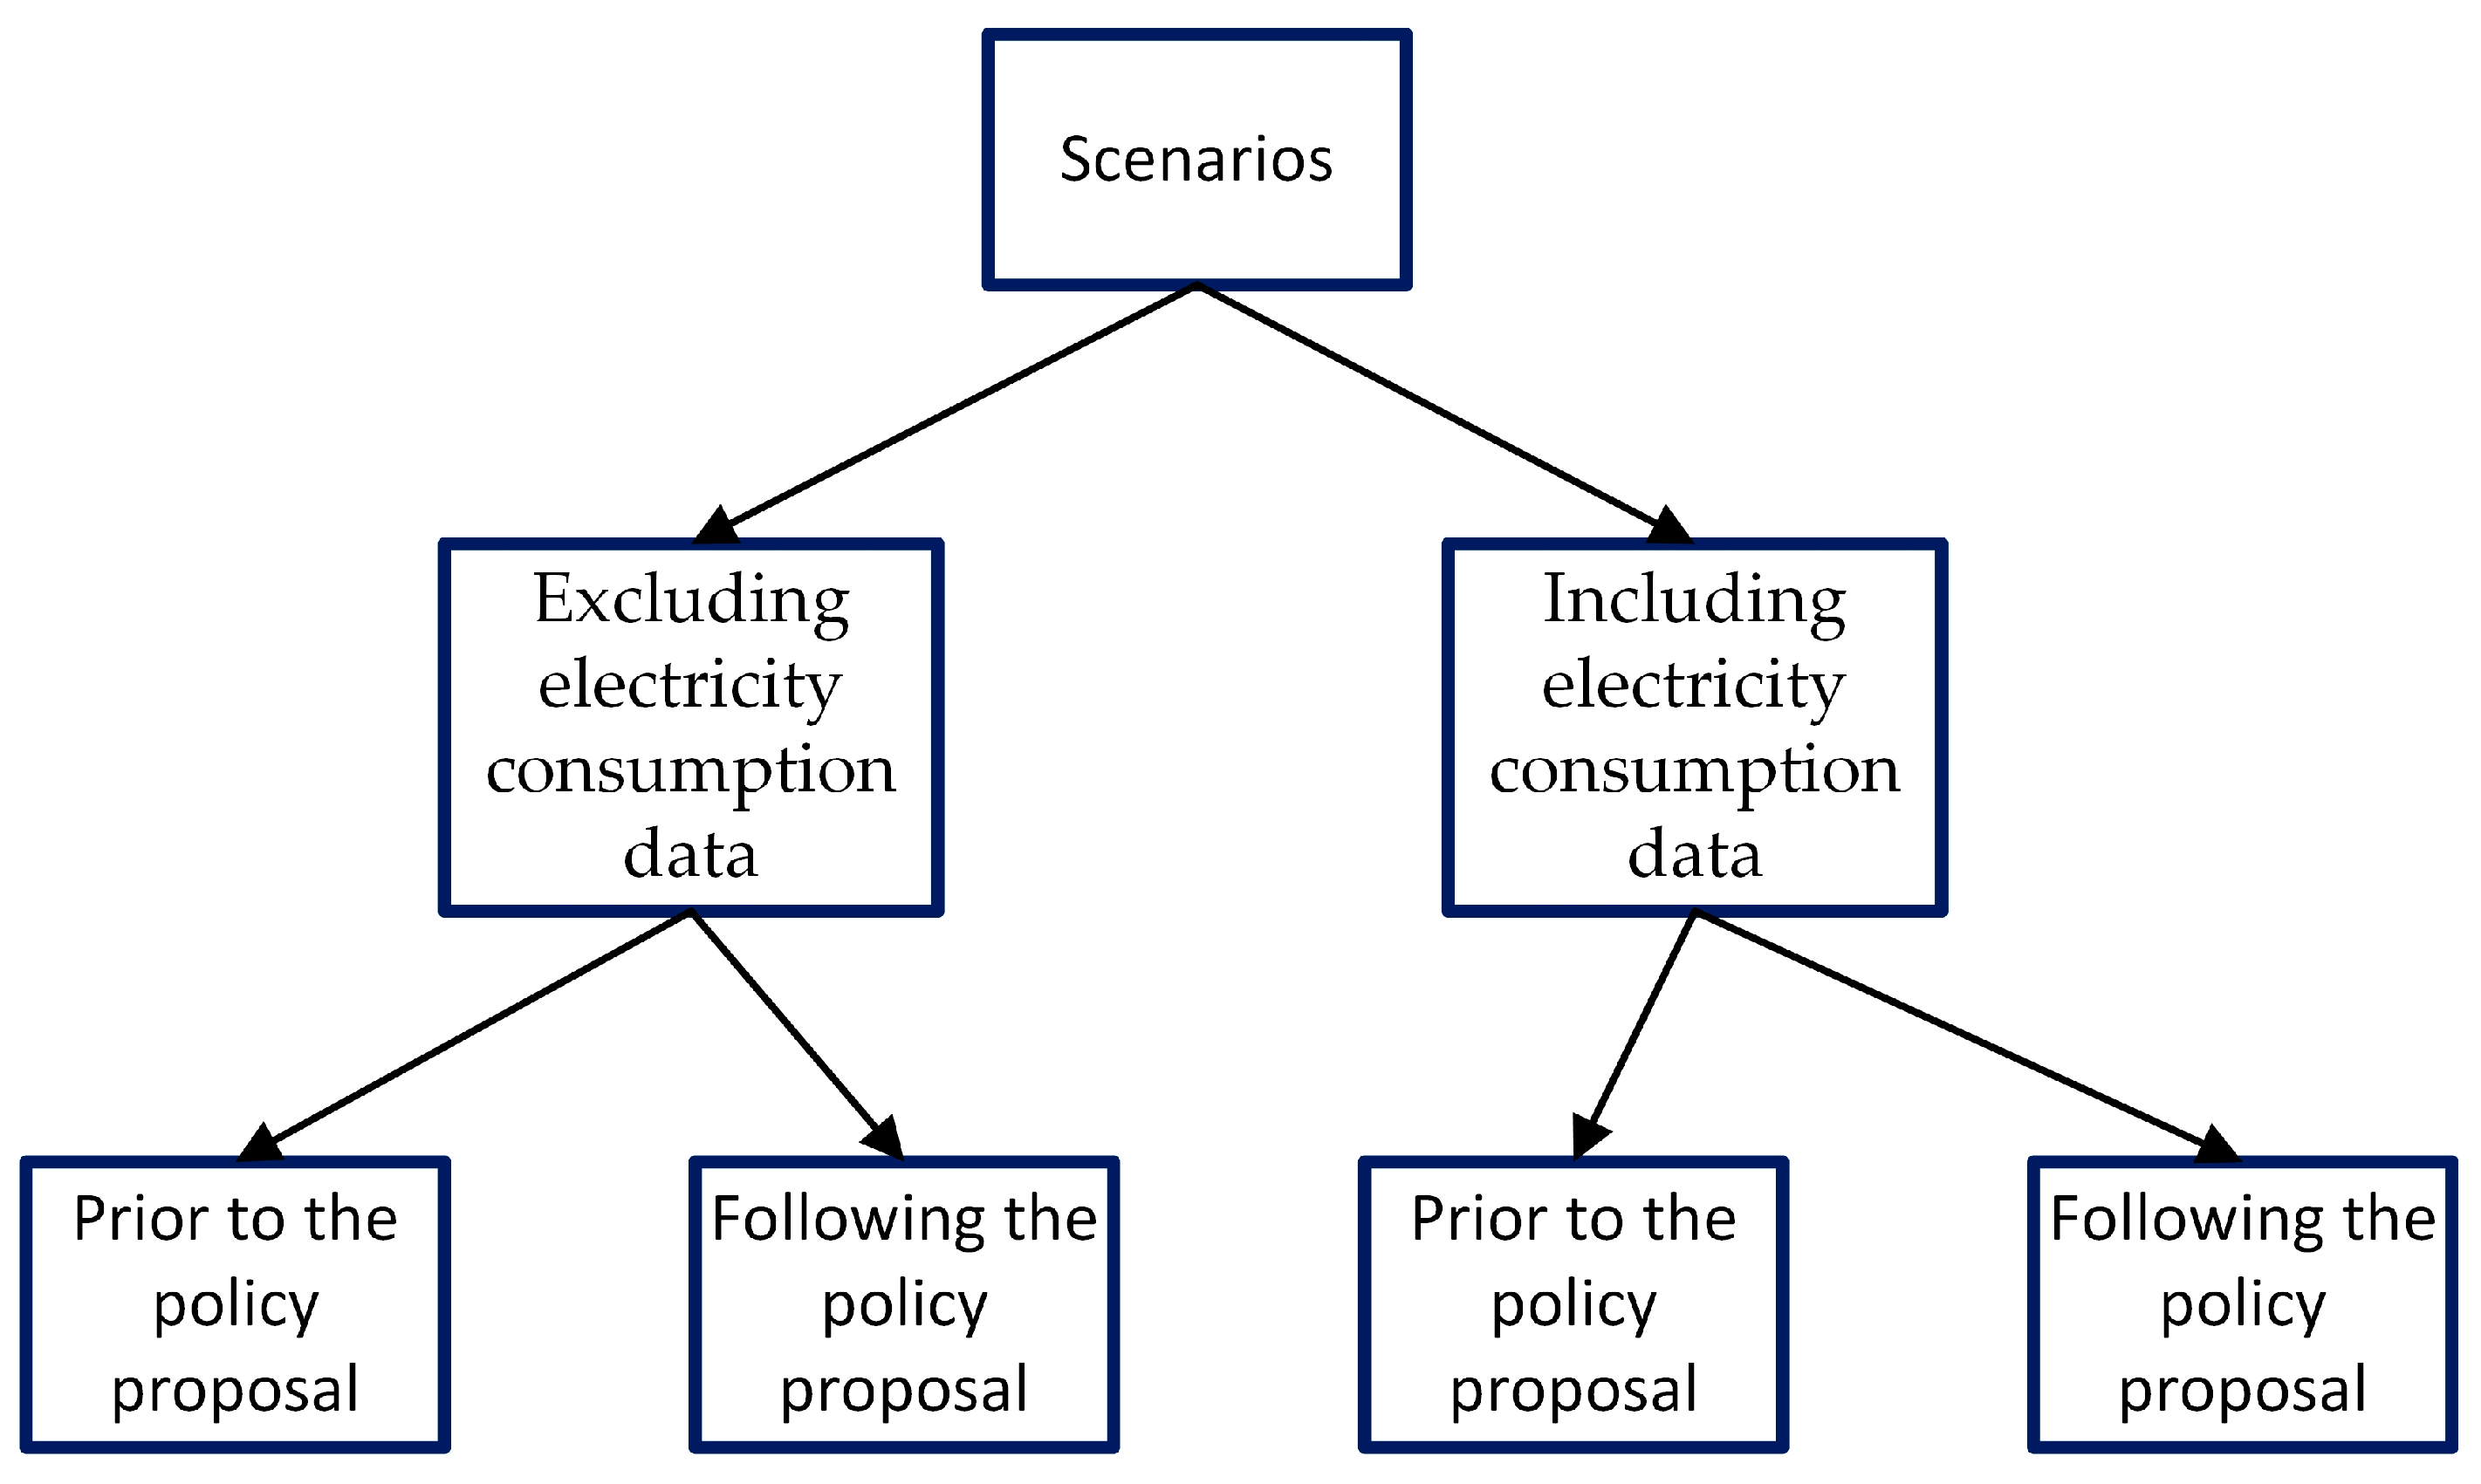
This study analyzes the social network of the Beijing–Tianjin–Hebei region under different scenario settings. The specific scenarios are illustrated in
Figure 1.
3.3.2. Pearson Correlation Coefficient
To validate the reasonableness of using electricity consumption as a proxy for economic interaction, this study conducted a correlation analysis between electricity consumption and available trade data using the Pearson correlation coefficient [
38].
3.4. Centrality Analysis
3.4.1. Degree Centrality
Degree centrality [
39] is a fundamental metric used to quantify the number of direct connections a given node has within a network. Specifically, it is calculated as the ratio of a node’s degree—that is, the number of edges incident to it—to the maximum possible degree within the network. Nodes with high degree centrality are distinguished by a greater number of direct links, which often translates into greater influence. This influence is primarily reflected in the node’s ability to interact with and disseminate information to a large number of other nodes.
3.4.2. Closeness Centrality
Closeness centrality [
39] is a key metric for evaluating a node’s accessibility within a network—not in physical or geographical terms, but in terms of network topology. It is defined as the reciprocal of the average shortest path length between a given node and all other nodes in the network. In this context, “distance” refers to the topological distance, meaning the minimum number of edges (i.e., the shortest path) required to reach other nodes. Nodes with high closeness centrality possess a distinct advantage: they can reach other nodes more quickly, enabling them to play a central role in the flow of information. This advantage primarily lies in their ability to efficiently gather information from various parts of the network and disseminate it rapidly, thereby functioning as critical hubs for communication and coordination.
3.4.3. Betweenness Centrality
Betweenness centrality [
39] is a crucial metric in network analysis that quantifies how often a node appears on the shortest paths between pairs of other nodes. This measure captures the node’s capacity to act as a bridge or conduit in facilitating the flow of information across the network’s topology. Nodes with high betweenness centrality function as critical intermediaries in the transmission of information and the allocation of resources. Owing to their strategic positions within the network structure, such nodes exert substantial influence and may control key pathways of interaction. This influence is particularly evident in their ability to steer the direction and pace of information dissemination. By occupying intermediary positions, these nodes can either accelerate or impede communication flows, thereby shaping the overall dynamics and efficiency of the network.
3.5. Lambda
Lambda analysis [
40] is a key method in UCINET 6 (a social network analysis software) used to assess the intensity and reachability of relationships between nodes in a network. It generates a similarity matrix and Lambda values by applying similarity measurement techniques to evaluate the structural equivalence of each node. The process begins with constructing an adjacency matrix, where each element indicates whether a connection exists between two nodes. The
row (or column) of adjacency matrix
A is extracted as neighbor vector
, representing the connection profile of node
with other nodes. The Pearson correlation coefficient is calculated between the neighbor vectors
and
of nodes
and
to construct a similarity matrix.
4. Empirical Results and Limitations
4.1. Correlation Test
To empirically validate the use of electricity consumption as a proxy for economic interaction, we conducted a correlation analysis between electricity usage and inter-regional trade volume among Beijing, Tianjin, and Hebei. Railway freight volume was used as a proxy for inter-firm trade activity, given its close association with bulk industrial goods and intercity logistics. The Pearson correlation coefficient between electricity interaction values and railway freight flows was found to be 0.9467, indicating a strong positive relationship. This result supports the underlying assumption that electricity consumption intensity reflects the scale and strength of economic linkages, particularly in energy-intensive sectors such as steel.
4.2. Degree Centrality Analysis
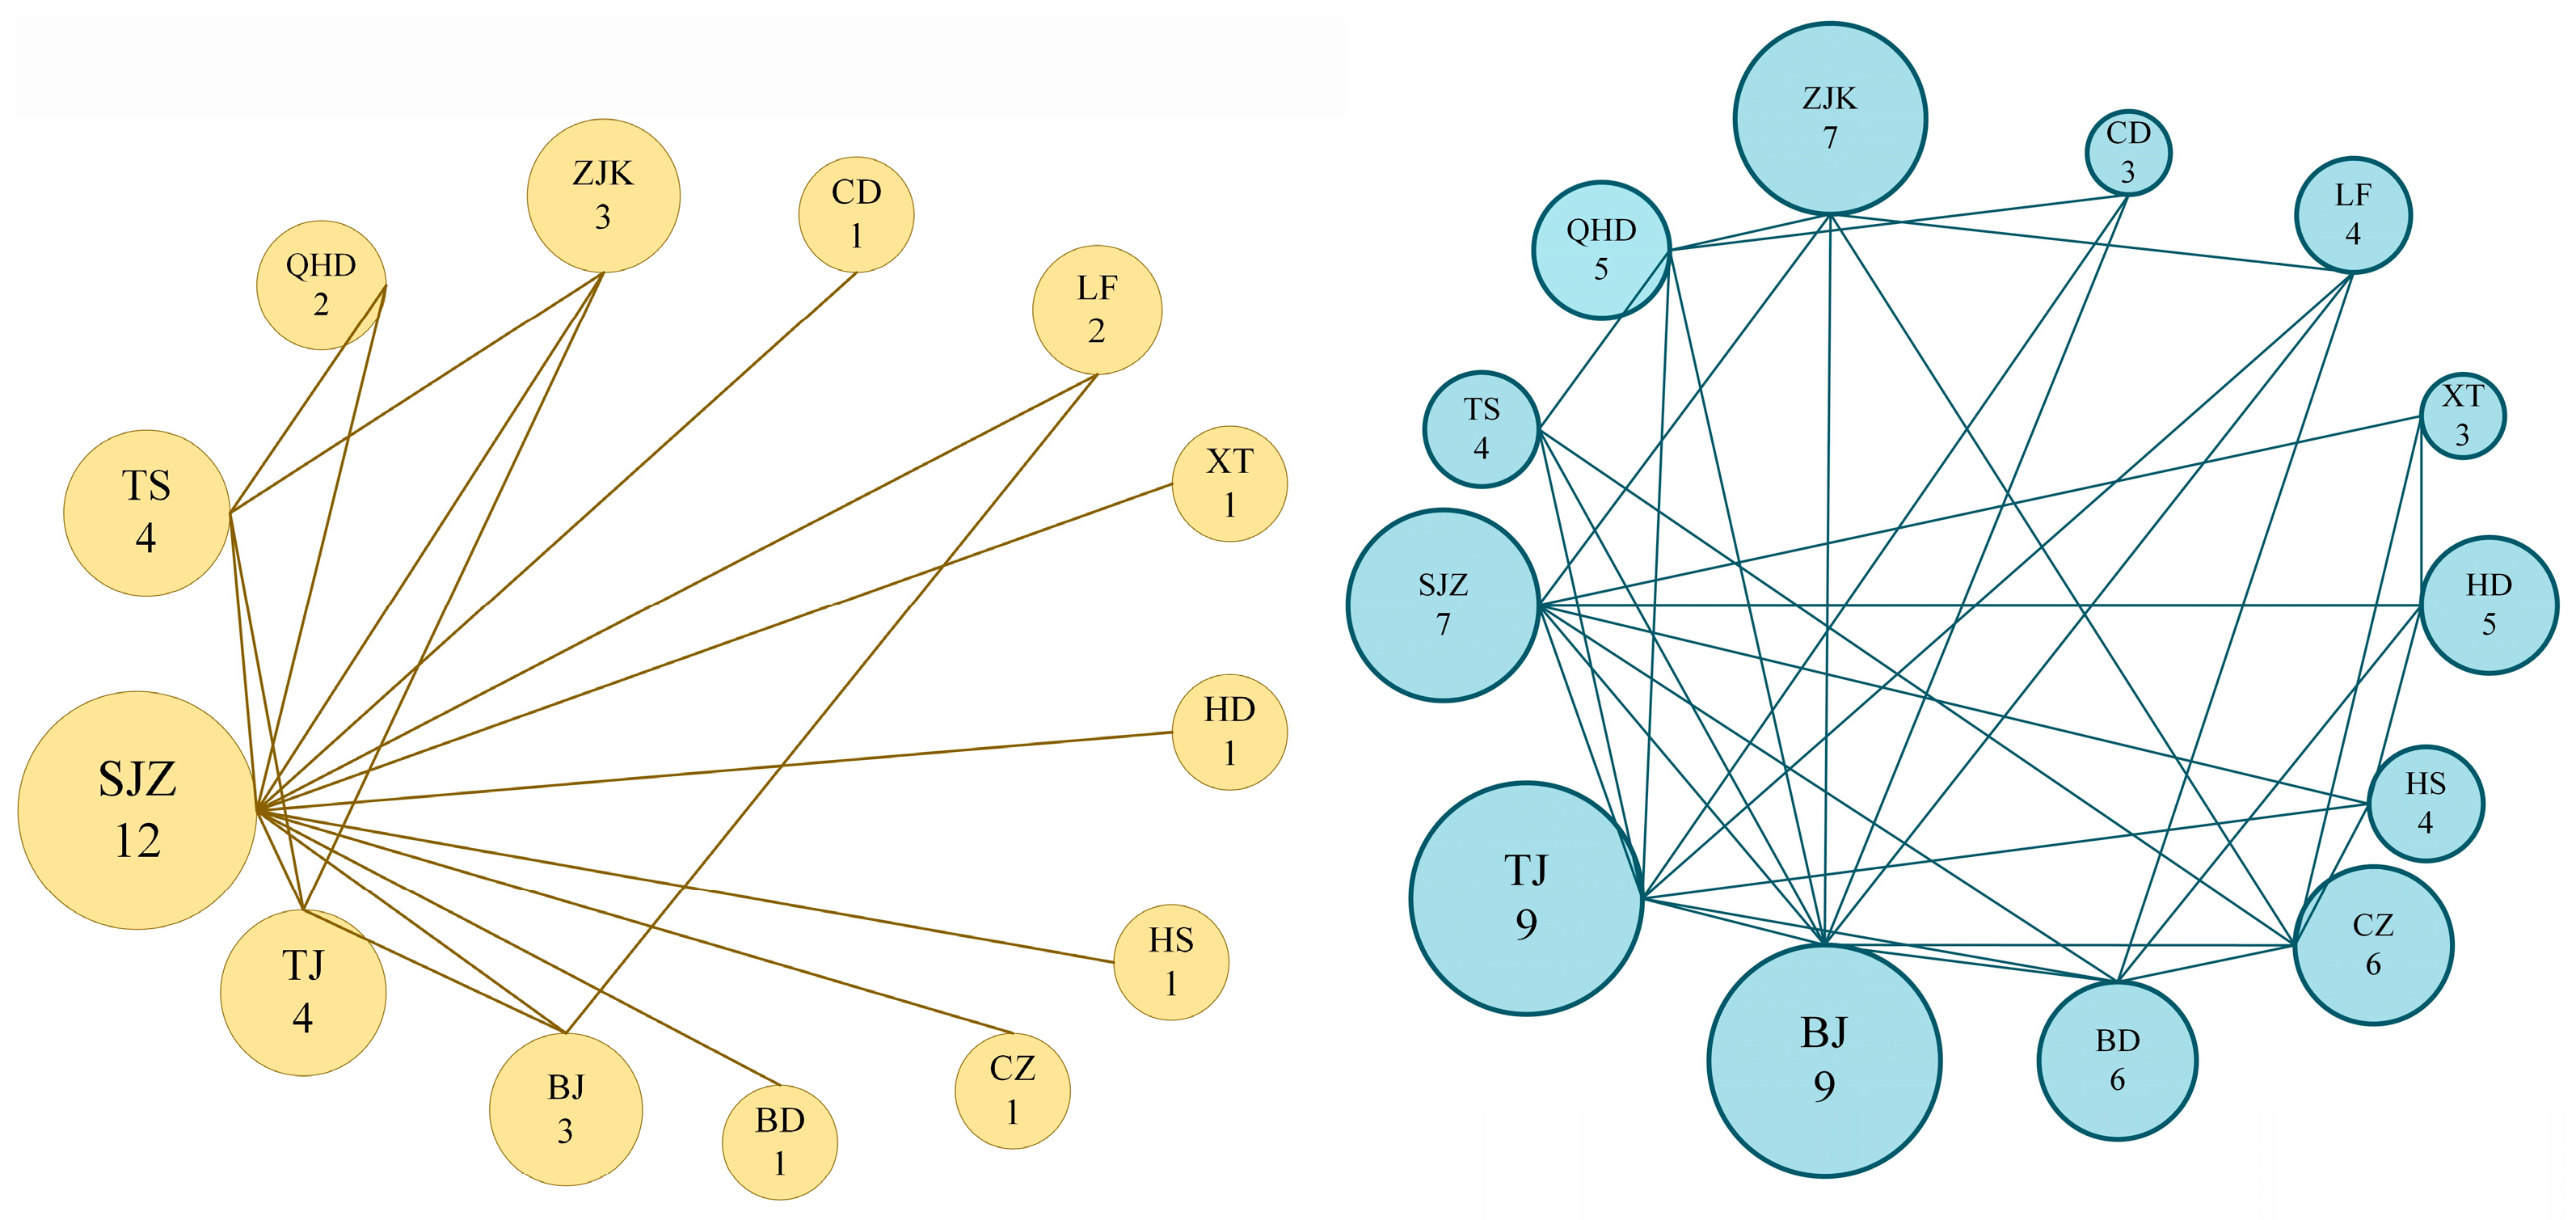
We calculated the degree centrality of the steel industry network within the BTH region under two scenarios: one excluding electricity consumption data and the other incorporating it, both before and after the implementation of the coordinated development policy (as illustrated in
Figure 2 and
Figure 3). In the scenario without electricity data, Shijiazhuang held the central position prior to policy implementation, with a degree centrality of 12. Following the policy, Beijing and Tianjin slightly increased their centrality scores, each reaching 9. In contrast, when electricity consumption data was integrated into the model, Shijiazhuang again occupied the central position before policy implementation, also with a score of 12. However, post implementation, Beijing emerged as the most central node with a degree centrality of 10, closely followed by Tianjin with 9. These findings indicate an expanded disparity in degree centrality among Beijing, Tianjin, and other cities, thereby reinforcing their prominence within the regional industrial network.
The coordinated development policy explicitly advocates for optimizing the regional industrial layout and promoting the relocation of energy-intensive and highly polluting industries from Beijing and Tianjin to Hebei. As the capital of Hebei Province, Shijiazhuang initially served as a significant node within the steel industry. However, under the guidance of the policy, a portion of its steel production capacity has been transferred to other regions within Hebei. Meanwhile, Beijing and Tianjin have shifted from traditional production centers to hubs for research and development, management, and trade, establishing broader connections with upstream and downstream enterprises and markets. These enhanced linkages have positioned Beijing and Tianjin as core nodes for resource allocation and market coordination. Additionally, the coordinated development policy has facilitated regional transportation integration. As major transportation hubs, both cities benefit from more developed railway, highway, and port networks. Collectively, these factors have contributed to a substantial increase in the degree centrality of Beijing and Tianjin within the industrial network.
Following the introduction of the BTH coordinated development policy, Beijing reduced its electricity consumption in the steel industry by relocating energy-intensive sectors. Nevertheless, even when electricity consumption data is incorporated, Beijing continues to exhibit a relatively high degree of centrality. This is because the inclusion of electricity consumption data allows network analysis to more accurately capture the economic weight and actual influence of each node. The elevated degree centrality of Beijing thus reflects not only its extensive connectivity within the steel industry network but also its substantial economic contributions, underscoring its sustained importance in the regional industrial structure.
4.3. Closeness Centrality Analysis
To examine the role of various nodes in information transmission within the BTH network, we computed closeness centrality under both analytical scenarios—excluding and including electricity consumption data—before and after the introduction of the coordinated development policy. The results are illustrated in
Figure 4 and
Figure 5.
Before and after the implementation of the coordinated development policy in the BTH region, the city with the highest closeness centrality within the regional network shifted. Prior to the policy, Shijiazhuang held the top position, reflecting its strong connectivity with other cities and its high efficiency in information dissemination. However, following the policy’s implementation, Beijing emerged as the most central node, closely followed by Tianjin. This shift in closeness centrality illustrates the substantial impact of the coordinated development policy on the structure of the regional network, particularly highlighting the effects of functional transformation and resource agglomeration in Beijing and Tianjin under policy guidance. The rise of Beijing as the new central node reflects its strengthened role as a political, economic, and technological hub, driven by strategic resource allocation and functional optimization in line with the policy’s objective to relocate non-capital functions. Tianjin’s ascent further underscores its increasing importance as a regional economic center. Conversely, the relative decline in Shijiazhuang’s centrality suggests a transition from a leading industrial node to a more supportive, peripheral role in the regional hierarchy. These findings underscore the effectiveness of the coordinated development policy in promoting a more balanced and integrated regional development model across the BTH area.
Closeness centrality is primarily computed based on the shortest path lengths between nodes, capturing a node’s efficiency in disseminating information and its ability to exert control within a network. In contrast, electricity consumption data primarily affects the strength of connections between nodes and more directly reflects the scale or intensity of a node’s production activities. As a result, the inclusion of electricity consumption data has only a limited impact on the calculation of closeness centrality, since it does not substantially alter the underlying shortest paths that determine this metric.
4.4. Betweenness Centrality Analysis
To examine the role of different nodes as “bridges” connecting indirectly linked pairs within the BTH network, we computed betweenness centrality under both analytical scenarios—excluding and including electricity consumption data—before and after the introduction of the coordinated development policy. The results are illustrated in
Figure 6.
Before the implementation of the coordinated development policy in the BTH region, Shijiazhuang held the highest betweenness centrality within the regional network. However, following the policy’s implementation, the role of the “bridge” node, responsible for connecting other nodes, shifted to Beijing. Changes in betweenness centrality primarily reflect a node’s bridging function and its capacity to control the flow of resources within the network. The observed shifts across betweenness, degree, and closeness centrality collectively suggest that, in the aftermath of the policy, Beijing has increasingly assumed the roles of both an economic hub and a technological center within the regional industrial network. The increase in Beijing’s betweenness centrality may appear to conflict with the goal of relocating non-capital functions; however, it reflects a transformation in Beijing’s role within the regional network. After implementation, Beijing shifted from a production hub to a coordination center for R&D, management, and service functions. This aligns with the viewpoint presented in Ref. [
29], which states that the initial results of Beijing’s non-capital function relocation have begun to take shape and that the industrial division of labor and development positioning among the three regions are gradually becoming clearer. Consequently, its intermediary role strengthened—not due to its continued industrial dominance but because of its enhanced capacity to direct and coordinate regional economic flows.
Under the traditional analytical framework that excludes electricity consumption data, the betweenness centrality of network nodes generally remained at low levels following policy implementation, thereby failing to effectively identify key nodes exhibiting prominent “bridge” characteristics. This outcome suggests that the classical gravity model may introduce systematic bias in characterizing regional economic linkages, primarily due to its omission of a critical dimension—electricity consumption—that reflects the intensity of real economic activity. As an objective and quantifiable indicator of industrial operations, the integration of electricity consumption data substantially enhances the model’s capacity to uncover implicit trade relationships and identify intermediary hub nodes. Consequently, it offers a more comprehensive analytical foundation for evaluating regional policy effectiveness and understanding the structural dynamics of industrial networks.
4.5. Centrality-Based Clustering Analysis
In the process of regional economic coordinated development, accurately revealing differences among cities across various dimensions is crucial for deepening the understanding of urban roles and optimizing regional resource allocation. This study focuses on the Beijing–Tianjin–Hebei region, aiming to analyze the disparities among cities in terms of “efficiency” and “control” within the network.
Closeness centrality, a key metric for assessing a city’s accessibility efficiency in the network, reflects the intensity of its connections with other cities and the ease with which information, resources, and other elements flow between them. Betweenness centrality, on the other hand, emphasizes a city’s control capability within the network, measuring how frequently it lies on the shortest paths between other cities. A higher frequency indicates greater control over information dissemination and resource allocation.
Based on this,
Figure 7 presents a cluster analysis of closeness centrality and betweenness centrality for cities in the BTH region. This analytical approach allows for a clear classification of cities based on their accessibility efficiency and control capability, thereby visually illustrating their distinct positions and functions within the regional urban network.
The results reveal a clear three-tier hierarchical structure within the urban system of the BTH region. The first tier comprises core hub cities, Beijing, Tianjin, and Shijiazhuang, which exhibit high values in both closeness and betweenness centrality. As the political, economic, and transportation centers of the region, these cities occupy a dominant position within the regional network. Beijing, serving as the national capital, Tianjin, functioning as the northern shipping hub, and Shijiazhuang, as the provincial capital and a major railway junction, collectively form the “control center” of the network, facilitating substantial flows of resources and information. The second tier consists of marginally connected cities, such as Hengshui and Cangzhou, which display high closeness centrality but low betweenness centrality. Geographically situated in the intermediate zone of the region, these cities enjoy high accessibility. However, due to the absence of high-end industries or critical infrastructure, they lack the capacity to function as intermediary nodes, resulting in limited resource allocation influence. The third tier includes peripheral and dependent cities, which score low on both centrality measures. These cities are primarily located on the geographical periphery of the BTH region or are subject to the siphoning effects of core cities. Consequently, they exhibit weak connectivity and limited control capacity within the network, with their development largely reliant on the radiative effects of the regional core.
4.6. Lambda Analysis
Lambda sets refer to the grouping of nodes within a social network based on their degree of association, thereby revealing hierarchical clustering patterns within the network. A higher degree of association indicates more stable and cohesive relationships among nodes. The greater the degree of association, the more stable the relationships between nodes. To further assess the effectiveness of incorporating electricity consumption data in analyzing social network associations, we employed the lambda method using the UCINET tool. The analysis was conducted under two scenarios: one excluding electricity consumption data and the other incorporating it.
Figure 8 illustrates the resulting Lambda sets under both scenarios. In the figure, the numbers at the top represent the degrees of association, while the numbers on the left indicate the serial numbers of the cities.
The structural changes observed in the Lambda sets reveal both the reconfiguration of existing industrial clusters and the emergence of new regional alliances. Before incorporating electricity consumption data, the network was more fragmented, with weaker associations among peripheral cities and a strong pairing only between Tianjin and Shijiazhuang (association strength 7). However, after incorporating electricity data, several significant shifts occurred:
A new mid-tier cluster emerged that included Tangshan, Zhangjiakou, Handan, Xingtai, Langfang, Baoding, and Chengde, all sharing an association strength of 3. This indicates stronger horizontal supply chain connections likely driven by shared industrial characteristics and production intensity.
The Beijing–Tianjin pair saw a marked increase in association strength from separate tiers to a score of 9, reflecting an intensified dual-core structure and deeper functional interdependence in coordination, management, and logistics.
The pairing of Beijing and Hengshui (association 5) is also noteworthy, suggesting emerging ties possibly associated with the relocation of auxiliary or support functions.
Meanwhile, cities like Qinhuangdao and Cangzhou form their own sub-cluster (association 4), suggesting enhanced linkages along coastal logistics or energy transmission lines.
4.7. Limitations
While this study provides valuable insights into the spatial effects of the BTH coordinated development policy, several limitations should be acknowledged. First, due to data constraints, the analysis is based on annual electricity consumption, which limits the ability to capture short-term dynamics. Second, although the enhanced gravity model incorporates electricity data, it relies on simplified assumptions such as equal weighting due to the lack of industry-specific parameters. Finally, the analysis is conducted at the prefecture-city level, which, while policy-relevant, does not capture finer intra-city variations.
Despite these limitations, the electricity-enhanced SNA framework proposed in this study is broadly applicable. It can be extended to other industries and to different regions, such as the Yangtze River Delta or international industrial corridors, provided reliable electricity data is available.
5. Policy Recommendations
Previous studies have found that enhancing industrial coordination requires attention to factors such as transportation layout [
41], fiscal subsidies [
42], support for R&D [
42], and regional cooperation [
43,
44]. Based on the findings of this study, we provide the following specific policy recommendations.
Provide fiscal and R&D support to intermediate cities like Hengshui and Cangzhou to strengthen their innovation capacity and industrial competitiveness, thereby promoting their integration into the regional supply chain.
Improve horizontal connectivity among peripheral and newly emerging mid-tier cities such as Tangshan, Zhangjiakou, and Handan to reduce resource flow costs and foster stable industrial linkages.
Capitalize on the strengthened dual-core structure of Beijing and Tianjin by enhancing collaborative innovation with surrounding cities, extending regional industrial value chains, and coordinating logistics and management functions.
Incorporate electricity consumption into the regional monitoring system as a real-time proxy for production intensity and economic activity, providing a more dynamic basis for policy evaluation.
To overcome structural imbalances, establish cross-city cooperation platforms that facilitate information sharing, resource integration, and interest alignment, supporting more balanced and synergistic regional development.


