Review

Energy Efficiency Measurement Method and Thermal Environment in Data Centers—A Literature Review

by
Zaki Ghifari Muhamad Setyo
1,
Hom Bahadur Rijal
1,*,
Naja Aqilah
2 and
Norhayati Abdullah
1,2
1
Graduate School of Environmental and Information Studies, Tokyo City University, 3-3-1 Ushikubo-nishi, Tsuzuki-ku, Yokohama 224-8551, Japan
2
Malaysia-Japan International Institute of Technology (MJIIT), Universiti Teknologi Malaysia, Jalan Sultan Yahya Petra, Kuala Lumpur 54100, Malaysia
*
Author to whom correspondence should be addressed.
Energies 2025, 18(14), 3689; https://doi.org/10.3390/en18143689
Submission received: 14 June 2025 / Revised: 2 July 2025 / Accepted: 8 July 2025 / Published: 12 July 2025
(This article belongs to the Section G: Energy and Buildings)

Abstract

The increase in data center facilities has led to higher energy consumption and a larger carbon footprint, prompting improvements in thermal environments for energy efficiency and server lifespan. Existing literature studies often overlook categorizing equipment for power usage effectiveness (PUE), addressing power efficiency measurement limitations and employee thermal comfort. These issues are addressed through an investigation of the PUE metric, a comparative analysis of various data center types and their respective cooling conditions, an evaluation of PUE in relation to established thermal standards and an assessment of employee thermal comfort based on defined criteria. Thirty-nine papers and ten websites were reviewed. The results indicated an average information technology (IT) power usage of 44.8% and a PUE of 2.23, which reflects average efficiency, while passive cooling was found to be more applicable to larger-scale data centers, such as Hyperscale or Colocation facilities. Additionally, indoor air temperatures averaged 16.5 °C with 19% relative humidity, remaining within the allowable range defined by ASHRAE standards, although employee thermal comfort remains an underexplored area in existing data center research. These findings highlight the necessity for clearer standards on power metrics, comprehensive thermal guidelines and the exploration of alternative methods for power metrics and cooling solutions.

1. Introduction

Data centers consume about 200 terawatt hours (TWh) of electricity annually, contributing roughly 0.3% of global carbon emissions [1]. Electricity demand from data centers is projected to more than double in southeast Asia by 2030 [2]. The article also estimated that data centers will use 945 TWh in 2030, roughly equivalent to the current annual electricity consumption of Japan. It was reported that data centers may utilize 100–200 times more electricity than typical office buildings, emphasizing their high energy demands [3]. These sources highlight the increasing energy demands and associated environmental impacts of data centers, reflecting the urgency of addressing efficient management of energy demand and thermal environment.

1.1. Growth of Data Centers and Energy Concerns

Global data centers consumed 61 billion kWh of electricity in 2006, making up 1.5% of U.S. electricity consumption, and this demand has steadily risen over the years [4]. Although data centers worldwide consume significant energy and resources to operate servers and the supporting infrastructure, the demand for their services continues to rise [5]. Additionally, the global information and communication technology (ICT) infrastructure, including data centers, is estimated to consume 1500 TWh of electricity, representing about 10% of total global usage [6]. The global expansion of data centers, fueled by increasing digital demands and the rise of hyperscale facilities, has significantly contributed to the growing energy consumption worldwide, underscoring the scale of this issue.
According to Kim et al. [7], cooling systems also contribute significantly to energy usage, with over 95% of cooling loads attributed to IT equipment heat generation. This indicates that only 5% of cooling goes into other equipment, such as power distribution units (PDUs). Furthermore, inefficient energy management and infrastructure variability contribute to energy consumption issues, making it essential to address the environmental impact of these facilities [8]. The substantial power demands and inefficiencies associated with data center growth and expansion highlight the pressing need for sustainable strategies for energy usage mitigation and carbon footprint reduction.

1.2. Importance of Power Metrics

The rapid growth of data center energy consumption demands efficient evaluation methods to identify areas for improvement. Metrics such as power usage effectiveness (PUE) are critical for quantifying how effectively energy is delivered to IT equipment compared to the overall facility’s power consumption [9]. However, PUE alone cannot capture the full picture of data center efficiency due to variations in infrastructure, design and operation [10]. Metrics that provide more granularity for the PUE and data center infrastructure efficiency (DCiE) metrics have been considered by The Green Grid for development by breaking them down into components [11]. Comprehensive power metrics provide essential insights into data center energy efficiency, allowing operators to navigate infrastructure complexities and address performance gaps effectively.
Effective power metrics play a crucial role in promoting sustainability by identifying inefficiencies and reducing unnecessary energy usage. To reduce total energy consumption, the end user should avoid optimizing individual components or subsystems in isolation, as such limited improvements may negatively affect the efficiency of the overall system [12]. Furthermore, consistent and standardized application of these metrics helps compare the performance of different data centers and track improvements over time [13]. This data-driven approach aids in lowering operational costs, minimizing carbon footprints and enhancing the overall energy efficiency of data centers [14]. PUE identifies inefficiencies by distinguishing IT power from facility power, enabling data-driven strategies to cut costs and enhance sustainability.

1.3. Research Gaps

When reviewing power consumption reports related to data centers, many studies do not provide the categorization of IT equipment power requirements, even though such classification is essential for accurate PUE calculation. Such categorization is critical for understanding power allocation and identifying the opportunities for efficiency improvement. Although the importance of precise energy metrics for benchmarking efficiency has been well researched, specific efforts addressing categorization require further studies. The lack of research comparing different data centers is likely caused by the lack of power reports per equipment used in data center facilities. Although Zhang et al. [15] and similar studies provide detailed breakdowns of equipment-level power consumption, they do not include comparative analyses between facilities.
Another issue identified in the data center topic is the absence of studies that explicitly specify the types of data centers analyzed, despite the significant operational differences that affect energy consumption. For instance, cloud data centers, designed for high networking capacity to support global users, have different energy allocation priorities to enterprise data centers, which primarily cater to internal organizational needs. Cloud computing and enterprise data centers differ in power distribution needs, with cloud facilities typically requiring more power for networking equipment due to their global user base. This gap limits the feasibility of existing research, as energy efficiency measures often depend on the type of facility and its operational goals.
The specification of data center type is not the only problem that affects the result of data center power efficiency measurements. Energy efficiency in data centers is closely tied to maintaining optimal thermal environments, which necessitates adherence to standardized guidelines. While standards from the American Society of Heating, Refrigerating and Air-Conditioning Engineers (ASHRAE) define the recommended temperature and humidity ranges, their applicability still needs to be evaluated across various data center types and operating conditions. Deviations from these standards, such as overcooling or undercooling, can lead to inefficiency, increased energy use and hardware risks. Research that examines thermal environments in real-world data center operations may highlight gaps in current standards and provide insights into adapting these guidelines to modern infrastructure. Addressing these gaps can ensure that thermal management strategies are both energy-efficient and effective in safeguarding equipment performance and longevity.
Although standards for thermal environments that optimize equipment efficiency in data centers have been established, there appears to be a lack of research addressing the thermal comfort of employees working within these facilities. This gap is significant, given the direct implications for productivity and workplace safety. While employees may not spend prolonged hours in server rooms, understanding their cycles of exposure and identifying potential challenges remain essential. Establishing standardized thermal comfort guidelines could address these issues.

1.4. Research Objectives

Based on the gaps found in previous research, this paper has several objectives:
  • To categorize IT equipment and measure the PUE value of different data centers.
  • To investigate the influence of data center type on the energy distribution priorities and cooling methods of each data center type.
  • To evaluate data centers’ compliance with existing thermal standards and identify the deviations that indicate a need for improvement.
  • To evaluate the possible thermal comfort of employees working in data center environments, based on exposure cycles and workplace conditions, with the aim of proposing occupational thermal comfort guidelines.

2. Research Methodology

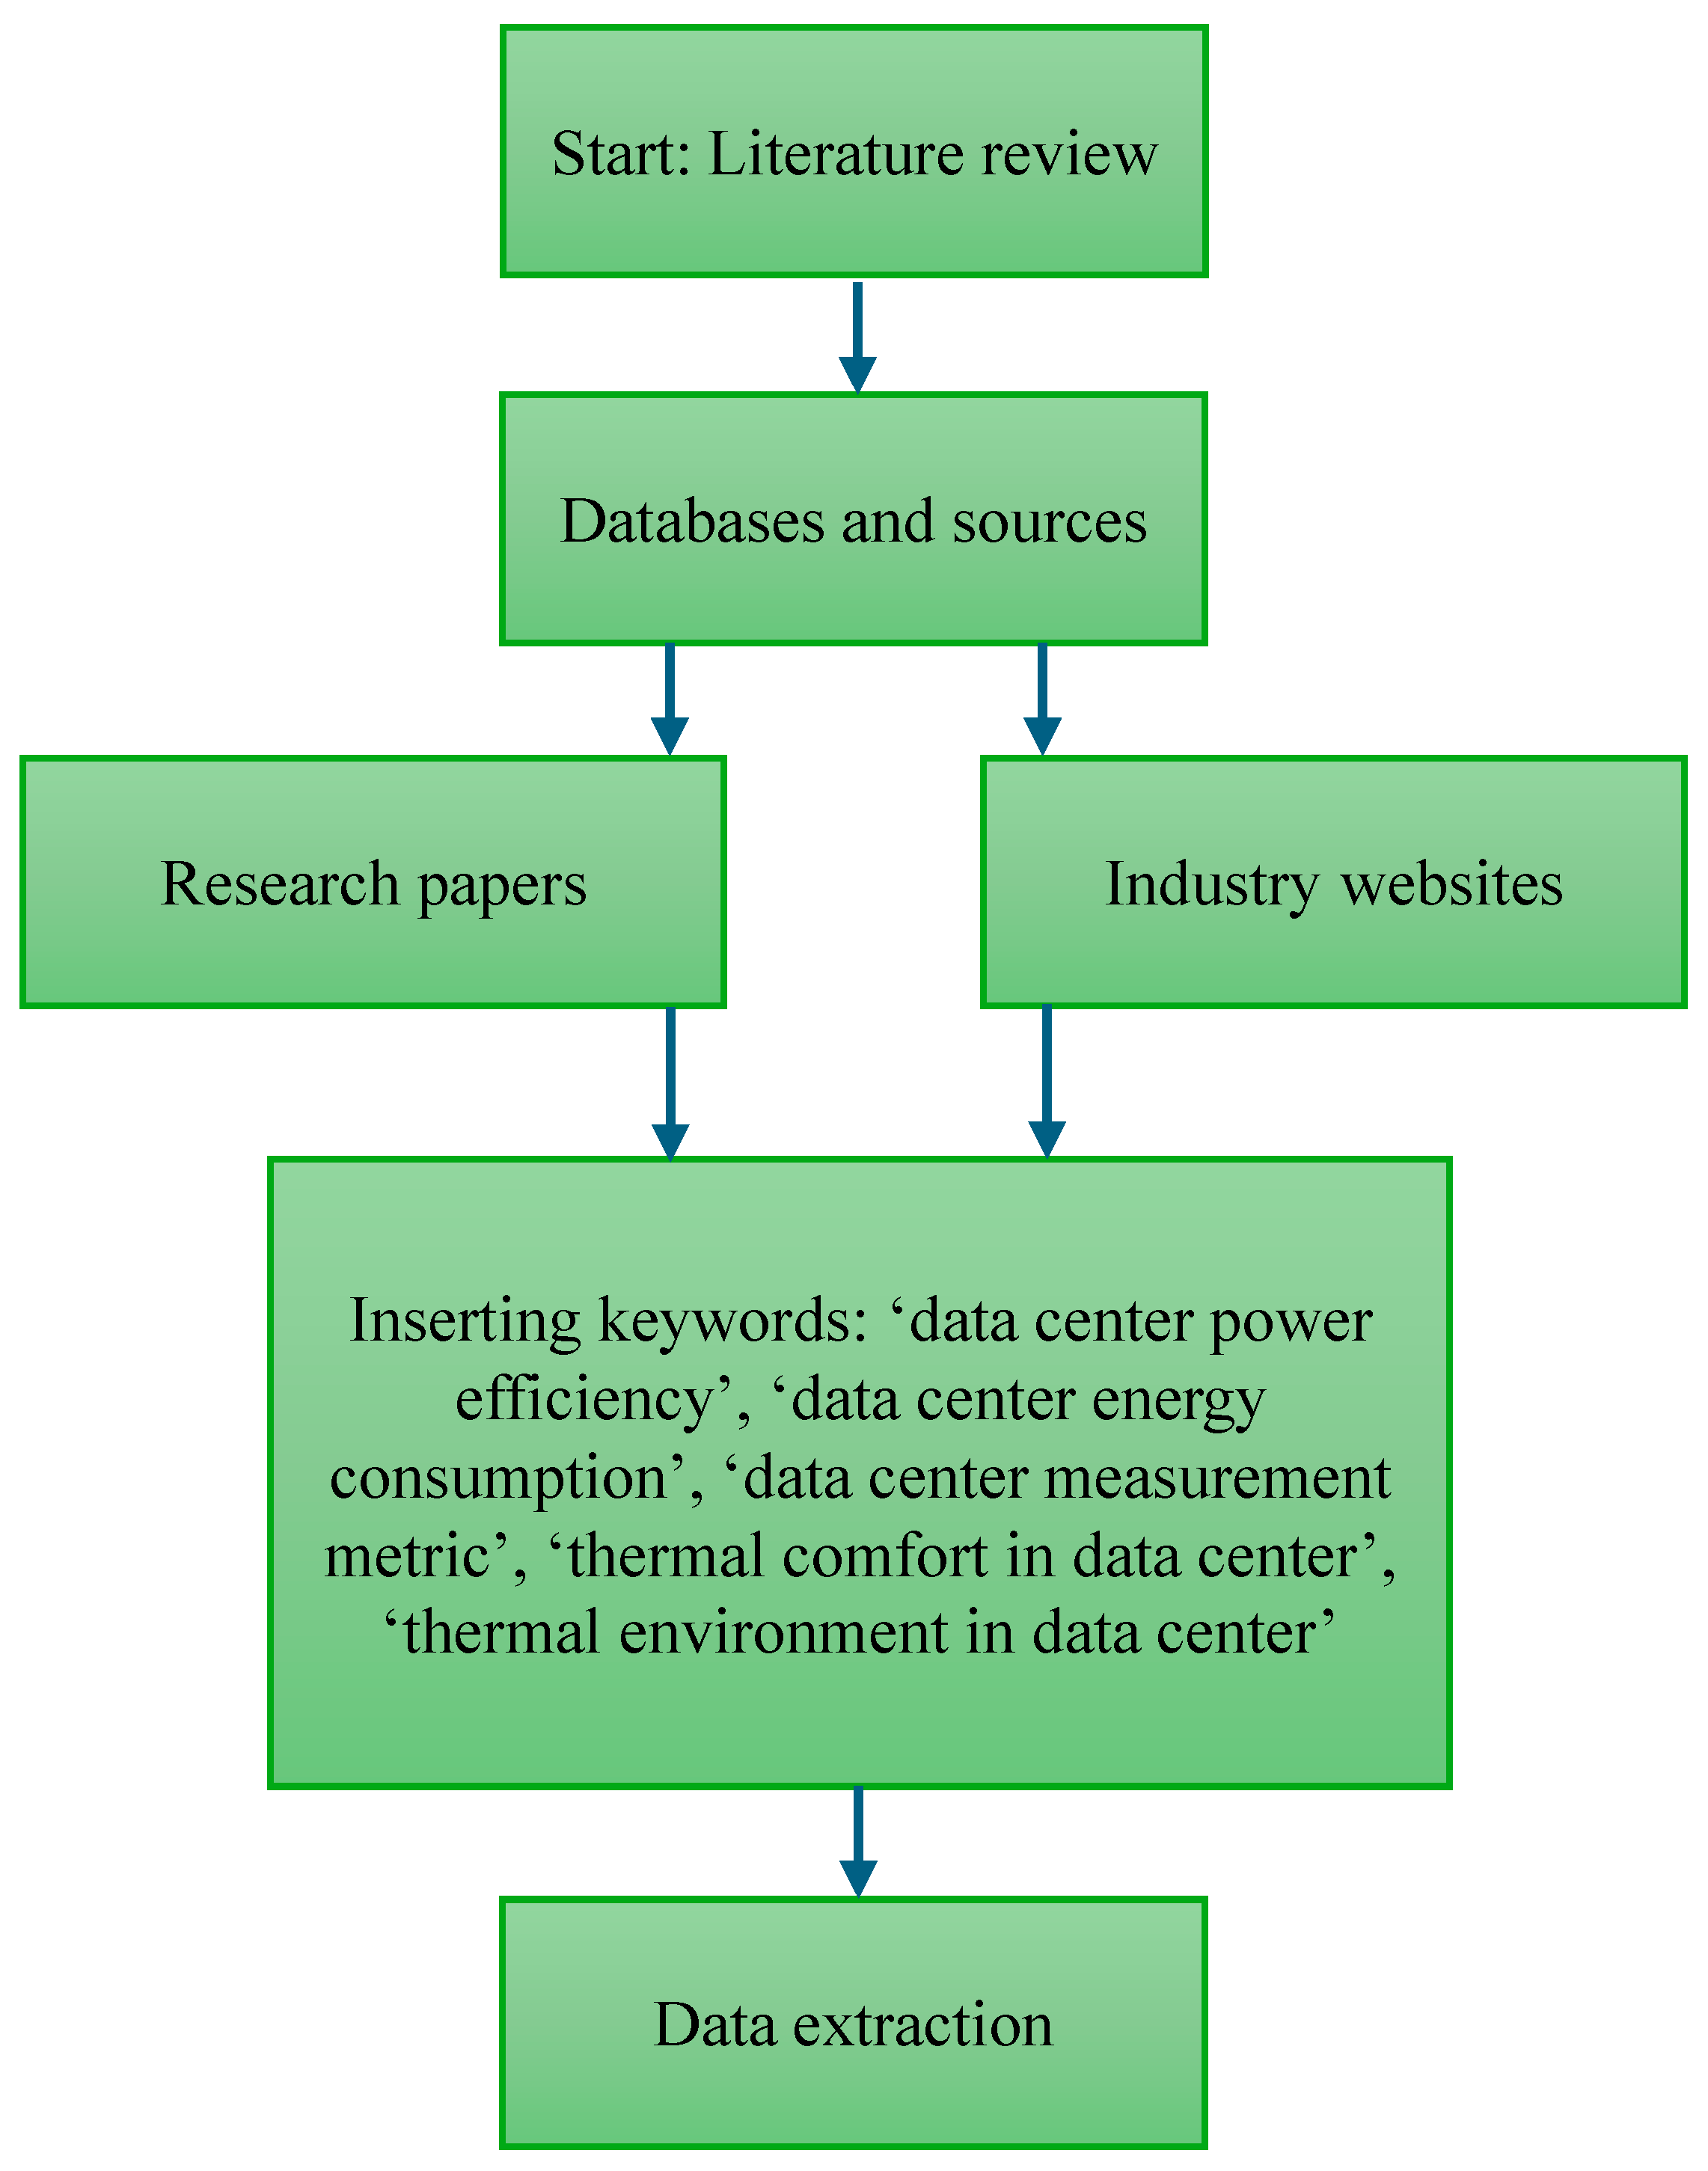
2.1. Process of Literature Review

In this study, a comprehensive literature review was conducted utilizing research papers gathered from Scopus and Google Scholar, as well as various industry websites and reports. Keywords such as “Measurement Metric”, “Data Center Energy Consumption” and “Data Center Energy Efficiency” were used to search for relevant studies, as shown in Figure 1. The inclusion criteria for the literature review focused on studies that provided specific data on power consumption, thermal environment conditions, equations for PUE and DCiE, as well as the impact of data center conditions on employee thermal comfort. Studies were excluded if they lacked relevant data or sufficient methodological detail. Initially, a total of 173 papers and 23 websites were identified as potential sources. Most of the sources featured a topic relevant to this research but lacked similarity in units, making them difficult to include in this research. After systematically screened based on predefined inclusion criteria, 39 papers and 10 websites were selected for full-text review. This selection process ensured that only relevant studies were included in the final analysis.
Once the relevant studies were selected, data extraction focused on data that could be compared to fulfill the objectives of this paper. The power consumption data were categorized based on PUE and DCiE equations, allowing for a standardized comparison across different studies. The data on passive cooling methods in data centers were collected and analyzed in relation to data center classifications to determine the suitability of specific passive cooling techniques for each type. The thermal environment data inside data center facilities were collected and compared with the standards, such as those stipulated by ASHRAE [16]. The data on thermal comfort in data centers were not found, and thus, this paper used data from computer labs. The collected data served as the basis for the findings of this paper.

2.2. Power Efficiency Metric in Data Centers

As data centers grow more complex, the need for standardized methods to evaluate energy efficiency becomes increasingly critical. Brown et al. [17] emphasized that without reliable metrics, managing the energy distribution and identifying inefficiencies are challenging. Effective metrics enable data center operators to systematically assess performance and guide improvements [18]. To assess PUE, data center power consumption is categorized into IT equipment power and facility power, following the methodology outlined by The Green Grid [13]. IT equipment power consists of computing devices, storage systems, network devices and related IT support infrastructure, whereas facility power includes energy used for cooling, power distribution, lighting and other non-IT infrastructure. The total facility power is the sum of IT equipment power and the supporting infrastructure’s energy consumption. If a power source is shared between IT and facility loads, The Green Grid recommends a pro-rata allocation based on the measured usage. After categorizing the data, the data can be inserted into the following Equations (1) and (2), respectively, to measure the PUE and DCiE [18]:
P U E = T o t a l F a c i l i t y P o w e r I T E q u i p m e n t P o w e r
D C i E % = 1 P U E × 100
Based on previous research by Cho et al. [18], a PUE value closer to 1.0 indicates higher efficiency, indicating that most of the consumed energy is used for IT equipment rather than facility power that is not directly related to the servers. Conversely, a higher PUE suggests excessive facility power consumption, highlighting areas for potential optimization. Using these formulae allows data center operators to track energy performance, identify inefficiencies and implement strategies to enhance sustainability. A more detailed classification of power distribution in data centers, including IT and facility equipment categorization, is available in The Green Grid’s PUE White Paper [13], which shows what equipment falls into each category.

2.3. Alternative Metrics to Measure Data Center Power Efficiency

Evaluating the energy efficiency of data centers is essential for understanding their power consumption and improving sustainability. Metrics are typically used to benchmark the energy performance of a single product or system (equipment or facility level) [19]. This becomes increasingly important as resource constraints and energy demands grow [20]. Moreover, reducing data center energy consumption is integral to supporting broader efforts in energy conservation and reducing carbon emissions [21]. Although numerous metrics exist for assessing different aspects of efficiency, PUE and DCiE are widely adopted due to their simplicity, practicality and industry acceptance.
Based on information published by Patterson [22], PUE had already become a widely recognized tool for evaluating data center infrastructure energy efficiency by now. The report also noted the importance of the continued drive for effective use of resources to maximize operational efficiency and reduce environmental impact. Additionally, Patterson [22] introduced two supplementary metrics: carbon usage effectiveness (CUE) and water usage effectiveness (WUE), which were intended to extend sustainability considerations to carbon emissions and water usage. In a subsequent publication, The Green Grid [13] emphasized that PUE, originally introduced in 2007, had since been adopted globally across the industry. Furthermore, they stated that by 2009, collaborative efforts with international organizations had led to a global consensus recognizing PUE as the industry’s preferred metric for evaluating infrastructure efficiency in data centers.
While WUE and CUE offer valuable insights into water usage, carbon emissions and dynamic performance, traditional power efficiency metrics remain foundational for evaluating data centers. These alternative approaches address aspects of efficiency that go beyond power consumption, capturing a broader spectrum of sustainability and operational performance, considering these broader perspectives can help data centers tackle environmental challenges more comprehensively.

3. Results and Discussion

3.1. Energy Usage and Efficiency Measurement in Data Centers

Analyzing energy consumption and efficiency in data centers involves breaking down energy usage into IT equipment power and facility power, following established classification frameworks such as The Green Grid [13]. Understanding this distribution is crucial to identifying inefficiencies and optimizing overall energy performance. By evaluating key metrics such as PUE and examining the thermal environment, valuable insights can be gained into how energy is utilized and where improvements can be made. The data presented in this section include power consumption values that are either directly measured, cited from prior studies or reported as typical data center power consumption. This classification ensures a more comprehensive perspective on energy distribution across different data centers, helping to highlight areas where efficiency can be improved, ultimately contributing to more sustainable data center operations.
To ensure that power consumption data can be correctly applied to the PUE equation, it is crucial to distinguish between IT equipment power and facility power, as categorized by The Green Grid [13]. However, existing studies were found to report power consumption with and without categorization or with a categorization that differed from The Green Grid’s IT and facility power, making it harder to measure using the standardized PUE equation. To address this gap, this study systematically classifies power consumption data from various sources into IT and facility power, primarily following The Green Grid’s framework while incorporating the authors’ judgment when inconsistencies or deviations from standard classifications are encountered. For example, some devices in Table 1, such as the Processor and Network hardware, are specifically mentioned in The Green Grid’s equipment categorization but were put into the IT equipment category following the authors’ judgement. While this approach offers a structured dataset for a more accurate PUE evaluation, ambiguities remain due to vague source descriptions. For example, if a “Power Supply System” serves servers, it is considered IT power, but if it involves uninterruptible power supply (UPS) or power distribution unit (PDU) for facility-wide distribution, it falls under facility power. Similarly, terms like “Power Conversion” and “Other Equipment” lack clear definitions, making classification between IT and facility power difficult. These uncertainties underscore the need for standardized data center energy reporting to clearly distinguish between IT and facility power. By compiling and categorizing the available data, this study provides a clearer framework for evaluating energy efficiency and highlights the importance of improving data clarity in future research and reports.
Table 1 presents a structured categorization of power consumption data from various sources, distinguishing between IT equipment power and facility power. IT equipment, which includes servers, storage and networking devices, accounts for an average of 44.8% of total power usage. In contrast, facility power, comprising cooling systems and other supporting infrastructure, makes up 51.4% of total power usage, primarily due to cooling and power distribution infrastructure. These values vary across sources, as the data include a mix of measured reports from actual facilities, simulation results and estimates of typical data center power usage. Although simulations and estimates may not perfectly reflect real conditions, they offer useful insights into power distribution patterns. This supports more transparent energy efficiency evaluations and underscores the need for consistent, detailed reporting in future studies and industry assessments.
Using 44.8%, which is the average IT equipment power from Table 1, and, for example, if a data center is provided with 100,000 kWh, the PUE value can be calculated using Equation (1):
P U E = 100,000   k W h 100,000   k W h   × 44.8 % = 100,000 44,800 = 2.23
If in reverse, the PUE value is known, and the objective is to find out the IT equipment power percentage, DCiE can be calculated using Equation (2):
D C i E = 1 2.23   ×   100 = 44.8 %
The calculated PUE value based on the data from Table 1 is 2.23, indicating that the energy efficiency of the data center is within the “Average” range, according to the standards defined by The Green Grid [13]. The corresponding DCiE is 44.8%, which reflects the proportion of energy consumed by IT equipment relative to total facility energy. This DCiE value aligns with the IT equipment power usage derived from Table 1. By applying Equations (1) and (2) to the data centers listed in Table 1, the relationship between IT equipment power usage and the PUE value may be better visualized, providing a clearer prediction of energy efficiency across different data center facilities. This comparison highlights the importance of monitoring these metrics to identify the opportunities for improving energy performance and reducing inefficiencies.
By calculating the values for each data center listed in Table 1, the relationship between IT equipment power usage and the PUE value and which efficiency level they belong to, according to Cho et al. [18], can be effectively visualized, as depicted in Figure 2. The graph reveals that as the percentage of power consumed by IT equipment increases, the PUE value decreases, which shows a negative correlation. This indicates that data centers operate more efficiently when a larger portion of the energy is directed toward IT equipment rather than facility power. This means that maximizing IT equipment power usage, relative to the total power consumption, results in better energy efficiency. Notably, none of the analyzed data centers fall within the “Efficient” or “Very efficient” PUE categories, suggesting that there is still room for improvement in optimizing power allocation. Additionally, one data point is positioned near the “Very inefficient” threshold, highlighting the potential risks of poor energy distribution in certain facilities. Such findings underscore the importance of accurately categorizing IT and facility power to assess data center efficiency effectively and guide future energy-saving strategies.
The analysis of power consumption data highlights distinct patterns in how energy is allocated between IT equipment and facility operations. A calculated PUE value of 2.23 indicates that for every unit of energy consumed by IT equipment, an additional 1.23 units are used for facility operations, reflecting the significant energy demand of cooling systems required to maintain optimal thermal conditions. These results underscore the importance of a balanced distribution of power consumption to achieve optimal energy efficiency in data centers. While IT equipment power is essential for core operations, excessive facility power, particularly from cooling systems, can adversely impact overall efficiency. The observed PUE and DCiE values reveal the current state of energy performance and highlight the potential for improvement by reducing facility power consumption. By accurately categorizing power usage and analyzing its distribution, data centers can identify inefficiencies and implement targeted strategies to enhance both energy efficiency and operational sustainability.

3.2. The Role of Data Center Classification in Energy Efficiency Measurement

PUE is widely regarded as the industry standard for assessing energy efficiency in data centers by comparing total facility energy consumption with the energy used by IT equipment [13]. Based on the literature review, two key issues were highlighted concerning energy efficiency in data centers. First, variations in infrastructure across data centers lead to inconsistencies in how IT and facility power are categorized. Second, the existing research rarely, if ever, specifies the data center type in the context of data center studies, limiting the applicability of PUE comparisons. Additionally, minimal analyses are reported on how different data center types align with passive cooling methods, making it unclear which facilities can effectively integrate these strategies. To address these challenges, this section examines these issues and tries to propose a possible approach to improve PUE assessments.

3.2.1. Limitations of PUE Without Data Center Classification

According to the report by Shehabi et al. [27], data centers are categorized into Telco Edge, Commercial Edge, Small and Medium Businesses (SMB), Enterprise Branch, Internal, Communications Service Providers (Comms SPs), Colocation (Small/Medium Scale and Large Scale) and Hyperscale. Hyperscale data centers, designed for large-scale computing, might report significantly lower PUE values compared to smaller facilities. For example, a hyperscale facility may achieve a low PUE by reducing non-essential facility equipment and focusing power allocation on IT equipment, whereas an SMB data center may have a higher PUE due to the presence of additional facility equipment, such as office space utilities and employee workstations. However, this contrast does not necessarily indicate that servers in SMB data centers are operating inefficiently, as the IT equipment power and facility power consumption differ. This distinction highlights the limitations of using PUE as a power efficiency metric, as it does not account for differences in data center types, potentially leading to inconsistencies in its application. To address this issue, this section proposes that future research on data center facilities explicitly specify the data center type. If direct classification is not possible, an effort should be made to analyze and determine how the facility would be categorized.
Another key issue lies in determining how energy consumption is allocated between IT and facility power. For instance, in the data center efficiency model, while only power to the IT load is typically defined as “useful output”, it can be argued that secondary support functions like cooling and lighting should also be considered useful [28]. Furthermore, PUE oversimplifies efficiency assessment by treating all data center elements as uniform, ignoring the specific operational realities that vary even within the same facility, as shown in previous studies [15,18,24,25,26]. Partial PUE (pPUE) has been introduced as an alternative metric to address this issue by focusing on energy use within specific, clearly defined segments of a data center, allowing for more targeted and meaningful efficiency analyses compared to traditional PUE [13]. However, this research proposes a different perspective that is believed to be crucial in data center studies. Specifically, it highlights the need for a more detailed categorization of equipment within the existing IT and facility power classifications. The current framework, such as that provided by The Green Grid [13], does not fully account for the variety of equipment present across different data center types. While this study does not propose a definitive method for such classification, further empirical research and industry collaboration are needed to establish a practical framework that accurately reflects the energy distribution across diverse data center environments. Emphasizing this refinement is essential for improving the accuracy and applicability of energy efficiency assessments.
In summary, these findings highlight two key limitations of PUE as a universal energy efficiency metric: the lack of data center type specification in existing assessments and inconsistencies in how IT and facility power are categorized across different facilities. These challenges make cross-comparisons between data centers difficult and can lead to misleading interpretations of energy efficiency. This paper addresses these issues and proposes that future research explicitly specify data center type in PUE assessments. Additionally, it advocates for updating The Green Grid’s existing equipment categorization standards to provide a more detailed classification that reflects advancements in data center technology. While this study does not propose a new classification framework, it emphasizes the need for refining existing methodologies to improve the reliability and applicability of PUE in future research.

3.2.2. Evaluating Passive Cooling Feasibility Through Data Center Classification

By utilizing natural cold sources, such as ambient air and water, free cooling methods, including airside, waterside and heat-pipe-based systems, offer a viable approach to reducing data center energy consumption [15]. While free cooling offers energy-saving potential, its applicability is limited by factors such as local climate, data center density and cooling requirements, especially in facilities with strict humidity and temperature controls [27]. Given these constraints, selecting an appropriate cooling method requires an evaluation of data center classification, space availability and environmental suitability. The possibility of using a natural resource is not only limited to cooling, as the study by Zhou et al. [29] stated that a rooftop photovoltaic system produces around 370,000 kWh of electricity each year, supplying roughly 8% of the data center’s overall annual energy needs. While this section does not focus on renewable energy, it highlights passive cooling strategies as viable energy-saving approaches. This study proposes specific cooling strategies for different data center types while fact-checking their feasibility using airside free cooling in Hokkaido, Japan [30], and waterside free cooling in Chongqing, China [31]. The former demonstrates the use of outdoor air for direct cooling, while the latter highlights water-based cooling infrastructure for energy efficiency.
The feasibility of passive cooling in data center implementations was examined based on documented studies by Inoue et al. [30] and Mi et al. [31]. Inoue et al. [30] found that airside cooling is more effective in open environments with stable airflow and a sufficiently cold climate, which aligns with the space requirement and geographic constraint categories presented in Table 2. While airflow stability was emphasized, air pollution is another important consideration, as airborne contaminants can increase filter maintenance, reduce cooling efficiency and potentially damage IT equipment.
Mi et al. [31] reported that the cooling towers in their waterside free cooling system operated with water flow rates of up to 755 m3/h, requiring wet-bulb temperatures below 10.4 °C for optimal efficiency. However, implementing towers of this scale in dense urban settings may be impractical due to space limitations and higher ambient temperatures. They also noted that natural water bodies, such as lakes and rivers, could serve as alternative heat sinks, further suggesting that this method is less suitable for urban areas. Based on these findings, Table 2 categorizes passive cooling feasibility by key influencing factors. Airside cooling is linked to data centers with unrestricted airflow and effective ventilation, while waterside cooling is more appropriate for facilities with sufficient building space and access to low-temperature water sources.
Table 3 classifies data center types based on the report by Shehabi et al. [27], which defines their functions, supplemented by the authors’ knowledge and feasibility assessments from Table 2 to evaluate passive cooling applicability. Smaller data centers, including Telco Edge, Commercial Edge, and SMB, are generally not feasible for passive cooling (Energies 18 03689 i001) due to their dense urban locations, higher ambient temperatures, polluted air and space limitations. These facilities are often in mixed-use buildings or small offices, which restricts large-scale cooling infrastructure. Therefore, mechanical cooling is recommended, such as liquid-cooled racks or precision air cooling. Similarly, Enterprise Branch and Internal data centers face constraints that limit passive cooling feasibility, although some waterside cooling (Energies 18 03689 i002 Possible) may be viable if wet-bulb temperatures remain stable, and the space for cooling towers is available. Larger-scale data centers, such as Colocation and Hyperscale, are generally well suited for passive cooling (Energies 18 03689 i003), as they are designed with efficiency in mind rather than being constrained by mixed-use buildings. These facilities are typically built in locations that support passive cooling, benefiting from lower urban heat influence and sufficient space for airflow management, enabling airside economization. Their waterside cooling feasibility depends on location, with some facilities built near natural water sources while others ensuring feasibility by allocating space for cooling towers as part of their infrastructure planning. This classification highlights how facility type and location significantly influence cooling feasibility, reinforcing the need for strategic site selection and infrastructure planning in data center design.
The classification of data centers plays a crucial role in assessing passive cooling feasibility, as facility type and location significantly impact cooling efficiency. Smaller data centers, constrained by urban settings, often require mechanical cooling, while larger facilities like Colocation and Hyperscale data centers are designed for efficiency and can benefit from passive cooling when conditions allow. Future research on passive cooling should clearly specify data center types, as overlooking this factor can lead to misleading PUE assessments. The passive cooling methods suitable for one facility may be ineffective for another, causing confusion when implementing research findings. Ensuring that data center classification is considered will improve research accuracy and provide more practical insights for optimizing passive cooling strategies.

3.3. Thermal Environment in Data Centers

Data centers are major energy consumers, accounting for approximately 2% of global electricity consumption, with nearly 40% of this energy used for cooling systems [32]. As the demand for data center services continues to grow, optimizing energy efficiency has become a critical priority. Improving the cooling efficiency and power management not only reduces operational costs but also mitigates environmental impacts. This section examines the current challenges and advancements in cooling techniques and evaluates their effectiveness in enhancing the overall energy efficiency of data centers.
Table 4 provides valuable insights into the environmental conditions maintained in data centers to ensure operational efficiency. Indoor environmental conditions in data centers vary across regions due to both external climate and operational conditions. ASHRAE [16] has published a standard for the indoor dry-bulb temperature and relative humidity for data center facilities. The temperature standards mentioned are 18 to 27 °C as the recommended range, while the allowable range extends from 15 to 32 °C, depending on the operational class of the data center. The relative humidity is recommended to be maintained at 60%, but it is allowed to range from 20 to 80%.
The indoor conditions in data centers are shaped by both external climate and internal control strategies. The data from Bengkulu, Indonesia [37], show high outdoor heat and humidity (above 30 °C and 70%), which correlate with elevated indoor conditions reaching 33 °C and 68%. Respectively, U.S. facilities [41] maintain stable indoor environments around 20 °C and 50% in correlation with the much cooler, drier outdoor air. This contrast highlights how warmer climates can challenge cooling systems, while cooler regions offer easier environmental control. Compared to the ASHRAE standard, only the U.S. facility stays fully within the recommended range. Indoor temperatures across all the data center sites range from 15 to 34 °C, with humidity from 17 to 68%, ranging beyond ASHRAE’s recommended upper and lower limits. These findings highlight the wide variation in thermal environments across regions, pointing to the need for context-aware climate control strategies that account for both external conditions and system capabilities.
The analysis of environmental conditions in data centers underscores the importance of precise temperature and humidity control for maintaining operational efficiency and equipment reliability. The observed data reveal variability in indoor air conditions, which may be influenced by regional climates and the specific environmental challenges they present. Deviations from ASHRAE’s recommended and allowable ranges highlight potential risks, such as increased energy consumption, equipment degradation and operational instability. Facilities that adhere to these standards are better positioned to reduce such risks and maintain stable operations. By aligning environmental management practices with industry standards and tailoring strategies to regional conditions, data centers can improve energy efficiency, extend equipment longevity and support more sustainable operations.

3.4. Thermal Comfort in Computer Rooms

The service and maintenance requirements of precision cooling systems, which are designed specifically to meet the needs of data center heat loads, are very different compared to those of standard building air conditioning systems, which are designed for occupant comfort [42]. Research on thermal comfort in data centers is notably absent, likely due to this difference in the cooling purpose. Given this gap in the research, data from computer rooms where both human comfort and equipment safety are considered can provide valuable insights into thermal conditions that balance these priorities effectively. This section aims to evaluate these computer room conditions to better understand how data center environments could be adapted to improve employee comfort while maintaining equipment safety.
Table 5 presents the comfort temperature (Tc), relative humidity, predicted mean vote (PMV) and predicted percentage dissatisfied (PPD) in the computer room. The comfort temperature reported by Ismail et al. [43] ranged from 22 to 24 °C, which aligns with findings from Aqilah et al. [44], who reported that the comfort temperatures typically ranged from 22 to 25.9 °C in controlled indoor environments. The PMV values from Ismail et al. [43] ranged from 1.1 to 1.4, exceeding the acceptable thermal comfort range of ±0.5 defined by the ISO standard [45], and above the recommended PMV applicability range of −2 to +2 for temperatures between 10 °C and 30 °C [46]. This indicates that a considerable number of occupants likely experienced thermal discomfort due to warm conditions. The PPD values from Abanto et al. [47] were below 10%, indicating good thermal satisfaction among occupants. This contrasts with findings from hospital environments, where PPD values exceeded 10% in all sections, highlighting greater thermal discomfort due to inadequate HVAC performance [48]. Overall, although the environment was largely perceived as thermally acceptable, the elevated PMV values point to specific areas where thermal conditions could be optimized further, suggesting that targeted adjustments may be necessary to achieve full compliance with comfort standards and ensure consistent occupant satisfaction.
This section highlights the significant lack of research directly addressing employee thermal comfort in data centers, suggesting that such studies are either scarce or non-existent, making it necessary to rely on computer room data instead. However, these data are very limited and lack standardization in terms of metrics and measurement methods, making comparisons across studies difficult. While data centers are primarily designed to prioritize equipment safety, the thermal comfort data presented here provide valuable insights into employee comfort in these settings. These findings may appear less relevant in facilities where employees are not regularly stationed. However, they can still inform small yet impactful changes, such as adjusting employee exposure time to extreme temperature (near hot aisle or cold aisle) or clothing policies. Moreover, given the diversity of data center facility types, some of which may share spaces with offices or other human-centered operations, these insights could be particularly useful. Incorporating such data into facility management practices could help create environments that better balance the needs of both employees and equipment.

4. Conclusions

Summarizing the key findings of this study, several important insights emerge:
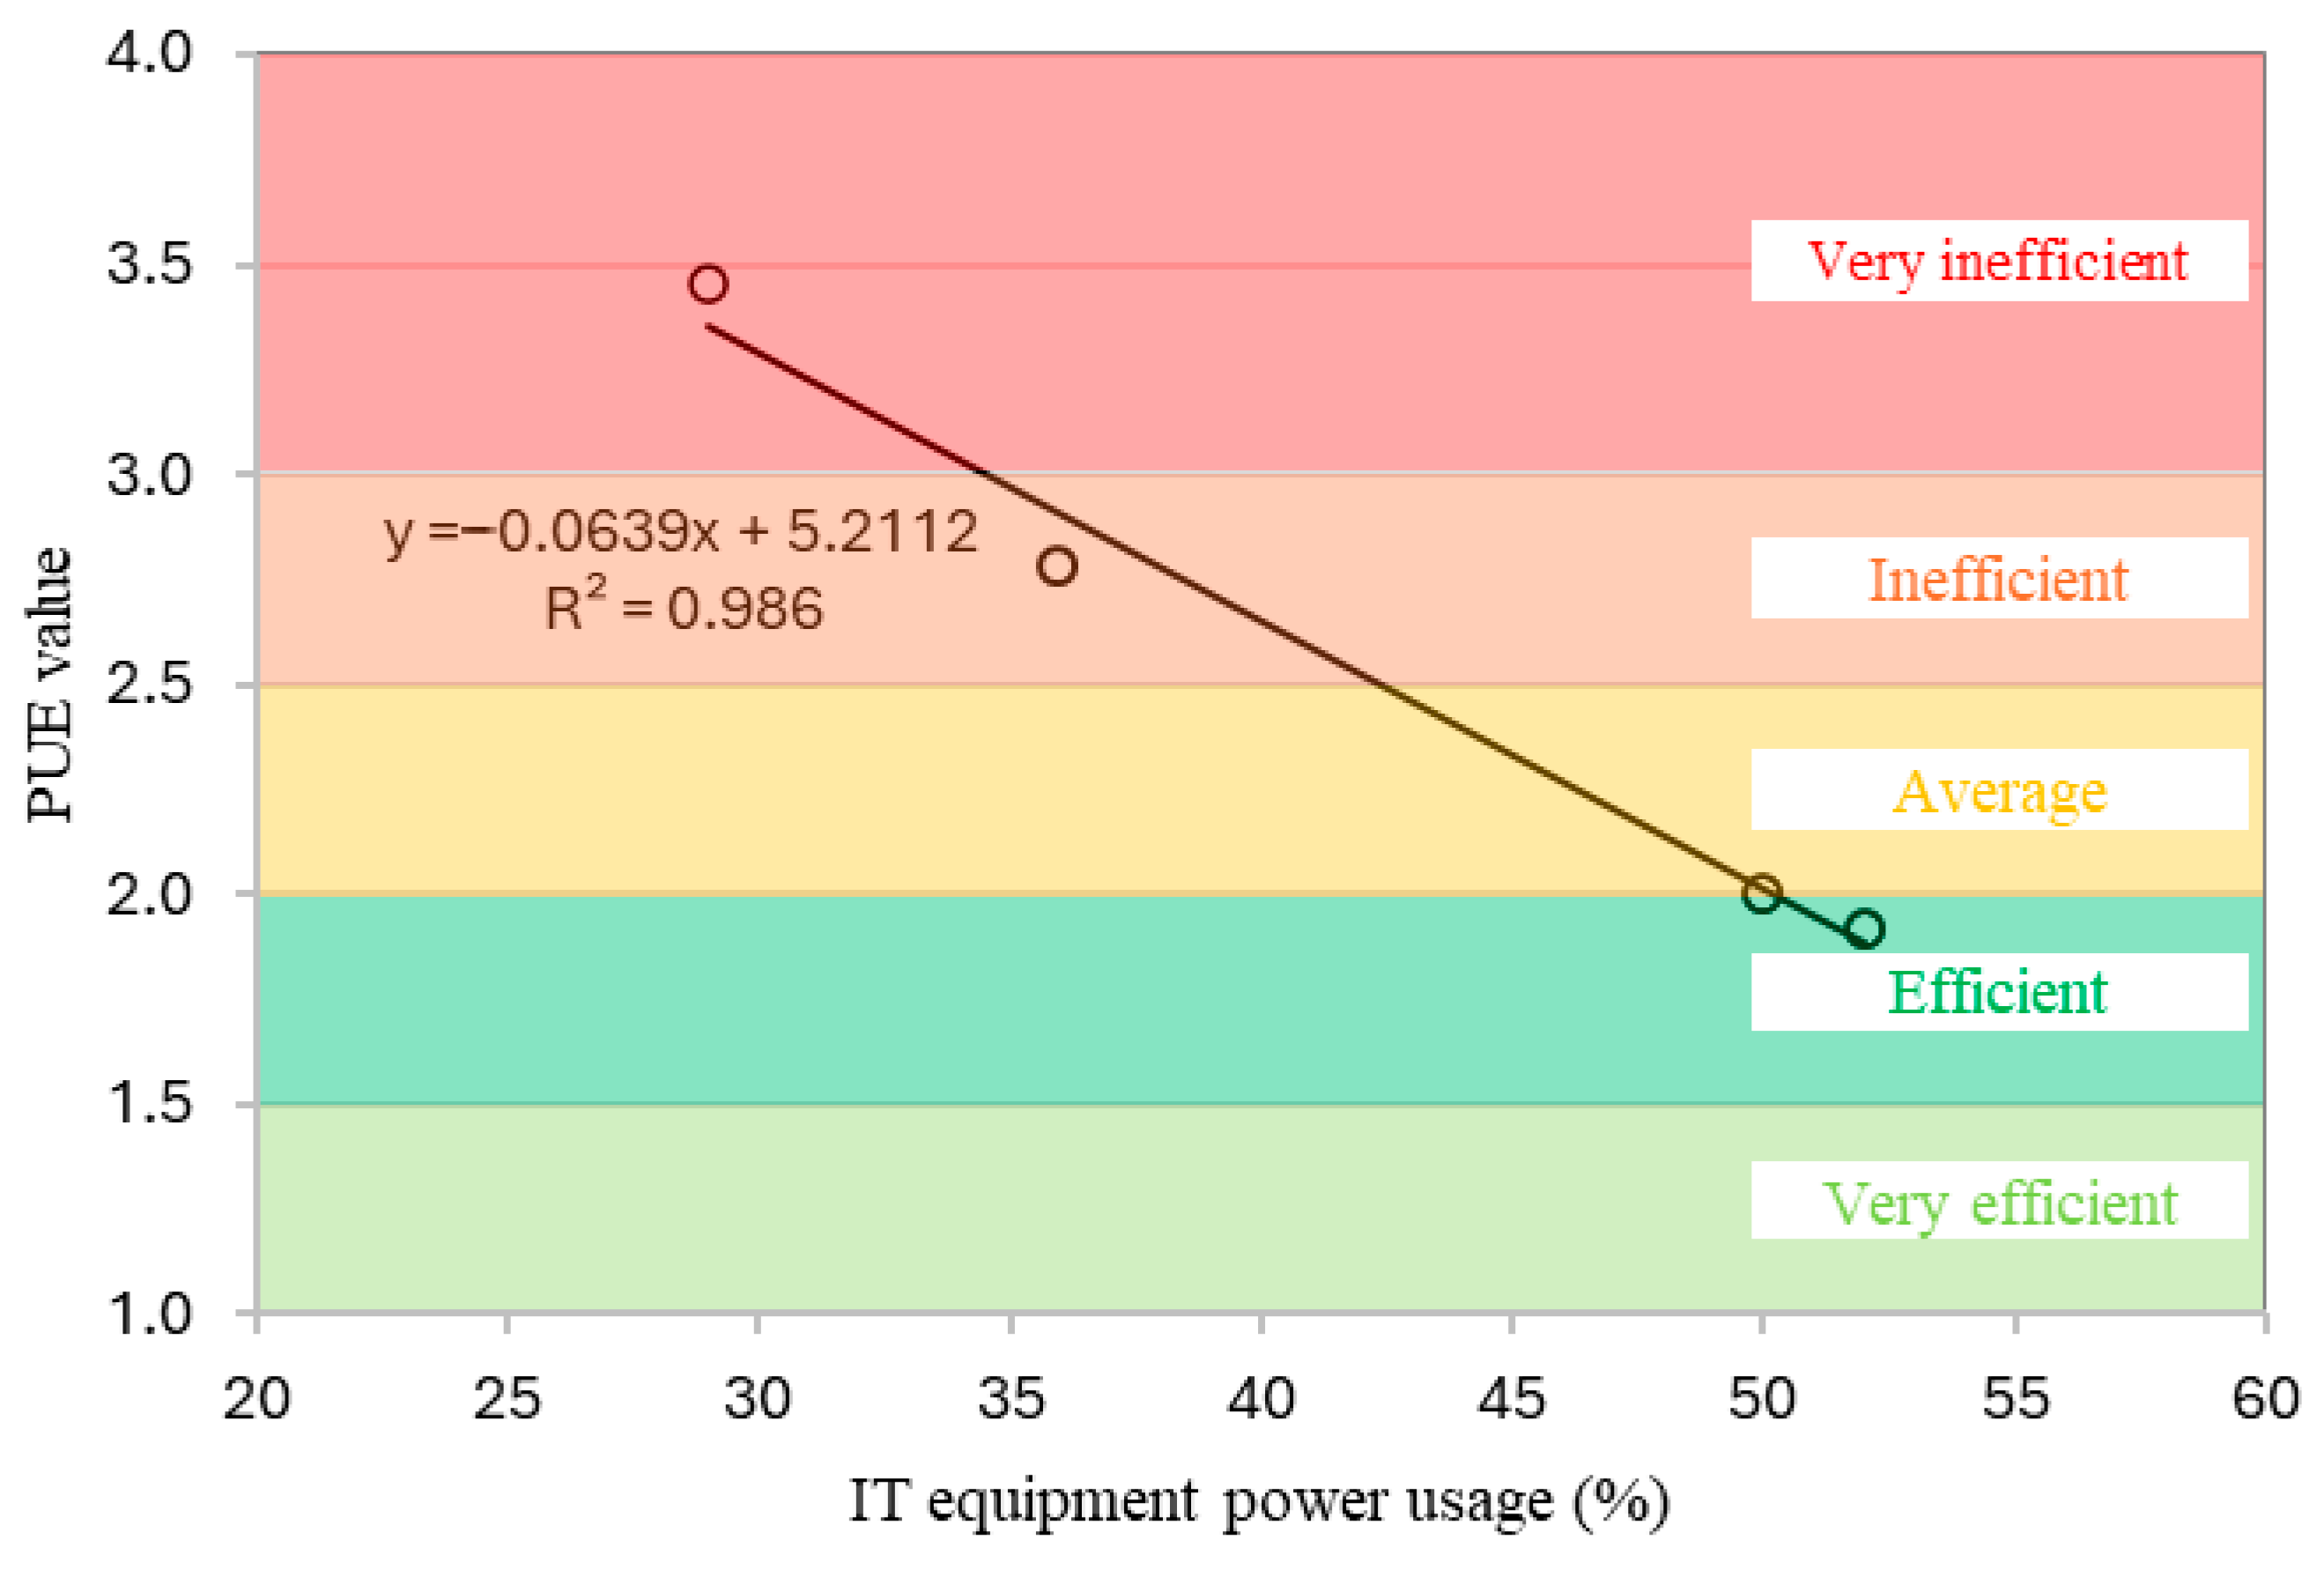
  • The referenced data centers averaged 44.8% for IT equipment power, resulting in a PUE of 2.23, being categorized as “Average” efficiency. These results highlight that there is room for improvement to achieve more efficient data center power usage.
  • Larger-scale data center types, such as hyperscale, are more compatible with passive cooling compared to smaller-scale ones, such as small and medium business data centers. These are related to data center size and location. Smaller data centers are often built near offices, while larger ones are placed in areas suited for passive cooling.
  • Most data centers are already following the ASHRAE thermal guidelines, although many remain in the “allowable range” rather than the “recommended range”. Some facilities even exceed the allowable limits, which may pose risk to the equipment.
  • Thermal comfort research specific to data centers was not found during this study; therefore, data from computer labs, which are unfortunately also limited and not standardized, were used instead. This reflects the lack of attention to the topic and highlights the need for further research. Even if it does not change how data centers operate, standards such as exposure duration or clothing requirements could be adopted instead.
This paper faces several limitations due to the lack of sufficient and comparable data. The studies reviewed use varied sources, including real data centers, simulations and general estimates, which makes direct comparison difficult. No studies were found which clearly specified the type of data center being examined, such as Hyperscale, Colocation or enterprise. However, most applied the same PUE metric. This may be problematic because different data center types likely face distinct on-site challenges that affect energy performance and should be evaluated accordingly. Most notably, no research on thermal comfort or employee safety in data center environments was found. While some studies reference thermal comfort using data from computer rooms, these environments differ significantly in operating conditions from actual data centers, which compromises the validity of such findings. Moreover, the predominance of studies from Asian regions (approximately 80%) introduces geographic bias, limiting the applicability of the results to broader global contexts. These limitations highlight the need for future research specifically targeting thermal comfort in data centers across diverse climates. These limitations do not invalidate the findings but rather emphasize the complexity of the topic and the importance of more targeted and consistent future studies.

Funding

We would like to thank Tokyo City University for providing funding for the Article Processing Charge.

Acknowledgments

The authors would like to express sincere gratitude to the authors of studies cited in this paper, whose work provided valuable insights and foundational knowledge for the development of this research. Their contributions were instrumental in shaping the direction and depth of this study.

Conflicts of Interest

The authors declare no conflict of interest.

References

  1. Jones, N. The information factories: Data centres are chewing up vast amounts of energy—So researchers are trying to make them more efficient. Nature 2018, 561, 163–166. [Google Scholar] [CrossRef] [PubMed]
  2. International Energy Agency (IEA). Energy and AI: World Energy Outlook Special Report; IEA: Paris, France, 2024; Available online: https://www.iea.org/reports/energy-and-ai (accessed on 3 July 2025).
  3. Dayarathna, M.; Wen, Y.; Fan, R. Data center energy consumption modeling: A survey. IEEE Commun. Surv. Tutor. 2015, 18, 732–794. [Google Scholar] [CrossRef]
  4. US Environmental Protection Agency. Report to Congress on Server and Data Center Energy Efficiency: Public Law 109-431; U.S. Environmental Protection Agency: Washington, DC, USA, 2007. [CrossRef]
  5. Thangam, D.; Muniraju, H.; Ramesh, R.R.; Narasimhaiah, R.; Ahamed Khan, N.M.; Booshan, S.; Booshan, B.; Manickam, T.; Sankar, G.R. Impact of data centers on power consumption, climate change, and sustainability. In Sustainability of Data Centers via Energy Mix, Energy Conservation, and Circular Energy; IGI Global: Hershey, PA, USA, 2024. [Google Scholar] [CrossRef]
  6. Vemula, D.; Setz, B.; Rao, S.V.R.K.; Gangadharan, G.R.; Aiello, M. Metrics for sustainable data centers. IEEE Trans. Sustain. Comput. 2017, 2, 290–303. [Google Scholar] [CrossRef]
  7. Kim, J.H.; Shin, D.U.; Kim, H. Data center energy evaluation tool development and analysis of power usage effectiveness with different economizer types in various climate zones. Buildings 2024, 14, 299. [Google Scholar] [CrossRef]
  8. Shao, X.; Zhang, Z.; Song, P.; Feng, Y.; Wang, X. A review of energy efficiency evaluation metrics for data centers. Energy Build. 2022, 271, 112308. [Google Scholar] [CrossRef]
  9. Jaureguialzo, E. PUE: The Green Grid metric for evaluating the energy efficiency in DC (Data Center). In Proceedings of the 2011 IEEE 33rd International Telecommunications Energy Conference (INTELEC), Amsterdam, The Netherlands, 1–8 October 2011. [Google Scholar] [CrossRef]
  10. Beitelmal, A.H.; Fabris, D. Servers and data centers energy performance metrics. Energy Build. 2014, 80, 562–569. [Google Scholar] [CrossRef]
  11. Lajevardi, B.; Haapala, K.R.; Junker, J.F. An energy efficiency metric for data center assessment. In Proceedings of the 2014 Industrial and Systems Engineering Research Conference; Guan, Y., Liao, H., Eds.; Institute of Industrial and Systems Engineers: Montréal, QC, Canada, 2014. [Google Scholar]
  12. Patterson, M.K. The effect of data center temperature on energy efficiency. In Proceedings of the 2008 11th Intersociety Conference on Thermal and Thermomechanical Phenomena in Electronic Systems (ITherm), Orlando, FL, USA, 28–31 May 2008; pp. 1167–1174. [Google Scholar] [CrossRef]
  13. The Green Grid. PUE™: A Comprehensive Examination of the Metric (White Paper #49). The Green Grid Association. 2012. Available online: https://datacenters.lbl.gov/sites/default/files/WP49-PUE%20A%20Comprehensive%20Examination%20of%20the%20Metric_v6.pdf (accessed on 3 March 2025).
  14. Fiandrino, C.; Kliazovich, D.; Bouvry, P.; Zomaya, A.Y. Performance and energy efficiency metrics for communication systems of cloud computing data centers. IEEE Trans. Cloud Comput. 2017, 5, 738–750. [Google Scholar] [CrossRef]
  15. Zhang, Q.; Meng, Z.; Hong, X.; Zhan, Y.; Liu, J.; Dong, J.; Bai, T.; Niu, J.; Deen, M.J. A survey on data center cooling systems: Technology, power consumption modeling and control strategy optimization. J. Syst. Archit. 2021, 119, 102253. [Google Scholar] [CrossRef]
  16. Steinbrecher, R.A.; Schmidt, R. Data center environments: ASHRAE’s evolving thermal guidelines. ASHRAE J. 2011, 53, 42–49. [Google Scholar]
  17. Brown, R.; Masanet, E.; Nordman, B.; Tschudi, B.; Shehabi, A.; Stanley, J.; Koomey, J.; Sartor, D.; Chan, P.; Loper, J.; et al. Report to Congress on Server and Data Center Energy Efficiency: Public Law 109-431; U.S. Environmental Protection Agency: Washington, DC, USA, 2007. Available online: https://www.energystar.gov/ia/partners/prod_development/downloads/EPA_Datacenter_Report_Congress_Final1.pdf (accessed on 22 April 2025).
  18. Cho, J.; Lim, T.; Kim, B.S. Viability of datacenter cooling systems for energy efficiency in temperate or subtropical regions: Case study. Energy Build. 2012, 55, 189–197. [Google Scholar] [CrossRef]
  19. Schaeppi, B.; Bogner, T.; Schloesser, A.; Stobbe, L.; Dias de Asuncao, M. Metrics for Energy Efficiency Assessment in Data Centers and Server Rooms. PrimeEnergyIT Consortium. 2012. Available online: https://www.researchgate.net/publication/261243130_Metrics_for_energy_efficiency_assessment_in_data_centers_and_server_rooms (accessed on 3 July 2025).
  20. Sharma, M.; Arunachalam, K.; Sharma, D. Analyzing the data center efficiency by using PUE to make data centers more energy efficient. Procedia Comput. Sci. 2015, 48, 142–148. [Google Scholar] [CrossRef]
  21. Tong, T.; Yang, X.; Li, J. To boost waste heat harvesting and power generation through a portable heat pipe battery during high-efficient electronics cooling. Appl. Energy 2025, 377, 124397. [Google Scholar] [CrossRef]
  22. Patterson, M. Water Usage Effectiveness (WUE): A Green Grid Data Center Sustainability Metric (White Paper No. 35). The Green Grid. 2011. Available online: https://airatwork.com/wp-content/uploads/The-Green-Grid-White-Paper-35-WUE-Usage-Guidelines.pdf (accessed on 3 July 2025).
  23. Yaqi, W.; Baochuan, F.; Zhengtian, W.; Shuang, G. A review on energy-efficient technology in large data center. In Proceedings of the 30th Chinese Control and Decision Conference (CCDC), Shenyang, China, 9–11 June 2018; pp. 5109–5114. [Google Scholar]
  24. Info-Tech Research Group. Top 10 Energy-Saving Tips for a Greener Data Center. Info-Tech. 2007. Available online: https://www.yumpu.com/en/document/read/40017537/top-10-energy-saving-tips-for-a-greener-data-center-info-tech- (accessed on 3 July 2025).
  25. Karlsson, J.F.; Moshfegh, B. Investigation of indoor climate and power usage in a data center. Energy Build. 2005, 37, 897–902. [Google Scholar] [CrossRef]
  26. Ahuja, N.; Rego, C.W.; Ahuja, S.; Zhou, S.; Shrivastava, S. Real-time monitoring and availability of server airflow for efficient data center cooling. In Proceedings of the 29th IEEE SEMI-THERM Symposium, San Jose, CA, USA, 17–21 March 2013; pp. 1–5. [Google Scholar] [CrossRef]
  27. Shehabi, A.; Smith, S.J.; Hubbard, A.; Newkirk, A.; Lei, N.; Siddik, M.A.B.; Holecek, B.; Koomey, J.; Masanet, E.; Sartor, D. United States Data Center Energy Usage Report; LBNL-2001637; Lawrence Berkeley National Laboratory: Berkeley, CA, USA, 2024.
  28. Rasmussen, N. Electrical Efficiency Modeling for Data Centers. American Power Conversion (White Paper 113, Rev. 1). 2007. Available online: https://www.biblioite.ethz.ch/downloads/nran-66ck3d_r1_en.pdf (accessed on 3 July 2025).
  29. Zhou, C.; Hu, Y.; Liu, R.; Liu, Y.; Wang, M.; Luo, H.; Tian, Z. Energy performance study of a data center combined cooling system integrated with heat storage and waste heat recovery system. Buildings 2025, 15, 326. [Google Scholar] [CrossRef]
  30. Inoue, Y.; Hayama, H.; Mori, T.; Kikuta, K.; Toyohara, N. Analysis of cooling characteristics in datacenter using outdoor air cooling. In Proceedings of the IEEE 9th International Conference on Industrial Electronics and Applications (ICIEA), Hangzhou, China, 9–11 June 2014; Available online: https://www.researchgate.net/publication/281191844_Analysis_of_Cooling_Characteristics_in_Datacenter_Using_Outdoor_Air_Cooling (accessed on 3 July 2025).
  31. Mi, R.; Bai, X.; Xu, X.; Ren, F. Energy performance evaluation in a data center with water-side free cooling. Energy Build. 2023, 295, 113278. [Google Scholar] [CrossRef]
  32. Khalaj, A.H.; Halgamuge, S.K. A review on efficient thermal management of air- and liquid-cooled data centers: From chip to the cooling system. Appl. Energy 2017, 205, 1165–1188. [Google Scholar] [CrossRef]
  33. Time and Date. Past Weather in Bengkulu, Bengkulu, Indonesia—Yesterday or Further Back. Available online: https://www.timeanddate.com/weather/indonesia/bengkulu/historic (accessed on 1 May 2025).
  34. Weather Spark. Medan Weather in February 2018. Available online: https://weatherspark.com/h/y/112741/2018/Historical-Weather-during-2018-in-Medan-Indonesia (accessed on 3 July 2025).
  35. Weather Spark. Jakarta Weather in May 2018. Available online: https://weatherspark.com/h/m/116847/2018/5/Historical-Weather-in-May-2018-in-Jakarta-Indonesia (accessed on 3 July 2025).
  36. National Centers for Environmental Information (NCEI). Climate Data Online (CDO). National Oceanic and Atmospheric Administration (NOAA). Available online: https://www.ncei.noaa.gov/access/past-weather/oakland (accessed on 2 May 2025).
  37. Purwanto, F.H.; Utami, E.; Pramono, E. Implementation and optimization of server room temperature and humidity control system using fuzzy logic based on microcontroller. J. Phys. Conf. Ser. 2018, 1140, 012050. [Google Scholar] [CrossRef]
  38. Nasution, T.; Muchtar, M.A.; Seniman, S.; Siregar, I. Monitoring temperature and humidity of server room using Lattepanda and ThingSpeak. J. Phys. Conf. Ser. 2019, 1235, 012068. [Google Scholar] [CrossRef]
  39. Arifin, J.; Herryawan, P.; Gultom, B. Deteksi suhu ruang server dan penggerak kipas berbasis Arduino Uno dengan report SMS. Electrician 2019, 12, 2079. [Google Scholar] [CrossRef]
  40. Peng, W.Z.; Ning, S.; Li, S.; Sun, F.; Yang, K.C.; Westerdahl, D.; Louie, P.K.K. Impact analysis of temperature and humidity conditions on electrochemical sensor response in ambient air quality monitoring. Sensors 2018, 18, 59. [Google Scholar] [CrossRef]
  41. Shehabi, A.; Tschudi, W.; Gadgil, A. Data Center Economizer Contamination and Humidity Study; Lawrence Berkeley National Laboratory: Berkeley, CA, USA, 2007. Available online: https://escholarship.org/uc/item/8fm831xf (accessed on 26 May 2025).
  42. Vertiv Co. Data Center Precision Cooling: The Need for a Higher Level of Service Expertise. White Paper SL-24642. 2017. Available online: https://www.vertiv.com/48ea67/globalassets/services/services/preventive-maintenance/thermal-preventive-maintenance/vertiv-data-center-precision-cooling-wp-en-na-sl-24642_n.pdf (accessed on 3 July 2025).
  43. Ismail, A.R.; Jusoh, N.; Ibrahim, M.H.M.; Panior, K.N.; Zin, M.Z.M.; Hussain, M.A.; Makhtar, N.K. Thermal comfort assessment in computer lab: A case study at Ungku Omar Polytechnic Malaysia. In Proceedings of the National Conference in Mechanical Engineering Research and Postgraduate Students (NCMER), Kuantan, Malaysia, 26–27 May 2010; pp. 408–416. Available online: https://www.researchgate.net/profile/Mm-Noor/publication/257025553_42_NCMER_056 (accessed on 3 July 2025).
  44. Aqilah, N.; Rijal, H.B.; Zaki, S.A. A review of thermal comfort in residential buildings: Comfort threads and energy saving potential. Energies 2022, 15, 9012. [Google Scholar] [CrossRef]
  45. ISO 7730; Ergonomics of the Thermal Environment—Analytical Determination and Interpretation of Thermal Comfort Using Calculation of the PMV and PPD Indices and Local Thermal Comfort Criteria. ISO: Geneva, Switzerland, 2005.
  46. Fang, Z.; Feng, X.; Lin, Z. Investigation of PMV model for evaluation of the outdoor thermal comfort. Procedia Eng. 2017, 205, 2457–2462. [Google Scholar] [CrossRef]
  47. Abanto, J.; Barrero, D.; Reggio, M.; Ozell, B. Airflow modelling in a computer room. Build. Environ. 2004, 39, 1393–1402. [Google Scholar] [CrossRef]
  48. Pourshaghaghy, A.; Omidvari, M. Examination of thermal comfort in a hospital using PMV–PPD model. Appl. Ergon. 2012, 43, 1089–1095. [Google Scholar] [CrossRef]
  49. Telejko, M. Attempt to improve indoor air quality in computer laboratories. Procedia Eng. 2017, 172, 1154–1160. [Google Scholar] [CrossRef]
Figure 1. Research framework for literature selection and data extraction of data center energy efficiency studies.
Energies 18 03689 g001
Figure 2. Relationship between PUE values and IT equipment power adapted from Table 1, calculated using Equations (1) and (2), respectively.
Energies 18 03689 g002
Table 1. Summary of data center equipment power usage from previous studies with authors’ classification into IT and facility power based on PUE guidelines.
ReferencesData TypeEquipmentPower Consumption (%)
Equipment
Usage
PUE Categorization
Usage
Cho et al. [18] Identified as typical data center power consumption in their studyProcessor15IT equipment power52
Communication equipment4
Storage4
Server power supply14
Other server15
Power distribution units (PDUs)1Facility power48
Cooling38
Switchgear3
Lighting system1
Uninterruptable power supply (UPS)5
Yaqi et al. [23] Referred to as data from an EYP report (source not given)IT equipment50IT equipment power50
Power supply system10Facility power50
Lighting system3
Room cooling system25
Ventilation and humidification system12
Info-tech [24] Identified as typical data center power consumption in their studyNetwork hardware10IT equipment power36
Server and storage26
Power conversion11Facility power64
Cooling50
Lighting system3
Karlsson and Moshfegh [25] Measured data (Linköping, Sweden)Computer equipment29IT equipment power29
Central chiller plant34Facility power71
Computer room air conditioner unit37
Zhang et al. [15] Identified as typical data center power consumption in their studyInformation and communication technology (ICT)50IT equipment power50
Lighting3Facility power50
Uninterruptible power supply (UPS) and energy transformation10
Chiller14
Fans12
Other equipment11
Ahuja et al. [26] Simulation resultIT equipment52IT equipment power52
Chiller system22Facility power48
Computer room air conditioner11
Other15
Average IT equipment power44.8
Facility power51.2
Table 2. Summary of passive cooling implementations in real-world data centers, suggesting the influences of climate, space and environmental conditions on feasibility.
References Location of Data CenterCooling MethodClimate SuitabilitySpace RequirementGeographic Constraints
Inoue et al. [30]Hokkaido, JapanAirside free coolingCold climates required (e.g., Hokkaido)Large open spaces for airflow stabilizationShould not be near urban pollution sources
Mi et al. [31]Chongqing, China Waterside
free cooling
Moderate-to-humid climatesRequires cooling towersNeeds access to a stable water source (e.g., cooling towers)
Table 3. Classification of data center types and assessment of passive cooling feasibility informed by spatial, environmental and infrastructure considerations.
Data Center Type [27]Available Space *Typical Location *Cooling Load/Density *Airside Free Cooling + [30]Waterside Free Cooling + [31]Recommended Cooling Method *
Telco EdgeVery limitedDense urban areasHighEnergies 18 03689 i001 Not feasible—Small footprint, high IT density limits airflow cooling.Energies 18 03689 i001 Not feasible—No space for cooling towers.Use liquid-cooled racks or direct expansion (DX) cooling.
Commercial EdgeSmall–mediumOffice buildings, urbanHighEnergies 18 03689 i001 Not feasible—Restricted airflow makes passive cooling ineffective.Energies 18 03689 i001 Not feasible—Lacks the required water cooling infrastructure.Adopt precision air cooling or closed-loop liquid cooling.
Small and Medium Business (SMB)LimitedUrban/suburbanModerate–highEnergies 18 03689 i001 Not feasible—Limited space for airflow management.Energies 18 03689 i002 Possible—Can work if wet-bulb temperature remains stable.Consider small-scale waterside economizer with a backup chiller.
Enterprise BranchModerateMixed (urban/suburban)ModerateEnergies 18 03689 i001 Not feasible—Airflow constraints limit cooling efficiency.Energies 18 03689 i002 Possible—Needs dedicated space for cooling towers.Install compact cooling towers with a hybrid chiller system.
InternalModerateOffice campusesModerate–highEnergies 18 03689 i001 Not feasible—Typically located inside buildings, restricting outdoor air use.Energies 18 03689 i002 Possible—Works if wet-bulb temperature allows effective cooling tower placement.Use high-efficiency air-cooled systems or waterside economizers.
Communications Service Providers (Comms SPs)Moderate–largeRegional data hubsHighEnergies 18 03689 i001 Not feasible—High IT density requires active cooling methods.Energies 18 03689 i002 Possible—Requires reliable water resources and infrastructure.Hybrid cooling with mechanical support for peak loads.
Colocation—Small/MedAvailableMixed (suburban/regional)ModerateEnergies 18 03689 i003 Ideal—Large space and moderate IT load allow effective free cooling.Energies 18 03689 i003 Ideal—Designed with infrastructure for water cooling.Prioritize free cooling via airside and waterside economizers.
Colocation—LargeLargeRegional/remoteHighEnergies 18 03689 i003 Ideal—Ample space, cooler regions support passive cooling.Energies 18 03689 i003 Ideal—Built with large-scale water cooling systems.Use optimized airside cooling and large-scale waterside economizers.
HyperscaleVery largeRemote, optimized for coolingVery highEnergies 18 03689 i003 Ideal—Maximized efficiency in cold regions with large airflow management.Energies 18 03689 i002 Possible—Requires strict water temperature control for efficiency.Hybrid cooling strategy combining air and advanced liquid cooling.
*: Based on the authors’ understanding. +: Interpretation by the authors, derived from but not directly quoted from the source.
Table 4. Measured indoor and outdoor temperature and humidity conditions in data centers across different geographic regions.
ReferencesData Center LocationAir Temperature (°C)Relative Humidity (%)
RoomOutside [33,34,35,36]RoomOutside [33,34,35,36]
Min.Avg.Max.Min.Avg.Max.Min.Avg.Max.Min.Avg.Max.
Purwanto et al. [37]Bengkulu, Indonesia23.028.0 *33.024.027.030.04657 *687077 *85
Nasution et al. [38]Medan, Indonesia15.016.5 *18.024.027.531.01819 *20---
Arifin et al. [39]Jakarta, Indonesia19.523.9 *28.425.028.3 *32.0---658398
Peng et al. [40]Hong Kong, China15.024.5 *34.017.020.5 *24.01732 *485474 *95
Shehabi et al. [41]Oakland, USA18.319.7 *21.110.017.0 *24.04047 *55---
*: Calculated by the authors.
Table 5. Recorded thermal comfort and air quality parameters in computer lab settings, serving as reference data for data center environmental conditions.
ReferenceLocation TypeAir Temperature (°C)Relative Humidity (%)Tc (°C)PMVPPD (%)
Min.Avg.Max.Min.Avg.Max.
Ismail et al. [43]Computer lab--30.04050 *6020–241.1–1.4-
Telejko [49]Computer lab26.828.2 *29.64952 *55Exceeding the recommended temperature when occupied--
Abanto et al. [47]Computer room16.818.3 *19.8--46In line with thermal standard-<10
*: Calculated by the authors, Tc: Comfort temperature, PMV: Predicted mean vote, PPD: Predicted percentage of dissatisfied.
Disclaimer/Publisher’s Note: The statements, opinions and data contained in all publications are solely those of the individual author(s) and contributor(s) and not of MDPI and/or the editor(s). MDPI and/or the editor(s) disclaim responsibility for any injury to people or property resulting from any ideas, methods, instructions or products referred to in the content.

