Article

Gas Void Morphology and Distribution in Solidified Pure Paraffin Within a Cubic Thermal Energy Storage Unit

School of Energy Science and Engineering, Central South University, Changsha 410083, China
*
Author to whom correspondence should be addressed.
Energies 2025, 18(14), 3686; https://doi.org/10.3390/en18143686
Submission received: 4 May 2025 / Revised: 9 July 2025 / Accepted: 10 July 2025 / Published: 12 July 2025

Abstract

Gas voids inevitably form during the solidification of phase change materials (PCMs) due to volumetric contraction and thus deteriorate the thermal conductivity of solidified PCMs. In this work, the gas void morphology and distribution in solidified pure paraffin within a cubic thermal energy storage unit are experimentally studied. The three-dimensional structure of the solidified pure paraffin is reconstructed via computed tomography (CT) scanning with a resolution of up to 25 µm. Four distinct morphological types of gas voids are found, including irregular elliptical gas voids, elongated “needle-like” gas voids, micro gas voids, and large circular gas voids. The formation mechanisms of each type are analyzed. The morphology and distribution of gas voids indicate that the solidified pure paraffin structure is anisotropic. The effective thermal conductivity (ETC) of this solid–gas structure is numerically evaluated using lattice Boltzmann simulations, and a two-term power equation is fitted. The results show that the ETC in the vertical direction is significantly lower than in the horizontal direction and the ETC could be reduced by as much as 31.5% due to the presence of gas voids.

1. Introduction

PCMs are widely used in both industrial production and daily life, including in thermal energy storage systems [1,2,3], thermal management of electronic devices [4,5], and the design of comfortable, energy-efficient buildings [6,7,8,9]. The low thermal conductivity of PCMs poses a significant limitation to their efficiency in thermal energy storage and release in practice [10]. As a result, extensive research has been conducted in recent years to enhance the thermal conductivity of PCMs, and significant progress has been achieved. Notable advancements include incorporating fins into PCMs [11,12,13,14], compositing metal foams with PCMs [15,16,17,18], and injecting nanoparticles into PCMs [19,20,21]. Zhang et al. [22] numerically studied the effects of fin length and tilt angle on the PCM melting process via two-dimensional modeling. The results show that longer fins and appropriate tilt angles can significantly accelerate the melting of PCM. Zhang et al. [23] mixed long continuous carbon fibers and PCM through pressure induction and vacuum treatment to produce composite PCM with anisotropic thermal conductivity, and further found that the composite PCM has excellent solar thermal energy collection and storage performance. Soltani et al. [24] optimized the thermal performance of a phase change energy storage system by increasing the heat transfer area through the incorporation of fins, enhancing natural convection with a rotation mechanism, and improving the thermal conductivity of PCM by injecting copper nanoparticles. The combination of these approaches has a significant effect on the performance improvement of the phase change energy storage system during both the heat storage and release processes. It is important to note that the solid and liquid phases of PCMs typically exhibit a significant difference in density, leading to the inevitable formation of gas voids during the solidification process. These gas voids deteriorate the thermal conductivity of PCMs, yet they are often overlooked in most previous studies.
As early as the 1980s, the inevitable formation of gas voids within the phase change unit/capsule upon PCM solidification was documented [25], sparking initial related investigations. These early studies primarily focused on the direct observation and qualitative characterization of gas voids [26,27,28,29,30]. For example, Revankar and Croy [30] visually observed and investigated void formation phenomena in transparent capsules with various geometries. The void growth and distribution within the capsule were photographically studied, and the effects of the capsule’s shape and size were analyzed. In recent years, a few researchers have also noticed the formation of gas voids during solidification [16,31,32,33,34,35,36,37,38]. Gao et al. [37] visualized the paraffin phase transition process in a spherical container and found that the material shrinkage in solidification leads to the formation of significant gas voids. These gas voids further trigger a unique floating phenomenon in the unconstrained melting process of paraffin within the spherical container. Liu et al. [38] proposed continuously compensating for volume shrinkage through excess liquid PCM in the tube and then recording the drop height to evaluate the volume shrinkage. However, specific and quantitative studies focusing on the morphology and distribution of gas voids, as well as their impact on the thermal conductivity of PCMs, remain scarce and limited.
This work focuses on an experimental study of the morphology and distribution of gas voids in pure paraffin (as a widely used PCM) after solidification within a cubic thermal energy storage unit. The three-dimensional structure of the solidified pure paraffin is successfully obtained with a resolution of up to 25 µm, to our knowledge, for the first time. Four distinct morphological types of gas voids are found, and the formation mechanisms of different gas voids are analyzed. Based on the experimental results, a numerical study of the impact of gas voids on thermal conductivity was further performed. An empirical equation is proposed for the effective thermal conductivity (ETC) of the solidified structure with gas voids. This work provides a theoretical basis and empirical support for improving the performance of thermal energy storage systems using PCMs in practical applications.

2. Methods

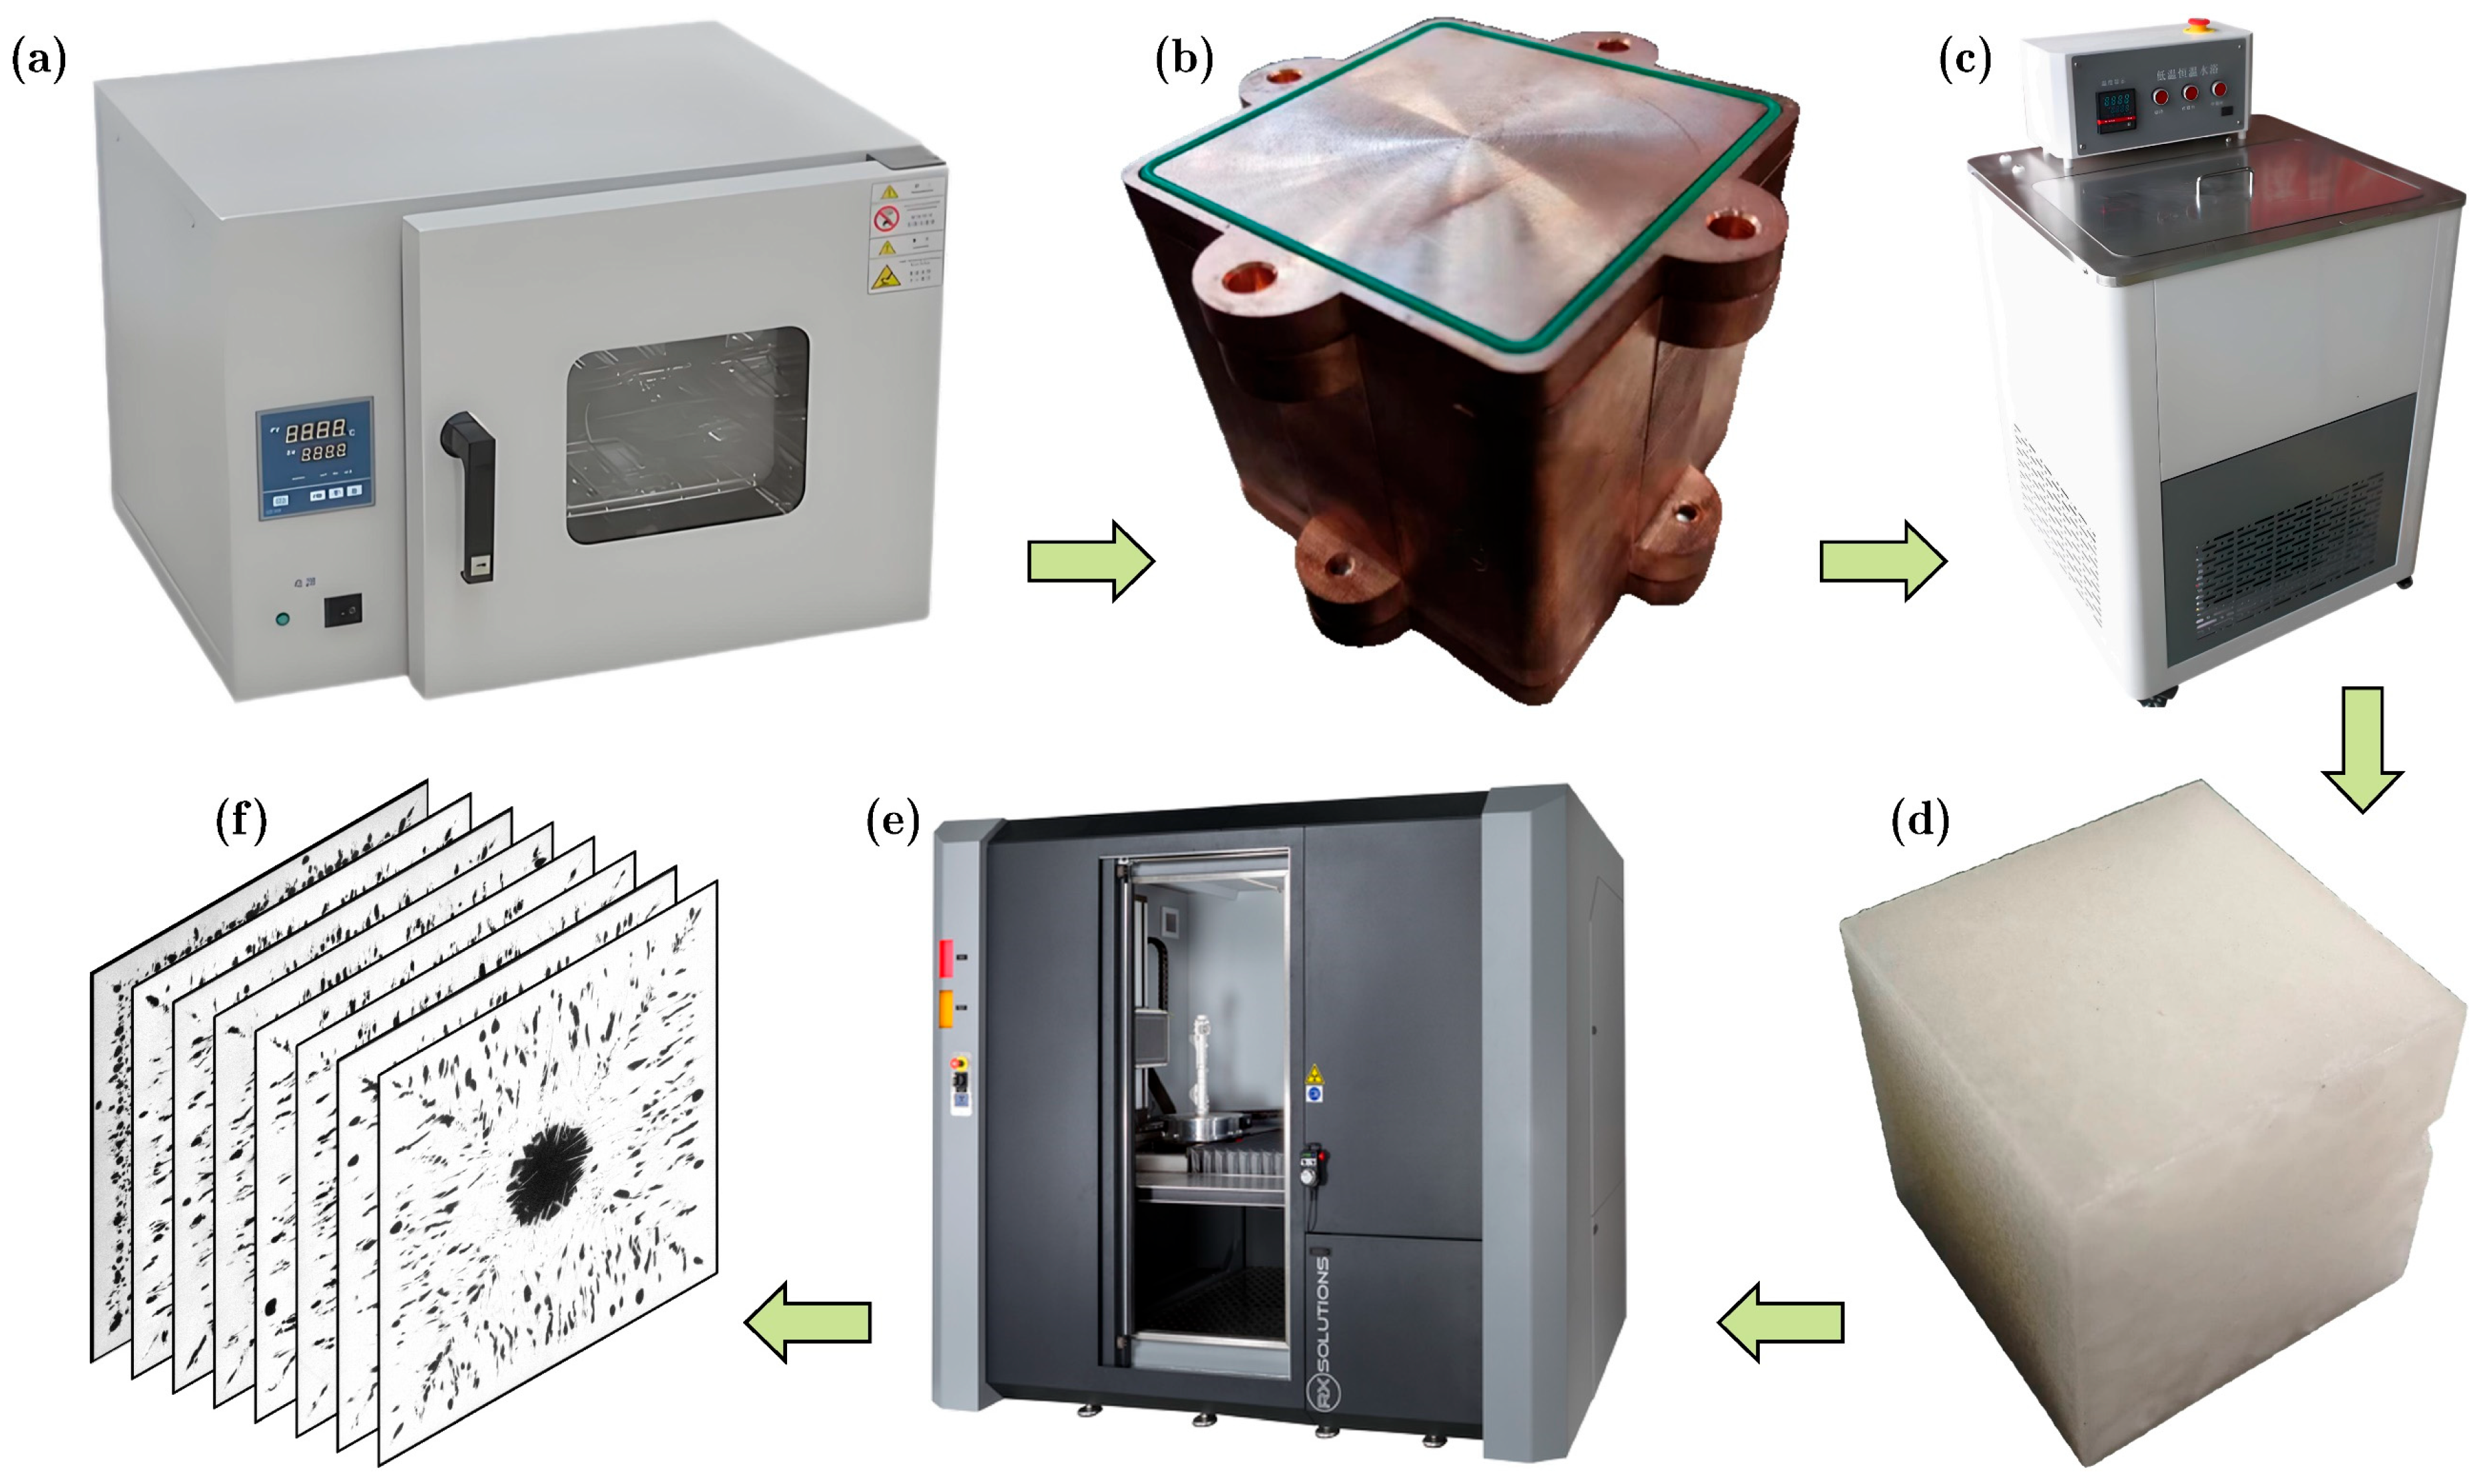
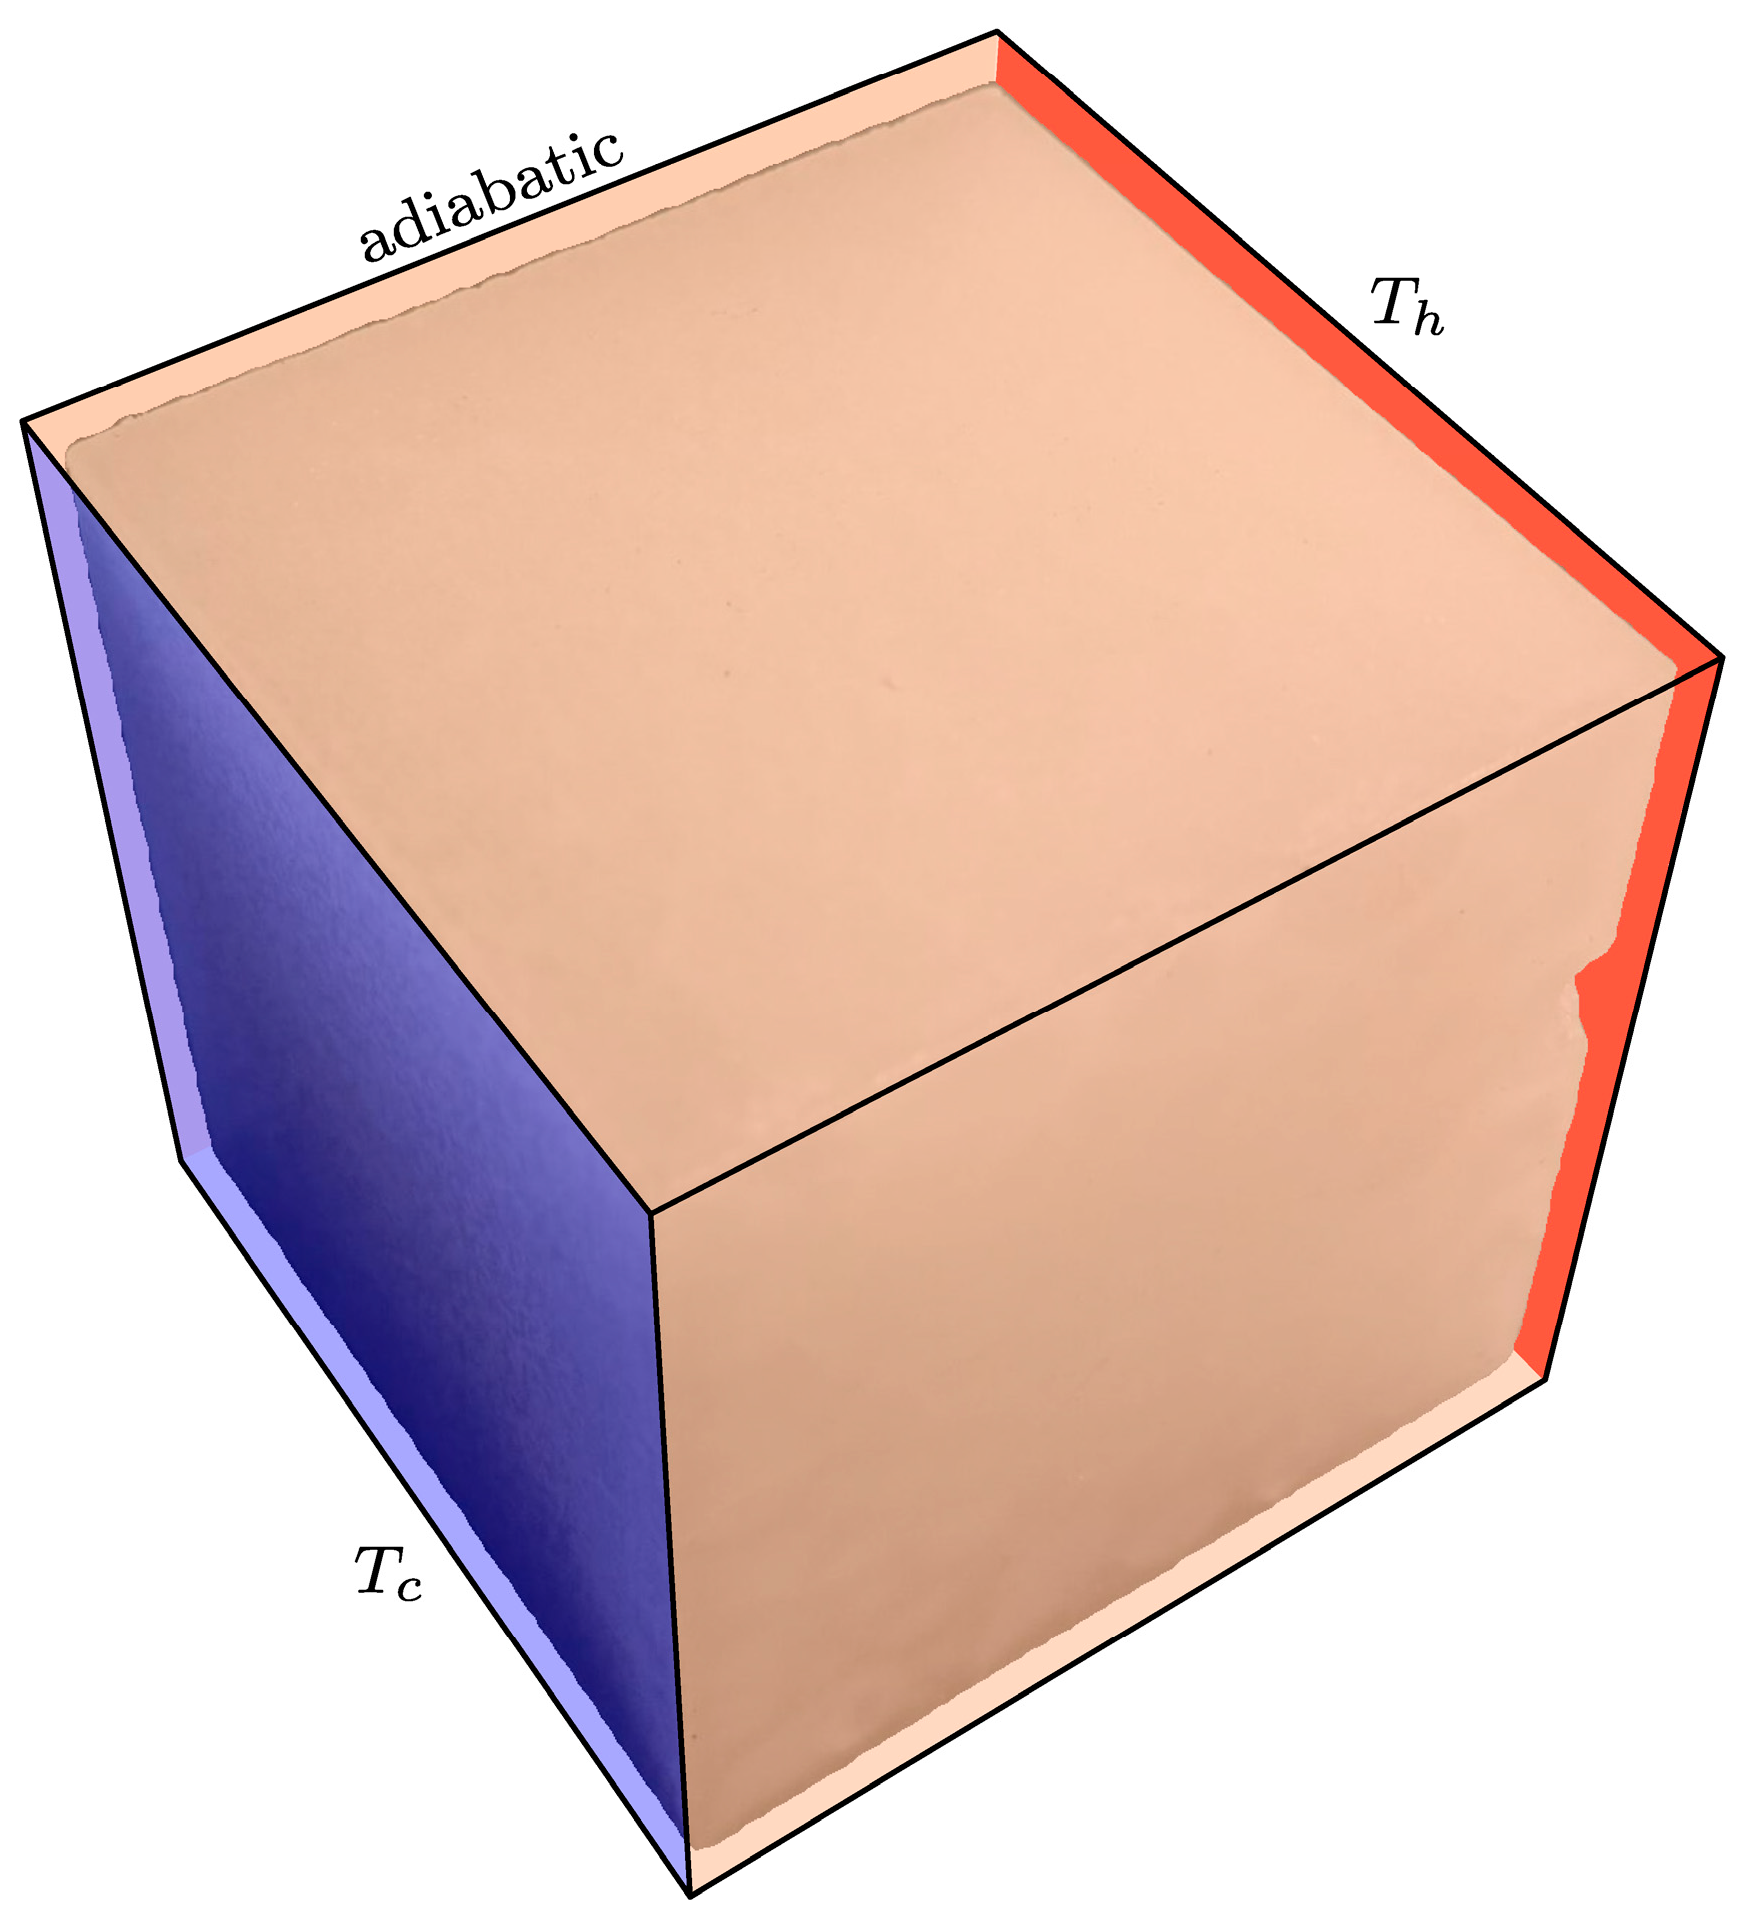
2.1. Experimental Setup

A constant temperature solidification experiment is first carried out by designing a detachable phase change unit. The experimental setup consists of a constant temperature heating chamber, a constant temperature water bath with a cooling system, and a custom-designed cubic copper container with internal dimensions of 60 × 60 × 60 mm, as shown by Figure 1. This copper container has a wall thickness of 5 mm. Its top and bottom are detachable, allowing for easy yet integral removal of solidified paraffin. Built-in rubber strips ensure a secure seal to prevent leakage during experiments. The pure paraffin (purity > 99.8%), referred to as A53, is purchased from Shengbang Plastic Raw Materials (Guangdong, China). The related thermophysical properties of A53 are listed in Table 1.
Figure 1 illustrates the schematic diagram of the present experimental procedure. In the experiment, the copper container and solid paraffin are initially placed inside a large stainless steel vessel, which is then heated at 70 °C for about 10 h in the constant temperature heating chamber. The solid paraffin fully melts into liquid, and the copper container is wholly immersed in the liquid paraffin. The copper container is then assembled into a sealed unit within the liquid paraffin, ensuring it is fully filled without initial gas voids. This assembly is uniformly maintained at 70 °C and then fully immersed in cooling water at 20 °C in the constant temperature bath for 4 h. The liquid paraffin inside the copper container solidifies completely. Subsequently, the copper container is reheated to 40 °C (below the paraffin’s melting temperature of 53 °C) for a short time to soften the paraffin adhering to the walls. Thus, the solidified paraffin can be removed integrally from the copper container, without damaging its structure. Finally, the RX SOLUTIONS EasyTom L instrument is employed to perform CT scanning of the solidified paraffin at room temperature, with a resolution of up to 25 µm. The scanning results, which can clearly identify the gas voids, are then used to reconstruct the three-dimensional structure of the solidified paraffin.

2.2. Lattice Boltzmann Model

Numerical simulations are performed to quantitatively evaluate the impact of gas voids on the thermal conductivity performance of the solidified paraffin structure. The total enthalpy-based lattice Boltzmann model [39,40], initially proposed for solid–liquid phase change, is adopted here. The corresponding macroscopic governing equation for heat transfer can be expressed as
H t + ( c p T u ) = λ ρ s T ,
where H is the total enthalpy, c p is the specific heat, T is the temperature, u is the velocity, λ is the heat conductivity, and ρ s is the solid density. Note that there is u = 0 in the simulation since a steady-state pure heat conduction problem is considered here.
The multiple-relaxation-time lattice Boltzmann equation for the total enthalpy distribution function g i ( x , t ) is given as [39,40]
g ( x + e δ t , t + δ t ) = g ( x , t ) M 1 R n ( x , t ) n e q ( x , t ) ,
where g ( x , t ) = [ g 0 ( x , t ) , , g 18 ( x , t ) ] T and g ( x + e δ t , t + δ t ) = [ g 0 ( x + e 0 δ t , t + δ t ) , , g 18 ( x + e 18 δ t , t + δ t ) ] T represent lattice vectors of the distribution function, n ( x , t ) = M g ( x , t ) is the rescaled moment of the distribution function with n e q ( x , t ) being the corresponding equilibrium moment, M is the dimensionless orthogonal transformation matrix from velocity space to moment space, and R is the collision matrix in moment space. With the mesoscopic distribution function, the macroscopic variable, i.e., the total enthalpy, is calculated by
H = i = 0 18 g i .
The temperature is thermodynamically determined by the total enthalpy. Since solid–liquid phase change is not involved here, the phase change latent heat is set to 0, and thus the temperature is determined as
T = H / c p , g gas part , H / c p , s solid part ,
where c p , g and c p , s are the specific heats of the gas and solid parts in the reconstructed solid–gas structure, respectively. This work mainly focuses on the morphology and distribution of gas voids in solidified pure paraffin and their impact on thermal conductivity performance. The more technical details of the total enthalpy-based lattice Boltzmann model will thus not be covered here, and the reader is referred to previous works [39,40].
Figure 2 shows the configurations of the numerical simulation of pure heat conduction in the solidified paraffin structure, which is reconstructed in the above experiment. Both the heat conduction cases in horizontal and vertical directions are considered. For each case, two opposing sides are maintained at cold ( T c = 0 ) and high ( T h = 1 ) temperatures, respectively, while the other four sides are kept adiabatic. The mirror half-way bounce-back scheme proposed in Ref. [40] is employed to treat both the isothermal and adiabatic boundary conditions. In present simulations performed on an NVIDIA GeForce RTX 4090 GPU with 24 GB of memory, the size of the computational domain is set to the maximal feasible size of 452 × 452 × 452 to balance the geometrical accuracy of gas voids with the computational cost. The specific heats of the gas and solid parts are set to c p , g lu = c p , s lu = 1 in lattice units as they do not take effect in the steady-state pure heat conduction problems. The thermal conductivity of the solid part is fixed at λ s lu = 1 in lattice units, and the gas part is determined by the solid-to-gas thermal conductivity ratio R λ = λ s / λ g . A higher R λ indicates a lower heat conductivity of the gas part.

3. Results and Discussion

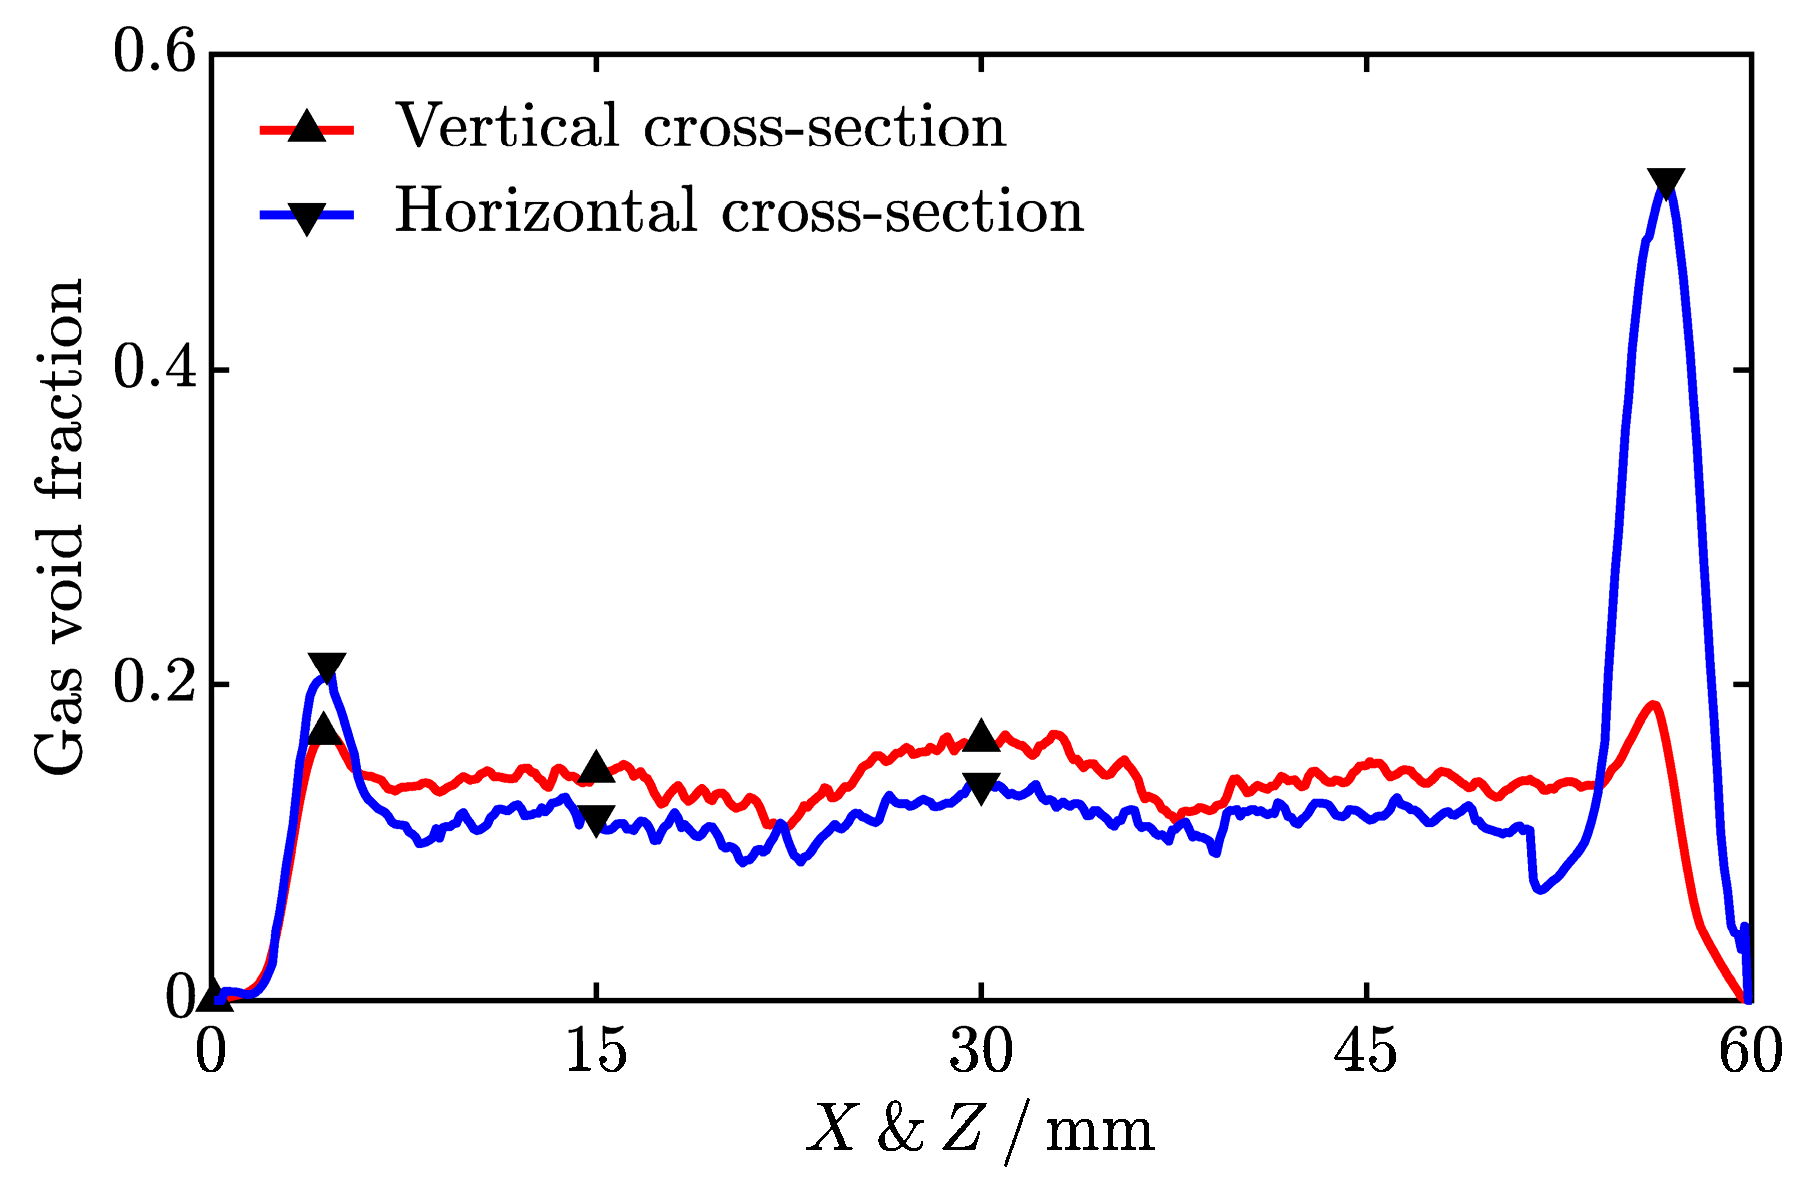
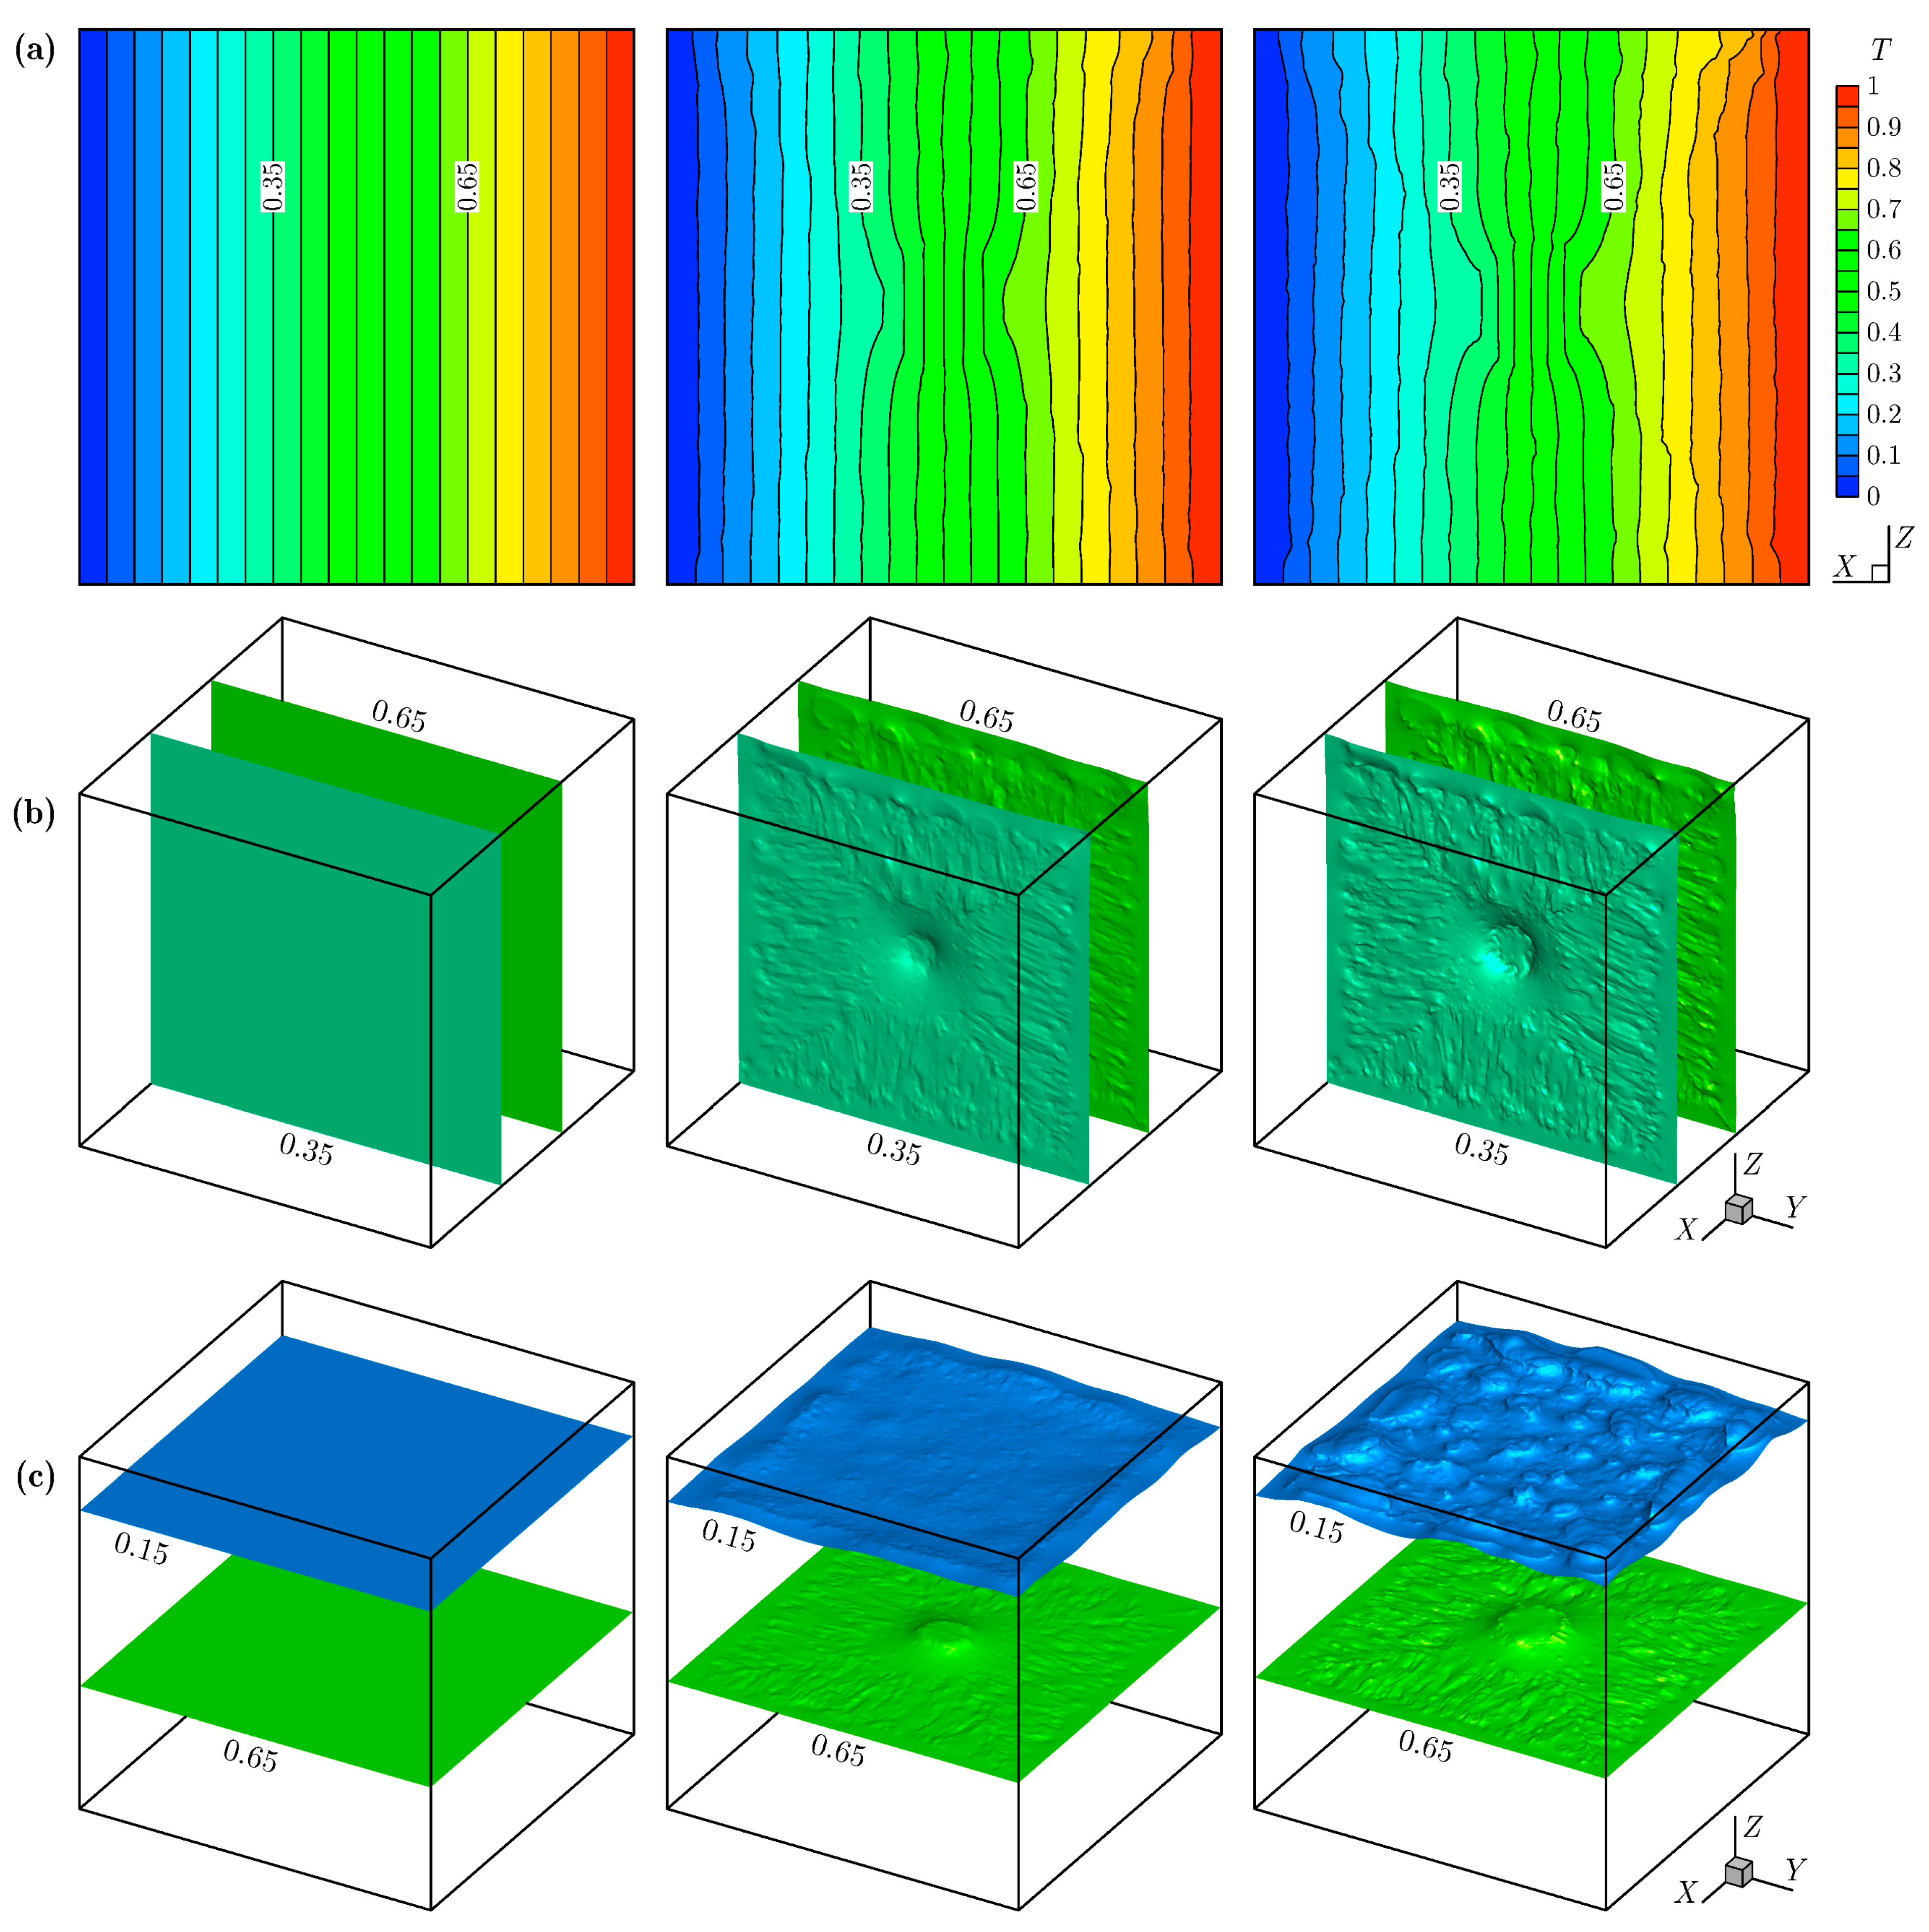
3.1. Gas Void Morphology and Distribution

Figure 3 shows the three-dimensional reconstructed structure of the solidified pure paraffin from CT scanning images, where the red domains are the gas voids. Since the solid density is greater than the liquid density, volumetric contraction occurs during the solidification process, inducing bubbles that eventually become gas voids within the solid. Figure 3 confirms that numerous gas voids form during solidification within a sealed thermal energy storage unit, caused by the density difference between the solid and liquid phases. To validate the CT scanning results, the solid-to-liquid density ratio is evaluated by calculating the total volume of the gas voids in the reconstructed structure. The evaluated result is 1.1503, showing a deviation of only 1.2% from the value 1.1370 calculated using the solid and liquid densities in Table 1. Thus, the gas voids in the solidified pure paraffin are adequately resolved by the present CT scanning at a resolution of 25 µm.
Figure 3 demonstrates that the gas voids formed within the solidified paraffin exhibit four distinct morphological types: (I) irregular elliptical gas voids, (II) elongated “needle-like” gas voids, (III) micro gas voids and (IV) large circular gas voids. The irregular elliptical gas voids (Type I) are primarily located near the top of the cubic unit, suggesting that they result from the bubbles that float up to the top and then merge into large ones at the early stage of the solidification process. The elongated “needle-like” gas voids (Type II) are formed by bubbles induced near the dendrites and then adsorbed on the dendrites. As the dendrites grow, these adsorbed bubbles merge and are squeezed and trapped there, resulting in the formation of Type II voids. In addition, the “needle-like” gas voids along the horizontal direction exhibit a slight upward tilt, which is caused by the weak natural convection in the liquid phase. Bubbles adsorbed on the dendrites may be blocked by dendrite growth before they can merge, leading to the formation of micro gas voids (Type III). During the formation of Types II and III voids, bubbles adsorbed on the dendrites may also detach due to mechanical vibration and/or liquid convection. These detached bubbles then gather in the liquid phase and eventually coalesce into a large circular gas void (Type IV) at the center of the cubic unit by the end of the solidification process. The dimensions of the gas voids can also be measured from the reconstructed structure shown in Figure 3. The height of the irregular elliptical gas voids (Type I) ranges from approximately 2.65 to 3.98 mm, while their diameter along the horizontal plane ranges from about 2.65 to 6.64 mm. The elongated “needle-like” gas voids (Type II) have a diameter ranging from 0.53 to 2.12 mm, and a length ranging from 3.0 to 12.0 mm. The diameter of the micro gas voids (Type III) ranges from approximately 0.26 to 0.4 mm, while the diameter of the large circular gas void (Type IV) is about 16.0 mm.
To further analyze the morphology and distribution of gas voids, Figure 4 presents the cross-sectional views of the reconstructed solidified pure paraffin structure along both the vertical and horizontal directions. Due to geometric symmetry, the vertical cross-sections are selected to be parallel to the Y - Z plane at X = 0.13 , 4.38, 15.03, and 30.06 mm (see Figure 3 for the coordinate system), while the horizontal cross-sections are selected to be parallel to the X - Y plane at Z = 4.51 , 15.03, 30.06, and 56.68 mm. Figure 4a clearly shows the absence of gas voids very close to the vertical wall of the copper container. This can be attributed to the direct contact between the liquid paraffin and the wall, as well as the rapid solidification at the early stage. The elongated “needle-like” gas voids (Type II) are oriented perpendicular to each wall of the copper container. This phenomenon can be explained by the cooling procedure in the experiment, where the copper container is fully immersed in cold water, resulting in a temperature gradient directed normally to each wall. Consequently, the dendritic growth of the paraffin occurs perpendicular to the container walls. During solidification, bubbles trapped in the regions between the dendrites are squeezed along the growth direction, leading to the alignment of the gas voids in this specific orientation. Interestingly, this specific orientation of Type II voids creates a distinct interface along the diagonal directions of the cross-section, which is clearly visible in the 15.03 mm and 30.06 mm cross-sections shown in Figure 4.
From Figure 3 and Figure 4, it is evident that the structure of the solidified pure paraffin exhibits anisotropy. Figure 5 shows the gas void fraction in vertical and horizontal cross-sections calculated from the reconstructed solidified pure paraffin structure. As seen, the gas void fraction in the vertical cross-sections exhibits a nearly symmetric distribution with respect to the mid-plane ( X = 30 mm ), a result of the geometric symmetry. On the contrary, the gas void fraction in the horizontal cross-sections shows a significant asymmetric distribution, due to bubbles rising at the early stage of solidification. Notably, the gas void fraction in the horizontal cross-section at Z = 56.68 mm reaches as high as 0.52 [see the rightmost panel of Figure 4b for the corresponding gas void distribution]. From the container wall to the internal region, the gas void fraction rapidly increases from 0 to a peak, then slightly decreases, and subsequently remains at a nearly constant level. When approaching the center of the cubic unit, the gas void fraction slightly increases due to the formation of the Type IV gas void. Figure 5 also demonstrates that the gas void fraction in the horizontal cross-sections is slightly lower than in the vertical cross-sections in the internal region (from 6.0 mm to 54.0 mm) but becomes significantly higher than in the vertical cross-sections as it approaches the top wall of the container. This feature indicates that the effective thermal conductivity (ETC) of the solidified pure paraffin is direction dependent.

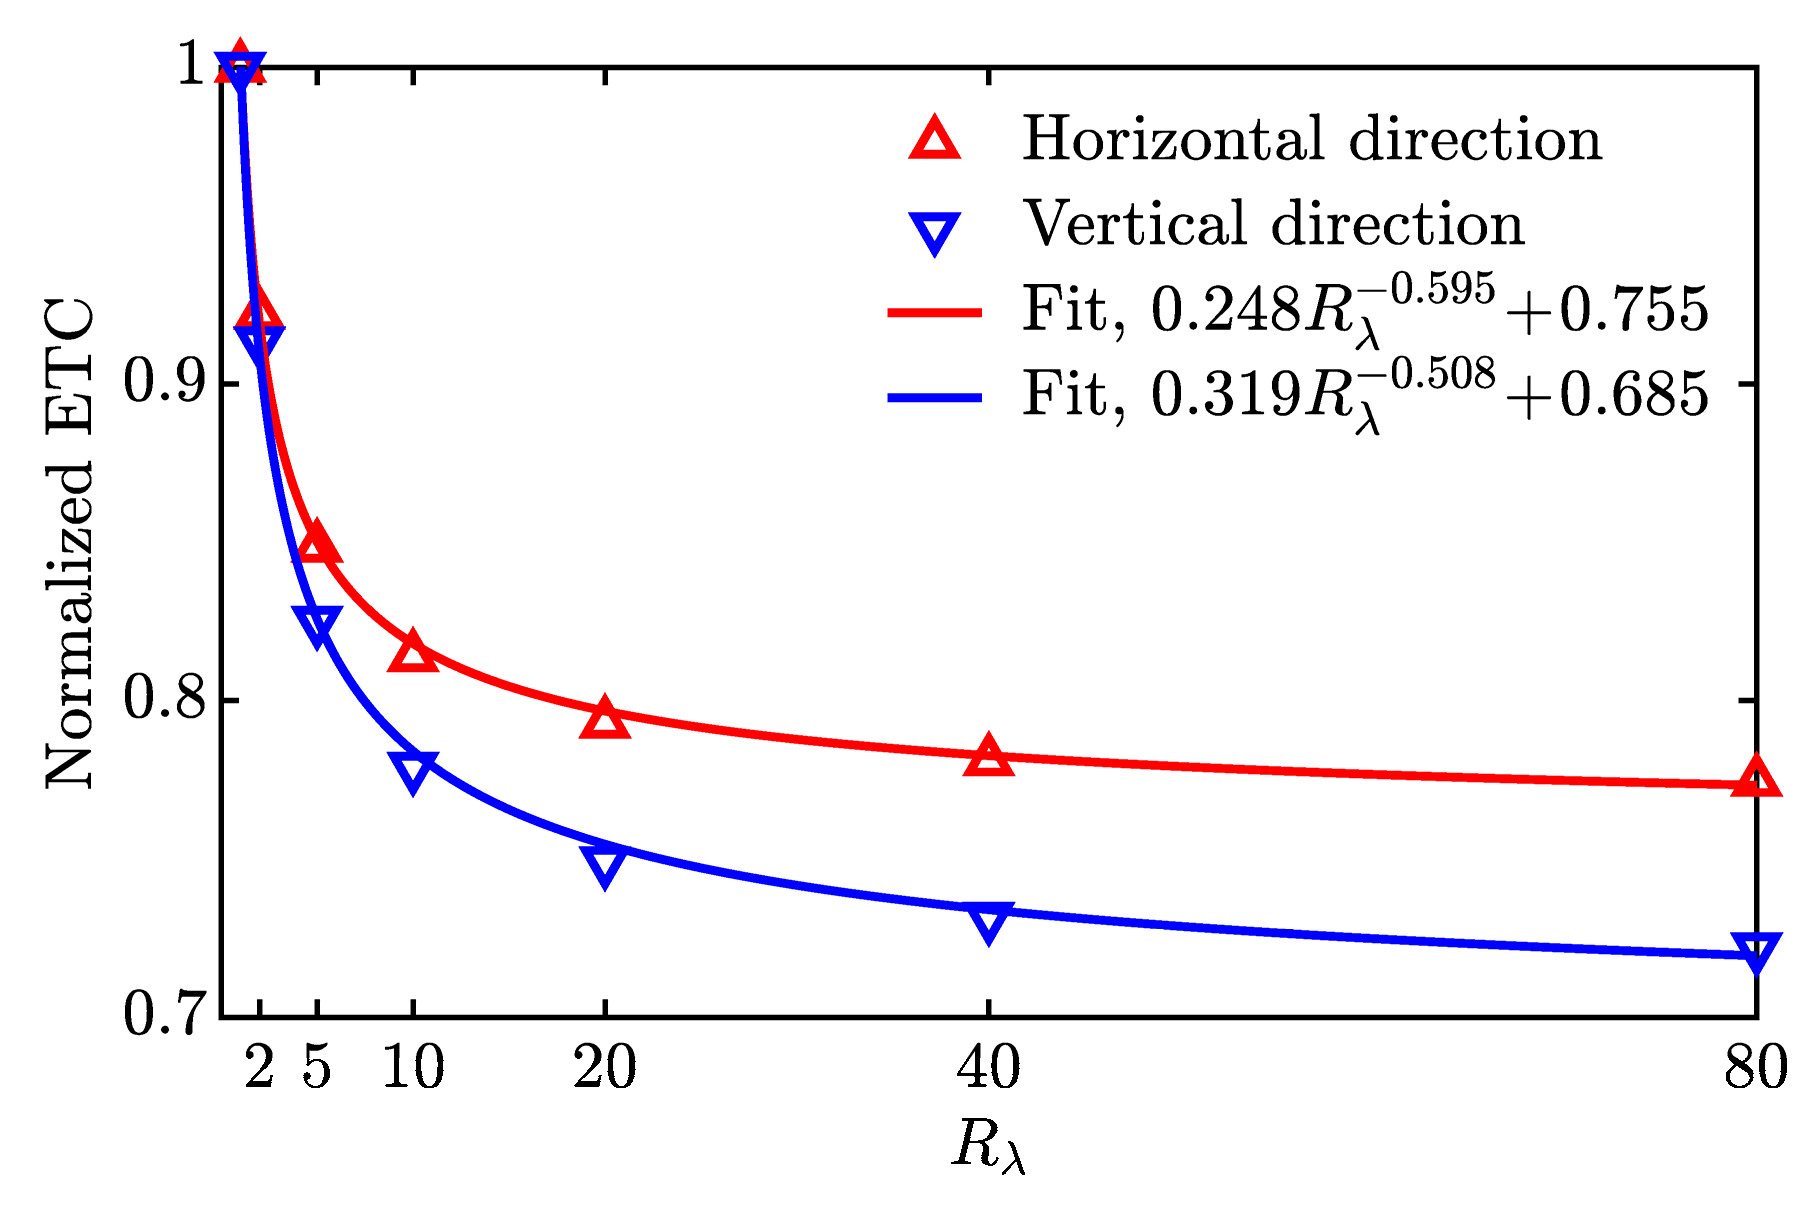
3.2. Effective Thermal Conductivity

Figure 6a shows the temperature field in the middle plane for the heat conduction cases in the horizontal direction for various solid-to-gas thermal conductivity ratios ( R λ = 1 , 5, and 80). Due to geometric symmetry, the horizontal direction here is set along the X axis, and the middle plane is chosen parallel to the X - Z plane (see Figure 3 for the coordinate system). Based on our tests, the two horizontal directions (i.e., the directions along the X and Y axes) exhibit good consistency in the effective thermal conductivity, with a deviation of less than 0.37%. Thus, numerical results along the Y axis will not be repeated in the following discussion. It can be seen from Figure 6a that as R λ increases from 1 to 80, the isotherms gradually change from a vertically parallel state to a curved state, which is particularly significant in the central area (see the isotherms at T = 0.35 and 0.65) due to the Type IV gas void (i.e., the large circular gas void). Figure 6b shows the corresponding isothermal surfaces at T = 0.35 and 0.65. Similarly, the isothermal surfaces remain flat for R λ = 1 and become uneven for R λ = 5 and 80, which is particularly significant in the central area due to the Type IV gas void. Figure 6c shows the isothermal surfaces at T = 0.15 and 0.65 for the heat conduction cases in the vertical direction for R λ = 1 , 5, and 80. In these cases, the upper side of the solidified paraffin structure is maintained at T c = 0 , and the lower side is maintained at T h = 1 . The isothermal surface at T = 0.65 passes through the Type IV gas void at the center of the cubic unit, causing its central area to protrude upwards. The isothermal surface at T = 0.15 passes through the Type I gas voids near the top of the cubic unit (i.e., the irregular elliptical gas voids), and thus it becomes quite uneven when R λ = 80 .
From the numerical results, the effective thermal conductivity (ETC) of the solidified paraffin structure can be calculated as
ETC = l ( T h T c ) A A q n d A ,
where q n is the heat flux at the side with temperature T h in its normal direction, A = l 2 is the heat conduction area, and l is the side length. Figure 7 shows the variation in the normalized ETC (normalized by the solid thermal conductivity) concerning the solid-to-gas thermal conductivity ratio R λ . The analytical normalized ETC equals 1 when R λ = 1 , while the numerical results are 0.997587 and 0.995337 in the vertical and horizontal directions, respectively. This close agreement validates the accuracy of the present lattice Boltzmann simulations. As R λ increases, the decreasing thermal conductivity of the gas voids reduces the normalized ETC. As R λ increases, the decreasing thermal conductivity of the gas voids reduces the normalized ETC. Such a reduction is pronounced when R λ 20 and levels off when R λ > 20 . Figure 7 demonstrates that the ETC in the vertical direction is significantly lower than in the horizontal direction, due to the presence of Type I gas voids near the top wall of the cubic unit [see the rightmost panel of Figure 4b]. Meanwhile, the normalized ETC, shown in Figure 7, can be well fitted by a two-term power equation
Normalized ETC = 0.248 R λ 0.595 + 0.755 horizontal direction , 0.319 R λ 0.508 + 0.685 vertical   direction ,
implying that the thermal conductivity of the solidified pure paraffin could be reduced by as much as 31.5% due to the presence of gas voids when the thermal conductivity of the gas voids is negligible (i.e., R λ ). Here, it is worth pointing out that the present solidification experiment is repeated three times, and the corresponding reconstructed solid-gas structures are slightly different. The normalized ETCs for these structures show good consistency. Thus, Equation (6) is relatively accurate for the PCM considered in this work. However, it may be inappropriate for a different PCM due to the corresponding solid and liquid density difference, and thus the gas void morphology and distribution could be significantly different.

4. Conclusions

In summary, the three-dimensional structure of the solidified pure paraffin within a cubic thermal energy storage unit is reconstructed through CT scanning with a resolution of up to 25 µm. Four distinct types of gas voids are identified: irregular elliptical gas voids, elongated “needle-like” gas voids, micro gas voids, and large circular gas voids. The irregular elliptical gas voids are primarily located near the top of the cubic unit, while the large circular gas void is found at the center of the cubic unit. The elongated “needle-like” and micro gas voids are relatively widespread throughout the cubic unit. These gas void morphologies and distributions indicate anisotropy of the solidified pure paraffin structure. Based on the reconstructed structure, lattice Boltzmann simulations are conducted to numerically evaluate and fit the ETC of the solidified pure paraffin as a function of the solid-to-gas thermal conductivity ratio. Due to the irregular elliptical gas voids near the top of the cubic unit, the ETC in the vertical direction is significantly lower than in the horizontal direction. As the solid-to-gas thermal conductivity ratio increases, the ETC of the solidified pure paraffin could be reduced by up to 31.5%. The present findings are crucial for designing thermal energy storage systems with PCMs and optimizing their performance in practical applications.

Author Contributions

D.W.: Investigation, Writing—original draft; Q.Z.: Validation, Writing—original draft; R.H.: Conceptualization, Methodology, Writing—review and editing. All authors have read and agreed to the published version of the manuscript.

Funding

This work was supported by the National Natural Science Foundation of China through Grants No. 52376086 and No. 52006244.

Data Availability Statement

The data presented in this study are available on request from the corresponding author.

Conflicts of Interest

The authors have no conflicts to disclose.

Nomenclature

CTcomputed tomography
ETCeffective thermal conductivity
GPUgraphics processing unit
c p , g l u gas specific heat capacity in lattice units
c p , s l u solid specific heat capacity in lattice units
c p , s solid specific heat capacity [ kJ / ( kg K ) ]
L latent heat of phase transition [ kJ / kg ]
T m phase transition temperature [ ° C ]
λ g l u gas thermal conductivity in lattice units
λ s l u solid thermal conductivity in lattice units
λ s solid thermal conductivity [ W / ( m K ) ]
ρ l liquid density [ kg / m 3 ]
ρ s solid density [ kg / m 3 ]

References

  1. Yang, X.; Guo, Z.; Liu, Y.; Jin, L.; He, Y. Effect of inclination on the thermal response of composite phase change materials for thermal energy storage. Appl. Energy 2019, 238, 22–33. [Google Scholar] [CrossRef]
  2. Huang, Z.; Li, Q.; Qiu, Y. Enhancements in thermal properties of binary alkali chloride salt by Al2O3 nanoparticles for thermal energy storage. Energy 2024, 301, 131584. [Google Scholar] [CrossRef]
  3. Martínez Figueira, N.; Salgado Sánchez, P.; Bello, A.; Olfe, K.; Rodriguez, J. Effect of surface heat exchange on phase change materials melting with thermocapillary flow in microgravity. Phys. Fluids 2023, 35, 084115. [Google Scholar] [CrossRef]
  4. Afaynou, I.; Faraji, H.; Choukairy, K.; Arshad, A.; Arici, M. Heat transfer enhancement of phase-change materials (PCMs) based thermal management systems for electronic components: A review of recent advances. Int. Commun. Heat Mass Transf. 2023, 143, 106690. [Google Scholar] [CrossRef]
  5. Rehman, T.-U.; Ali, H.M.; Saieed, A.; Pao, W.; Ali, M. Copper foam/PCMs based heat sinks: An experimental study for electronic cooling systems. Int. J. Heat Mass Transf. 2018, 127, 381–393. [Google Scholar] [CrossRef]
  6. Ramakrishnan, S.; Wang, X.; Sanjayan, J.; Wilson, J. Thermal performance of buildings integrated with phase change materials to reduce heat stress risks during extreme heatwave events. Appl. Energy 2017, 194, 410–421. [Google Scholar] [CrossRef]
  7. Gao, Y.; Meng, X. A comprehensive review of integrating phase change materials in building bricks: Methods, performance and applications. J. Energy Storage 2023, 62, 106913. [Google Scholar] [CrossRef]
  8. Chan, Y.; Hoke, T.; Meredith, K.; Chen, X. Annual simulation of phase change materials for enhanced energy efficiency and thermal performance of buildings in southern california. Energies 2025, 18, 847. [Google Scholar] [CrossRef]
  9. Niall, D.; West, R. Development of concrete façade sandwich panels incorporating phase change materials. Energies 2024, 17, 2924. [Google Scholar] [CrossRef]
  10. Mobedi, M.; Hooman, K.; Tao, W.-Q. Solid-Liquid Thermal Energy Storage: Modeling and Applications; CRC Press: Boca Raton, FL, USA, 2022. [Google Scholar]
  11. Yang, X.; Lu, Z.; Bai, Q.; Zhang, Q.; Jin, L.; Yan, J. Thermal performance of a shell-and-tube latent heat thermal energy storage unit: Role of annular fins. Appl. Energy 2017, 202, 558–570. [Google Scholar] [CrossRef]
  12. Kazemi, A.; Izadi, M.; Assareh, E.; Ershadi, A. Melting process of Carreau non-Newtonian nano-phase change material inside cylindrical energy storage system: Effect of thermal fins. Phys. Fluids 2023, 35, 087116. [Google Scholar] [CrossRef]
  13. Khedher, N.B.; Mahdi, J.M.; Dulaimi, A.; Chatroudi, I.S.; Tiji, M.E.; Ibrahem, R.K.; Yvaz, A.; Talebizadehsardari, P. On the application of novel arc-shaped fins in a shell-and-tube type of latent heat storage for energy charge enhancement. J. Energy Storage 2023, 73, 108697. [Google Scholar] [CrossRef]
  14. Khedher, N.B.; Togun, H.; Abed, A.M.; Mohammed, H.I.; Mahdi, J.M.; Ibrahem, R.K.; Yaïci, W.; Talebizadehsardari, P.; Keshmiri, A. Comprehensive analysis of melting enhancement by circular Y-shaped fins in a vertical shell-and-tube heat storage system. Eng. Appl. Comput. Fluid Mech. 2023, 17, 2227682. [Google Scholar] [CrossRef]
  15. Mesalhy, O.; Lafdi, K.; Elgafy, A.; Bowman, K. Numerical study for enhancing the thermal conductivity of phase change material (PCM) storage using high thermal conductivity porous matrix. Energy Convers. Manag. 2005, 46, 847–867. [Google Scholar] [CrossRef]
  16. Yao, Y.; Wu, H.; Gao, Z.; Liu, Z. Pore-scale visualization and measurement of paraffin solidification in high porosity open-cell copper foam. Int. J. Therm. Sci. 2019, 135, 94–103. [Google Scholar] [CrossRef]
  17. Andreozzi, A.; Asinari, P.; Barletta, A.; Bianco, V.; Bocanegra, J.A.; Brandão, P.V.; Buonomo, B.; Cappabianca, R.; Celli, M.; Chiavazzo, E. Heat transfer and thermal energy storage enhancement by foams and nanoparticles. Energies 2023, 16, 7421. [Google Scholar] [CrossRef]
  18. Amini, Y.; Hekmat, F. Improving the thermal performance of a spherical latent thermal energy storage using innovative fins and porous media. Phys. Fluids 2025, 37, 017160. [Google Scholar] [CrossRef]
  19. Khodadadi, J.M.; Hosseinizadeh, S.F. Nanoparticle-enhanced phase change materials (NEPCM) with great potential for improved thermal energy storage. Int. Commun. Heat Mass Transf. 2007, 34, 534–543. [Google Scholar] [CrossRef]
  20. Zhang, P.; Ma, Z.W.; Wang, R.Z. An overview of phase change material slurries: MPCS and CHS. Renew. Sust. Energy Rev. 2010, 14, 598–614. [Google Scholar] [CrossRef]
  21. Sheikholeslami, M.; Jafaryar, M.; Shafee, A.; Babazadeh, H. Acceleration of discharge process of clean energy storage unit with insertion of porous foam considering nanoparticle enhanced paraffin. J. Clean. Prod. 2020, 261, 121206. [Google Scholar] [CrossRef]
  22. Zhang, X.; Cui, W.; Yang, S.; Wu, Z.; Xiong, Z.; Zhang, S. Influence of inclined non-uniform fins on the melting of phase change materials under constant-power heating condition. Energies 2025, 18, 1733. [Google Scholar] [CrossRef]
  23. Zhang, P.; Wang, Y.; Qiu, Y.; Yan, H.; Wang, Z.; Li, Q. Novel composite phase change materials supported by oriented carbon fibers for solar thermal energy conversion and storage. Appl. Energy 2024, 358, 122546. [Google Scholar] [CrossRef]
  24. Soltani, H.; Soltani, M.; Karimi, H.; Nathwani, J. Optimization of shell and tube thermal energy storage unit based on the effects of adding fins, nanoparticles and rotational mechanism. J. Clean. Prod. 2022, 331, 129922. [Google Scholar] [CrossRef]
  25. Morris, D.G.; Foote, J.P.; Olszewski, M. Development of Encapsulated Lithium Hydride Thermal Energy Storage for Space Power Systems; Technical Report; Oak Ridge National Lab. (ORNL): Oak Ridge, TN, USA, 1987. [Google Scholar]
  26. Sulfredge, C.D.; Chow, L.C.; Tagavi, K.A. Void formation in radial solidification of cylinders. J. Sol. Energy Eng. 1992, 114, 32–39. [Google Scholar] [CrossRef]
  27. Sulfredge, C.D.; Chow, L.C.; Tagavi, K.A. Solidification void formation in tubes: Role of liquid shrinkage and bubble nucleation. Exp. Heat Transf. 1992, 5, 147–160. [Google Scholar] [CrossRef]
  28. Sulfredge, C.D. Fundamentals of Solidification Shrinkage Void Formation. Ph.D. Thesis, University of Kentucky, Lexington, KY, USA, 1993. [Google Scholar]
  29. Sulfredge, C.D.; Chow, L.C.; Tagavi, K.A. Void formation in unidirectional freezing from above. Exp. Heat Transf. 1993, 6, 1–16. [Google Scholar] [CrossRef]
  30. Revankar, S.T.; Croy, T. Visualization study of the shrinkage void distribution in thermal energy storage capsules of different geometry. Exp. Therm. Fluid Sci. 2007, 31, 181–189. [Google Scholar] [CrossRef]
  31. Chiew, J.; Chin, C.S.; Toh, W.D.; Gao, Z.; Jia, J. Low-temperature macro-encapsulated phase change material based thermal energy storage system without air void space design. Appl. Therm. Eng. 2018, 141, 928–938. [Google Scholar] [CrossRef]
  32. Janghel, D.; Saha, S.K.; Karagadde, S. Effect of shrinkage void on thermal performance of pure and binary phase change materials based thermal energy storage system: A semi-analytical approach. Appl. Therm. Eng. 2020, 167, 114706. [Google Scholar] [CrossRef]
  33. Chen, L.; Wang, L.; Wang, Y.; Chen, H.; Lin, X. Influence of phase change material volume shrinkage on the cyclic process of thermal energy storage: A visualization study. Appl. Therm. Eng. 2022, 203, 117776. [Google Scholar] [CrossRef]
  34. Sutradhar, J.; Kothari, R.; Sahu, S.K. Melting and solidification analysis of phase change material-metal foam composite with expansion/shrinkage void in rectangular system. J. Energy Storage 2022, 47, 103596. [Google Scholar] [CrossRef]
  35. Xu, D.; Qu, Z.; An, L.; Xu, H.; Yang, Q.; Luo, Z.; Pan, H. Pore-scale study on the effects of randomly distributed void cavities on the thermal performance of composite phase change materials. J. Energy Storage 2022, 55, 105715. [Google Scholar] [CrossRef]
  36. Janghel, D.; Karagadde, S.; Saha, S.K. Measurement of shrinkage void and identification of solid-liquid phases in phase change materials: Ultrasound-based approach and simulated predictions. Appl. Therm. Eng. 2023, 223, 120048. [Google Scholar] [CrossRef]
  37. Gao, Z.; Yao, Y.; Wu, H. A visualization study on the unconstrained melting of paraffin in spherical container. Appl. Therm. Eng. 2019, 155, 428–436. [Google Scholar] [CrossRef]
  38. Liu, M.; Fan, L.; Zhu, Z.; Feng, B.; Zhang, H.; Zeng, Y. A volume-shrinkage-based method for quantifying the inward solidification heat transfer of a phase change material filled in spherical capsules. Appl. Therm. Eng. 2016, 108, 1200–1205. [Google Scholar] [CrossRef]
  39. Huang, R.; Wu, H. Phase interface effects in the total enthalpy-based lattice Boltzmann model for solid–liquid phase change. J. Comput. Phys. 2015, 294, 346–362. [Google Scholar] [CrossRef]
  40. Huang, R.; Wu, H. Total enthalpy-based lattice Boltzmann method with adaptive mesh refinement for solid-liquid phase change. J. Comput. Phys. 2016, 315, 65–83. [Google Scholar] [CrossRef]
Figure 1. Schematic diagram of the experimental procedure: (a) Heating in the constant temperature heating chamber; (b) Filling and assembling the copper container; (c) Cooling in the constant temperature water bath; (d) Removing the solidified paraffin; (e) CT scanning using the RX SOLUTIONS EasyTom L; (f) Reconstructing the three-dimensional structure.
Energies 18 03686 g001
Figure 2. Schematic diagram of the numerical simulation of a pure heat conduction problem, where the solidified paraffin structure is set as the computational domain, two opposing sides are maintained at cold temperature T c and high temperature T h , respectively, and the other four sides are kept adiabatic.
Energies 18 03686 g002
Figure 3. Three-dimensional reconstructed structure of the solidified pure paraffin from CT scanning images, where the red domains are the gas voids and the gravitational acceleration g indicates the vertical direction. The three middle plane cross-sections are also plotted to show the inner structure of the solidified pure paraffin.
Energies 18 03686 g003
Figure 4. Cross-sectional views of the reconstructed solidified pure paraffin structure, where the red domains are the gas voids. (a) Vertical cross-sections (parallel to Y - Z plane) at X = 0.13 , 4.38, 15.03, and 30.06 mm. (b) Horizontal cross-sections (parallel to X - Y plane) at Z = 4.51 , 15.03, 30.06, and 56.68 mm.
Energies 18 03686 g004
Figure 5. Gas void fraction in vertical and horizontal cross-sections of the reconstructed solidified pure paraffin structure. The symbols denote the cross-sections shown in Figure 4.
Energies 18 03686 g005
Figure 6. (a) Temperature field in the middle plane and (b) isothermal surfaces at T = 0.35 and 0.65 for the horizontal heat conduction cases. (c) Isothermal surfaces at T = 0.15 and 0.65 for the vertical heat conduction cases. The solid-to-gas thermal conductivity ratios are R λ = 1 , 5, and 80, in the left, middle, and right panels, respectively.
Energies 18 03686 g006
Figure 7. Variation in the normalized effective thermal conductivity (ETC) of the reconstructed solidified pure paraffin structure in the horizontal and vertical directions with respect to the solid-to-gas thermal conductivity ratio R λ .
Energies 18 03686 g007
Table 1. Thermophysical properties of the pure paraffin (A53).
PropertiesValues
Phase transition temperature, T m 53 ° C
Latent heat of phase transition, L 220 ± 10 kJ / kg
Solid thermal conductivity, λ s 0.21 W / ( m K )
Solid specific heat capacity, c p , s 2 kJ / ( kg K )
Solid density, ρ s 830 kg / m 3
Liquid density, ρ l 730 kg / m 3
Disclaimer/Publisher’s Note: The statements, opinions and data contained in all publications are solely those of the individual author(s) and contributor(s) and not of MDPI and/or the editor(s). MDPI and/or the editor(s) disclaim responsibility for any injury to people or property resulting from any ideas, methods, instructions or products referred to in the content.

