1. Introduction
Modern electrical appliances, such as generators, transformers, inductors, and the magnetic coils of electric motors, widely use plate-conductive elements. During operation, these elements are exposed to external electromagnetic fields (EMFs), including quasi-steady fields, which can significantly influence their mechanical properties, operational longevity, and overall performance. Particular attention should be paid to the processes of technological heat treatment of electroconductive products that use induction heating.
Mathematical models, analytical and experimental approaches for describing and studying electromagnetic, thermal, and mechanical processes, are considered in many fundamental works, in particular [
1,
2,
3,
4,
5,
6].
Reference [
1] offers an in-depth review of the principal electrical technologies used in process heating. In addition to addressing thermal stress phenomena, [
2] includes contributions on related disciplines such as elasticity theory, thermal conductivity, and thermodynamics. Paper [
3] is devoted to the construction of a two-dimensional physical and mathematical model to investigate the temperature behavior of a rectangular conductive strip subjected to induction heating by a quasi-steady electromagnetic field. A methodology for constructing solutions to the formulated problems of electrodynamics and thermal conductivity for the strip under consideration is proposed. This technique uses the approximation of the determining functions—the component of the magnetic field strength and temperature vector tangential to the band bases by cubic polynomials in the thickness variable. This approach enabled the transformation of the initial two-dimensional boundary value problems into one-dimensional formulations based on the integral characteristics of the defining functions. The solution to these one-dimensional problems is found by applying a finite integral transform in the transverse direction and the Laplace transform with respect to time. The qualitative and quantitative regularities of changes in time and in the cross-sectional area of both determinant functions for a strip made of stainless steel under the action of a quasi-steady electromagnetic field are analyzed numerically.
Papers [
4,
5] highlight the regularities of induction heating technology obtained on the basis of experimental studies.
Paper [
6] considers the simulations of thermomechanical behavior in conductive solids exposed to high-temperature induction heating. The study examines how the frequency of the electric current influences the development of residual stresses in a cylindrical body. The analysis focuses on the induction treatment process, which entails heating the solid to a target temperature and subsequently cooling it. Particular attention is given to how different cooling conditions affect the resulting residual stress distribution.
In [
7], a mathematical model describing the temperature field during high-frequency induction heating was proposed [
7]. The model relies on solving a set of sequentially coupled equations of the electromagnetic and temperature fields. Computational simulations were performed using the appropriate software, and the results demonstrated a strong agreement between the model’s predictions and experimental data.
Reference [
8] investigates the temperature distribution in a carbon steel plate during linear induction heating. This distribution was analyzed numerically using the electromagnetic and thermal coupling analysis. To validate the accuracy of the simulation results, the real process of induced deformation during linear heating was carried out. A strong correlation between the numerical predictions and experimental observations confirmed the reliability of the proposed approach.
Paper [
9] proposes a model of the process of induction hardening of steel elements of complex shapes using induction heating. The induction contour hardening of gears is considered as an example. The results of modeling for coupled physical fields performed using software are presented.
Reference [
10] addresses the challenge of efficiently solving coupled electromagnetic–thermal problems. To enhance computational performance, a semi-analytical modeling approach is introduced. This method combines an initial finite element analysis with the subsequent application of analytical electromagnetic formulations. The use of the proposed model is limited to simple geometric characteristics, such as flat or curved surfaces with a large ratio of curvature to skin-effect depth. Numerical and experimental verification of the model shows good agreement in predicting the temperature evolution, achieving higher accuracy than other known commercial software products.
In recent years, much attention has been paid to the synthesis of new structural materials that have a high melting point, high thermal and electrical conductivity, and increased mechanical strength. Papers [
11,
12,
13,
14] describe experimental methods for creating such new materials and investigate the effect of appropriate impurities in homogeneous materials and the new methods for their technological processing to improve thermomechanical properties.
These new materials, in particular those based on tungsten and copper matrix metal composites [
14], usually have a heterogeneous structure, unlike the well-described homogeneous materials.
Despite the large number of theoretical and experimental studies devoted to electromagnetic, thermal, and mechanical processes in conductive bodies, most of them focus on one-dimensional models and stationary modes of EMF, in particular, modes of high-frequency induction heating by steady-state fields. However, the influence of a quasi-steady-state electromagnetic field on the thermophysical and mechanical properties of structural elements operating at elevated heating temperatures remains insufficiently studied.
This is due to the insufficient number of developed two-dimensional physical and mathematical models. Such two-dimensional models provide an opportunity for a deeper and more extended analysis of the thermomechanical behavior of plate elements under the action of a quasi-steady-state electromagnetic field. In contrast to the known models that use steady-state EMFs, the quasi-steady-state EMF takes into account the moment of switching on an inductor or a high-frequency oscillator and, to some extent, takes into account the transient mode of the change in time of the EMF, taking into account its output to steady-state electromagnetic oscillations.
Understanding and taking into account the interrelated effects of electromagnetic, temperature, and mechanical fields on the temperature regimes and thermal stress states of plate elements are important for predicting the performance and extending the service life of such elements in modern electrical and electromechanical systems. In these systems, electrically conductive elements such as electrodes, the plate elements of plasma processing structures, fusion reactor elements, and high-power electrical contacts are exposed to intense electromagnetic fields and high temperatures. Such studies are critical for both the temperature control and structural reliability of the material from which the conductive plate element is made.
Therefore, the purpose of this work is to fill the research gap by developing a comprehensive model of the thermomechanical behavior of nonferromagnetic panels, in particular, those made of tungsten, exposed to quasi-steady-state electromagnetic fields.
2. Formulation of the Thermomechanics Problem for an Electroconductive Panel
Consider a long conductive panel of a rectangular cross-section. In the rectangular Cartesian coordinate system , the axis coincides with the width , the axis with the thickness of the panel , and the panel is infinitely long along the axis. The origin of the coordinate system is the point of symmetry of the rectangle.
![Energies 18 03680 i001]()
The panel is exposed to an unsteady electromagnetic field (EMF), which causes induction heating. The temperature distribution in the panel is caused by the Joule heat, which has a non-stationary volumetric character. This temperature field creates a corresponding plane-deformed thermal stress state of the panel. To determine this state, it is necessary to formulate a two-dimensional problem of thermomechanics in stresses. This problem is complex and consists of three stages.
At the first stage, we use Maxwell’s equations to determine the EMF in the panel and the specific Joule heat density. The second stage involves determining the temperature distribution by solving the heat conduction equation, in which the heat source is Joule heat. At the third stage, we use the equations of the two-dimensional quasi-static thermoelasticity problem to find the components of the stress tensor that describe the thermal stress state of the panel. Let us illustrate this with this diagram.
![Energies 18 03680 i002]()
The first two stages—the calculation of Joule heating and the temperature field—are examined in [
3]. This work analyzes the temperature variation over Fourier time at characteristic points within the cross-section of a steel strip, considering different values of the Biot number for both near-surface and deep induction heating under a quasi-steady electromagnetic field. It also presents the temperature distribution across the strip’s cross-section in the steady-state heating regime.
The aim of this work is as follows:
To build a two-dimensional physical and mathematical model for determining the thermal stress state of an electroconductive nonferromagnetic panel under the action of a non-stationary EMF.
To develop a methodology for constructing a solution to the quasi-static problem of thermomechanics in the case of a plane-deformed state of the panel.
To conduct a numerical analysis of the Fourier time evolution of the stress tensor components and stress intensity in a tungsten panel depending on the parameters of induction heating by quasi-steady-state EMF and different heat exchange conditions with the surrounding environment.
3. Determination of the Thermal Stress State of the Panel
Previous studies [
3,
5,
6] have established that when an electroconductive body is subjected to induction heating by a quasi-steady electromagnetic field, the resulting stress state is primarily influenced by the generated Joule heat
, with the effect of ponderomotive forces
being negligible. Consequently, under plane deformation driven solely by the temperature field
, the governing equations for the two-dimensional quasi-static thermoelasticity problem are formulated as follows [
3].
Here, denote the components of the quasi-static stress tensor , and represents the sum of the normal stress components; is the linear thermal expansion coefficient and is Poisson’s ratio; while stands for Young’s modulus.
Expressions
define the boundary conditions on the panel surfaces at
and the following expressions
describe the boundary conditions on the end surfaces at
. These values are taken into consideration at the end sections of the panel
, as indicated by the symbol
in (3). In relations (1)‒(3), the dimensional Cartesian coordinates
,
are used.
To evaluate the thermomechanical response of the panel, the stress intensity is calculated using the known components of the stress tensor—
—along with the temperature distribution
. For the two-dimensional case under consideration, the stress intensity is expressed by the following formula:
4. Solution Methodology for 2D Initial Boundary Problems
The set of functions
varies with the spatial coordinates
and time
. These functions are approximated along the thickness direction using cubic polynomials expansions:
The coefficients
in the polynomials (5) are expressed through the integral characteristics
of the functions
, defined as follows:
along with the boundary values
of the functions on the surfaces
. To derive the equations for determining the integral characteristics
, the governing Equation (1) involving
and
are multiplied by
and integrated over the thickness variable
, using definitions (5) and (6). This procedure yields a system of initial equations for
, which reduces the original two-dimensional problem to a set of one-dimensional equations in the coordinate
. These equations are solved by applying finite integral transforms in the
direction, in accordance with the boundary conditions specified at the ends of the panel
. A detailed description of the method for finding the components of the stress tensor in the panel is described in [
3].
5. Computational Analysis of Stress Tensor and Stress Intensity in an Electroconductive Panel Under Quasi-Steady Electromagnetic Heating
By applying the methodology described in [
3] and the approach presented above, we derive expressions for the temperature and stress tensor components in a nonferromagnetic panel subjected to a uniform quasi-steady electromagnetic field. This field is characterized by the tangential values of the magnetic field intensity component
on the panel surfaces at
and
, expressed as follows
The dimensionless Cartesian coordinates are defined as , , with and , where t denotes time. In Expressions (7), the time-dependent function is given by . is the imaginary unit, and the parameter , where , characterizes the penetration depth of the induction currents with frequency relative to the panel’s half-thickness . In the expression , the parameter denotes the dimensionless time required for electromagnetic oscillations at frequency to reach a steady-state amplitude , where .
The numerical experiment was performed for an electroconductive panel made of tungsten [
15] (see
Table 1).
The panel has a thickness of , and a width of (corresponding to a relative half-width ). Two values of the induction current penetration depth, given in relation to the panel’s half-thickness h, were calculated: near-surface heating is represented by parameter , while in-depth heating is represented by .
The surface heating of the panel under study is represented by the circular frequency of electromagnetic oscillations , while the in-depth heating is represented by the circular frequency of electromagnetic oscillations .
5.1. Analysis of Stress Tensor Components
Figure 1,
Figure 2,
Figure 3,
Figure 4,
Figure 5,
Figure 6,
Figure 7 and
Figure 8 show the change in Fourier time and in the cross-sectional area of the considered panel of the components
,
,
, and
of the quasi-static stress tensor at the value
of the Biot criterion under induction heating by a quasi-steady-state EMF. The time variation in the Fourier data of the quasi-static stress tensor components was calculated at the characteristic points
,
, and
of the cross-section of the tungsten panel under consideration.
Figure 1,
Figure 2,
Figure 3 and
Figure 4 show the data dependencies of the stress tensor components under the near-surface induction heating with
, and
Figure 5,
Figure 6,
Figure 7 and
Figure 8 show the dependencies of the data components under its in-depth heating with
.
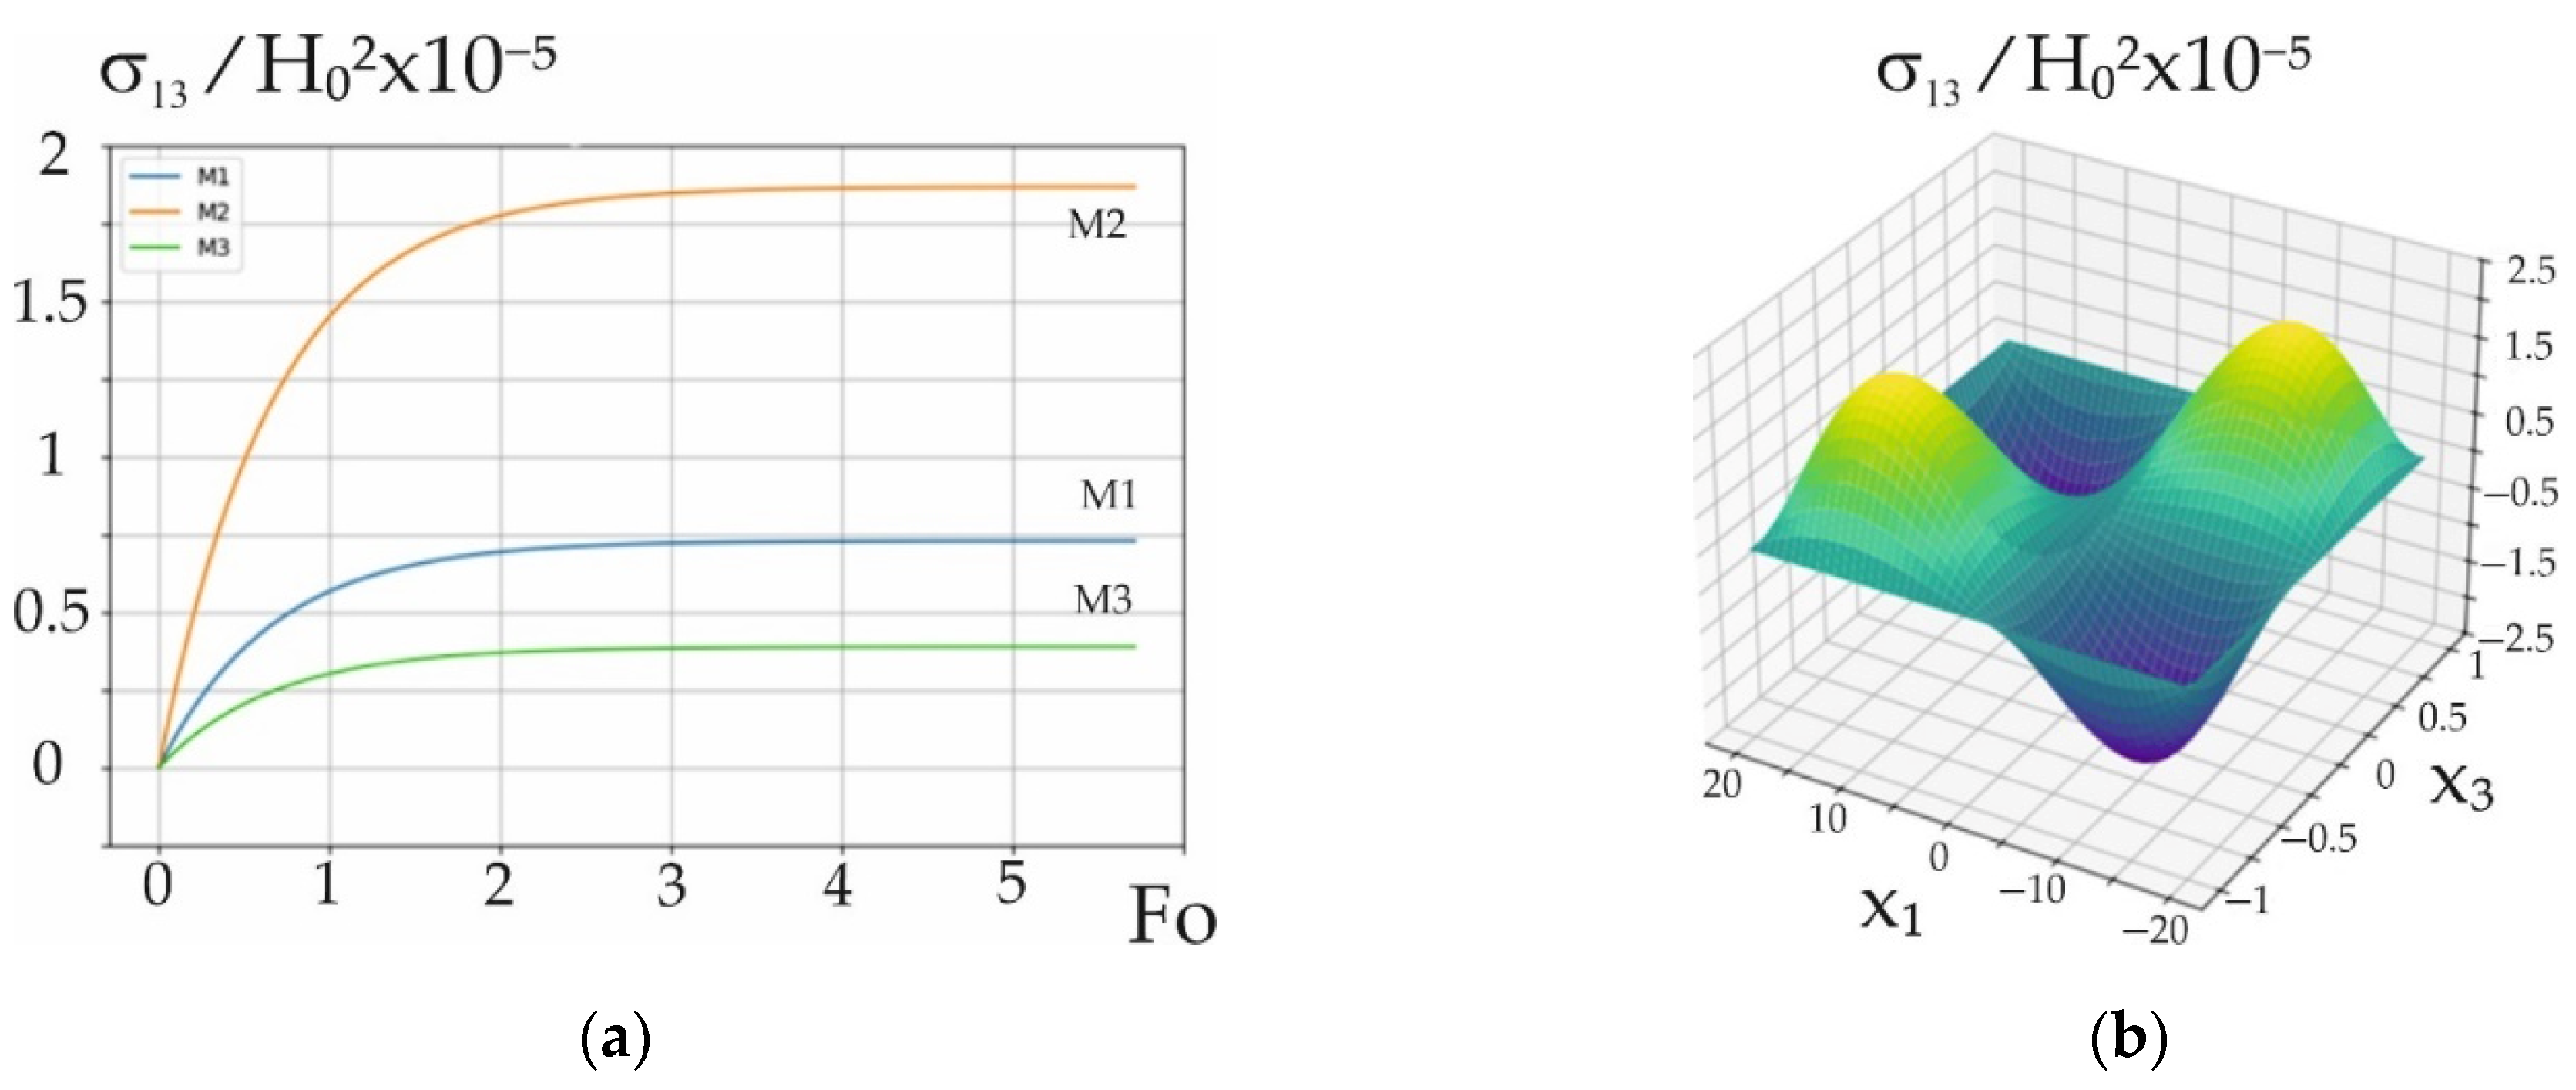
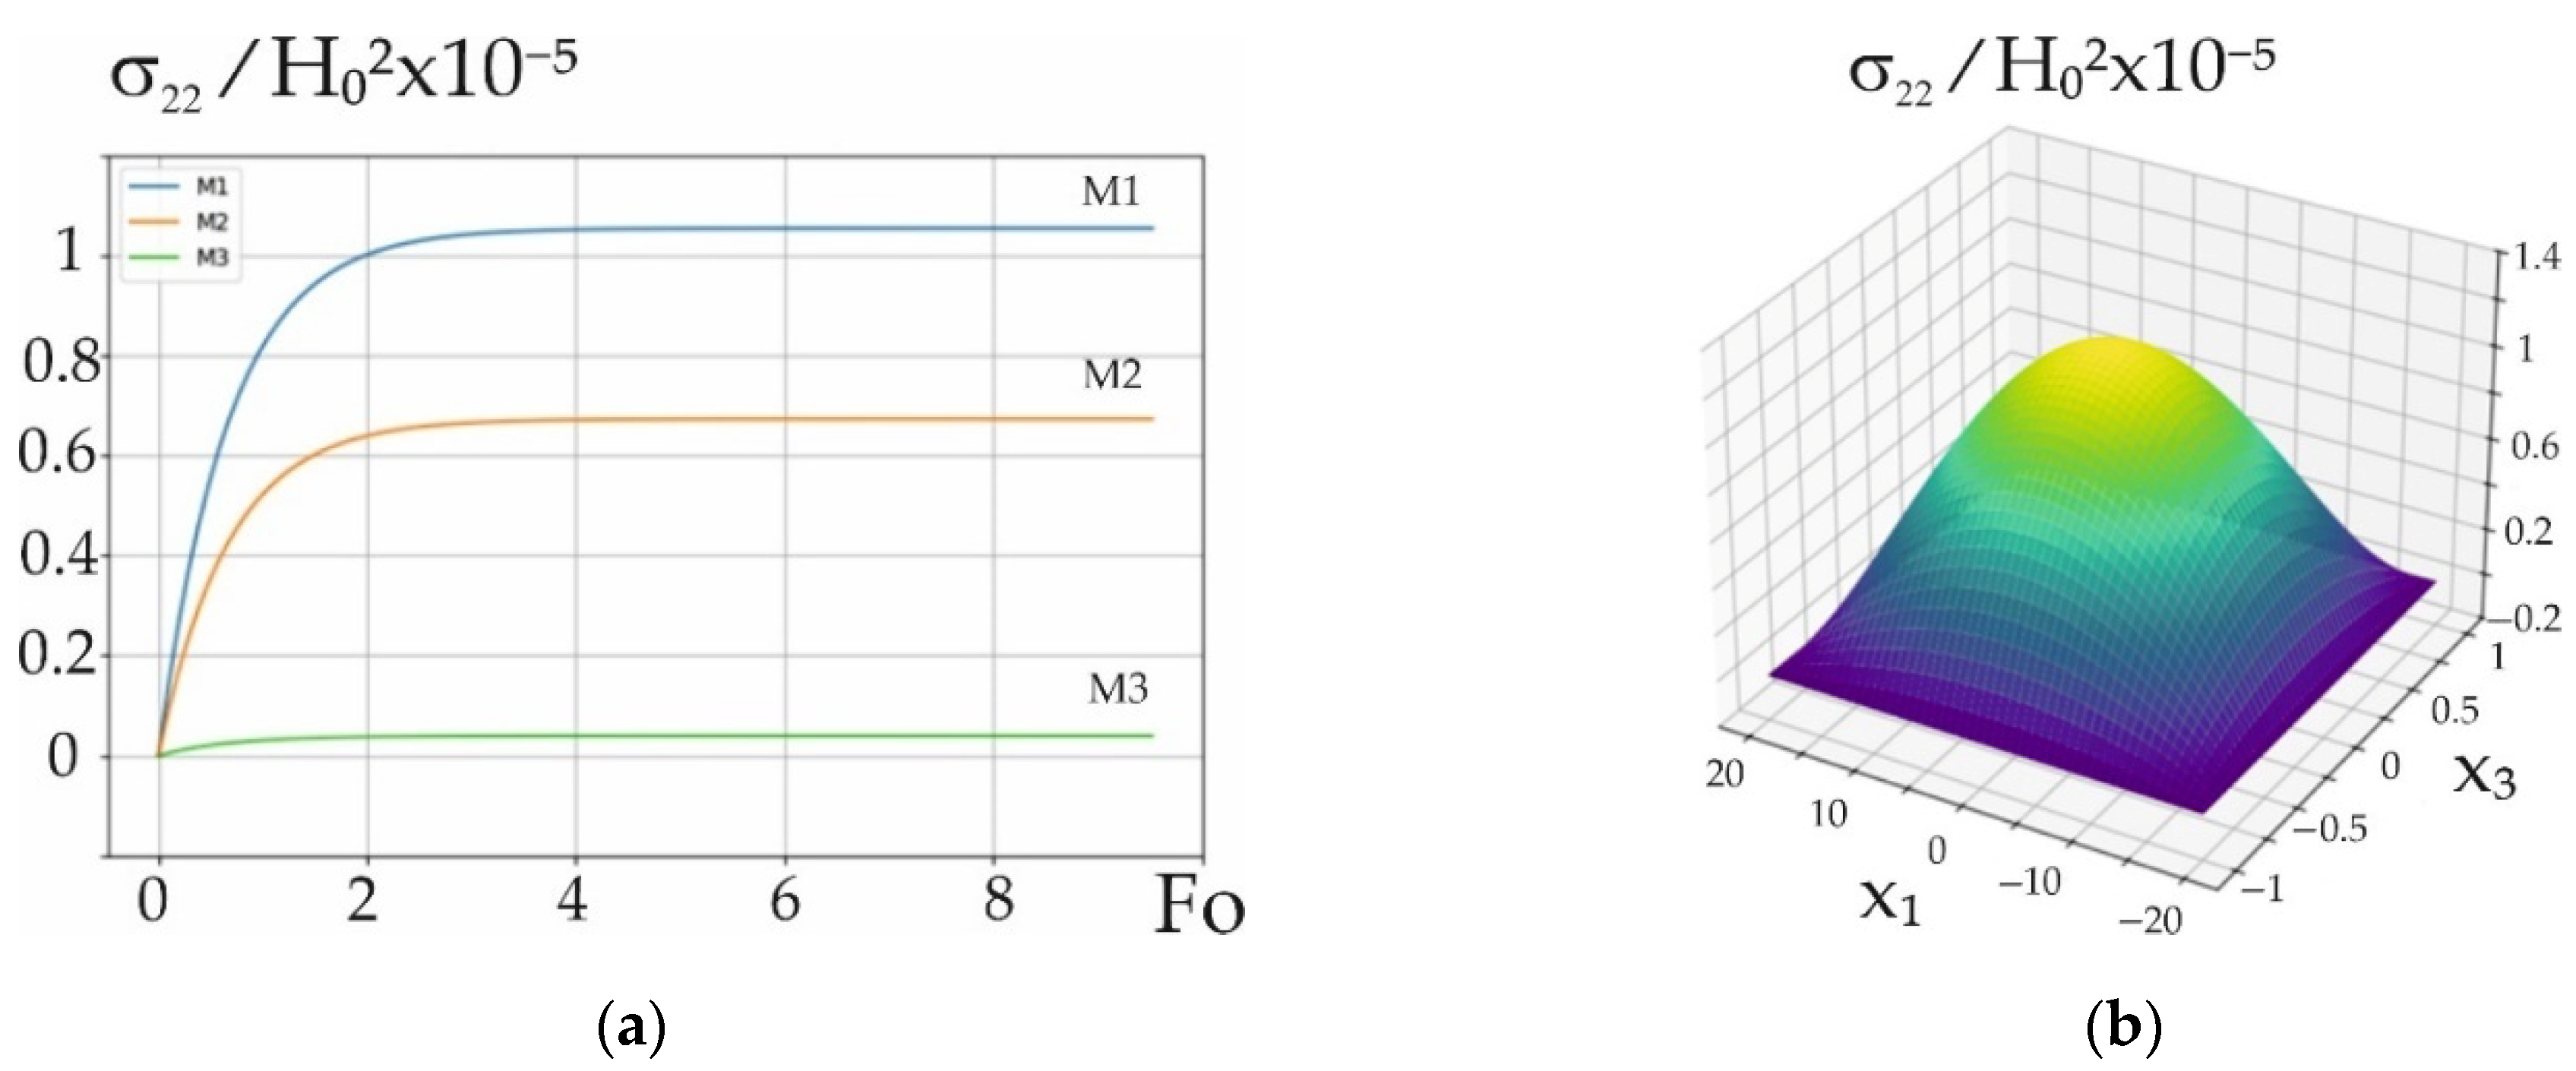
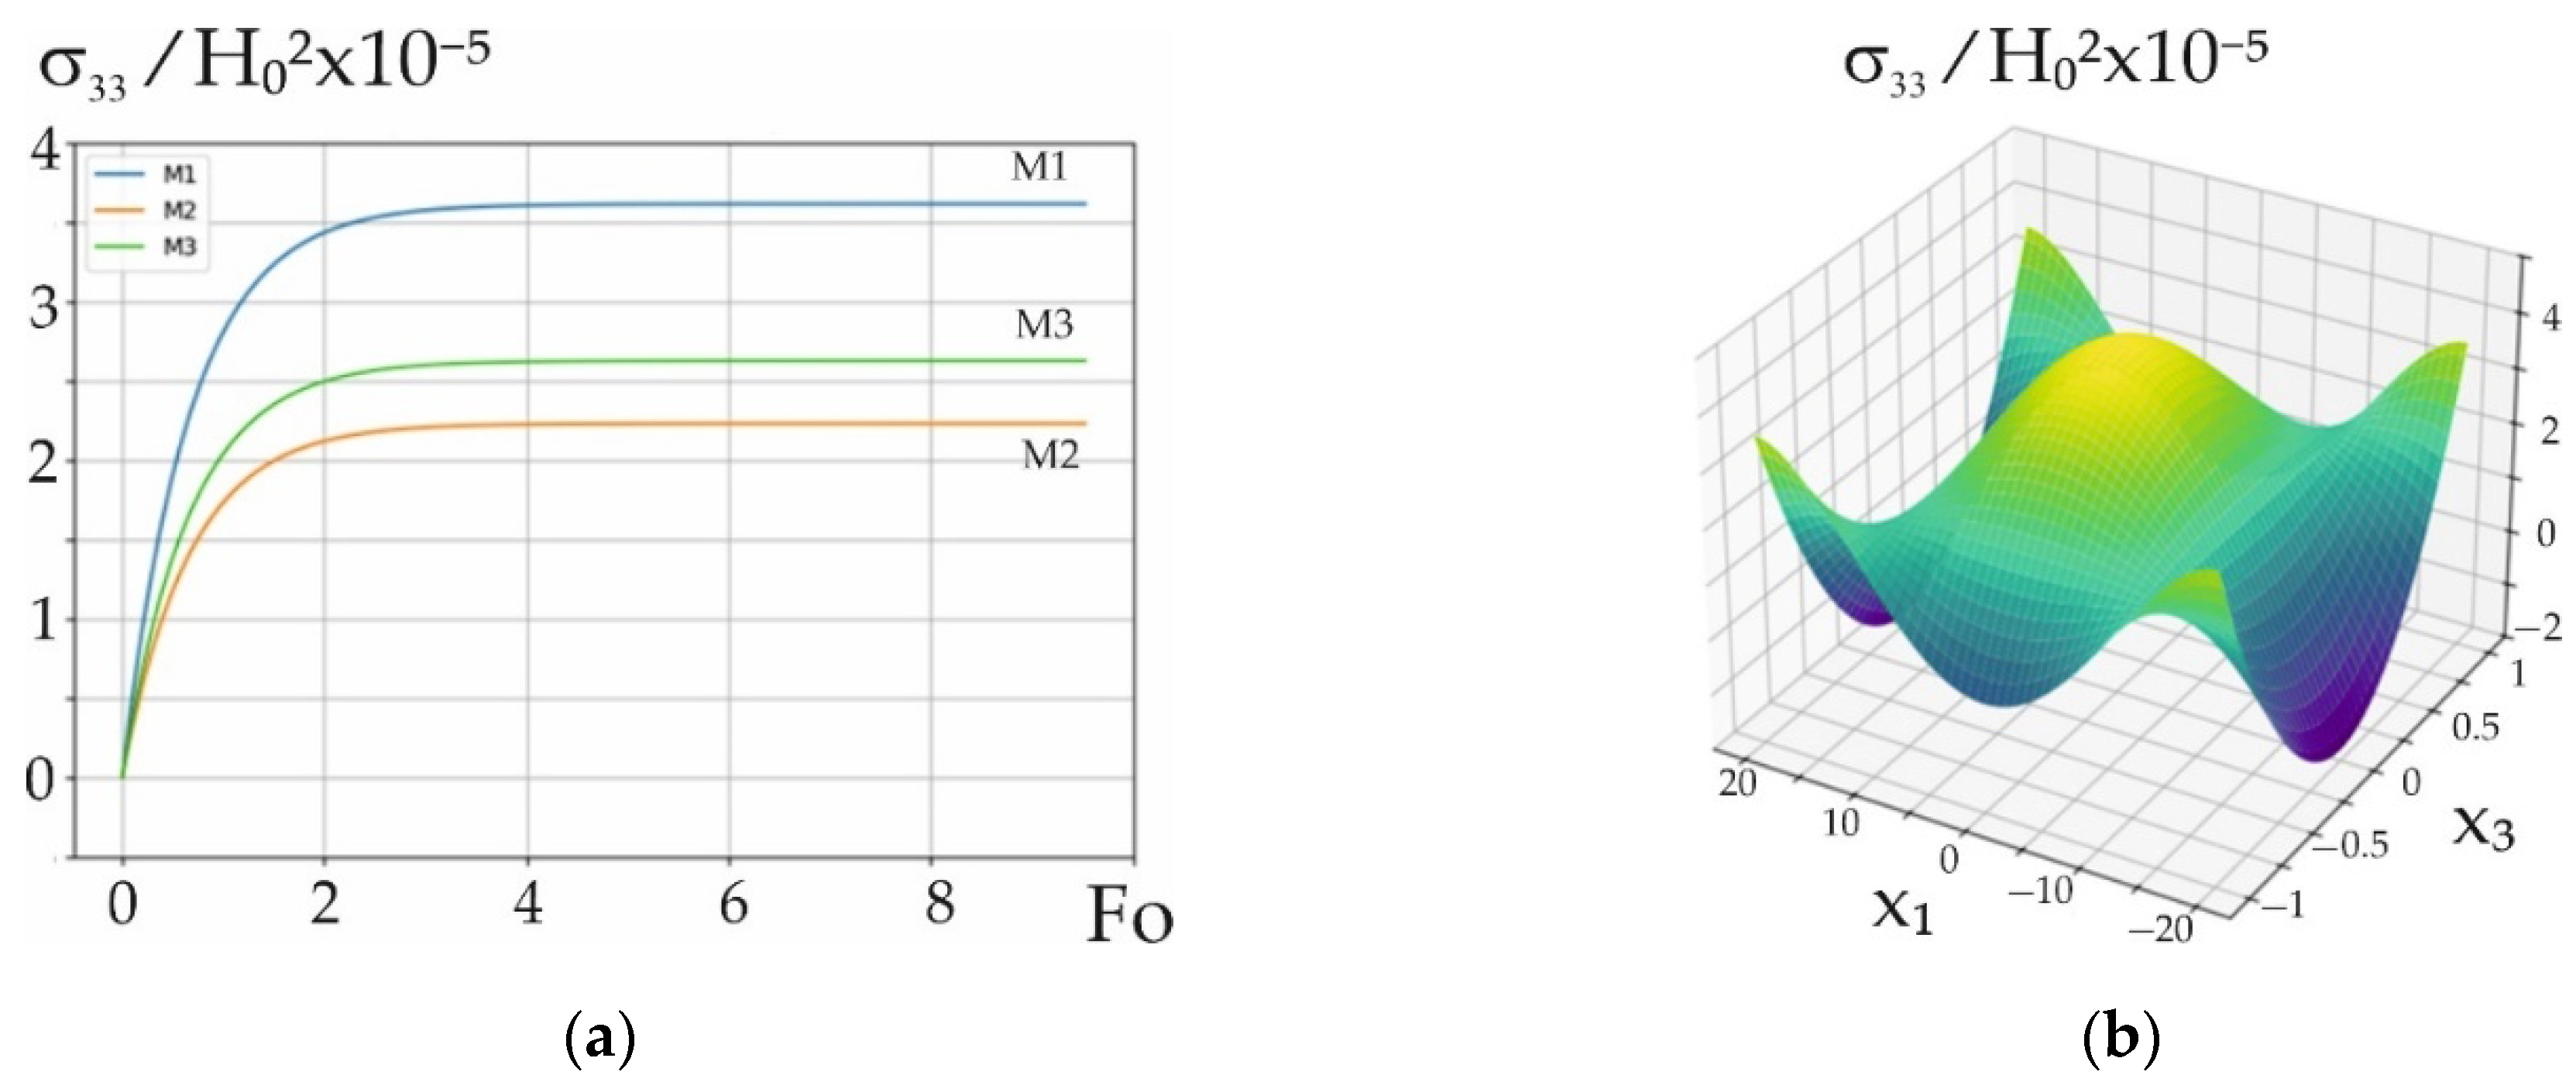
When a panel with half-width was exposed to near-surface induction heating by a quasi-steady electromagnetic field with , the time-dependent behavior of the stress tensor components at characteristic points , , and was numerically analyzed.
The results showed that
The stress tensor component takes on maximum compressive values at point , which are approximately nine times greater than the maximum tensile values at points and .
The stress tensor component at all characteristic points has tensile values that are at maximum at point and are approximately five times smaller than the values of the component at this point.
The stress tensor component at all characteristic points has tensile values that are at maximum at point and are approximately four times larger than the same maximum tensile values of the component at this point.
The stress tensor component at all characteristic points has tensile values that are at maximum at point and are approximately three times larger than the same maximum tensile values of the component at this point.
It is determined that the maximum compressive stresses have the component at point , and the maximum tensile stresses have the component at point .
Accordingly, the maximum compressive stresses of the component at point are approximately two times smaller than the maximum tensile stresses of the component at point .
The maximum values of shear stresses are approximately an order of magnitude smaller than the same values of normal stresses and and approximately two orders of magnitude smaller than the same values of normal stresses
Analysis of the distribution of the stress tensor components over the cross-sectional area of the panel showed that
The maximum values of the component of the stress tensor are taken at points corresponding to the midpoints of the sides of the rectangle of the strip cross-section, and the maximum compressive values are taken at the corner points of this rectangle.
The component takes on either the compressive or tensile maximum values of the same magnitude at opposite points on the diagonals of the cross-sectional rectangle.
The component takes maximum values at the intersection point of the diagonals of the cross-sectional rectangle, and minimum values on the sides of this rectangle.
The component takes on maximum tensile values at the intersection point of the diagonals of the cross-sectional rectangle and at its corner points and takes on maximum compressive values at the midpoints of the sides of the rectangle. Note that the maximum tensile values are approximately equal to the maximum compressive values of this component.
Let us present the results of the analysis of the change in time of the components of the stress tensor in the characteristic points , , and of a panel with half-width subjected to in-depth induction heating by a quasi-steady electromagnetic field with :
The stress tensor component takes on maximum compressive values at point , which are approximately 12 times larger than the maximum tensile values at points and .
The stress tensor component takes on maximum tensile values at point , which are approximately five times larger than the same maximum tensile values at point .
The stress tensor component takes on maximum tensile values at point , which are approximately 20 times larger than the same values at point .
The stress tensor component takes on maximum tensile values at point , which are approximately 1.5 times larger than the same maximum tensile values at point .
Analysis of the distribution of the stress tensor components over the cross-sectional area of the panel showed that
The maximum tensile values of the component of the stress tensor are taken at points corresponding to the midpoints of the sides of the cross-sectional rectangle, and the maximum compressive values are taken at the corner points of this rectangle.
The component takes either compressive or tensile maximum values of the same magnitude at opposite points of the diagonals of the cross-sectional rectangle.
The component takes maximum compressive values at the corner points of the cross-sectional rectangle and maximum tensile values at the intersection point of the diagonals of this rectangle.
The component takes maximum tensile values at the corner points and at the intersection of the diagonals of the cross-sectional rectangle, and maximum compressive values at the midpoints of its sides. Note that the maximum tensile values are approximately of the same order as the maximum compressive values of this component.
During in-depth heating, the maximum values of tensile stresses are approximately 50 times smaller than the same values under near-surface induction heating. The qualitative nature of the change in compressive and tensile stresses under in-depth heating conditions is approximately the same as under near-surface heating conditions. Accordingly, the maximum values of the stress tensor components under in-depth heating conditions are significantly smaller than the same values under near-surface heating conditions. The stresses are approximately 50 times smaller; the stresses , , and are approximately 40 times smaller. The largest in magnitude are compressive stresses and tensile stresses .
5.2. Analysis of Stress Intensity
Figure 9 shows the time variation in the stress intensity
during induction heating by the EMF at
for both near-surface heating (
Figure 9a) and in-depth heating (
Figure 9b). Additionally,
Figure 10 presents the spatial distribution of the stress intensity
over the cross-sectional area of the panel under consideration at
and
—corresponding to the moment when the stress intensity reaches its peak—for induction heating with penetration depths
(
Figure 10a) and
(
Figure 10b).
The characteristic points , , and of the cross-section of the tungsten panel under consideration (curves M1-M3, respectively) were used to calculate the change in Fourier time of the stress intensities .
6. Conclusions
Based on the conducted analysis, the following key findings were established:
- (1)
The highest stress intensity values in the panel during induction heating by a quasi-steady electromagnetic field occur near its edges. These peak values are strongly influenced by the dimensionless penetration depth parameter and the Biot number.
- (2)
The stress intensity distribution at specific characteristic points (M1–M3) of the panel’s cross-section varies significantly with changes in 0 and Bi.
- (3)
At a fixed , reducing the Biot number leads to a convergence in the stress intensity values at the selected points. Notably, when , the stress values are almost the same. This behavior reflects a heating regime approaching thermally insulated boundary conditions on the panel’s lateral surfaces.
- (4)
Under near-surface induction heating conditions (, the maximum stress intensity is approximately 40 times greater than that observed under in-depth heating (, ). Hence, near-surface heating is more effective for achieving higher stress levels in tungsten panels.
- (5)
A tenfold reduction in the Biot number results in a tenfold increase in the time required for the stress intensity to reach a steady-state level, regardless of the induction heating mode.
- (6)
For both near-surface and in-depth heating scenarios, the maximum stress intensity scales quadratically with the amplitude in the steady-state electromagnetic oscillations.
The numerical investigation of stress intensity behavior in a tungsten panel and the newly revealed dependencies on induction heating conditions and convective heat transfer parameters provide valuable insights. These findings have both theoretical and practical importance for engineering applications, particularly in predicting the load-bearing capacity of electroconductive plate structures subjected to quasi-steady electromagnetic fields.
The proposed two-dimensional physical and mathematical model and calculation scheme for studying the thermomechanical behavior of homogeneous nonferromagnetic conductive elements under the action of a quasi-stationary electromagnetic field also allows us to investigate the thermomechanical properties of conductive elements made of structurally heterogeneous materials, in particular, matrix metal composites based on tungsten and copper. To do this, experimenters need to determine the physical and mechanical characteristics of the newly created heterogeneous nonferromagnetic materials. These characteristics can be used to theoretically predict, based on the proposed physical and mathematical model, the thermomechanical behavior of plate elements made not only of homogeneous materials but also of structurally heterogeneous materials.
Author Contributions
Conceptualization, R.M. and P.G.; methodology, R.M., D.C., and P.G.; software, V.P., E.S., and M.K.; formal analysis, R.M., V.P., and P.G.; investigation, R.M., V.P., and M.K.; data curation, P.G., Z.K., and E.S.; writing—original draft preparation R.M.; writing—review and editing, D.C., M.K., and V.P.; visualization, P.G., Z.K., and M.K.; supervision, D.C.; funding acquisition, D.C., and P.G. All authors have read and agreed to the published version of the manuscript.
Funding
This research received no external funding.
Informed Consent Statement
Informed consent was obtained from all subjects involved in the study.
Data Availability Statement
Data are contained within the article.
Conflicts of Interest
The authors declare no conflicts of interest.
References
- Lupi, S. Fundamentals of Electroheat, Electrical Technologies for Process Heating; Springer: Cham, Switzerland, 2017. [Google Scholar] [CrossRef]
- Hetnarski, R. Encyclopedia of Thermal Stresses; Springer: Dordrecht, The Netherlands, 2014. [Google Scholar] [CrossRef]
- Musii, R.; Lis, M.; Pukach, P.; Chaban, A.; Szafraniec, A.; Vovk, M.; Melnyk, N. Analysis of Varying Temperature Regimes in a Conductive Strip during Induction Heating under a Quasi-Steady Electromagnetic Field. Energies 2024, 17, 366. [Google Scholar] [CrossRef]
- Bobart, G.F.; Induction Heating. AccessScience. 2020. Available online: https://www.accessscience.com/content/article/a341500 (accessed on 15 May 2023).
- Rudnev, V.; Loveless, D.; Cook, R. Handbook of Induction Heating; CRC Press: London, UK; Taylor and Francis Group: Abingdon, UK, 2018. [Google Scholar] [CrossRef]
- Drobenko, B.; Vankevych, P.; Ryzhov, Y.; Yakovlev, M. Rational approaches to high temperature induction heating. Int. J. Eng. Sci. 2017, 117, 34–50. [Google Scholar] [CrossRef]
- Shen, H.; Yao, Z.Q.; Shi, Y.J.; Hu, J. Study on temperature field in high frequency induction heating. Acta Metall. Sin. Engl. Lett. 2006, 19, 190–196. [Google Scholar] [CrossRef]
- Lee, K.S.; Kim, S.W.; Eom, D.H. Temperature distribution and bending behaviour of thick metal plate by high frequency induction heating. Mater. Res. Innov. 2011, 15 (Suppl. S1), s283–s287. [Google Scholar] [CrossRef]
- Barglik, J. Induction hardening of steel elements with complex shapes. Przegląd Elektrotechniczny 2018, 94, 51–54. [Google Scholar] [CrossRef]
- Areitioaurtena, M.; Segurajauregi, U.; Akujärvi, V.; Fisk, M.; Urresti, I.; Ukar, E. A semi-analytical coupled simulation approach for induction heating. Adv. Model. Simul. Eng. Sci. 2021, 8, 14. [Google Scholar] [CrossRef]
- Babilas, R.; Kądziołka-Gaweł, M.; Bajorek, A.; Gębara, P.; Radoń, A.; Warski, T.; Bialas, O.; Spilka, M.; Łoński, W.; Młynarek-Żak, K. Effect of Cu addition on microstructure, wear, and corrosion resistance of AlCoCrFeNiSi0.5Cux (x = 0.01, 0.05, 0.1) high-entropy alloys. Arch. Civ. Mech. Eng. 2025, 25, 48. [Google Scholar] [CrossRef]
- Junfeng Xu, Ming Yang, Honghao Ma, Zhaowu Shen, Zijun Chen, Fabrication and performance studies on explosively welded CuCrZr/316L bimetallic plate applied in extreme environments. J. Mater. Res. Technol. 2020, 9, 4. [CrossRef]
- Sas-Boca, I.-M.; Iluțiu-Varvara, D.-A.; Tintelecan, M.; Aciu, C.; Frunzӑ, D.I.; Popa, F. Studies on Hot-Rolling Bonding of the Al-Cu Bimetallic Composite. Materials 2022, 15, 8807. [Google Scholar] [CrossRef] [PubMed]
- Han, Y.; Li, S.; Cao, Y.; Li, S.; Yang, G.; Yu, B.; Song, Z.; Wang, J. Mechanical Properties of Cu-W Interpenetrating-Phase Composites with Different W-Skeleton. Metals 2022, 12, 903. [Google Scholar] [CrossRef]
- Temperature Dependent Elastic and Thermal Properties Database. Available online: http://www.jahm.com (accessed on 2 May 2013).
Figure 1.
Time variation in the stress tensor component at points M1-M3 on the panel (a) and its distribution across the cross-section at Fourier time moments (b) under near-surface induction heating with ; (c) is an inset of (a) at points M1, M2.
Figure 1.
Time variation in the stress tensor component at points M1-M3 on the panel (a) and its distribution across the cross-section at Fourier time moments (b) under near-surface induction heating with ; (c) is an inset of (a) at points M1, M2.
Figure 2.
Time variation in the stress tensor component at points M1-M3 on the panel (a) and its distribution across the cross-section at Fourier time moments (b) under near-surface induction heating with .
Figure 2.
Time variation in the stress tensor component at points M1-M3 on the panel (a) and its distribution across the cross-section at Fourier time moments (b) under near-surface induction heating with .
Figure 3.
Time variation in the stress tensor component at points M1-M3 on the panel (a) and its distribution across the cross-section at Fourier time moments (b) under near-surface induction heating with .
Figure 3.
Time variation in the stress tensor component at points M1-M3 on the panel (a) and its distribution across the cross-section at Fourier time moments (b) under near-surface induction heating with .
Figure 4.
Time variation in the stress tensor component at points M1-M3 on the panel (a) and its distribution across the cross-section at Fourier time moments (b) under near-surface induction heating with .
Figure 4.
Time variation in the stress tensor component at points M1-M3 on the panel (a) and its distribution across the cross-section at Fourier time moments (b) under near-surface induction heating with .
Figure 5.
Time variation in the stress tensor component at points M1-M3 on the panel (a) and its distribution across the cross-section at Fourier time moments (b) under in-depth induction heating with ; (c) is an inset of (a) at points M1, M2.
Figure 5.
Time variation in the stress tensor component at points M1-M3 on the panel (a) and its distribution across the cross-section at Fourier time moments (b) under in-depth induction heating with ; (c) is an inset of (a) at points M1, M2.
Figure 6.
Time variation in the stress tensor component at points M1-M3 on the panel (a) and its distribution across the cross-section at Fourier time moments (b) under in-depth induction heating with .
Figure 6.
Time variation in the stress tensor component at points M1-M3 on the panel (a) and its distribution across the cross-section at Fourier time moments (b) under in-depth induction heating with .
Figure 7.
Time variation in the stress tensor component at points M1-M3 on the panel (a) and its distribution across the cross-section at Fourier time moments (b) under in-depth induction heating with .
Figure 7.
Time variation in the stress tensor component at points M1-M3 on the panel (a) and its distribution across the cross-section at Fourier time moments (b) under in-depth induction heating with .
Figure 8.
Time variation in the stress tensor component at points M1-M3 on the panel (a) and its distribution across the cross-section at Fourier time moments (b) under in-depth induction heating with .
Figure 8.
Time variation in the stress tensor component at points M1-M3 on the panel (a) and its distribution across the cross-section at Fourier time moments (b) under in-depth induction heating with .
Figure 9.
Time variation in the stress intensity in a tungsten panel with a thickness of 2h = 2 mm and width of 2d = 40 mm under induction heating: (a) for and (b) for . The curves correspond to observation points , , and (labeled M1–M3), with Biot number .
Figure 9.
Time variation in the stress intensity in a tungsten panel with a thickness of 2h = 2 mm and width of 2d = 40 mm under induction heating: (a) for and (b) for . The curves correspond to observation points , , and (labeled M1–M3), with Biot number .
Figure 10.
Variation in the stress intensity over the cross-sectional area in a tungsten panel with thickness 2h = 2 mm and width 2d* = 40 mm at the value of and under its induction heating: (a) for and (b) for .
Figure 10.
Variation in the stress intensity over the cross-sectional area in a tungsten panel with thickness 2h = 2 mm and width 2d* = 40 mm at the value of and under its induction heating: (a) for and (b) for .
Table 1.
The thermophysical and mechanical properties of tungsten.
Table 1.
The thermophysical and mechanical properties of tungsten.
| Property | Value |
|---|
| Density (ρ) | 19,250, kg/m3 |
| Melting point | 3695, K (≈3422 °C) |
| Boiling point | 6203, K |
| Electrical conductivity (σ) | 1.8 × 10⁷, /m |
| Thermal conductivity (λ) | 173, W/(m·K) |
| Specific heat capacity (c) | 134, J/(kg·K) |
| Young’s modulus (E) | 411, GPa |
| Poisson’s ratio (ν) | 0.28 |
| Coefficient of Linear Expansion (α) | 4.5 × 10⁻⁶, 1/K |
| Thermal diffusivity (κ) | 6.7 × 10⁻⁵, m2/s |
| Disclaimer/Publisher’s Note: The statements, opinions and data contained in all publications are solely those of the individual author(s) and contributor(s) and not of MDPI and/or the editor(s). MDPI and/or the editor(s) disclaim responsibility for any injury to people or property resulting from any ideas, methods, instructions or products referred to in the content. |
© 2025 by the authors. Licensee MDPI, Basel, Switzerland. This article is an open access article distributed under the terms and conditions of the Creative Commons Attribution (CC BY) license (https://creativecommons.org/licenses/by/4.0/).


 ,
, 


