Article

Predicting the Energy Consumption in Chillers: A Comparative Study of Supervised Machine Learning Regression Models

by
Mohamed Salah Benkhalfallah
1,2,*,
Sofia Kouah
1,2,* and
Saad Harous
3,*
1
Department of Mathematics and Computer Science, University of Oum El Bouaghi, Oum El Bouaghi 04000, Algeria
2
Artificial Intelligence and Autonomous Things Laboratory, University of Oum El Bouaghi, Oum El Bouaghi 04000, Algeria
3
College of Computing and Informatics, University of Sharjah, Sharjah 27272, United Arab Emirates
*
Authors to whom correspondence should be addressed.
Energies 2025, 18(14), 3672; https://doi.org/10.3390/en18143672
Submission received: 27 April 2025 / Revised: 19 June 2025 / Accepted: 27 June 2025 / Published: 11 July 2025

Abstract

Optimization of energy consumption in urban infrastructures is essential to achieve sustainability and reduce environmental impacts. In particular, accurate regression-based energy forecasting of the energy consumption in various sectors plays a key role in informed decision-making, efficiency improvements, and resource allocation. This paper examines the application of artificial intelligence and supervised machine learning techniques to modeling and predicting the energy consumption patterns in the smart grid sector of a commercial building located in Singapore. By evaluating performance of several regression algorithms using various metrics, this study identifies the most effective method for analyzing sectoral energy consumption. The results show that the Regression Tree Ensemble algorithm outperforms other techniques, achieving an accuracy of 97.00%, followed by Random Forest Regression (96.20%) and Gradient Boosted Regression Trees (95.50%). These results underline the potential of machine learning models to foster intelligent energy management and promote sustainable energy practices in smart cities.

1. Introduction

Energy has transformed human life due to its essential role and its necessity in all aspects of our lives. It encompasses a quintessential essence within the realms of investment, innovations, and mobility; evolving trends; and across various sectors, contributing to the pursuit of growth, advancements, and the overarching quest for global intelligent prosperity [1]. Information technology has undergone rapid and remarkable evolution in recent decades [2], particularly driven by the emergence and maturation of innovative paradigms such as digital infrastructures, interconnected networks, the Internet of Things (IoT), electronic governance systems, and large-scale data analytics platforms [3]. Among the most transformative advancements are artificial intelligence (AI) and machine learning (ML), which have become instrumental in enhancing the efficiency, adaptability, and productivity of contemporary energy systems. These technologies empower energy experts to process and interpret vast volumes of heterogeneous energy data, providing comprehensive insights into consumption behaviors, generation capabilities, and storage dynamics [4]. Such analytical capabilities enable the design of more resilient and optimal energy systems while also facilitating accurate forecasting of future energy demands. A body of research [5,6,7,8,9,10,11,12] has successfully leveraged various AI methodologies to forecast energy consumption, thereby supporting strategic energy planning, optimizing the operational performance, and ensuring the stability of systems operating under diverse environmental and infrastructural conditions. The present study aims to advance the performance, relevance, and predictive capability of chiller energy consumption models by employing an enhanced suite of assessment metrics and a diverse array of supervised ML algorithms. These include Linear Regression (LR), Gradient Boosted Regression Trees (GBRTs), Random Forest Regression (RFR), Simple Regression Tree (SRT), Polynomial Regression (PR), and Regression Tree Ensemble (RTE), each selected for their demonstrated proficiency in extracting patterns from labeled datasets and producing highly accurate predictions in regression contexts. These models offer significant advantages in energy forecasting applications: interpretability, which supports transparent and explainable decision-making; scalability, which enables integration across various building sizes and infrastructures; and robustness, which ensures model resilience under varying operational conditions. Such characteristics are vital for promoting regulatory compliance and operational stability within intelligent energy management frameworks. Moreover, forecasting the energy consumption in commercial buildings offers numerous benefits: it reduces the monitoring times and operational costs for both utilities and consumers; accelerates anomaly detection and its resolution; simplifies the reporting process; and ultimately contributes to the realization of intelligent, responsive, and sustainable energy management systems [13]. This paper is organized as follows: Section 2 presents an examination of the relevant scientific literature, Section 3 delineates the methodology applied, Section 4 designates the specific tools and platforms employed, Section 5 discusses the results, and finally, this paper closes with a conclusion and future work directions.

2. The Literature Review

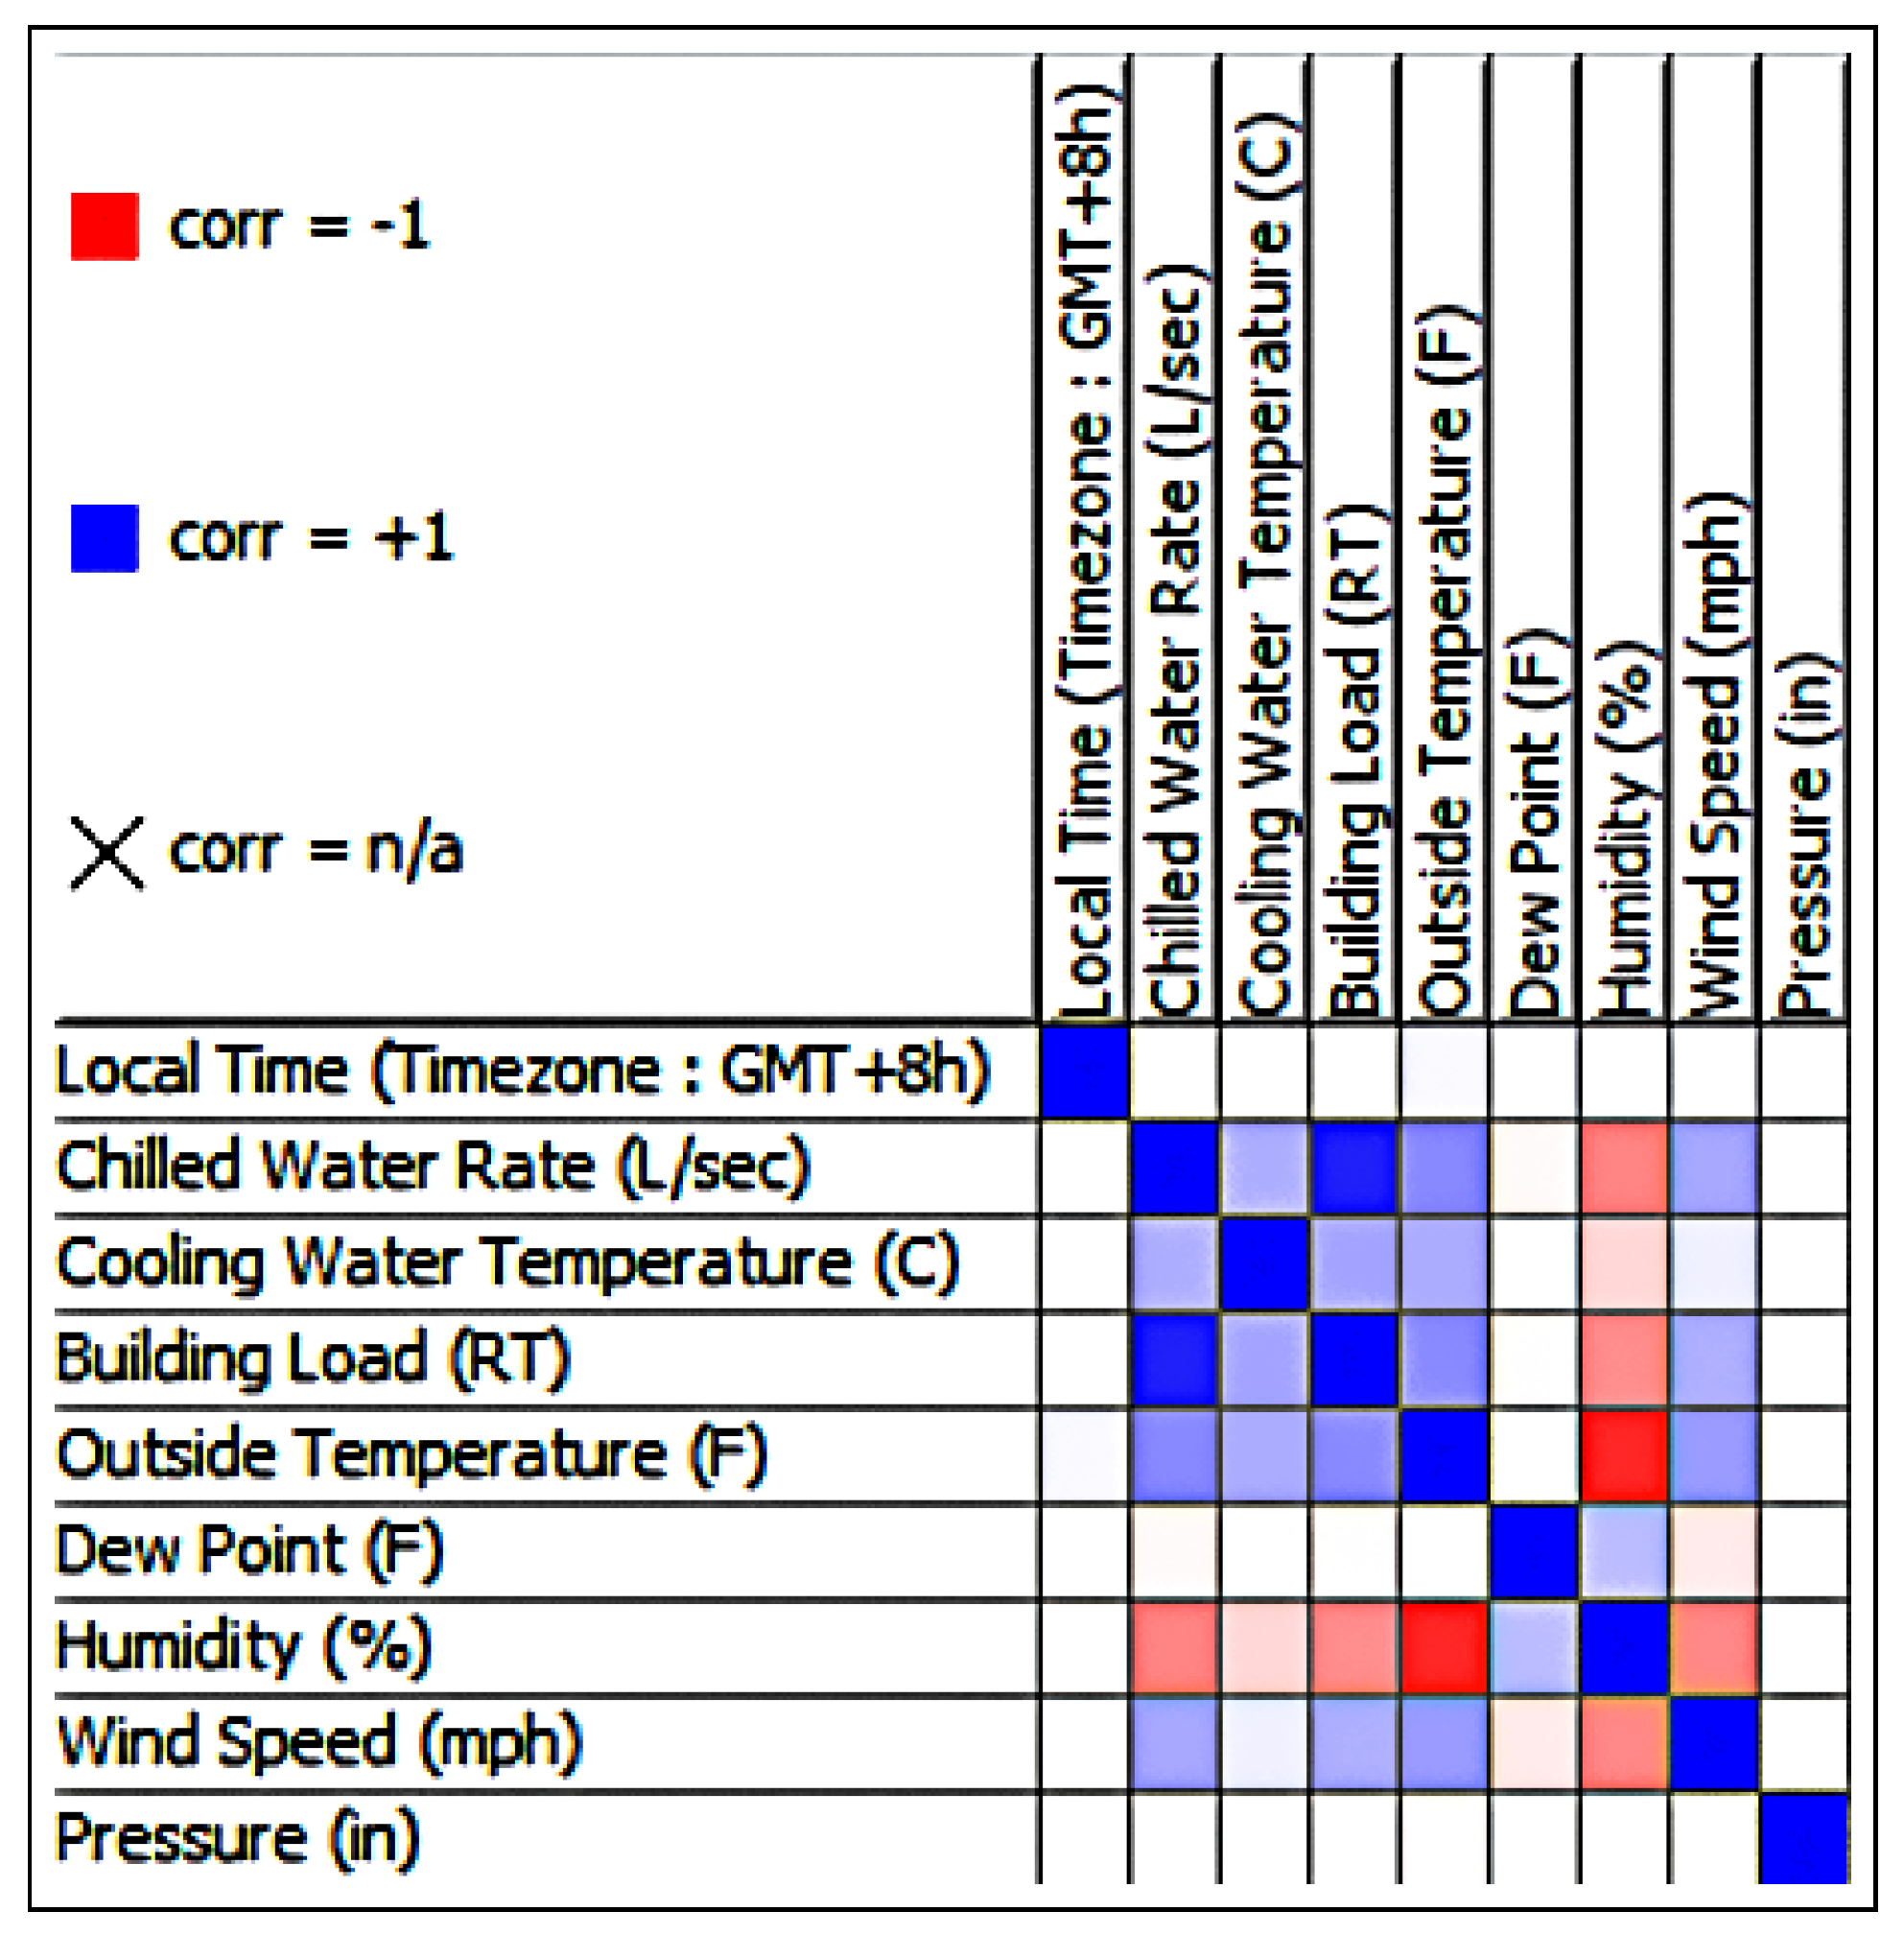
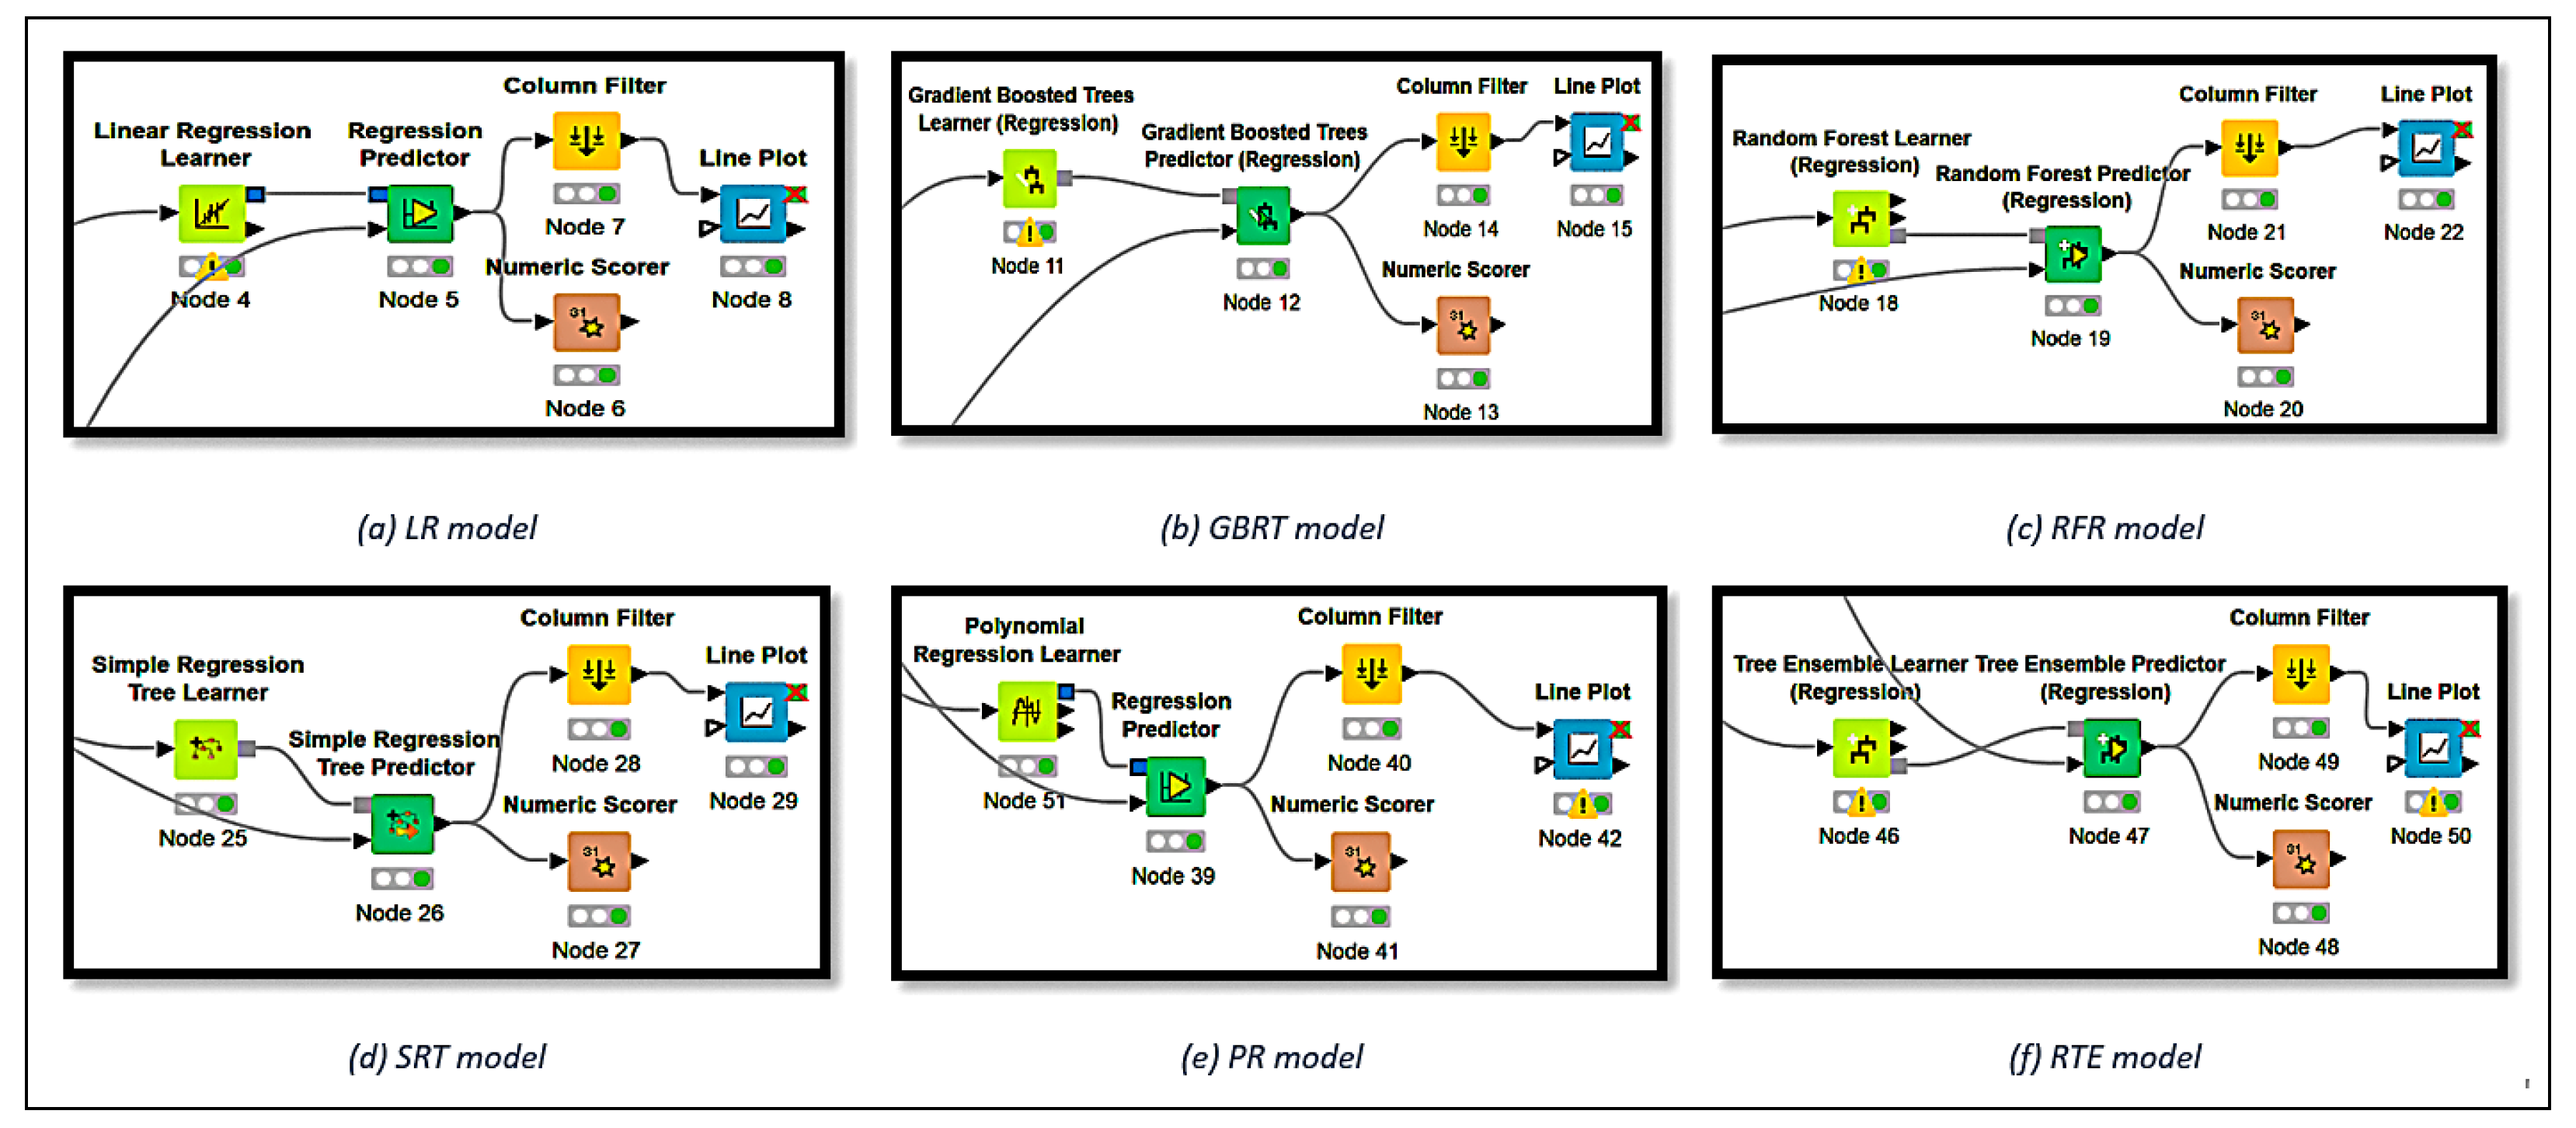
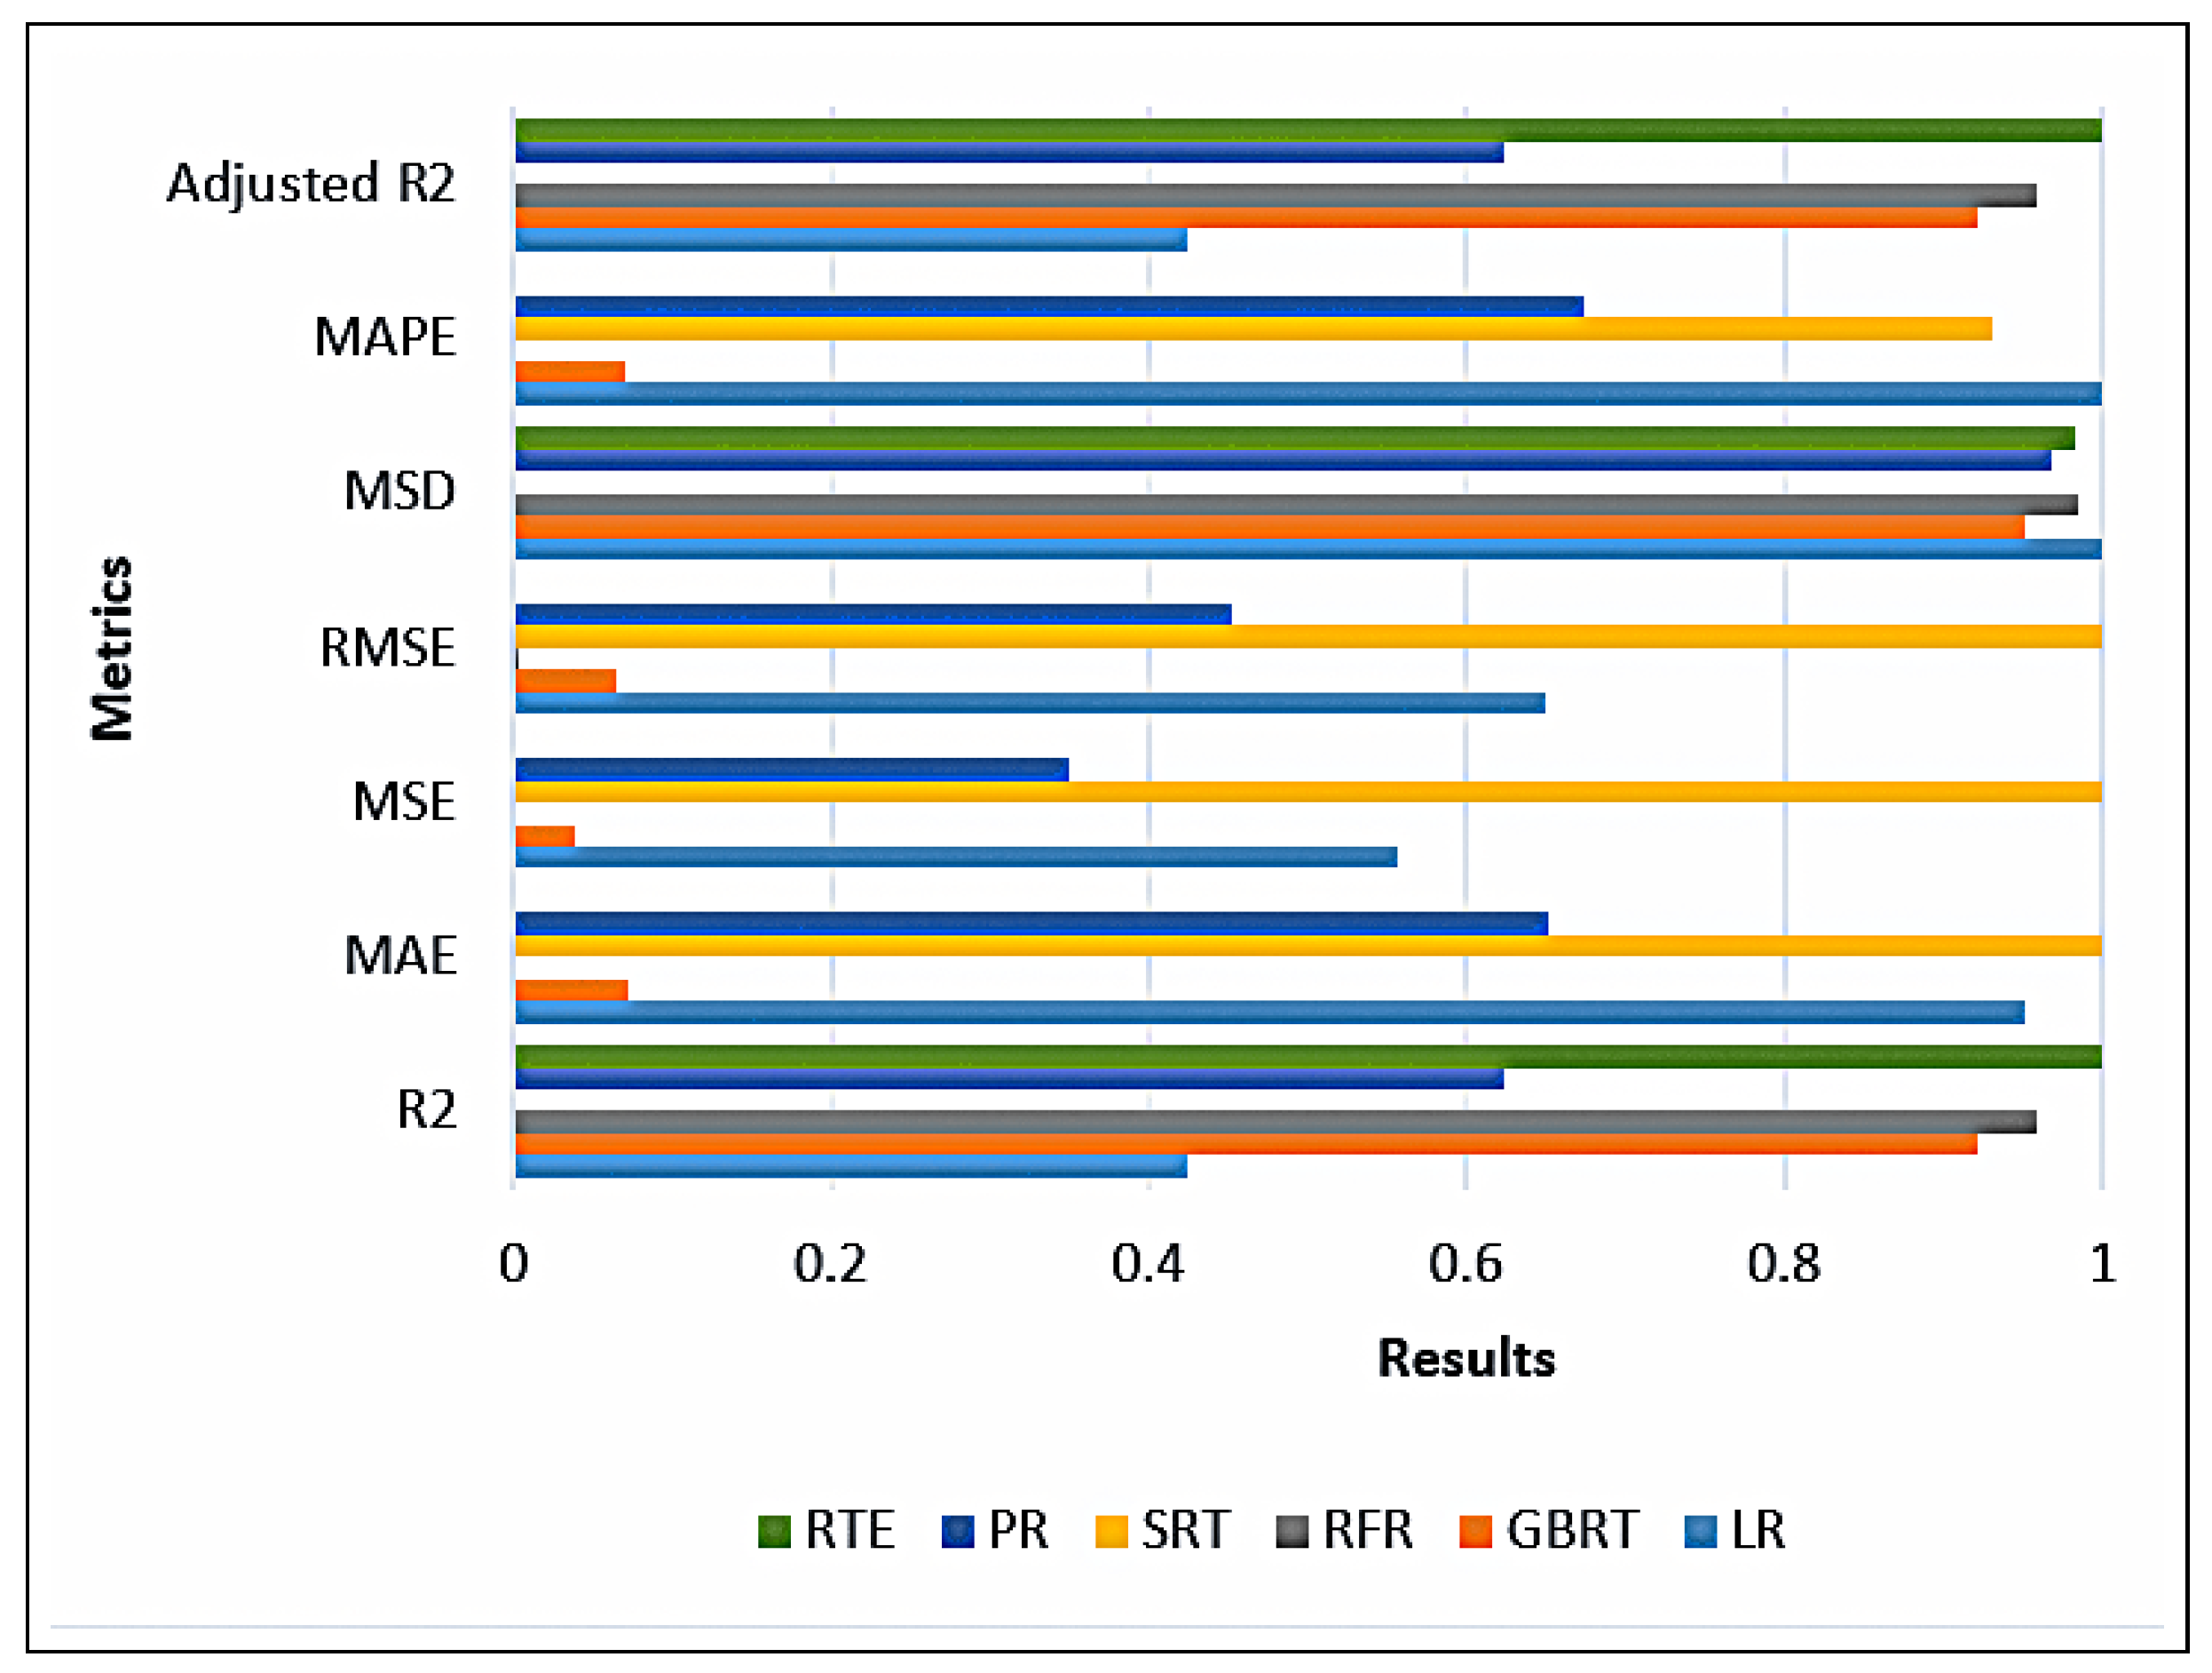
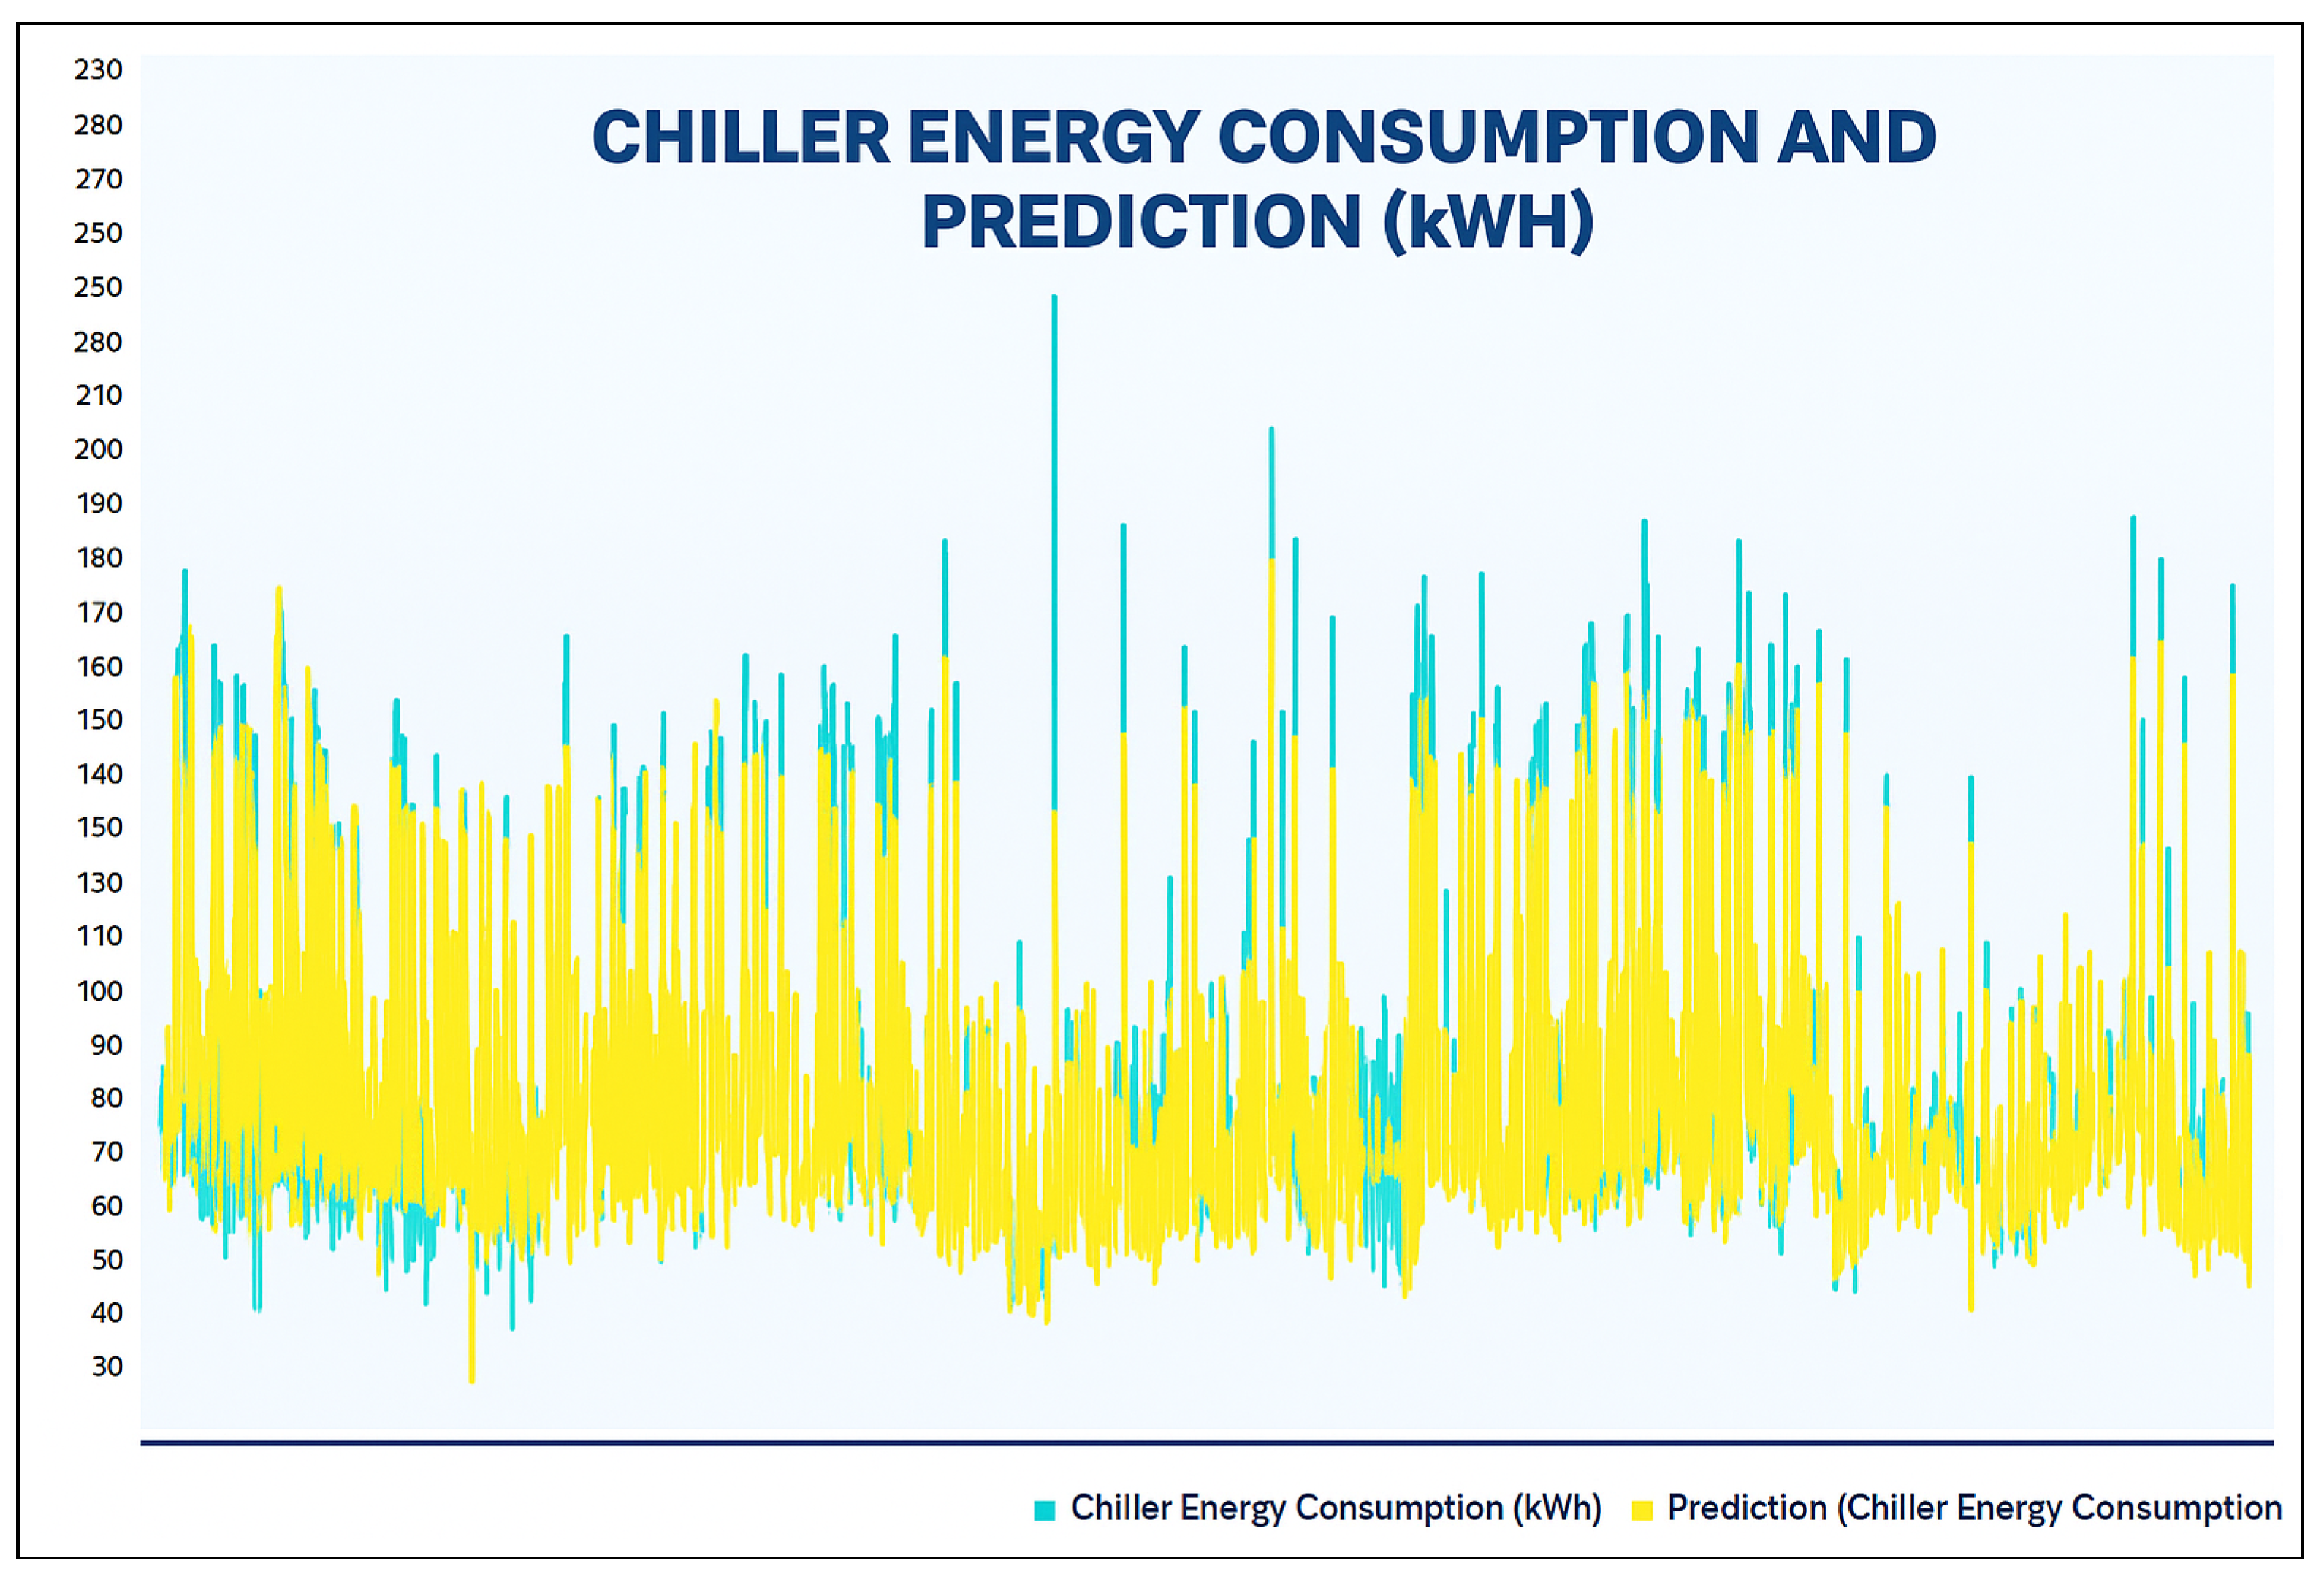
A profusion of scholarly research endeavors have been dedicated to investigating the domain of cooling energy, addressing a wide spectrum of challenges, resolutions, and prospects within the field of intelligent energy management. This section presents a comprehensive overview of the existing literature on forecasting the energy consumption for intelligent and optimized energy management. To identify the most impactful and relevant contributions, a systematic bibliographic search was conducted, covering peer-reviewed publications from July 2018 to February 2025. The search encompassed leading scientific databases, including IEEE Xplore, ScienceDirect, SpringerLink, and Google Scholar, and employed targeted keywords such as energy consumption, energy management, ML, supervised learning, regression, predictive models, and data mining. Studies were selected based on strict inclusion criteria: the application of ML algorithms to real-world energy datasets, the implementation of rigorous validation protocols, and the comparison of proposed approaches with conventional methods. The exclusion criteria eliminated purely theoretical studies without empirical validation, those lacking the proper documentation, and those relying exclusively on synthetic data. This rigorous selection process ensured the compilation of a representative and high-quality corpus of literature that captured the recent advancements in data-driven energy forecasting, with direct implications for the design and implementation of intelligent energy management systems.
The research [14] investigated the intricate evolution of the energy consumption trends in the United States, propelled by multifaceted drivers such as demographic shifts, technological advancements, and evolving consumer behaviors. This study advances the proposition that ML algorithms substantially enhance the forecasting precision across residential, commercial, and industrial energy sectors. Drawing on comprehensive datasets, this study evaluates diverse ML models, demonstrating the superior predictive reliability of logistic regression within the given context. This research further critiques the limitations of the conventional statistical methods in modeling nonlinearities and behavioral complexities, advocating for a transition toward data-driven, adaptive forecasting frameworks. By positioning accurate energy demand predictions as a foundational element for sustainable development and climate resilience, this study underscores the strategic value of ML in optimizing energy resource management and informing policy interventions. The study [15] investigates the application of advanced ML algorithms to optimizing the energy consumption forecasting for office building HVAC and lighting systems, components that collectively represent a significant share of total energy use, with HVAC alone accounting for up to 40%. Four regression-based models were evaluated: Extra Trees Regressor (ETR), Voting Hybrid Regression (VHR), Multi-Layer Perceptron Regression (MLPR), and K-Nearest Neighbors Regression (K-NN). Leveraging two years of real-world operational data, the ETR model achieved the highest predictive performance, with an R2 of 0.9943 and an RMSE of 0.4352, indicating exceptional accuracy. These findings underscore the effectiveness of ensemble-based methods, particularly boosted regression trees, in modeling complex, nonlinear patterns and managing data variability, thereby offering robust, interpretable, and scalable solutions for sustainable energy management in commercial office environments. The authors of [16] proposed a hybrid forecasting framework that synergistically integrated advanced ML algorithms with metaheuristic optimization techniques to enhance the predictive accuracy of electricity consumption models. Specifically, the framework combines gradient boosting methods with three optimization algorithms. The proposed models were empirically validated using real-world electricity consumption datasets from Turkey. Among the various configurations, the XGBoost-SSA hybrid demonstrates a superior performance, attaining the highest coefficient of determination (R²) and the lowest forecasting error metrics. This study distinguishes itself through its methodological robustness, high predictive fidelity, and tangible applicability to real-world energy management scenarios. Nonetheless, limitations persist regarding the model’s cross-regional generalizability and the absence of benchmarking against deep-learning-based time series models. The study [17] explores the application of ML algorithms to predicting the energy consumption in U.S. residential buildings. It uses the Residential Energy Consumption Survey (RECS) dataset to develop predictive models for the Energy Use Intensity (EUI) in apartments and single-family houses, employing tree-based algorithms such as LightGBM, CatBoost, and XGBoost. This study also incorporates SHAP (SHapley Additive exPlanations) to analyze the importance and interactions of household features in determining energy consumption, providing valuable insights for energy-efficient building design and retrofitting strategies. The results highlight key factors, including building size, heating methods, climate conditions, and building age, as significant contributors to energy use. By offering personalized energy saving strategies for different building types, this study contributes to the growing body of knowledge on energy efficiency and the integration of ML into building energy management. U. Ali et al. [18] proposed a scalable and robust framework for forecasting the energy consumption across urban residential building stocks, leveraging ensemble-based ML techniques. This approach integrates data acquisition, archetype development, parametric simulation, and predictive modeling to address the key limitations of conventional urban energy modeling, most notably the limited availability and heterogeneity of large-scale building data. Applied to Ireland’s residential building stock, this framework synthesizes a dataset representing one million dwellings characterized by 19 critical parameters. By disaggregating the end-use energy demands, such as heating, lighting, domestic hot water, photovoltaic generation, and appliance loads, this model enhances the resolution and interpretability. Ensemble learning methods achieve a predictive accuracy of 91%, markedly surpassing the traditional modeling techniques (76%). This study offers a data-driven, policy-relevant tool to support urban planners and decision-makers in evaluating retrofitting strategies and advancing sustainable energy transitions at scale. Sijun Xu et al. [19] studied the effects of individual factors on power savings and thermal management. They summarized the main factors in various cooling systems for reducing the power consumption, realized data management, and described the corresponding research, as well as the optimization methods. They also investigated data center cooling systems and described their principles, which take three main forms: air cooling systems, liquid cooling systems, and free cooling systems. Moreover, the power usage effectiveness (PUE) values and simultaneous cooling loads for different systems are provided. The study [20] presents a robust and interpretable machine learning framework for accurately forecasting the energy consumption for residential heating. The proposed model employs a stacking ensemble architecture comprising LightGBM, Random Forest, and XGBoost, with the hyperparameters optimized via Particle Swarm Optimization (PSO) and preceded by dimensionality reduction through Self-Organizing Maps (SOMs). Achieving a predictive accuracy of 95.4%, the model demonstrates strong generalizability and performance. Beyond prediction, the integration of SHapley Additive exPlanations (SHAP) and causal inference techniques enables both interpretability and the identification of underlying cause–effect relationships. Notably, variations in air and water pipe temperatures were found to significantly impact the energy usage. This methodological framework not only enhances the precision and transparency of energy demand modeling but also offers actionable insights for building managers to implement efficient, cost-effective heating strategies, particularly during high-demand winter periods. S. Kapp [21] proposes a hybrid modeling framework for forecasting the energy consumption in industrial buildings by integrating domain-specific physical system knowledge with ML techniques. Utilizing data from 45 manufacturing facilities, the model incorporates a comprehensive set of features, including environmental variables (e.g., air enthalpy, solar radiation), support system metrics (e.g., motors, steam usage, compressed air), and operational parameters (e.g., production throughput, workforce levels, and facility size). A linear regression model applied to a transformed feature space outperformed a conventional support vector machine, achieving a superior predictive accuracy while maintaining model interpretability. This physically informed, data-driven approach offers a scalable and practical solution for uncovering energy saving opportunities within complex industrial systems. Mohd Herwan Sulaiman and Zuriani Mustaffa [22] proposed the Barnacles Mating Optimizer (BMO) to solve the optimal chiller loading (OCL) problem by reducing the total energy consumption while considering certain limitations in the multi-cooling system. To show the effectiveness of the BMO, it was tested on three different cooling systems (6-unit, 4-unit, and 3-unit chiller systems) and its results compared with those of other modern optimization algorithms, where it was recognized that it could provide competitive results and was effective in achieving the lowest energy consumption to solve the OCL problem. The authors of [23] demonstrated that existing Thermal Energy Storage cooling facilities could be one of the most cost-effective resources for achieving state and government carbon neutrality goals, applied model predictive control (MPC), and evaluated the site performance of a campus-wide TES cooling facility. It aims to self-consume electricity generated on site, reduce carbon emissions into the grid, and reduce utility bills. The performance of MPC was evaluated against a carefully selected baseline period. The results of the MPC showed a reduction in the excess PV capacity by approximately 25%, greenhouse gas emissions by 10%, and the peak electricity demand by 10%. In [24], the authors proposed an analysis of the statistical relationship between the energy performance and life cycle costs (LCCs) of a cooling plant operating in medium- and large-scale application scenarios, with an evaluation of its impact under the same heat demand conditions. A case study of a Cuban hotel with 138 sets of differently arranged cooling stations was selected. The results indicated that the design of the overall chiller and the distribution of the cooling capacity between chillers have a significant impact on the energy consumption of the cooling plant, with Spearman’s Rho and Kendall’s Tau correlation indices of 0.625 and 0.559. Considering the LCCs, only the distribution of the cooling capacity between the chillers had an effect, with a Kendall Tau correlation index of 0.289. For the total cooling capacity studied, the statistical test applied indicated that this design variable did not affect the performance of the cooling plant. The study [25] assessed the efficacy of data-driven methodologies for predicting and forecasting the chiller power consumption within HVAC systems using real-time operational data from an academic building in Taiwan. A comparative analysis was conducted between a conventional thermodynamic linear regression model and a Multi-Layer Perceptron (MLP) neural network for consumption predictions, as well as among three deep learning architectures, MLP, a one-dimensional Convolutional Neural Network (1D-CNN), and Long Short-Term Memory (LSTM), for minute-ahead forecasting. The MLP model demonstrated a superior performance over that of the traditional thermodynamic approaches, yielding an R² of 0.971. For short-term forecasting, the LSTM model outperformed its counterparts with an R² of 0.994, underscoring its capability to capture the temporal dependencies in high-resolution energy data. Beyond the predictive accuracy, this study highlights real-world applications of these models, including proactive maintenance scheduling and intelligent switching of the energy sources based on the anticipated load, thereby advancing the energy efficiency and cost optimization in smart building operations. Jee-Heon Kim et al. [26] conducted a study on developing an energy consumption model for the refrigerant in an HVAC system using an ML algorithm based on artificial neural networks to find the optimal conditions. The developed model was also evaluated for its accuracy. It was improved in terms of various input parameters, as the model was able to predict the power consumption with 99.07% accuracy based on eight input variables. In addition, a standard reference building was designed to generate operating data for the refrigeration system during extended cooling periods (warm-weather months). 
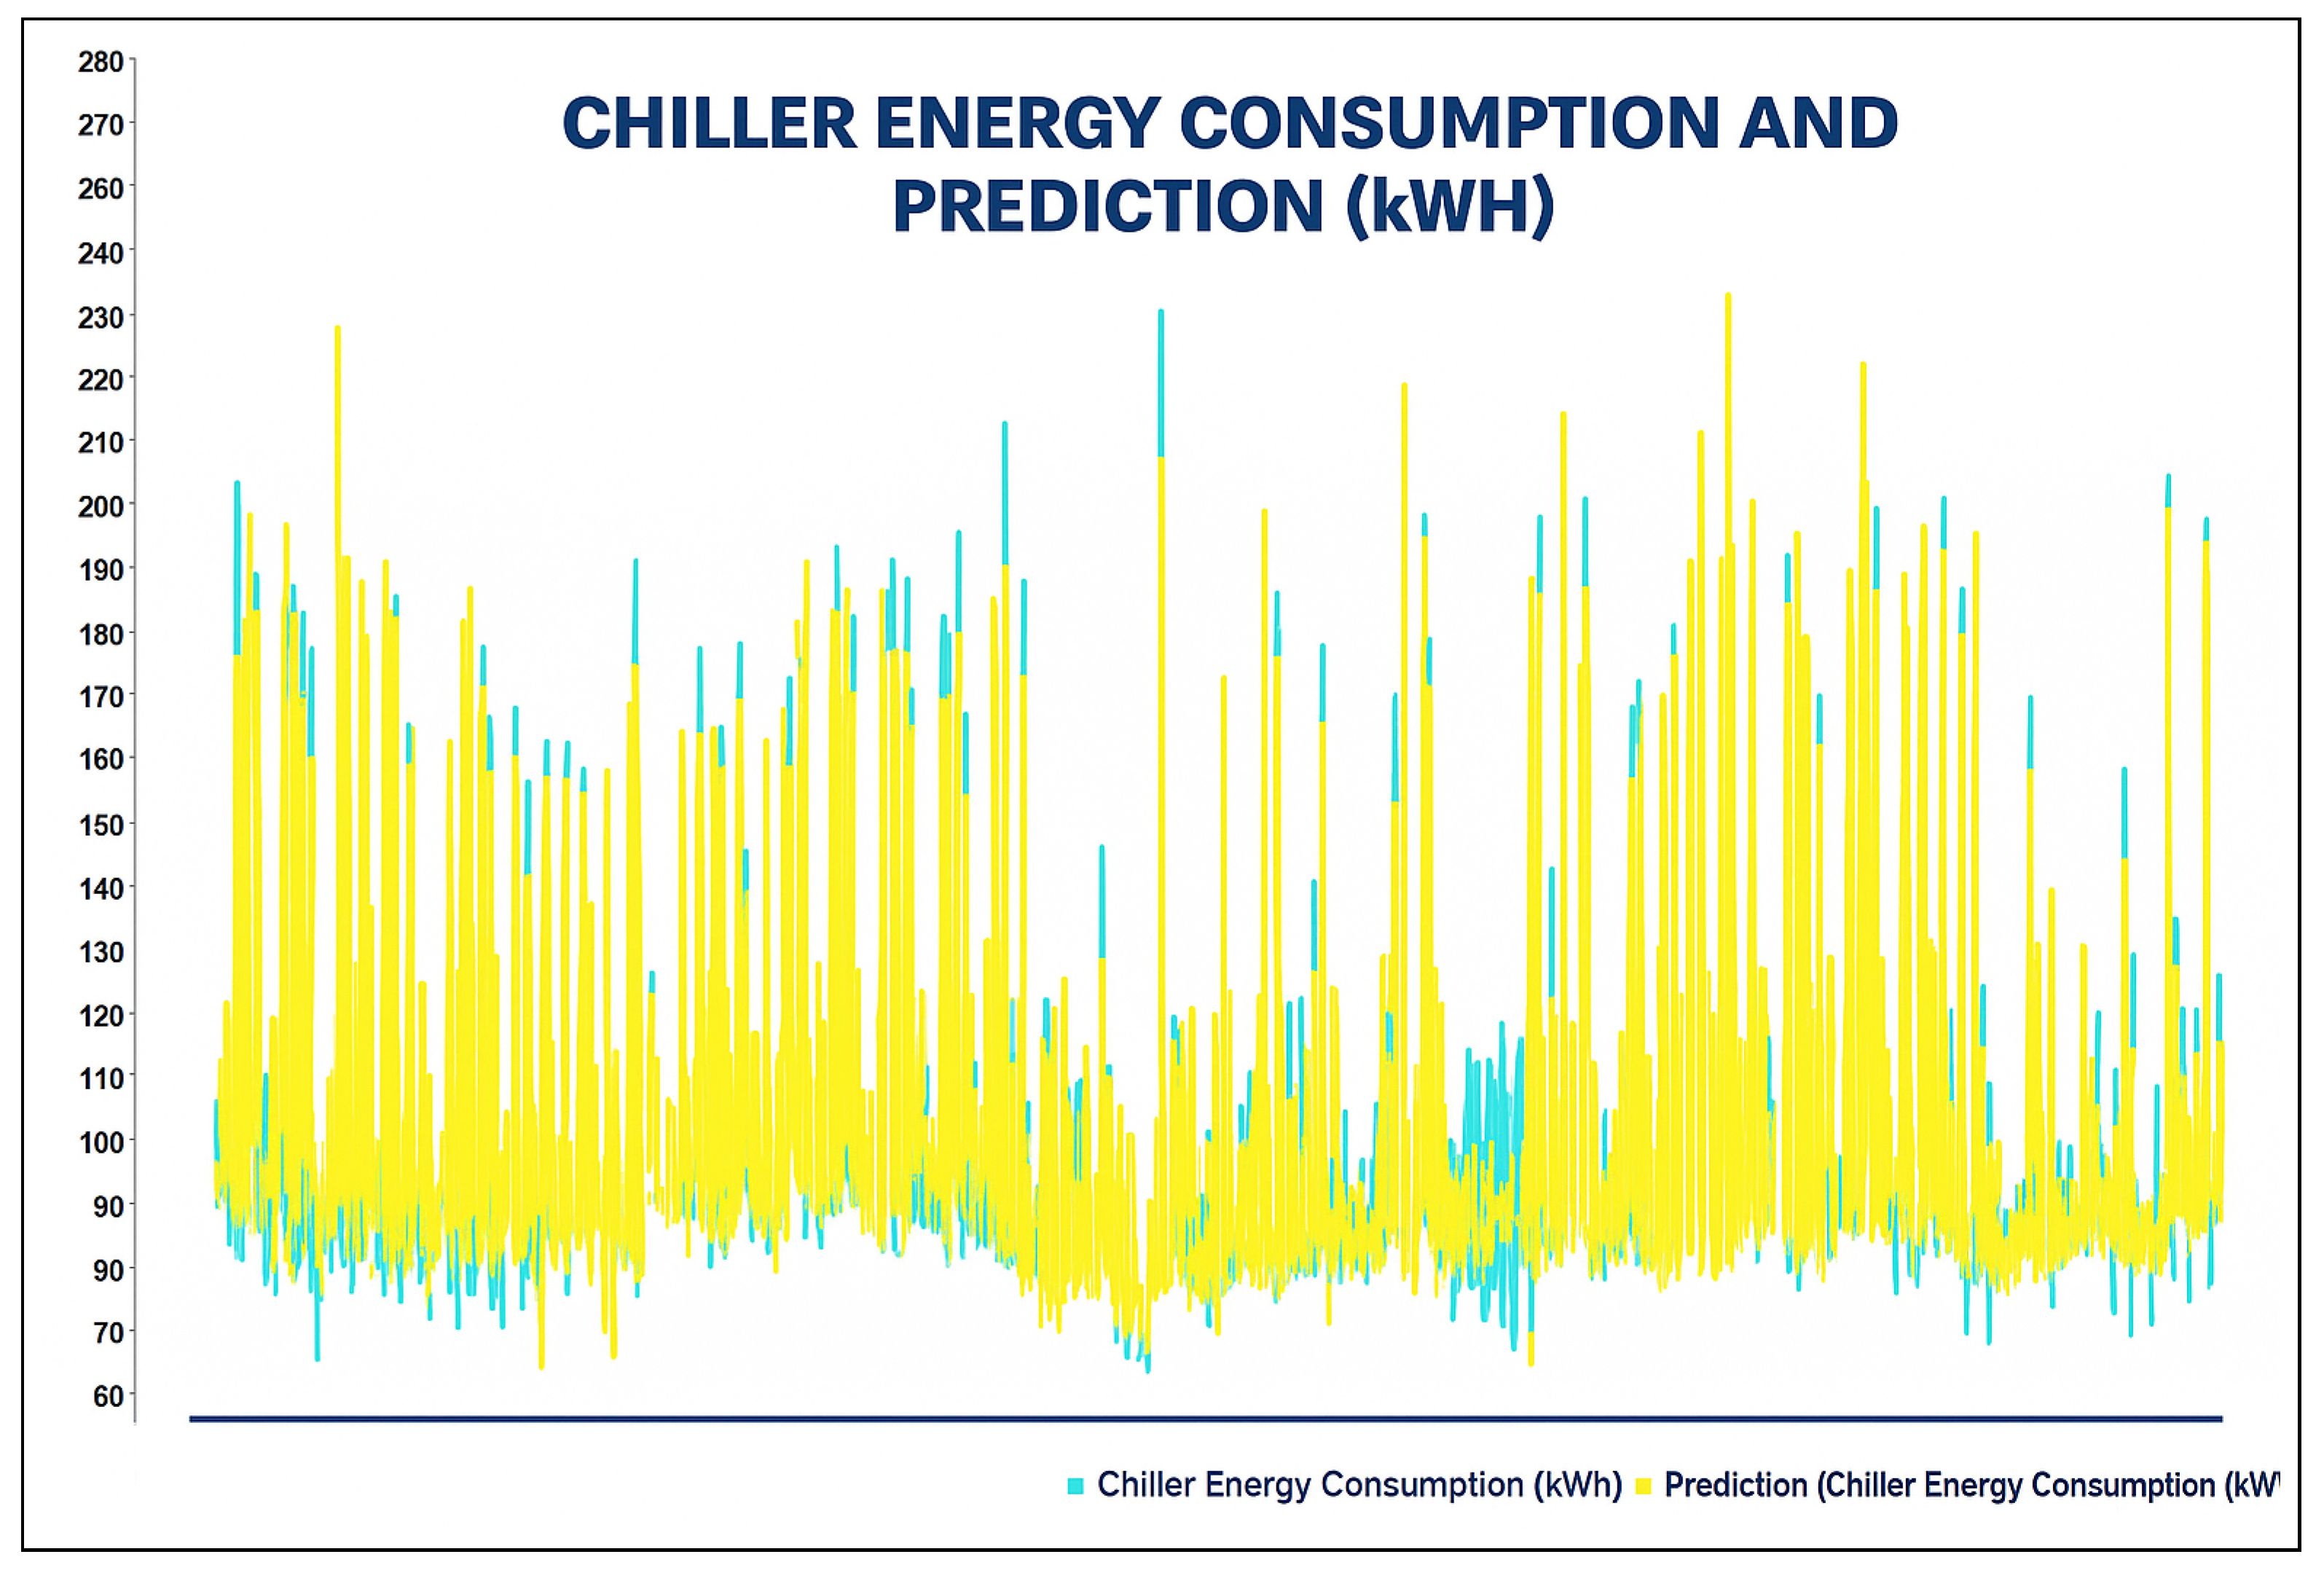
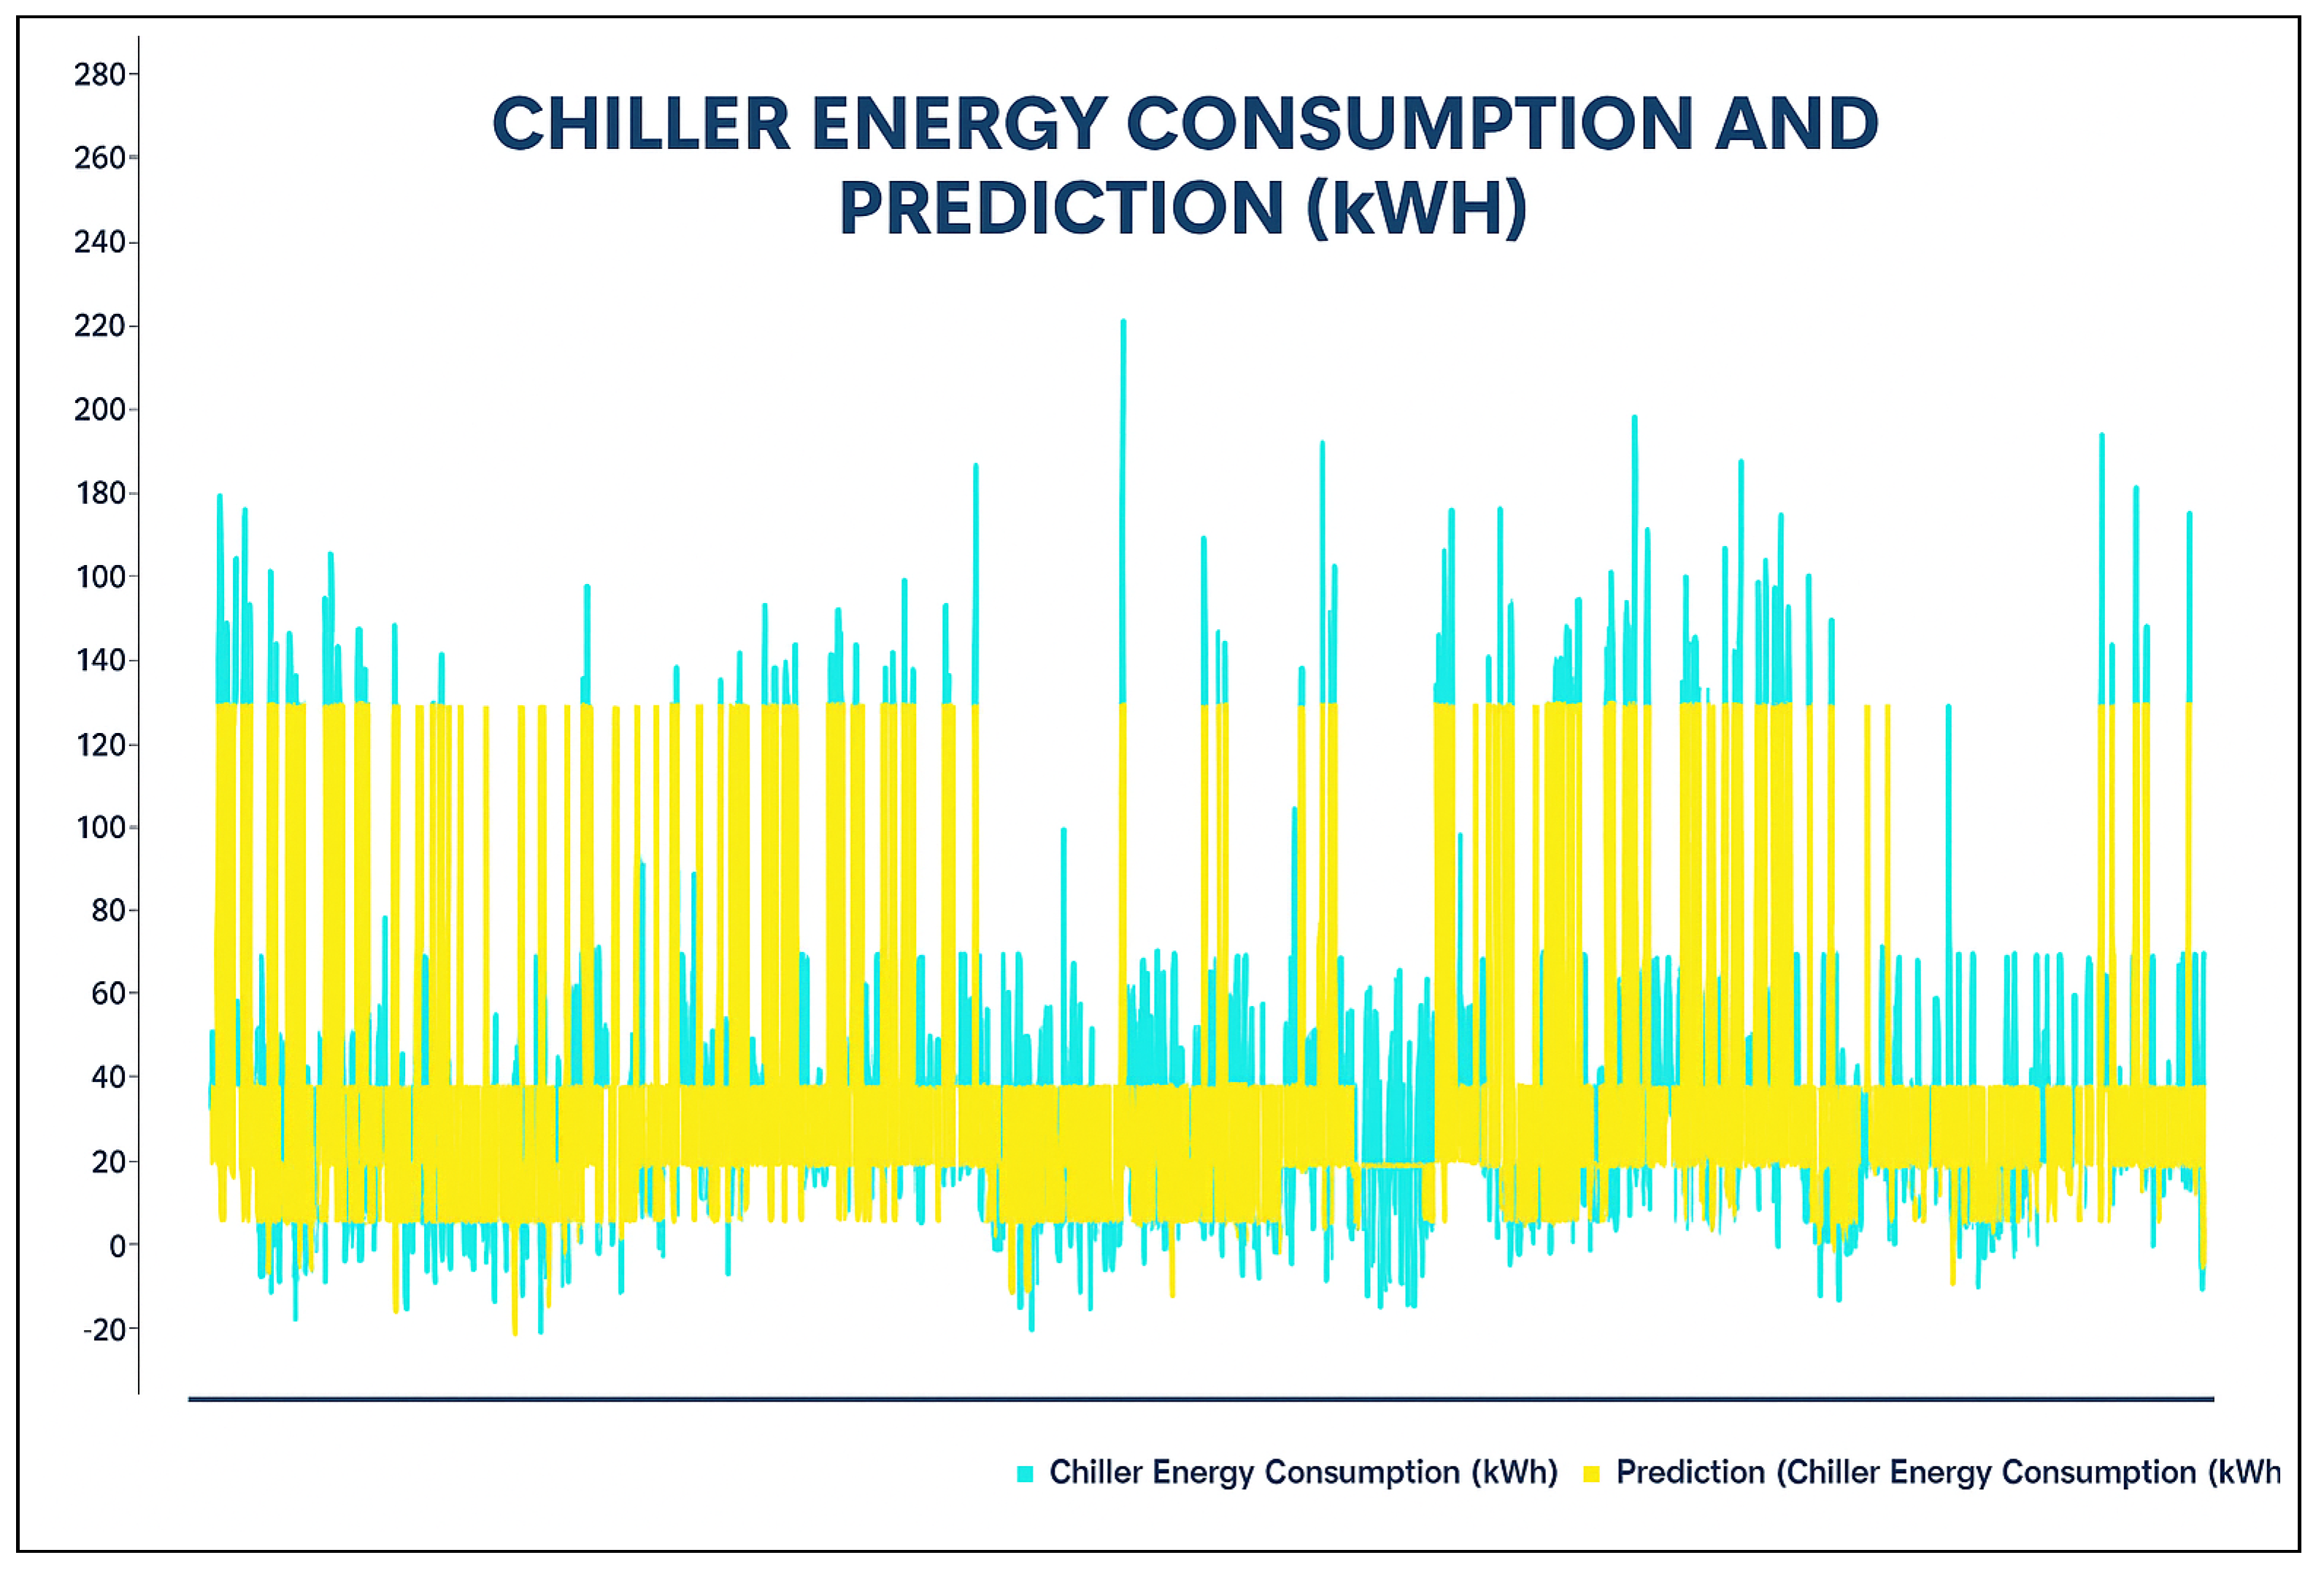
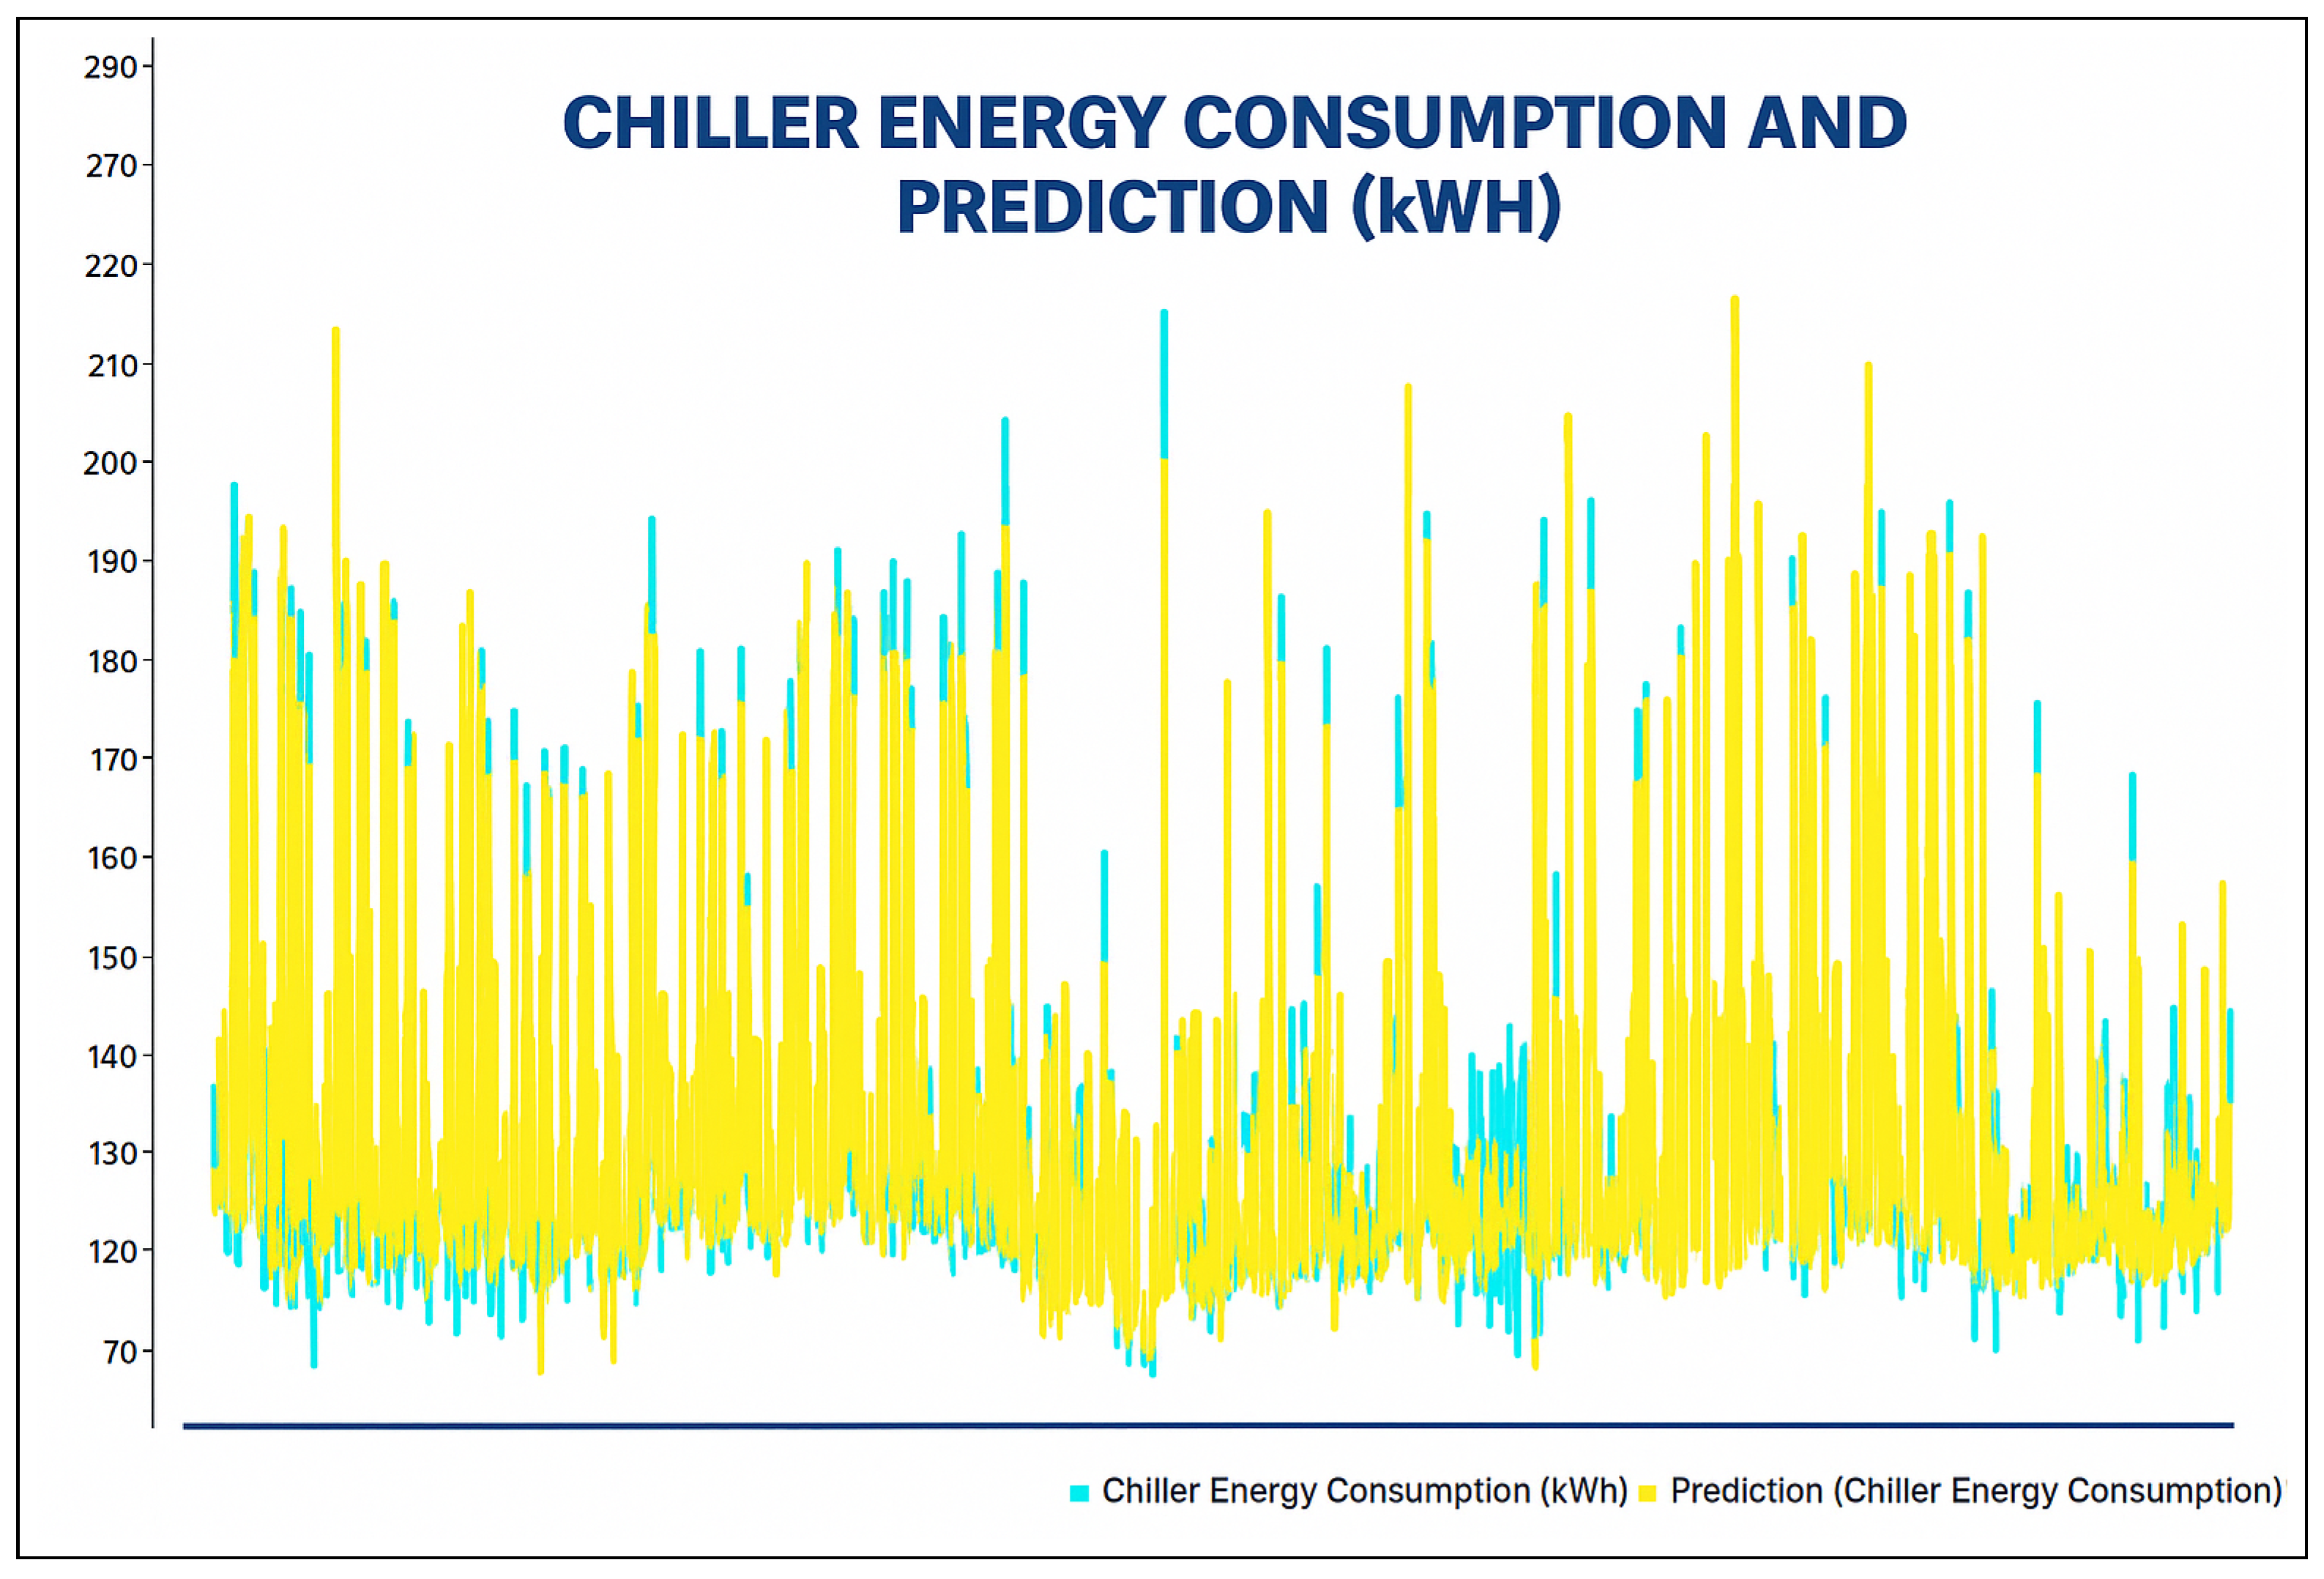
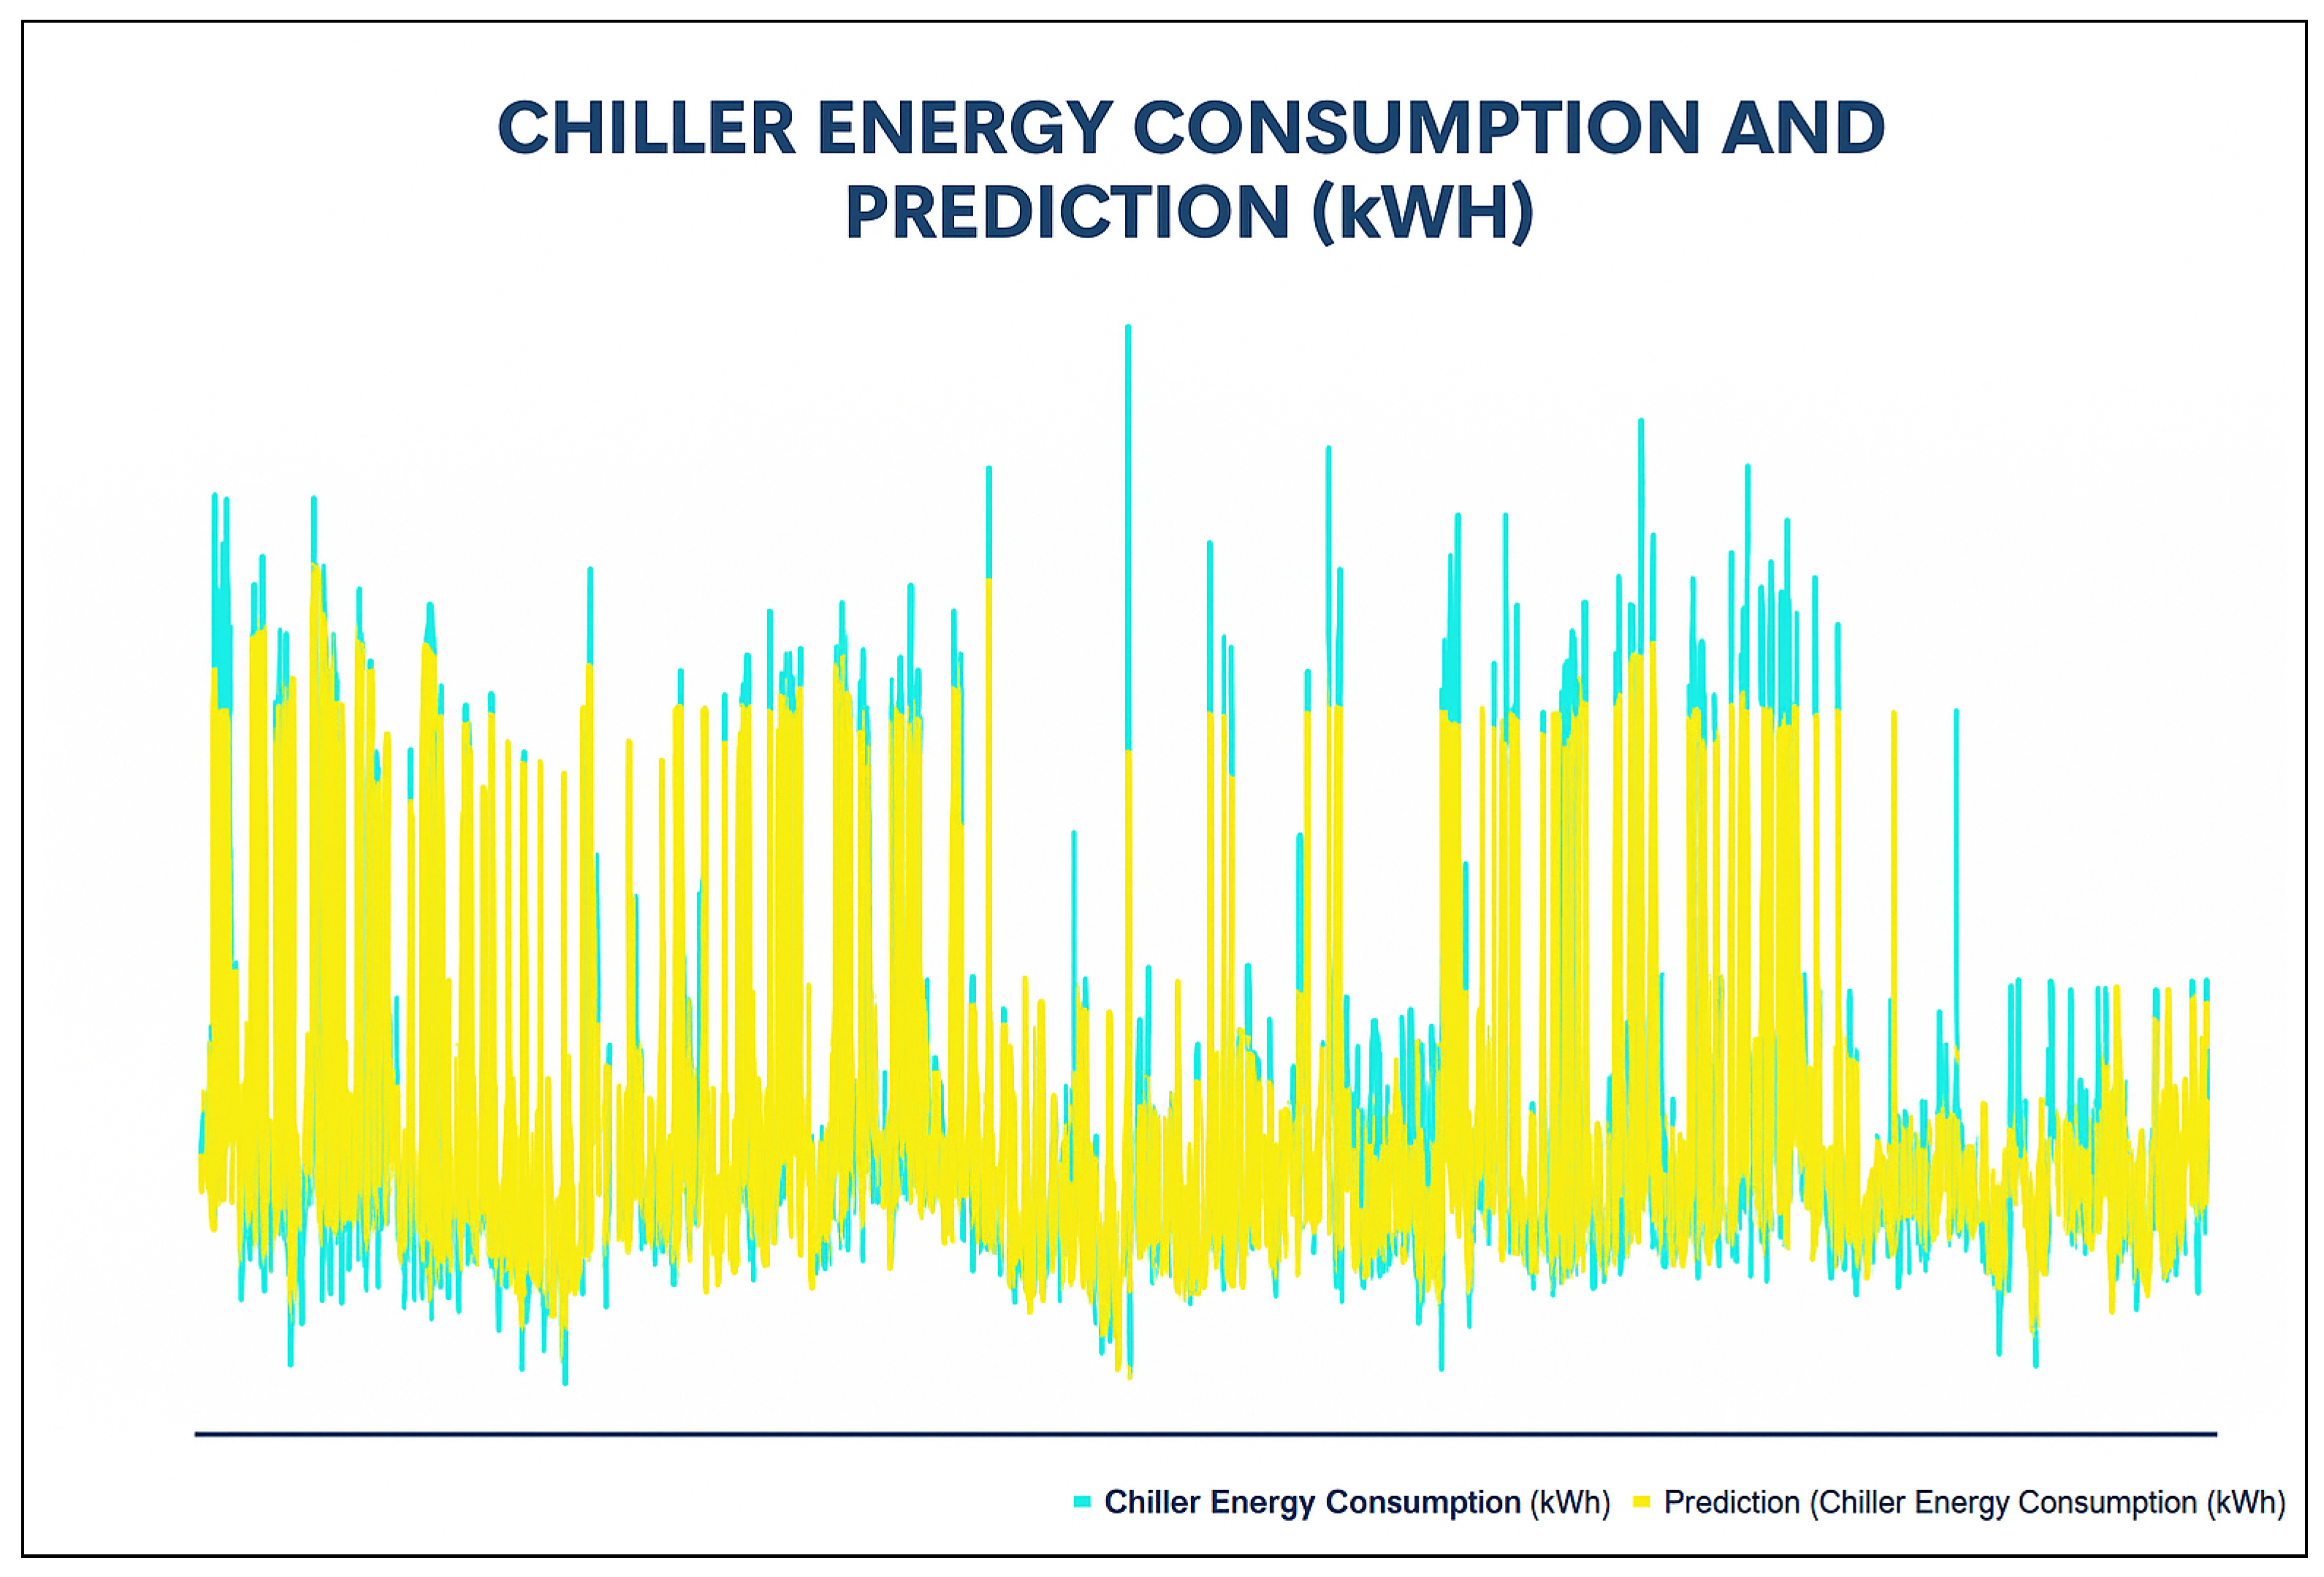
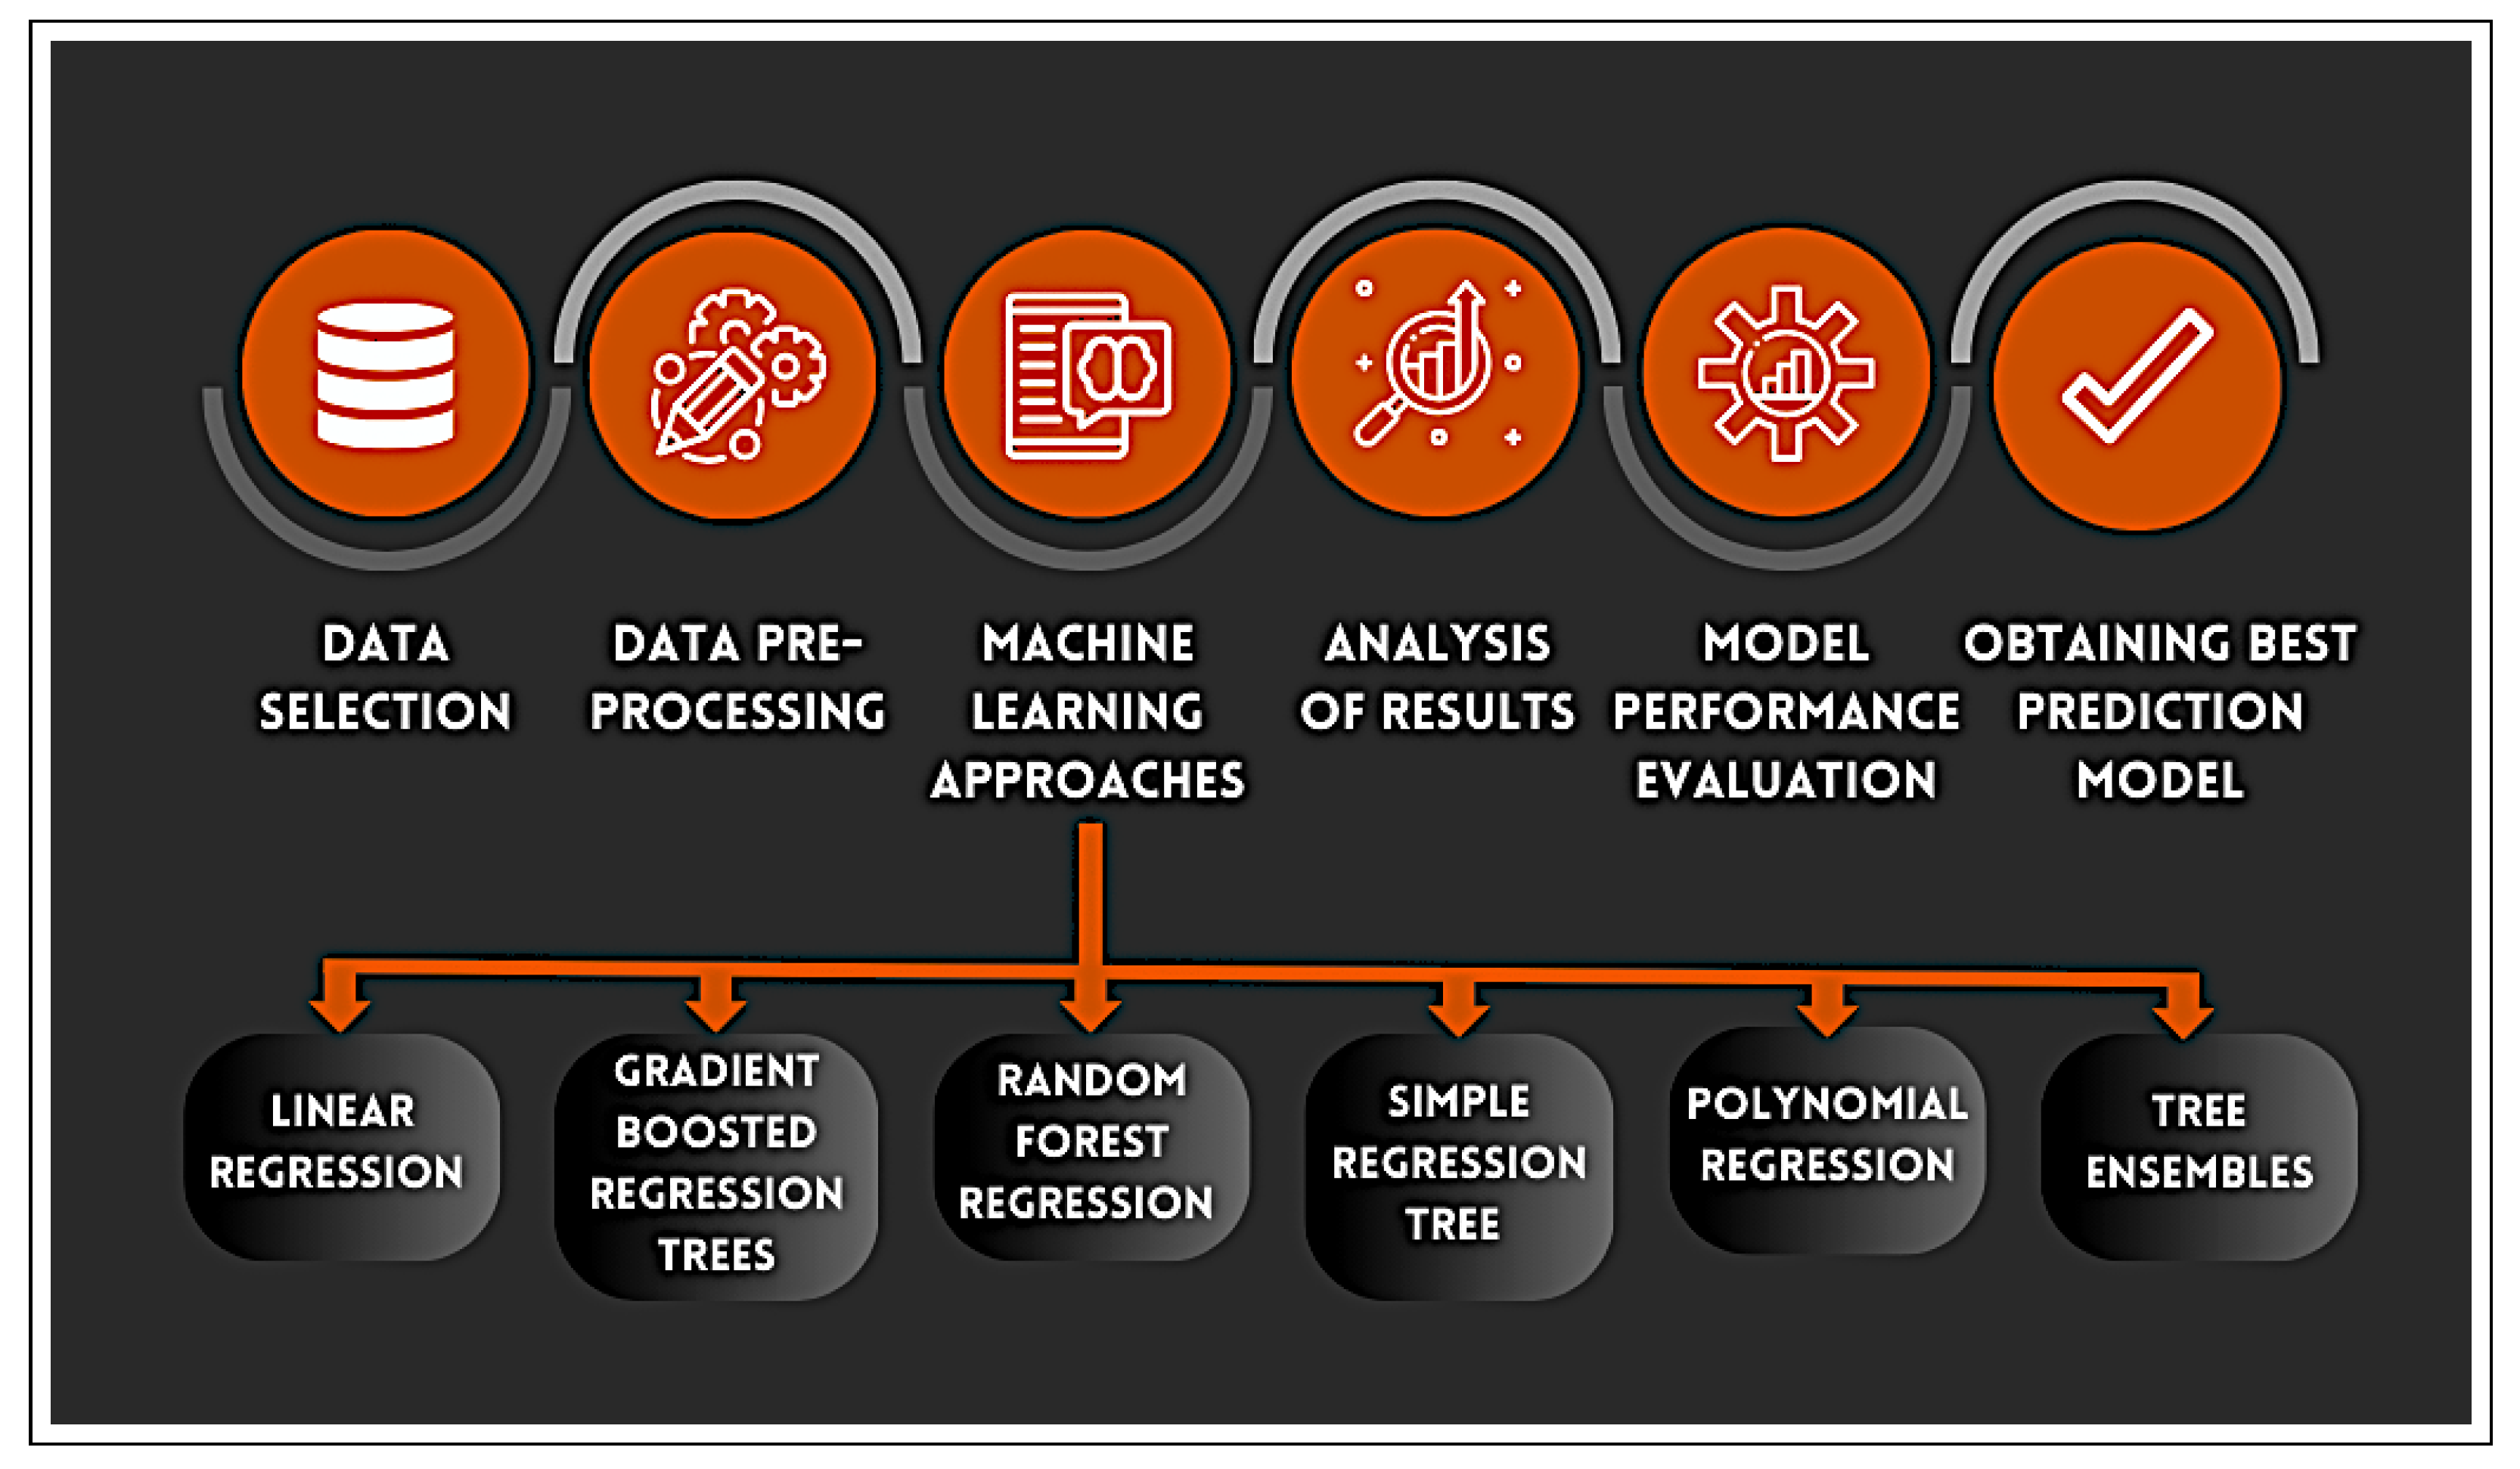
Table 1 provides a synthesized comparison of the reviewed studies, emphasizing their key findings and contributions.
The previous literature has focused mainly on ensuring efficient energy use and managing its data; improving its performance, savings, and production; reducing the total power consumption; and lowering utility bills. Various energy systems were scrutinized, elucidating their underlying principles and operational mechanisms. Furthermore, it included the analysis, comparison, and evaluation of results that indicated the ability to achieve the optimal accuracy using a set of developed and multiple models, different ML algorithms, and various methodological techniques. However, it is worth noting that the aforementioned works did not encompass the application of supervised machine learning regression techniques within the same study, as Pedro C. Albuquerque et al. [29] demonstrated the superior predictive capabilities of supervised regression models in energy forecasting, attributing their efficacy to their ability to exploit labeled datasets to generate highly accurate and operationally actionable predictions. In light of this observation, our research seeks to use several supervised ML regression algorithms within a unified experimental framework to analyze, compare, and evaluate their predictive results while achieving a greater accuracy and performance.

3. Methodology

This section describes the conventional design methodology applied in this study, which is divided into three sequential and interdependent phases. The first phase deals with the details of the data selection process, ensuring relevance and representativeness in the context of chiller energy modeling. Then, the second phase explains the pre-processing of the data to enhance their analytical quality and compatibility with ML algorithms. Finally, the third phase comprehensively details different machine learning approaches used to model chiller energy and facilitates the prediction of potential outcomes. This phase encompasses model training, evaluation, and a comparative performance assessment. Figure 1 presents the adopted methodology.

3.1. Data Selection

This paper works with a dataset for a commercial building located in Singapore [30] from 18 August 2019 at 00:00 to 01 June 2020 at 13:00. The dataset is stored in a CSV file with 9 feature sets and 1 target feature. The feature sets include Timestamp, Chilled Water Rate (L/s), Cooling Water Temperature (C), Building Load (RT), Total Energy (kWh), Temperature (F), Dew Point (F), Humidity (%), Wind Speed (mph), Pressure (in), Hour of Day (h), and Day of Week. Table 2 provides a brief description of the dataset’s features.
Figure 2 and Figure 3 illustrate the variable energy consumption of the chillers, with a marked concentration within the 76–150 kWh range. The [101–125] kWh interval alone accounts for 47.35% of the records, indicating a standard operating range for the system under typical load conditions. Extreme values below 75 kWh or above 225 kWh are rare, reflecting atypical or exceptional load conditions. These findings suggest a relatively stable consumption profile, with potential for optimization beyond 150 kWh.

3.2. Data Visualization

The information from the dataset [30] was translated into a visual context and represented in a scatter plot (Figure 4) to improve the interpretability of complex data on the chiller’s energy consumption. This visualization facilitates the identification of underlying trends, anomalies, and correlations that may be obscured in raw numerical datasets. By transforming intricate patterns into an intuitive graphical representation, the scatter plot bridges technical analysis with actionable insights. As a result, it empowers decision-makers to make more informed, effective, and timely decisions, such as detecting abnormal energy usage, optimizing the operational strategies, and preemptively addressing inefficiencies with greater speed and precision.

3.3. Pre-Processing Data

It is recommended that inconsistent, incoherent, missing, noisy, and contradictory data to be analyzed and processed before applying various supervised ML regression techniques to the dataset. This data pre-processing guarantees resilient, robust, and precise outcomes. However, this dataset was carefully processed by the authors before publication. To provide a glimpse into the dataset’s structure, Table 3 displays some of the rows. The complete dataset comprises 13,615 rows.

3.3.1. Data Splitting

This step can increase scalability, minimize potential conflicts, and enhance the performance by splitting the dataset into two non-overlapping sets: 80% for the training set and 20% for the test set [31]. This split is instrumental in expediting computational procedures and harnessing the power of parallel processing [2]. It allows for more efficient memory usage, aids in model evaluation without compromising unseen data, and supports enhanced experimentation, enabling various model iterations and hyperparameter tuning.

3.3.2. The Correlation Matrix

Within the realm of data science, one of the most common statistical measures is the correlation coefficient since it can be used to dependencies in data and identify potential causal relationships. These correlations can be used to determine the importance of the features in ML tasks [32] because the relationship between the feature set and the target feature may serve as a reference for the significance of the feature [33]. To achieve high precision in ML task, Karl Pearson’s linear correlation coefficient was employed in this work, as indicated in Equation (1) [34], because it is efficient, accurate, and significant. It is based on the covariance method and is used globally.
r = ( X X ¯ ) ( Y Y ¯ ) ( X X ¯ ) 2 ( Y Y ¯ ) 2
where
  • X ¯ : The mean of the X variable;
  • Y ¯ : The mean of the Y variable.
We conduct a comprehensive examination of the data to discern potential correlations among the features. As presented in Figure 5 and Table 4, it appears that there is no significant correlation that can be taken into account.

3.4. An Overview of the Applied Models

The pursuit of intelligent and cost-effective energy management in the future requires the development of prediction models that encapsulate chillers’ energy consumption patterns, drawing upon available data. For this endeavor, an array of advanced regression techniques has been employed to forge robust and forward-looking models, including LR, GBRT, RFR, SRT, PR, and RTE, for modeling the chiller energy and forecast potential outcomes.
In the realm of supervised ML, one method employed to rigorously assess the performance of ML algorithms is discrete training tests. This method involves the segregation of the data into distinct groups: the first group undertakes the responsibility of training the ML model, rigorously exposing it to diverse datasets and patterns, while the second group focuses on scrutinizing and evaluating the model’s accuracy and predictive capabilities. This bifurcation facilitates a robust evaluation framework, enabling comprehensive assessments of the model’s efficacy, its generalizability, and its adeptness in discerning patterns and making accurate predictions. Next, we briefly describe the different regression techniques considered in this work.

3.4.1. Linear Regression (LR)

Linear regression is one of the simplest and most popular supervised ML algorithms. It operates on the principle of establishing a linear relationship between the input features and the corresponding target variable. It endeavors to identify the best-fitting line that minimizes the discrepancy between the predicted values and the actual values. This algorithm leverages mathematical computations to estimate the coefficients that govern the linear equation, allowing for precise predictions of the target variable based on the provided input features. Linear regression finds extensive utility in diverse domains, including but not limited to predictive modeling, trend analyses, and correlation assessments, making it a foundational and widely employed tool in data analysis and ML tasks [35].
Its parameters and properties are as follows:
  • An applied linear regression equation: Y = a + bX.
  • where
  • X is the explanatory variable;
  • Y is the dependent variable;
  • b is the slope of the line;
  • a is the intercept (the value of y when x = 0).

3.4.2. Gradient Boosted Regression Trees (GBRTs)

Gradient Boosted Regression Trees or Gradient Boosted Machines (GBMs) are developed based on the Decision Tree (DT) model and derived from the Ensemble Learning Boosting algorithm. GBRT represents a flexible, non-parametric statistical learning technique that ranks among the most potent ML models for predictive analyses, making it a widely adopted method in ML applications. Its distinctive framework enhances the stability, precision, and computational efficiency of the predictions, rendering it the preferred choice for diverse applications demanding optimal accuracy and robustness. The amalgamation of decision trees through boosting mechanisms empowers GBRT to excel in capturing complex relationships and delivering an exceptional predictive performance, establishing its prowess as a prominent tool in the ML paradigm [36].
Its parameters and properties are as follows:
  • Tree options: The number of levels (tree depth) is 4;
  • Boost options: The number of models is 100, the learning rate is 0.1, and the alpha is 0.95;
  • The method for handling missing values is XGBoost.

3.4.3. Random Forest Regression (RFR)

Random Forest Regression is a supervised learning algorithm which is one of the most widely used algorithms for regression problems due to its simplicity and high accuracy. This technique operates by combining numerous decision trees, employing a voting mechanism to synthesize their predictions. Typically trained through a bagging methodology, Random Forest Regression unifies the forecasts derived from multiple ML models, endowing the resulting predictions with heightened accuracy and resilience, surpassing the performance of a solitary model, thereby solidifying its standing as an indispensable tool in the realm of ML [37].
Its parameters and properties are as follows:
  • Forest options: The number of models is 100.

3.4.4. Simple Regression Tree (SRT)

Simple Regression Tree (SRT) represents a distinct approach characterized by its unique attributes. In contrast to other modeling techniques, it embraces a completely different paradigm by eschewing the imposition of any specific functional form, thereby fostering unfettered exploration of intricate covariate interactions. By design, SRT leverages the construction of a variable tree, implicitly enabling seamless interactions between the covariates. This distinctive approach endows it with unparalleled flexibility, which increases its diverse predictive capabilities. By accommodating complex relationships and capturing nonlinear patterns, it enables an improved predictive performance, reinforcing its position as a powerful and indispensable tool in modeling production functions and related fields [38].
Its parameters and properties are as follows:
  • Tree options: The number of levels (tree depth) is 100;
  • The method for handling missing values is Surrogate.

3.4.5. Polynomial Regression (PR)

Polynomial regression is a sophisticated extension of standard linear regression, possessing the capacity to apprehend intricate nonlinear relationships among variables by fitting a nonlinear regression line. Unlike the constraints imposed by simple linear regression, polynomial regression makes it possible to capture the subtle complexities inherent in the data, where linear models may fall short. By incorporating the Nth-degree polynomial of the predictor variable, this algorithm navigates beyond the confines of linearity, adeptly embracing the intricacies and subtleties that lie within the dataset. This enhanced flexibility and adaptability enable polynomial regression to unearth intricate patterns and hidden dynamics, making it an indispensable tool for modeling scenarios where linear regression models fail to adequately capture the underlying complexity [39].
Its parameters and properties are as follows:
  • The maximum polynomial degree is 3.

3.4.6. Regression Tree Ensemble (RTE)

The Regression Tree Ensemble is a powerful supervised ML algorithm that combines multiple regression trees to improve the predictive performance. It falls under the ensemble learning category, where the decisions of multiple individual trees are aggregated to generate the final prediction. Each tree in the ensemble is trained on a random subset of the data and considers a subset of features at each split, which helps prevent overfitting and enhances the model’s ability to generalize. During prediction, each tree contributes its prediction, and the final prediction is obtained by combining these individual predictions, typically through averaging. This ensemble approach enables the model to capture complex relationships, handle nonlinearities, and provide reliable predictions. The Regression Tree Ensemble is widely used in various applications, particularly in regression tasks to accurately estimate continuous target variables [40].
Its parameters and properties are as follows:
  • Tree options: It uses mid-point splits for numeric attributes;
  • The number of models is 100;
  • Attribute sampling: Sample (square root);
  • Attribute selection: It uses a different set of attributes for each tree node.

3.5. Evaluation Metrics

3.5.1. The Statistical Indicators Used

Several assessment measures were used, as detailed in Table 5, such as R 2 , mean absolute error (MAE), mean squared error (MSE), root mean squared error (RMSE), mean signed difference (MSD), mean absolute percentage error (MAPE), and adjusted R 2 [41]. By employing these advanced assessment metrics, this study aims to achieve a nuanced and comprehensive appraisal of the predictive capabilities and efficacy exhibited by the supervised ML algorithms.

3.5.2. The Cross-Validation Strategy

To guarantee a rigorous, reliable, and generalizable evaluation of the performance of the ML models applied, we adopted a cross-validation strategy. Specifically, we used k-fold cross-validation with k = 10. This method consists of dividing the training set into ten subsets of equivalent size. At each iteration, one subset is used for validation, while the other nine are used to train the model. The process is repeated ten times, with each subset acting successively as a validation set. This approach reduces the variance associated with a single slice of the data, limits the risk of overfitting, and provides a more reliable estimate of the model’s performance on unseen data [42].

4. The Tools and Platforms Used

This section elucidates the implementation environment, encompassing the specific devices and tools instrumental in the predicting of chillers’ energy consumption through the application of ML techniques. Pertinent details are encapsulated within Table 6 and Figure 6.
Table 6. Some of the tools and equipment.
ComponentDescription
ProcessorIntel(R) Core (TM) i5-6300U CPU @ 2.40GHz
RAM8.00 Go
System type64-bit operating system, ×64 processor
Operating systemWindows 10
Implementation environmentKNIME
Programming languagePython
Figure 6. KNIME workflow.
Energies 18 03672 g006
To enhance clarity, Figure 7 illustrates the specific workflows implemented for each respective regression technique: LR, GBRT, RFR, SRT, PR, and RTE.
  • CSV Reader Node: This reads a CSV file that contains the datasets; this node can access a variety of file systems, which corresponds to the section of this study on the data selection.
  • Table View Node: This allows you to specify the number of different rows and columns to display in the table; this corresponds to the section of this study that provides a glimpse of the data structure.
  • Rank Correlation Node: This determines the strength of the relationship between the selected attributes and the target attributes through a correlation matrix, this corresponds to the “The Correlation Matrix” section of this study.
  • Partitioning Node: In this node, the complete dataset is split into two portions: the training and test data; this corresponds to the Data Splitting section of this study.
  • Numeric Scorer Node: This computes certain statistics between the numeric column’s values and the predicted values. It computes the R 2 value, mean absolute error, mean squared error, root mean squared error, mean signed difference, mean absolute percentage error, and adjusted R 2 . The computed values can be inspected in the node view and/or processed further using the output table.
  • Column Filter Node: This filters the columns, and you can decide which columns to retain and which to exclude.
  • Line Plot Node: This allows you to view a sample to obtain the desired line plot, including the columns for x and y axes.

5. Results and Discussion

This section outlines the experimental framework and the outcomes of forecasting the chiller energy consumption for a commercial building located in Singapore. Six distinct supervised ML models were employed: LR, GBRT, RFR, SRT, PR, and RTE. The primary objective was to identify the most robust and reliable predictive model through rigorous comparative performance evaluation.
Table 7 presents the quantitative results of the rating scales produced by different supervised ML models, thus providing a comprehensive comparative analysis, where the following was found:
The RFR and RTE models exhibit the highest R 2 values, showcasing strong predictive capabilities.
Both RFR and RTE demonstrate notably lower MAEs, indicating their superior prediction accuracy compared to that of the other models.
The RFR and RTE models display lower MSE and RMSE values, indicating minimized errors and better precision in prediction.
The RFR and RTE models demonstrate minimal prediction discrepancies, confirming a high degree of alignment between the observed and forecasted energy consumption values.
With the lowest MAPE among all of the tested models, the superior forecasting accuracy of the RFR and RTE models is further affirmed.
Finally, the highest adjusted R 2 values attained by RFR and RTE suggest not only strong model fits but also robustness against overfitting, enhancing their applicability in real-world energy forecasting contexts.
These results collectively affirm the efficacy of ensemble-based learning methods, particularly RFR and RTE in delivering accurate, stable, and interpretable predictions for chillers’ energy consumption within smart building environments.
Table 7. Model statistics.
Row IDPrediction (Chiller Energy Consumption)
LRGBRTRFRSRTPRRTE
R 2 0.8600.9550.9620.7790.8980.970
MAE8.9744.0053.6039.2497.2773.601
MSE124.37240.25034.197196.72590.84833.872
RMSE11.1526.3445.84814.0269.5315.820
MSD−0.130−0.348−0.197−4.630−0.272−0.204
MAPE0.0720.0320.0290.0690.0580.029
Adjusted R 2 0.8600.9550.9620.7790.8980.970
The most compelling results in this study were achieved through the application of supervised ML algorithms, as detailed in Table 7 and illustrated in Figure 8 and Figure 9. Among the models evaluated, the Regression Tree Ensemble demonstrated a superior performance, attaining a predictive accuracy of 97.00% in estimating the chillers’ energy consumption rates. This was closely followed by the Random Forest Regression model with 96.20% and the Gradient Boosted Regression Trees model with 95.50%. These outcomes underscore the efficacy and robustness of the RTE model, positioning it as the most accurate and reliable technique for forecasting chillers’ energy demand in this context.
Figure 9 provides a comparative visualization of the models based on their R 2 values, offering an intuitive understanding of each model’s degree of fit with the dataset. This facilitates an informed selection of the most suitable predictive model by highlighting the extent to which each algorithm captures the variance in the target variable. In this regard, the RTE model emerges as a highly efficient and context-appropriate tool for predicting the energy consumption in commercial buildings, particularly within the urban landscape of Singapore.
Figure 9. Graphical representation of R 2 values for supervised ML models.
Energies 18 03672 g009

The Cross-Validation Results

The results of the 10-fold cross-validation procedure are presented in Table 8 and illustrated in Figure 10 and Figure 11. For each model, the initial R 2 score, the cross-validation R 2 score, and the corresponding standard deviation are presented. This comprehensive presentation enables a more rigorous and objective assessment of the predictive robustness and stability of each model.
Table 8. Comparative results.
ModelInitial R2 (%)Cross-Validation R2 (%)Gap
LR86.00%84.20%−1.80%
GBRT95.50%93.60%−1.90%
RFR96.20%94.50%−1.70%
SRT77.90%73.50%−4.40%
PR89.80%86.90%−2.90%
RTE97.00%95.30%−1.70%
Overall, it is observed that cross-validation R 2 scores were slightly lower than the initial scores computed using a single train/test split, which is an expected outcome in a realistic evaluation scenario. This discrepancy highlights the models’ ability to generalize their learning beyond the specific training data. Notably, models such as RTE, RFR, and GBRT maintain a high performance even after cross-validation, underscoring their robustness, effectiveness, and stability in predictive tasks.
Figure 10. A graphical representation of the comparison between the initial R 2 scores and the cross-validation R 2 .
Energies 18 03672 g010
Figure 11. A graphical representation of the difference in the R 2 performance between the initial scores and the cross-validation.
Energies 18 03672 g011
The regression rates for chiller energy consumption and the predictive ratios for the six supervised ML models used in this study are shown in Figure 12, Figure 13, Figure 14, Figure 15, Figure 16 and Figure 17. These visual representations encapsulate the intricate nuances of the models’ performance. These figures serve as a valuable resource for assessing and comparing the predictive capabilities of the models, shedding light on their respective strengths and weaknesses.
To contextualize model effectiveness, Table 9 presents a comparative analysis with existing studies, all conducted using the same chiller energy dataset.
Table 9. Comparison of RFR and XGB evaluations.
WorkRMSEMAE
RFRXGBRFRXGB
This study5.8486.3443.6034.005
Daniel Kan et al. [12]10.2509.7707.1006.960
Figure 14. A graphical representation of the regression rate for Random Forest Regression and its predictive ratio.
Energies 18 03672 g014
Figure 15. A graphical representation of the regression rate for a Simple Regression Tree and its predictive ratio.
Energies 18 03672 g015
Figure 16. A graphical representation of the regression rate for polynomial regression and its predictive ratio.
Energies 18 03672 g016
Figure 17. A graphical representation of the regression rate for Regression Tree Ensemble and its predictive ratio.
Energies 18 03672 g017
The RTE model consistently outperforms alternative approaches reported in the literature, thereby reinforcing its validity and highlighting its significant contribution to the field of intelligent energy management and building-level energy forecasting.

6. Conclusions and Future Work

Heating and cooling systems represent a significant component of the total energy consumption in both residential and commercial infrastructure. The integration of ML into this domain has profoundly transformed intelligent energy management, enabling enhancements in energy efficiency, operational safety, system longevity, and real-time distribution monitoring, ultimately contributing to notable reductions in energy usage and associated costs. In this study, a robust methodology was proposed to forecast chiller energy consumption rate for a commercial building located in Singapore. Leveraging a diverse ensemble of supervised ML models, highly satisfactory prediction scores were obtained. Among the array of models employed, the Regression Tree Ensemble (RTE) model achieved good fit results and model concordance of 97.00%. These findings highlight the efficacy of the proposed approach in estimating chillers energy consumption rates, thereby fostering informed decision-making and paving the way for optimized intelligent energy management practices in commercial building settings. Despite substantial research efforts to enhance power management and optimize its performance, and address efficient heat dissipation within cooling systems, the realm of intelligent energy management still presents notable research gaps that demand further investigation and exploration. Future research initiatives should aim to delve deeper into areas such as advanced energy storage technologies, adaptive control systems, optimal resource allocation algorithms, and comprehensive energy management frameworks that holistically integrate diverse energy sources [43]. Additionally, exploring emerging technologies, including blockchain, IoT, and AI, holds immense potential for addressing existing challenges and revolutionizing the landscape of intelligent energy management.

Author Contributions

Conceptualization, M.S.B. and S.K.; Methodology, M.S.B., S.K. and S.H.; Formal analysis, M.S.B.; Writing—original draft, M.S.B.; Writing—review & editing, S.K. and S.H.; Supervision, S.K. and S.H; Visualization, M.S.B.; Project administration, S.K. All authors have read and agreed to the published version of the manuscript.

Funding

This research received no external funding.

Data Availability Statement

The datasets generated and/or analyzed as part of this study are available in the [Kaggle] repository at https://www.kaggle.com/datasets/chillerenergy/chiller-energy-data (accessed on 5 January 2025).

Conflicts of Interest

The authors declare no conflicts of interest.

References

  1. Derkenbaeva, E.; Vega, S.; Hofstede, G.; Van Leeuwen, E. Positive energy districts: Mainstreaming energy transition in urban areas. Renew. Sustain. Energy Rev. 2022, 153, 111782. [Google Scholar] [CrossRef]
  2. Benkhalfallah, F.; Laouar, M.; Benkhalfallah, M. Empowering Education: Harnessing Artificial Intelligence for Adaptive E-Learning Excellence. In Proceedings of the International Conference On Artificial Intelligence And Its Applications In The Age of Digital Transformation, Nouakchott, Mauritania, 23–25 April 2024; pp. 41–55. [Google Scholar]
  3. Shahzad, M.; Qu, Y.; Rehman, S.; Zafar, A. Adoption of green innovation technology to accelerate sustainable development among manufacturing industry. J. Innov. Knowl. 2022, 7, 100231. [Google Scholar] [CrossRef]
  4. Ullah, Z.; Al-Turjman, F.; Mostarda, L.; Gagliardi, R. Applications of artificial intelligence and machine learning in smart cities. Comput. Commun. 2020, 154, 313–323. [Google Scholar] [CrossRef]
  5. Chou, J.; Tran, D. Forecasting energy consumption time series using machine learning techniques based on usage patterns of residential householders. Energy 2018, 165, 709–726. [Google Scholar] [CrossRef]
  6. Somu, N.; MR, G.; Ramamritham, K. A deep learning framework for building energy consumption forecast. Renew. Sustain. Energy Rev. 2021, 137, 110591. [Google Scholar] [CrossRef]
  7. Shapi, M.; Ramli, N.; Awalin, L. Energy consumption prediction by using machine learning for smart building: Case study in Malaysia. Dev. Built Environ. 2021, 5, 100037. [Google Scholar] [CrossRef]
  8. Moon, J.; Park, J.; Hwang, E.; Jun, S. Forecasting power consumption for higher educational institutions based on machine learning. J. Supercomput. 2018, 74, 3778–3800. [Google Scholar] [CrossRef]
  9. Shin, S.; Woo, H. Energy Consumption Forecasting in Korea Using Machine Learning Algorithms. Energies 2022, 15, 4880. [Google Scholar] [CrossRef]
  10. Bourhnane, S.; Abid, M.; Lghoul, R.; Zine-Dine, K.; Elkamoun, N.; Benhaddou, D. Machine learning for energy consumption prediction and scheduling in smart buildings. SN Appl. Sci. 2020, 2, 297. [Google Scholar] [CrossRef]
  11. Benkhalfallah, M.; Kouah, S.; Benkhalfallah, F. Enhancing Advanced Time-Series Forecasting of Electric Energy Consumption Based on RNN Augmented with LSTM Techniques. In Proceedings of the International Conference On Artificial Intelligence And Its Applications In The Age Of Digital Transformation, Nouakchott, Mauritania, 23–25 April 2024; pp. 34–46. [Google Scholar]
  12. Daniel, K.; Jeffrey, L.; Totally, M. Chiller Energy Data Analysis. 2023. Available online: https://www.kaggle.com/code/zerokan/chiller-energy-data-analysis (accessed on 5 January 2025).
  13. Benkhalfallah, M.; Kouah, S.; Ammi, M. Smart Energy Management Systems. In Proceedings of the Novel & Intelligent Digital Systems Conferences, Athens, Greece, 28–29 September 2023; pp. 1–8. [Google Scholar]
  14. Hossain, S.; Hasanuzzaman, M.; Hossain, M.; Amjad, M.; Shovon, M.; Hossain, M.; Rahman, M. Forecasting Energy Consumption Trends with Machine Learning Models for Improved Accuracy and Resource Management in the USA. J. Bus. Manag. Stud. 2025, 7, 200–217. [Google Scholar] [CrossRef]
  15. Zaki, A.; Zayed, M.; Bargal, M.; Saif, A.; Chen, H.; Rehman, S.; Alhems, L.; El-deen, E. Environmental and energy performance analyses of HVAC systems in office buildings using boosted ensembled regression trees: Machine learning strategy for energy saving of air conditioning and lighting facilities. Process Saf. Environ. Prot. 2025, 198, 107214. [Google Scholar] [CrossRef]
  16. Li, X.; Wang, Z.; Yang, C.; Bozkurt, A. An advanced framework for net electricity consumption prediction: Incorporating novel machine learning models and optimization algorithms. Energy 2024, 296, 131259. [Google Scholar] [CrossRef]
  17. Cui, X.; Lee, M.; Koo, C.; Hong, T. Energy consumption prediction and household feature analysis for different residential building types using machine learning and SHAP: Toward energy-efficient buildings. Energy Build. 2024, 309, 113997. [Google Scholar] [CrossRef]
  18. Ali, U.; Bano, S.; Shamsi, M.; Sood, D.; Hoare, C.; Zuo, W.; Hewitt, N.; O’Donnell, J. Urban building energy performance prediction and retrofit analysis using data-driven machine learning approach. Energy Build. 2024, 303, 113768. [Google Scholar] [CrossRef]
  19. Xu, S.; Zhang, H.; Wang, Z. Thermal Management and Energy Consumption in Air, Liquid, and Free Cooling Systems for Data Centers: A Review. Energies 2023, 16, 1279. [Google Scholar] [CrossRef]
  20. Dinmohammadi, F.; Han, Y.; Shafiee, M. Predicting energy consumption in residential buildings using advanced machine learning algorithms. Energies 2023, 16, 3748. [Google Scholar] [CrossRef]
  21. Kapp, S.; Choi, J.; Hong, T. Predicting industrial building energy consumption with statistical and machine-learning models informed by physical system parameters. Renew. Sustain. Energy Rev. 2023, 172, 113045. [Google Scholar] [CrossRef]
  22. Sulaiman, M.; Mustaffa, Z. Optimal chiller loading solution for energy conservation using Barnacles Mating Optimizer algorithm. Results Control Optim. 2022, 7, 100109. [Google Scholar] [CrossRef]
  23. Kim, D.; Wang, Z.; Brugger, J.; Blum, D.; Wetter, M.; Hong, T.; Piette, M. Site demonstration and performance evaluation of MPC for a large chiller plant with TES for renewable energy integration and grid decarbonization. Appl. Energy 2022, 321, 119343. [Google Scholar] [CrossRef]
  24. Torres, Y.; Gullo, P.; Herrera, H.; Toro, M.; Guerra, M.; Ortega, J.; Speerforck, A. Statistical Analysis of Design Variables in a Chiller Plant and Their Influence on Energy Consumption and Life Cycle Cost. Sustainability 2022, 14, 10175. [Google Scholar] [CrossRef]
  25. Chaerun Nisa, E.; Kuan, Y. Comparative assessment to predict and forecast water-cooled chiller power consumption using machine learning and deep learning algorithms. Sustainability 2021, 13, 744. [Google Scholar] [CrossRef]
  26. Kim, J.; Seong, N.; Choi, W. Modeling and optimizing a chiller system using a machine learning algorithm. Energies 2019, 12, 2860. [Google Scholar] [CrossRef]
  27. U.S. EPA Air Markets Program Data. 2017. Available online: https://campd.epa.gov/campd/ (accessed on 28 January 2025).
  28. Building Energy Codes Program. 2023. Available online: https://www.energycodes.gov/development/commercial/prototype_models (accessed on 28 January 2025).
  29. Albuquerque, P.; Cajueiro, D.; Rossi, M. Machine learning models for forecasting power electricity consumption using a high dimensional dataset. Expert Syst. Appl. 2022, 187, 115917. [Google Scholar] [CrossRef]
  30. Chiller Energy Data. 2021. Available online: https://www.kaggle.com/datasets/chillerenergy/chiller-energy-data (accessed on 28 January 2025).
  31. Kohavi, R. A study of cross-validation and bootstrap for accuracy estimation and model selection. Ijcai 1995, 14, 1137–1145. [Google Scholar]
  32. Benkhalfallah, F.; Laouar, M. Predicting student exam scores: Exploring the most effective regression technique. In Proceedings of the 2023 International Conference On Networking and Advanced Systems (ICNAS), Algiers, Algeria, 21–23 October 2023; pp. 1–9. [Google Scholar]
  33. Esmailoghli, M.; Quiané-Ruiz, J.; Abedjan, Z. COCOA: COrrelation COefficient-Aware Data Augmentation. In EDBT; University of Konstanz: Konstanz, Germany, 2021; pp. 331–336. [Google Scholar]
  34. Chattamvelli, R. Pearson’s Correlation. In Correlation In Engineering and The Applied Sciences: Applications In R; Springer Nature: Berlin/Heidelberg, Germany, 2024; pp. 55–76. [Google Scholar]
  35. Maulud, D.; Abdulazeez, A. A review on linear regression comprehensive in machine learning. J. Appl. Sci. Technol. Trends 2020, 1, 140–147. [Google Scholar] [CrossRef]
  36. Cui, P.; Dai, C.; Zhang, J.; Li, T. Assessing the Effects of Urban Morphology Parameters on PM2. 5 Distribution in Northeast China Based on Gradient Boosted Regression Trees Method. Sustainability 2022, 14, 2618. [Google Scholar] [CrossRef]
  37. Ding, W.; Qie, X. Prediction of Air Pollutant Concentrations via RANDOM Forest Regressor Coupled with Uncertainty Analysis—A Case Study in Ningxia. Atmosphere 2022, 13, 960. [Google Scholar] [CrossRef]
  38. Schiltz, F.; Masci, C.; Agasisti, T.; Horn, D. Using regression tree ensembles to model interaction effects: A graphical approach. Appl. Econ. 2018, 50, 6341–6354. [Google Scholar] [CrossRef]
  39. Mısır, O.; Akar, M. Efficiency and core loss map estimation with machine learning based multivariate polynomial regression model. Mathematics 2022, 10, 3691. [Google Scholar] [CrossRef]
  40. Pachauri, N.; Ahn, C. Regression tree ensemble learning-based prediction of the heating and cooling loads of residential buildings. Build. Simul. 2022, 15, 2003–2017. [Google Scholar] [CrossRef]
  41. Chicco, D.; Warrens, M.; Jurman, G. The coefficient of determination R-squared is more informative than SMAPE, MAE, MAPE, MSE and RMSE in regression analysis evaluation. PeerJ Comput. Sci. 2021, 7, e623. [Google Scholar] [CrossRef] [PubMed]
  42. Gorriz, J.; Segovia, F.; Ramirez, J.; Ortiz, A.; Suckling, J. Is K-fold cross validation the best model selection method for Machine Learning? arXiv 2024, arXiv:2401.16407. [Google Scholar]
  43. Benkhalfallah, M.; Kouah, S. Towards A Greener Future: The Power of Renewables in Intelligent Energy Management. In Proceedings of the First National Conference On New Educational Technologies And Informatics (NCNETI 2023), Guelma, Algeria, 3–4 October 2023; pp. 100–111. [Google Scholar]
Figure 1. Methodology applied.
Energies 18 03672 g001
Figure 2. Chiller energy consumption bar chart.
Energies 18 03672 g002
Figure 3. Chiller energy consumption pie chart.
Energies 18 03672 g003
Figure 4. Data visualization.
Energies 18 03672 g004
Figure 5. Correlation matrix between features set and target features using colors.
Energies 18 03672 g005
Figure 7. Workflows implemented for each respective regression technique.
Energies 18 03672 g007
Figure 8. Evaluation metrics for supervised ML models.
Energies 18 03672 g008
Figure 12. A graphical representation of the regression rate for linear regression and its predictive ratio.
Energies 18 03672 g012
Figure 13. A graphical representation of the regression rate for Gradient Boosted Regression Trees and their predictive ratio.
Energies 18 03672 g013
Table 1. Comparison and summary of the studies.
AuthorsStudyData AvailabilityMethod/ApproachKey FindingsStrengthsLimitations
Saddam Hossain et al. [14], (2025)Develop and evaluate ML algorithms aiming to accurately predict the energy consumption trends in the United StatesU.S. Energy Information Administration (EIA) and the Department of Energy (DOE)Neural networks, regression analysis, ensemble approaches; specific algorithms compared: logistic regression, Random Forest, XG-BoostEnhance the forecasting accuracy for the energy demand across various sectors, including residential, commercial, and industrialComprehensive dataset; the application of advanced methodologies; a comparative analysis of algorithms; actionable insights; a focus on real-world applications; consideration of multiple factorsData bias and generalizability; the complexity of long-term forecasting; dependency on historical data; challenges in real-time forecasting; the limited scope of the algorithms; framework limitations
A. M. Zaki et al. [15], (2025)An ML strategy for energy savings in air conditioning and lighting systemsNot applicableBoosted ensembled regression treesML enables efficient prediction of HVAC and lighting energy performance, improving sustainabilityStrong use of ensemble learning and smart sensor integrationLack of a data validation protocol
Xuetao Li et al. [16], (2024)A hybrid forecasting framework that synergistically integrates advanced ML algorithms with metaheuristic optimization techniquesNot applicableML models: CatBoost and XGBoost; optimization algorithms: SSA, PPSO, GWOEnhance the accuracy and efficiency of electrical load forecasts for efficient energy managementIntegration of advanced ML with optimization; high forecasting accuracy; real-world relevance; robust evaluation metrics.Dataset-specific findings; a lack of deep temporal modeling; limited diversity in ML models; optimization overhead
Xue Cui et al. [17], (2024)Predicting the energy consumption in residential buildings and analyzing the impact of house features on energy useU.S. Energy Information Administration (EIA)ML algorithms: LightGBM, CatBoost, XGBoost; the SHAP methodImproving the energy efficiency of residential buildingsComprehensive data source; advanced ML models; interpretability with SHAP; personalized energy insightsLimited scope of building types; simplified features; overfitting risk; a lack of real-world validation
U. Ali et al. [18], (2024)Predicting the energy performance of urban buildings and analyzing renovation processesNot applicableData-driven ML with archetype modeling, end-use disaggregation, ensemble learningThe ML model achieved 91% accuracy in urban-scale prediction; helpful for retrofit planningA large synthetic dataset; practical policy applicationsA lack of real-world testbed validation; dependency on archetypes
Sijun Xu et al. [19], (2023)Thermal management and energy consumption in cooling systems for data centersNot applicableCooling system analysis and optimizationPUE values and load analysis for different cooling techniquesComprehensive review of thermal management; highlights importance of data center efficiencyThe nature of the review limits new insights—broad, not implementation-specific
F. Dinmohammadi et al. [20], (2023)Using advanced ML algorithms to predict the energy consumption in residential buildingsNot applicablePSO-optimized Random Forest Stacking Ensemble; SOM + SHAPThe stacking model reached 95.4% accuracy; SHAP and causal inference improved the interpretationMultimodal ML interpretability; high performanceLimited generalization; based on specific case context
S. Kapp et al. [21], (2023)Predicting the energy consumption in industrial buildings using statistical and ML models based on the system’s physical parametersNot applicableA linear regressor in a transformed feature space; physical-parameter-informed featuresLinear model outperformed SVM; physical parameters enhanced prediction accuracyCombines physics and data science; interpretable modelUnknown external validity
Mohd Herwan Sulaiman and Zuriani Mustaffa [22], (2022)The optimal chiller loading using the BMO algorithmNot applicableAn evolutionary optimization algorithm (BMO)Reduces energy consumption in multi-cooling systems; achieves the optimal loadNovel optimization method; energy-saving focus; innovative approachRequires validation; generalizability unclear
D. Kim et al. [23], (2022)MPC performance evaluation for a TES cooling plantAir market program data [27]Model predictive control (MPC)Reduces PV overcapacity, GHG emissions, and peak loadReal-world demonstration relevance to grid decarbonization; robust controlComplex implementation; site-specific; long-term scalability questions
Y. D. Torres et al. [24], (2022)Statistical analysis of chiller station design variablesNot applicableStatistical analysisDesign and distribution affect energy use significantlyLife cycle cost included; informs design optimization; sustainable focusMay miss dynamic behavior; dataset limitations
E. Chaerun Nisa and Y.-D. Kuan [25], (2021)Benchmarking the prediction and forecasting of water chiller energy consumption using ML and deep learning algorithmsNot applicableMLP CNN LSTMLSTM performed best for short-term forecasting ( R 2 = 0.994); MLP was best for static predictionsComprehensive model comparison with real building dataOnly tested on a single building in Taiwan
Jee-Heon Kim et al. [26], (2019)Modeling and optimizing a chiller systemBuilding Energy Codes Program [28]Artificial neural networksA 99.07% prediction accuracy for HVAC systemsAdvanced ML modeling; performance enhancement; generalizable frameworkHigh data needs; overfitting risks; real-world applications not explored
Table 2. A description of the dataset features.
№ FeatureFeatureFeature TypeFeature Description
01Local Time (Timezone: GMT + 8 h)Small date timeTimestamp: an hour of the day and a day of the week
02Chilled Water Rate (L/sec)NumericalAmount of chilled water flow in liters per second
03Cooling Water Temperature (C)NumericalCooling water temperature in degrees Celsius
04Building LoadNumericalThe load of the building
05Outside Temperature (F)NumericalThe outdoor temperature in Fahrenheit
06Dew Point (F)NumericalThe dew point in Fahrenheit
07Humidity (%)NumericalThe amount of humidity as a percent
08Wind Speed (mph)NumericalThe wind speed in miles per hour
09Pressure (in)NumericalThe amount of pressure in inches
10Chiller Energy Consumption (kWh)NumericalThe chiller’s total energy consumption in kilowatt-hours
Table 3. A few rows of the dataset for all features and their values.
Local TimeChilled Water RateCooling Water TemperatBuilding LoadOutside TemperatureDew PointHumidityWind SpeedPressureChiller Energy Consumption
8/18/2019 0:0085.631.4479.68275791329.83116.2
9/4/2019 6:0092.731.3468.3817379229.77112
10/26/2019 11:30106.733.2566.7917355329.83125.3
11/23/2019 15:00102.833.5612.6847984929.77143.9
12/21/2019 19:3087.831469.7797589529.8104.6
2/3/2020 21:0097.431.1487.5817584729.8698.1
3/12/2020 23:3090.931.5457.9827579529.89101.9
4/25/2020 3:0082.730.6393.1797794229.7798.1
6/1/2020 13:00108.733.3569.7827579529.86129
Table 4. Correlation matrix between features set and target features.
Row IDLocal TimeChilled Water Rate (L/s)Cooling Water Temp. (°C)Building Load (RT)Outside Temp. (°F)Dew Point (°F)Humidity (%)Wind Speed (mph)Pressure (in)Chiller Energy (kWh)
Local Time1.0−1.01830.0410−1.01330.14710.0985−1.09140.0669−1.01771.1518
Chilled Water Rate−1.01831.00.33940.72690.4237−1.1428−1.43820.3539−1.02460.6389
Cooling Water Temp.0.04100.33941.00.36310.34610.1023−1.24970.1808−1.06920.4464
Building Load−1.01330.72690.36311.00.4190−1.1287−1.42140.3367−1.04860.7469
Outside Temp.0.14710.42370.34610.41901.0−1.0600−1.70640.3816−1.12010.4411
Dew Point0.0985−1.14380.1023−1.1287−1.06001.00.3114−1.1941−1.0104−1.0655
Humidity−1.0914−1.4382−1.2497−1.4214−1.70640.31141.0−1.43040.0837−1.4039
Wind Speed0.06690.35390.18080.33670.3816−1.1941−1.43041.0−1.00650.3064
Pressure−1.0177−1.0246−1.0692−1.0486−1.1201−1.01040.0837−1.00651.0−1.0873
Chiller Energy1.15180.63890.44640.74690.4411−1.0655−1.40390.3064−1.08731.0
Table 5. Evaluation metrics.
MetricDerivations
R 2 1 i = 1 n ( True values i Predicted values i ) 2 i = 1 n ( True values i True values ¯ ) 2
MAE 1 n i = 1 n | True values i Predicted values i |
MSE 1 n i = 1 n ( True values i Predicted values i ) 2
RMSE 1 n i = 1 n ( True values i Predicted values i ) 2
MSD 1 n i = 1 n ( Predicted values i True values i )
MAPE 100 % n i = 1 n True values i Predicted values i True values i
Adjusted R 2 1 ( 1 R 2 ) ( n 1 ) n p 1
Disclaimer/Publisher’s Note: The statements, opinions and data contained in all publications are solely those of the individual author(s) and contributor(s) and not of MDPI and/or the editor(s). MDPI and/or the editor(s) disclaim responsibility for any injury to people or property resulting from any ideas, methods, instructions or products referred to in the content.

