Article

GCT–CET Integrated Flexible Load Control Method for IES

1
School of Electrical and Control Engineering, Shaanxi University of Science & Technology, Xi’an 710021, China
2
State Grid Jibei Electric Power Co., Ltd., Research Institute, Beijing 100045, China
3
State Key Laboratory of Alternate Electrical Power System with Renewable Energy Sources, North China Electrical Power University, Beijing 100000, China
*
Author to whom correspondence should be addressed.
Energies 2025, 18(14), 3667; https://doi.org/10.3390/en18143667
Submission received: 2 June 2025 / Revised: 3 July 2025 / Accepted: 4 July 2025 / Published: 11 July 2025
(This article belongs to the Special Issue Low-Carbon Energy System Management in Sustainable Cities)

Abstract

Under the “dual carbon” goals, the low-carbon economic dispatch of integrated energy systems (IES) faces multiple challenges, including suboptimal economic efficiency, excessive carbon emissions, and limited renewable energy integration. While traditional green certificate trading (GCT) enhances renewable energy adoption, its emission reduction effect remains inadequate. Conversely, standalone carbon emission trading (CET) effectively curbs emissions but often at the expense of increased operational costs, making it difficult to achieve both economic and environmental objectives simultaneously. To address these limitations, this study proposes an innovative green certificate trading–tiered carbon emission trading (GCT–CET) synergistic mechanism integrated with demand-side flexible load optimization, developing a low-carbon dispatch model designed to minimize total system costs. Simulation experiments conducted with the CPLEX solver demonstrate that, compared to individual GCT or CET implementations, the proposed coordinated mechanism effectively combines renewable energy incentives (through GCT) with stringent emission control (via stepped CET), resulting in a 47.8% reduction in carbon emissions and a 5.4% decrease in total costs. Furthermore, the participation of flexible loads enhances supply–demand balancing, presenting a transformative solution for achieving high-efficiency and low-carbon operation in IES.

1. Introduction

Under the global energy transition background, significant progress has been made in low-carbon optimal dispatch research of integrated energy systems (IES) [1]. As a market-based tool relying on carbon emission rights [2], carbon emission trading (CET) has demonstrated notable advantages in IES dispatch. Reference [3] pioneered the introduction of tiered CET into IES models with multiple load interactions, Reference [4] further established an optimization model considering tiered carbon costs using the whale optimization algorithm, while references [5,6] confirmed that tiered CET more effectively constrains thermal unit output compared to conventional mechanisms, achieving energy conservation and emission reduction.
Concurrently, green certificate trading (GCT) as a certification system for renewable energy generation [7] has yielded a series of research achievements. Reference [8] innovatively incorporated GCT into IES with carbon capture and power-to-gas synergy, Reference [9] verified the resource optimization effect of carbon-certificate dual mechanisms in electricity markets, and reference [10] constructed an IES operation framework integrating both trading mechanisms. Subsequent studies deepened this research: Reference [11] improved GCT theory with renewable portfolio standards, reference [12] quantified GCT’s emission reduction effects through system dynamics, references [13] developed coordinated dispatch schemes for multi-energy markets, and reference [14] combined tiered CET with multi-energy conversion devices to enhance renewable energy accommodation.
In demand response research, reference [15] confirmed energy storage’s role in mitigating renewable energy fluctuations, reference [16] identified shortcomings in load-side resource dispatch studies, while reference [17] focused on demand response in energy hubs. References [18,19,20] made important breakthroughs: Reference [18] proposed source-load coordination strategies considering user willingness, reference [19] designed price incentive mechanisms for multi-region systems, and reference [20] categorized and studied flexible load regulation effects. However, reference [21] noted that existing research still inadequately addresses coordinated control of diversified flexible resources like thermal loads.
Despite these achievements, these studies, however, exhibit three key limitations: First, references [4,5,6,7] and [8,9,10,11,12,13,14] primarily focus on single mechanisms, lacking in-depth exploration of the synergy between CET and GCT; second, although references [15,16,17,18,19,20,21] address flexible loads, they insufficiently incorporate market mechanisms like tiered CET and GCT into the dispatch models for flexible loads; third, no optimization framework has been established that simultaneously integrates tiered CET, GCT, and diversified flexible loads.
The objective of this study is to integrate the GCT and CET mechanisms to reduce the operational costs of integrated energy systems while achieving carbon emission reductions. This study’s innovation lies in the following: Based on market mechanism theory from references [2,3], integrating technical methods from references [4,5,6,7,8,9,10,11,12,13,14,15,16,17,18,19,20,21] to build a coordinated IES optimization model incorporating carbon-certificate-load synergy. Simulation results show that compared to single-mechanism studies, this model achieves coordinated optimization with 23.6% higher renewable energy accommodation, 47.8% lower carbon emissions, and 5.4% reduced total costs, providing new insights for IES’s low-carbon transition.
The technical roadmap of this paper is shown in Figure 1.

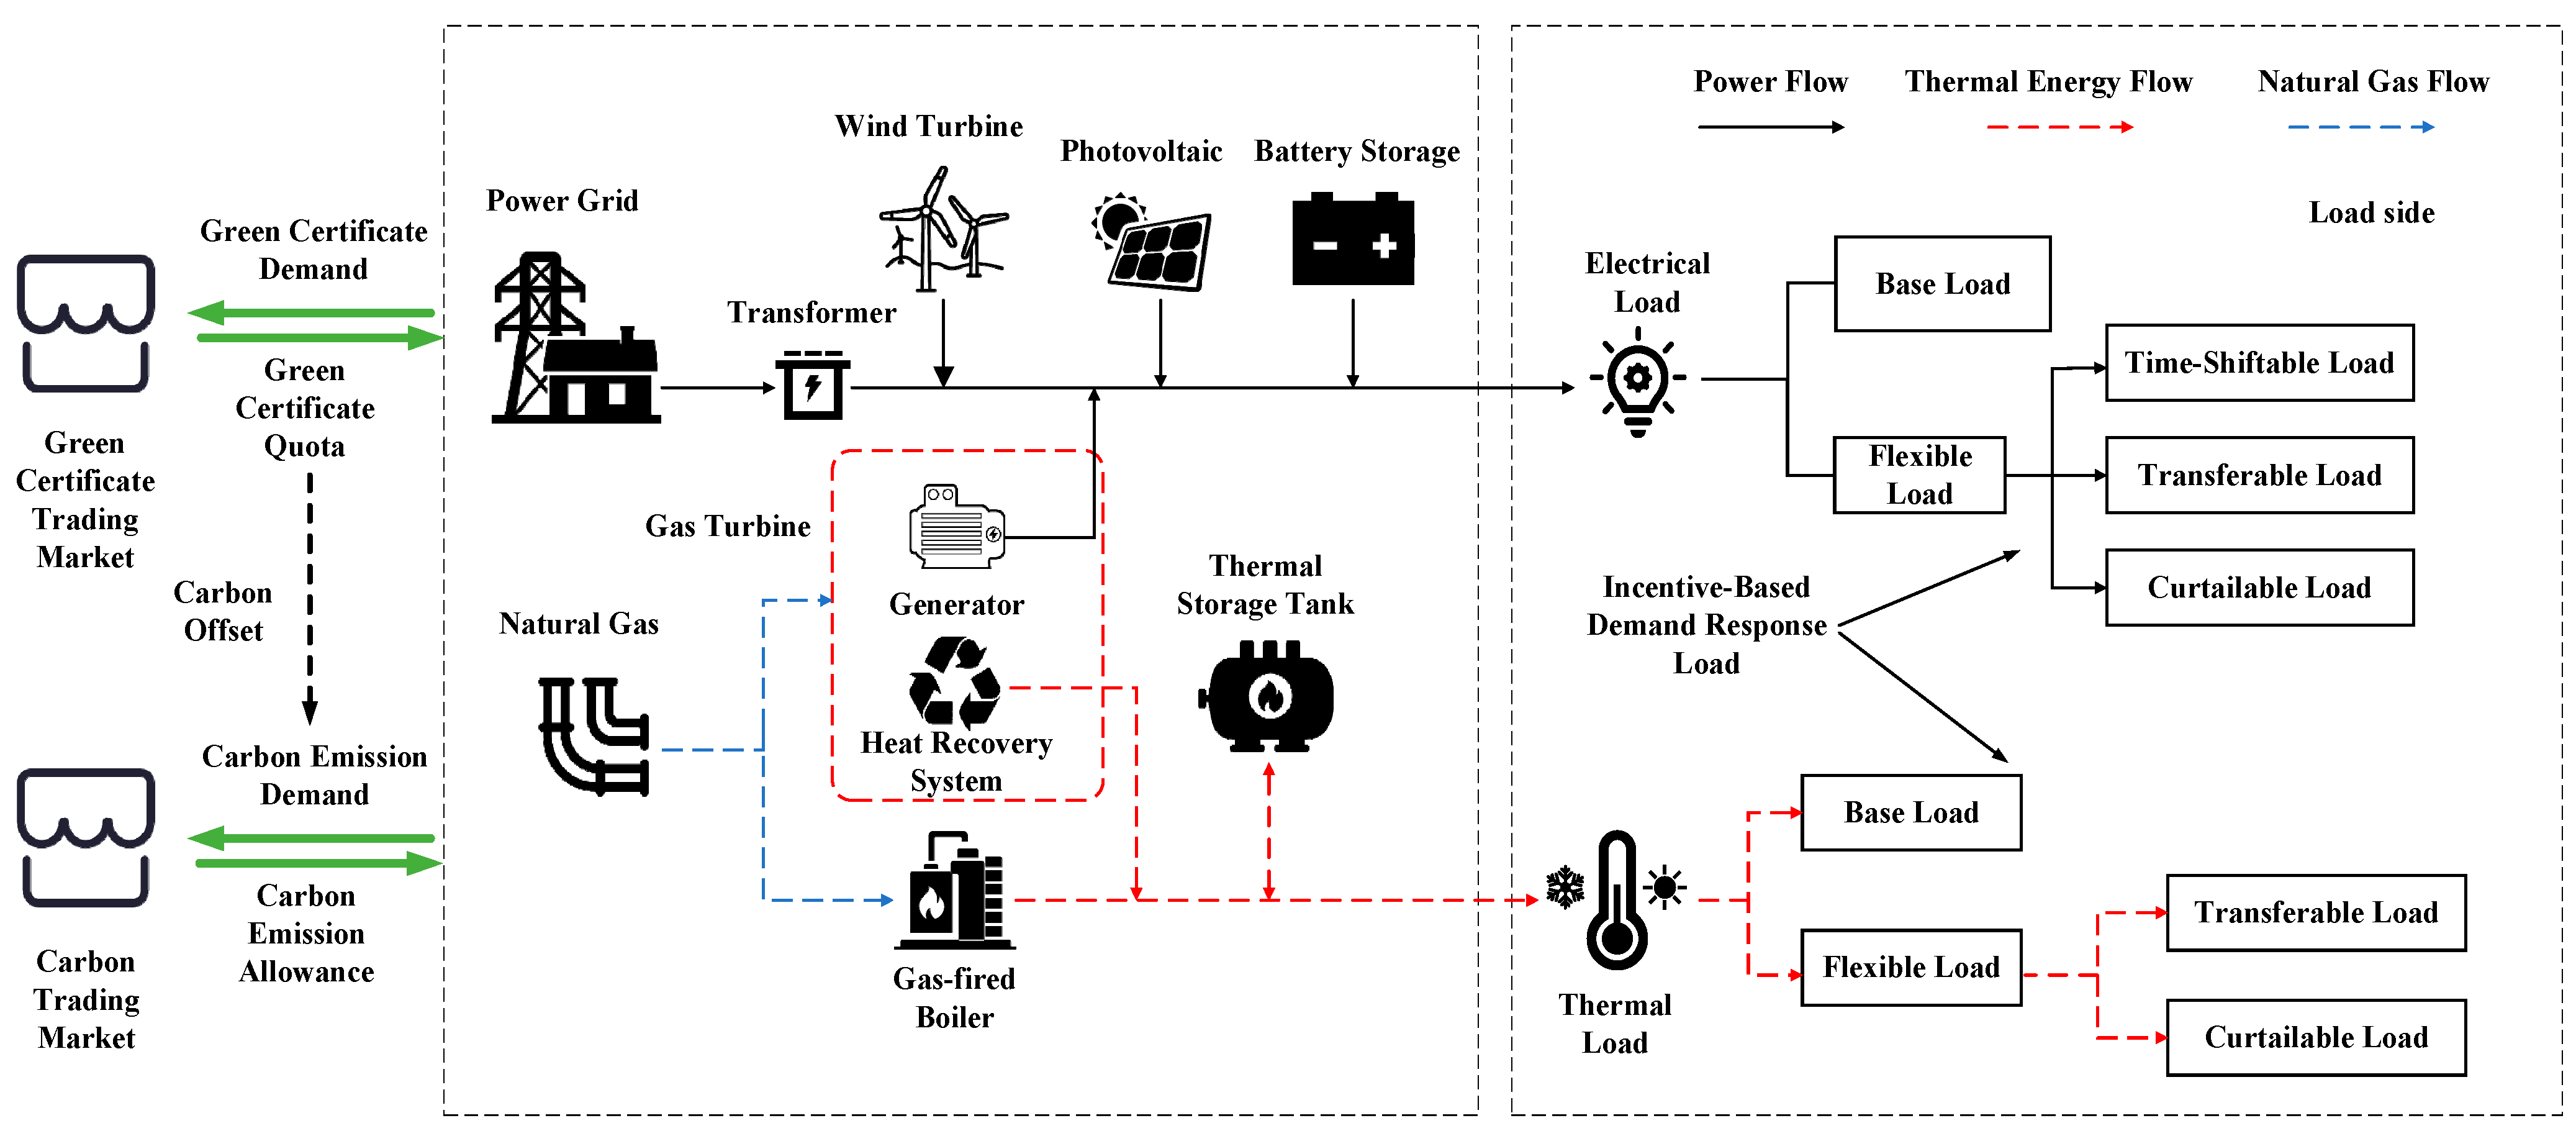
2. Flexible Load Modeling for Integrated Energy Systems

This study establishes an integrated energy system (IES) optimal dispatch model that introduces a green certificate trading–carbon emission trading (GCT–CET) mechanism based on conventional dispatch models to improve the accommodation level of renewable energy on the generation side and reduce system carbon emissions. On the demand side, an incentive-based demand response mechanism considering user satisfaction is introduced to achieve “peak shaving and valley filling” of thermal and electric loads. The optimization objective is set to minimize the comprehensive operating costs of the system, and multiple operational scenarios are established to conduct comparative verification of the effectiveness of the proposed dispatch strategy. The specific operational framework is shown in Figure 2, where the IES incorporating flexible loads is constructed using the energy hub (EH) framework [22].
The energy sources include grid electricity, renewable energy (wind and solar), and natural gas. Power output conversion is achieved through transformers and gas turbines, while heat supply is provided jointly by the waste heat recovery system of gas turbines and gas boilers. Electricity and heat storage are implemented using battery systems and thermal storage tanks, respectively. The load component comprises flexible electric loads and thermal loads.

2.1. Incentive-Based Integrated Demand Response Model

Adjustable loads in integrated energy systems (IES) represent significant resource potential [23]. Effective utilization of demand-side resources necessitates establishing supply–demand interaction mechanisms, primarily implemented through price-induced guidance and direct load control strategies [24]. The price-induced mechanism employs economic instruments including time-of-use pricing and electricity market participation to incentivize optimal consumption patterns [25], while the direct control approach utilizes regional energy management systems for real-time load monitoring and adjustment, with provision for load interruption when required, thereby enabling demand-side resources to function as critical operational regulation assets for power systems [26].
Considering the combined effects of electricity pricing and incentive-based demand response, along with the characteristics of various load types in response participation, loads can be categorized into the following four types:
Base load: Requires a continuous power supply with extremely high reliability requirements; it is unaffected by electricity prices or incentive measures, and cannot be interrupted or adjusted. Typically includes loads critical for safety or core production processes. Examples: Medical ventilators, operating room lighting; chemical reactor vessels, semiconductor wafer cleanrooms; data center servers, traffic signals, fire protection systems; refrigerators, cold storage facilities.
Time-shiftable load: Fixed operation duration but flexible scheduling within overall time windows. Examples: Washing machines, dishwashers; electroplating production lines, injection molding machines (non-continuous batch operations); electric bus overnight charging (must reach full charge before next-day operation) [27].
Transferable load: Allows flexible electricity consumption allocation across different time periods while maintaining constant total energy consumption over the scheduling cycle. Examples: Cold storage refrigeration (pre-cooling at night + daytime insulation), residential thermal storage heaters; aluminum electrolysis plant current adjustment (constant total output); smart irrigation systems (time-based pumping according to electricity prices with constant total water volume).
Curtailable load: Can tolerate power interruptions, reduced power levels, or compressed operation durations. Examples: increasing mall temperatures by 1–2 °C (10–20% load reduction); intermittent ventilation system operation, pump frequency reduction; temporary shutdown of advertising displays and decorative fountains; power reduction for instant water heaters, time-limited operation of pool pumps.
To fully exploit the carbon reduction potential of the GCT–CET mechanism and alleviate the peak-shaving pressure on the IES, this study employs incentive-based demand response to optimize the supply–demand relationship between the source and load sides. The incentive-based demand response encourages load-side participation in load shifting, transfer, or curtailment through compensation mechanisms [28]. Taking electric load (similarly applicable to thermal load) as an example, the following analyzes various adjustable load models and their corresponding compensation mechanisms:

2.1.1. Time-Shiftable Load

The time-shiftable load is denoted as L shift , with its pre-dispatch power distribution represented by L shift , as expressed in Equation (1):
L shift = 0 , , P t s shift , P t s + 1 shift , , P t D shift , , 0 .
The equation parameters are defined as follows:
t s represents the initial time period;
P t s shift denotes the power of the time-shiftable load during the period t s , with an adjustable time window t sh , t sh + ;
t D indicates the duration.
We introduce a binary variable α to characterize the operational state of L shift during the time interval τ: α τ = 1 indicates L shift is active in this period, while α τ = 0 denotes L shift remains inactive. The set of initial time periods S s h i f t can then be expressed as:
S shift = t sh , t sh + t D + 1 { t S } .
If τ = t s , the load remains unchanged. If τ t sh , t sh + t D + 1 and τ t s , the post-shift power distribution starting from t s is given by:
L shift = 0 , , P τ shift , P τ + 1 shift , , P τ + t D t S shift , , 0 .
The compensation cost F s h i f t for users after load shifting is given by:
F shift = F cost shift P sum shift t = t sh t sh + t D + 1 α t .
The parameters in the equation are defined as follows:
F s h i f t represents the total compensation amount for adjustable time-shiftable loads;
F cost shift denotes the unit compensation price for time-shiftable loads;
P sum shift indicates the total shifted power.

2.1.2. Transferable Load

The schedulable time set for transferable load L t r a n is defined as t t r , t t r + , and a binary variable β is introduced to characterize the state during the time interval τ . When β τ = 1 holds, it indicates that a portion of power P τ tran in L t r a n has been transferred, with the transfer quantity constrained by Equation (5):
β t P min t r a n P t t r a n β t P max t r a n .
The parameters in the equation are defined as follows:
P min t r a n represents the minimum transferable load power quantity;
P max t r a n denotes the maximum transferable load power quantity.
To prevent load fragmentation across multiple discrete time intervals (which would lead to frequent start-stop cycling of equipment), the following operational constraints must be imposed on load transfer:
τ = t t + T min tran 1 β t T min tran β t β t 1 .
The parameters in the equation are defined as follows:
T min tran represents the minimum continuous operating duration of the equipment.
The compensation cost for regulating the transferable load is given by:
F tran = F cost tran t = t tr ι tr + β t P t tran .
The parameters in the equation are defined as follows:
F t r a n represents the total compensation amount for regulating transferable loads;
F cost tran denotes the unit compensation price for load transfer.

2.1.3. Curtailable Load

The operational state of the curtailable load L c u t during the time interval τ is characterized by the binary variable γ . When condition γ τ = 1 is satisfied, it indicates that a portion L c u t of the load is curtailed in τ . The post-dispatch power during this interval can then be expressed as:
P τ cut = 1 θ τ γ τ P τ cut
The parameters in the equation are defined as follows:
θ τ represents the curtailment ratio at time τ , θ τ 0 , 1 ;
p τ c u t * represent the pre-dispatch power of the curtailable load L c u t at time τ .
Considering user satisfaction, necessary constraints must be applied to the duration and frequency of load reduction execution.
Minimum continuous reduction time constraint:
ι = 1 ι + T min cut 1 γ ι T min cut ( γ ι γ ι 1 )
The parameters in the equation are defined as follows:
T min cut is the minimum continuous reduction time for the reducible load.
Maximum reduction time constraint:
t = 1 t + T max cut + 1 1 γ t 1 .
The parameters in the equation are defined as follows:
T max cut is the maximum continuous reduction time for the reducible load.
Reduction frequency constraint:
t = 1 24 γ t N max .
The parameters in the equation are defined as follows:
N max is the maximum number of reductions for the reducible load.
The corresponding compensation price is:
F cut = F cost cut t = 1 T γ t P t cut P t cut
The parameters in the equation are defined as follows:
F c u t is the total compensation amount for regulating the reducible load;
P t c u t is the reducible load power before regulation;
P t c u t * is the reducible load power after regulation;
F cost c u t is the compensation unit price for the reducible load.
By integrating the electrical load and heat load models and the GCT–CET coordination mechanism set up below, an integrated energy system framework is jointly constructed.

2.2. Green Certificate–Tiered Carbon Emission Trading Interaction Mechanism Model

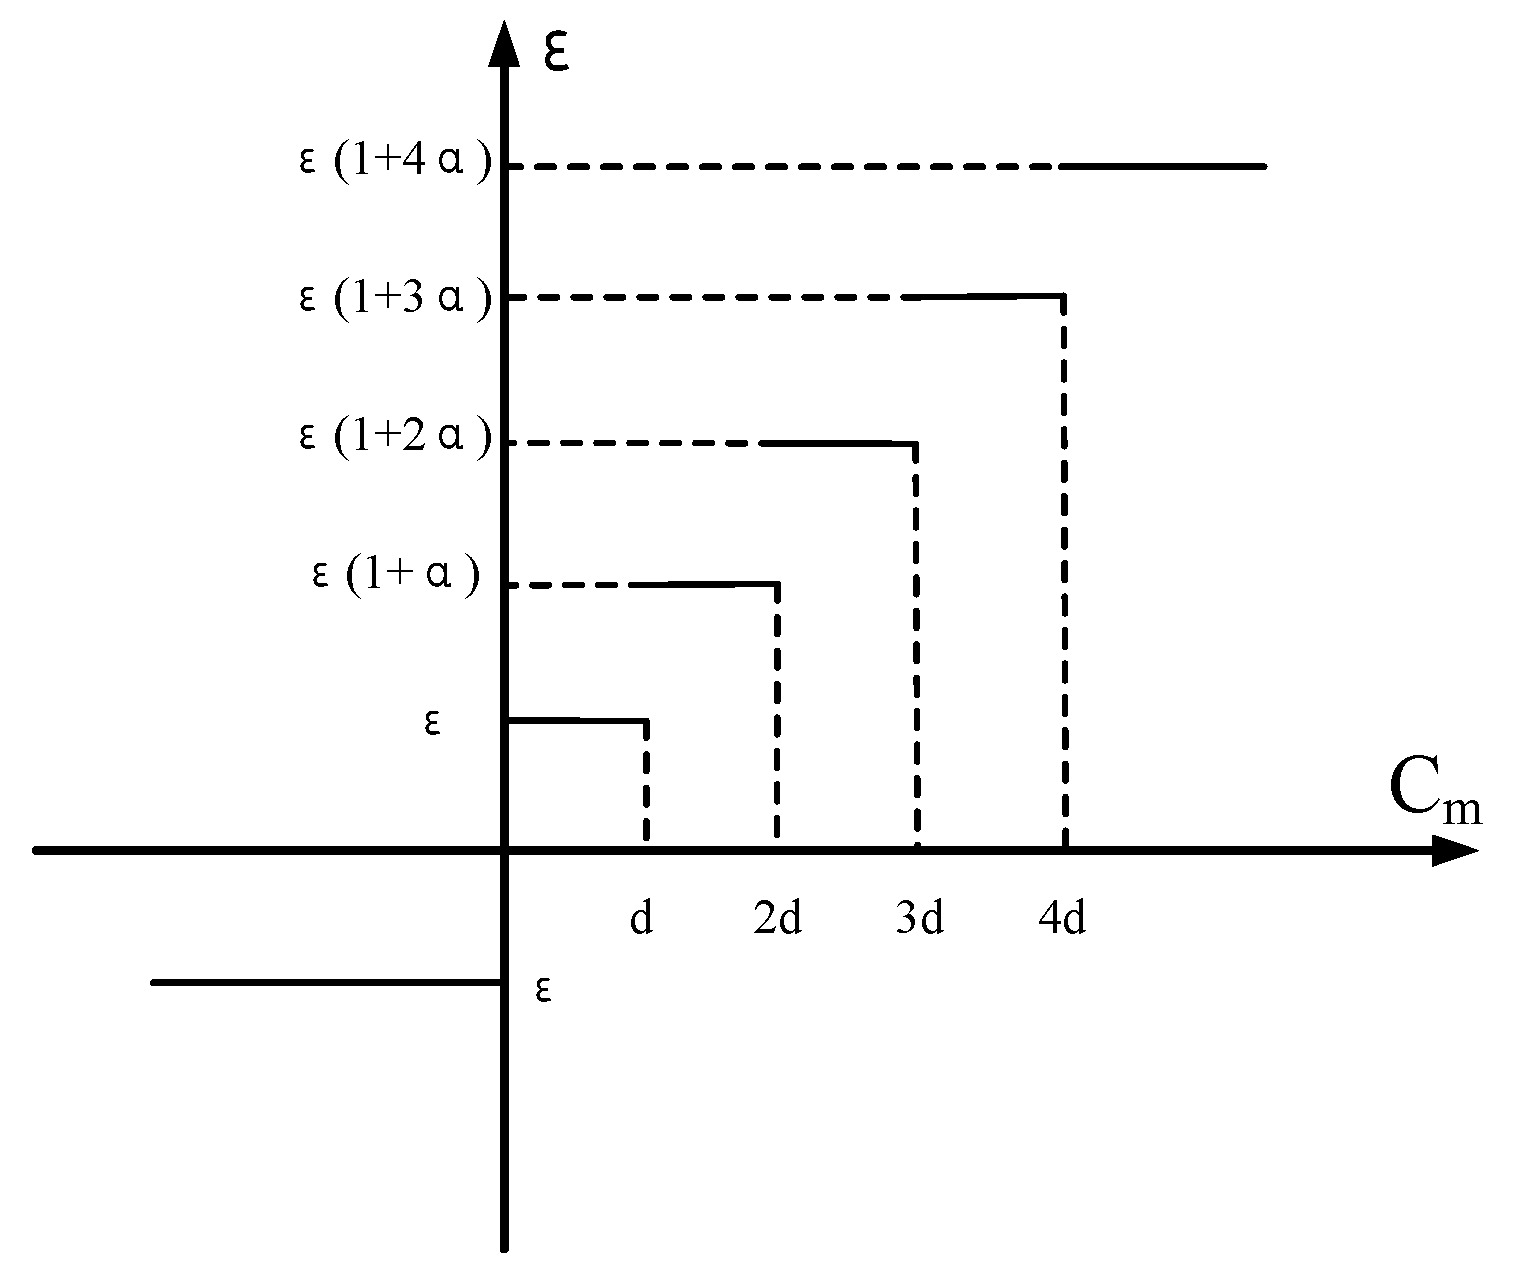
2.2.1. Tiered Carbon Trading Mechanism

Carbon trading is a market-based mechanism where regulators allocate initial emission allowances to entities. If an entity’s actual emissions are below its allowance, it can sell the surplus on carbon markets; if emissions exceed the allowance, it must purchase additional permits [29]. This system incentivizes companies to adopt energy-saving measures and emission reduction technologies for cost optimization.
Carbon trading cost calculation formula:
C m = Q m q m
The parameters in the equation are defined as follows:
C m denotes the carbon trading volume of the m-th generation unit;
Q m represents the actual carbon emissions of the m-th generation unit;
q m indicates the carbon emission allowance allocated to the m-th generation unit.
Given that carbon emissions in IES originate from both energy production/transportation and end-use processes, this paper employs a two-stage method to quantify the system’s carbon emissions:
Q m = ( c m pre + c m run ) P m .
The parameters in the equation are defined as follows:
c m pre denotes the carbon emission coefficient of the m-th energy equipment during its energy production and transportation phase;
c m r u n represents the carbon emission coefficient of the m-th energy equipment during its energy utilization phase;
P m indicates the operational power output of the m-th energy equipment.
The tiered pricing mechanism defines the transaction intervals and the corresponding carbon emission prices for the system’s participation in the carbon market. As the system’s carbon emissions increase, the unit carbon price gradually increases with a fixed increment α when C m 0 . When the actual carb ε on emissions are lower than the allocated carbon quota, the system can sell the remaining quota through the carbon trading platform to obtain economic benefits, with the base price being ε [30]. The relationship between the coefficients of the tiered carbon price is shown in Figure 3.
f m , CO 2 ε C m , C m d ε ( 1 + α ) ( C m d ) + ε d , d C m 2 d ε ( 1 + 2 α ) ( C m 2 d ) + ε ( 2 + α ) d , 2 d C m 3 d ε ( 1 + 3 α ) ( C m 3 d ) + ε ( 3 + 3 α ) d , 3 d C m 4 d ε ( 1 + 4 α ) ( C m 4 d ) + ε ( 4 + 6 α ) d , C m 4 d .
The parameters in the equation are defined as follows:
f C O 2 represents the carbon trading cost.
The IES carbon trading cost model based on the carbon trading mechanism is shown in the following formula:
F CO 2 = m = Ω f m , CO 2
The parameters in the equation are defined as follows:
Ω represents the set of energy equipment;
F C O 2 represents the total cost of carbon trading. When F C O 2 is positive, it indicates that carbon emissions exceed the quota, requiring the purchase of additional carbon emission allowances; conversely, when emissions exceed the quota, additional carbon emission permits need to be purchased.

2.2.2. Green Certificate Trading Mechanism

The core of green certificate technology is to collect real-time renewable energy power generation data through the Internet of Things, smart meters, blockchain, and other technologies. The green certificate trading (GCT) system mandates that energy suppliers meet renewable energy consumption obligations through green certificates, where one certificate represents 1 MWh of renewable electricity. Suppliers failing to meet quotas must purchase certificates through market trading [31]. These certificates serve as proof of renewable energy use and can be traded to fulfill obligations. The GCT cost is calculated as follows:
F GCT = λ ρ t = 1 24 P L ( t ) δ t = 1 24 [ P pv ( t ) + P w ( t ) ] .
The parameters in the equation are defined as follows:
F G C T represents the total cost of green certificate trading;
λ denotes the market trading price per individual green certificate;
ρ indicates the mandatory green certificate quota ratio for the IES;
δ is the conversion factor for transforming renewable energy generation into green certificates;
P L ( t ) represents the total electricity load;
P w ( t ) denotes the output power of wind turbines;
P p v ( t ) indicates the output power of photovoltaic generation.
The green certificate price reflects the environmental value of renewable energy and encourages investment through the market mechanism. When the green card price rises, it will stimulate developers to build more renewable energy projects; When the green card price decreases, it reflects the surplus of renewable energy, and the strategy or grid flexibility needs to be adjusted [32].

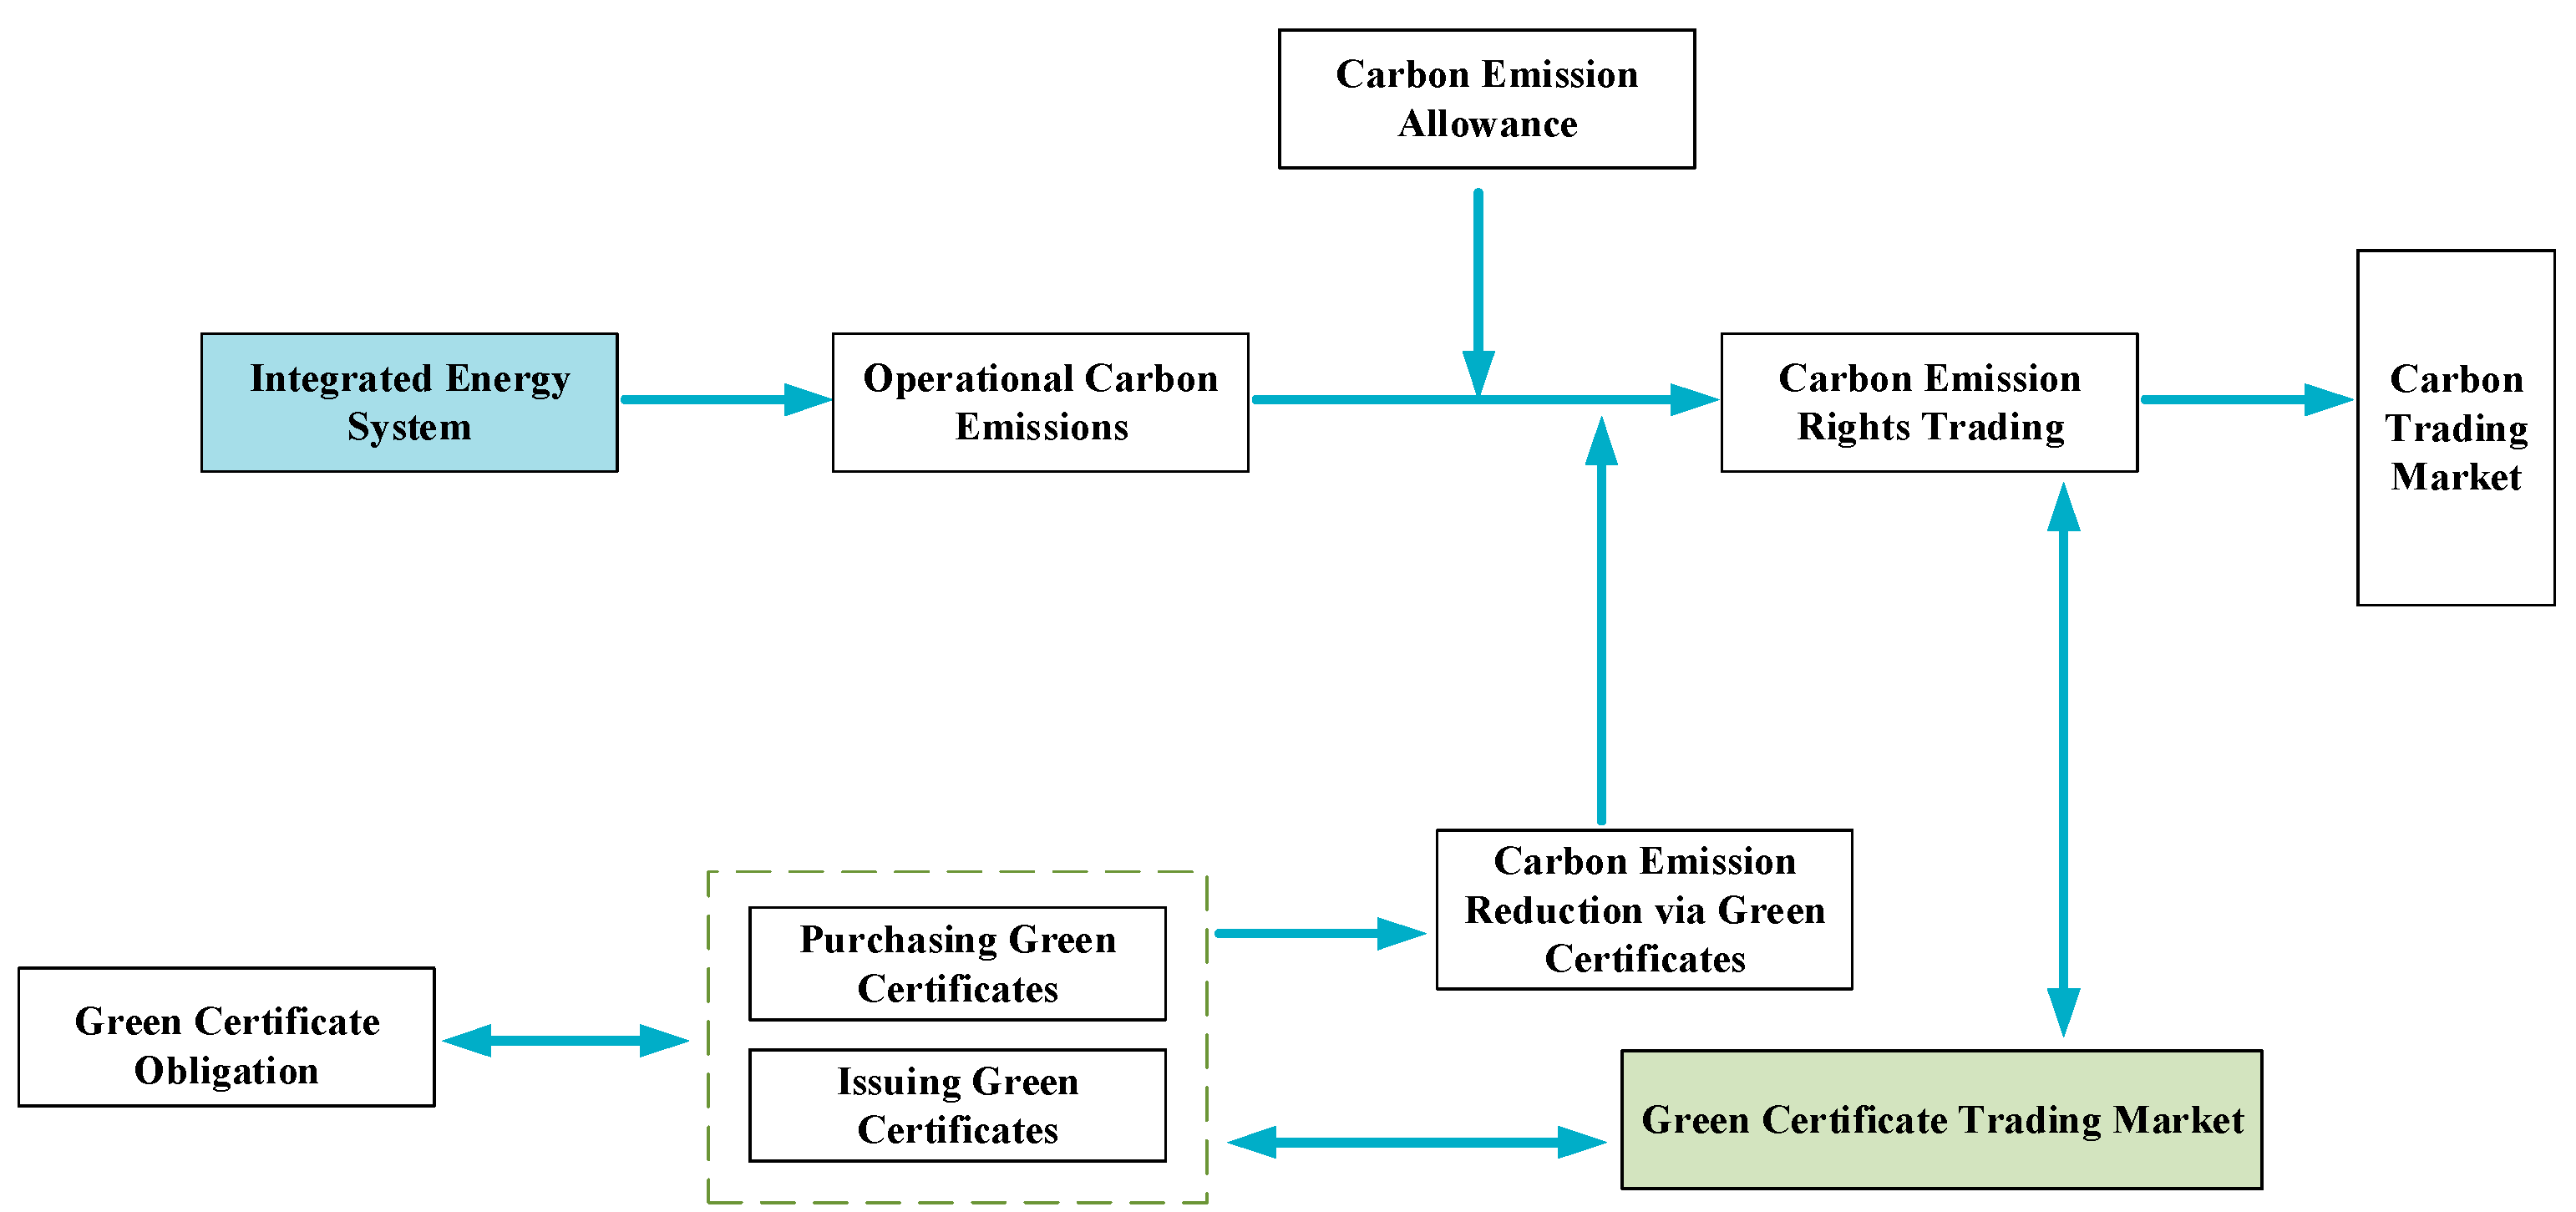
2.2.3. Green Certificate–Tiered Carbon Emission Trading Interaction Mechanism

Based on the aforementioned constructed carbon trading mechanism and green certificate trading mechanism, an integrated green certificate–tiered carbon trading model is developed. Under the GCT–CET (green certificate trading–tiered carbon emission trading) collaborative emission reduction framework established in this study, integrated energy system (IES) operators can not only obtain green certificates but also receive additional government-allocated carbon emission allowances. When considering the green certificate–tiered carbon trading interaction mechanism, this portion must be deducted from the total carbon emissions calculation. The computational formula is as follows:
B green = κ δ t = 1 24 [ P pv ( t ) + P w ( t ) ] .
The parameters in the equation are defined as follows:
B g r e e n represents the carbon emission allowances converted through the green certificate mechanism;
κ is the conversion coefficient.
The GCT–CET interaction process is illustrated in Figure 4. The government establishes the green certificate obligation quota based on the IES’s actual electricity load. The green certificate market then certifies the renewable energy consumed by the IES and issues corresponding green certificates [33]. While meeting the green certificate quota requirement, the IES may autonomously choose whether to purchase additional green certificates to offset its actual carbon emissions, subject to the operational cost minimization objective.

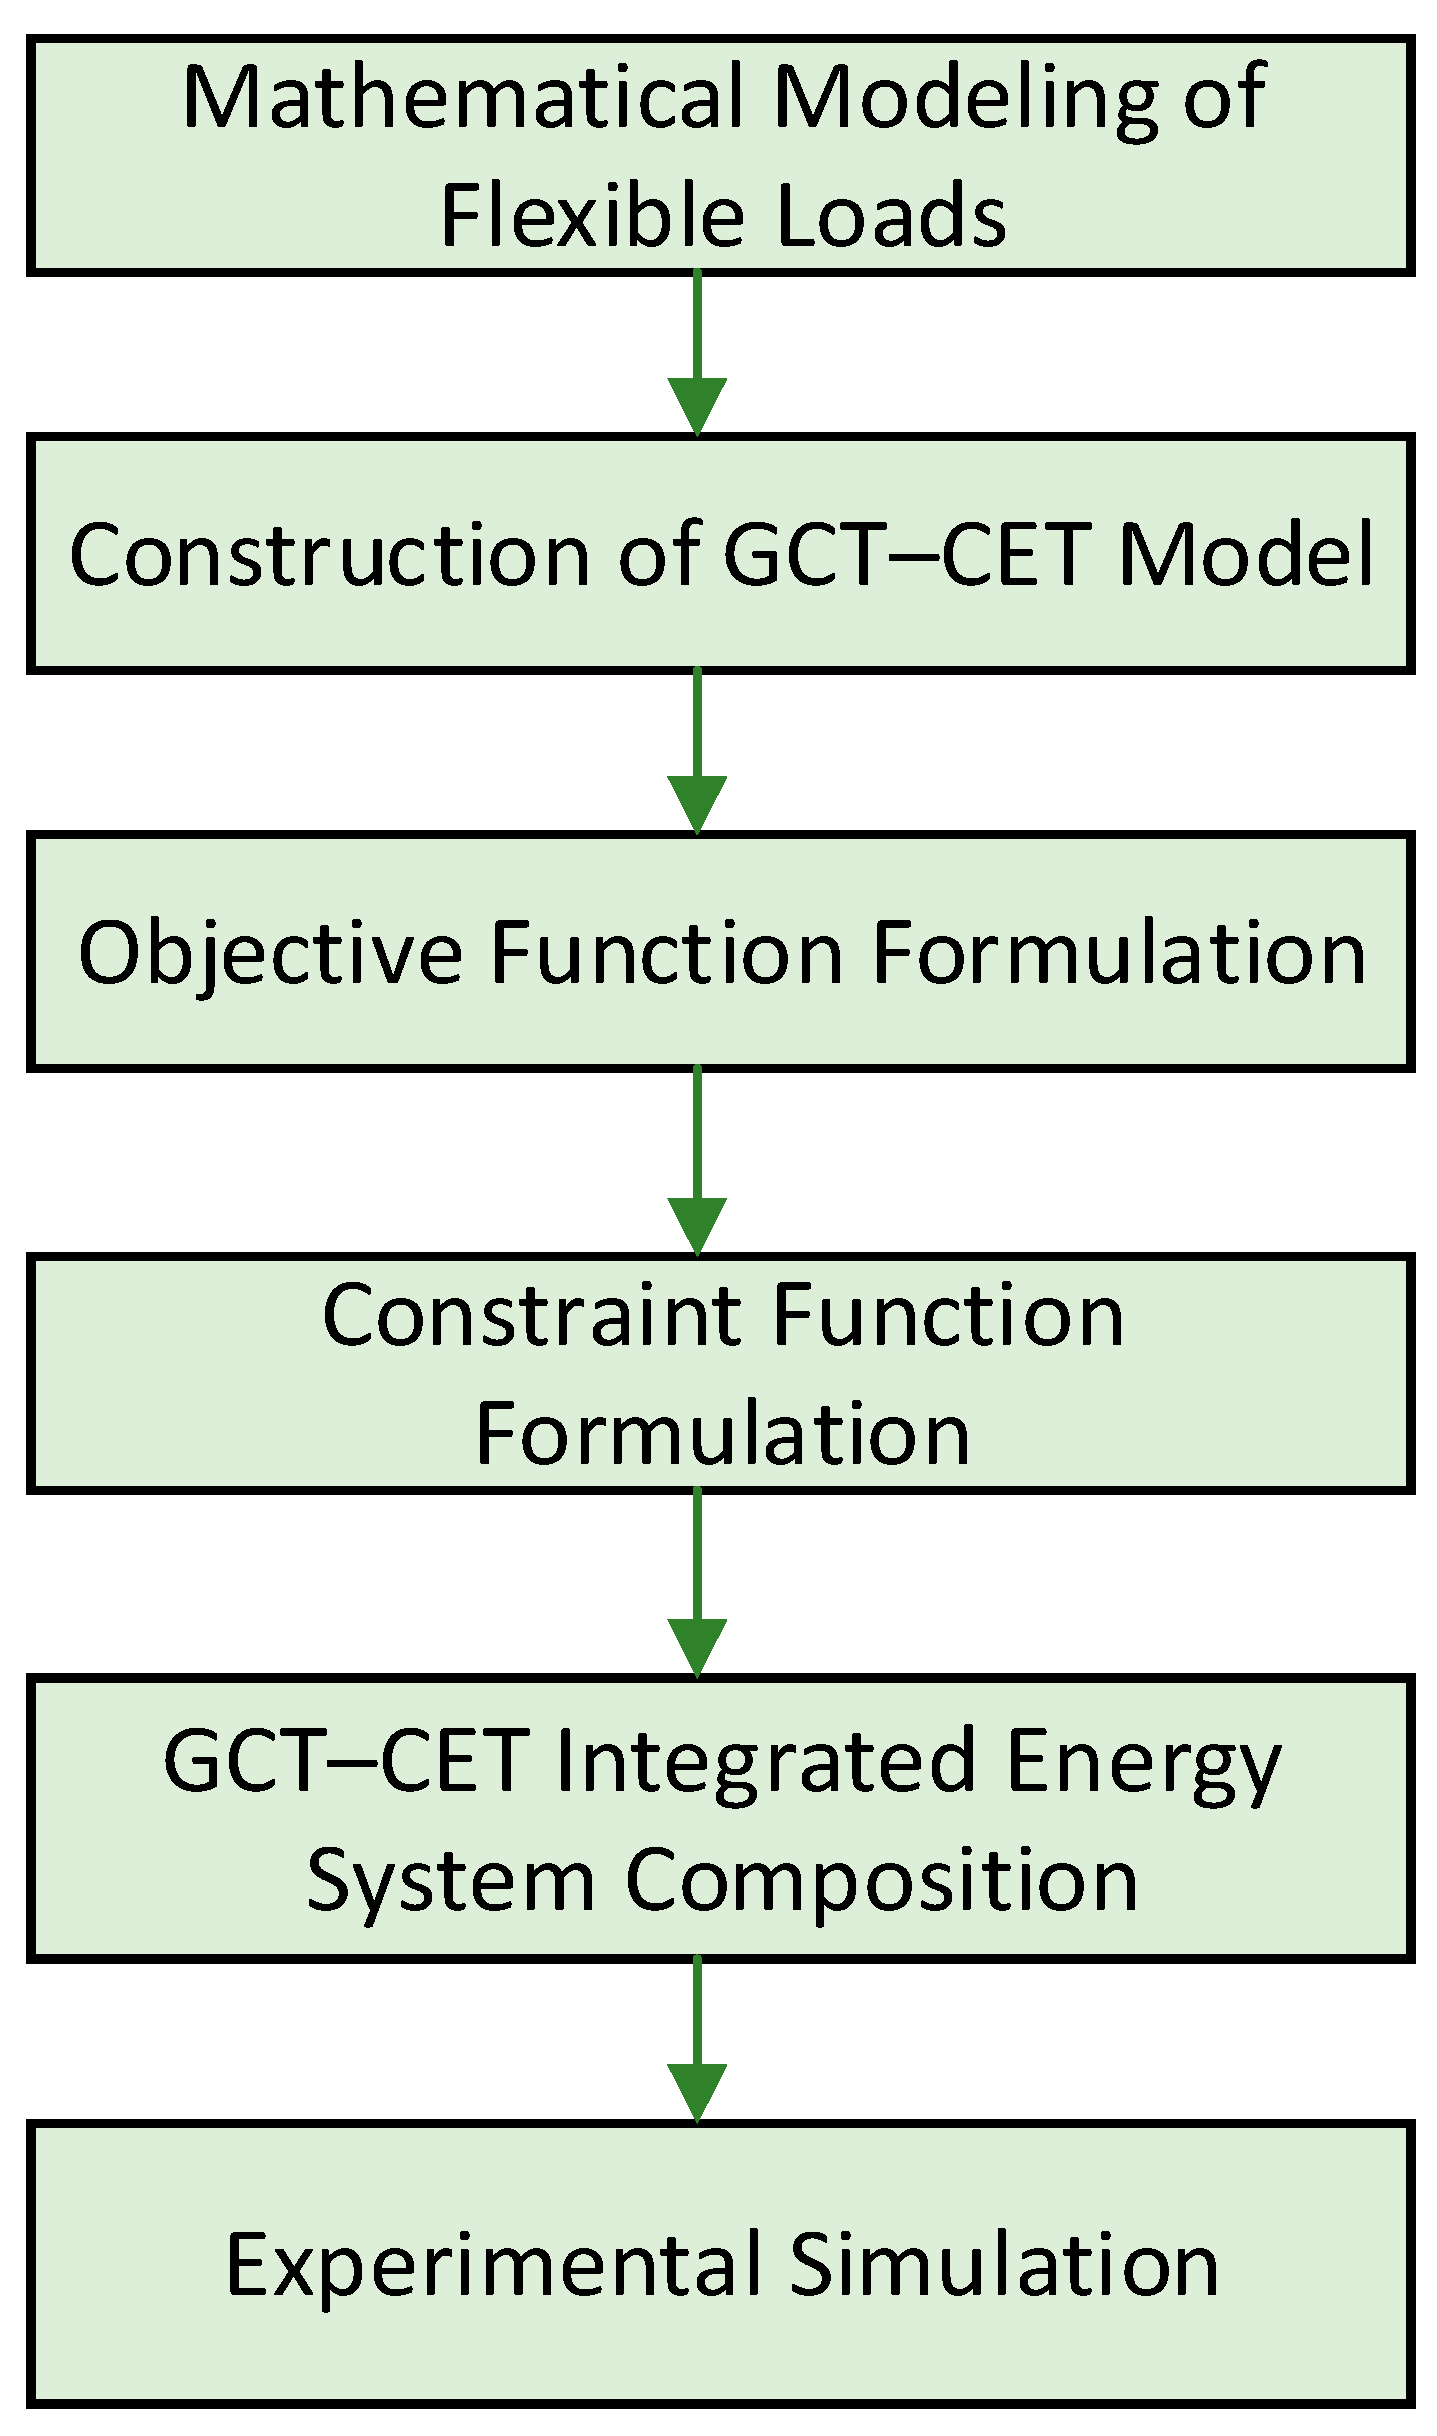
3. Optimal Dispatch Model for Integrated Energy Systems Considering Green Certificate–Tiered Carbon Emission Trading Interaction

3.1. Low-Carbon Economic Optimization Objective Function

The low-carbon economic optimization operation of a comprehensive energy system can be summarized as the reasonable allocation of energy resources over the next 24 h to minimize overall operating costs. Specifically, based on the forecast data for electricity and heat loads, as well as the estimated output of wind and photovoltaic power, the output arrangement of controllable devices is optimized under the premise of ensuring the operational constraints of each system unit. This also coordinates the flexible load adjustment on the user side and incorporates the charging and discharging strategy of the energy storage system, thereby improving energy utilization efficiency and reducing total costs (including operating costs, green certificate trading costs, and carbon emission costs).
The day-ahead operating costs of the comprehensive energy system encompass multiple aspects, including the operating costs of distributed power sources, the costs of purchasing electricity from the grid, the compensation costs for optimizing the flexible loads on the user side, fuel costs for gas turbines, and depreciation costs for batteries and thermal storage tanks. Due to the consideration of the interaction between the green certificate and tiered carbon trading, the total cost becomes the sum of the day-ahead operating costs, green certificate trading costs, and carbon trading costs. Therefore, the objective function is as shown in the following formula:
min F EH = F DG + F net + F MT + F GB + F HST + F BAT + F L + F GCT + F CO 2
F D G = t = 1 T K w P w t + K pv P pv t
F net = t = 1 T K b P net t
F GB = t = 1 T K GB P GB ( t )
F HST = t = 1 T K HST P HST t
F BAT = t = 1 T K BAT P BAT t
F L = F shifh + F tran + F cut .
The parameters in the equation are defined as follows:
F E H represents the total system cost (monetary units);
F D G denotes distributed generation operating costs;
F n e t indicates grid interaction costs;
F M T represents gas turbine operating costs;
F G B denotes gas boiler operating costs;
F H S T indicates thermal storage tank costs;
F B A T represents battery depreciation costs;
F L denotes flexible load regulation compensation costs;
F G C T represents green certificate trading costs;
F C O 2 indicates carbon emission costs;
T represents the total operating period (hours);
K w , K p v , and K G B represents cost coefficients for wind turbines, photovoltaics, and gas boilers;
K b denotes time-of-use electricity purchase prices;
K H S T and K B A T represent degradation coefficients for thermal storage, battery systems;
P w ( t ) and P p v ( t ) represent the output power of wind turbines, photovoltaics;
P H S T ( t ) indicates charge/discharge power of thermal storage;
P B A T ( t ) represents battery charge/discharge power;

3.2. Electric and Thermal Network Constraints

3.2.1. Electric Network Constraints

(1) Electric power balance constraint.
P w + P pv + P net + P MT = L e + P BAT L e = L base + L shift + L tran + L cut .
The parameters in the equation are defined as follows:
L e denotes the total electric load;
L b a s e represents the non-dispatchable base load in the IES (units: kW or MW);
L s h i f t , L t r a n , and L c u t , respectively, represent the time-shiftable load, transferable load, and curtailable load.
(2) Power output limits constraints.
0 P w P w , max
0 P p v P p v , max
P n e t , min P n e t P n e t , max
0 P M T P M T , max
P B A T , min P B A T P B A T , max .
The parameters in the equation are defined as follows:
P w , max and P p v , max , respectively, represent the predicted generation output of wind turbines and photovoltaic systems;
P n e t , max and P n e t , min correspond to the upper and lower limits of grid interaction power;
P M T , max indicates the maximum rated generation capacity of gas turbines;
P B A T , max and P B A T , min represents the maximum discharge and charge power of the battery storage system.
(3) Battery storage constraints.
The battery’s state of charge (SOC) must be maintained within safe operating limits, expressed through the following constraints:
S min S sup ( t ) S max .
The parameters in the equation are defined as follows:
S max denotes the maximum state of charge (SOC) of the battery storage system;
S min represents the minimum state of charge (SOC) of the battery storage system.
To prevent simultaneous charging and discharging of the battery storage system, the following constraint is imposed:
X t Y t = 0 .
The parameters in the equation are defined as follows:
X t indicates the charging status, X t 0 , 1 ;
Y t indicates the discharging status, Y t 0 , 1 .
To account for battery degradation from frequent cycling during scheduling, the following constraint is added:
t = 1 r X t + 1 X t N 1 t = 1 r Y t + 1 Y t N 2 .
The parameters in the equation are defined as follows:
N 1 denotes the maximum allowable charging cycles;
N 2 represents the maximum allowable discharging cycles.
The battery’s energy capacity at the start and end of the dispatch period must remain equal, enforced by the following constraint:
S 0 = S T .
The parameters in the equation are defined as follows:
S 0 denotes the initial state of charge (SOC) of the battery storage system;
S T represents the final state of charge (SOC) at the end of the scheduling period.

3.2.2. Thermal Network Constraints

(1) Thermal power balance constraint.
Q HT + Q GB = Q L + Q HST Q L = Q base + Q shift + Q cut .
The parameters in the equation are defined as follows:
Q L denotes the total thermal load;
Q b a s e represents the base thermal load;
Q s h i f t indicates the time-shiftable thermal load;
Q c u t specifies the curtailable thermal load.
(2) Power constraints.
0 Q HT Q HT , max
0 Q G B Q G B , max
Q HST , min Q HST Q HST , max
The parameters in the equation are defined as follows:
Q H T , max indicates the rated thermal output of heat recovery systems;
Q G B , max denotes the rated thermal output of gas turbines;
Q H S T , min represents the maximum discharge power of thermal storage;
Q H S T , max specifies the maximum charge power of thermal storage.
(3) Thermal storage constraints.
The thermal storage tank cannot charge and discharge simultaneously. Thus, its operating states must satisfy:
A t B t = 0
The parameters in the equation are defined as follows:
A t represents the thermal storage charging state;
B t represents the thermal storage discharging state.
The thermal energy content must be equal at the start and end of the scheduling period:
W 0 = W T .
The parameters in the equation are defined as follows:
W 0 is the initial heat of thermal storage at scheduling start;
W T is the final heat of thermal storage at the scheduling end.
Compared with the existing integrated energy system optimal scheduling model framework, this paper innovatively integrates green card and stepped carbon trading mechanism, and introduces the constraint of user satisfaction to improve the optimal operation results of the system.
Based on the above constraints, the integrated energy system described in Section 2 is formulated.

4. Experimental Setup and Results Analysis

4.1. Experimental Setup

4.1.1. Simulation Software and Hardware

The experiment was conducted on a computer equipped with an AMD Ryzen 5 5600 6-Core processor, NVIDIA GeForce GTX 4070 graphics card, and 16.0 GB RAM. The model was solved using the CPLEX solver (IBM of the United States) in the YALMIP toolbox under MATLAB R2023b.

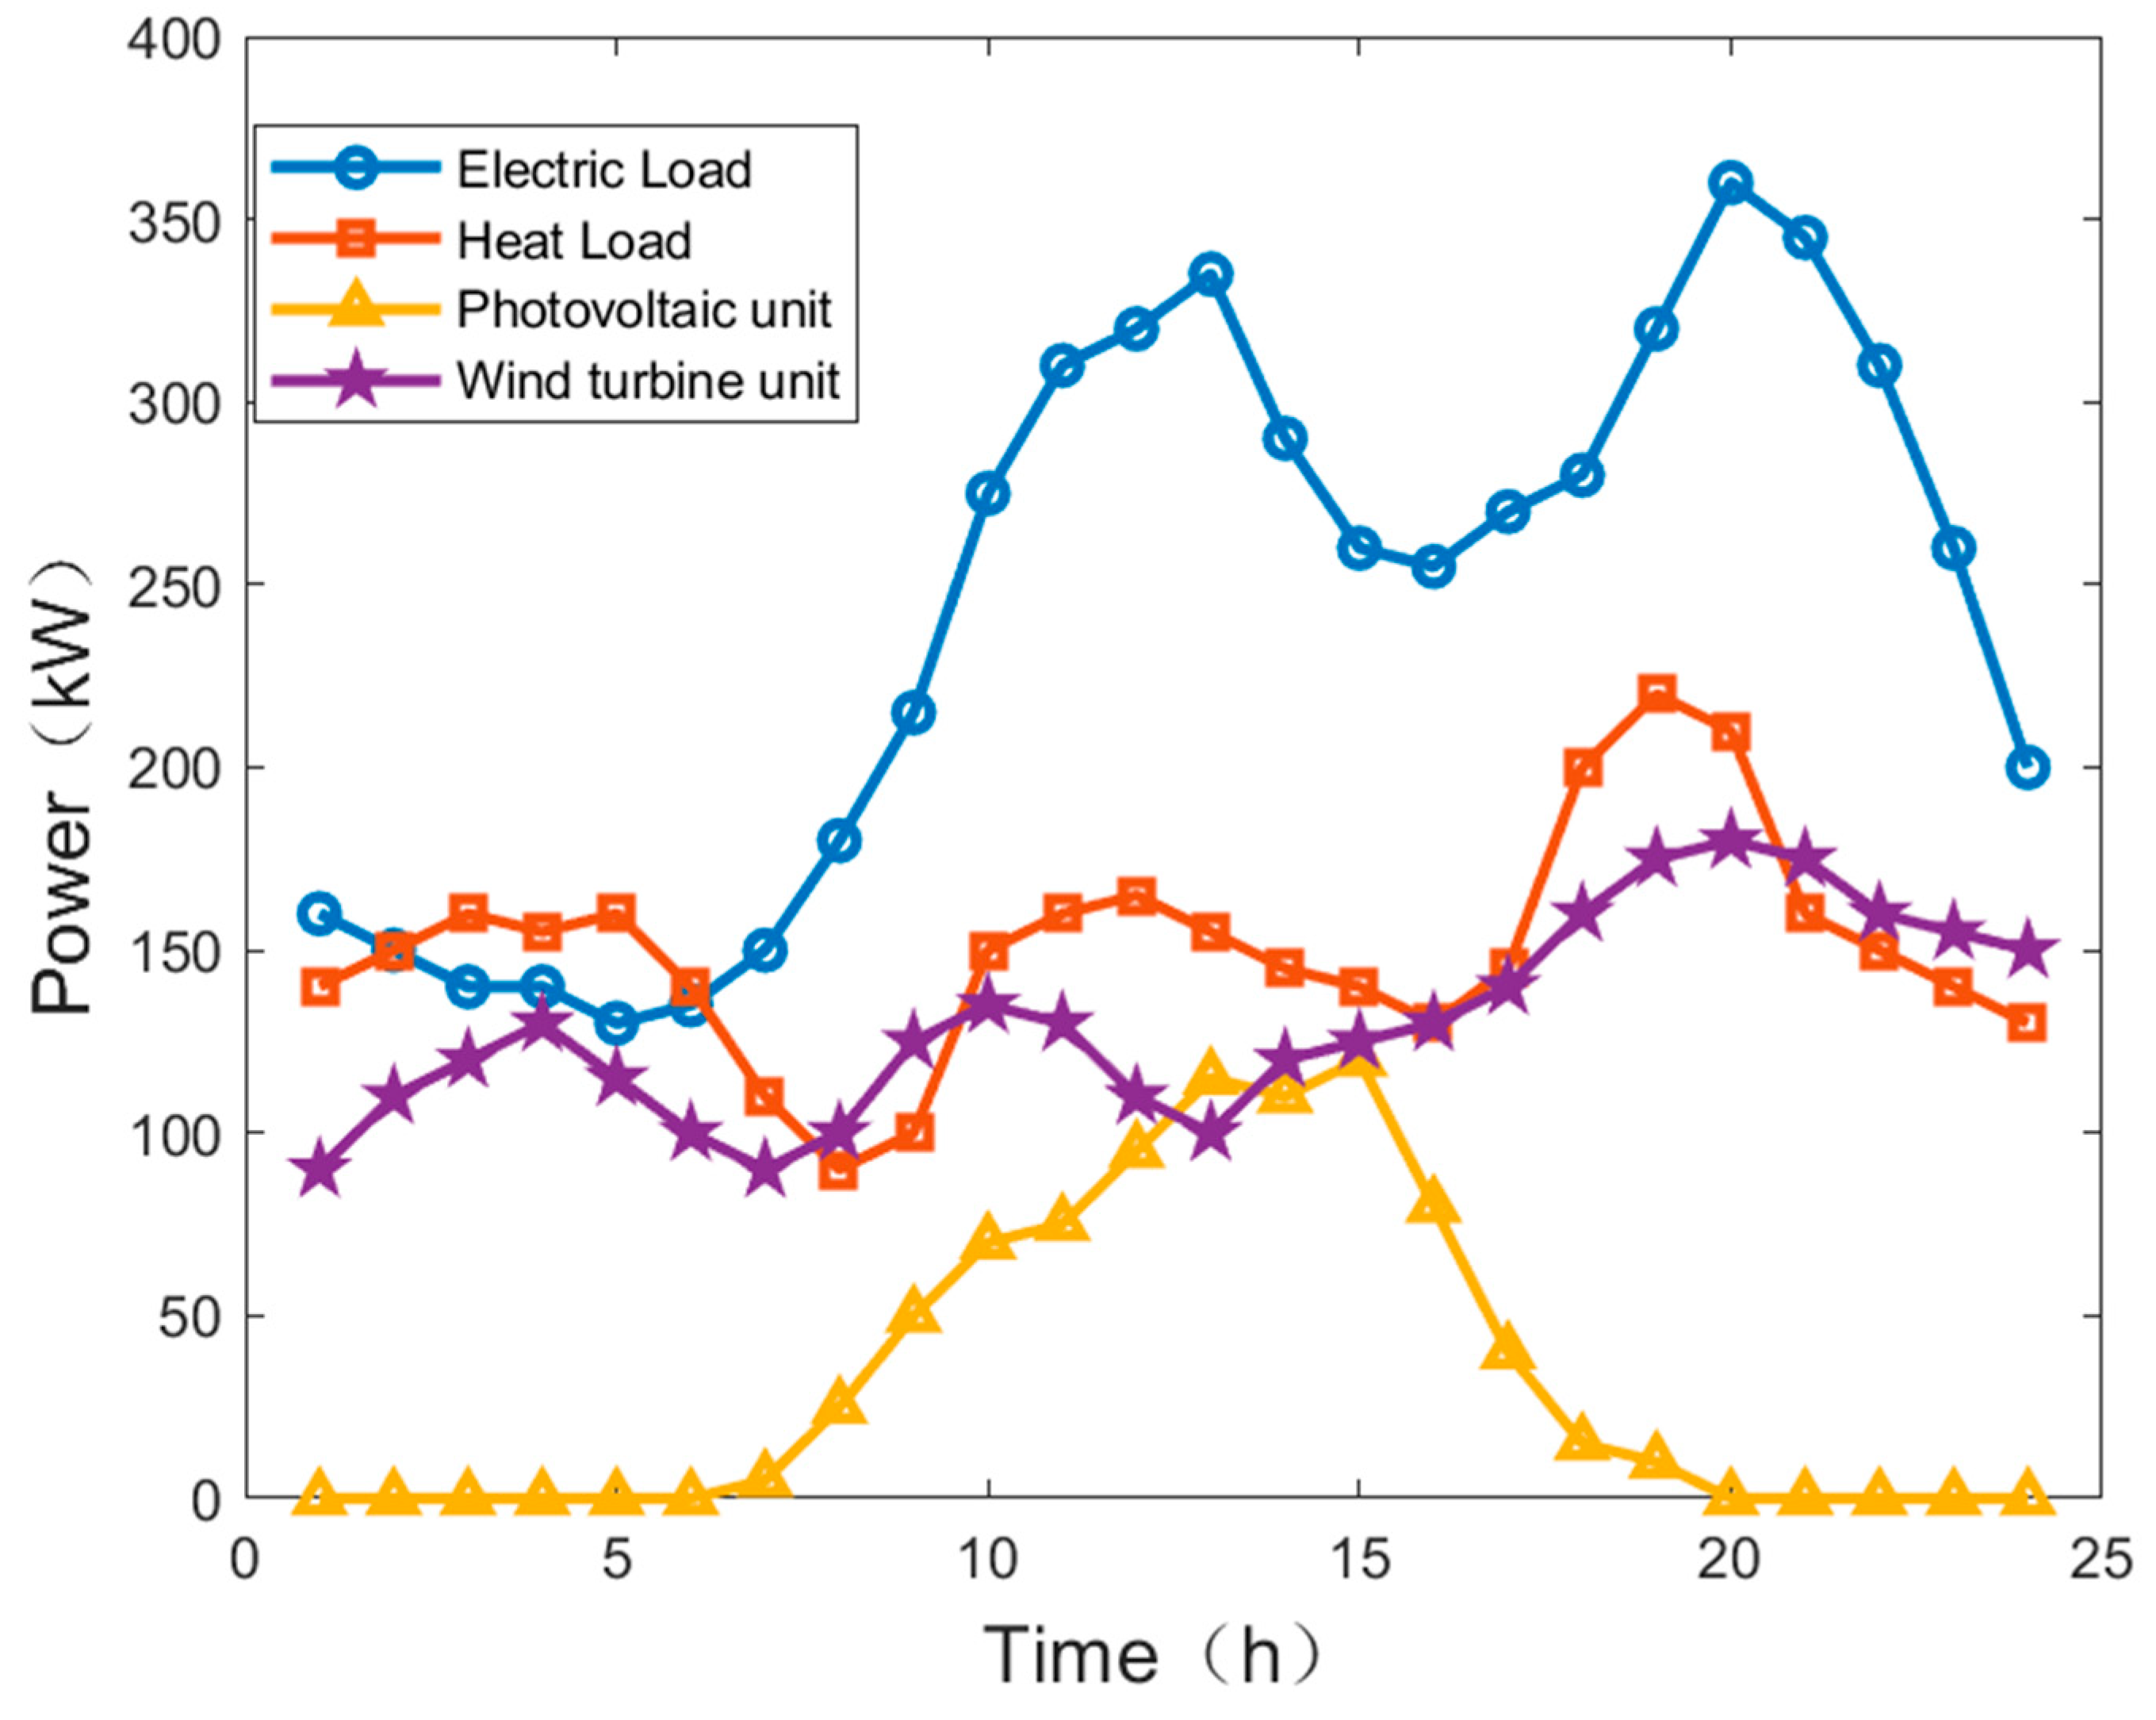
4.1.2. Data Description

To validate the effectiveness of the integrated energy system’s flexible load regulation method, incorporating green certificate–tiered carbon trading interactions, this section conducts analysis through specific numerical examples. The time horizon is divided into 24 intervals, corresponding to hourly scheduling operations. Figure 5 shows the predicted results of various loads and wind/solar output within the comprehensive energy system. The electrical load and thermal load data are obtained using the load forecasting method from reference [34], while the wind turbine and photovoltaic output forecasts are derived using the scenario clustering method from reference [35].

4.1.3. Parameter Settings

The natural gas price is set at CNY 2.5/m3 with a lower heating value of 9.7 kWh/m3. For the battery storage system, the minimum state of charge ( S min ) is set at 0.40, maximum state of charge ( S max ) at 0.95, charge/discharge efficiency at 0.9, self-discharge coefficient at 0.001, with charge/discharge cycles limited to 8 times. The installed capacities and operational parameters of all equipment are detailed in Table 1, Table 2, Table 3 and Table 4. The flexible loads include both electrical and thermal loads, with partial parameters configured according to Reference [26].
Following the time-of-use pricing mechanism, this study divides a day into six distinct periods for detailed analysis, with corresponding electricity prices provided in Table 5. Based on data from reference [36] and the two-stage carbon emission accounting method, Table 6 presents the carbon emission factors for various energy sources in this integrated energy system. The total carbon emission factor is obtained by summing the two-stage emission factors, with the base carbon trading price set at CNY 150/ton. Green certificate trading parameters are listed in Table 7. Additionally, it is assumed that prediction errors are fully accommodated by the system’s reserve capacity.

4.2. Comparative Analysis Across Scenarios

To investigate the impact of GCT–CET on integrated energy system (IES) dispatch operations and evaluate the optimization potential of flexible loads in low-carbon economic dispatch, this study designs eight distinct scenarios for comparative analysis. The specific configurations of each scenario are shown in Table 8.
Scenario 1: Flexible loads do not participate in regulation; total cost includes carbon trading costs, but the objective function excludes carbon trading costs.
Scenario 2: Based on Scenario 1, the objective function includes carbon trading costs.
Scenario 3: Based on Scenario 1, shiftable, transferable, and curtailable flexible electric loads are considered.
Scenario 4: Based on Scenario 3, carbon trading costs are additionally included in the objective function.
Scenario 5: Based on Scenario 3, shiftable and curtailable flexible thermal loads are added to the dispatch.
Scenario 6: Based on Scenario 4, carbon trading costs are additionally included in the objective function.
Scenario 7: Based on Scenario 6, green certificate trading is introduced.
Scenario 8: Based on Scenario 7, the green certificate–tiered carbon trading interaction mechanism is incorporated.
As shown in Table 9, the dispatch results for the eight configured scenarios are presented. Subsequent analysis will be conducted from the following perspectives: consideration of the tiered carbon trading mechanism, effectiveness of green certificate trading, effectiveness of green certificate–tiered carbon trading interaction, effectiveness of introducing flexible loads, and the effectiveness of flexible loads in low-carbon economic dispatch.

4.2.1. Effectiveness Analysis of Carbon Trading Mechanism

A comparative analysis between Scenario 1 and Scenario 2 reveals significant operational differences. In Scenario 1, which neither incorporates the green certificate–carbon trading mechanism nor involves flexible load participation in system regulation, the total cost reaches its peak at CNY 3318.7 with maximum carbon emissions of 918.7 kg. In contrast, Scenario 2 demonstrates marked improvements after implementing the tiered carbon emission trading mechanism: carbon emissions are substantially reduced while the total cost decreases to CNY 3179.9. Furthermore, the introduction of the tiered carbon trading mechanism in Scenario 2 enhances renewable energy accommodation compared to Scenario 1, showcasing the mechanism’s dual benefits in both economic and environmental dimensions.

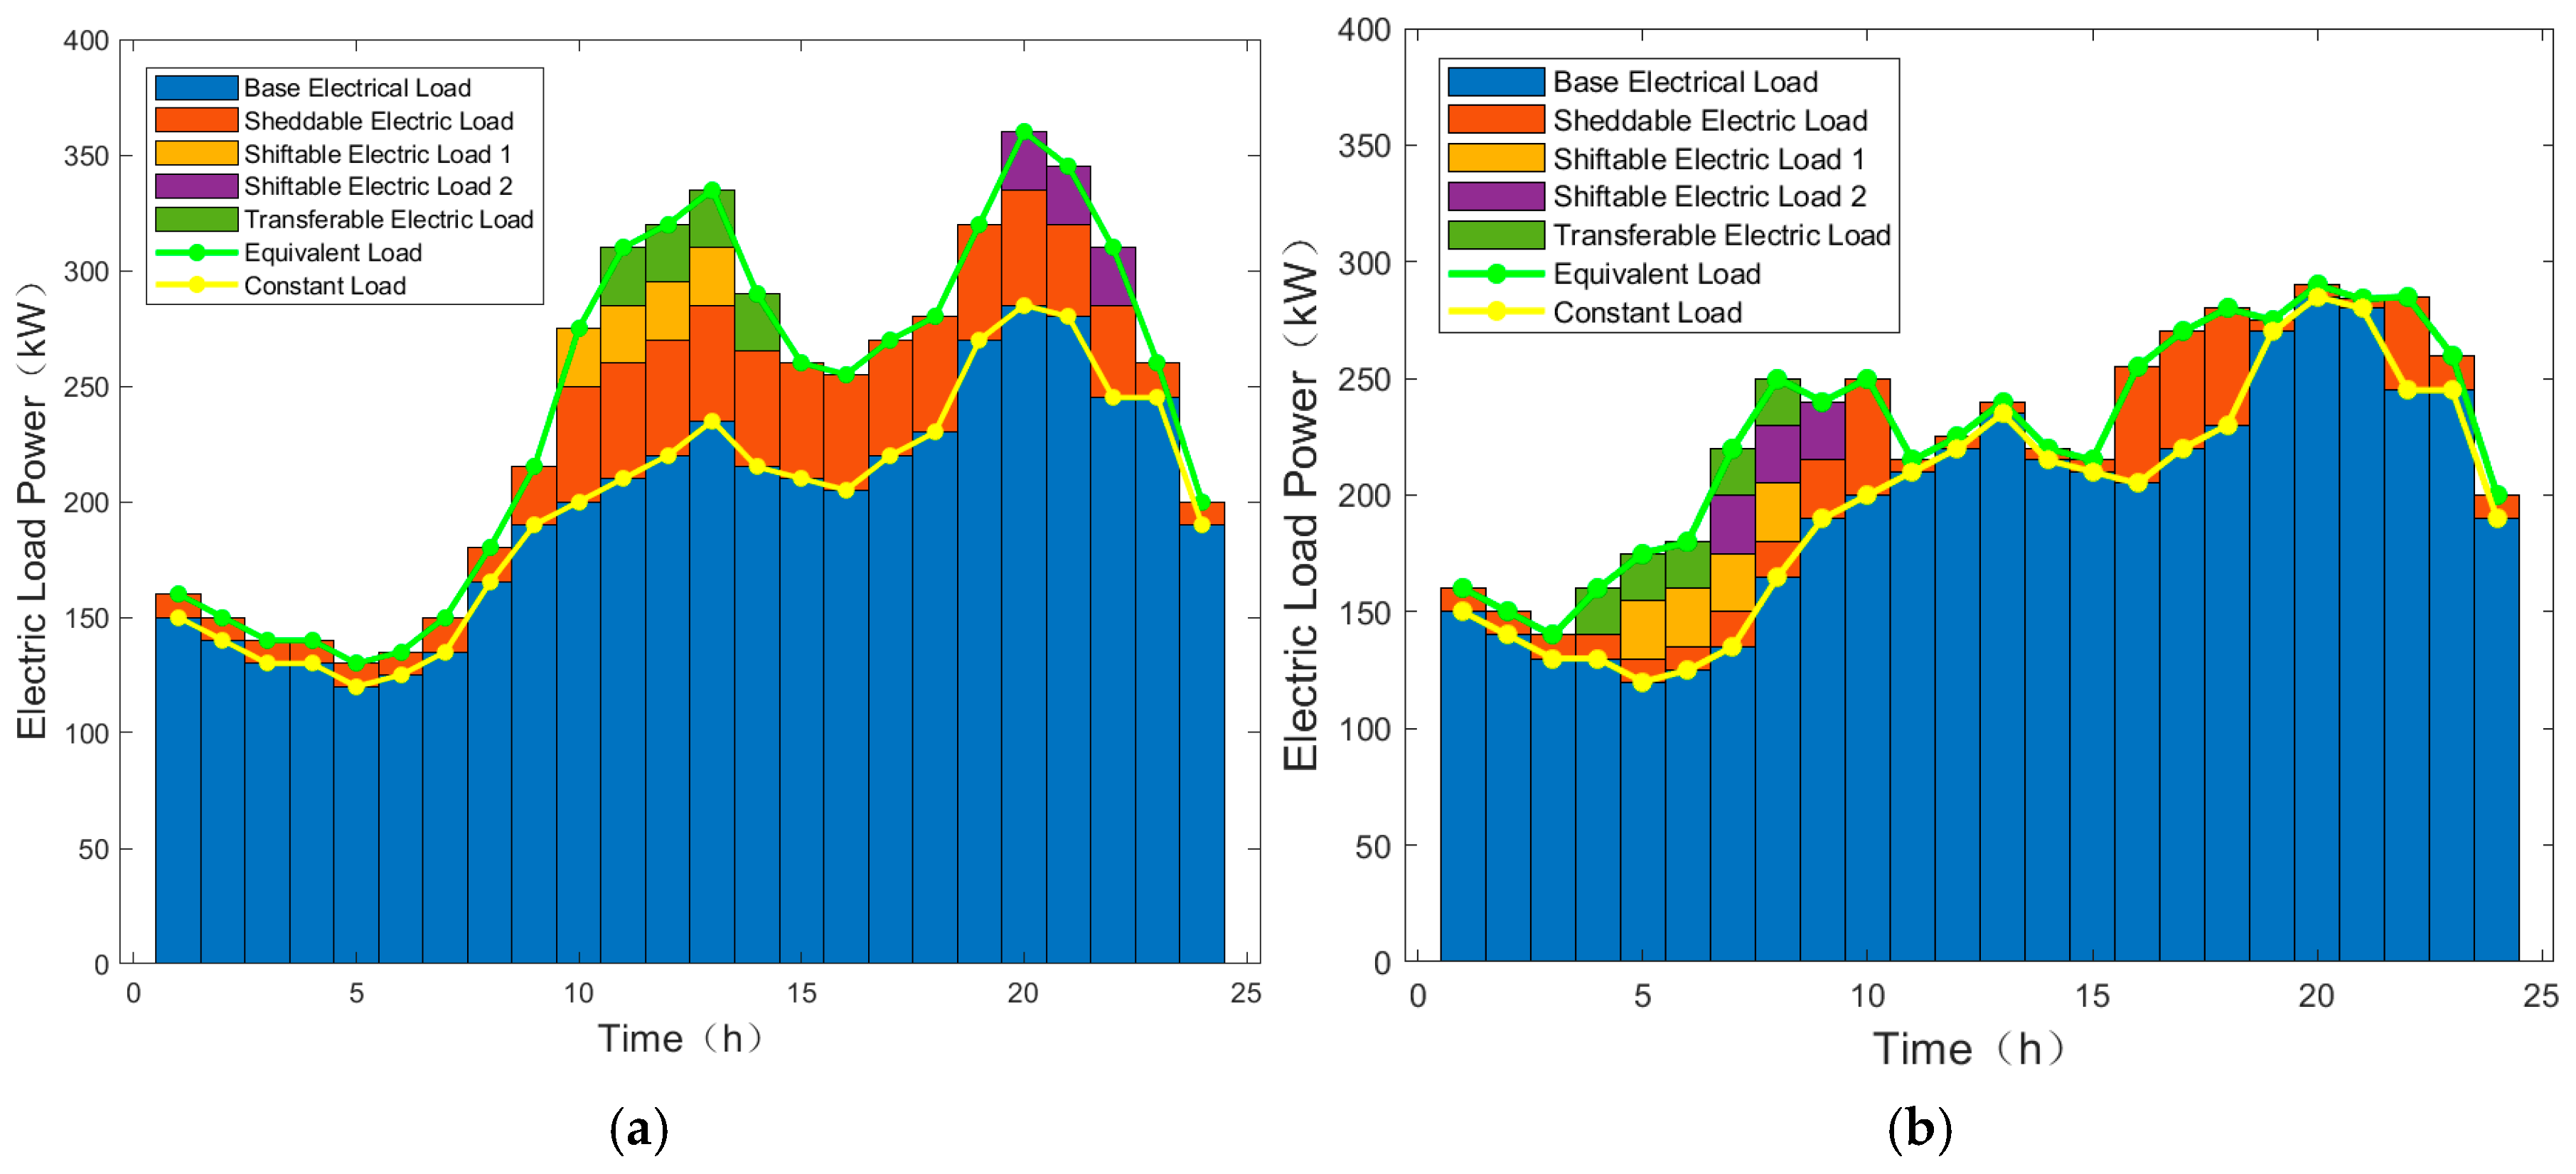
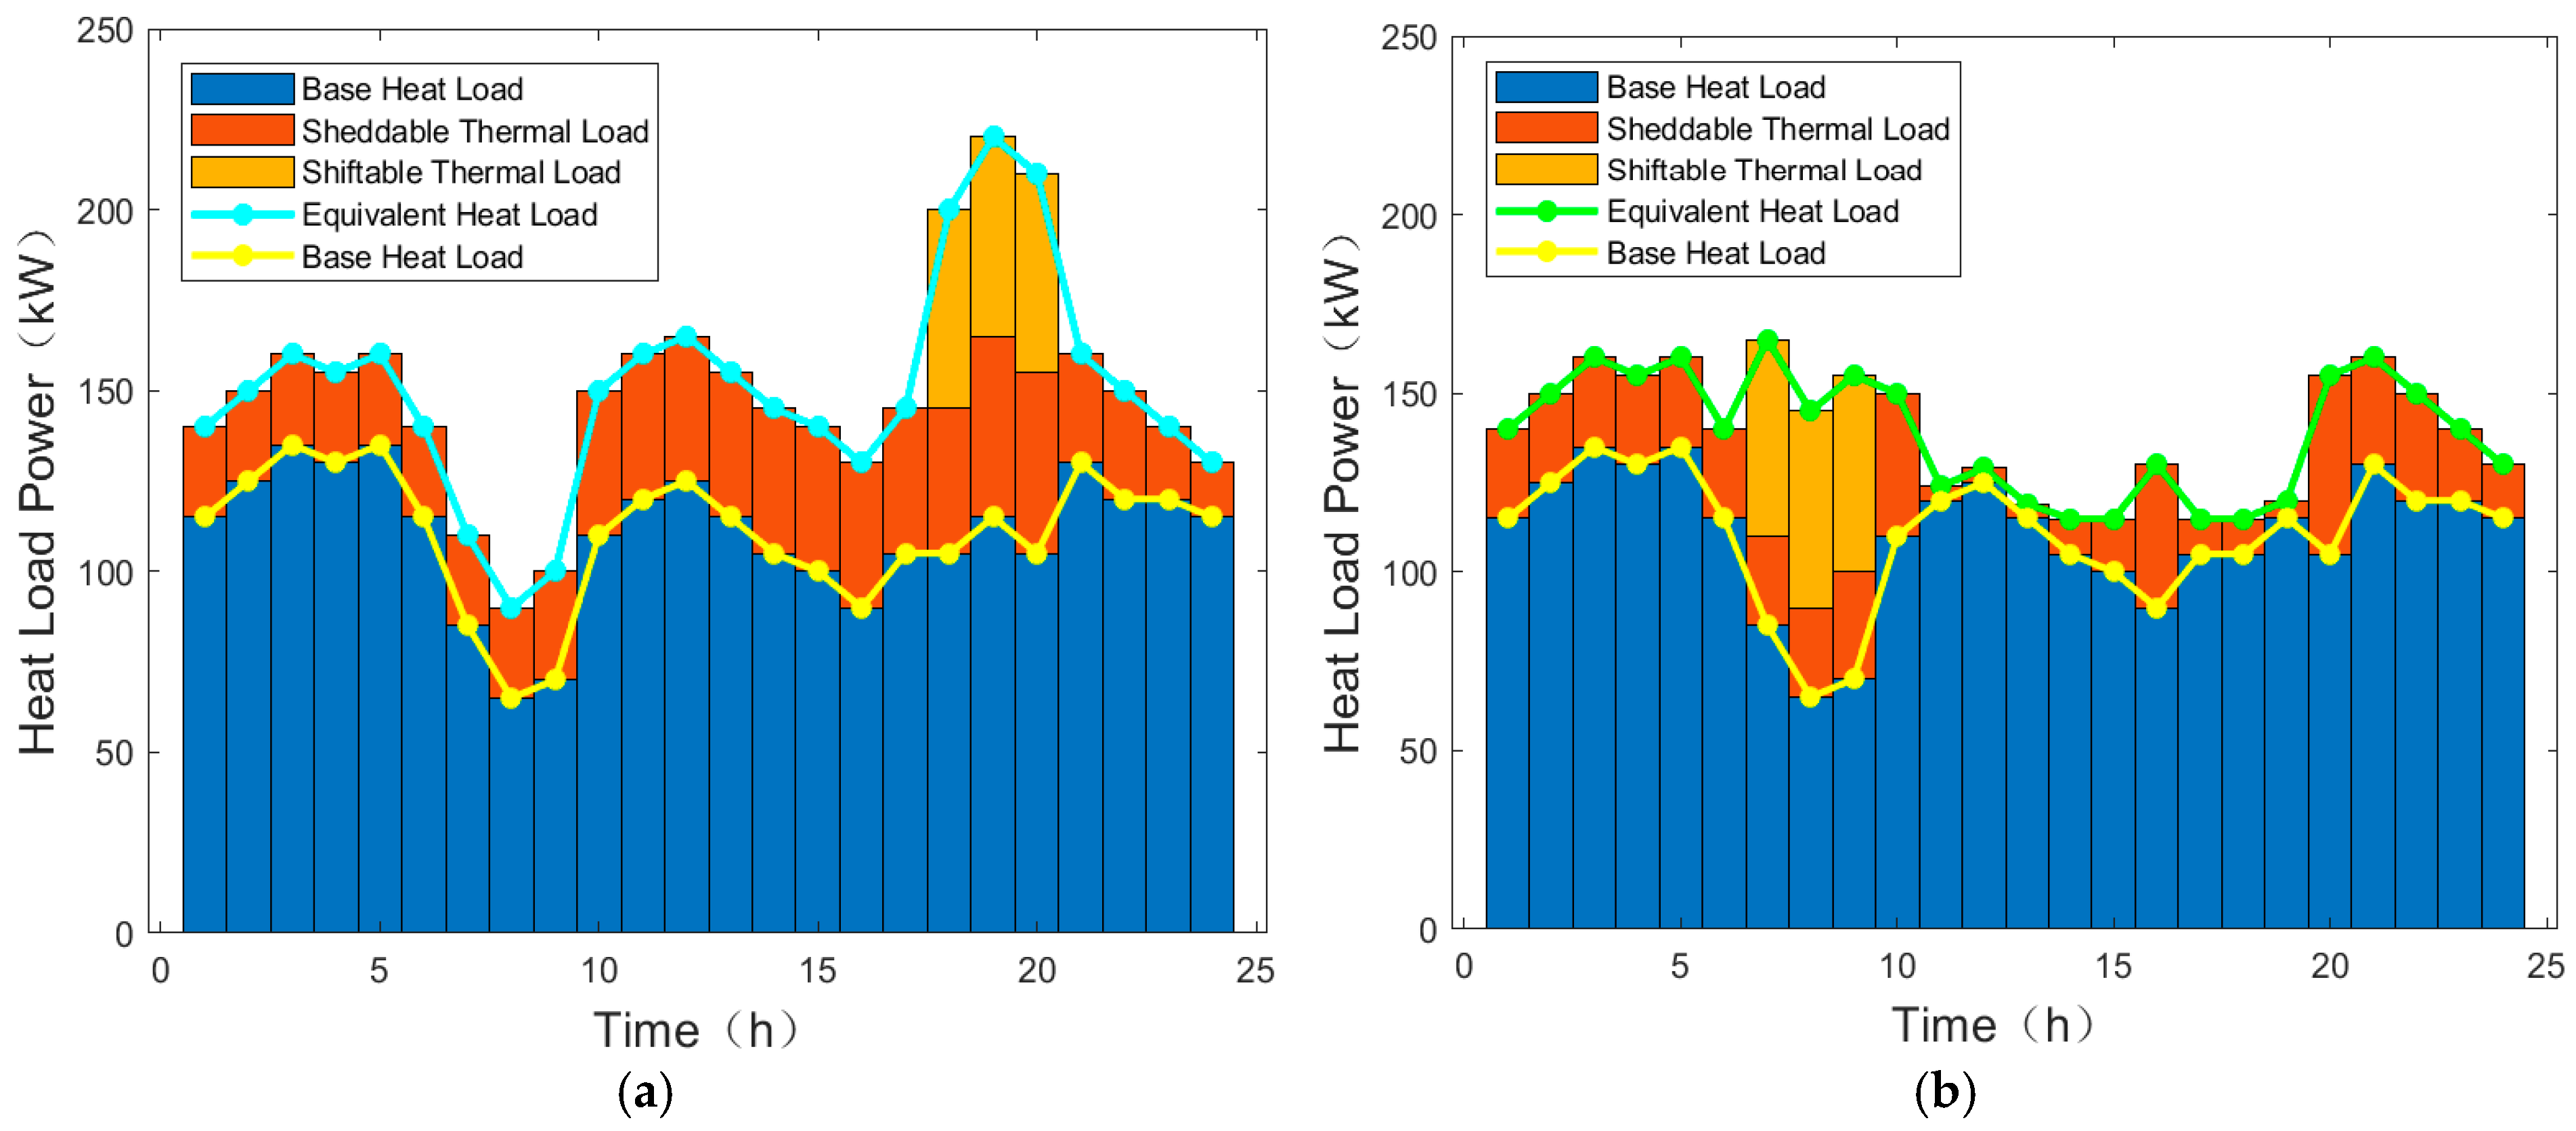
4.2.2. Effectiveness Analysis of Flexible Load Integration

A comparative analysis of Scenarios 1, 3, and 5 reveals the progressive impact of flexible load integration. Scenario 3 builds upon Scenario 1 by incorporating flexible electric load regulation, while Scenario 5 further extends this framework by adding flexible thermal load control. Although none of these scenarios implement carbon or green certificate trading mechanisms, the introduction of flexible electric load regulation in Scenario 3 reduces total system costs from CNY 3318.7 to CNY 3182.9 compared to Scenario 1. However, Scenario 3 exhibits higher carbon emissions (961.9 kg vs. 918.7 kg in Scenario 1), attributable to the exclusion of carbon emission costs in the optimization objective. This outcome demonstrates that flexible electric load regulation can effectively lower operational costs.
The advancement to Scenario 5 yields additional improvements, with total costs further decreasing from CNY 3182.9 to CNY 3141.4, confirming that flexible thermal load integration provides supplementary economic benefits. Notably, Scenario 5 also achieves carbon emission reductions (945.9 kg) compared to Scenario 3, illustrating how coordinated electric–thermal flexible load management can simultaneously enhance both economic and environmental performance, even without market-based emission control mechanisms.

4.2.3. Impact of Flexible Loads on Low-Carbon Economic Dispatch

The comparative analysis of Scenarios 2, 4, and 6 systematically demonstrates the synergistic effects of integrating tiered carbon trading with flexible load regulation. Scenario 2 establishes the baseline with tiered carbon trading alone, while Scenario 4 builds upon this by incorporating flexible electric load control, resulting in significant improvements—total costs decrease from CNY 3179.9 to CNY 3007.1 and carbon emissions are dramatically reduced from 464.4 kg to 217.7 kg, demonstrating the enhanced emission reduction capability when market mechanisms are combined with demand-side flexibility. The progression to Scenario 6, which further introduces flexible thermal load regulation, yields additional optimization benefits through further reductions in both electricity procurement costs and total system expenditures, conclusively proving that comprehensive coordination of electric and thermal flexible loads under carbon pricing mechanisms creates a mutually reinforcing optimization effect that simultaneously achieves superior economic performance and deeper carbon emission reductions in integrated energy system dispatch.

4.2.4. Effectiveness Analysis of Green Certificate Trading Mechanism

Comparing Scenario 6 and Scenario 7 shows that the total cost was further reduced from CNY 2967.5 to CNY 2874.3. However, Scenario 7 exhibits significantly higher carbon emissions. This occurs because Scenario 7 does not link green certificate trading with carbon trading, and renewable energy output still carries carbon emission coefficients. Consequently, while increasing renewable energy utilization and reducing total costs, the carbon emissions are not reduced but instead increase. This results from the inability to use green certificates to offset carbon allowances, allowing enterprises to lower total costs by selling certificates without substantially reducing their actual carbon emissions.

4.2.5. Effectiveness Analysis of Green Certificate–Tiered Carbon Trading Interaction

Comparing Scenario 7 and Scenario 8 demonstrates the significant superiority of the green certificate-carbon trading interaction mechanism over the isolated operation mode (Scenario 7). Key improvements include: carbon emissions substantially decreasing from 331.8 kg to 173.2 kg (a reduction of 158.6 kg, 47.8% decrease); total costs optimizing from CNY 2874.3 to CNY 2719.3 (saving CNY 155.0, 5.4% reduction); carbon trading costs markedly dropping from CNY 61.2 to CNY 28.0 (saving CNY 33.2, 54.2% decrease); while renewable energy output reaches its maximum among all scenarios. The experiment proves that the interaction mechanism between green certificates and carbon trading, through market coordination and responsibility binding, achieves deep emission reductions while maintaining economic efficiency, verifying that mechanism synergy represents a core pathway for the low-carbon transition.

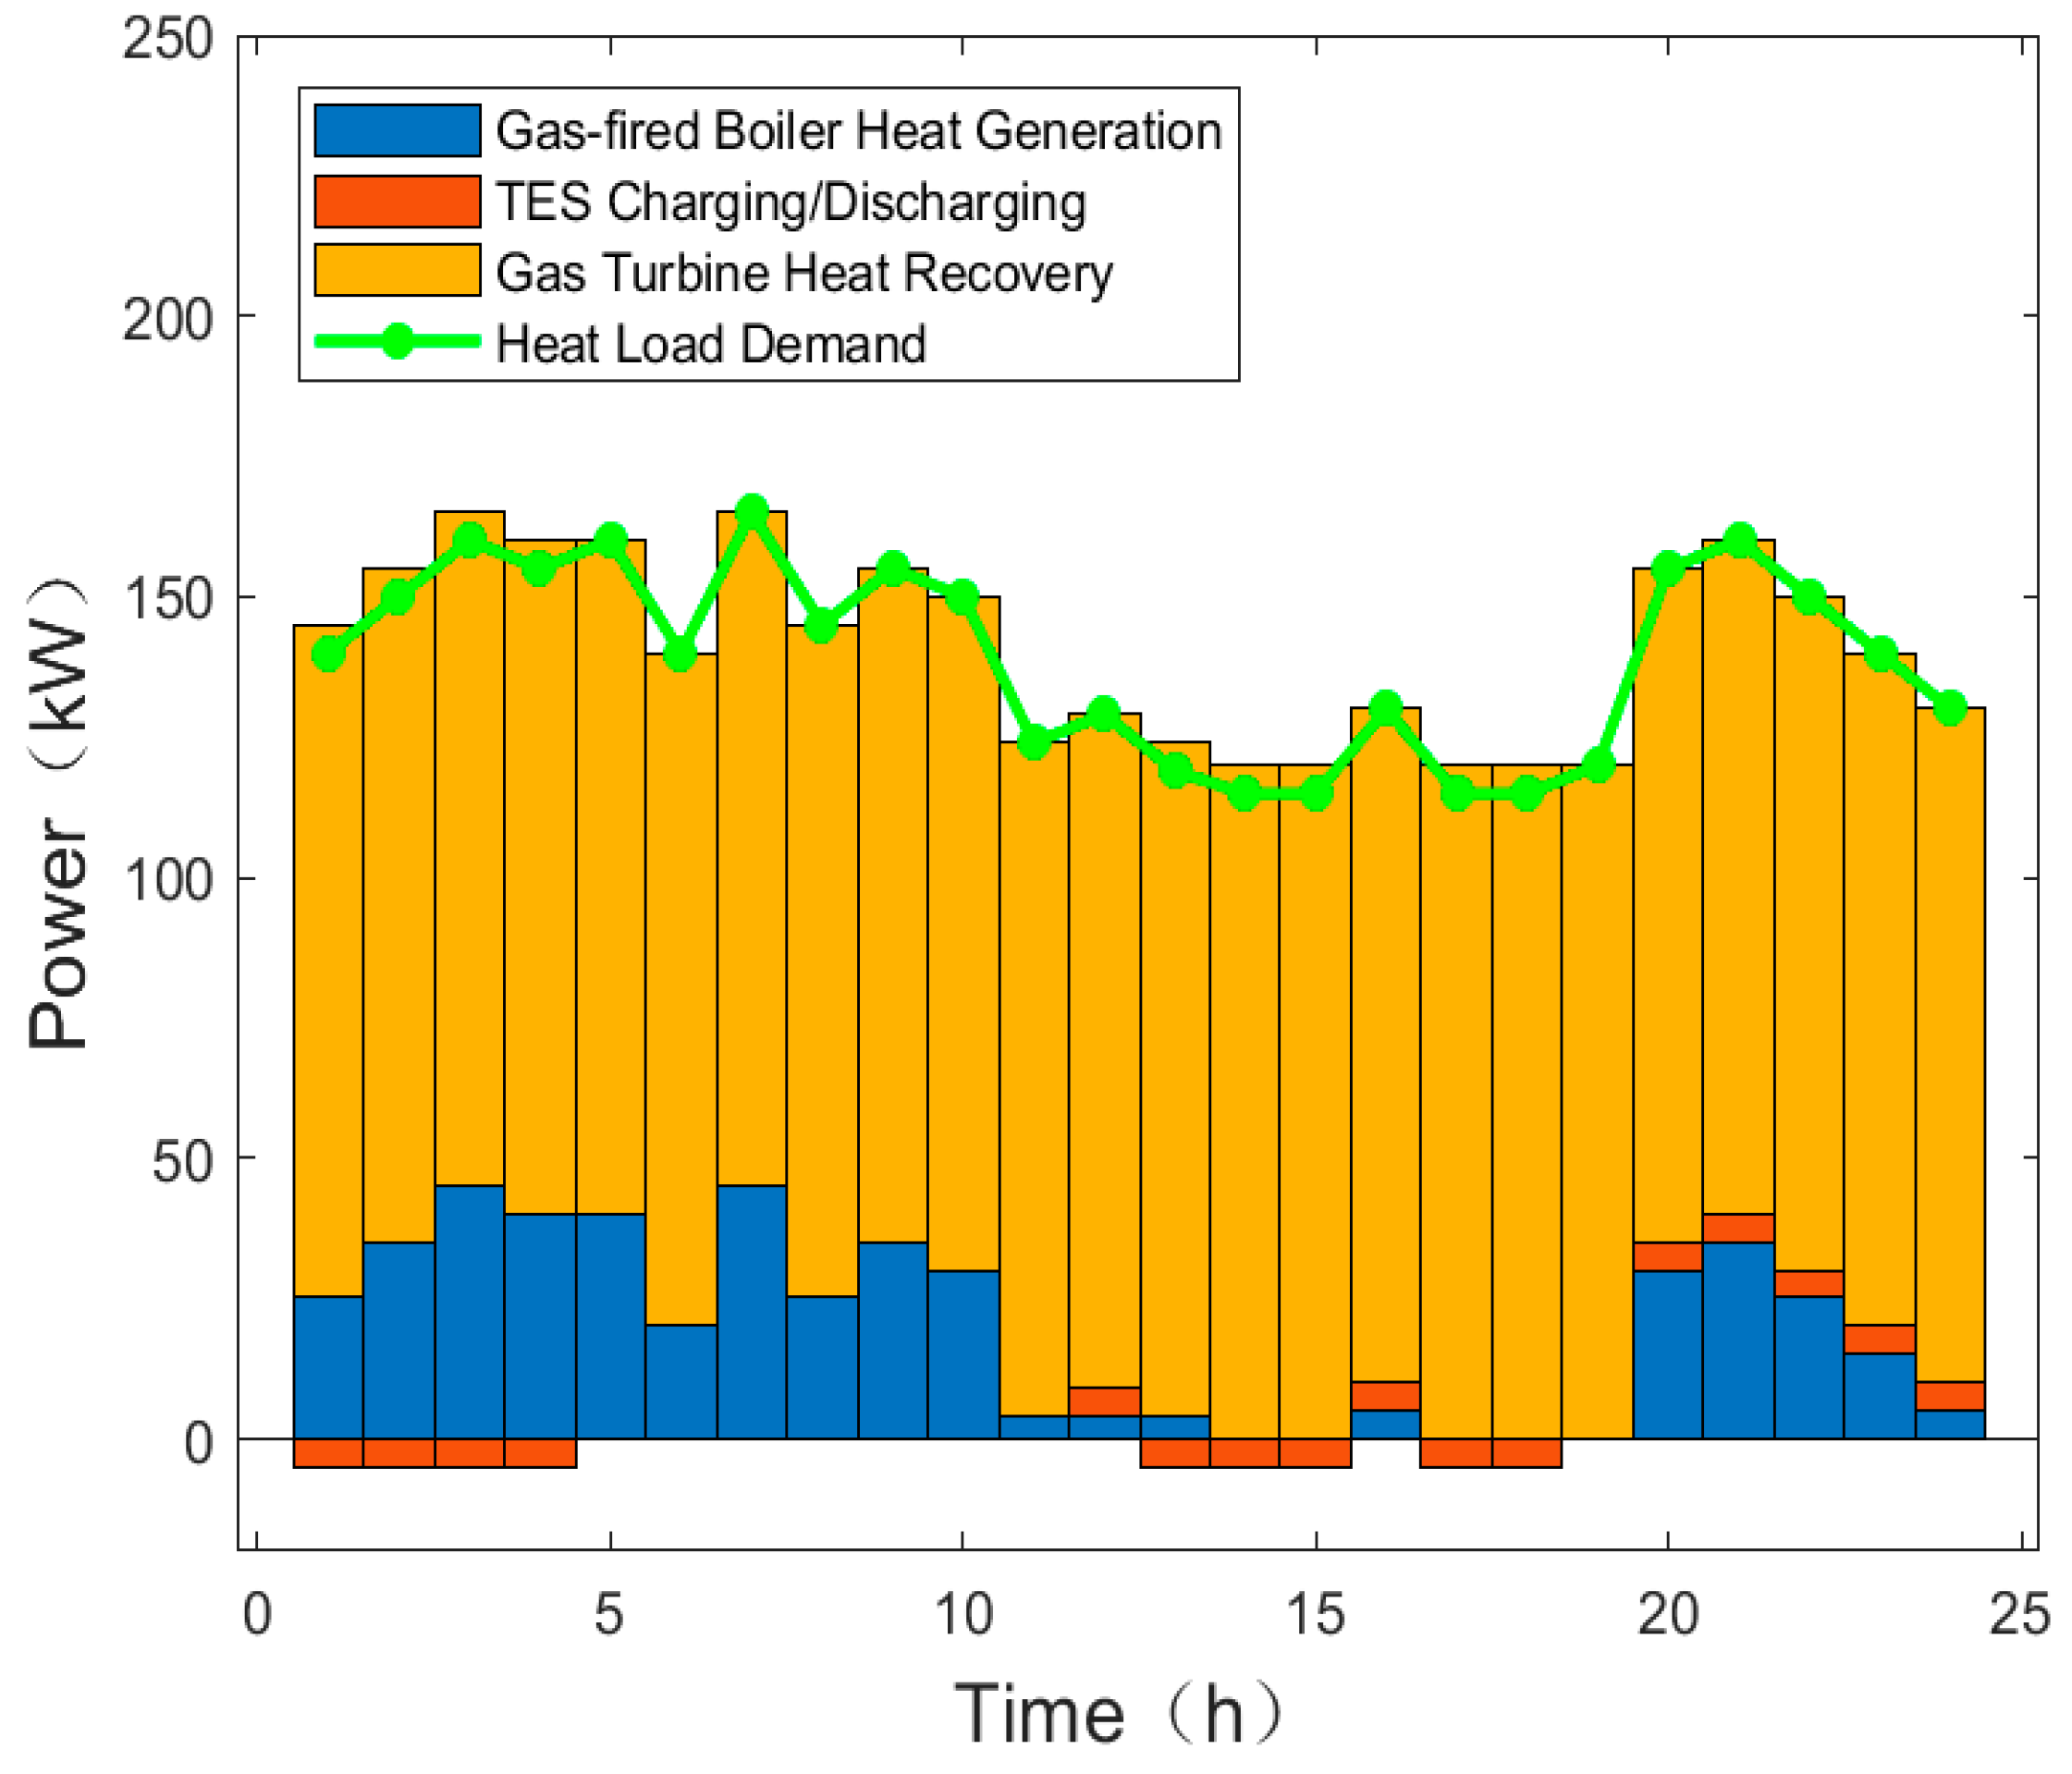
4.3. Optimal Operation Analysis

According to Section 4.2, under Scenario 8, the system’s carbon emissions, renewable energy accommodation, and total operating costs are superior to those of other scenarios. To further validate the impact of the GCT–CET joint mechanism on system operation, a comparative analysis is conducted between Scenario 7 and Scenario 8, with their electric and thermal power balance diagrams shown below.
As shown in Figure 6a, the electricity demand on the user side primarily consists of base load and adjustable loads (including shiftable, transferable, and curtailable loads). Without optimization, the system experiences significant load pressure during peak electricity hours (10:00–14:00 and 20:00–22:00). Figure 6b demonstrates that after optimization, portions of shiftable and transferable loads are rescheduled from peak to off-peak periods (4:00–9:00), achieving notable peak shaving and valley filling. Concurrently, curtailable loads during peak hours are reduced, effectively alleviating peak demand pressure and lowering carbon emission costs. The optimized load profile shows significantly smoother characteristics, proving the effectiveness of flexible electric load optimization in enhancing system operational efficiency and low-carbon performance.
From Figure 7a, it is evident that before optimization, the system faces substantial thermal load pressure during peak heating hours (18:00–21:00). Figure 7b shows the optimized distribution, where adjusting the temporal allocation of flexible thermal loads shifts portions of peak demand to low-load periods (7:00–9:00), significantly reducing peak heating requirements and improving low-carbon dispatch effectiveness. Additionally, curtailable thermal loads during peak hours are diminished, further relieving system pressure and reducing carbon emissions. The optimized thermal load distribution achieves better uniformity, demonstrating that flexible thermal load optimization not only enhances the operational stability of the integrated energy system but also improves its adaptability to the green certificate–carbon trading mechanism.
The comparison between pre-optimization and post-optimization flexible load distributions demonstrates that under the guidance of the green certificate–carbon trading interaction mechanism, the system successfully achieves peak shaving and valley filling of energy demand by optimizing the temporal distribution of both electric and thermal flexible loads. This reduces carbon emissions during peak periods while enhancing the system’s overall economic efficiency and low-carbon performance.
From Figure 8, the power dispatch strategy prioritizes minimizing electricity purchases from the grid, resulting in gas turbines operating at nearly full capacity. Consequently, the system primarily utilizes waste heat from gas turbines to meet thermal demand. Supplemental heat sources—thermal storage tanks and gas boilers—ensure thermal load balance. During low-demand periods (0:00–4:00, 13:00–18:00), the thermal storage tanks store excess heat from the recovery system. During high-demand periods, the stored heat is discharged to participate in the heating supply, achieving thermal load “peak shaving and valley filling” and optimizing thermal energy supply–demand balance.
Figure 9 illustrates the electric load balancing scenario. During periods of abundant wind and solar power generation, the system stores surplus electricity through energy storage devices while supplementing power deficits through grid purchases. The gas turbines operate in a heat-determined power mode, meeting electricity demand while utilizing excess power for battery charging. From 8:00 to 18:00, when distributed energy supply is sufficient and electricity prices are higher, the system prioritizes the use of wind and solar resources and sells excess renewable power to the grid. During the 00:00~07:00 off-peak period with lower electricity demand, the electricity price is CNY 0.22/kWh. Although there is no photovoltaic output during this time and the operating cost of wind turbines (CNY 0.30/kWh) exceeds the purchase price, the system continues to operate wind turbines due to their significantly lower carbon emission coefficients compared to grid power, coupled with the carbon offset benefits of the green certificate–tiered carbon trading interaction mechanism. The surplus wind power is either sold to the grid or stored in energy storage devices. The battery charge/discharge strategy is optimized based on electricity price fluctuations and renewable energy availability, charging during low-price periods or when renewable energy is abundant, and discharging during peak-price periods to achieve efficient energy utilization.

5. Discussion and Conclusions

This study establishes a diversified load model for integrated energy systems (IES) based on fundamental operational concepts. It introduces and incorporates models for tiered carbon trading, green certificate trading, and their interactive mechanisms. To fully exploit the regulation potential of flexible electric and thermal loads on the user side, improve system operational efficiency and economic performance, and reduce overall carbon emissions, the study proposes a low-carbon economic dispatch model for IES that integrates user-side flexible loads. The mathematical models and compensation mechanisms for various flexible loads are analyzed, the objective function for IES optimal operation is determined, and operational models with constraints for system equipment are established. Compared to existing models, this study incorporates the integration of green certificates and tiered carbon trading mechanisms into the modeling framework, while introducing user satisfaction as a constraint criterion to enhance the flexible dispatch capability of thermal–electrical loads in integrated energy systems.
Multi-scenario analysis demonstrates that curtailable loads effectively reduce peak demand, while shiftable and transferable loads play active roles in peak shaving and valley filling. The introduction of carbon trading and green certificate trading helps lower the overall operational costs of IES, reduce carbon emissions, and enhance renewable energy accommodation. Experimental results show that compared to isolated operation models of carbon trading and green certificates, the interactive mechanism of green certificate–tiered carbon trading achieves a 47.8% reduction in carbon emissions, 54.2% decrease in carbon trading costs, and 5.4% reduction in total costs, proving its significant positive impact on suppressing system carbon emissions and improving comprehensive benefits when incorporated into IES optimization dispatch.
These research findings provide energy companies with solutions to reduce compliance costs and increase clean energy revenue, offer technical support for industrial parks to achieve carbon reduction targets and optimize energy costs, and provide quantitative references for policymakers to design carbon quota allocation and green certificate pricing mechanisms. Potential application entities include electricity market operators, industrial park integrated energy service providers, renewable energy power generation enterprises, and government energy regulatory agencies.
At the same time, the study has certain limitations. The model in this paper is based on a specific scale of regional energy system design, so its adaptability in a large-scale cross-regional power grid has not been verified. At the same time, the model relies on all-day forecast data and has not yet integrated a real-time rolling scheduling mechanism. In the future, the model can introduce robust optimization to deal with the uncertainty of wind and solar output and load, so as to improve the ability of the model to deal with uncertainty, and expand the multi-regional energy internet to study the cross-regional green certificate carbon trading coordination mechanism.

Author Contributions

Conceptualization, Y.L., Y.S., C.H., Z.D. and J.C.; data curation, Y.Y.; formal analysis, K.Z.; investigation, Y.W.; methodology, Y.L.; project administration, Y.S.; resources, Y.L.; software, Y.L. and K.Z.; supervision, Y.L.; validation, Y.W., Y.Y., Y.S. and Z.D.; writing—original draft, Y.L., K.Z. and Y.W.; writing—review and editing, Y.L., J.C., K.Z. and Y.W. All authors have read and agreed to the published version of the manuscript.

Funding

This research was funded by the Science and Technology Project of Xi’an City, grant number 2024JH-GXFW-0180.

Data Availability Statement

Data are available on request from the authors.

Conflicts of Interest

Author Yue Sun and Cong Hou was employed by the company State Grid Jibei Electric Power Co., Ltd. The remaining authors declare that the research was conducted in the absence of any commercial or financial relationships that could be construed as a potential conflict of interest.

References

  1. Zhang, S.B.; He, F.; Li, B.F. Research on the Optimal Scheduling of Multi-Microgrid Double-Layer Game Considering Fair Carbon Trading Strategy in the Green Certificate Trading Market. IEEE Access 2024, 12, 161620–161636. [Google Scholar] [CrossRef]
  2. Li, Y.F.; Wang, W.Q.; Kou, Y.; Zhu, S.L. Considering Green Certificate-Carbon Joint Trading and Demand Response Itegrated Energy System Economic Operation. Acta Energiae Solaris Sin. 2023, 44, 538–546. [Google Scholar]
  3. Yang, D.F.; Liu, H.W.; Sun, Y.; Li, B.J.; Liu, C.; Liu, X.J. Multi-agent Joint Peak Regulation Optimal Scheduling Considering Green Certificate Trading Mechanism and Deep Peak Regulation Green Certificate Trading Mechanism and Deep Peak Regulation. Power Syst. Technol. 2024, 48, 100–112. [Google Scholar]
  4. Qin, T.; Liu, H.D.; Wang, J.Q.; Feng, Z.Q.; Fang, W. Carbon Trading Based Low-carbon Economic Dispatch for Integrated Electricity-Heat-Gas Energy System. Autom. Electr. Power Syst. 2018, 42, 8–13. [Google Scholar]
  5. Xue, K.Y.; Chu, Y.; Ling, Z.; Li, Z.L. Low–carbon economic optimal dispatch of integrated energy system considering flexible load. Renew. Energy Resour. 2018, 42, 8–13. [Google Scholar]
  6. Wei, Z.N.; Zhang, S.D.; Sun, G.Q.; Xu, X.H.; Chen, S.; Chen, S. Carbon Trading Based Low-carbon Economic Operation for Integrated Electricity and Natural Gas Energy System. Autom. Electr. Power Syst. 2016, 40, 9–16. [Google Scholar]
  7. Chen, J.; Gui, W.; Huang, Y. The impact of the establishment of carbon emission trade exchange on carbon emission efficiency. Environ. Sci. Pollut. Res. 2023, 30, 19845–19859. [Google Scholar] [CrossRef]
  8. Liu, X.J.; Nie, F.J.; Yang, D.F.; Wang, Y.; Xu, Y. Low Carbon Economic Dispatch of Integrated Energy Systems Considering Green Certificates-carbon Trading Mechanism Under CCPP-P2G Joint Operation Model. Power Syst. Technol. 2023, 47, 2207–2222. [Google Scholar]
  9. Liu, K.Z.; Dai, Y.H.; Zhao, Q.L.; Wu, Z.S.; Dong, M. New Energy Interprovincial Trading Model Considering Carbon-green Certificate Trading Mechanism. Proc. CSU-EPSA 2023, 35, 9–19. [Google Scholar]
  10. Luo, Z.; Qin, J.H.; Liang, J.Y.; Shen, F.; Liu, H.Z.; Zhao, M.; Wang, J.H. Day-ahead optimal scheduling of integrated energy system with carbon-green certificate coordinated trading mechanism. Electr. Power Autom. Equip. 2021, 41, 248–255. [Google Scholar]
  11. Yuan, G.L.; Liu, P.D.; Tang, F.B.; Tian, W.L. Source-load coordination optimal scheduling considering green power certificate and carbon trading mechanisms. Acta Energiae Solaris Sin. 2022, 43, 190–195. [Google Scholar]
  12. Li, J.F.; Zou, N.; Li, W.D.; Wu, J.; Zhang, M.K. Analysis of local green power certificate, carbon emission and electricity joint trading considering demand flexibility. Power Syst. Technol. 2023, 47, 3164–3173. [Google Scholar] [CrossRef]
  13. Liang, N.; Miao, M.; Xu, H.H.; Zheng, F.; Fang, Q. Bi-Level Optimal Scheduling of Integrated Energy System Considering Green Certificates-Caebon Emission Trading Mechanism. Acta Energiae Solaris Sin. 2024, 45, 312–322. [Google Scholar]
  14. Cui, Y.; Zeng, P.; Zhong, W.Z.; Cui, W.L.; Zhao, Y.T. Low-carbon economic dispatch of electricity-gas-heat integrated energy system based on ladder-type carbon trading. Electr. Power Autom. Equip. 2021, 41, 10–17. [Google Scholar]
  15. Li, J.H.; Zhu, M.S.; Lu, Y.J.; Huang, Y.J.; Wu, T. Review on Optimal Scheduling of Integrated Energy Systems. Power Syst. Technol. 2021, 45, 2256–2269. [Google Scholar]
  16. Bai, X.Y.; Fan, Y.F.; Liu, Y.J.; Song, Y.L. Wind power storage virtual power plant considering reliability and flexibility tiered capacity configuration. Power Syst. Prot. Control 2022, 50, 11–24. [Google Scholar]
  17. Huang, W.D.; Li, Y.; Li, J.Y.; Liu, Y.; Wu, F.; Wang, Z.Z. Multi-time scale joint optimal scheduling for wind-photovoltaic-electrochemical energy storage-pumped storage considering renewable energy uncertainty. Electr. Power Autom. Equip. 2023, 43, 91–98. [Google Scholar]
  18. Liu, Z.G.; Xiao, Z.F.; Wu, Y.F.; Hou, H.; Xu, T.; Zhang, Q.Y. Integrated optimal dispatching strategy considering power generation and consumption interaction. IEEE Access 2020, 9, 1338–1349. [Google Scholar] [CrossRef]
  19. Fan, H.; Lu, J.Y.; Lu, X.X. Coordinated planning of multi-region integrated energy system considering incentive demand response. Electr. Meas. Instrum. 2023, 60, 117–124+187. [Google Scholar]
  20. Liu, R.H.; Li, Y.; Yang, X.; Li, Y.F.; Sun, G.P.; Shi, S.S. Two-Stage Optimal Scheduling of Community Integrated Energy System Considering Demand Response. Acta Energiae Solaris Sin. 2021, 42, 46–54. [Google Scholar]
  21. Yang, D.F.; Xu, Y.; Jiang, C. Multiple Time-Scale Coordinated Scheduling of Combined Electro-Thermal System Considering Multi-Type Demand Response. Acta Energiae Solaris Sin. 2021, 42, 282–289. [Google Scholar]
  22. Zhu, X.X.; Liu, Z.T.; Xue, J.F.; Hu, M.; Han, Z.H.; Wu, D. Optimal Scheduling of Integrated Energy System with Flexible Load Participation. Acta Energiae Solaris Sin. 2023, 44, 29–38. [Google Scholar]
  23. Song, X.T.; Shi, Q.Q.; Ju, Y.T.; Ge, H.C.; Zhang, J.H.; Lu, Y.W.; Yu, K.Y. Review on Low-carbon Planning and Operation of Integrated Energy System. High Volt. Eng. 2024, 50, 1053–1066. [Google Scholar]
  24. Xu, L.; Xu, Y.T.; Yuan, X.F.; Xiong, W.; Lu, Z.Y. Low-Carbon Dispatching of Hydrogen-Based Integrated Energy Systems Considering Dynamic Carbon Emissions. Power Syst. Clean Energy 2025, 41, 120–129. [Google Scholar]
  25. Mo, J.S.; Yan, G.X.; Song, N.; Yuan, M.Y. Review of Demand Response-based Optimal Scheduling of Electric and Thermal Integrated Energy Systems. Adv. Eng. Sci. 2025, 57, 296–307. [Google Scholar]
  26. Li, R.H.; Li, Z.L.; Yang, X.; Sun, G.P.; Li, L.H. Optlmal Dispatch of Community Integrated Energysystem Conidering User-Side Flexible Load. Acta Eenrgiae Solaris Sin. 2019, 40, 2842–2850. [Google Scholar]
  27. Chen, Q.B.; Yang, G.H.; Geng, L.Q.; Su, J. Low-Carbon Operation Scheduling of Integrated Energy System Considering Source-Load Uncertainty and Flexible Loads. Acta Energiae Solaris Sin. 2025, 46, 183–192. [Google Scholar]
  28. Zhao, W.Z.; Chen, Z.Q. Optimization of energy storage system capacity allocation considering flexible load. Sci. Technol. Eng. 2024, 24, 12977–12984. [Google Scholar]
  29. Chen, Z.; Hu, Z.J.; Weng, C.H.; Li, T.G. Multi-stage planning of park-level integrated energy system based on ladder-type carbon trading mechanism. Electr. Power Autom. Equip. 2021, 41, 148–155. [Google Scholar]
  30. Zhao, Z.Y.; Li, X.X. Low-Carbon Economic Dispatch Based on Ladder Carbon Trading Virtual Power Plant Considering Carbon Capture Power Plant and Power-to-Gas. Power Gener. Technol. 2023, 44, 769–780. [Google Scholar]
  31. Shang, N.; Chen, Z.; Lu, Z.L.; Leng, Y. Interaction Principle and Cohesive Mechanism Between Electricity Market, Carbon Market and Green Power Certificate Market. Power Syst. Technol. 2023, 47, 142–154. [Google Scholar]
  32. Lu, X.Y.; Zhang, R.D.; Sun, J.H. Exploring the Strategies and Effects of Green Certificates in Promoting New Energy Development. Adv. Econ. Manag. Political Sci. 2024, 93, 75–79. [Google Scholar] [CrossRef]
  33. Kilinc-Ata, N.; Rahman, M.P. Digitalization and financial development contribution to the green energy transition in Malaysia: Findings from the BARDL approach. Nat. Resour. Forum 2024, 1–19. Available online: https://onlinelibrary.wiley.com/doi/10.1111/1477-8947.12509 (accessed on 1 June 2025). [CrossRef]
  34. Liu, Y.X.; Zhang, K.X.; Chen, S.S.; Zhou, Y.; Chen, J.W. GRO-Bagging Day-Ahead Power Curve Forecasting Model Based on Multi-Cycle Feature Extraction. IEEE Access 2024, 12, 98584–98598. [Google Scholar] [CrossRef]
  35. Yao, J.M.; Zhao, S.Q.; Wei, Z.Y.; Zhang, H. Day-ahead dispatch and its fast solution method of power system based on scenario analysis. Electr. Power Autom. Equip. 2022, 42, 102–110. [Google Scholar]
  36. Wang, Z.S.; Shi, Y.; Tang, Y.M.; Men, X.Y.; Cao, J.; Wang, H.F. Low Carbon Economy Operation and Energy Efficiency Analysis of Integrated Energy Systems Considering LCA Energy Chain and Carbon Trading Mechanism. Proc. CSEE 2019, 39, 1614–1626. [Google Scholar]
Figure 1. Technology roadmap.
Energies 18 03667 g001
Figure 2. Flexible load regulation operation framework of integrated energy system considering green certificate-ladder carbon trading interaction.
Energies 18 03667 g002
Figure 3. Carbon price ladder.
Energies 18 03667 g003
Figure 4. GCT–CET interactive process.
Energies 18 03667 g004
Figure 5. Wind power generation and heating load power curve.
Energies 18 03667 g005
Figure 6. Optimized before and after user-side flexible electrical load distribution. (a) Pre-optimization distribution of flexible electric loads at the consumer side; (b) post-optimization distribution of flexible electric loads at the consumer side.
Energies 18 03667 g006
Figure 7. Before and after optimization of user-side flexible heat load distribution. (a) Pre-optimization distribution of flexible thermal loads at the consumer side; (b) post-optimization distribution of flexible thermal loads at the consumer side.
Energies 18 03667 g007
Figure 8. Heat load balancing.
Energies 18 03667 g008
Figure 9. Electric load balancing.
Energies 18 03667 g009
Table 1. Equipment parameters.
TypeMin Power (kW)Max Power (kW)Operating Cost (CNY/kWh)
Main Grid0160Forecast value
Wind Turbine0Forecast value0.3
Photovoltaic (PV)0Forecast value0.55
Gas Turbine (Power)065Forecast value
Gas Turbine (Heat)0160Forecast value
Gas Boiler0100Forecast value
Table 2. Transferable load parameters.
Load Type T m i n t r a n (h) P m i n t r a n P m a x t r a n t s h t s h + F c o s t t r a n (CNY/kWh)
Transferable Power Load515~30 kW04:00~22:000.3
Table 3. Shiftable load parameters.
Load Type t s t D t s t s + F c o s t s h i f t (CNY/kWh)
Shiftable Electric Load 110:00405:00~21:000.2
Shiftable Electric Load 219:00307:00~23:000.2
Shiftable Thermal Load18:00305:00~21:000.1
Table 4. Curtailable load parameters.
Load Type T m i n c u t (h) T m a x c u t (h) N m a x (Max Times) F c o s t t r a n (CNY/kWh)
Curtailable Electric Load2580.4
Curtailable Thermal Load2580.2
Table 5. Time-based electricity pricing.
PeriodTime SlotPrice (CNY/kWh)
Off-Peak0:00~7:000.22
Mid-Peak7:00~10:00
15:00~18:00
21:00~24:00
0.42
Peak10:00~15:00
18:00~21:00
0.65
Table 6. Carbon emission factors and allowance factors.
Energy Type C i p r e ( g / k W h ) C i r u n ( g / k W h )Total Emission Factor ( g / k W h )Carbon Allowance
( g / k W h )
Coal Power (Grid)1303.001303.0798.0
Natural Gas116.4448.3564.7424.0
Wind Power43.0043.078.0
Solar PV54.50154.578.0
Energy Storage91.3091.30
Table 7. Green certificate trading related parameter settings.
Parameterλ (CNY)ρδ (Certificates/MWh)κ (t/Certificate)
Set Value100.000.521.000.05
Table 8. Scene setting information.
Scenario IDCarbon
Trading
Green Certificate TradingGreen Certificate–Carbon Trading InteractionFlexible Electric LoadFlexible Thermal Load
Scenario 1×××××
Scenario 2××××
Scenario 3××××
Scenario 4×××
Scenario 5×××
Scenario 6××
Scenario 7×
Scenario 8
Table 9. Scheduling results of each scenario.
Scenario IDCarbon EmissionsCarbon Trading Cost (CNY)Electricity Purchase Cost (CNY)Renewable Energy
Output (kWh)
Wind/PV O and M Cost (CNY)Compensation Cost (CNY)Total Cost (CNY)
Scenario 1918.7275.6720.42895.0999.80.03318.7
Scenario 2464.494.9422.13690.71298.00.03179.9
Scenario 3961.9288.6554.82895.0999.8205.43182.9
Scenario 4217.736.3160.23655.01250.3201.83007.1
Scenario 5945.9283.8542.72895.0999.8247.63141.4
Scenario 6201.733.3148.13655.01250.3244.02967.5
Scenario 7331.861.2161.63845.01353.5244.02874.3
Scenario 8173.228.0161.63925.01377.5244.02719.3
Disclaimer/Publisher’s Note: The statements, opinions and data contained in all publications are solely those of the individual author(s) and contributor(s) and not of MDPI and/or the editor(s). MDPI and/or the editor(s) disclaim responsibility for any injury to people or property resulting from any ideas, methods, instructions or products referred to in the content.

