Abstract
The growing integration of renewable energy sources (RESs) into modern power systems calls for enhanced flexibility and control mechanisms. Conventional demand response (DR) strategies, such as price-based and incentive-driven methods, often encounter challenges that limit their effectiveness. This paper proposes a novel DR approach grounded in Customer Directrix Load (CDL) and formulated through Stackelberg game theory. A bilevel optimization framework is established, with air conditioning (AC) systems and electric vehicles (EVs) serving as the main DR participants. The problem is addressed using a genetic algorithm. Simulation studies on a modified IEEE 33-bus distribution system reveal that the proposed strategy significantly improves RES accommodation, reduces power curtailment, and yields mutual benefits for both system operators and end users. The findings highlight the potential of the CDL-based DR mechanism in enhancing operational efficiency and encouraging proactive consumer involvement.
1. Introduction
The construction of a new power system with a progressively increasing share of renewable energy sources (RESs) is a critical step toward achieving the “dual carbon” goals. As the proportion of RESs in the grid increases, higher demands are placed on the flexibility and adaptability of the power system [1]. This trend necessitates a transition from the traditional “generation-follows-load” model to an interactive paradigm where generation and load influence each other. In this context, the utilization of demand-side flexible resources plays a pivotal role in enhancing system flexibility and facilitating RES integration. Recent advances in measurement, communication, and intelligent control technologies have enabled the flexible operation of various loads, such as electric vehicles (EVs) and air conditioning (AC) systems [2]. By incorporating such flexible loads through demand response (DR) mechanisms, power system flexibility can be substantially improved, thereby supporting the safe and stable operation of the grid while promoting higher levels of RES consumption [3,4].
Currently, existing demand response (DR) mechanisms can be categorized into price-based DR (PDR) and incentive-based DR (IDR) [5,6,7]. PDR utilizes electricity price signals to encourage consumers to modify their consumption patterns, typically through time-of-use or real-time pricing models. In contrast, IDR incentivizes consumers to adjust their loads by offering rewards based on contractual agreements, often using customer baseline load (CBL) as a benchmark for evaluating DR contributions [8]. Ref. [9] proposes a two-stage Stackelberg game-based demand response model that uses smart meter data and occupancy patterns to optimize customized pricing strategies for both retailers and consumers; ref. [10] introduces a three-layer risk-averse game-theoretic coordination framework that integrates smart buildings and EV fleets into microgrid scheduling through dynamic tariff-based demand response; ref. [11] presents a bi-level Stackelberg–Nash game model enhanced by a novel multi-agent reinforcement learning algorithm to improve distributed energy resource integration while protecting consumer interests; ref. [12] develops an exergy-driven scheduling model for virtual energy stations using cooperative and Stackelberg games to coordinate integrated energy systems in demand response programs; ref. [13] constructs a hierarchical game-theoretic market participation framework involving multi-leader multi-follower games to balance interests among diverse energy participants and enhance demand response efficiency; ref. [14] models demand response as an aggregative game under user equilibrium to analyze grid load profiles, demonstrating advantages in scalability and computational efficiency over traditional Nash equilibrium approaches; ref. [15] proposes a two-layer game model combining cooperative and Stackelberg games to optimize virtual power plant operations in the day-ahead market while minimizing emissions and maximizing stakeholder profits; and ref. [16] employs hybrid game theory combining Stackelberg and bargaining games to design multi-layer energy management strategies in urban integrated energy systems, significantly enhancing renewable energy utilization and pricing efficiency.
However, both PDR and IDR have inherent limitations that constrain their scalability and often result in low user engagement. To enable the large-scale implementation of DR, the concept of Customer Directrix Load (CDL) and goal-oriented CDL-based DR mechanisms has been proposed in the literature [17,18]. The CDL-based DR framework has been investigated in various studies. For instance, ref. [19] explores scheduling strategies for heat pump water heaters as DR participants, achieving increased revenues while meeting user electricity demands. Additionally, ref. [20] examines the deployment of CDL-based DR across transmission and distribution networks, demonstrating its effectiveness in improving grid operational efficiency. Despite these advancements, limited attention has been paid to the interactive relationship between grid operators and DR loads, especially under game-theoretic formulations for optimal scheduling.
Building upon game theory, this paper investigates a CDL-based demand response strategy. First, a model for calculating CDL under AC power flow conditions is established and reformulated using the second-order cone relaxation method for tractability. Subsequently, a bi-level optimization model grounded in Stackelberg game theory is proposed to represent the CDL-based DR framework. Air conditioning (AC) systems and electric vehicles (EVs) are selected as representative DR resources. Objective functions and operational constraints are formulated for both the distribution system operator (DSO) and the load aggregator (LA), and the model is solved using a genetic algorithm. The resulting CDL-based DR scheduling strategy is then derived. Finally, a case study is conducted on a modified IEEE-33 node system to validate the proposed method. The results demonstrate that the CDL-based DR approach effectively reduces RES curtailment and, through the Stackelberg game formulation, achieves mutually beneficial outcomes for both system operators and consumers.
Among flexible loads, AC systems and EVs are chosen as representatives due to two reasons: (1) they together constitute over 50% of the residential peak load in many regions and have fast, controllable power-adjustment capabilities and (2) their dynamics (thermal inertia for AC, battery charging for EVs) cover both continuous and discrete DR behaviors, making them ideal for validating our Stackelberg bi-level framework.
2. Calculation Method for CDL
CDL-based DR is goal-oriented, so the calculation of CDL is treated as an optimization problem. Most of the existing CDL calculations are based on the DC power flow model, and the AC power flow is less widely considered. In this paper, relevant research is carried out on the distribution network. In the distribution network scenario, power loss and node voltage have a great impact on the system operation economy and the power quality of users, so AC power flow that is closer to the actual situation is adopted.
In order to promote the full utilization of RES power generation, this paper takes minimizing RES abandoned energy as the goal of implementing CDL-based DR, and the calculation formula is
where is the scheduling active power of RES of node i in time period t and indicates the maximum active power of RES of node i in time period t. In order to ensure the uniqueness of the model solution, regularization terms to minimize the active power loss are added to the objective function. The total objective function is
where is the regularization coefficient; is the square term of the current of the j line in the t period; is the resistance value of the j line; and indicates the number of lines in the system.
The calculation of CDL needs to satisfy many constraints. The first is the constraint of the power flow equilibrium. The DistFlow model is used to establish the power flow equation as
where and are the active and reactive power input from node j to node i during the period t, respectively, while and are the active and reactive power input from node i to node k during the period t, respectively. and are the active and reactive power of the conventional load of node i during the period t, respectively. and are the active and reactive power input from the upper power grid of node i in time t, respectively. is the CDL of node i. is the total power of the adjustable load of node i; and represent the node set where the power flows from the upstream node to the downstream node i and the node set where the power flow from the upstream node i to the downstream node respectively. and are the resistance and reactance values of line , respectively. is the voltage of node j.
For any branch in the system, there are
Here, is the voltage magnitude at node i, while in the SOC-relaxed model (Equations (8), (10) and (12)), we use for notational convenience.
The model also needs to meet the transmission power constraints of the upper power grid, RES output constraints, line capacity constraints, and voltage and current safety constraints, respectively, as shown in Equations (5)–(8).
where and are the maximum input active power and reactive power of the upper power grid of node i, respectively. and are the minimum input active and reactive power of node i; and are the active and reactive power upper limits of line , respectively. and are the lower active and reactive power limits of line respectively. is the square of node i’s voltage at time period t; and are the upper limit and lower limit of the voltage square of node i, respectively. is the maximum value of the line ’s current squared.
The non-convexity of the equations shown in Equations (3) and (4) makes it difficult to solve the model. The second-order cone relaxation method is used to modify the power flow equilibrium constraint. Firstly, the power flow equation is modified by the square term of node voltage:
Equation (11) can be transformed into standard second-order cone form by means of relaxation and further deformation:
3. CDL-Based Demand Response Strategy Based on Game Theory
Due to the small scale of individual power consumption, it is often insufficient to meet the participation threshold for demand response (DR); hence, loads typically engage in DR through aggregation into clusters. In this context, a load aggregator (LA) is designated as the cluster manager and shares economic benefits with the participating loads. When loads participate in CDL-based DR, the distribution system operator (DSO) must provide financial incentives based on the degree of response. The unit economic reward offered by the DSO to the LA is denoted as . A higher increases the LA’s motivation to adjust its power consumption schedule, thereby aligning the load curve more closely with the CDL to maximize rewards. Conversely, the LA’s power consumption planning also influences the DSO’s scheduling decisions. Thus, an optimal scheduling framework based on CDL-based DR forms a Stackelberg game relationship between the DSO and the LA. The Stackelberg game is a specific type of non-cooperative game. In a non-cooperative game, when a particular strategy set is reached such that no player can improve their payoff by unilaterally changing their strategy, the game is said to have reached an equilibrium.
3.1. DSO Layer Model
As the game leader, DSO, with the goal of maximum net profit, decides on the reward unit price given to LA, the output scheduling value of RESs, and the power value purchased from the superior power grid. The objective function is as follows:
where is the net profit, is the income from selling power, is the cost of purchasing power, is the DR cost, is the penalty cost of RES power abandonment, and is the penalty cost of network loss. is the electricity sale price during the period t; is the electricity purchase price during the period t. represents the t-period power values of the adjustable load of node i. is the penalty cost of RES power abandonment per unit power, is the penalty cost of network loss per unit power. is the similarity between node i’s load and CDL, and the calculation formula is as follows:
where is the similarity threshold. In order to avoid a siutation where rewards can be obtained without any adjustment, it is stipulated that rewards can only be obtained when is greater than . k is a constant, while is the Euclidean distance between the standardized power curve of the adjustable load and CDL, the formula for which is
3.2. LA Layer Model
The goal of LA is to balance the benefits and satisfaction losses of participating in DR on the premise of meeting the load demand, so as to comprehensively optimize the load curve. In this paper, the loss of satisfaction with electricity consumption is expressed as a constraint condition, and the objective function only considers the cost of power purchase and the reward obtained by participating in DR:
where is the total cost of electricity consumption, is the cost of electricity purchase, and is the reward obtained by participating in DR.
The adjustment of load has certain limitations. In this paper, two typical flexible loads—AC and EV—are selected as the objects of DR. We set all ACs as fixed frequency refrigeration air conditioners. The adjustment limit of AC is analyzed. First, the first-order equivalent thermal parameter (ETP) model of AC is established, as shown in Figure 1.

Figure 1.
First-order equivalent thermal parameter model.
According to Figure 1, the heat balance equation of the first-order ETP model can be obtained, specifically as follows:
where is the room temperature; is the outdoor ambient temperature; is the cooling capacity of air conditioner; and and are equivalent thermal resistance and thermal mass, respectively. According to Equation (17), the relationship between the cooling capacity in and the temperature change can be obtained:
The cooling capacity can be converted into electric power by dividing the fixed energy efficiency ratio COP, and the calculation formula is as follows:
According to Equation (18) and (19), the relationship between AC power and temperature can be established. AC must meet the following constraints when participating in DR:
where indicates the rated operating power of AC; and are the upper and lower limits of the indoor temperature.
Without considering the discharge capacity of EVs, the charging model of an EV is established:
where represents the charging power of the EV in time period t; and are the time of EV arrival and departure from the charging station, respectively; SoC is the state of charge of the EV; and B indicates the battery capacity of the EV.
EV participation in DR needs to meet the following constraints:
where represents the rated power of the EV; is the maximum limit of SoC; and is the SoC value that the EV needs to reach when it leaves the charging station.
Load participation in DR may result in loss of electricity satisfaction. We therefore need to define the consumption satisfaction loss index S. AC’s satisfaction with electricity consumption is related to temperature. The greater the degree of temperature deviation from the ideal temperature, the greater the loss of satisfaction with electricity consumption. Therefore, the S calculation formula of AC is as follows:
where is the ideal temperature set by the user.
EV users want to charge to as soon as possible, so the S index of EVs can be obtained according to the fastest and slowest charging path, as follows:
where and are the fastest and slowest charging paths, respectively.
The greater the absolute value of S, the greater the loss of power satisfaction of the load, so the sum of absolute value of S for all periods of the load cannot exceed a certain threshold value :
is not fixed, but varies according to changes in the reward price. According to the principle of consumer psychology, the relationship between and reward price is modeled as a piecewise linear function, specifically as follows:
where and are the upper and lower limits of , respectively. and are the two abscissa inflection points of the piecewise linear function.
3.3. Method of Solving the Model
When solving the bi-level optimization model, it is common to transform the upper-level problem into its Karush–Kuhn–Tucker (KKT) conditions, thereby converting the bi-level model into a single-level problem. However, this transformation approach requires the LA to disclose sensitive information such as load parameters and operational status. Due to concerns over privacy leakage, some loads may refuse to participate in DR, thus limiting its applicability. In contrast, the genetic algorithm (GA) generates multiple individuals within the solution space and iteratively updates them to search for the optimal solution. The GA-based solution method enables decoupled optimization of the upper- and lower-level problems, eliminating the need for LA to provide private load parameters. Therefore, this study adopts a GA-based approach to solve the bi-level model. The solution process is divided into three stages. First, a series of individuals—specifically, reward prices —are generated and transmitted to the LA, representing the first-stage decision. Next, the CPLEX solver is invoked to solve the LA’s optimization problem, thereby determining the corresponding load curves under different reward prices, constituting the second-stage decision. Finally, the load curve obtained from the LA is passed back to the DSO, and the CPLEX solver is again employed to solve the DSO’s optimization problem. The resulting objective value of the DSO is then used as the fitness value of the individual, representing the third-stage decision. The GA-based bi-level solver (Algorithm 1) is illustrated in Figure 2. The model is coded in MATLAB R2024a calling IBM CPLEX v20.1. The typical run time is approximately 120 s per case on an Intel i7-9700K CPU with 16 GB of RAM.
| Algorithm 1 GA-based bi-level solver |
|
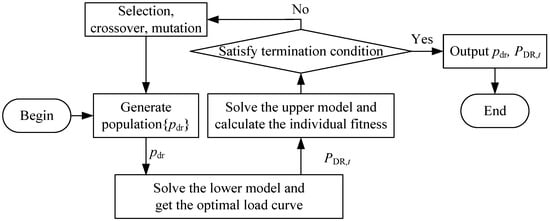
Figure 2.
The process of solving based on genetic algorithm.
4. Case Study
4.1. Introduction of Case
The modified IEEE-33 node system is adopted for simulation analysis. The system structure is shown in Figure 3. Node 1 is the connection point between the distribution network and the upper power network, and the line parameters are shown in [1]. A photovoltaic power generation system with an installed capacity of 1.2 MW is installed at node 20 and node 30, a wind power system with an installed capacity of 1.2 MW is installed at node 13 and node 27, and a wind power system with an installed capacity of 0.6 MW is installed at node 24. The total base load in the system and the overall predicted power curve of wind and solar renewable energy are shown in Figure 4. The load shapes of each node and the power curves of wind power and photovoltaic are set in Figure 4. The load ratios of each node are the same as those set in [1], and the ratios of each wind power and photovoltaic are distributed according to the installed capacity. The outdoor temperature change curve is shown in Figure 5.
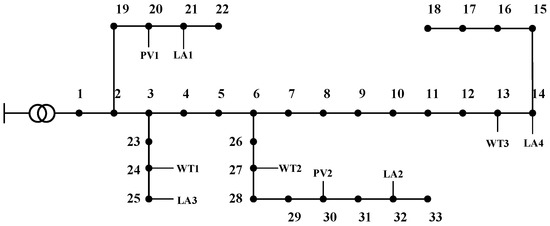
Figure 3.
The modified IEEE-33 node system. (wind power in node 13, 24, 27. PV in node 20, 30. LA in node 14, 21, 25, 32).
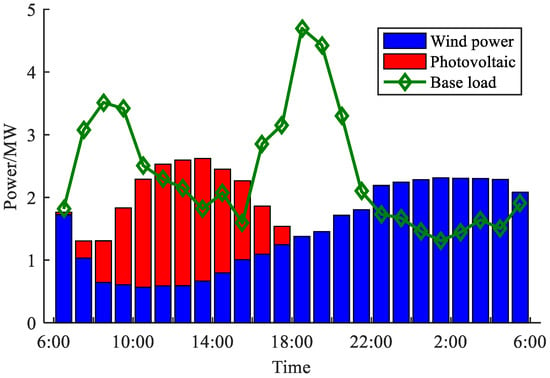
Figure 4.
The predicted power curves of base load and RESs.
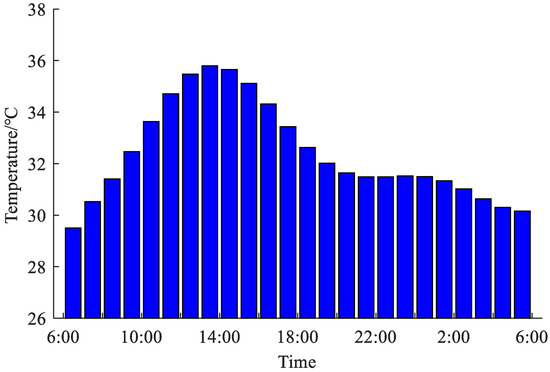
Figure 5.
The outdoor temperature change.
There are four load clusters in the system, in which one EV cluster is set at nodes 21 and 32 and one AC cluster is set at nodes 14 and 25. The number of single AC clusters is 80 and the number of single EV clusters is 150. AC is set to be on all day, EVs have grid-connected behavior, and their distribution characteristics are shown in Table 1. The number of EVs of three types is 60, 60, and 30, respectively. The parameters of EV clusters are obtained via the Monte Carlo sampling method.

Table 1.
Sampling parameters for EV connection behavior.
The unit price of electricity sold by DSO is CNY 0.5283/kWh, the unit price of electricity purchased from the superior grid is CNY 0.35/kWh, and the upper and lower limit of node voltage offset is ±7%. From 6:00 a.m. to 6:00 a.m. the next day, the DR is carried out in one day, and the model calculates values at a time interval of 1 h.
4.2. Result Analysis
According to the proposed CDL calculation method, the CDL of the adjustable load of each node is calculated, and the results are shown in Figure 6. It can be seen from Figure 4 and Figure 6 that the value of CDL is high in the period when the RES consumption demand is high. Therefore, taking CDL as the adjustment target of the load involved in DR can accurately reflect the adjustment demand of the system and also guide the load to adjust intuitively and concisely, avoiding problems such as an unclear adjustment target, overadjustment, and rebound.
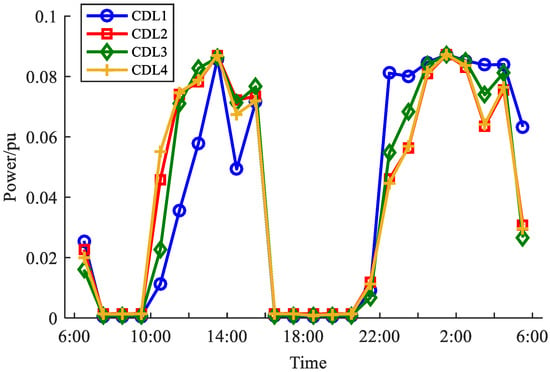
Figure 6.
The CDL calculation results.
The reward price PDR obtained by the final solution is CNY 0.183/kWh. The comparison between the load curve per unit value of AC and EVs after optimization is shown in Figure 7 and Figure 8, respectively. According to Figure 7 and Figure 8, it can be seen that the load curve is optimized under economic incentives so that the shape of the load curve is close to CDL, where the similarity between AC and CDL is 0.827 and the similarity between EVs and CDL is 0.891. The similarity of EVs is greater than that of AC, because EVs participate in DR through the adjustment of the charging period, as long as the required amount of electricity is charged when leaving the charging station, so their adjustment range is large and their response ability is strong. AC participates in DR through the thermal energy storage characteristics of the building, but its temperature deviation is strictly limited. The ability to make AC continuously output higher or lower power is weak, so its response is weak compared to EVs.
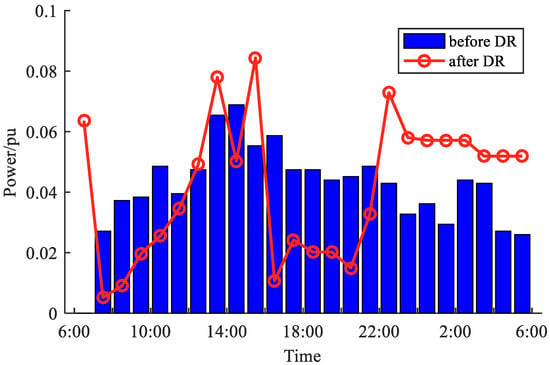
Figure 7.
The CDL calculation results.
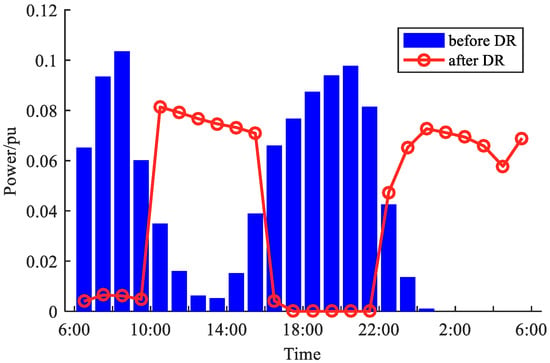
Figure 8.
The CDL calculation results.
The optimal scheduling results of the system are shown in Figure 9. In order to compare and analyze the effect of DR, the situation without DR is analyzed. In the case of no DR, the EV starts charging immediately after connecting to the charging station and stops charging when is reached, while AC uses electricity according to maintenance. According to Figure 9, it can be seen that under the guidance of CDL, the total load curve optimized by DR decreases in the period of low consumption demand of RESs and increases in the period of high consumption demand of RESs, thus reducing the abandoned power of RESs. However, compared with the predicted output curve of RESs, there is still some abandoned power, because the adjustment capacity of AC has reached the upper limit. Although EVs can continue to adjust, limited by the degree of satisfaction loss, DSO needs to give more rewards to promote the adjustment. From an economic perspective, DSO will not continue to increase the reward.
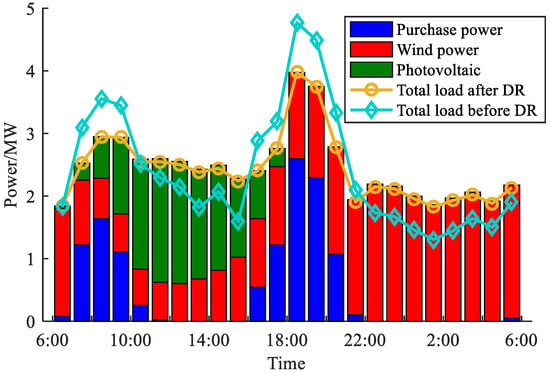
Figure 9.
The optimal scheduling result.
Load-Shedding Mechanism at Peaks: During the morning (08:00–09:00) and evening (18:00–19:00) peaks, the DSO raises the DR reward above participating consumers’ discomfort cost thresholds (), inducing voluntary load shedding. Specifically, AC systems defer cooling when > CNY 1/kWh, and EV chargers suspend charging when > CNY 1.26/kWh. Each load agent compares the instantaneous reward to its , resulting in the abrupt consumption drops seen in Figure 9. As decreases post-peak, loads resume normal operation, illustrating the rebound effect.
The economic benefit pair of DSO with or without DR is shown in Table 2, and the economic benefit pair of LA is shown in Table 3 and Table 4. From the perspective of the economic benefits of DSO, due to DR, the load curve is very similar to CDL, which can help the absorption of RESs, so the penalty cost of power abandonment of RESs is lower when DR is implemented. Meanwhile, because RESs can be fully utilized for power generation, there is no need to transmit large amounts of power from the upper power grid to the distribution network to ensure the balance between supply and demand, so the power purchase cost is also lower when DR is implemented. Based on the above factors, DSO with DR has better economic benefits. From the perspective of the revenue of LA, due to the implementation of DR, the load adjustment electricity consumption curve is close to the shape of CDL, meaning that it obtains a higher DR reward, and the electricity consumption cost with DR is greatly reduced. According to Table 2, Table 3 and Table 4, DR based on CDL can achieve win–win benefits for both the system side and the demand side.

Table 2.
Comparison of economic benefits of DSO.

Table 3.
Comparison of economic benefits of AC.

Table 4.
Comparison of economic benefits of EVs.
Environmental and Economic Impact: Using the merit-order dispatch, we calculate that DR reduces imported thermal generation by 12.5 MWh, corresponding to a 6% drop in coal burning. Applying an emission factor of 0.85 kg /kWh for coal plants, the total is reduced by 10.6 t. Comparing pre- and post-DR energy bills yields a system-level saving of CNY 1250 (2.3%) and a consumer saving of CNY 340 (4.1%).
5. Conclusions
This paper presents a demand response strategy based on CDL and game theory. A CDL calculation model under AC power flow conditions is constructed, followed by the development of a bi-level optimization framework for demand response formulated through Stackelberg game theory. The model incorporates both air conditioning (AC) systems and electric vehicles (EVs) as DR resources, with separate objective functions and constraints designed for the distribution system operator (DSO) and the load aggregator (LA). The optimization problem is solved using a genetic algorithm. A case study conducted on a modified IEEE-33 node system demonstrates that the proposed CDL-based DR strategy, supported by game-theoretic modeling, can effectively reduce the curtailment of renewable energy sources (RES) and achieve win–win outcomes for both the system operator and the demand side.
Author Contributions
Writing—original draft, W.X., Q.C. and H.X.; Writing—review & editing, W.X., Q.C., Q.X. and H.X.; Project administration, W.X. and Q.X. All authors have read and agreed to the published version of the manuscript.
Funding
This research was funded by the Science and Technology Project of the State Grid Corporation of China, grant number CEKY23065. The APC was funded by the Science and Technology Project of the State Grid Corporation of China.
Data Availability Statement
The original contributions presented in the study are included in the article, further inquiries can be directed to the corresponding author.
Acknowledgments
The authors gratefully acknowledge the support from the State Grid. We also thank the City Energy Research Institute for their technical support and contributions to this research. Finally, we appreciate the valuable comments and suggestions from the reviewers and the editorial team, which have significantly improved the quality of this manuscript.
Conflicts of Interest
The authors declare no conflict of interest.
References
- Ding, Y.; Shao, C.; Yan, J.; Song, Y.; Zhang, C.; Guo, C. Economical flexibility options for integrating fluctuating wind energy in power systems: The case of China. Appl. Energy 2018, 228, 426–436. [Google Scholar] [CrossRef]
- Hu, Z.; Guo, X.; Wang, S.; Xu, C.; Li, T.; Zhou, W. Demand Response Strategy for Electric Vehicles and Air Conditioners Considering Response Willingness. Power Syst. Prot. Control 2023, 51, 109–119. [Google Scholar]
- Palensky, P.; Dietrich, D. Demand side management: Demand response, intelligent energy systems, and smart loads. IEEE Trans. Ind. Inform. 2011, 7, 381–388. [Google Scholar] [CrossRef]
- Wang, J.; Zhong, H.; Ma, Z.; Xia, Q.; Kang, C. Review and prospect of integrated demand response in the multi-energy system. Appl. Energy 2017, 202, 772–782. [Google Scholar] [CrossRef]
- Ming, H.; Xia, B.; Lee, K.Y.; Adepoju, A.; Shakkottai, S.; Xie, L. Prediction and assessment of demand response potential with coupon incentives in highly renewable power systems. Prot. Control Mod. Power Syst. 2020, 5, 1–14. [Google Scholar] [CrossRef]
- Pandey, V.C.; Gupta, N.; Niazi, K.R.; Swarnkar, A.; Thokar, R.A. A Hierarchical Price-Based Demand Response Framework in Distribution Network. IEEE Trans. Smart Grid 2022, 13, 1151–1164. [Google Scholar] [CrossRef]
- Nikzad, M.; Samimi, A. Integration of designing price-based demand response models into a stochastic bi-level scheduling of multiple energy carrier microgrids considering energy storage systems. Appl. Energy 2021, 282. [Google Scholar] [CrossRef]
- Zhang, Z.; Huang, Y.; Chen, H.; Huang, Q.; Lee, W.J. A novel hierarchical demand response strategy for residential microgrid. IEEE Trans. Ind. Appl. 2021, 57, 3262–3271. [Google Scholar] [CrossRef]
- He, L.; Liu, Y.; Zhang, J. An Occupancy-Informed Customized Price Design for Consumers: A Stackelberg Game Approach. IEEE Trans. Smart Grid 2022, 13, 1988–1999. [Google Scholar] [CrossRef]
- Mansouri, S.A.; Paredes, A.; Gonzalez, J.M.; Aguado, J.A. A Three-Layer Game Theoretic-Based Strategy for Optimal Scheduling of Microgrids by Leveraging a Dynamic Demand Response Program Designer to Unlock the Potential of Smart Buildings and Electric Vehicle Fleets. Appl. Energy 2023, 347, 121440. [Google Scholar] [CrossRef]
- Nie, Y.; Liu, J.; Liu, X.; Zhao, Y.; Ren, K.; Chen, C. Asynchronous Multi-Agent Reinforcement Learning-Based Framework for Bi-Level Noncooperative Game-Theoretic Demand Response. IEEE Trans. Smart Grid 2024, 15, 5622–5637. [Google Scholar] [CrossRef]
- Song, M.; Ding, J.; Gao, C.; Yan, M.; Ban, M.; Liu, Z.; Bai, W. Exergy-Driven Optimal Operation of Virtual Energy Station Based on Coordinated Cooperative and Stackelberg Games. Appl. Energy 2024, 360, 122770. [Google Scholar] [CrossRef]
- Yan, Y.; Liu, M.; Tian, C.; Li, J.; Li, K. Multi-Layer Game Theory Based Operation Optimisation of ICES Considering Improved Independent Market Participant Models and Dedicated Distributed Algorithms. Appl. Energy 2024, 373, 123691. [Google Scholar] [CrossRef]
- Jin, F.; Shao, C.; Li, K.; Jin, X.; Shahidehpour, M.; Wang, X. User Equilibrium Analysis of Aggregative Game in Demand Response. IEEE Trans. Power Syst. 2025, 40, 1903–1915. [Google Scholar] [CrossRef]
- Wu, J.K.; Liu, Z.W.; Li, C.; Zhao, Y.; Chi, M. Coordinated Operation Strategy of Virtual Power Plant Based on Two-Layer Game Approach. IEEE Trans. Smart Grid 2025, 16, 554–567. [Google Scholar] [CrossRef]
- Yang, H.; Chang, X.; Zhou, Y.; Xue, Y.; Li, Z.; Su, J.; Sun, H. Transactive Energy Management for CIES Considering Tri-Level Hybrid Game-Theoretic Approaches with Multiple Weight Allocation Factors. Appl. Energy 2025, 377, 124685. [Google Scholar] [CrossRef]
- Fan, S.; Li, Z.; Yang, L.; He, G. Customer directrix load-based large-scale demand response for integrating renewable energy sources. Electr. Power Syst. Res. 2020, 181, 106175. [Google Scholar] [CrossRef]
- Fan, S.; Jia, K.; Wang, F.; Wang, Z.; Yang, L.; He, G. Large-scale demand response based on customer directrix load. Autom. Electr. Power Syst. 2020, 44, 19–27. [Google Scholar]
- Xu, B.; Zhang, P.; He, G. Stackelberg game based control method for water heater cluster using customer directrix line. Proc. CSEE 2022, 42, 7785–7797. [Google Scholar]
- Meng, Y.; Fan, S.; Shen, Y.; Xiao, J.; He, G.; Li, Z. Transmission and distribution network-constrained large-scale demand response based on locational customer directrix load for accommodating renewable energy. Appl. Energy 2023, 350, 121681. [Google Scholar] [CrossRef]
Disclaimer/Publisher’s Note: The statements, opinions and data contained in all publications are solely those of the individual author(s) and contributor(s) and not of MDPI and/or the editor(s). MDPI and/or the editor(s) disclaim responsibility for any injury to people or property resulting from any ideas, methods, instructions or products referred to in the content. |
© 2025 by the authors. Licensee MDPI, Basel, Switzerland. This article is an open access article distributed under the terms and conditions of the Creative Commons Attribution (CC BY) license (https://creativecommons.org/licenses/by/4.0/).