Article

Construction of Multi-Sample Public Building Carbon Emission Database Model Based on Energy Activity Data

1
Marketing Service Center (Metering Center), State Grid Hubei Electric Power Co., Ltd., Wuhan 430080, China
2
China State Construction Engineering Design & Research Institute Co., Ltd., Beijing 100037, China
3
Institute of Thermal Science and Technology, Shandong University, Jinan 250062, China
*
Author to whom correspondence should be addressed.
Energies 2025, 18(14), 3635; https://doi.org/10.3390/en18143635
Submission received: 16 May 2025 / Revised: 28 June 2025 / Accepted: 8 July 2025 / Published: 9 July 2025

Abstract

In order to address the growing urgency of energy-related carbon emission reduction and improve the construction of the existing public building carbon emission database model, this study constructs a public building carbon emission database model based on energy activity data by collecting the energy consumption data of relevant buildings in the region and classifying the building types, aiming to quantitatively analyze the carbon emission characteristics of different types of public buildings and provide data support for the national and local governments, enterprises, universities and research institutions, and the power industry. This study is divided into three phases: The first stage is the mapping of carbon emission benchmarks. The second stage is the analysis of multi-dimensional-building carbon emission characteristics. The third stage is to evaluate the design optimization plan and propose technical improvement suggestions. At present, this research is in the first stage: collecting and analyzing information data such as the energy consumption of different types of buildings, building a carbon emission database model, and extracting and analyzing the carbon emission benchmarks and characteristics of each building type from the data of 184 public buildings in a given area. Moreover, preliminary exploration of the second phase has been conducted, focusing on identifying key influencing factors of carbon emissions during the operational phase of public buildings. Office buildings have been selected as representative samples to carry out baseline modeling and variable selection using linear regression analysis. The results of this study are of great significance in the energy field, providing data support for public building energy management, energy policy formulation, and carbon trading mechanisms.

1. Introduction

As the issue of global climate change becomes increasingly serious, carbon footprint, as an important indicator for measuring carbon emissions during the life cycle of products and buildings, has attracted widespread attention [1]. In the construction industry in particular, carbon emissions from public buildings account for a significant proportion. Data shows that in 2021, carbon emissions from the operation of buildings in China reached 2.3 billion tCO2, of which carbon emissions from public buildings accounted for as much as 41% [2]. This phenomenon shows that controlling the carbon emissions of public buildings during the operation stage is crucial to achieving the goals of peaking carbon emissions and carbon neutrality [3].
How to effectively quantify the carbon emissions of public buildings during the operation stage and establish a comprehensive and relatively accurate database of public building carbon emissions has become a critical step [4]. However, there are still many deficiencies in the current carbon emission database. For example, data sources are scattered and lack unified standards, making it difficult to compare data from different studies [5,6]. There is no unified framework for carbon emission calculation methods, and there are significant differences in boundary conditions, emission factors, calculation methods, etc., between different studies [7,8].
Existing research mainly focuses on the carbon emissions of the entire life cycle of buildings, while the assessment of carbon emissions during the operation of public buildings is still insufficient. Since building operating energy consumption is the main source of carbon emissions, how to accurately measure and effectively control it remains an urgent issue [4]. Therefore, there is an urgent need to construct a carbon emission database covering the operation stage of public buildings of different building types, and to optimize it to address issues such as scattered data, inconsistent standards, and differences in calculation methods [9].
In this context, this paper will further review domestic and foreign research on the construction of building carbon emission databases and calculation methods, to provide a solid theoretical basis for this study.

2. Literature Review

2.1. Importance of Operational Carbon Emissions in Public Buildings

In China, buildings are mainly divided into civil buildings, industrial buildings, and agricultural buildings [10]. Civil buildings are classified into two main categories based on their functions: residential buildings and public buildings [11]. Statistics indicate that operational energy consumption in China accounts for over 21% of the country’s total energy use. In particular, the unit-area energy consumption of public buildings can be up to three times that of residential buildings [12]. Therefore, research on public buildings is of greater significance compared to residential buildings.
In defining the research scope, public buildings refer to civil buildings intended for non-residential use, including office buildings, educational and research buildings, commercial buildings, and so on. This classification is based on functional usage, rather than ownership structure. Accordingly, the research scope includes all non-residential buildings that are open to the public or serve public functions, including certain privately owned buildings with public service attributes, all of which are categorized as public buildings in this study [13,14].
Operational carbon emissions refer to greenhouse gas emissions generated from the consumption of energy sources such as electricity and natural gas during the daily use of buildings. Numerous studies have shown that the operational phase accounts for the largest share of carbon emissions throughout a building’s life cycle, making it one of the most significant sources [4,15]. Therefore, this study focuses on the carbon emissions of public buildings during the operational phase and selects them as the primary subject of analysis.

2.2. Research Status of Building Carbon Emission Databases

The carbon emissions of buildings throughout their life cycle can be broadly categorized into two major components: embodied carbon and operational carbon [16]. Embodied carbon refers to the emissions generated during the production, transportation, and construction of building materials, as well as during demolition and disposal processes. In contrast, operational carbon refers to the direct and indirect emissions resulting from energy consumption during the building’s use phase to meet functional demands such as heating, cooling, lighting, and equipment operation [17,18]. Clearly distinguishing and quantifying these two categories is of fundamental importance in database development, carbon footprint assessment, and emissions reduction strategy formulation.
Researchers at home and abroad have conducted multi-dimensional explorations into the development of building carbon emission databases, each with different focuses in terms of scope and data coverage:
Embodied carbon database research: This area of research primarily focuses on the pre-operation phase of buildings, such as material production and construction activities. For example, Long Jiangying and colleagues developed a dynamic database covering the full life cycle from material production to demolition and reuse, with a particular strength in tracking embodied carbon stages such as materials and construction; however, it provides limited depth and real-time support for operational data [19]. Zhang et al. built a carbon emission estimation model and emission factor database based on BIM technology, mainly to support localized embodied carbon calculations [20]. Internationally, material environment databases such as BEES, ICE, and input–output databases such as EIO-LCA provide foundational data for embodied carbon assessments [21] but generally lack detailed characterization of operational energy use and emissions.
Operational carbon database research: Managing data on carbon emissions during the operational phase is another key direction. Chen Jianhua and colleagues developed a client–server-based evaluation system focused on the carbon assessment process; however, it lacks comprehensive discussion on the systematic collection, standardization, and wide coverage of operational carbon data itself [22]. Lu et al. proposed a three-step framework for constructing scalable carbon emission factor databases, offering a general method; however, the sources, accuracy, and application of operational emission factors—especially for public buildings—are not sufficiently elaborated in their case studies [23]. At the macro level, international databases such as those developed by the IEA, CDIAC, EDGAR, EIA, and EXIOBASE provide national- or regional-level energy and emissions data [24,25], but their granularity is insufficient to support fine-scale, building-specific operational carbon accounting and management.
Therefore, to effectively promote the development of green public buildings, there is an urgent need to establish a dedicated operational carbon emission database specifically for public buildings. This study aims to address this research and practical gap by systematically collecting, processing, analyzing, and standardizing key carbon emission data from the operational phase of public buildings, ultimately constructing a database that supports accurate emissions accounting, operational optimization, and data-driven policy and management decisions.

2.3. Research Status of Building Carbon Emission Calculation Methods

The primary methods for calculating building carbon emissions include Life Cycle Assessment (LCA), building energy simulation, and input–output analysis (IOA) [26]. These approaches differ in terms of accounting boundaries, data requirements, and applicable scenarios, forming the fundamental framework of current research. In contrast, this study focuses on the operational phase of public buildings and adopts a calculation method based on measured data [27], which offers higher accuracy and practical applicability. This approach is particularly suitable for carbon quota allocation and integration with carbon trading mechanisms. To clarify the positioning of this study, the following section briefly reviews domestic and international progress in the three aforementioned methods, comparing their applicability and limitations in operational carbon emission accounting to highlight the advantages and practical value of the measured-data-based method.
Life Cycle Assessment (LCA): LCA is a core methodology in building carbon emission research, with its key strength being a systematic assessment of emissions throughout a building’s entire life cycle—from raw material extraction and construction to operation and eventual demolition. In China, LCA has been used to develop stage-specific carbon accounting models [28], explore emission reduction strategies for urban building clusters [29], and improve accuracy by integrating energy simulation techniques [30]. International studies often focus on comparing the embodied emissions of different materials and structural systems to inform green design strategies [31]. While LCA is well-suited for strategic planning and design optimization, it generally lacks the capacity to dynamically reflect the actual operational performance of buildings. In contrast, methods based on measured data capture real-time energy use and operational characteristics, enabling a more accurate and context-specific reflection of emissions. This enhances the reliability and adaptability of carbon accounting and provides a solid empirical foundation for database development and quota management.
Energy Simulation: Energy simulation methods create physical models of buildings (using software such as EnergyPlus version 9.3.0) to predict energy consumption and, subsequently, carbon emissions based on parameters like structure, equipment, climate, and usage behaviors. These methods are widely applied during the design phase to assess the carbon performance and energy-saving potential of various scenarios, such as different operational conditions [30] or climate zones and structural forms [32]. Although simulation offers foresight and flexibility for design comparison and policy optimization, its accuracy heavily depends on the model configuration and quality of input data. Without calibration using measured data, simulation results may exhibit substantial deviations from actual performance.
Input–Output Analysis (IOA): IOA is based on macroeconomic systems, quantifying the indirect carbon emissions associated with building activities (e.g., embodied emissions in construction materials) through inter-industry energy and material flow relationships. IOA is particularly useful for carbon footprint analysis and policy development at urban, regional, or national scales, such as examining the embodied emissions of various housing typologies [33]. While IOA offers a broad systemic perspective by leveraging input–output tables and economic linkages, it lacks the granularity to capture the dynamic energy use patterns and behavioral differences of individual buildings, limiting its precision and applicability at the micro (building) level.
Based on the review of domestic and international research, LCA is the most widely used method for assessing carbon emissions over the entire building life cycle, but it has limitations in capturing the actual operational status of buildings. Energy simulation methods focus on design-stage predictions, with results highly dependent on model parameters. Input–output analysis is suitable for macro-level studies but lacks the precision needed to reflect the operational emissions of individual buildings. In contrast, this study adopts a method based on energy activity data and emission factors, focusing on the direct estimation of carbon emissions during the operational phase of public buildings. This approach features clear data sources and a straightforward calculation process, enabling accurate reflection of real operating conditions. It avoids the complexity and time-lag issues of other methods and is better suited to the practical needs of constructing a carbon emission database for public building operations.

3. Methodology

Based on the aforementioned domestic and international research, although extensive studies on building carbon emissions exist, research specifically focused on constructing a carbon emission database for the operational phase of public buildings remains relatively scarce. To address this gap, this study collects data provided by relevant authorities, supplemented by sample surveys and investigations. The collected data is processed and, based on activity data and emission factors, a carbon emission database model for public buildings is developed. The specific methodology is as follows:

3.1. Data Collection and Processing

(1)
Data Collection
The data sources for this study include building energy consumption records and relevant operational measurement data provided by the Housing and Urban–Rural Development Department of Hubei Province and the State Grid Hubei Power Company (Wuhan, China). To ensure the uniqueness of each building sample’s encoding, a combination of city administrative codes, building type sequence numbers, and project sequence numbers is applied. The sample coding system consists of three parts: the first four digits of the project code are derived from the last four digits of the six-digit city administrative code; a two-digit number is assigned to each building type according to its classification order as the middle part of the code (e.g., 01, 02); and a four-digit number is assigned as the project sequence number based on the order of project inclusion (e.g., 0001, 0002).
(2)
Data Investigation
A combination of systematic data screening and manual verification was used for preliminary filtering of the collected data. Irrelevant information was removed, and records with duplicate entries or irregular formats were flagged. Any discrepancies or missing data were addressed by consulting relevant departments, reviewing historical records, or conducting additional on-site investigations to obtain supplementary data.
(3)
Classification of Building Types
To ensure accurate calculation and analysis of carbon emissions from public buildings, this study classifies building types based on an in-depth review of relevant building standards and the literature. Initially, office buildings, commercial buildings, and cultural and sports buildings were included in the study scope [34]. Previous studies by Feng [35] and reports by Zhou [36] suggest that hospital buildings and welfare buildings share highly concentrated public service functions, a reliance on energy-intensive equipment, and 24 h operations, and are therefore categorized as medical and welfare buildings. Based on the research of Zhang [37] and Wang [38], hotel and lodging buildings, which provide both accommodation and catering services, are classified as a single category. The research by Peng [39] indicates that educational and research buildings, both involving knowledge dissemination, research, and innovation, should be merged into the education and research building category. Other buildings that do not fall into these predefined categories are classified as other buildings. Ultimately, this study categorizes public buildings into seven major types based on their functions: office buildings, educational and research buildings, medical and welfare buildings, commercial buildings, hotels and hostel buildings, cultural and sports buildings, and other buildings.
(4)
Data Processing
In the data processing phase, rigorous data cleaning and optimization were performed. The main steps include the following:
(a) Data Screening and Cleaning
Energy data were converted into standardized units, and samples with missing electricity consumption data, building area information, or personnel count were removed. Buildings outside the research scope were excluded, and samples with obvious errors (e.g., negative electricity consumption values) were deleted.
(b) Removal of Abnormal Values
Buildings with abnormal carbon emission intensity were excluded. Specifically, samples with carbon emission intensity exceeding 10 times or falling below 0.1 times the average carbon emission intensity for each building type were removed.
(c) Outlier Elimination
The Grubbs test was applied for further outlier detection, using a two-tailed test with a confidence level of α = 0.1. The final dataset used for analysis was established after this screening process [40].

3.2. Calculation Boundaries and Methods

To better understand and quantify carbon emissions in the building sector, defining the boundaries of building carbon emissions is a fundamental prerequisite for conducting relevant research [41]. As a complex system, a building’s carbon emissions are not limited to the use of construction materials and the construction process but also include energy consumption during its operational phase.
Existing research on building carbon emissions generally follows two main directions: narrow-scope building carbon emissions, which focus solely on emissions generated during the operational phase of buildings; and broad-scope building carbon emissions, which encompass the entire building life cycle [42]. Since the majority of building carbon emissions are generated during the operational phase [43], this study focuses on the operational stage of buildings, emphasizing direct and indirect carbon emissions resulting from external energy consumption (such as electricity and gas) during daily use [1].
On this basis, this study refers to a grandfather-based allocation method adopted in the carbon emission quota system for public buildings in Tokyo, Japan. The baseline year is defined as the average actual emissions over the three years prior to the facility’s assessment, which helps mitigate the impact of fluctuations in single-year data [44].

3.2.1. Carbon Emission Calculation Method

This study calculates carbon emissions from electricity and gas consumption based on emission factors. The total carbon emissions are determined as the sum of carbon emissions from electricity and gas, specifically by multiplying the actual energy consumption of each source by its corresponding carbon emission factor. The key aspect of this step is to determine the carbon emission factors for different types of energy sources.
(1)
Carbon Emission Factors for Electricity and Gas
According to the National Development and Reform Commission of the People’s Republic of China (NDRC) [45], the lower heating value of gas is 389.3 GJ/t, with a carbon content per unit heating value of 0.01530 tC/GJ, a carbon oxidation rate of 99%, and a molecular weight ratio of CO2 to carbon of 44/12. Based on these parameters, the emission factor for gas is calculated as 2.16 kgCO2/m3.
For electricity, the carbon emission factor is 0.5703 kgCO2/kWh [46].
(2)
Annual Carbon Emissions in the Building Sector
The carbon emission calculation method follows the Standard for Calculation of Building Carbon Emissions (GB/T 51366-2019) [47].
The formula for calculating annual carbon emissions in the building sector is as follows:
C i ,   k = j ( E i ,   j ,   k × Q j )
  • i is the year;
  • C i ,   k is the total carbon emissions of the k building in the i-th year, kgCO2;
  • E i ,   j ,   k is the consumption of the j type of energy by the k building in the i-th year;
  • Q j is the emission factors for the j type of energy.

3.2.2. Carbon Emission Intensity Calculation Method

To determine the characteristics of carbon emission variations in the building sector, it is necessary to consider both total carbon emissions and emission intensity. Common intensity indicators include carbon emissions per unit area, per unit GDP, and per capita carbon emissions [48,49]. This study adopts the carbon emission intensity per unit area as the key metric for calculation.
The formula for calculating annual carbon emission intensity of individual public buildings is as follows:
C A 1 ,   i ,   k = C i ,   k A k
  • C A 1 ,   i ,   k is the carbon emission intensity of the k building in the i-th year, kgCO2/m2;
  • A k is the building area of the k building, m2.
The three-year average carbon emission intensity is taken as the benchmark for carbon emissions in individual public buildings. The calculation formula is as follows:
C A 2 ,   k = n = i i + 2 C n ,   k 3 A k
  • C A 2 ,   k is the three-year average total carbon emissions of the k building, kgCO2/m2;
  • C n ,   k is the total carbon emissions of the k building in the n-th year, kgCO2;
  • A k is the building area of the k building, m2.
This chapter focuses on the construction methodology of the carbon emission database, introducing in sequence the processes of data collection and processing, as well as the definition of carbon emission calculation boundaries and methods. These steps lay the data foundation and technical path for the quantitative estimation of carbon emissions and carbon emission intensity. Building upon this, the next chapter will elaborate on the framework design of the public building carbon emission database based on emission factors, including the purpose and application of the research database, an overview of the database framework, the detailed framework of the carbon emission database, and so on.

4. Carbon Emission Database Framework Based on Emission Factors

4.1. Purpose and Application of the Research Database

This study aims to establish a public building carbon emission database to provide data support for the national and local governments, enterprises, universities and research institutions, and the power industry, as illustrated in Figure 1.

4.2. Overview of the Database Framework

The database is designed based on energy consumption and building usage data, integrating emission factors to conduct quantitative calculations and analyses of carbon emissions. The structure of the database is designed to ensure data integrity, scalability, and efficient data processing capabilities.
The carbon emission database framework consists of four layers: Basic Data Storage Layer, Carbon Emission Calculation Layer, Data Storage and Analysis Layer, Visualization and Presentation Layer. Through the integration of these layers, the framework provides a comprehensive solution for research on building carbon emissions.

4.3. Carbon Emission Database Framework

(1)
Basic Data Storage Layer
This layer stores building information and energy consumption data, providing the foundation for carbon emission calculations. The database model includes four levels of data, but this study focuses only on Level 1 data, which primarily covers basic building information, energy consumption data, and building characteristics information. This includes details such as building type, company address, building area, and monthly/annual electricity and gas consumption. These data serve as the basis for subsequent carbon emission calculations. The core data tables include the following: Building Information Table, Energy Consumption Data Table, and Building Characteristics Information Table.
(2)
Carbon Emission Calculation Layer
This layer integrates energy consumption data and carbon emission factors to calculate the carbon emissions of each building for different years. The core data tables include the following:
Carbon Emission Factor Table: Stores carbon emission factors for different energy types, converting energy consumption into carbon emissions.
Carbon Emission Data Table: Records the carbon emissions of each building over different time periods.
Calculation Steps:
Perform a data completeness check.
Convert energy consumption data into carbon emissions, calculating total carbon emissions and carbon emission intensity for each sample.
Conduct anomaly detection and outlier analysis based on carbon emission intensity.
Store verified calculation results in the Carbon Emission Data Table, ensuring that carbon emission data for each building is recorded by year and energy type.
(3)
Data Storage and Analysis Layer
This layer is responsible for data storage, retrieval, efficient querying, and analytical processing. It supports multi-dimensional data analysis, such as carbon emission analysis by time, building type, and energy type. The key functional modules include the following:
Data Storage: Provides efficient storage for historical data and supports large-scale datasets.
Analytical Tools: Enables carbon emission trend analysis, comparative analysis, and other analytical functions based on dimensions such as time, building type, and location.
(4)
Visualization and Presentation Layer
This layer visually presents the results of carbon emission analyses through charts and graphs, helping decision-makers understand trends and influencing factors in carbon emissions.

4.4. Composition of the Carbon Emission Database

The carbon emission database consists of the following key components, each playing a distinct role within the database. These components work together to support the calculation, storage, and analysis of carbon emissions:
(1)
Building Information Table
This table records basic information for each building, as shown in Table 1.
To enable systematic modeling and analysis of carbon emissions during the operational phase of public buildings, this study established a carbon emission database, with the Building Information Table serving as the foundational table to record the basic attributes and classification details of each building sample.
The table uses Building_ID as the primary key to ensure each building sample has a unique identifier within the database. Fields such as Cons_number, Origin_ID, and Origin_ID_Name record information on project sources and construction project codes, facilitating data traceability and quality verification in later stages. Company_Name, Company_Address, City, and City_Code reflect the ownership entity and geographic location of the building and can be used for cross-city carbon emission comparisons.
For functional classification, a two-level hierarchical structure is adopted: Category_PID/Category_PName represents the broader building category, while Category_ID/Category_Name specifies the subcategory. This structure enables accurate identification of various public building types and supports the development of emission baseline models based on building use, as well as comparative analysis of energy consumption and emissions by category.
The Building_Area and Number_Of_Energy_Users fields are key input variables for the model, representing the building’s scale (floor area) and the number of service occupants, respectively. These variables are critical for calculating emission intensity per square meter and energy consumption per capita.
(2)
Energy Consumption Data Table
This table records the energy consumption details for each type of energy, as shown in Table 2.
To support the quantitative accounting of carbon emissions during the operational phase of public buildings, this study established an Energy Consumption Data Table within the database to record the energy usage of each building sample across different time periods.
The Energy_ID field serves as the primary key of the table, ensuring that each energy consumption record has a unique identifier. The Building_ID field acts as a foreign key, linking to the primary key in the Building Information Table, enabling the integration and association of energy data with different building samples.
The Energy_Type field identifies the type of energy consumed, such as electricity or gas, and provides the basis for assigning emission factors and calculating carbon emissions.
The Consumption_Amount field records the actual quantity of energy consumed and serves as the direct input for carbon emission calculations. By multiplying this value with the appropriate emission factors, it enables the monthly or yearly estimation, accumulation, and comparison of building-level carbon emissions.
The Year and Month fields provide a temporal dimension, supporting the analysis of seasonal variations in carbon emissions and helping to identify periodic patterns in energy usage behavior. To facilitate aggregated analysis by building function, the table also includes the Category_PName field, which indicates the general functional type of each building. This allows for quick statistical analysis and grouping of energy consumption patterns across different building categories, even without relying on the main table.
(3)
Carbon Emission Factor Table
This table records the carbon emission factors for different types of energy, as shown in Table 3.
To enable accurate carbon emission calculations based on energy activity data, this study developed a Carbon Emission Factor Table to store the emission factors corresponding to different types of energy.
The Energy_ID field serves as the primary key of the table and is structurally linked to the corresponding field in the Energy Consumption Data Table, ensuring that the emission factor for each energy type can be accurately matched and applied during calculation. The Energy_Type field specifies the type of energy, such as electricity or natural gas, and serves as the basis for emission factor matching.
The Emission_Factor field records the carbon emission factor for each type of energy, which is a key parameter for converting energy activity data into carbon emissions during the calculation process.
(4)
Carbon Emission Data Table
This table records the calculated carbon emissions based on energy consumption and emission factors, as well as the carbon emission intensity calculated based on building area, as shown in Table 4.
The Carbon Emission Data Table serves as a key results table within the database framework of this study. It records the calculated carbon emissions for specific time periods, building entities, and energy types. This table integrates building characteristics, energy activity data, carbon emission factors, and benchmark information, providing core data support for applications such as carbon performance evaluation, benchmark comparison, and carbon quota management.
The field Emission_ID provides a unique identifier for each carbon emission record, ensuring traceability and data integrity. Building_Area defines the total floor area of the building, serving as the basis for normalizing emissions by scale. Carbon_Emission captures the total amount of carbon emissions generated from energy consumption, while Carbon_Benchmark offers a reference value derived from policy guidelines or historical baselines for comparison.
The Carbon_Intensity field reflects emissions per unit area, enabling cross-building comparisons regardless of building size. Meanwhile, Benchmark_Intensity represents the standard or expected value for carbon intensity. By comparing actual values against these benchmarks, the dataset supports the identification of high-emission buildings, evaluation of carbon reduction performance, and formulation of differentiated emission control strategies.
(5)
Building Characteristics Information Table
This table is used to systematically record the key attribute variables of each public building and serves as the foundational data support for carbon emission intensity regression analysis, as shown in Table 5.
The Building Characteristics Information Table serves as the key data foundation for the second phase of this study. It systematically records core information on the structural features, usage patterns, and energy activities of each public building. By analyzing these variables, researchers can identify and evaluate the key factors influencing carbon emission intensity during the operational phase of buildings.
Year_Of_Completion reflects the age of the building, helping to assess the impact of construction era on carbon performance. Weekly_Working_Hours records the actual operating hours per week, while Underground_Parking_Area indicates the area of the underground parking space, which is typically associated with additional energy consumption for lighting and ventilation. Heating_Area represents the total area requiring heating, and Cooling_Area indicates the space covered by cooling or air conditioning systems—an important factor in assessing summer electricity loads. Data_Center_Area refers to the area of data centers, which are high-energy-consuming zones and significantly impact total energy use.
Annual_Electricity_Consumption captures the building’s total annual electricity use, serving as a fundamental input for carbon emission calculations. Electricity_Consumption_Per_Unit_Area expresses electricity consumption intensity per square meter, facilitating cross-building comparisons. Annual_Gas_Consumption measures the building’s yearly natural gas use, while Gas_Consumption_Per_Unit_Area indicates gas consumption intensity per unit area—both being essential parameters in carbon accounting. Energy_Users_Per_Unit_Area reflects the density of energy users per square meter, offering insight into how occupant concentration may relate to energy demand.

4.5. Carbon Emission Data Visualization and Analysis

Based on the previous research methodology and carbon emission database framework, this study selects City A as the demonstration area. It should be noted that although the current research is based on data collected from City A, the proposed database model is designed to have broad applicability. It adopts a modular and scalable architecture that supports various building types and can be adapted to different cities or regions. Meanwhile, the model is built upon a standardized system of building classification, data processing procedures, and carbon emission accounting methods, ensuring strong replicability and scalability and can be extended to other areas by adjusting key parameters such as carbon emission factors. Therefore, the model not only reflects the characteristics of buildings in City A but also provides a transferable framework for future applications in other regions, facilitating large-scale comparative studies and regional carbon management strategies.
Through surveys, building information and energy consumption data were collected, covering a total of 184 samples. After data processing and filtering, 151 valid samples were identified and input into the database for visualization and analysis.

4.5.1. Sample Distribution

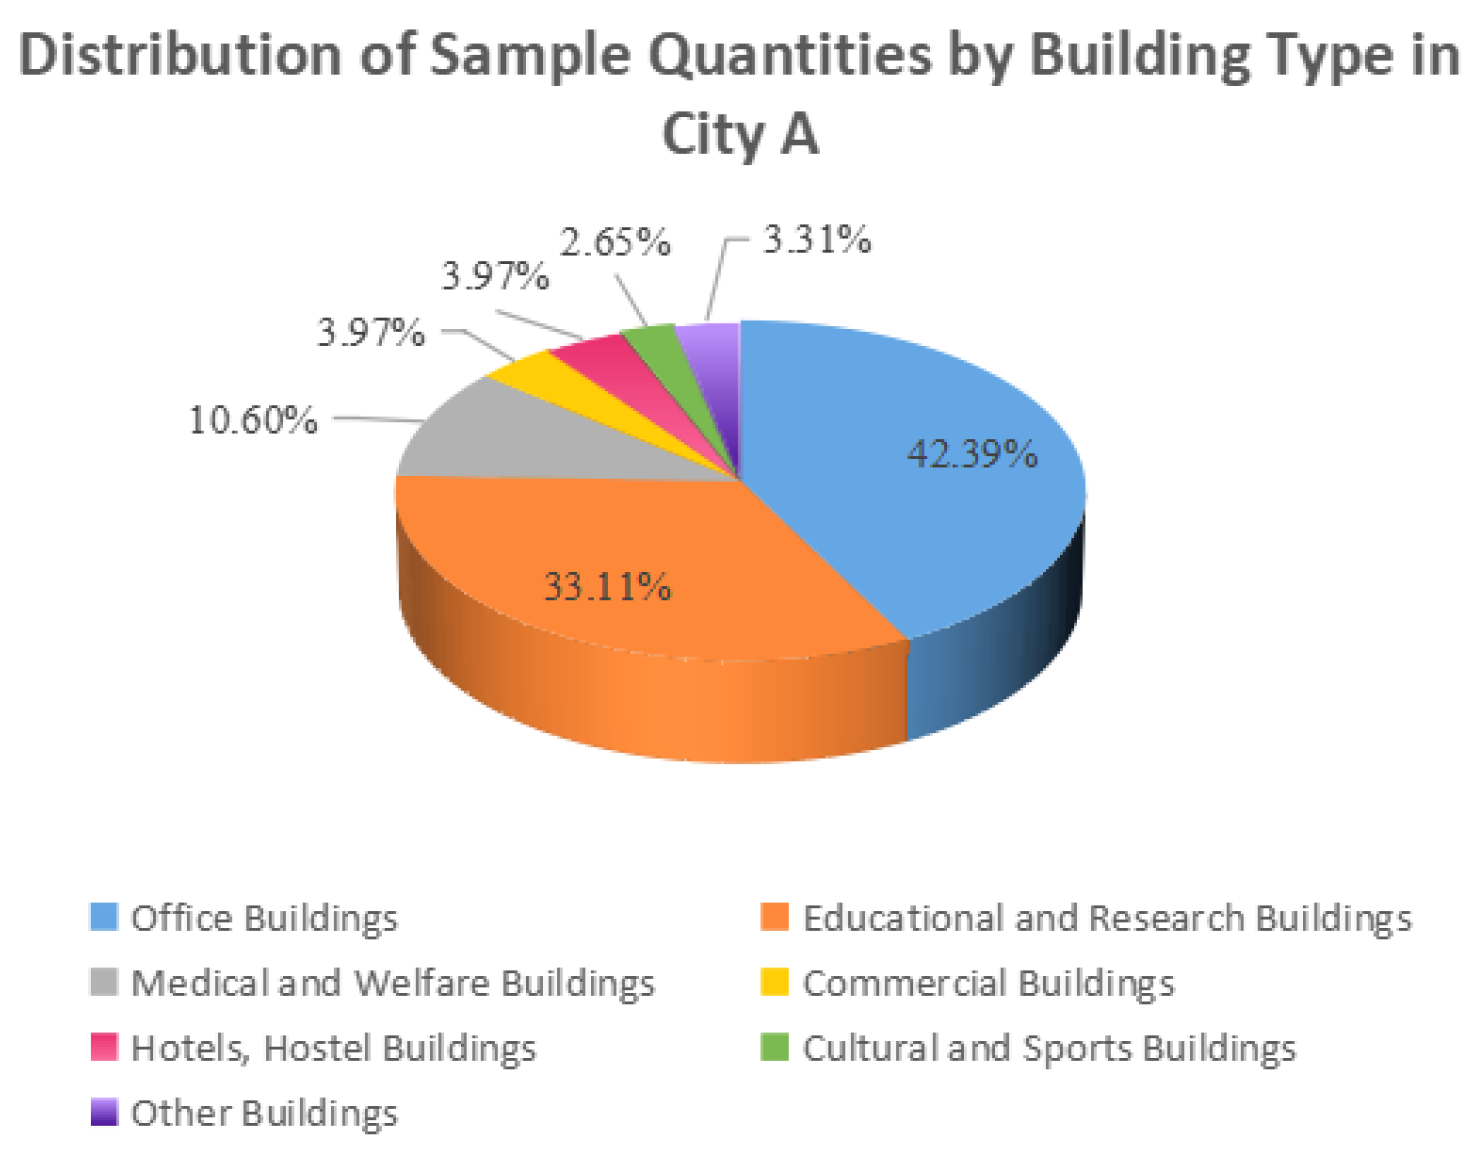
Figure 2 shows that in the sample dataset of City A, office buildings, educational and research buildings, and medical and welfare buildings account for 42.38%, 33.11%, and 10.6%, respectively. The remaining building types have a relatively smaller proportion in the sample.

4.5.2. Total Carbon Emission Distribution

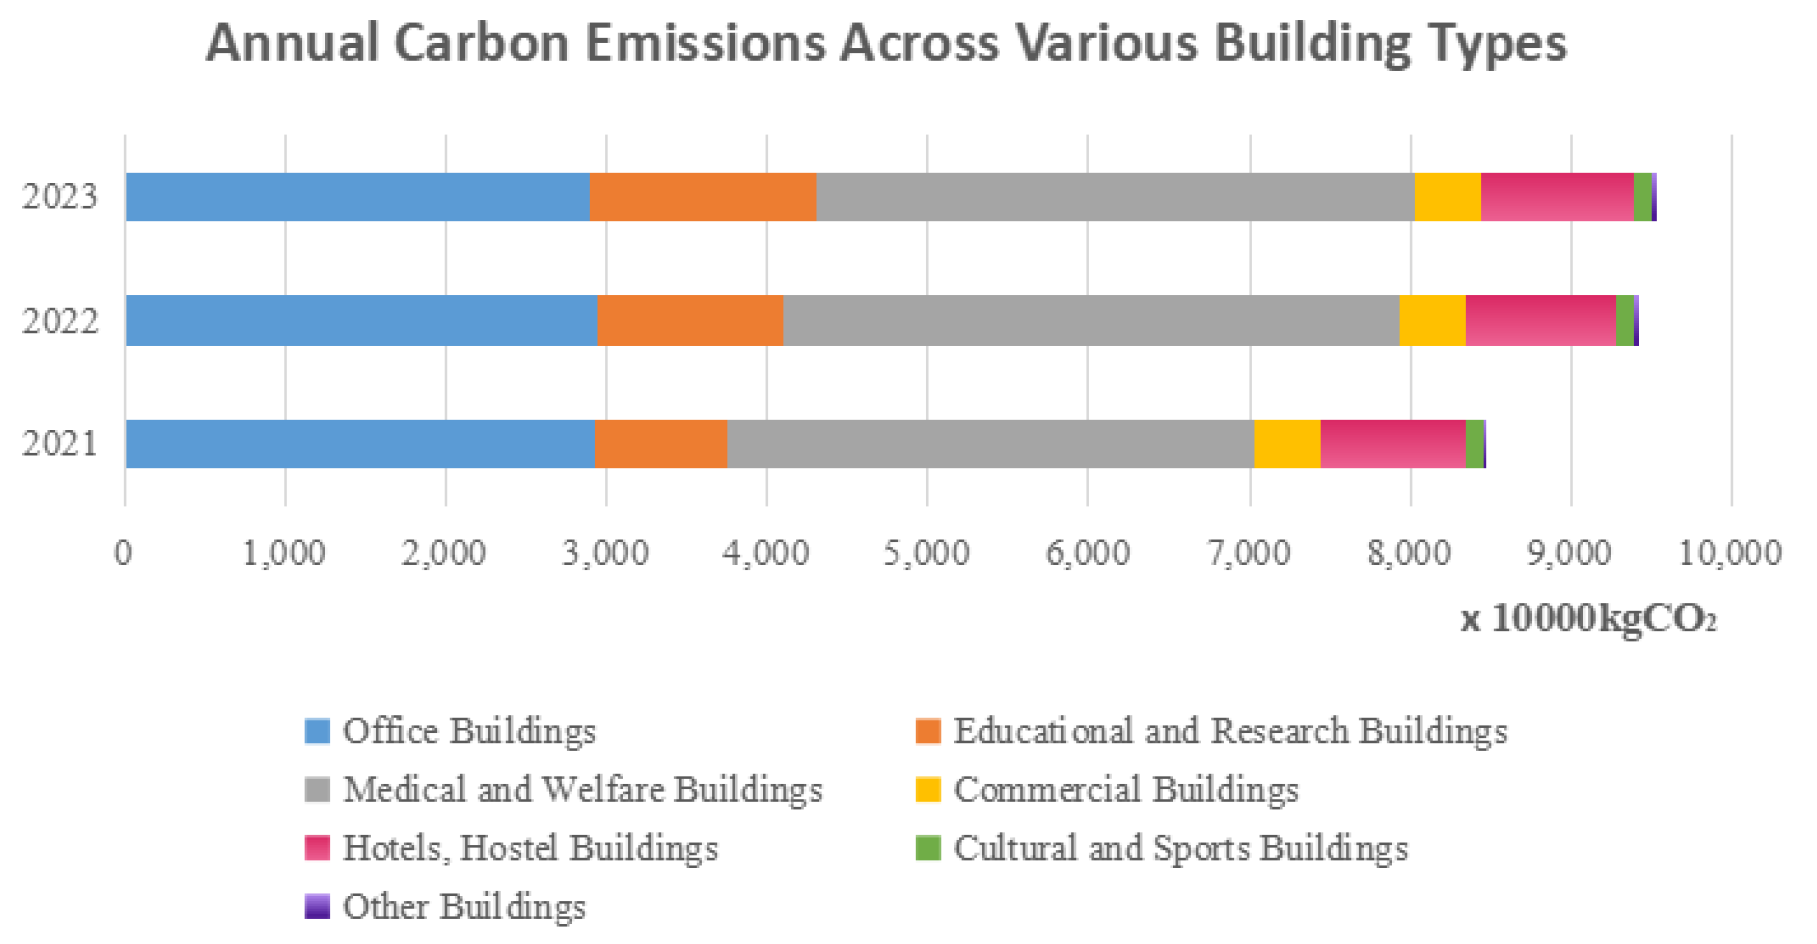
As shown in Figure 3, the total carbon emissions and distribution of various building types from 2021 to 2023 exhibit a gradual upward trend. Among the surveyed samples, medical and welfare buildings have the highest total emissions, despite having a relatively small number of samples (16 buildings). For example, in 2023, the total carbon emissions of medical and welfare buildings reached 37.24 million kgCO2, while office buildings (64 buildings) recorded 28.9 million kgCO2 in the same year.
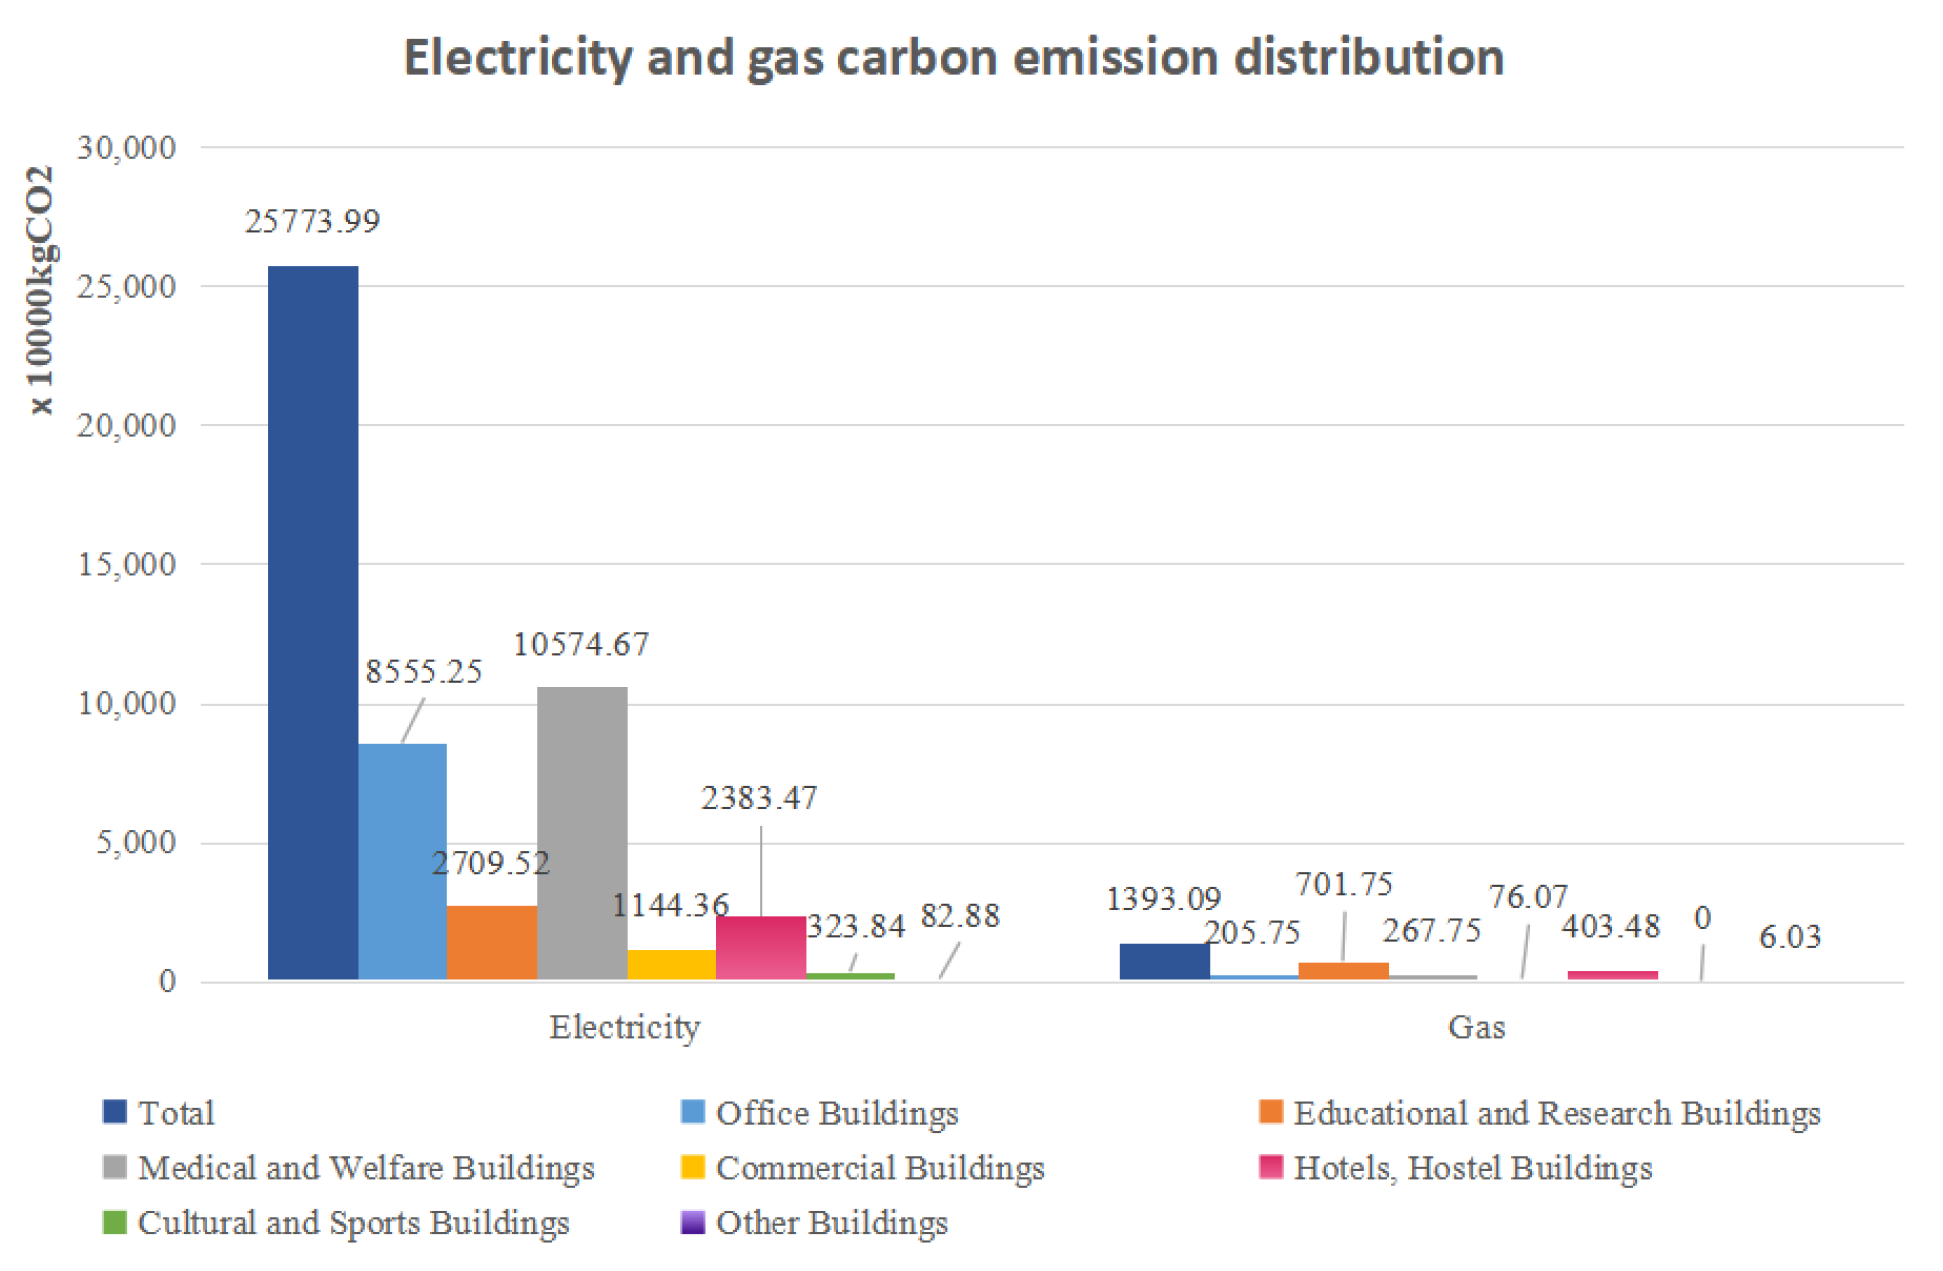
As shown in Figure 4, in the selected samples from City A, electricity consumption accounted for approximately 94.87% of the total carbon emissions over the past three years. Across all building types, carbon emissions from electricity consumption were significantly higher than those from gas consumption. For example, in medical and welfare buildings, carbon emissions from electricity reached 105.75 million kgCO2, while carbon emissions from gas were 2.68 million kgCO2.

4.5.3. Carbon Emission Intensity Analysis

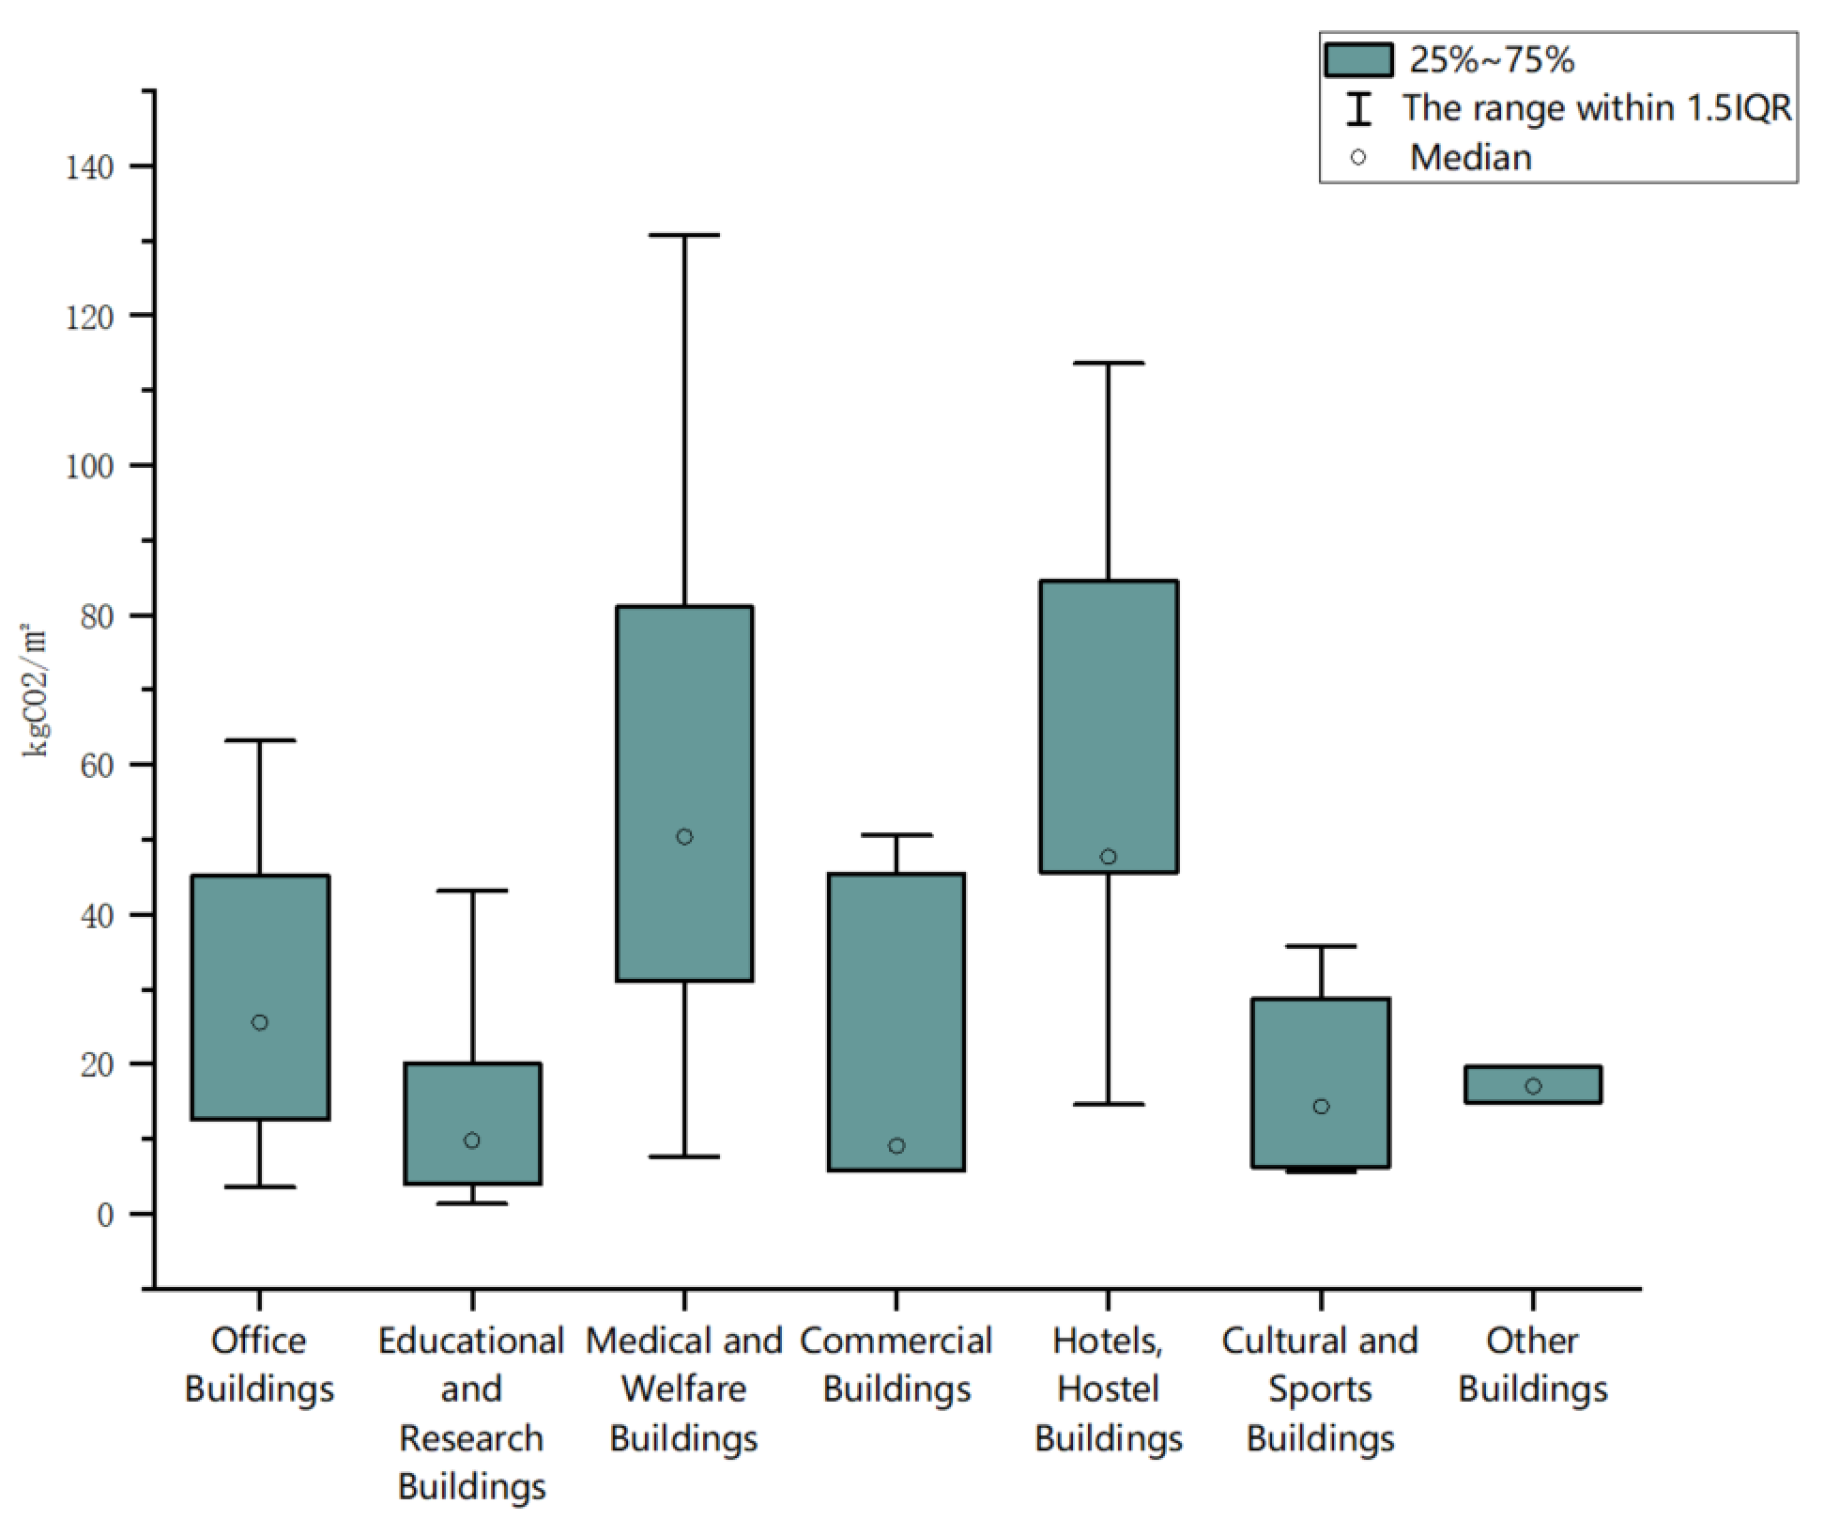
Figure 5 illustrates the distribution of carbon emission intensity across different building types. Considering the wide dispersion of samples, the median is used as the benchmark for carbon emission intensity in each building category. Among them, the median carbon emission intensity for medical and welfare buildings is 50.36 kgCO2/m2, while for hotel and lodging buildings, it is 47.66 kgCO2/m2.
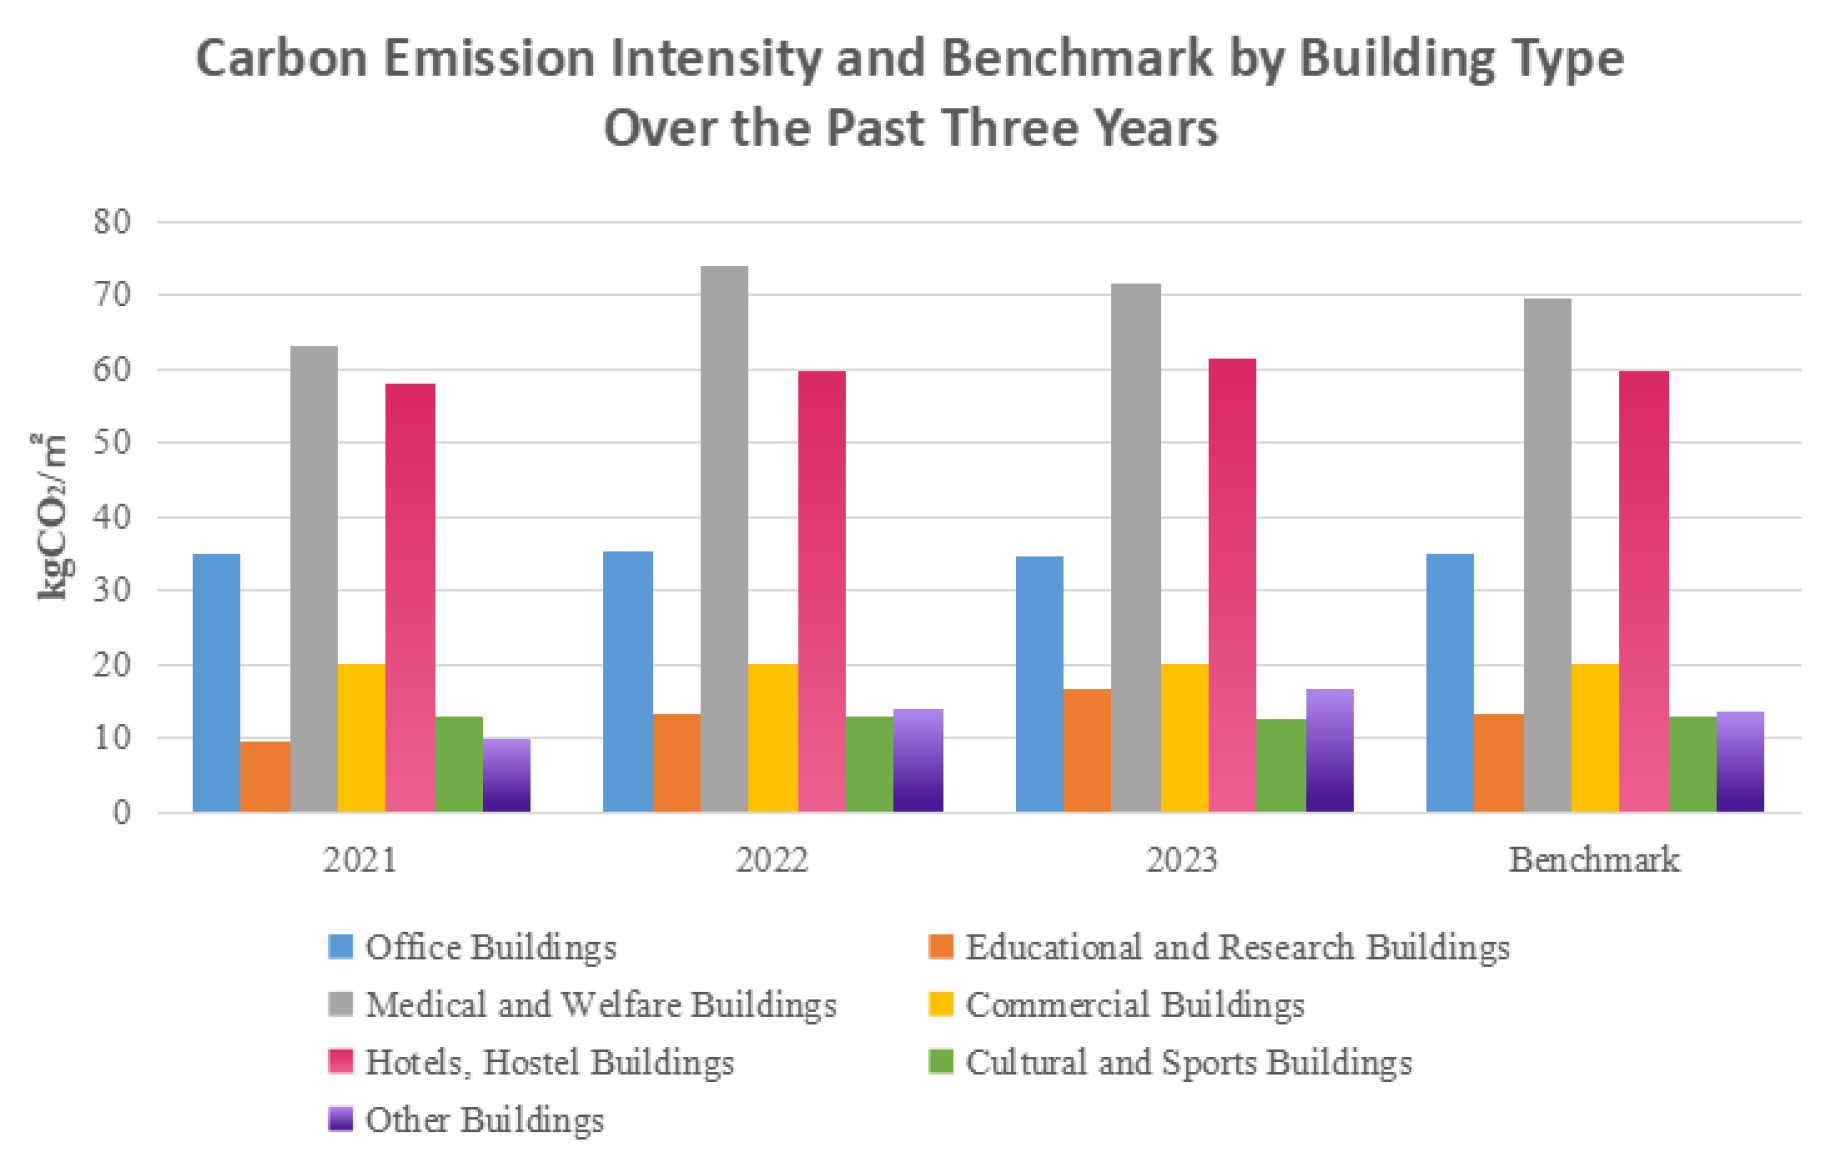
Combining Figure 2, Figure 3, Figure 5 and Figure 6, despite the smaller sample size for medical and welfare buildings and hotels and hostel buildings, their total carbon emissions are significantly high, and they also exhibit higher carbon emission intensity. For instance, in 2023, the carbon emission intensity of medical and welfare buildings reached 71.67 kgCO2/m2, while for hotels and hostel buildings, it was 61.44 kgCO2/m2, both exceeding the benchmark value and showing an upward trend. In contrast, office buildings and educational and research buildings had relatively lower carbon emission intensities, at 34.59 kgCO2/m2 and 16.56 kgCO2/m2, respectively.
This study adopts a multi-sample strategy by incorporating 151 valid samples across seven different building categories (e.g., office buildings). Each category is analyzed separately to extract total carbon emissions and emission intensity specific to that building type. The database also supports multi-dimensional analysis along temporal (year), spatial (city), and categorical (building type) axes, thereby ensuring the validity of multi-dimensional insights.
Based on the current sample data, energy-saving and carbon reduction efforts in the medical sector should be prioritized, while carbon emission trends in office buildings should continue to be monitored.
Due to the limited sample size, the carbon emission intensity of certain building types may lack representativeness, and further data collection and refinement will be conducted in future research. By leveraging quantitative indicators, specific carbon reduction assessment targets can be set for individual buildings, along with guideline and limit values for industry-wide carbon emissions.
Based on the established carbon emission accounting methods and database framework, this study further advances into the second phase of preliminary research. By applying linear regression analysis, key influencing factors are systematically identified, and the baseline model’s reliability and applicability are preliminarily validated using office buildings as a case study.

5. Preliminary Study on Baseline Model Construction

This chapter aims to develop baseline models applicable to different types of public buildings, providing quantitative support for the scientific design of carbon quota allocation and carbon trading mechanisms. The study is based on 214 office building samples collected from real-world data and employs linear regression analysis to systematically identify key variables influencing carbon emission intensity. A multiple linear regression equation is then established to estimate the baseline carbon emission levels for office buildings. The modeling process includes data preprocessing, variable selection, correlation analysis, multicollinearity testing, and stepwise regression modeling, ultimately resulting in a carbon emission intensity estimation model with strong goodness of fit and explanatory power. By comparing the predicted results with actual values, the model’s reliability and applicability are further validated.

5.1. Variable Selection

In this modeling phase, Carbon Emission Intensity Per Unit Area is selected as the dependent variable, and a total of 13 explanatory variables related to building characteristics are considered as candidate variables, with a sample size of 214. The explanatory variables include Building Area, Year of Completion, Weekly Working Hours, Underground Parking Area, Heating Area, Cooling Area, Data Center Area, Annual Electricity Consumption, Annual Electricity Consumption Per Unit Area, Annual Gas Consumption, Annual Gas Consumption Per Unit Area, Number of Energy Users, and Number of Energy Users Per Unit Area.
To clarify the linear relationship between carbon emission intensity and key characteristic variables in office buildings, the next step of this study uses Carbon Emission Intensity Per Unit Area (and its natural logarithm) as the dependent variable and calculates the correlation coefficients between it and each explanatory variable (and their natural logarithms).

5.2. Correlation Analysis

Table 6 presents the correlation coefficients between Carbon Emission Intensity Per Unit Area (and its natural logarithm) and the explanatory variables (and their natural logarithms).

5.3. Multicollinearity Test

When the correlation coefficients between explanatory variables are relatively high, multicollinearity is suspected. In such cases, explanatory variables with lower correlation to the dependent variable are excluded, while those with higher correlation are retained as candidate variables. In this analysis, we use the natural logarithms of both the dependent and explanatory variables, as the results are nearly identical regardless of transformation. A correlation coefficient greater than 0.6 is considered indicative of multicollinearity. The explanatory variables excluded due to multicollinearity are listed in Figure 7, with variables examined in descending order of correlation coefficient. Green indicates explanatory variables, while blue represents the dependent variable. Red highlights pairs of explanatory variables with a correlation coefficient greater than 0.6, indicating multicollinearity. Orange is used to show the correlation coefficients between each of the two explanatory variables and the dependent variable when the correlation between the two explanatory variables exceeds 0.6.
LN (Annual Gas Consumption) and LN (Annual Gas Consumption Per Unit Area)
The correlation coefficient between LN (Annual Gas Consumption) and LN (Annual Gas Consumption Per Unit Area) is 0.722, indicating multicollinearity. The variable LN (Annual Gas Consumption), which has a lower correlation with the dependent variable, is excluded.
LN (Number of Energy Users) and LN (Number of Energy Users Per Unit Area)
The correlation coefficient between LN (Number of Energy Users) and LN (Number of Energy Users Per Unit Area) is 0.760, indicating multicollinearity. The variable LN (Number of Energy Users), which has a lower correlation with the dependent variable, is excluded.
Based on the multicollinearity analysis, Table 7 lists the candidate explanatory variables included in the multiple regression analysis. Variables shown in gray were excluded due to multicollinearity. In the multiple regression analysis, the candidate explanatory variables for Carbon Emission Intensity Per Unit Area and its natural logarithm are highlighted in green. Variables with equal correlation coefficients are highlighted in yellow; in such cases, LN (Year of Completion) is selected as the candidate variable.
When constructing the linear regression equation, the guiding principle is to select the form of each explanatory variable—either the original value or its natural logarithm—based on which has a higher correlation coefficient with the dependent variable. Based on the results in Table 7, explanatory variables with a correlation coefficient lower than 0.100 with the dependent variable are further excluded. For example, when the dependent variable is Carbon Emission Intensity Per Unit Area, all effective explanatory variables have correlation coefficients greater than 0.100, so no variables are excluded. However, when the dependent variable is LN (Carbon Emission Intensity Per Unit Area), LN (Year of Completion), LN (Weekly Working Hours), and Underground Parking Area are excluded due to correlation coefficients below 0.100.

5.4. Results of Multiple Regression Analysis

Based on the effective explanatory variables retained through the above correlation analysis and multicollinearity testing, the subsequent multiple regression analysis adopts the stepwise method (where variables with an F-value equal to or greater than 2 are considered effective explanatory variables), as shown in Table 8 and Table 9. The explanatory variables used in the multiple regression equations and the adjusted coefficient of determination (R2) are summarized in Table 10.
When the dependent variable is Carbon Emission Intensity Per Unit Area, the effective explanatory variables are as follows: Building Area, LN (Year of Completion), Weekly Working Hours, LN (Underground Parking Area), Heating Area, Cooling Area, LN (Data Center Area), LN (Annual Electricity Consumption), Annual Electricity Consumption Per Unit Area, Annual Gas Consumption Per Unit Area, and LN (Number of Energy Users Per Unit Area). The adjusted coefficient of determination (R2) is 0.812.
When the dependent variable is LN (Carbon Emission Intensity Per Unit Area), the effective explanatory variables are as follows: Building Area, Heating Area, Cooling Area, LN (Data Center Area), LN (Annual Electricity Consumption), Annual Electricity Consumption Per Unit Area, Annual Gas Consumption Per Unit Area, and LN (Number of Energy Users Per Unit Area). The adjusted R2 is 0.754.

5.5. Multiple Regression Equation

When the dependent variable is Carbon Emission Intensity Per Unit Area, the multiple regression equation is as follows:
y1 = 2345.5 − 2.5 × 10−5X1 − 310.536X2 – 5 × 10−4X3 − 0.0021X4 + 1.5 × 10−5X5 − 1.9 × 10−5X6 − 0.546X7 + 2.224X8 + 0.446X9 + 2.156X10 + 1.063X11
When the dependent variable is LN (Carbon Emission Intensity Per Unit Area), the multiple regression equation is as follows:
y2 = −0.459 − 1.115 × 10−5X1 − 1.13 × 10−5X2 − 1.19 × 10−6X3 − 0.018X4 + 0.276X5 + 0.012X6 + 0.053X7 + 0.081X8

5.6. Comparison Between Actual Values and Predicted Values from the Multiple Regression Equation

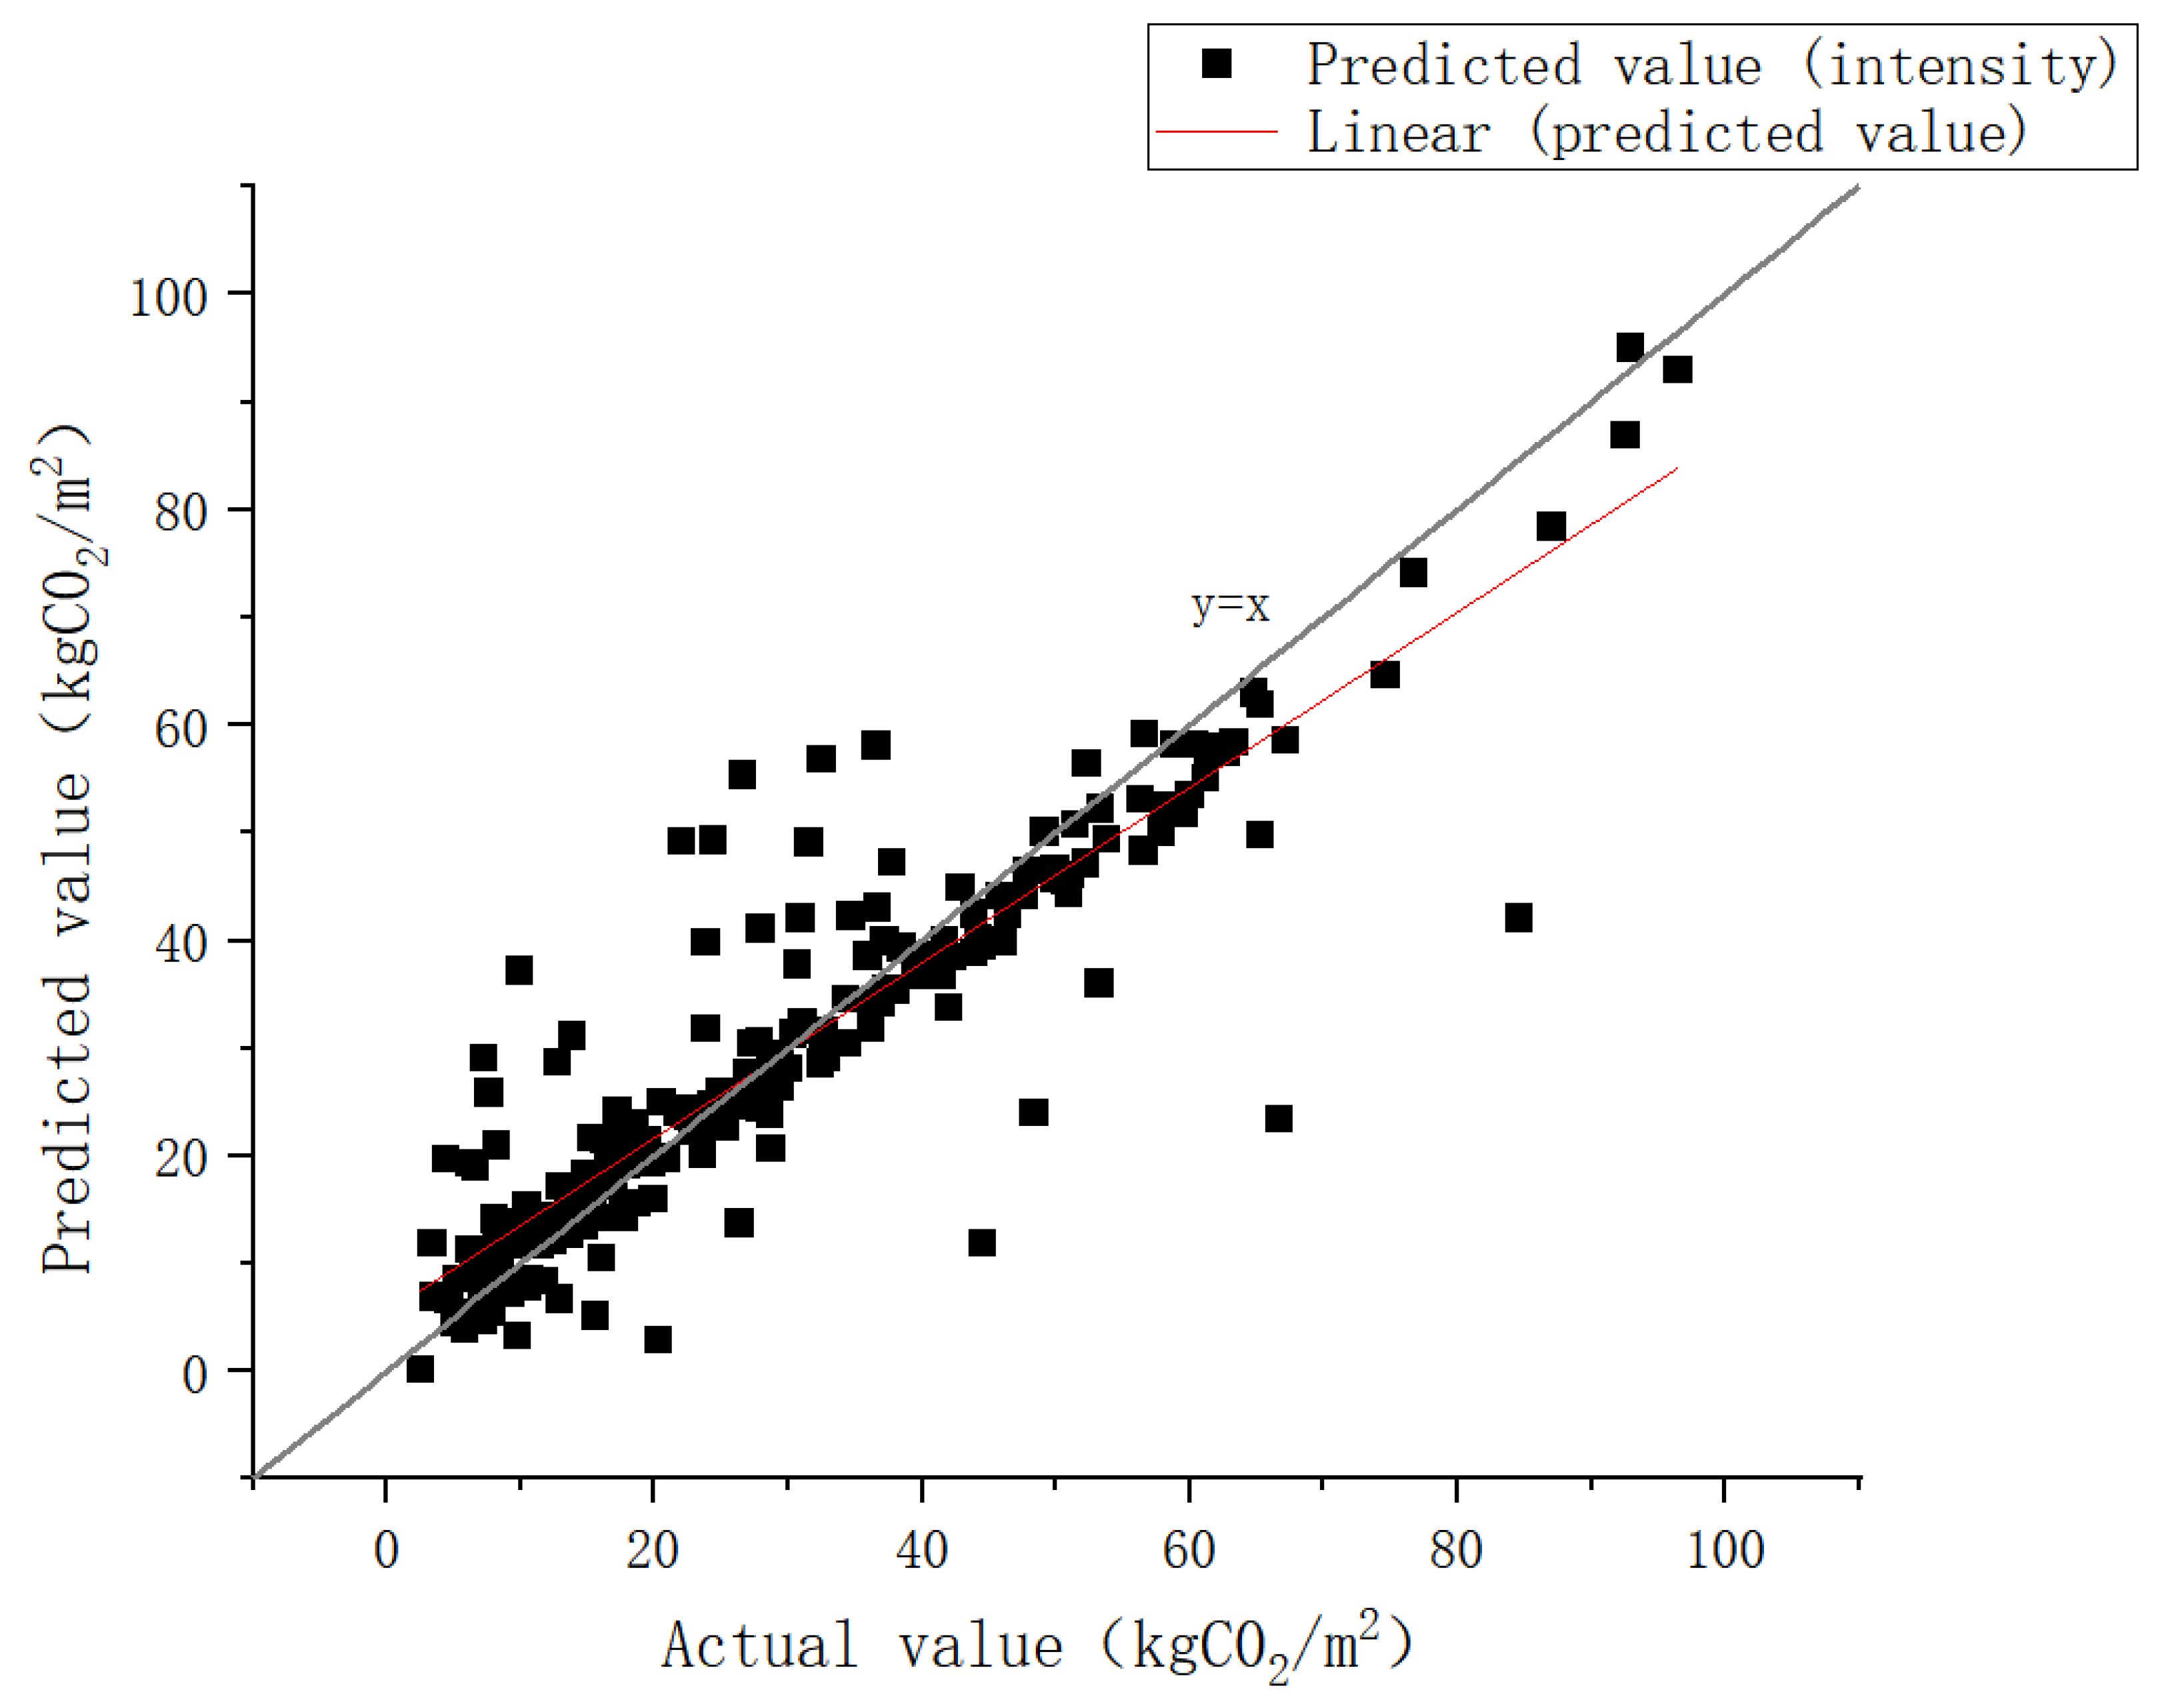
Figure 8 shows the scatter plot and fitted regression line between the actual values of Carbon Emission Intensity Per Unit Area (x-axis) and the predicted values from the regression model (y-axis).
The figure illustrates the comparison between the actual values of Carbon Emission Intensity Per Unit Area and the predicted values calculated by the multiple regression equation. When the actual intensity values range between 0 kgCO2/m2 and 50 kgCO2/m2, the predicted values are relatively close to the actual values, indicating high estimation accuracy. However, as the actual values increase, the deviation between the actual and predicted values tends to grow. When the actual value exceeds 60 kgCO2/m2, both the accuracy and reliability of the predictions decline. The coefficient of determination (R2) of the multiple regression equation is 0.813, and the adjusted R2 is 0.812.
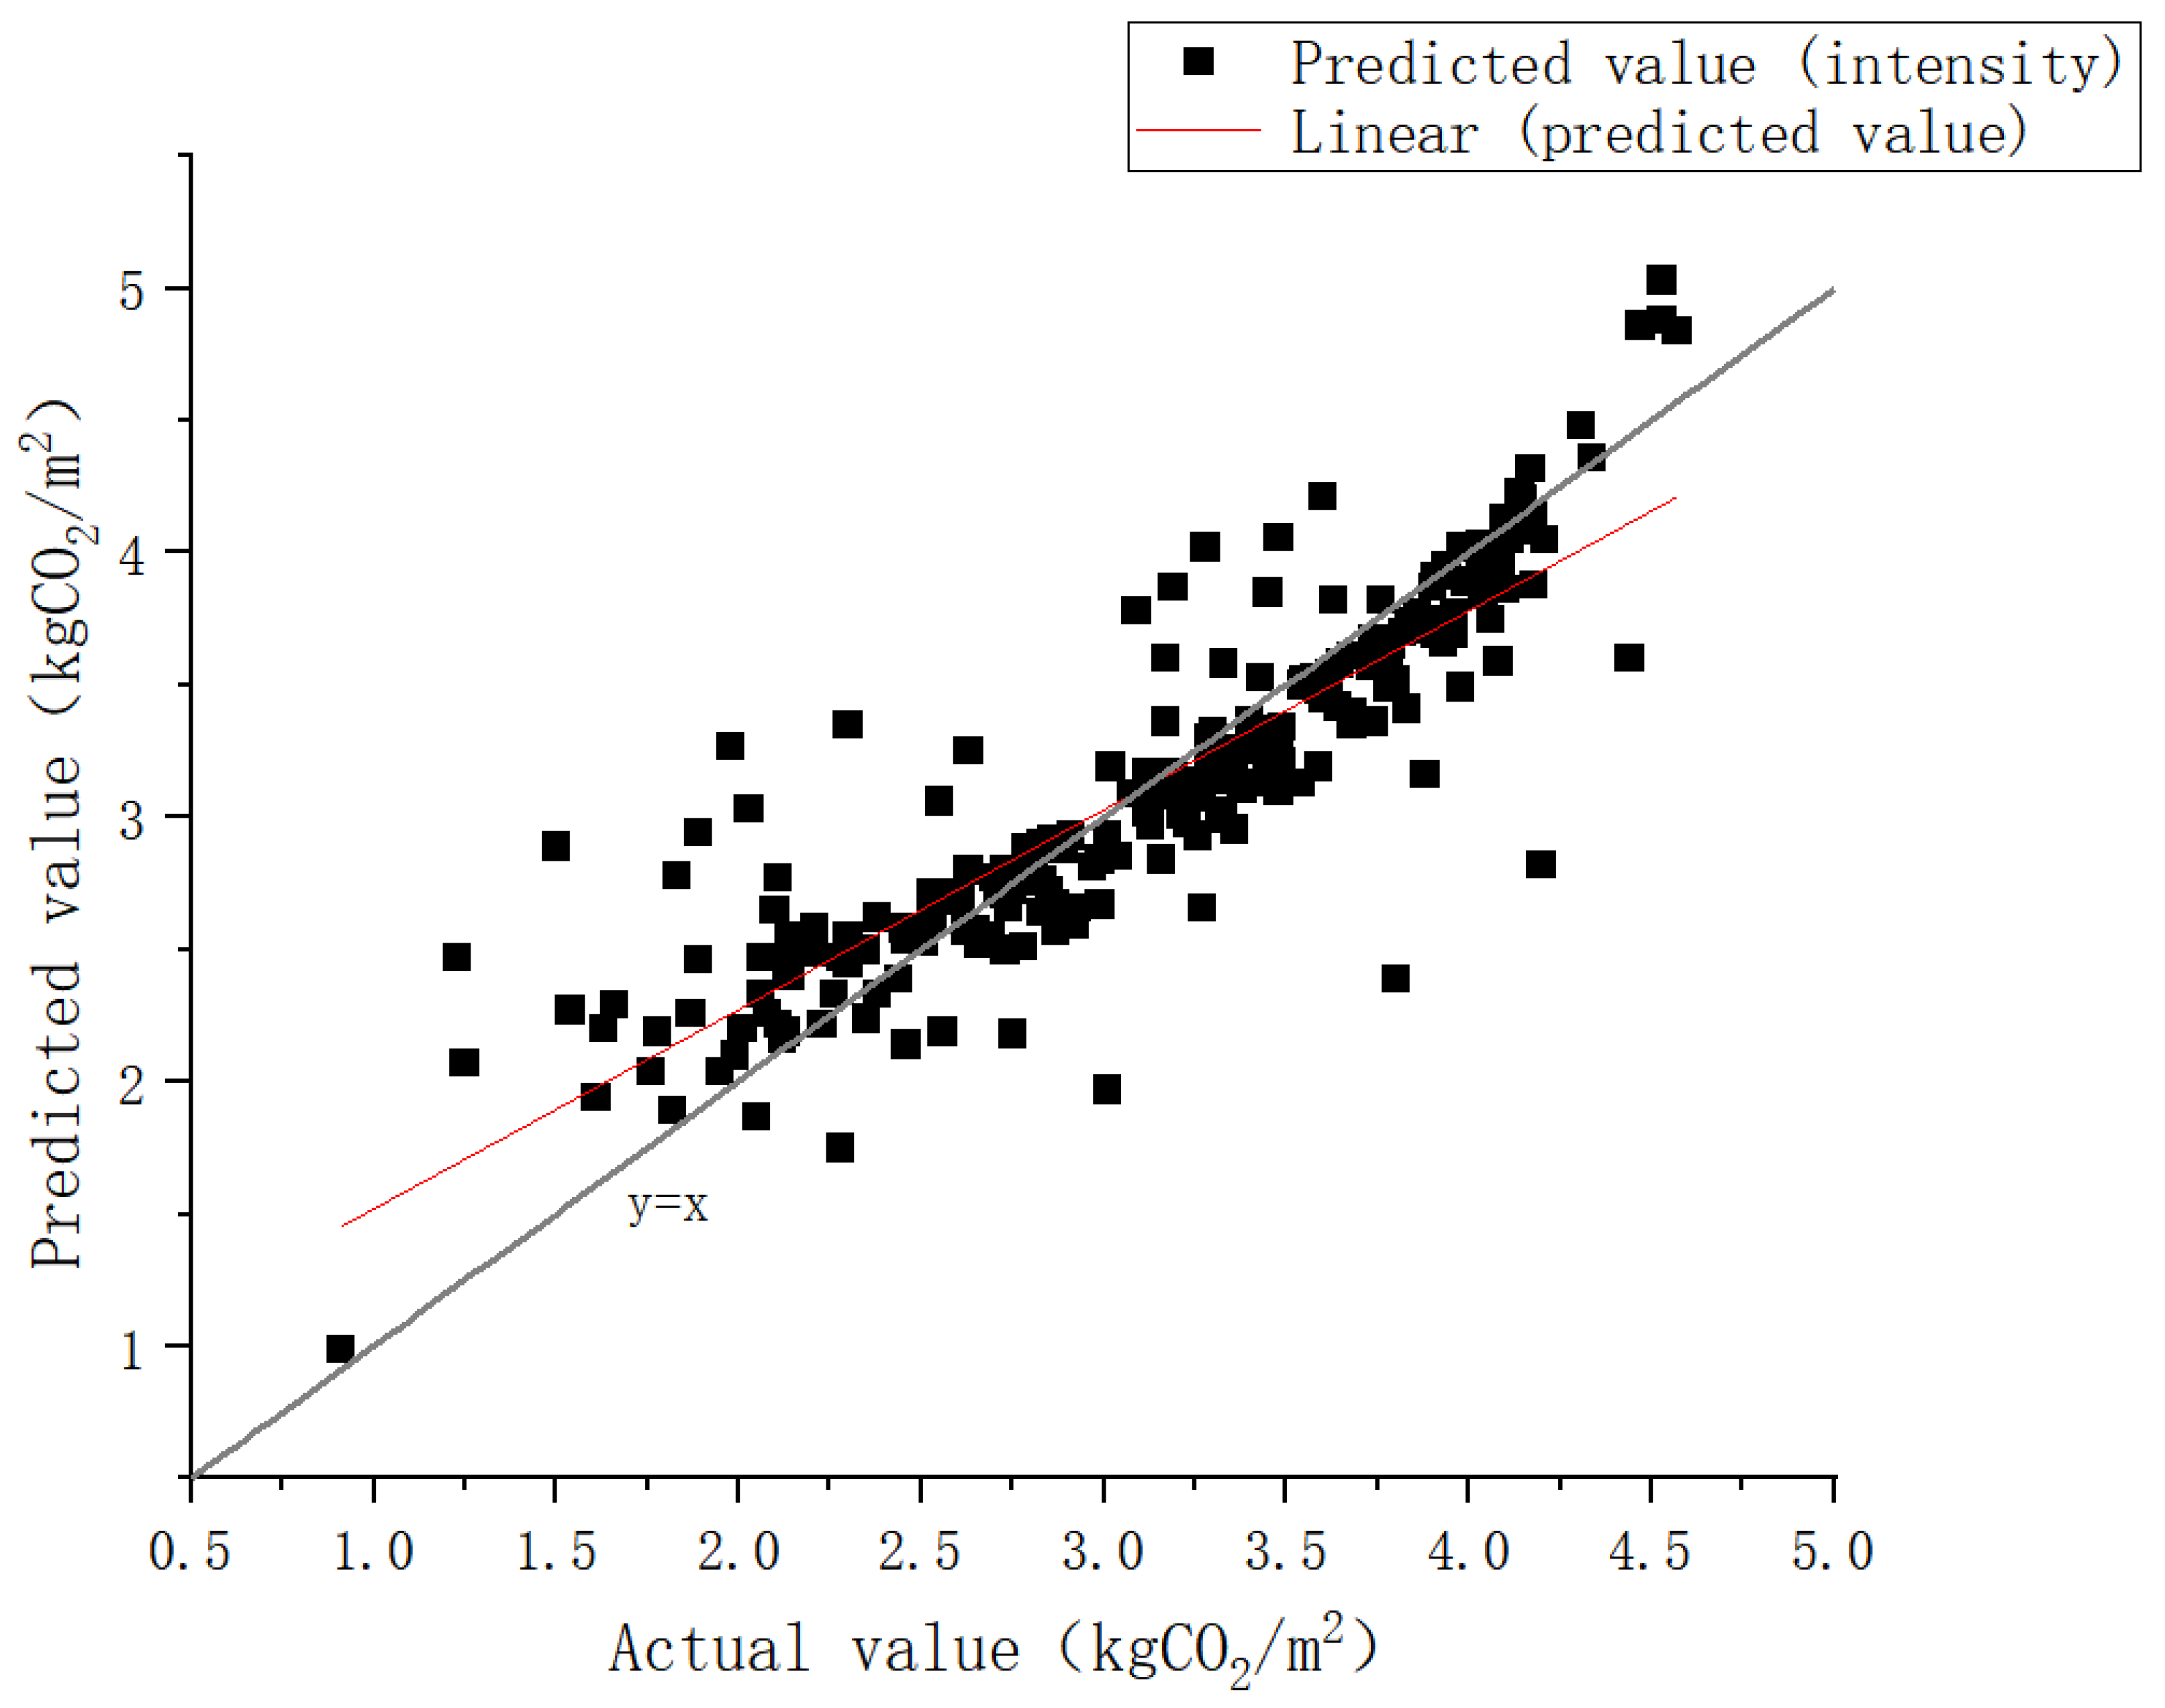
Figure 9 presents the scatter plot and fitted regression line between the actual values of LN (Carbon Emission Intensity Per Unit Area) (x-axis) and the predicted values from the regression model (y-axis).
The figure shows the comparison between the actual values of LN (Carbon Emission Intensity Per Unit Area) and the predicted values calculated by the multiple regression equation. When the actual natural logarithm of intensity ranges from 2.0 kgCO2/m2 to 4.5 kgCO2/m2, the predicted values closely match the actual values, indicating high estimation accuracy. However, as the actual values increase, the error between predicted and actual values also tends to rise. When the actual value exceeds 4.5 kgCO2/m2, both the accuracy and reliability of the predictions decline. The coefficient of determination (R2) of the multiple regression equation is 0.756, and the adjusted R2 is 0.754.

6. Conclusions

This study addresses the challenge of collecting baseline carbon emission data for regional public buildings by proposing and constructing a carbon emission database model based on actual electricity and gas consumption data. The aim is to achieve more accurate quantification and analysis of carbon emission characteristics across various types of public buildings during their operational phase. From a top-level design perspective, the study establishes a comprehensive methodological framework encompassing “Data Encoding—Preliminary Screening—Building Type Classification—Data Processing—Carbon Emission Calculation—Database Construction—Results Analysis.”
Specifically, the methodology includes the following: developing a standardized sample coding system to ensure data traceability and consistency; combining automated data screening with manual verification to effectively eliminate low-quality or erroneous data and ensure the reliability of subsequent analyses; integrating multi-source data from power companies and housing authorities, enabling emission accounting to be based on actual operational data rather than estimations, thereby improving the accuracy and timeliness of emission intensity calculations; formulating a standardized building classification scheme based on functional use, categorizing buildings into seven typical public building types; applying data cleaning, outlier removal, and anomaly detection to enhance data quality; utilizing the emission factor method to calculate carbon emissions from electricity and gas consumption during building operation; and establishing a structured database framework comprising a Building Information Table, Energy Consumption Data Table, Carbon Emission Factor Table, Carbon Emission Data Table, and Building Characteristics Information Table.
The resulting database supports multi-dimensional emission analysis across time periods, building categories, and geographic regions. It enables dynamic calculation and visualization of both total carbon emissions and emission intensity, while also providing a solid data foundation and methodological support for future applications such as baseline setting and carbon reduction potential assessment. Through the implementation of this systematic approach, this study not only fills a gap in operational-stage public building carbon emission research but also offers a sustainable and replicable technical pathway for the development of regional carbon management platforms.
Building on this foundation, this research has entered its second phase of preliminary exploration. Using office buildings as representative samples, a baseline modeling study of carbon emission intensity was conducted based on multiple linear regression. Key influencing factors such as Building Area, Heating Area, and Cooling Area were identified, and a carbon emission intensity prediction equation was established. The regression model demonstrated strong goodness of fit and explanatory power, laying a theoretical and practical foundation for extending baseline definition and quota allocation mechanisms to other building types in the future.
Compared to most existing carbon emission database models, the model proposed in this study offers several significant advantages:
(1)
It is based on actual energy activity data, which enhances the accuracy and timeliness of carbon emission analysis during the operational phase of buildings.
(2)
It incorporates a multi-dimensional data structure that supports emission analysis and comparison across multiple dimensions—including time (comparing total emissions and emission intensity across different years), space (horizontal comparisons between cities), and category (analysis by building type).
(3)
It adopts a modular and scalable architecture, allowing for regional adaptation by adjusting parameters such as carbon emission factors.
In contrast to the static nature and limited scope of traditional databases, the proposed model is better suited to support future needs in building carbon management and policy development.
Future research should focus on expanding the data collection scope and improving data quality by optimizing data acquisition methods to minimize energy underreporting. Additionally, to enhance the efficiency and accuracy of data processing, automated and intelligent tools should be introduced to handle large-scale datasets. These improvements will further enhance the accuracy and usability of the public building carbon emission database model.

Author Contributions

Conceptualization, F.Z., W.B. and X.R.; methodology, Y.G., X.Z. and X.R.; software, X.Z.; validation, X.P.; formal analysis, W.W., H.W. and H.Y.; investigation, H.W.; resources, Y.H.; data curation, W.W. and Y.H.; writing—original draft, Y.G. and W.B.; visualization, X.Z. and W.W.; supervision, F.Z. All authors have read and agreed to the published version of the manuscript.

Funding

This research received no external funding.

Data Availability Statement

The original contributions presented in the study are included in the article, further inquiries can be directed to the corresponding author.

Conflicts of Interest

Authors Yue Guo, Xin Zheng, Wei Wei, Yuancheng He and Xiang Peng were employed by Marketing Service Center (Metering Center), State Grid Hubei Electric Power Co., Ltd. Authors Fei Zhao, Hailong Wu, Wenxin Bi and Hongyang Yan were employed by China State Construction Engineering Design & Research Institute Co., Ltd. The remaining author declares that the research was conducted in the absence of any commercial or financial relationships that could be construed as a potential conflict of interest.

References

  1. Raza, M.S.; Khahro, S.H.; Memon, S.A.; Ali, T.H.; Memon, N.A. Global trends in research on carbon footprint of buildings during 1971–2021: A bibliometric investigation. Environ. Sci. Pollut. Res. Int. 2021, 28, 63227–63236. [Google Scholar] [CrossRef] [PubMed]
  2. China Association of Building Energy Efficiency, Special Committee on Building Energy Consumption and Carbon Emission Data 2023. 2023 China Building and Urban Infrastructure Carbon Emission Research Report, Chongqing. Available online: https://mhuanbao.in-en.com/html/huanbao-2384668.shtml (accessed on 21 February 2025).
  3. Kibert, C.J. Sustainable Construction: Green Building Design and Delivery, 4th ed.; Wiley: New York, NY, USA, 2016. [Google Scholar]
  4. Wang, Q.; Jia, X.; Zhao, Y.; Zhou, H.; Zhang, X.; Lin, B.; Zhang, C. A building operational carbon emissions database of 362 Chinese cities: Construction process and spatiotemporal characteristic analysis. Dev. Built Environ. 2024, 20, 100546. [Google Scholar] [CrossRef]
  5. Lu, K.; Wang, H. Estimation of Building’s Life Cycle Carbon Emissions Based on Life Cycle Assessment and Building Information Modeling: A Case Study of a Hospital Building in China. J. Geosci. Environ. Prot. 2019, 7, 147–165. [Google Scholar] [CrossRef]
  6. Yang, L.; Zhang, N.; Lu, M.; Luo, Z.; Dou, M. Study on carbon emission calculation method and carbon reduction indexes of urban building stock. Sci. China Technol. Sci. 2024, 67, 2706–2726. [Google Scholar] [CrossRef]
  7. Xiong, L.; Wang, M.; Mao, J.; Huang, B. A Review of Building Carbon Emission Accounting Methods under Low-Carbon Building Background. Buildings 2024, 14, 777. [Google Scholar] [CrossRef]
  8. Chen, Y.; Wu, Y.; Chen, N.; Kang, C.; Du, J.; Luo, C. Calculation of Energy Consumption and Carbon Emissions in the Construction Stage of Large Public Buildings and an Analysis of Influencing Factors Based on an Improved STIRPAT Model. Buildings 2022, 12, 2211. [Google Scholar] [CrossRef]
  9. Liang, Y.; Pan, Y.; Yuan, X.; Yang, Y.; Fu, L.; Li, J.; Sun, T.; Huang, Z.; Kosonen, R. Assessment of operational carbon emission reduction of energy conservation measures for commercial buildings: Model development. Energy Build. 2022, 268, 112189. [Google Scholar] [CrossRef]
  10. Ministry of Housing and Urban-Rural Development of the People’s Republic of China; General Administration of Quality Supervision, Inspection and Quarantine of the People’s Republic of China. Terminology Standard for Civil Building Design (GB/T 50504 2009); China Planning Press: Beijing, China, 2009. [Google Scholar]
  11. Ministry of Housing and Urban-Rural Development of the People’s Republic of China. Unified Standard for Design of Civil Buildings (GB 50352-2019); China Architecture & Building Press: Beijing, China, 2019. [Google Scholar]
  12. Zhou, H.; Tian, X.; Zhao, Y.; Chang, C.; Lin, B. Investigation of policy tools for energy efficiency improvement in public buildings in China—Current situation, obstacles, and solutions. City Built Environ. 2024, 2, 2. [Google Scholar] [CrossRef]
  13. Gong, T.; Zhang, W.; Liang, J.; Lin, C.; Mao, K. Forecast and Analysis of the Total Amount of Civil Buildings in China in the Future Based on Population Driven. Sustainability 2021, 13, 14051. [Google Scholar] [CrossRef]
  14. Jiang, P. Analysis of national and local energy-efficiency design standards in the public building sector in China. Energy Sustain. Dev. 2011, 15, 443–450. [Google Scholar] [CrossRef]
  15. Yu, Y.; You, K.; Cai, W.; Feng, W.; Li, R.; Liu, Q.; Chen, L.; Liu, Y. City-level building operation and end-use carbon emissions dataset from China for 2015–2020. Sci. Data 2024, 11, 138. [Google Scholar] [CrossRef] [PubMed]
  16. Zhang, Y.; Sattar, S.; Cook, D.; Johnson, K.; Fung, J. Systematic Review of Embodied Carbon Assessment and Reduction in Building Life Cycles. NIST Spec. Publ. 2024. Available online: https://nvlpubs.nist.gov/nistpubs/SpecialPublications/NIST.SP.1324.pdf (accessed on 21 February 2025).
  17. Lützkendorf, T.; Balouktsi, M. Embodied carbon emissions in buildings: Explanations, interpretations, recommendations. Build. Cities 2022, 3, 964–973. [Google Scholar] [CrossRef]
  18. Mohan, S.; Vijayalaxmi, J. Embodied and Operational Carbon in Buildings: Strategies to Decarbonize, 1st ed.; Springer: Singapore, 2024. [Google Scholar]
  19. Long, J.; Yu, Q.; Wu, T. Discussion on the construction of a carbon emission database for the whole life cycle of construction projects under big data in Guizhou. In Proceedings of the 2016 Annual Conference of the Engineering Management Research Branch of the Architectural Society of China, Guiyang, China, 1 July 2016; pp. 144–148. [Google Scholar]
  20. Zhang, R.; Zhang, H.; Hei, S.; Ye, H. Research on Database Construction and Calculation of Building Carbon Emissions Based on BIM General Data Framework. Sustainability 2023, 15, 10256. [Google Scholar] [CrossRef]
  21. Zhang, B.; Li, D.; Cui, P.; Ou, X. Research on the introduction of foreign building carbon emission databases. Architecture 2015, 14, 30–32. [Google Scholar]
  22. Chen, J.; Bao, W.; Chen, L. Research on carbon emission evaluation database and tools. Qual. Certif. 2014, 1, 56–58. [Google Scholar]
  23. Lu, K.; Deng, X.; Zhang, Y.; Jiang, X.; Cheng, B.; Tam, V.W.Y. Extensible carbon emission factor database: Empirical study for the Chinese construction industry. Environ. Sci. Pollut. Res. Int. 2024, 31, 41482–41501. [Google Scholar] [CrossRef]
  24. Li, Q.-Q.; Su, Y.; Shang, L.; Wei, W.; Wang, M.-H. Comparative analysis of international typical carbon databases for China’s carbon emission accounting. Adv. Clim. Change Res. 2018, 14, 275–280. [Google Scholar]
  25. Cullen, L.; Marinoni, A.; Cullen, J. Machine learning for gap-filling in greenhouse gas emissions databases. J. Ind. Ecol. 2024, 28, 636–647. [Google Scholar] [CrossRef]
  26. Cui, Y. Research on Carbon Emission Characteristics and Analysis Model of Public Buildings. Ph.D. Thesis, Beijing University of Civil Engineering and Architecture, Beijing, China, 2018. [Google Scholar]
  27. Dongmei, S. Research and Application of Energy Consumption Benchmarking Method for Public Buildings Based on Actual Energy Consumption. Energy Procedia 2018, 152, 475–483. [Google Scholar] [CrossRef]
  28. Guo, Z.; Wang, X.; Luo, X.; Zhao, N.; Wang, Q. Study on carbon emission influencing factors of green public buildings over the whole life cycle—A case study of hot summer and cold winter regions. Build. Sci. 2024, 40, 12–18+29. [Google Scholar]
  29. Huang, B.; Cui, H.; Song, J.; Yu, H. Study on building carbon emission accounting in Shanghai. J. Univ. Shanghai Sci. Technol. 2022, 44, 343–350. [Google Scholar]
  30. Liu, W.; Mei, H.; Zhao, C. Research on carbon emission quantification methods and carbon reduction strategies for large-space public buildings under the background of carbon neutrality. Contemp. Archit. 2023, 126–129. [Google Scholar]
  31. Bribián, I.Z.; Capilla, A.V.; Usón, A.A. Life cycle assessment of building materials: Comparative analysis of energy and environmental impacts and evaluation of the eco-efficiency improvement potential. Build. Environ. 2011, 46, 1133–1140. [Google Scholar] [CrossRef]
  32. Zhang, H. Life cycle costing analysis of deep energy retrofits of a mid-rise building to understand the impact of energy conservation measures. arXiv 2023, arXiv:2304.00456. [Google Scholar]
  33. Suzuki, M.; Oka, T.; Okada, K. The estimation of energy consumption and CO2 emission due to housing construction in Japan. Energy Build. 1995, 22, 165–169. [Google Scholar] [CrossRef]
  34. Ministry of Housing and Urban-Rural Development of the People’s Republic of China & State Administration for Market Regulation of the People’s Republic of China. National Standard of the People’s Republic of China: Building Terminology Standard (Draft for Comments); China Architecture Design & Research Group: Beijing, China, 2021. [Google Scholar]
  35. Feng, F. Energy Consumption and Energy-Saving Analysis of Large and Medium-Sized Medical Buildings. Master’s Thesis, Shandong Jianzhu University, Jinan, China, 2014. [Google Scholar]
  36. Zhou, Z. Welfare Institutions Implement 24-Hour Monitoring. Southern Daily, 21 March 2008; p. A04. [Google Scholar]
  37. Zhang, Y. Research on Renovation Strategies for Existing Hotel Buildings. Master’s Thesis, Nanjing University of Technology, Nanjing, China, 2022. [Google Scholar]
  38. Wang, Y. Research on the Development Model of Family Inns in Inner Mongolia Autonomous Region. Master’s Thesis, Yunnan University, Kunming, China, 2010. [Google Scholar]
  39. Peng, Z. Analysis of the application of green building technology in the architectural design of educational and research buildings. New Urban Constr. Technol. 2023, 32, 13–15. [Google Scholar]
  40. Lin, L.; Xiao, H.; Wu, X. Comparison of Chauvenet’s criterion and Grubbs’ criterion. Univ. Phys. Exp. 2012, 25, 86–88. [Google Scholar]
  41. Zhao, M.; Wang, S.; Kang, W.; Li, Y.; Meng, X. Review of research on carbon emission accounting in the construction sector. HVAC 2022, 52, 13–22. [Google Scholar]
  42. Zhao, M.; Li, Y.; Yue, W.; Kang, W. Study on carbon emission characteristics and influencing factors in the building sector of Shanxi Province. HVAC 2024, 54, 122–131. [Google Scholar]
  43. Institute of Standards and Quotas, Ministry of Housing and Urban-Rural Development & Shenzhen Institute of Building Sciences Co., Ltd. Civil Building Energy Consumption Standard: GB/T 51161—2016; China Architecture & Building Press: Beijing, China, 2016. [Google Scholar]
  44. Ling, J.; You, S.; Xing, J.; Liu, X.; Wu, X.; Zhang, Z. Exploratory research on carbon emission trading in the building sector of Tianjin. Constr. Sci. Technol. 2014, 22, 34–36. [Google Scholar]
  45. National Development and Reform Commission of the People’s Republic of China (NDRC) 2025. Guidelines for Accounting Methods and Reporting of Greenhouse Gas Emissions by Public Building Operating Enterprises (Trial); National Development and Reform Commission of the People’s Republic of China: Beijing, China. Available online: https://www.ndrc.gov.cn/xxgk/zcfb/tz/201511/W020190905506437983335.pdf (accessed on 21 February 2025).
  46. General Office of the Ministry of Ecology and Environment 2023. Notice on the Management of Greenhouse Gas Emission Reporting for Power Generation Enterprises from 2023 to 2025. Available online: https://www.mee.gov.cn/xxgk2018/xxgk/xxgk06/202302/t20230207_1015569.html (accessed on 22 February 2025).
  47. MOHURD. Standard for Building Carbon Emission Calculation; GB/T51366-2019; China Architecture & Building Press: Beijing, China, 2019. [Google Scholar]
  48. Dong, F.; Yu, B.; Hadachin, T.; Dai, Y.; Wang, Y.; Zhang, S.; Long, R. Drivers of carbon emission intensity change in China. Resour. Conserv. Recycl. 2018, 129, 187–201. [Google Scholar] [CrossRef]
  49. Gan, L.; Liu, Y.; Shi, Q.; Cai, W.; Ren, H. Regional inequality in the carbon emission intensity of public buildings in China. Build. Environ. 2022, 225, 109657. [Google Scholar] [CrossRef]
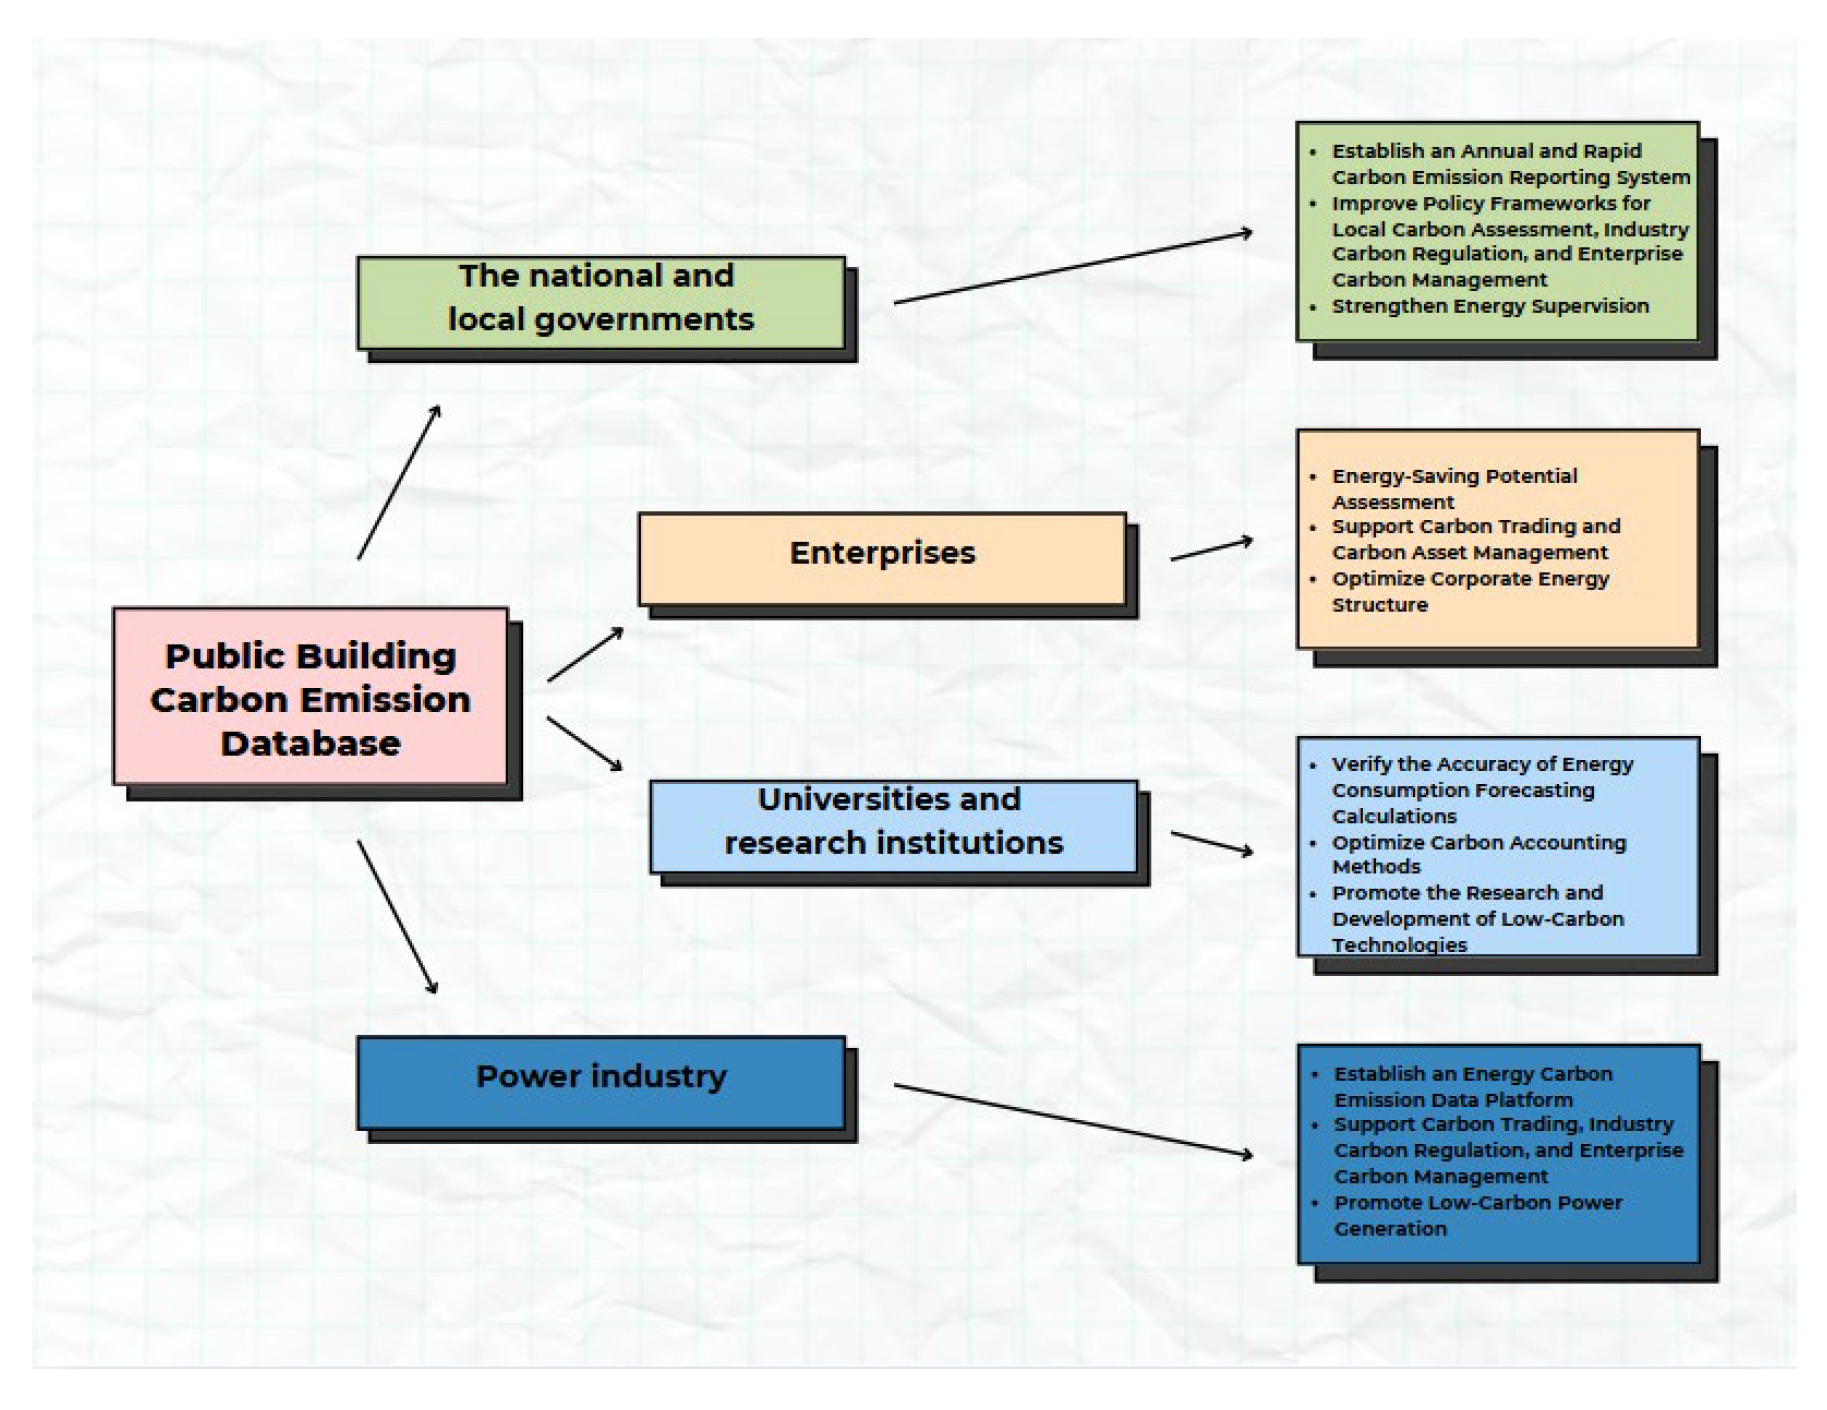
Figure 1. Application targets of the public building carbon emission database.
Energies 18 03635 g001
Figure 2. Distribution of sample quantities by building type in City A.
Energies 18 03635 g002
Figure 3. Annual carbon emissions across various building types.
Energies 18 03635 g003
Figure 4. Electricity and gas carbon emission distribution.
Energies 18 03635 g004
Figure 5. Boxplot of carbon emission intensities across different public building types.
Energies 18 03635 g005
Figure 6. Carbon emission intensity and benchmark by building type over the three years.
Energies 18 03635 g006
Figure 7. Multicollinearity correlation matrix.
Energies 18 03635 g007
Figure 8. Regression model prediction (dependent variable: Carbon Emission Intensity Per Unit Area).
Energies 18 03635 g008
Figure 9. Regression model prediction (dependent variable: LN (Carbon Emission Intensity Per Unit Area)).
Energies 18 03635 g009
Table 1. Building Information Table.
FieldField TypeField Length
Building_IDINT11
Cons_numberVARCHAR50
Origin_IDVARCHAR50
Origin_ID_NameVARCHAR100
Company_NameVARCHAR100
Company_AddressVARCHAR255
CityVARCHAR100
City_CodeVARCHAR20
Category_PIDINT11
Category_PNameVARCHAR50
Category_IDINT11
Category_NameVARCHAR50
Building_AreaFLOAT
Building_Area_UnitVARCHAR10
Number_Of_Energy_UsersINT11
Table 2. Energy Consumption Data Table.
FieldField TypeField Length
Energy_IDINT11
Energy_TypeVARCHAR20
Building_IDINT11
Category_PNameVARCHAR50
Consumption_AmountFLOAT
YearINT4
MonthINT2
Table 3. Carbon Emission Factor Table.
FieldField TypeField Length
Energy_IDINT11
Energy_TypeVARCHAR20
Emission_FactorFLOAT
Table 4. Carbon Emission Data Table.
FieldField TypeField Length
Emission_IDINT11
Building_IDINT11
YearINT4
MonthINT2
Energy_TypeVARCHAR20
Building_AreaFLOAT
Consumption_AmountFLOAT
Emission_FactorFLOAT
Carbon_EmissionFLOAT
Carbon_BenchmarkFLOAT
Carbon_IntensityFLOAT
Benchmark_IntensityFLOAT
Table 5. Building Characteristics Information Table.
FieldField TypeField Length
Building_AreaFLOAT
Year_Of_CompletionINT4
Weekly_Working_HoursINT3
Underground_Parking_AreaFLOAT
Heating_AreaFLOAT
Cooling_AreaFLOAT
Data_Center_AreaFLOAT
Annual_Electricity_ConsumptionFLOAT
Electricity_Consumption_Per_Unit_AreaFLOAT
Annual_Gas_ConsumptionFLOAT
Gas_Consumption_Per_Unit_AreaFLOAT
Number_Of_Energy_UsersINT11
Energy_Users_Per_Unit_AreaFLOAT
Table 6. Variable correlation analysis.
VariablesCarbon Emission
Intensity per Unit Area
LN (Carbon Emission
Intensity per Unit Area)
Building Area−0.212 *−0.312 **
Year of Completion−0.105 *−0.091
Weekly Working Hours0.100 * −0.005
Underground Parking Area−0.039−0.049
Heating Area−0.213 *−0.246 *
Cooling Area−0.199 *−0.225 *
Data Center Area−0.071−0.093
Annual Electricity Consumption0.393 **0.379 **
Annual Electricity Consumption Per Unit Area0.780 ***0.780 ***
Annual Gas Consumption0.210 *0.107 *
Annual Gas Consumption Per Unit Area0.349 **0.221 *
Number of Energy Users−0.105 *−0.145 *
Number of Energy Users Per Unit Area−0.061−0.097 *
LN (Building Area)−0.209 *−0.274 *
LN (Year of Completion)−0.105 *−0.091
LN (Weekly Working Hours)0.038−0.025
LN (Underground Parking Area)0.249 *0.004
LN (Heating Area)−0.153 *−0.195 *
LN (Cooling Area)−0.064−0.081
LN (Data Center Area)−0.122 *−0.151 *
LN (Annual Electricity Consumption)0.505 ***0.529 ***
LN (Annual Electricity Consumption Per Unit Area)0.694 ***0.779 ***
LN (Annual Gas Consumption)0.0740.111 *
LN (Annual Gas Consumption Per Unit Area)0.241 *0.138 *
LN (Number of Energy Users)0.0620.022
LN (Number of Energy Users Per Unit Area)0.259 *0.262
Note: Explanatory variables and their natural logarithms are compared; variables with higher correlation are marked in green, while those with equal correlation are marked in yellow. * indicates a weak correlation (correlation coefficient between 0.1 and 0.3); ** indicates a moderate correlation (between 0.3 and 0.5); *** indicates a strong correlation (greater than 0.5).
Table 7. Correlation analysis of variables (explanatory variables removed due to multicollinearity).
VariablesCarbon Emission
Intensity per Unit Area
LN (Carbon Emission
Intensity per Unit Area)
Building Area−0.212 *−0.312 **
Year of Completion−0.105 *−0.091
Weekly Working Hours0.100 *−0.005
Underground Parking Area−0.039−0.049
Heating Area−0.213 *−0.246 *
Cooling Area−0.199 *−0.225 *
Data Center Area−0.071−0.093
Annual Electricity Consumption0.393 **0.379 **
Annual Electricity Consumption Per Unit Area0.780 ***0.780 ***
Annual Gas Consumption
Annual Gas Consumption Per Unit Area0.349 **0.221 *
Number of Energy Users
Number of Energy Users Per Unit Area−0.061−0.097 *
LN (Building Area)−0.209 *−0.274 *
LN (Year of Completion)−0.105 *−0.091
LN (Weekly Working Hours)0.038−0.025
LN (Underground Parking Area)0.249 *0.004
LN (Heating Area)−0.153 *−0.195 *
LN (Cooling Area)−0.064−0.081
LN (Data Center Area)−0.122 *−0.151 *
LN (Annual Electricity Consumption)0.505 ***0.529 ***
LN (Annual Electricity Consumption Per Unit Area)0.694 ***0.779 ** *
LN (Annual Gas Consumption)
LN (Annual Gas Consumption Per Unit Area)0.241 *0.138 *
LN (Number of Energy Users)
LN (Number of Energy Users Per Unit Area)0.259 *0.262 *
Note: Explanatory variables and their natural logarithms are compared; variables with higher correlation are marked in green, while those with equal correlation are marked in yellow. * indicates a weak correlation (correlation coefficient between 0.1 and 0.3); ** indicates a moderate correlation (between 0.3 and 0.5); *** indicates a strong correlation (greater than 0.5). Variables shown in gray were excluded due to multicollinearity.
Table 8. F-values for Carbon Emission Intensity Per Unit Area.
Explanatory VariableF-ValueRetained
Building Area9.97TRUE
LN (Year of Completion)5.73TRUE
Weekly Working Hours5.84TRUE
LN (Underground Parking Area)4.71TRUE
Heating Area5.04TRUE
Cooling Area4.26TRUE
LN (Data Center Area)3.71TRUE
LN (Annual Electricity Consumption)21.31TRUE
Annual Electricity Consumption Per Unit Area39.61TRUE
Annual Gas Consumption Per Unit Area86.72TRUE
LN (Number of Energy Users Per Unit Area)79.60TRUE
Table 9. F-values for LN (Carbon Emission Intensity Per Unit Area).
Explanatory VariableF-ValueRetained
Explanatory Variable22.90TRUE
Building Area16.62TRUE
LN (Year of Completion)11.08TRUE
Weekly Working Hours8.42TRUE
LN (Underground Parking Area)54.15TRUE
Heating Area68.84TRUE
Cooling Area86.91TRUE
LN (Data Center Area)79.36TRUE
Table 10. Retained variables.
Data SummaryCarbon Emission
Intensity per Unit Area
LN (Carbon Emission
Intensity per Unit Area)
Adjusted R20.8120.754
Explanatory VariableUnit
Building Aream2Original DataOriginal Data
Year of CompletionYearLN
Weekly Working HoursHour(s)Original Data
Underground Parking Aream2LN
Heating Aream2Original DataOriginal Data
Cooling Aream2Original DataOriginal Data
Data Center Aream2LNLN
Annual Electricity ConsumptionkWhLNLN
Annual Electricity Consumption Per Unit AreakWh/m2Original DataOriginal Data
Annual Gas Consumption Per Unit Aream3/m2Original DataOriginal Data
Number of Energy Users Per Unit AreaPerson(s)/m2LNLN
Disclaimer/Publisher’s Note: The statements, opinions and data contained in all publications are solely those of the individual author(s) and contributor(s) and not of MDPI and/or the editor(s). MDPI and/or the editor(s) disclaim responsibility for any injury to people or property resulting from any ideas, methods, instructions or products referred to in the content.