1. Introduction
Resource transfer among microgrids can be realized through cable interconnection. However, due to the complexity of submarine topography and high investment costs, the conditions for laying cables among microgrids on oceanic islands may not be available [
1,
2]. For this reason, some scholars have proposed deploying mobile energy storage [
3,
4] for inter-island resource transfer and demonstrated its good application prospects [
5].
At present, the inter-island resource transfer model based on mobile energy storage participation has made some progress. In Reference [
6], an energy cooperation framework for oceanic-island-group microgrids based on offshore mobile energy storage is proposed, enabling energy sharing and significantly reducing the system’s energy cost. In Reference [
7], to cope with the impact of extreme natural disasters on the supply of electricity, cold energy, and water, a post-disaster security strategy based on power exchange ships is proposed, which can effectively reduce the security cost of the system. In Reference [
8], based on the passenger carrying demand of tourist islands and the renewable energy consumption demand of resource islands, an energy optimization scheduling method based on all-electric ships for oceanic island groups is proposed, which fully exploits the potential of mobile energy storage in energy transmission and passenger transportation. In Reference [
9], by quantitatively analyzing the spatio-temporal characteristics of power exchange ships, a hybrid power supply model with both discrete and continuous characteristics is proposed to achieve the energy dynamic balance of the island group. However, these studies typically assume that mobile energy storage operates at a constant speed, without fully considering the role of its flexibility in optimizing system operation. This, to some extent, limits the flexibility of inter-island resource transfer and also restricts the consumption of renewable energy.
The development of optimization strategies for the storage, conversion, and consumption of surplus energy is a key measure to ensure the economic and efficient operation of island microgrids [
10]. In Reference [
11], an integrated power supply system integrating an electrolysis unit and a photovoltaic power plant is proposed, which promotes the consumption of renewable energy and significantly improves the overall benefit of the island microgrid through the synergistic effect of the two. In Reference [
12], the operational characteristics of an electrolytic water-to-hydrogen plant are analyzed, and a hybrid electric–hydrogen energy scheduling strategy that takes into account the battery life and hydrogen production efficiency is proposed to improve the efficiency of the utilization of the surplus energy and to reduce the system operating cost. In Reference [
13], a demand-driven energy supply model is proposed by segmenting the loads according to their ‘demand urgency’, thus enhancing the renewable energy consumption capacity of the resource island. In Reference [
14], energy loss and wind and solar power curtailment during inter-island interconnection are reduced by delivering water, electricity, and hydrogen in the form of material packages and optimizing their ratios. However, most of the above work focuses on the consumption of surplus energy and neglects its utilization efficiency, leading to a certain degree of economic loss. In addition, there is a paucity of research on hybrid delivery of water, electricity, and hydrogen resources in the aforementioned references, which hinders the ability to meet the diverse energy and resource demands of the island.
In recent years, the optimal scheduling of microgrids with the participation of renewable energy has gained widespread attention. In Reference [
15], a ship berth allocation method is proposed that considers the stability of the microgrid when the ship docks, optimizes load distribution, and effectively reduces environmental pollution. However, it does not address the solution of complex models, nor has it been validated through practical implementation. In Reference [
16], an incentive-based optimal scheduling method for grid-connected microgrids is proposed. This method encourages users to participate in demand response programs, effectively reducing energy release from the grid. However, it does not consider the impact of user participation in demand response on the users themselves. In Reference [
17], an optimal coordinated scheduling strategy for multiple microgrids in both grid-connected and islanded modes is proposed. By optimizing controllable generation units, uncontrollable units, and energy storage devices, higher operational efficiency is achieved. However, it does not consider the impact of proactive islanding on grid stability. In Reference [
18], an optimal scheduling strategy for electrolyzers in a park-type microgrid is proposed to address the issue of low efficiency in large-scale operation of alkaline electrolyzers, achieving optimal utilization of the electrolyzers. However, it does not consider the impact of cooperating with other types of electrolyzers on the system. In addition, the aforementioned references do not consider how to assess the effectiveness of the proposed strategies under an extended model, nor do they conduct sensitivity analysis on key parameters.
This paper proposes a flexible scheduling strategy for water–electricity–hydrogen in oceanic-island-group microgrids based on multi-rate hydrogen-powered ships. First, an inter-island resource sharing model based on hydrogen-powered ships is proposed using water storage tanks, battery packs and hydrogen storage (HS) tanks as material carriers. Second, the advantages and disadvantages of each device on the resource island in consuming the surplus renewable energy are analyzed, and the variable-efficiency operation characteristic models of SDU and PEMEL are established, while the influence of battery life loss is considered. By considering the variable-efficiency characteristics of SDU and PEMEL, the device output is optimized to improve the system’s energy utilization efficiency. Then, for the influence of mobile energy storage flexibility on system optimization, a resource transfer model based on multi-rate hydrogen-powered ships is proposed, and its spatio-temporal characteristics are elaborated. By optimizing the ship’s sailing speed, flexible resource transfer is achieved, and the curtailment rate of renewable energy is reduced. Finally, from the perspective of overall system benefit, a flexible dispatch model for water–electricity–hydrogen in oceanic-island-group microgrids is constructed with the objective of minimizing the total system cost, and a simulation analysis is carried out using an island group in the South China Sea as an example. In the case of short distances between islands, the results indicate that the proposed strategy enhances economic performance by 5.17% and reduces the curtailment rate by 77.46% compared with the traditional strategy that accounts for the ship’s low speed. Additionally, when compared with the traditional strategy that assumes fixed-efficiency operation, the proposed strategy improves economic performance by 4.56% and increases the overall operational efficiency by 4.88%. It is worth noting that the proposed strategy still maintains good performance under longer sailing times.
2. Water–Electricity–Hydrogen Hybrid Resource Transfer System in Oceanic-Island-Group Microgrids
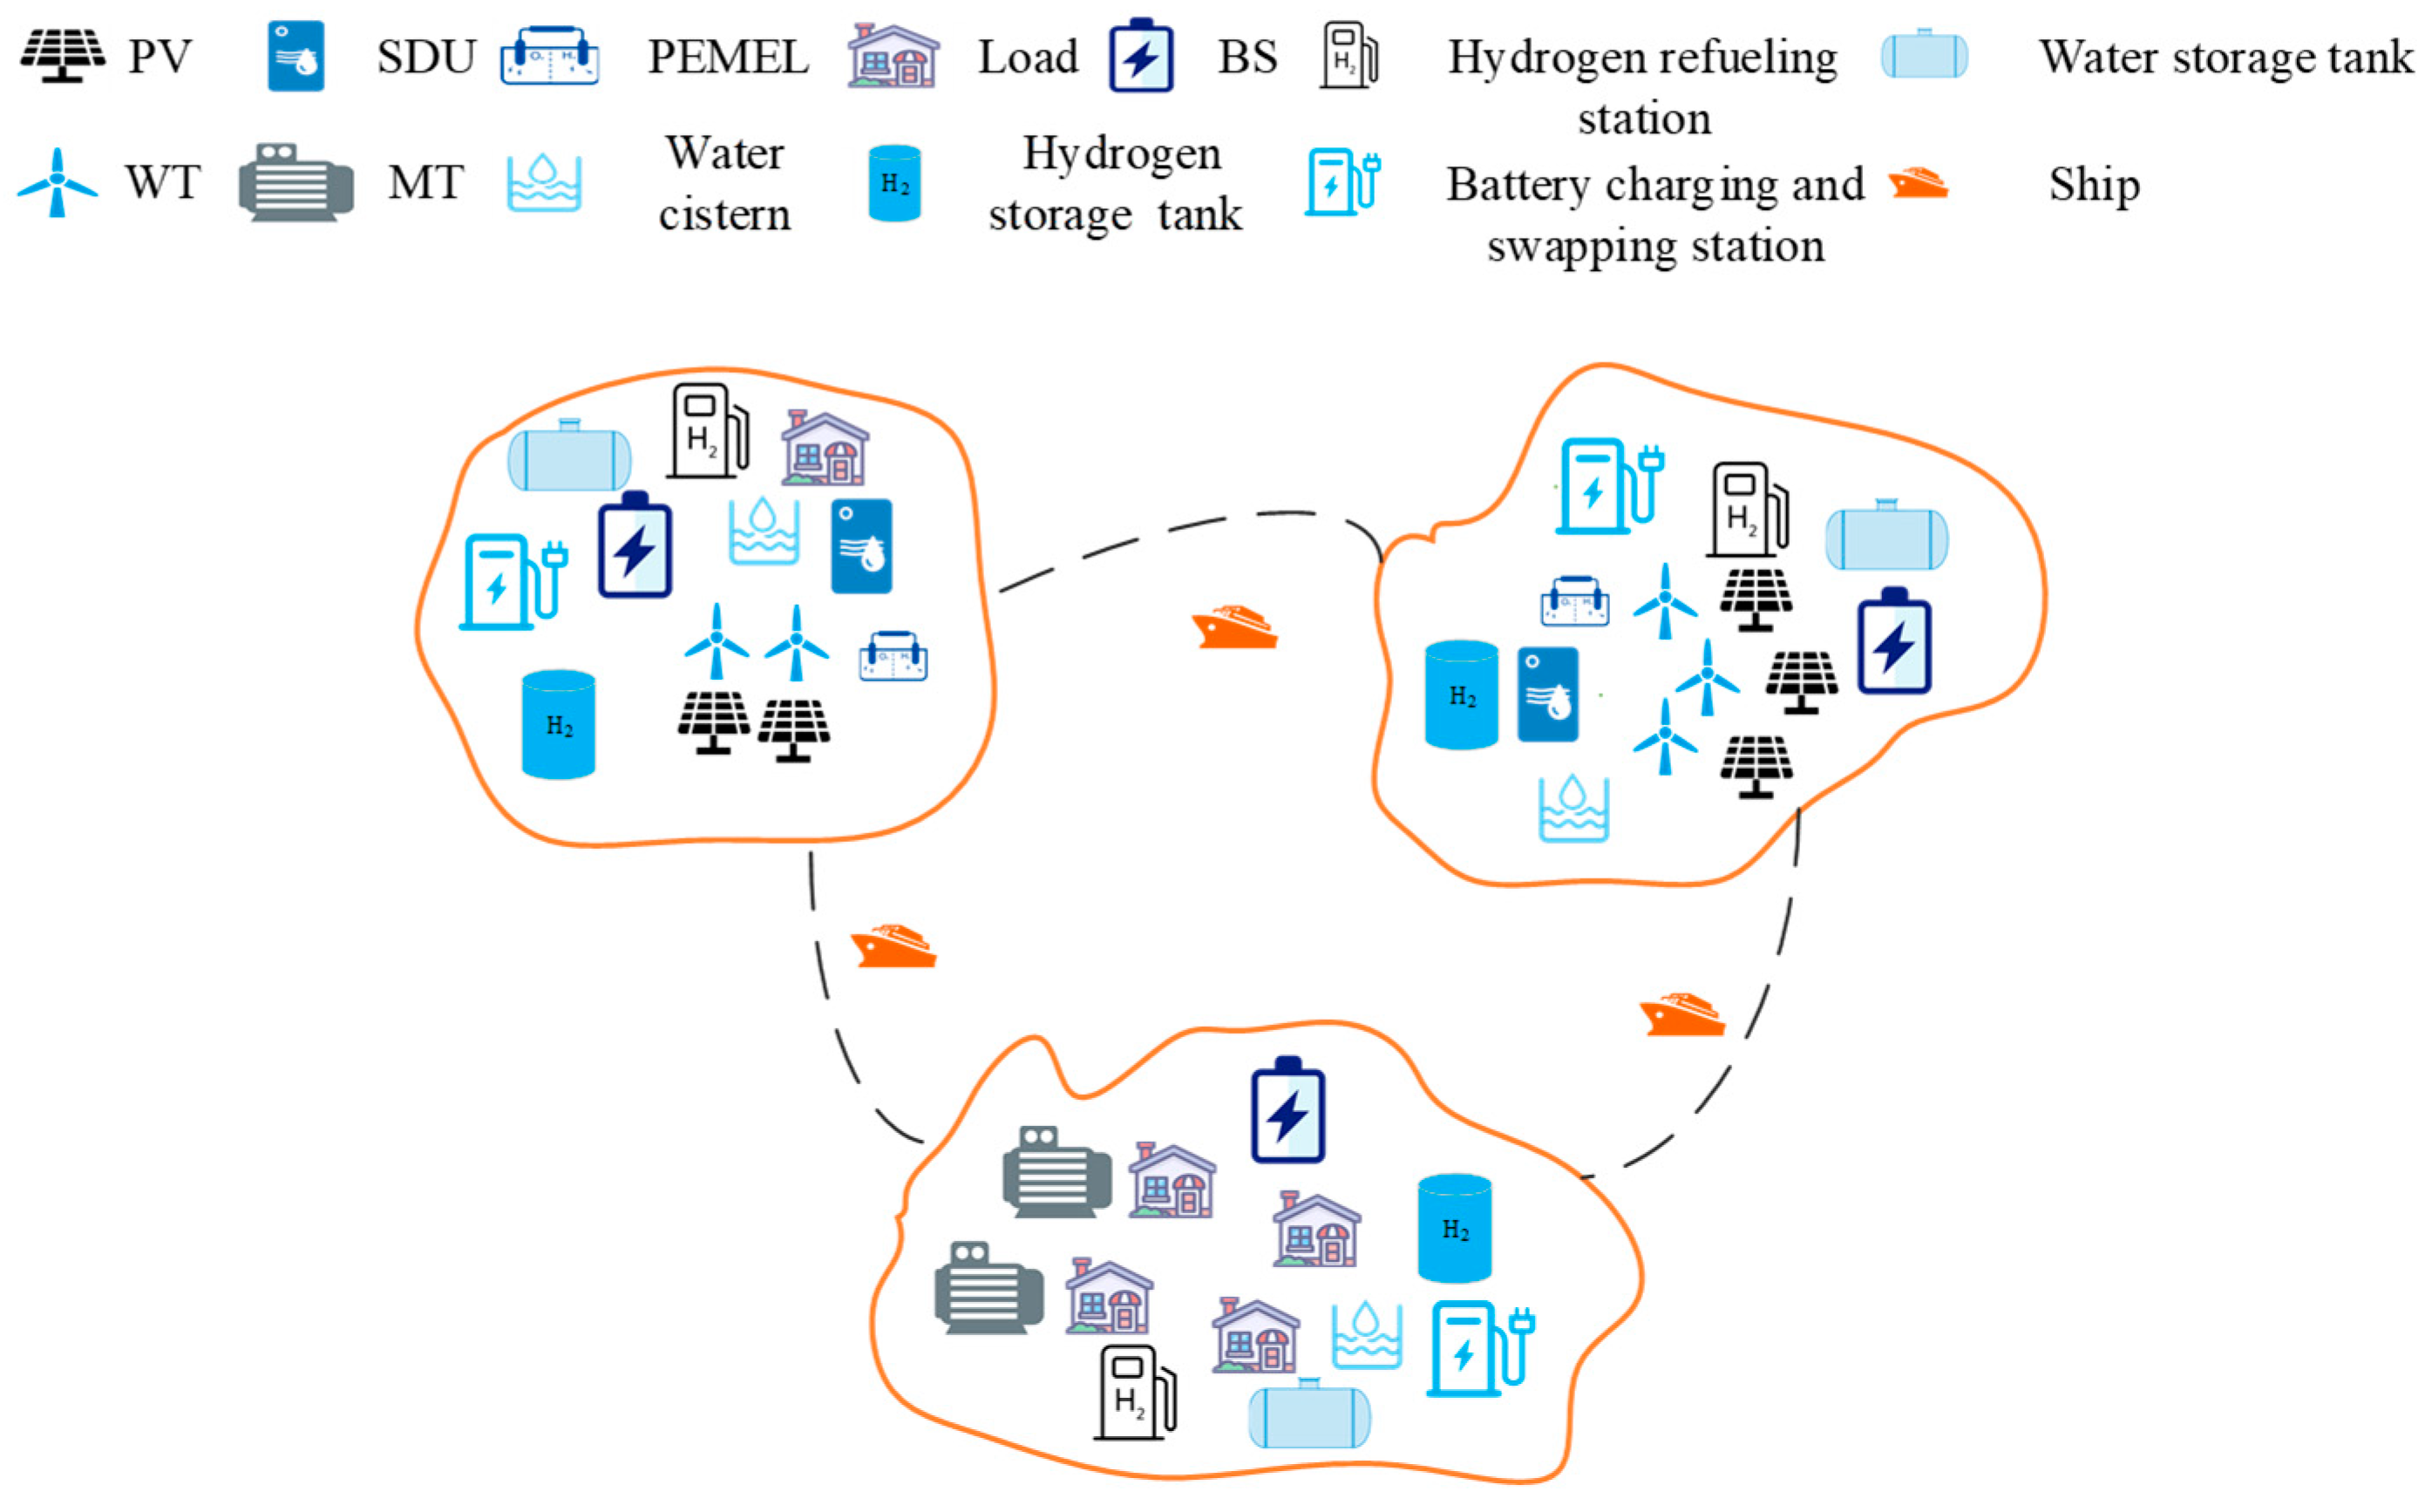
Oceanic-island-group microgrids usually consist of a load island and multiple resource islands [
10], as shown in
Figure 1. Wind turbines (WTs), photovoltaic panels (PVs), hydrogen refueling stations, PEMELs, hydrogen storage tanks, battery charging and switching stations, BSs, SDUs, water storage tanks, and water cisterns are deployed on resource islands, in consideration of the resource supply and demand differences between resource and load islands. Hydrogen refueling stations, hydrogen storage tanks, battery charging and switching stations, BSs, microturbines (MTs), water storage tanks, and water cisterns are configured to load islands, with methane serving as the fuel for the microturbines. Surplus renewable energy is used on resource islands to produce water, electricity, and hydrogen for load islands, and then material packages are generated using water storage tanks, battery packs, and hydrogen storage tanks as carriers, and, finally, inter-island resource transfer is realized through the transfer and loading and unloading of material packages by hydrogen-powered ships.
The BS, PEMEL, and SDU each have their own strengths and weaknesses in terms of consuming surplus renewable energy. While the BS can experience a shortened service life when it is overcharged and discharged, the efficiency and yield of the PEMEL and SDU are affected by the power at which they operate, and both do not achieve optimal efficiency at rated power. Considering the volatility of renewable energy output, relying on the BS, PEMEL, or SDU alone may result in some degree of energy loss and economic loss. Therefore, it is necessary to comprehensively consider the ratio of the three materials—water, electricity, and hydrogen—and select the optimal consumption strategy in order to realize the economic operation of the system.
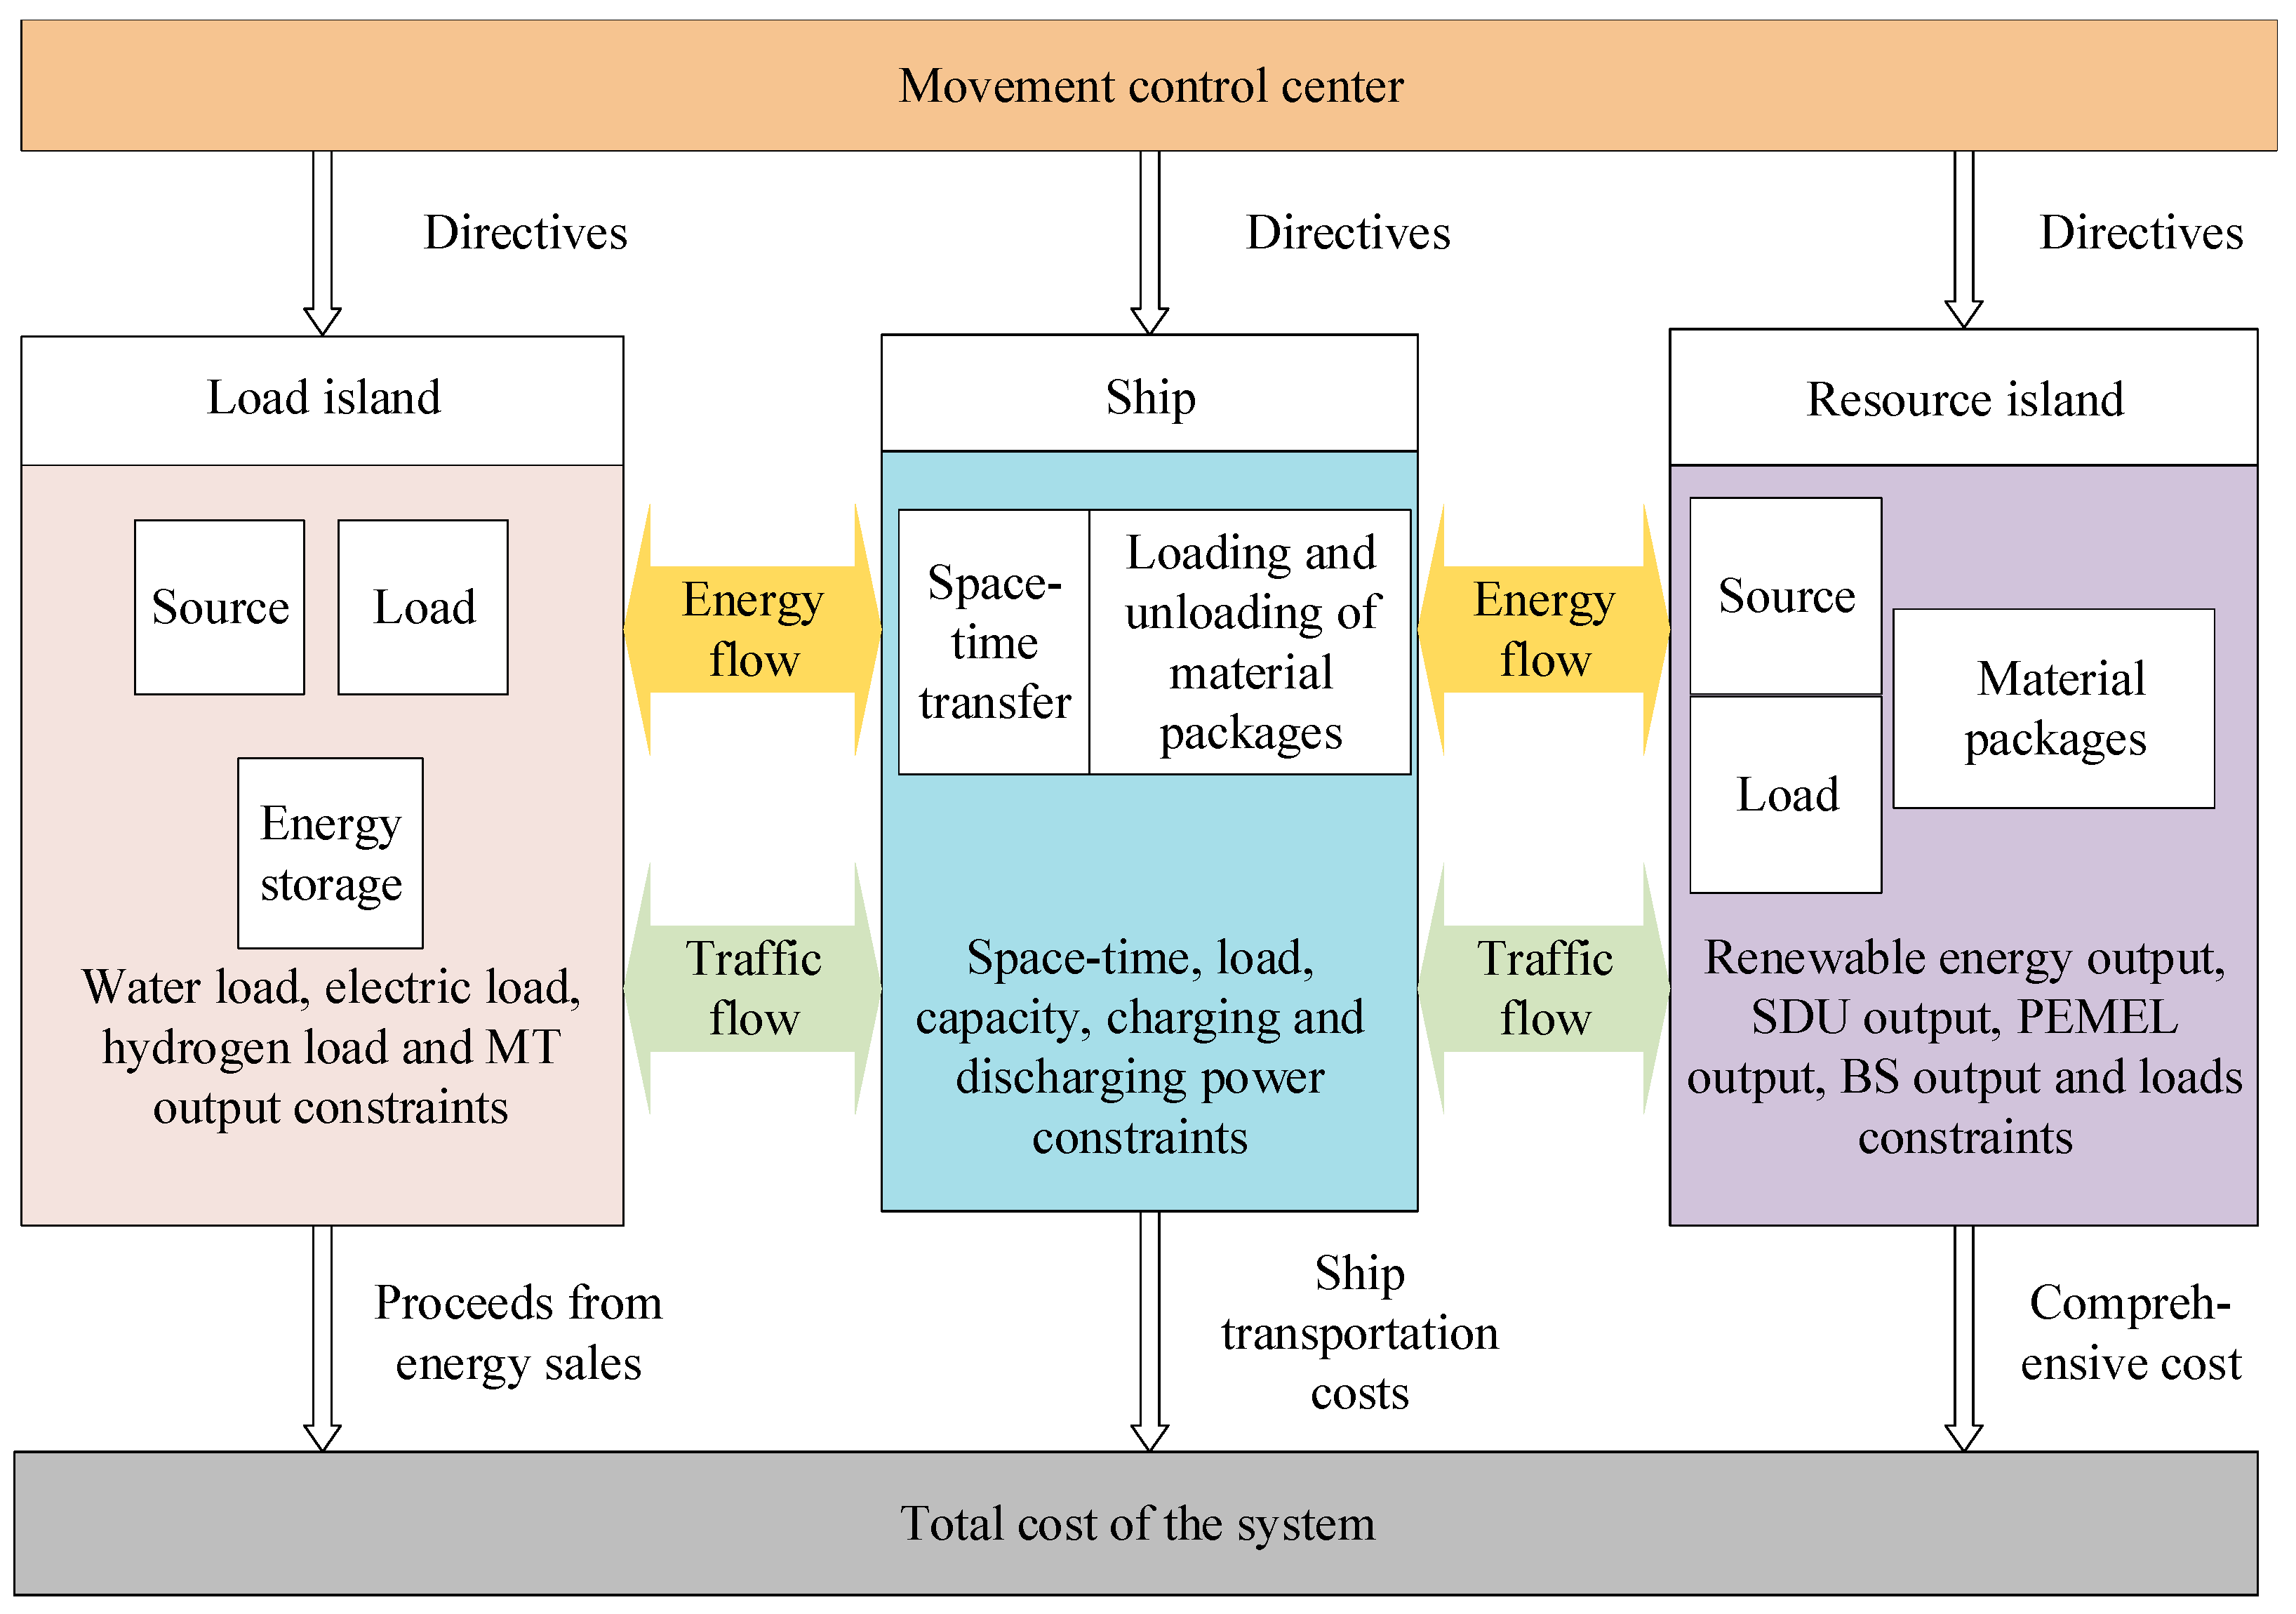
The water–electricity–hydrogen flexible dispatch model of oceanic-island-group microgrids is shown in
Figure 2. As shown in the figure, under the premise of satisfying the load demands of the personnel stationed on the island, the resource islands supply all the water and hydrogen, as well as part of the electricity, required by the load islands, while the remaining electricity is supplied by the MT. By optimizing the ratios of water, hydrogen, and electricity based on a comprehensive consideration of the returns from the sale of water and hydrogen, we aim to minimize the total cost of the system.
5. Simulation Analysis
5.1. Introduction to Simulation Data
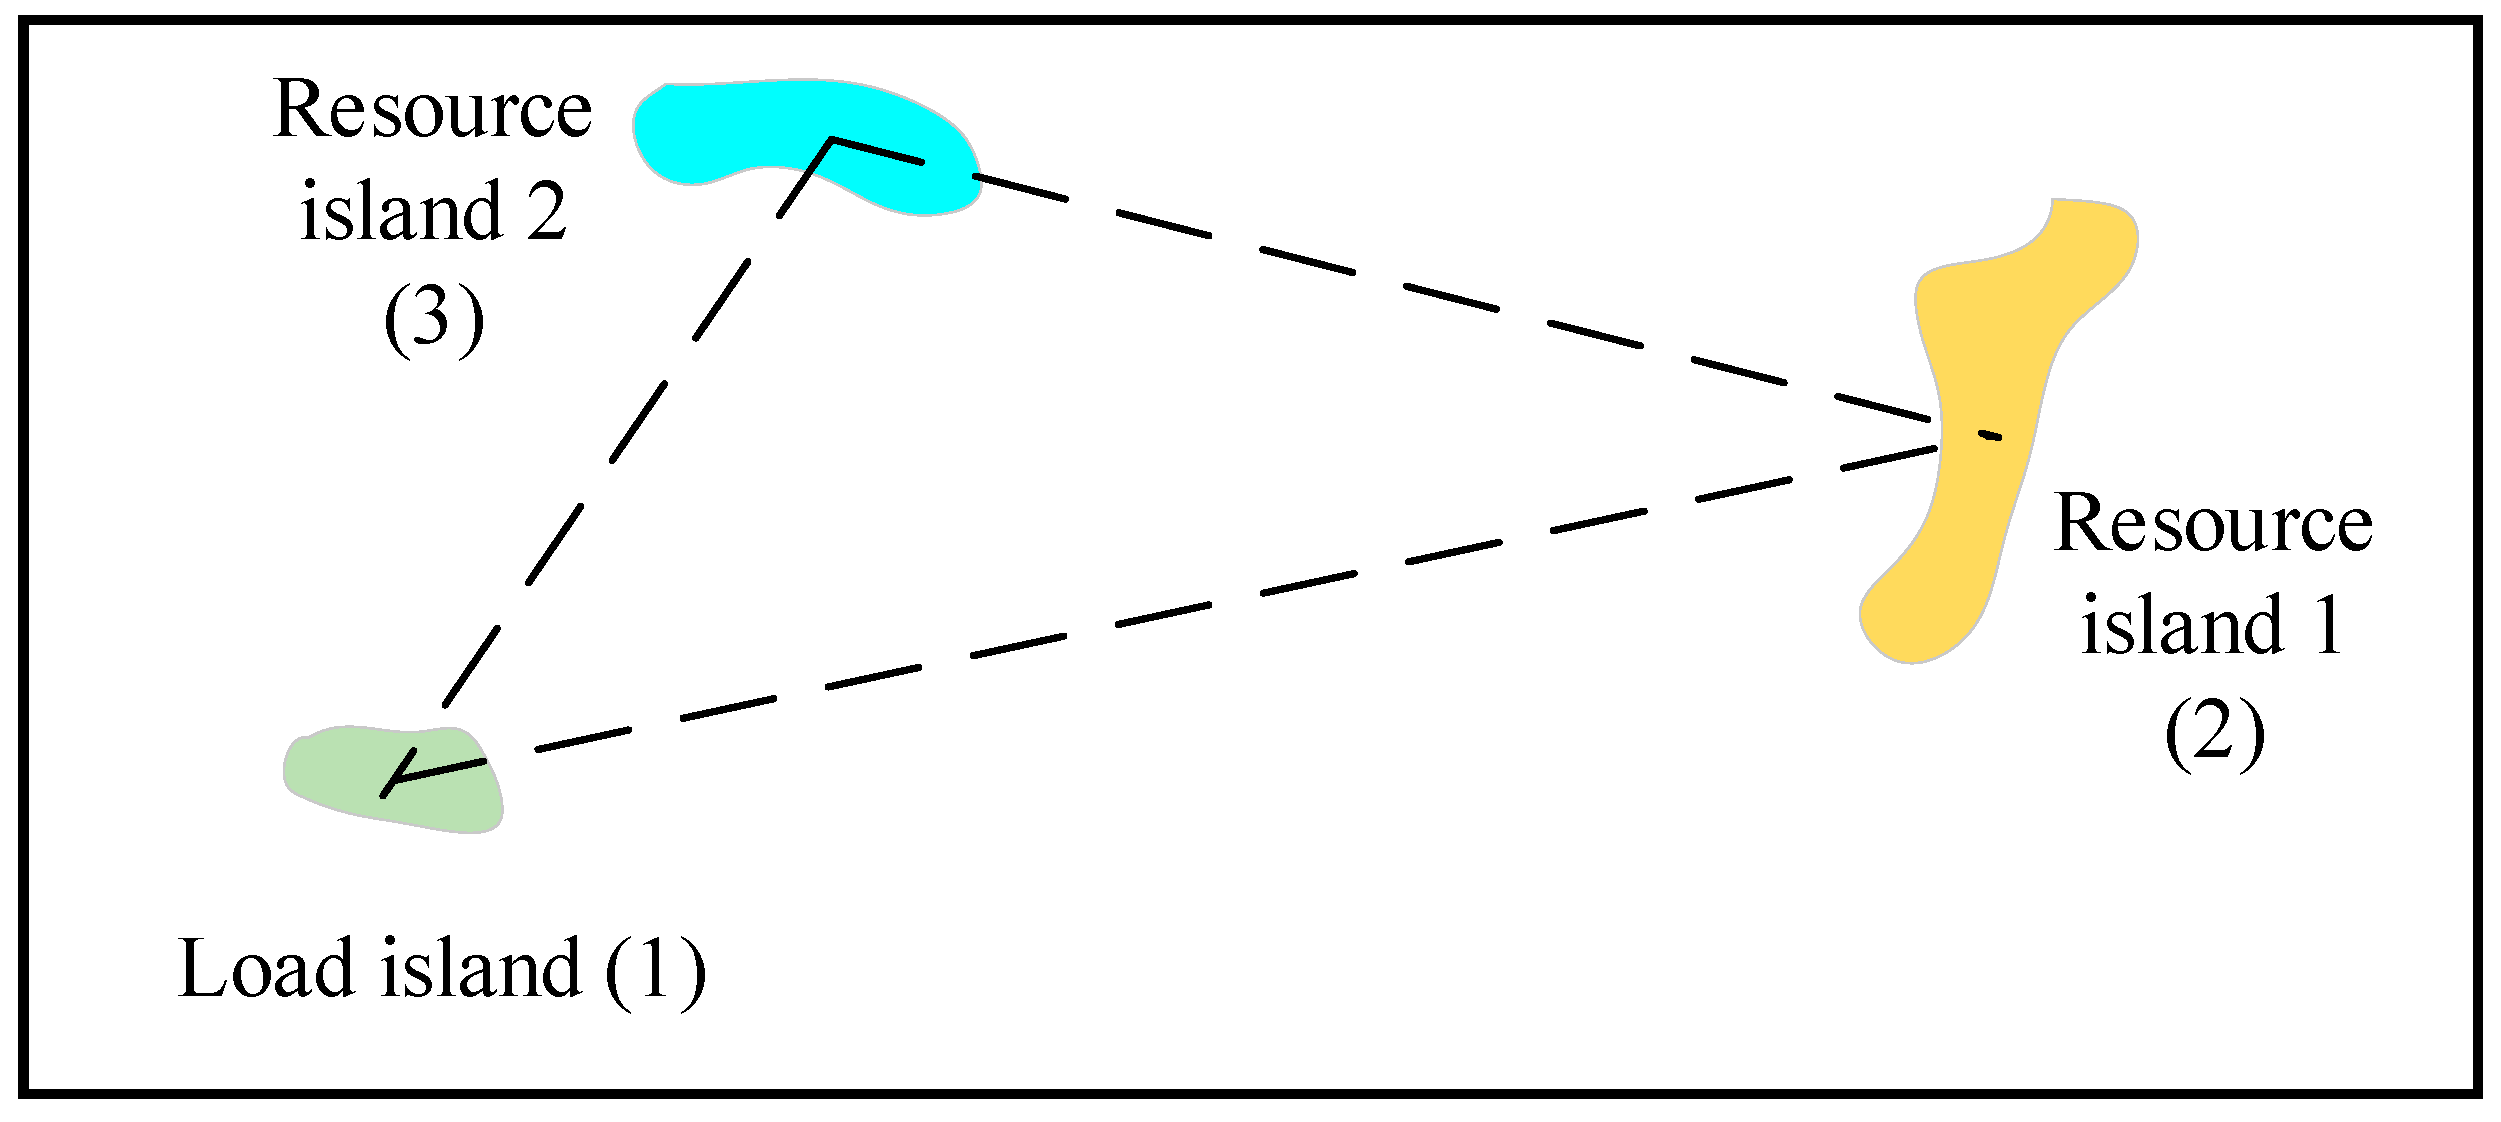
A group of oceanic islands in the South China Sea, whose relative positions and numbers are shown in
Figure 5 [
30], is taken as the research object. Among them, it is assumed that island 1 is a load island and islands 2 and 3 are resource islands. The load island includes the water load, electricity load, and hydrogen load. Resource islands serve as renewable energy bases for electricity storage, hydrogen production, and water production, with resource island 2 also responsible for supplying water and electricity to resident personnel.
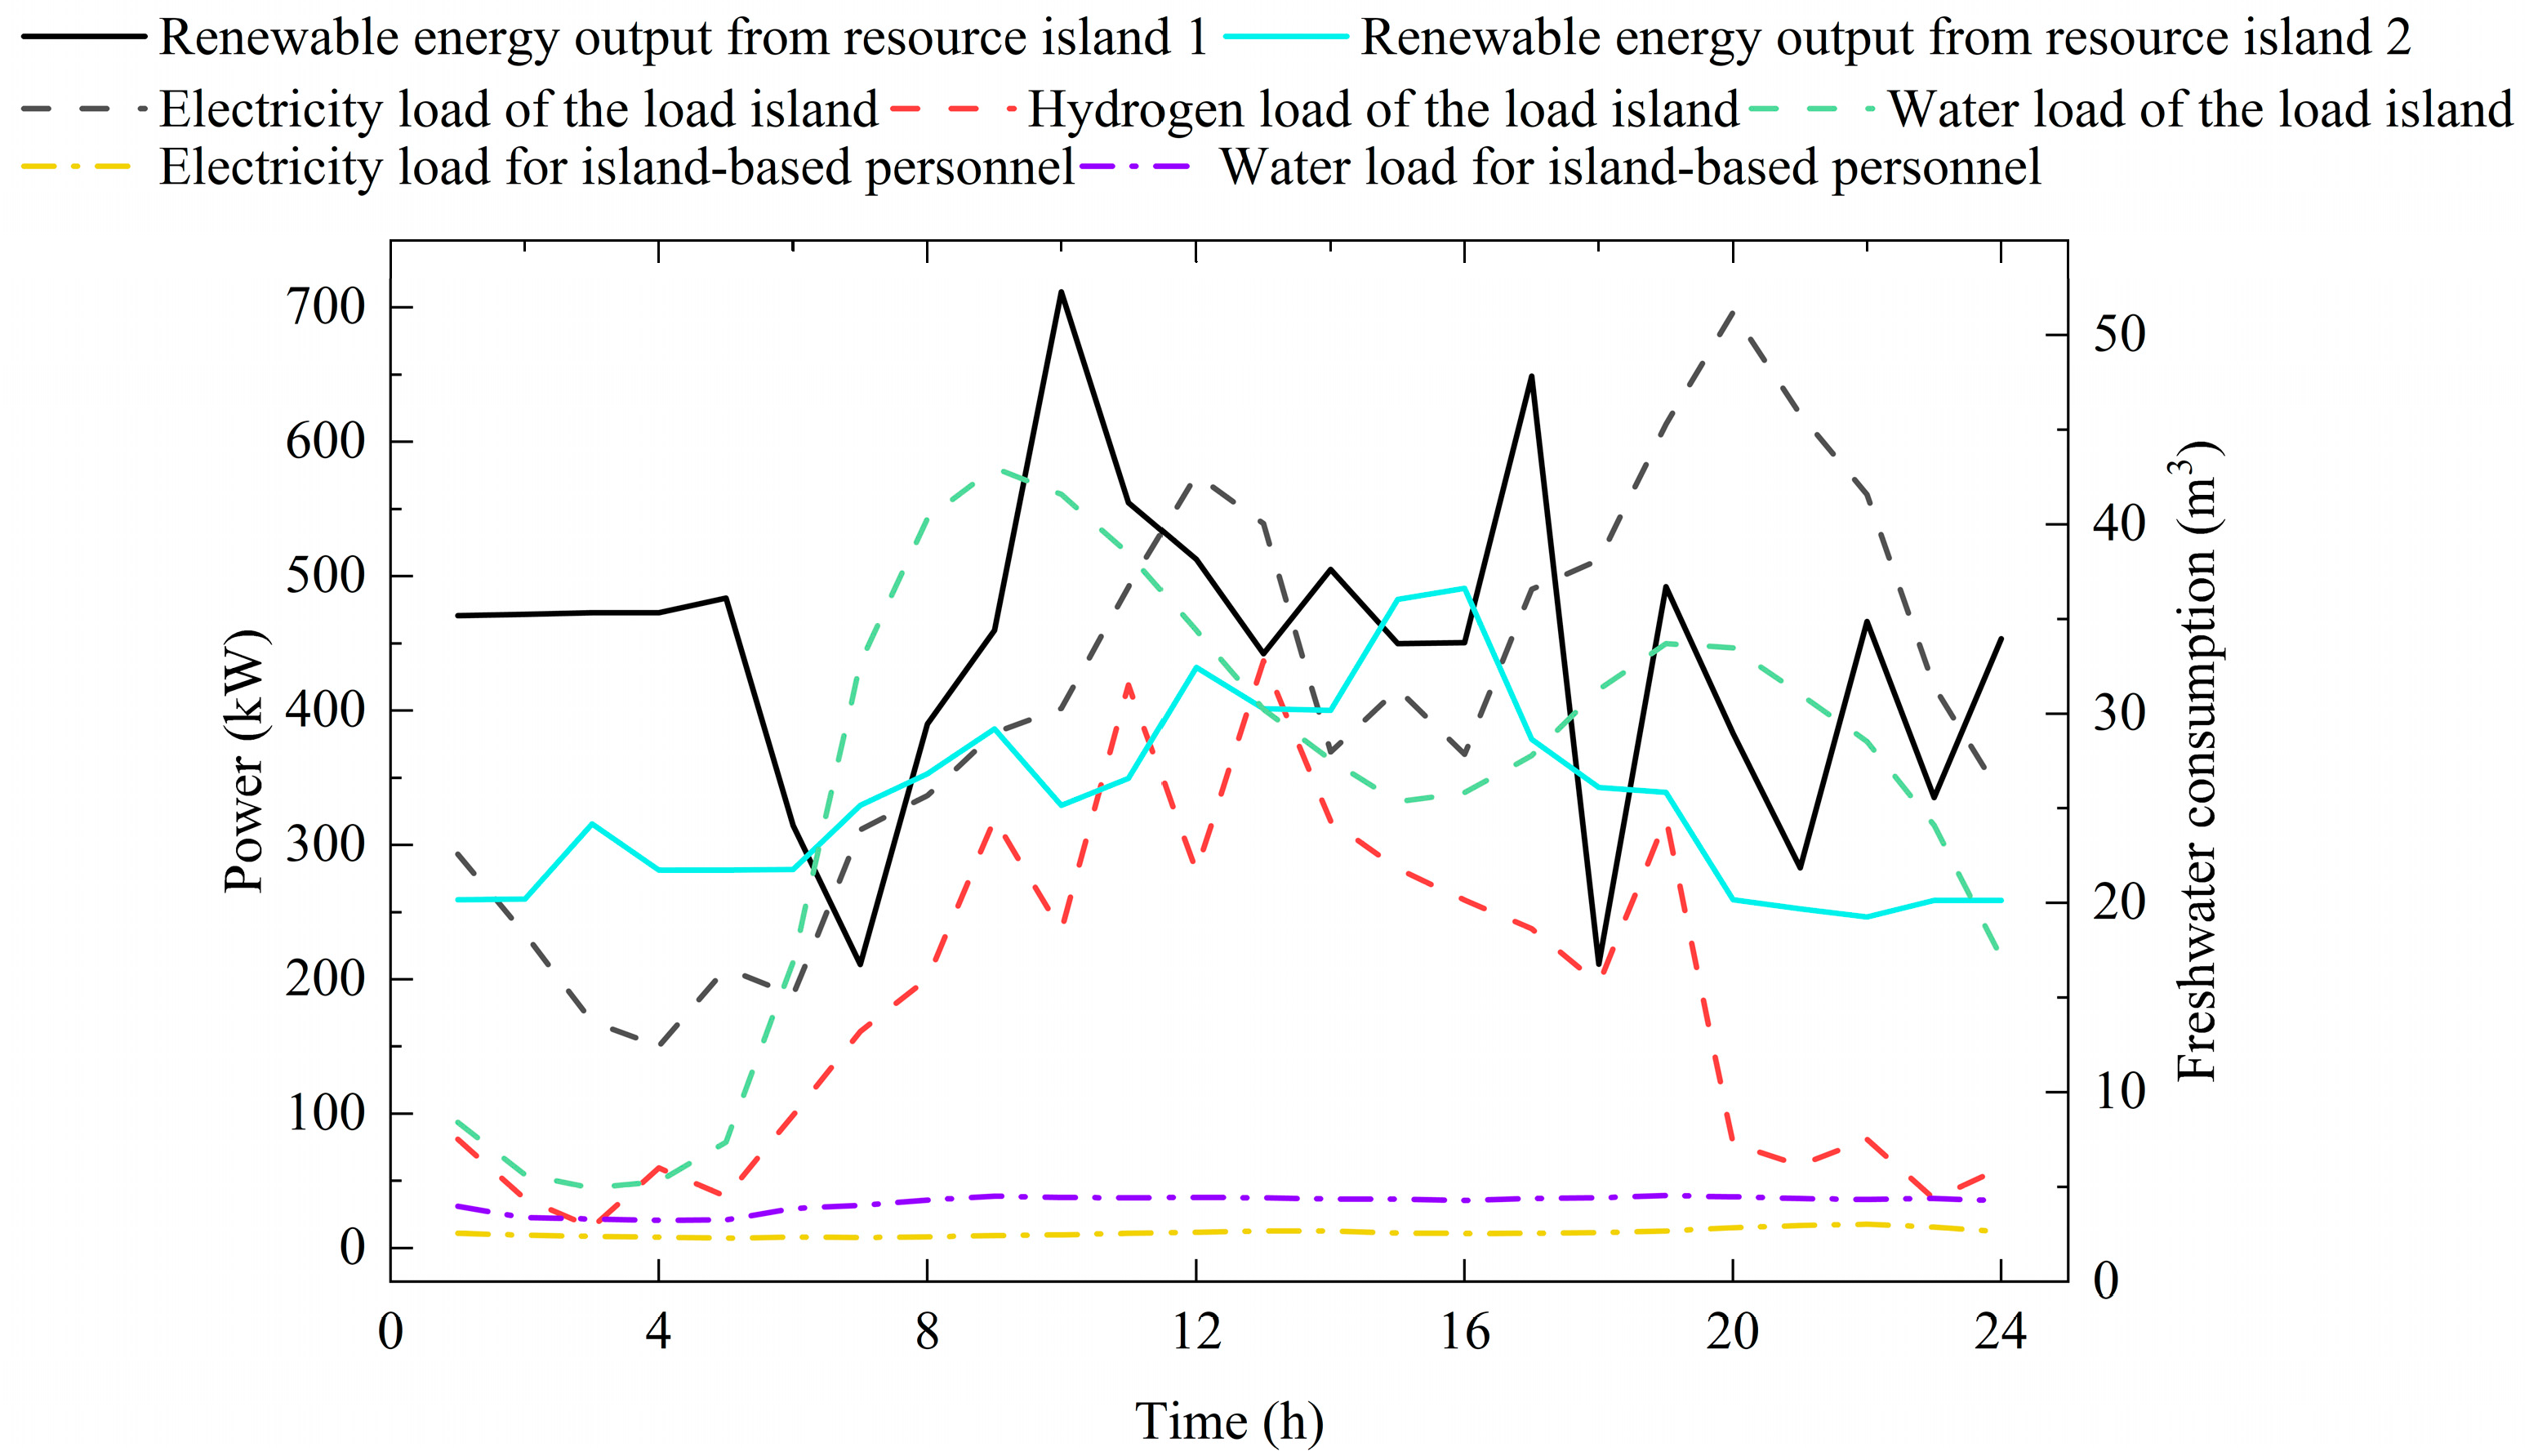
Figure 6 presents the water, electricity, and hydrogen load of the load island, the renewable energy output of the two resource islands, and the water and electricity loads of the resident personnel on resource island 2, all of which are based on data from References [
9,
13,
31,
32,
33] and have been proportionally scaled. An MT is configured in the load island. An SDU and a PEMEL are configured on each resource island. The prices of water and hydrogen are set to be 6.5 CNY/m
3 and 70 CNY/kg, respectively [
34].
It is assumed that under favorable natural conditions, the ship’s low-speed sailing speed is 7.5 km/h, and the hydrogen consumption is 3 kg/h. In high-speed sailing, the ship’s speed is 11.25 km/h, and the hydrogen consumption is 10.125 kg/h. In the low-speed sailing mode, the sailing time between island 2 and islands 1 and 3 is 2 h and that between islands 1 and 3 is 1 h. In the high-speed sailing mode, the sailing time between any two islands is 1 h. In addition, the time required for operations, such as filling and discharging hydrogen and loading and unloading material packages, on the ship is about 1 h [
35]. The ship can be equipped with up to eight batteries, each with a capacity of 500 kW. The PEMEL and SDU operate at fixed efficiencies of 0.709 and 0.29, respectively. The relevant parameters of the equipment are shown in
Table 2.
In order to verify the effectiveness of the scheduling strategy proposed in this paper, the following six scenarios were designed for comparison:
Scenario 1: The method proposed in this paper is a co-optimization approach that considers the variable-efficiency operation characteristics of the PEMEL and SDU, as well as the flexibility of the ship.
Scenario 2: The PEMEL and SDU are operated at a fixed efficiency, while the ship’s flexibility is also taken into account.
Scenario 3: According to the setting of Scenario 1, the ship operates at a low speed.
Scenario 4: According to the setting of Scenario 1, the ship operates at a high speed.
Scenario 5: According to the setting of Scenario 2, the ship operates at a low speed.
Scenario 6: According to the setting of Scenario 2, the ship operates at a high speed.
5.2. Analysis of Power Allocation Results
Figure 7 shows the power allocation results for Scenarios 1 and 2. As shown, there is a significant difference between the SDU operation strategies of the two scenarios. Scenario 1 adopts a variable-power, high-efficiency operation mode from 1:00 to 7:00, 9:00 to 11:00, and at 13:00 and 24:00, while Scenario 2 operates at a constant rated power. This difference verifies the variable-efficiency characteristics of the SDU, and in conjunction with
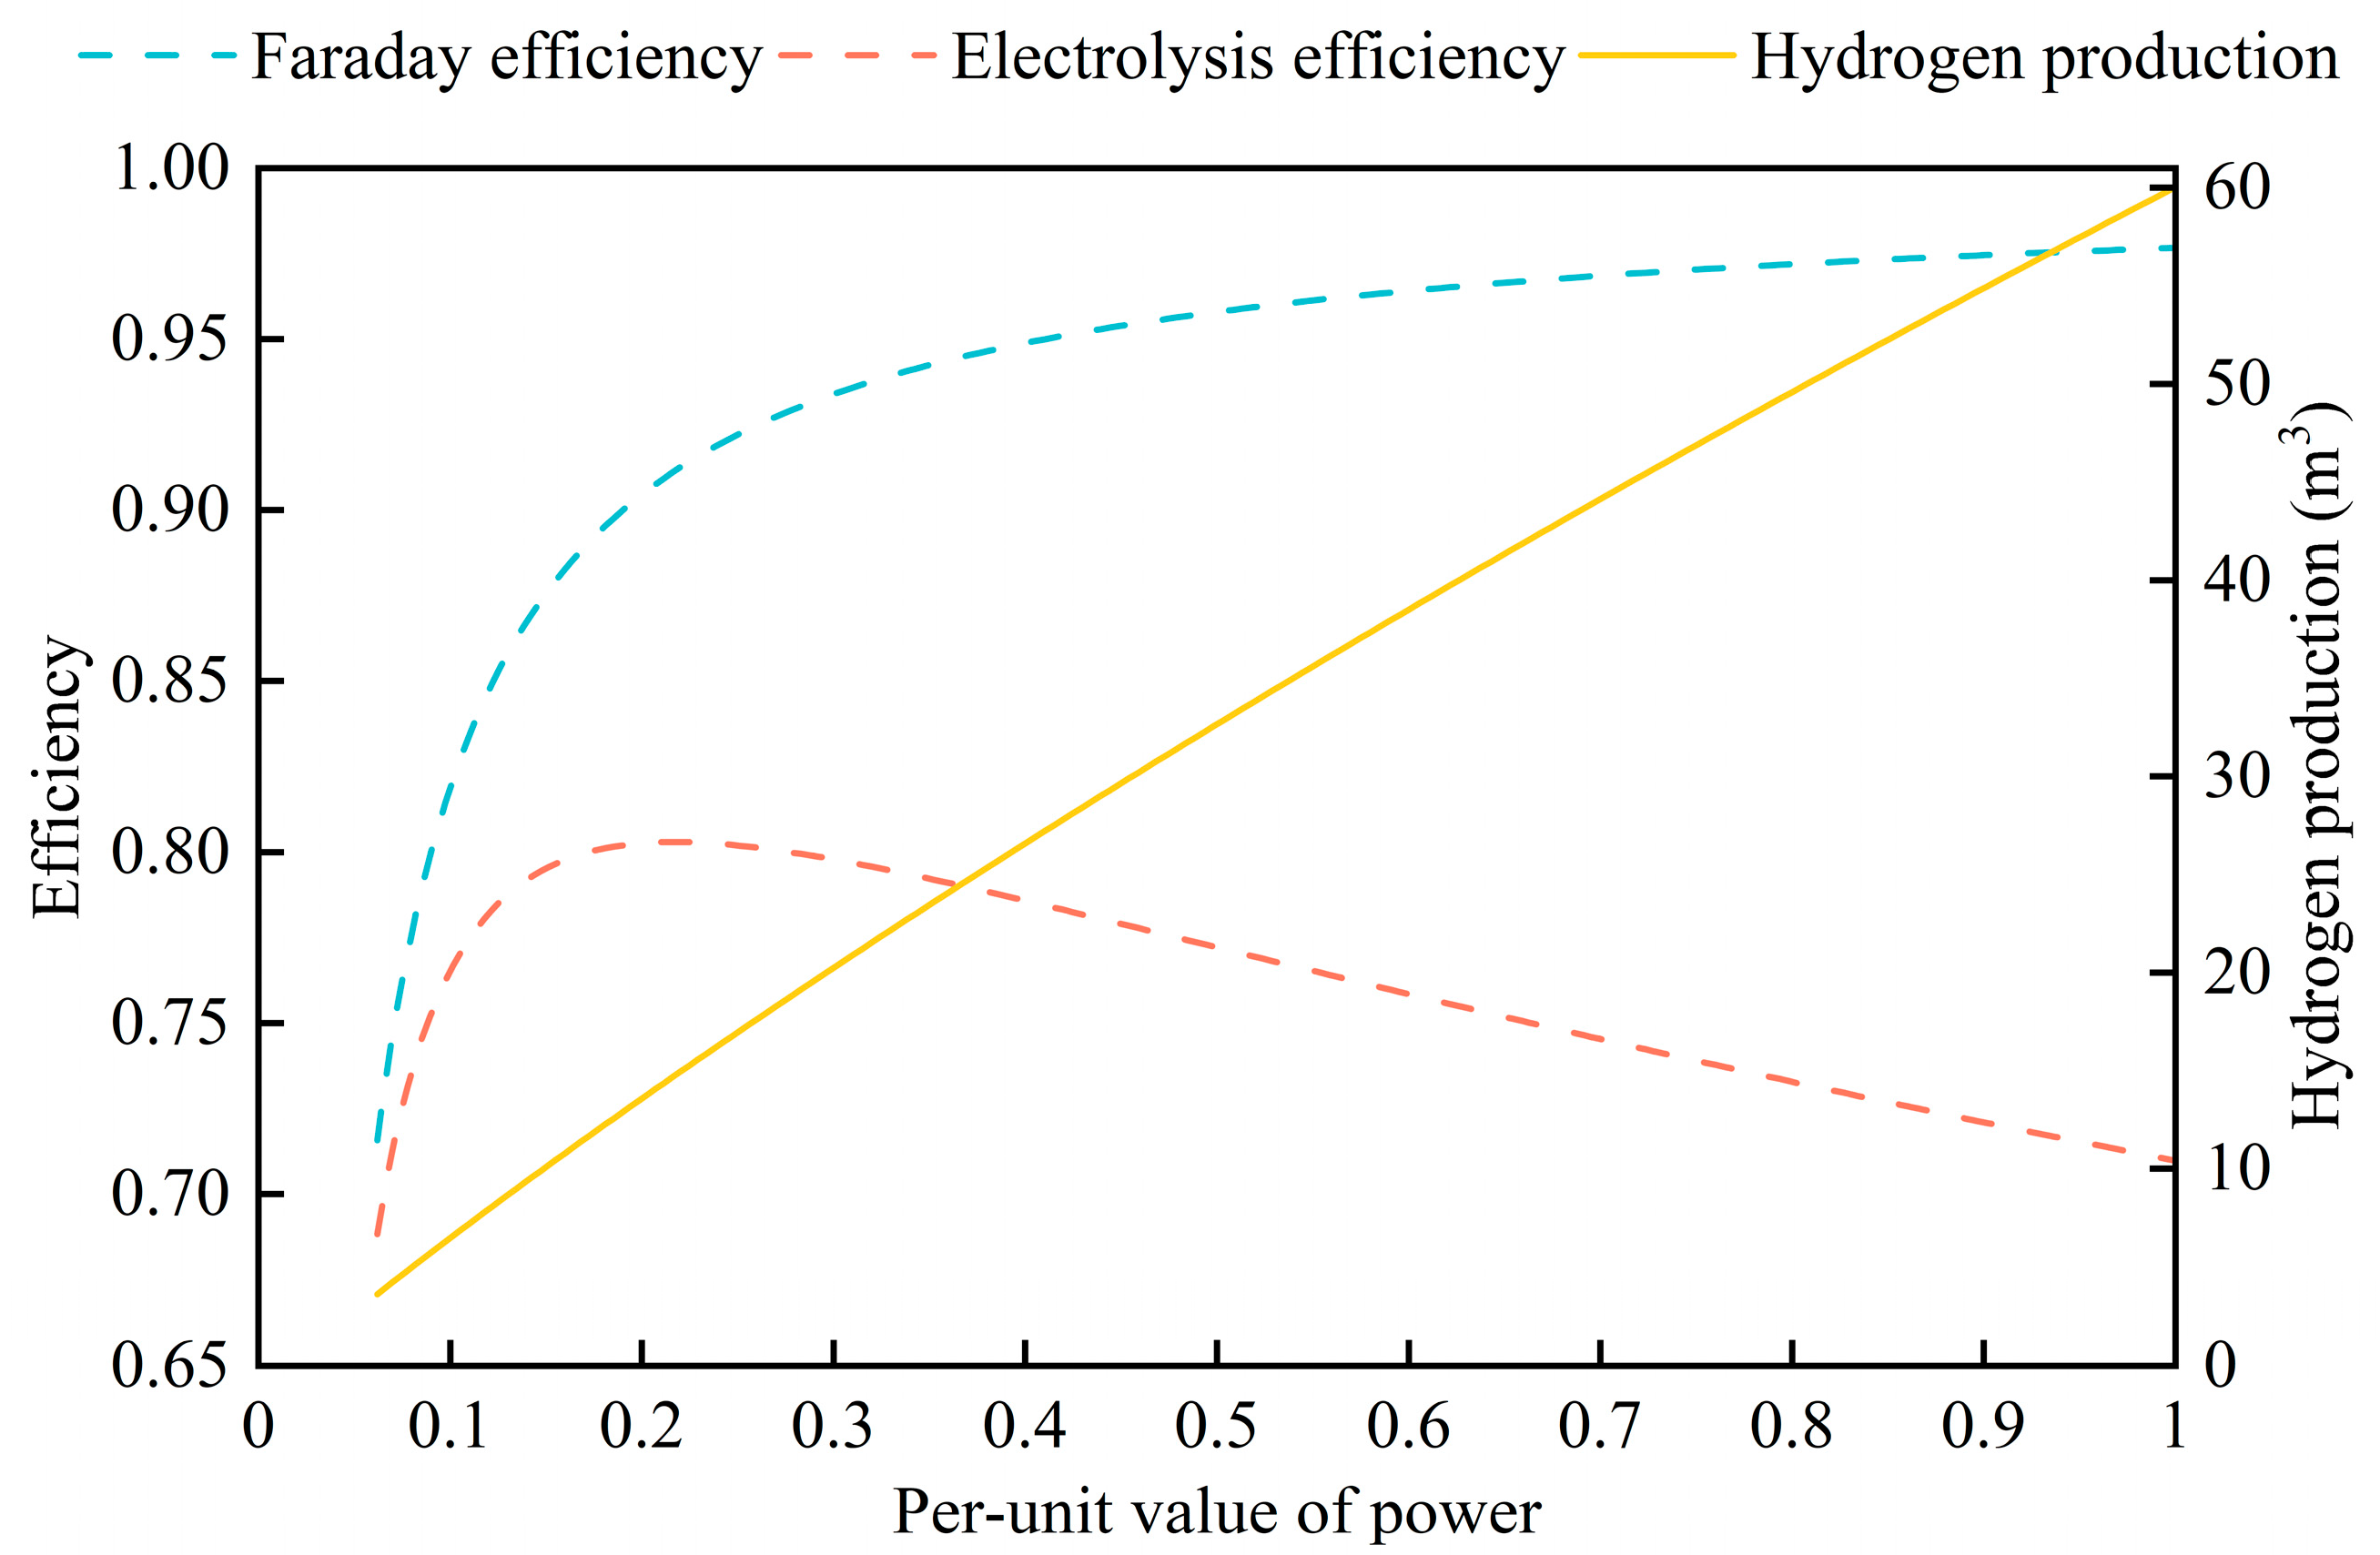
Figure 3, it can be seen that the efficiency of the SDU is not the highest when it is at rated power, whereas the SDU of Scenario 1 operated at these times with higher efficiency than that of Scenario 2, proving that keeping them at rated power at certain times results in a loss of efficiency and is not an optimal operational strategy. At 12:00, the PEMEL in both scenarios operated at rated power to ensure maximum hydrogen production.
Figure 8 shows the power allocation of resource islands in Scenarios 3 and 4. The results demonstrate similar power allocation characteristics between these two scenarios. Both desalination and electrolysis hydrogen production systems of the two scenarios mainly operate in the high efficiency range, thanks to the fact that both of them consider the dynamically changing characteristics of the efficiency of the dissipation unit. It is noteworthy that the electrolysis power is significantly higher than the charging power in all four scenarios. This is primarily because the resource islands must not only supply hydrogen for ship propulsion but also deliver additional hydrogen to increase system revenue and thereby reduce the total cost, provided that the load island’s hydrogen load is satisfied.
5.3. Analysis of Renewable Energy Consumption Results
Table 3 shows the results of renewable energy consumption from Scenarios 1 to 6.
As shown in
Table 3, Scenarios 1 to 6 consume 18,433.88 kWh, 18,450.64 kWh, 17,787.70 kWh, 18,204.83 kWh, 17,780.25 kWh, and 18,405.95 kWh of renewable energy, with curtailment rates of 1.01%, 0.92%, 4.48%, 2.24%, 4.52%, and 1.16%, respectively. Notably, compared to Scenario 3, the curtailment rate in Scenario 1 decreased by 77.46%, highlighting the impact of the proposed strategy in optimizing renewable energy utilization. Renewable energy consumption in low-speed sailing scenarios (Scenarios 3 and 5) is lower than that in the corresponding scenarios that consider the flexibility of the ship (Scenarios 1 and 2). This is primarily because low-speed sailing limits the resource transfer rate, resulting in partial underutilization of renewable energy. In contrast, high-speed sailing scenarios (Scenarios 4 and 6) have a higher transfer rate, enabling greater resource transfer. However, the equipment on the resource islands is unable to generate sufficient output in time, leading to the curtailment of renewable energy within the system. As a result, overall consumption remains lower than in scenarios where ship flexibility is considered. In conclusion, considering the ship’s speed variation capability allows for greater renewable energy absorption and reduces the curtailment rate.
5.4. Analysis of the System Operational Efficiency
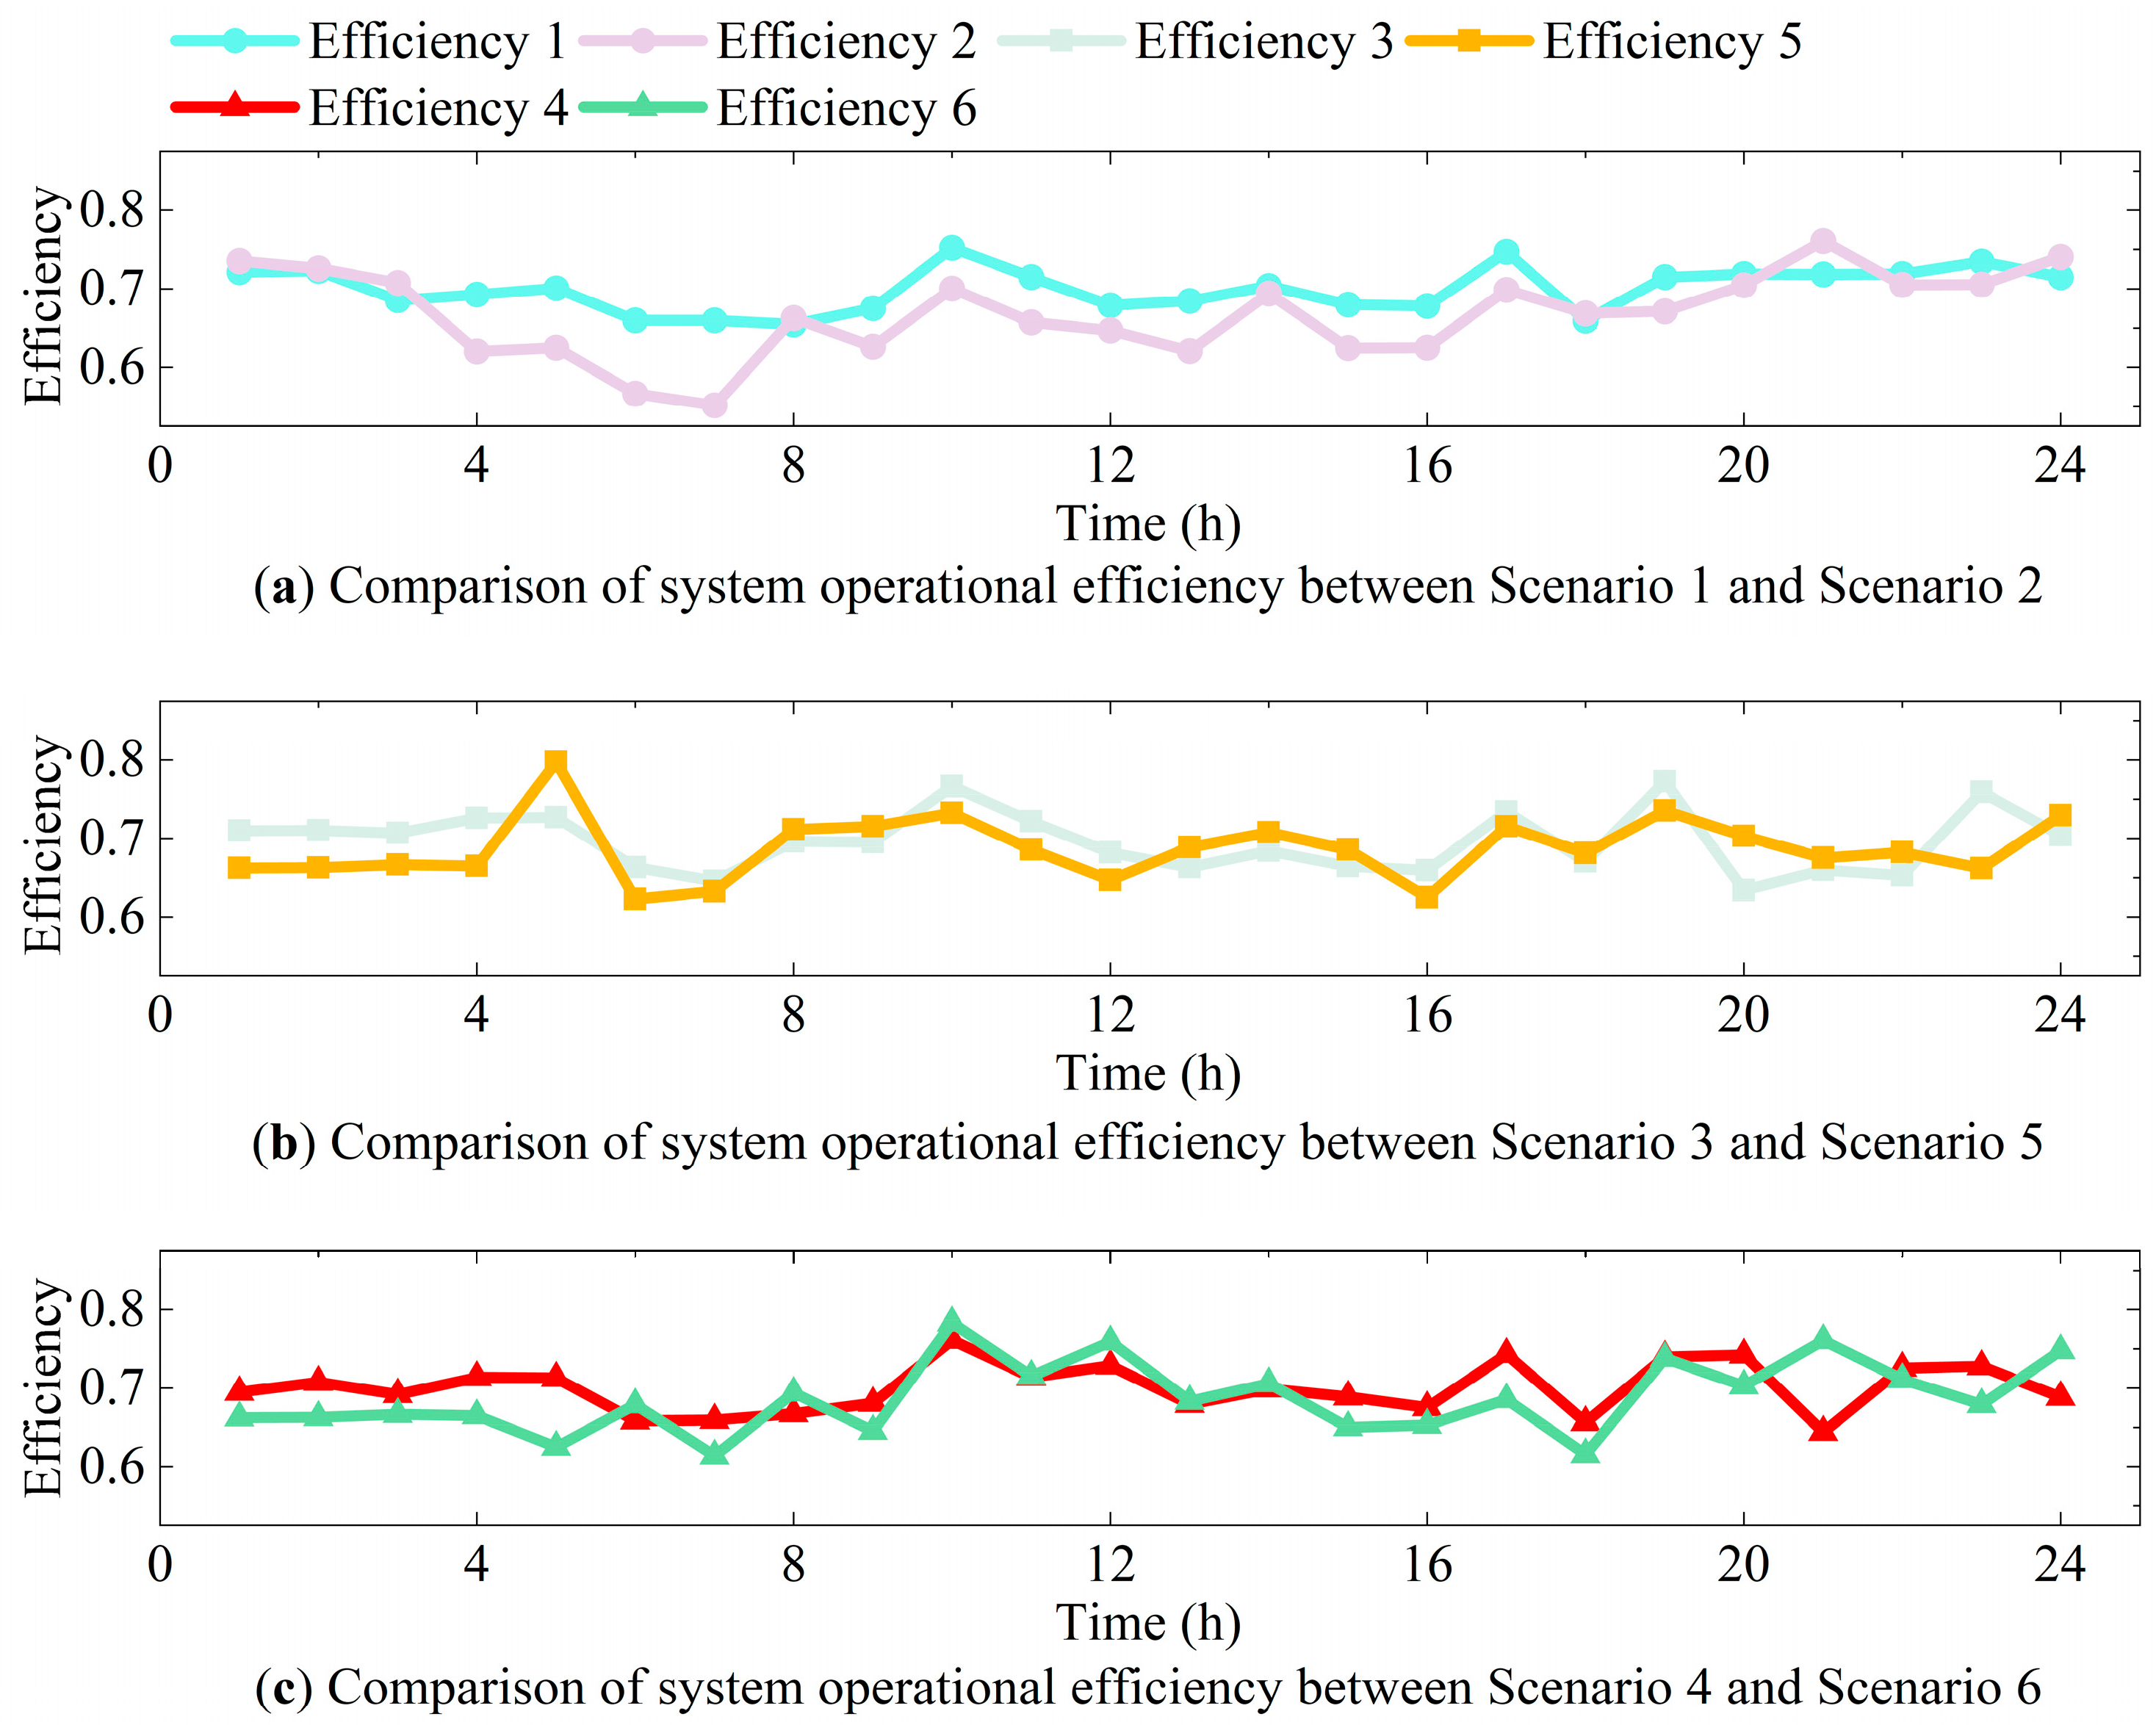
Figure 9 shows the operational efficiency of the system under the six scenarios, where Efficiency 1 to Efficiency 6 denote the operational efficiency of the system for Scenarios 1 to 6, respectively. The overall operational efficiencies of Scenarios 1 to 6 are 70.12%, 66.86%, 69.97%, 70.34%, 68.97%, and 68.99%, respectively. It is evident that the overall operational efficiency of Scenario 1 is improved by 4.88% compared with Scenario 2, which aligns with the optimization strategy proposed in this study. As shown, Scenarios 1, 3, and 4 exhibit higher operating efficiencies than their fixed-efficiency counterparts for the majority of the time. Meanwhile, the efficiencies of the fixed-efficiency scenarios fluctuate significantly over time, and compared to their counterpart scenarios, these scenarios exhibit the lowest efficiencies. In addition, the operating efficiency of fixed-efficiency scenarios is higher than that of variable-efficiency scenarios during certain time periods. Due to the higher efficiency of BSs and PEMELs, when a BS or PEMEL operating under a fixed-efficiency scenario produces a higher output at a certain point in time, its overall efficiency may be higher than that of the corresponding variable-efficiency scenario. For example, at 21:00, Scenario 2 (fixed-efficiency) shows higher efficiency than Scenario 1 (variable-efficiency), mainly due to its higher charging power. Similarly, at 18:00, Scenario 2 has higher efficiency due to its greater electrolysis power. In conclusion, considering the variable-efficiency characteristics of the SDU and PEMEL can improve the overall operational efficiency of the system.
5.5. Economic Analysis
In order to verify the validity of the method proposed in this paper, a scenario is added for comparison, and its method is referenced in [
12].
Table 4 shows the economic results under the seven scenarios. As shown, the total costs of Scenarios 1 to 7 are CNY 9480, CNY 9933, CNY 9997, CNY 11,938, CNY 10,388, CNY 12,424, and CNY 10,144, respectively. Compared with other scenarios, Scenario 1 achieves cost savings of 4.56%, 5.17%, 20.59%, 8.74%, 23.70%, and 6.55%, respectively. It can be seen that optimizing the system by ignoring the PEMEL and SDU variable-efficiency characteristics leads to an increase in cost. This is mainly because Scenarios 2, 5, and 6 adopt fixed-efficiency operation. However, as shown in
Figure 3 and
Figure 4, the efficiency is not maximized when the PEMEL and SDU operate at or near their rated power. As a result, more electricity is required to produce a unit mass of hydrogen and water, leading to inefficient energy utilization and distribution and, ultimately, increasing the total system cost. Compared with Scenario 1, the total cost of Scenario 3 increases, mainly due to the fact that the ship sails at a low speed and the resource transfer speed is limited, which leads to the system abandoning energy, unreasonable resource transfer, and higher navigation costs, which, in turn, leads to an increase in the total cost. Whereas in Scenario 4, the ship sails at a high speed and hydrogen consumption increases by 36.75 kg compared with Scenario 1, leading to a significant decrease in hydrogen delivery, which, in turn, increases the cost. Compared with Scenario 3, the total cost of Scenario 7 (based on the approach in Reference [
12]) increases by CNY 147. This increase is mainly due to the failure to account for the changing efficiency characteristics of the SDU, which leads to some energy being wasted, thus increasing the cost.
In summary, Scenario 1 achieves the lowest total cost among the six scenarios, primarily due to two factors. On the one hand, by considering the variable-efficiency characteristics of the dissipation device, it optimizes the timing of the energy distribution, enabling more efficient energy use and reducing losses. On the other hand, by leveraging the variable-speed characteristics of mobile storage, it adjusts the rate of resource transfer, thereby consuming more surplus renewable energy and minimizing unnecessary energy waste. The synergistic effect of these two optimizations leads to a significant reduction in total system cost.
5.6. Analysis of Flexible Transfer Results for Water–Electricity–Hydrogen Hybrid Resources
Figure 10 shows the ship transportation routes and energy consumption for Scenarios 1 to 6. As shown, three transportation tasks are arranged for Scenarios 1 to 6. The specific transportation routes are as follows: the transportation routes of Scenario 1, 4, and 6 are 1→3→1→3→2→1→3→2→1; the route of Scenario 2 is 1→3→2→1→3→1→3→2→1; and the routes of Scenarios 3 and 5 are 1→3→1→2→1→3→2→1. Additionally, in Scenarios 1 and 2, the ships operate at high speed during 21:00 and 23:00, resulting in a hydrogen consumption rate of 10.125 kg/h. At other times, they traveled at low speed with a consumption rate of 3 kg/h. Compared with Scenario 2, Scenario 3 saves 11.25 kg of hydrogen during transportation, while Scenario 4 increases hydrogen consumption by 36.75 kg.
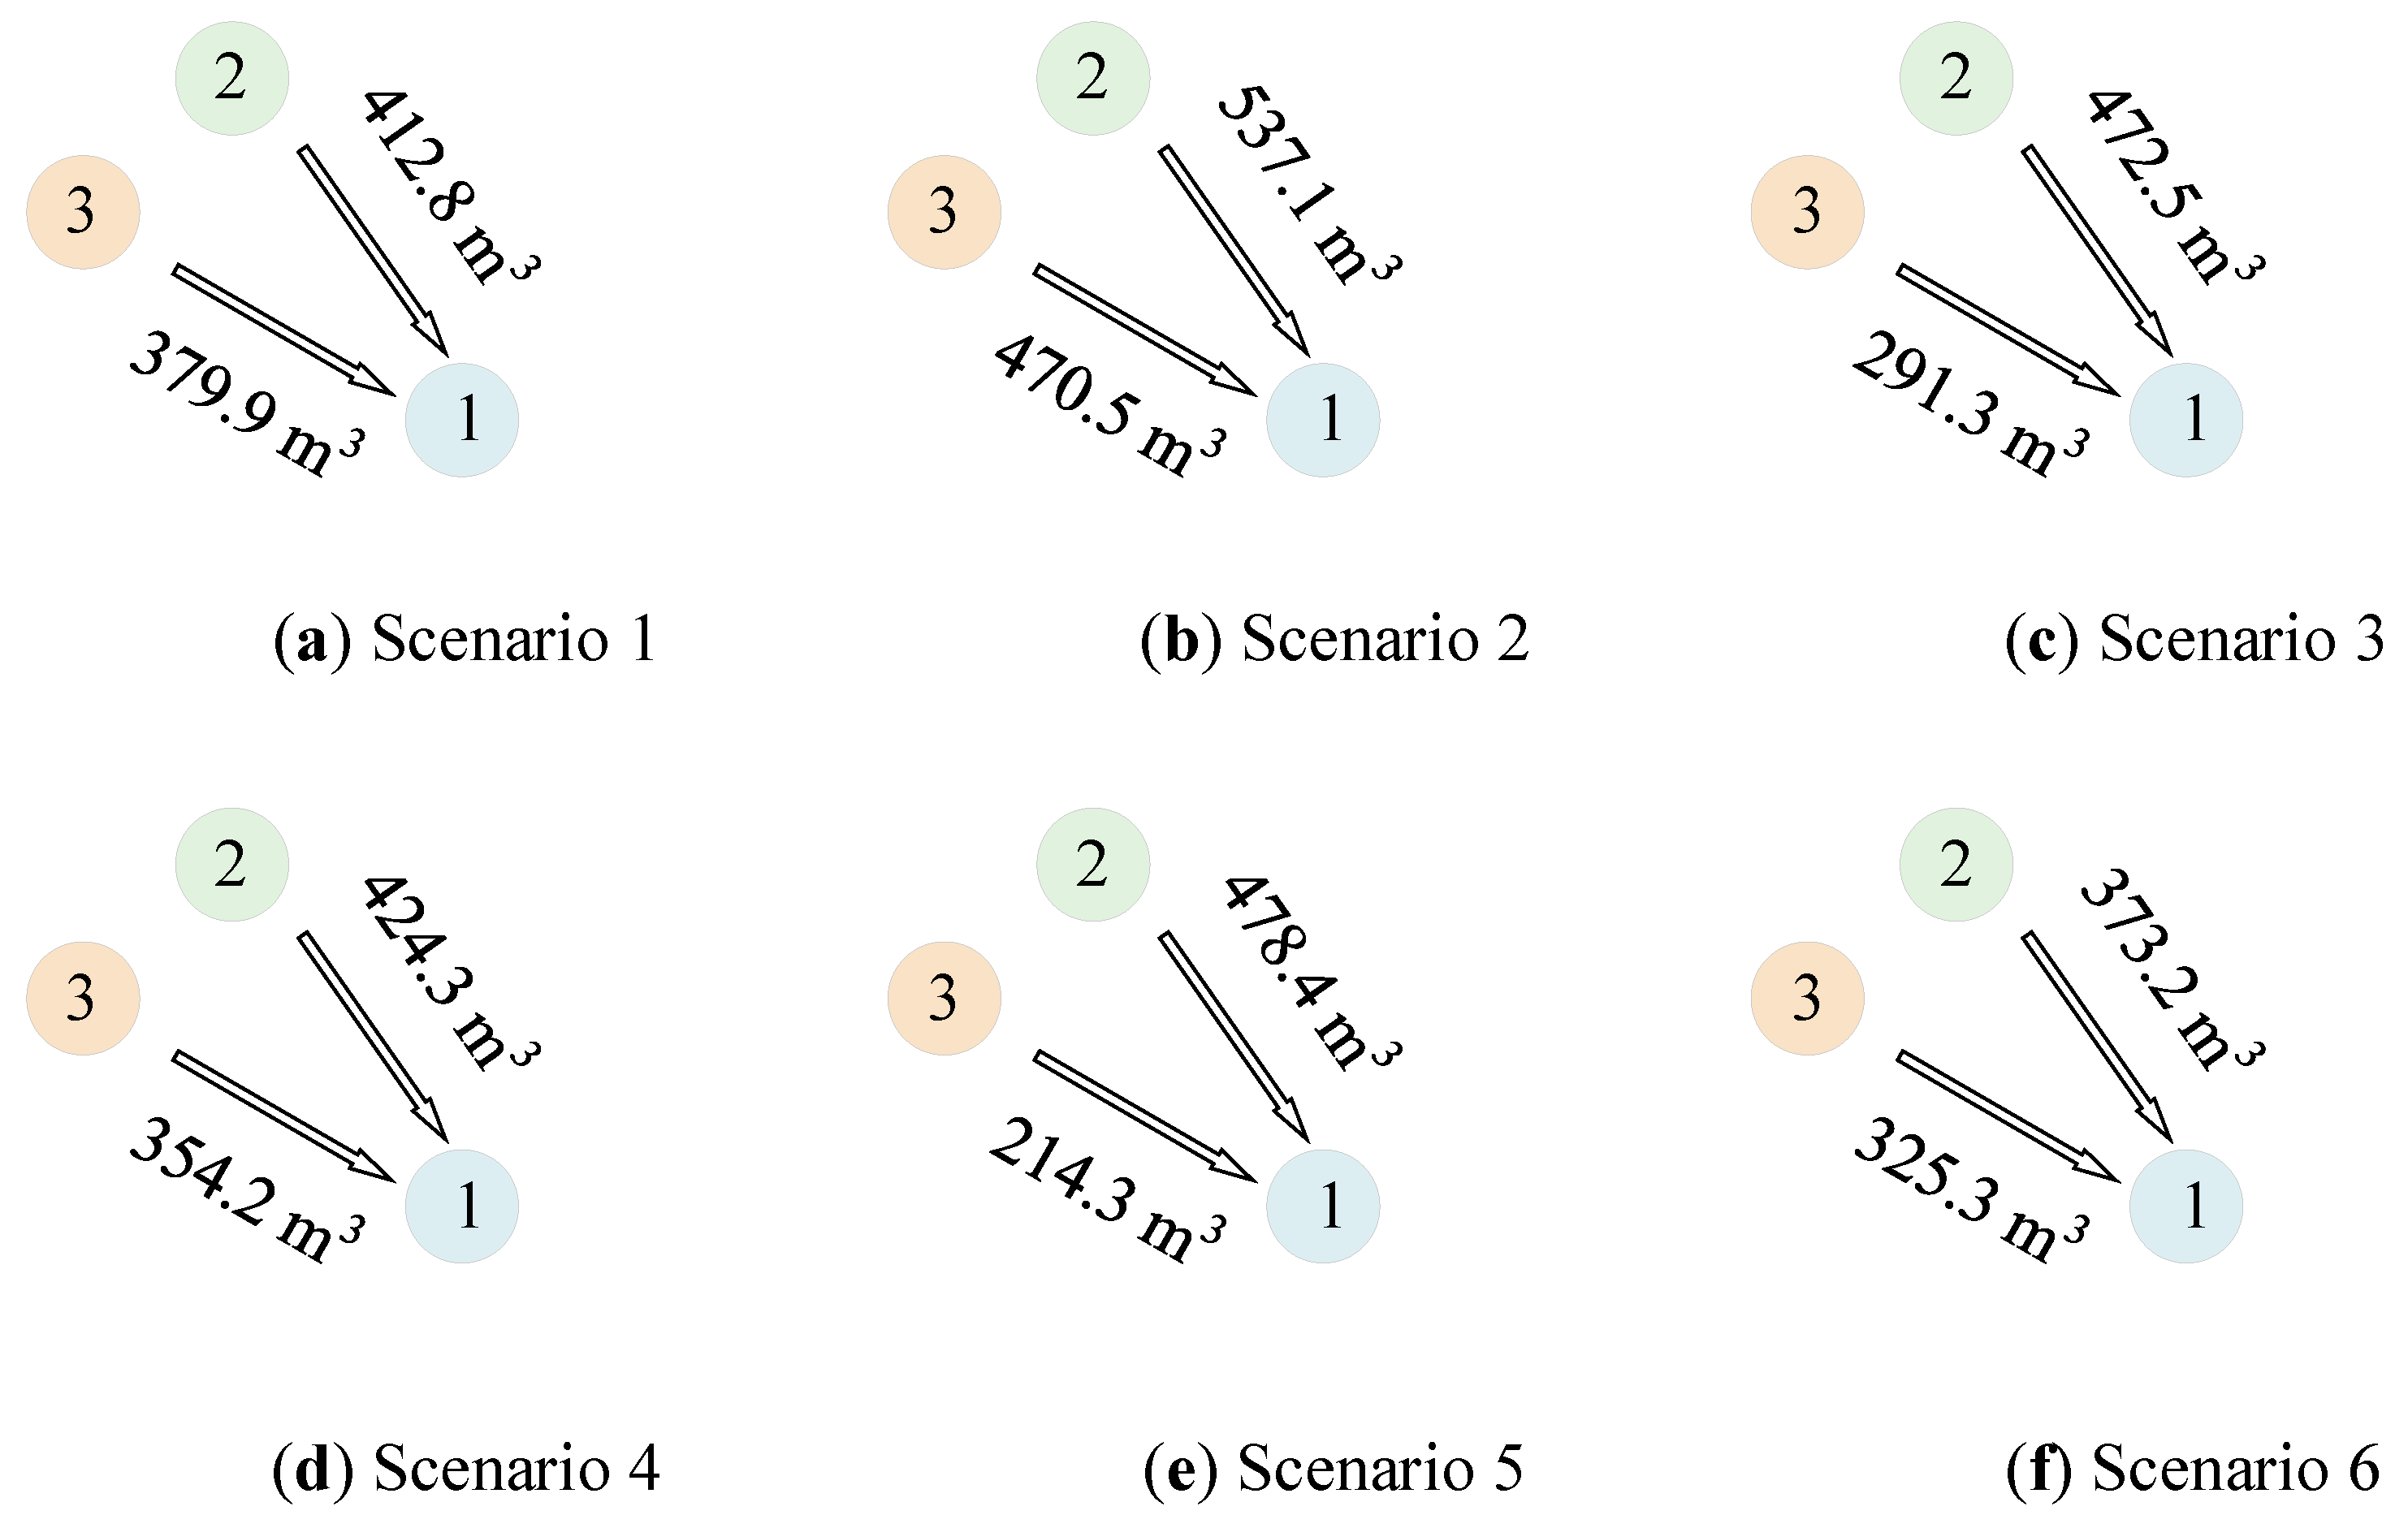
Figure 11 shows the water transportation across Scenarios 1 to 6.
As shown in
Figure 11, resource island 1 (island 2) delivered 412.8 m
3, 537.1 m
3, 472.5 m
3, 424.3 m
3, 478.4 m
3, and 373.2 m
3 of water to the load island in the respective scenarios. Similarly, resource island 2 (island 3) supplied 379.9 m
3, 470.5 m
3, 291.3 m
3, 354.2 m
3, 214.3 m
3, and 325.3 m
3 of water under the corresponding scenarios. Scenario 2 achieves the highest water transportation, primarily because transporting water under this strategy yields greater economic benefits compared with hydrogen. The water transportation in Scenario 5 is notably lower than in Scenarios 1 to 4, which is attributed to higher revenues from hydrogen transport. Likewise, Scenario 6 exhibits reduced water transportation relative to Scenarios 1 to 4, mainly due to increased hydrogen consumption for ship propulsion, resulting in diminished water output and transport.
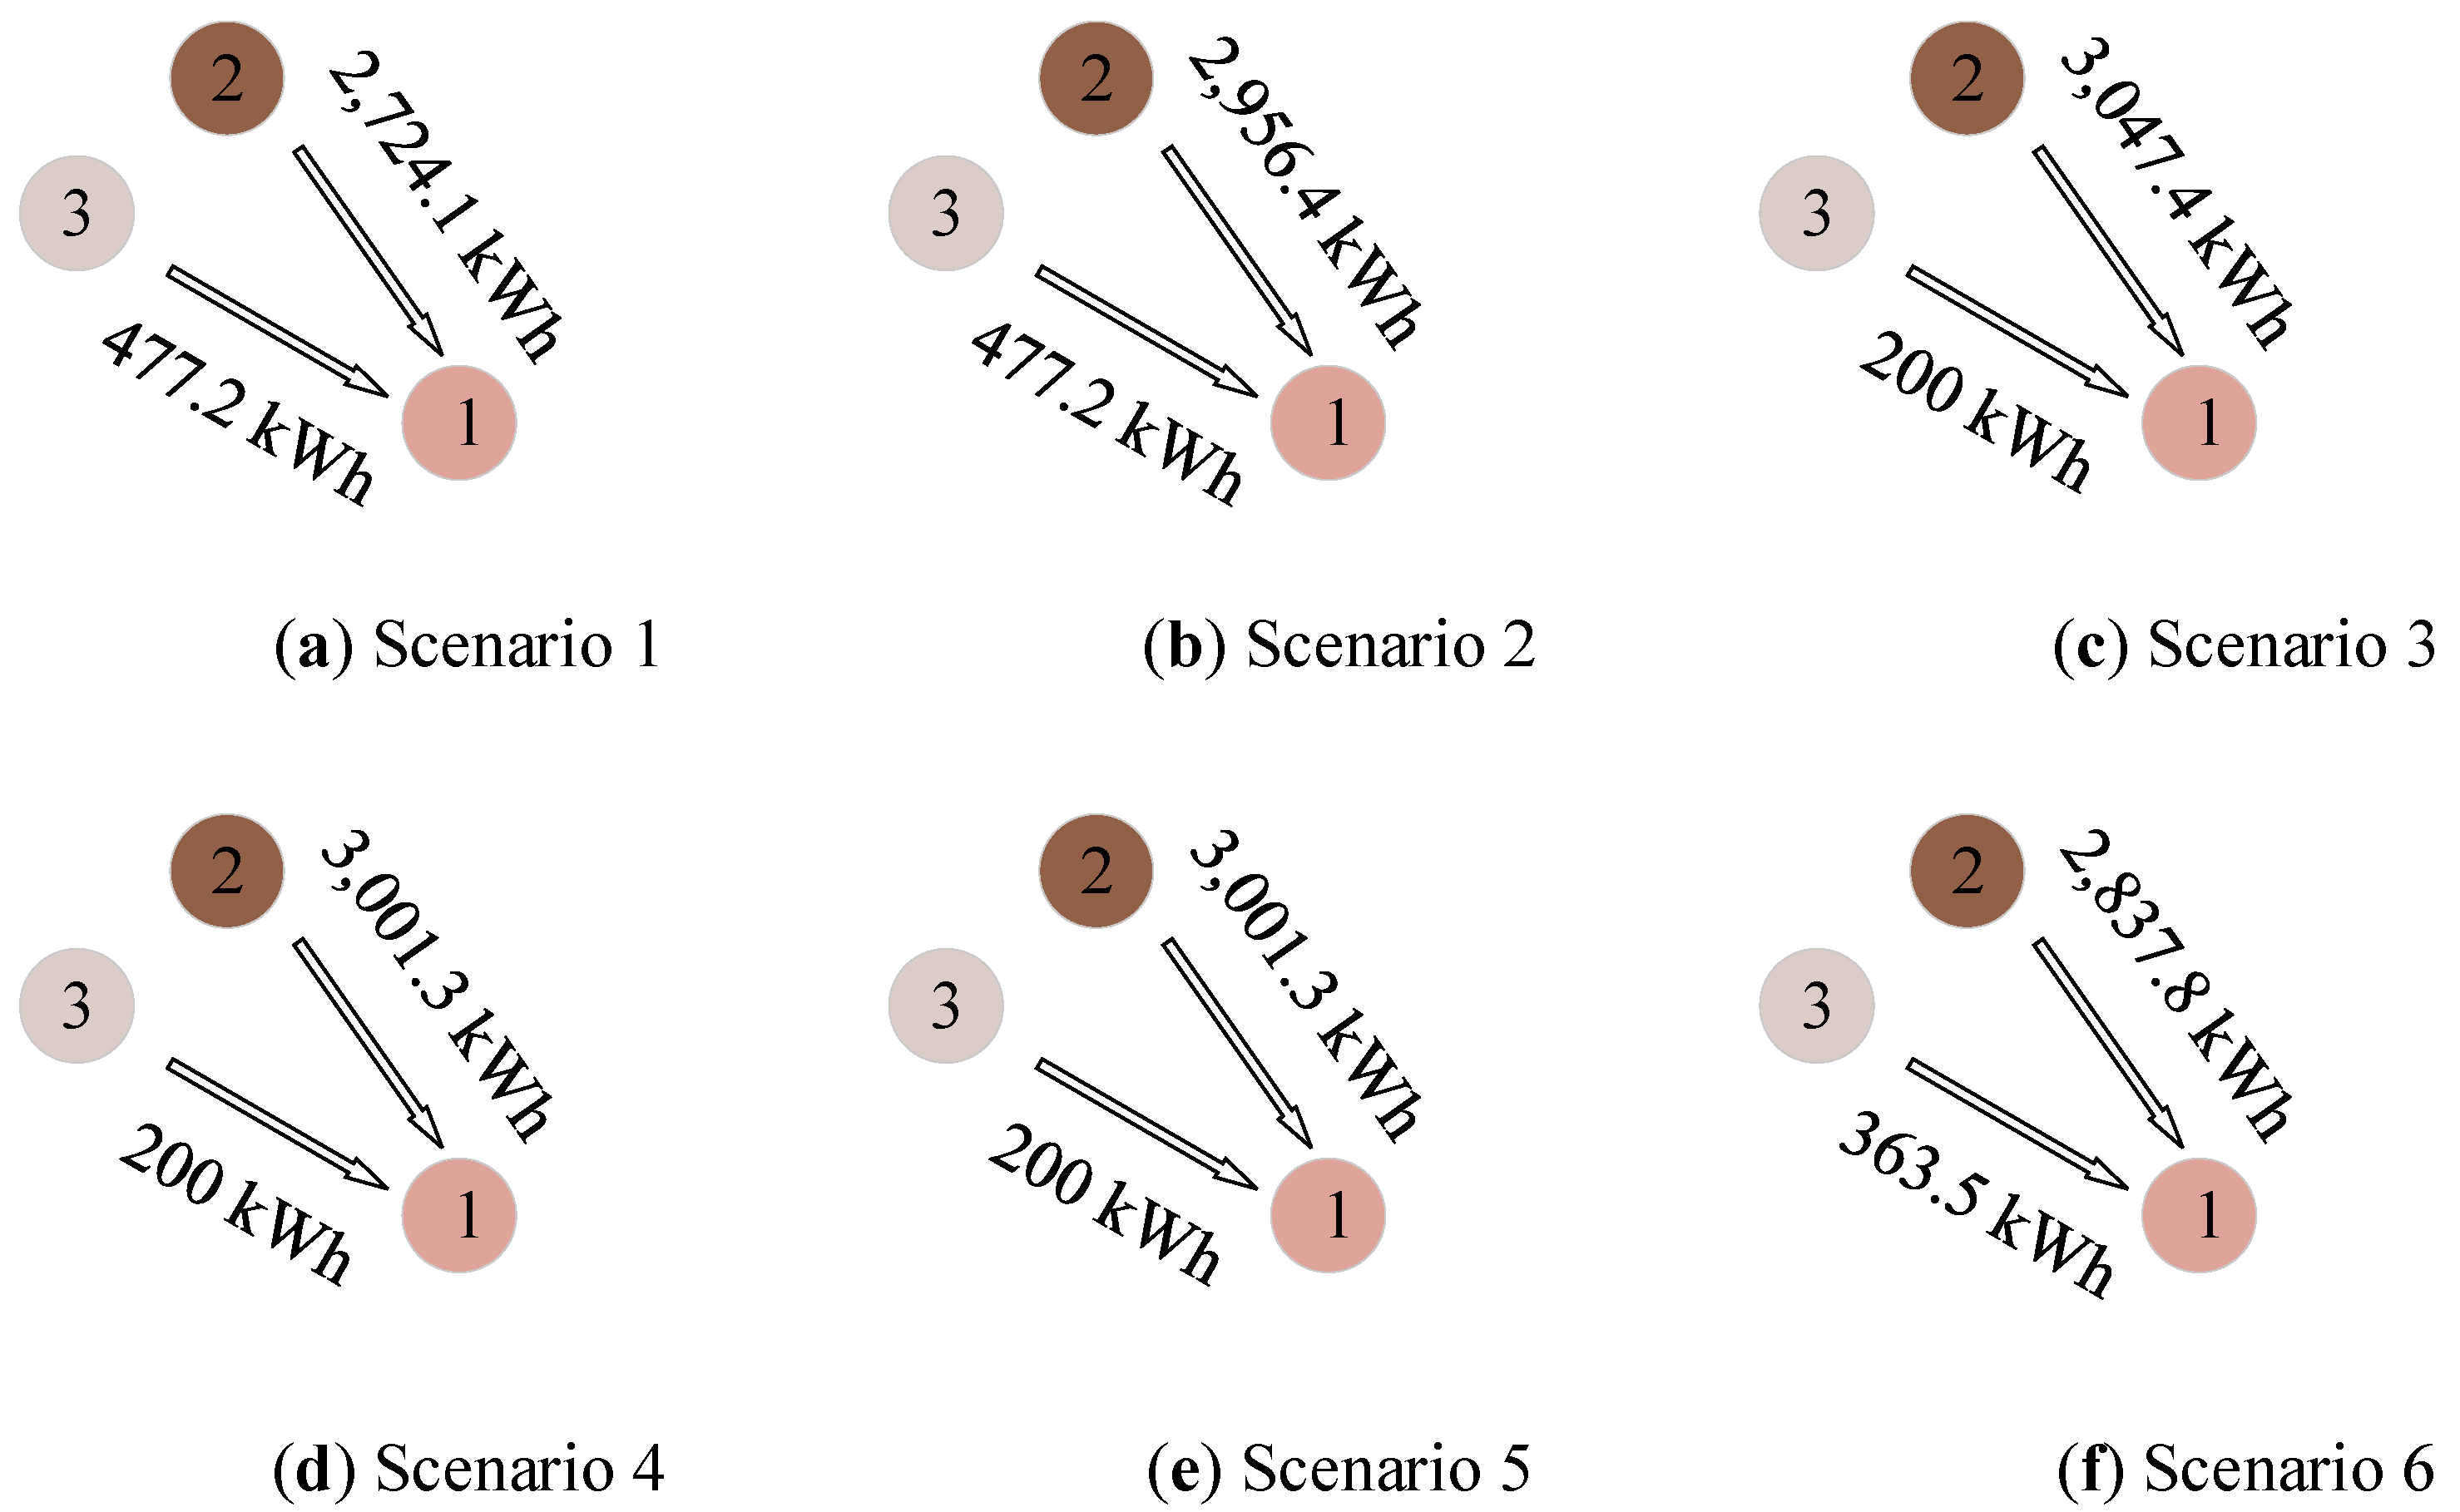
Figure 12 shows the electricity delivery under Scenarios 1 to 6. Resource island 1 (island 2) transmitted 2724.1 kWh, 2956.4 kWh, 3047.4 kWh, 3001.3 kWh, 3001.3 kWh, and 2837.8 kWh of electricity to the load island in the respective scenarios. Resource island 2 (island 3) transmitted 477.2 kWh, 477.2 kWh, 200 kWh, 200 kWh, 200 kWh, and 363.5 kWh of electricity to the load island across the corresponding scenarios. It can be seen that at least 3201.3 kWh of electricity is delivered across the six scenarios because the MT’s limited output capacity cannot fully meet the electricity demand, and the shortfall is compensated by BSs. Although increasing the amount of electricity delivered helps reduce the fuel and O&M costs of the MT, this strategy has a less significant effect on reducing total costs compared with water and hydrogen transportation.
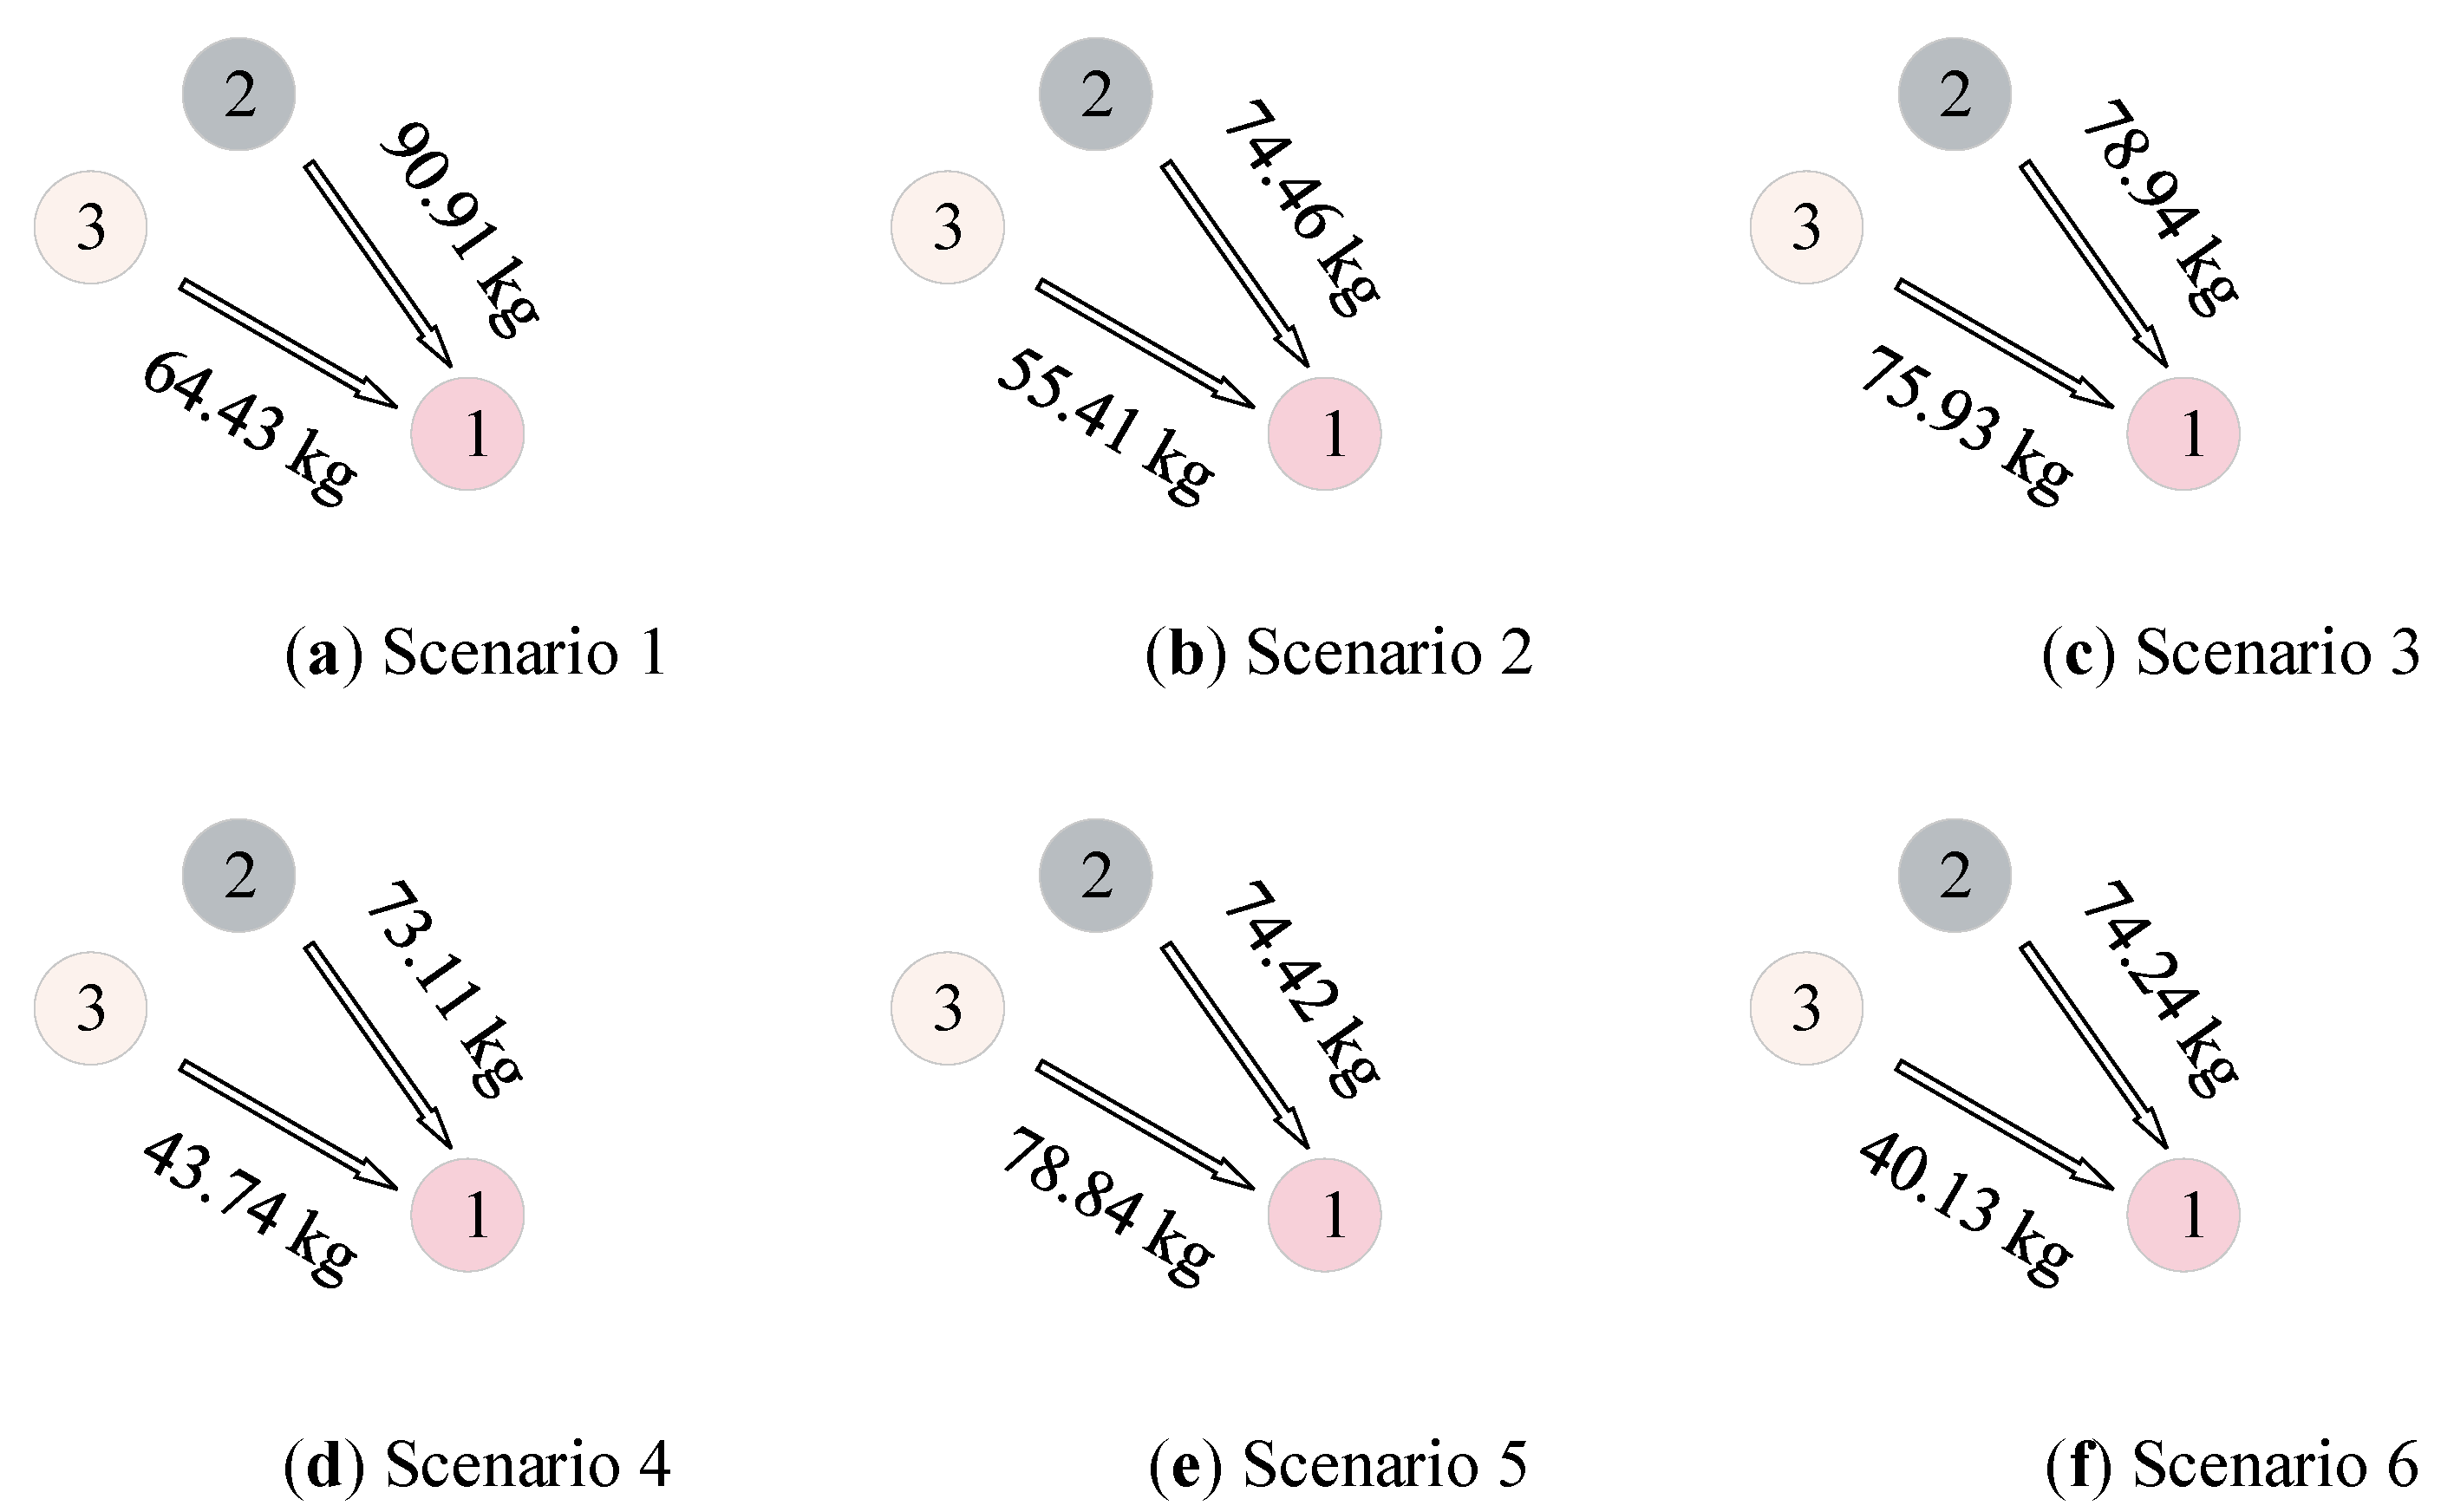
Figure 13 shows the hydrogen transportation under Scenarios 1 to 6. Resource island 1 (island 2) delivered 90.91 kg, 74.46 kg, 78.94 kg, 73.11 kg, 74.42 kg, and 74.24 kg of hydrogen to the load island in the respective scenarios. Resource island 2 (island 3) delivered 64.43 kg, 55.41 kg, 75.93 kg, 43.74 kg, 78.84 kg, and 40.13 kg of hydrogen under the corresponding scenarios. It can be observed that, compared with the low-speed sailing scenarios (Scenarios 3 and 5), the hydrogen transportation in the high-speed sailing scenarios (Scenarios 4 and 6) significantly decreases, primarily due to increased hydrogen consumption for ship navigation. In contrast, the scenarios considering variable ship speeds (Scenarios 1 and 2) do not exhibit a regular pattern in hydrogen transportation relative to their corresponding scenarios. This irregularity mainly stems from the differing economic benefits associated with transporting hydrogen and water in these two scenarios.
5.7. Sensitivity Analysis of Key Parameters
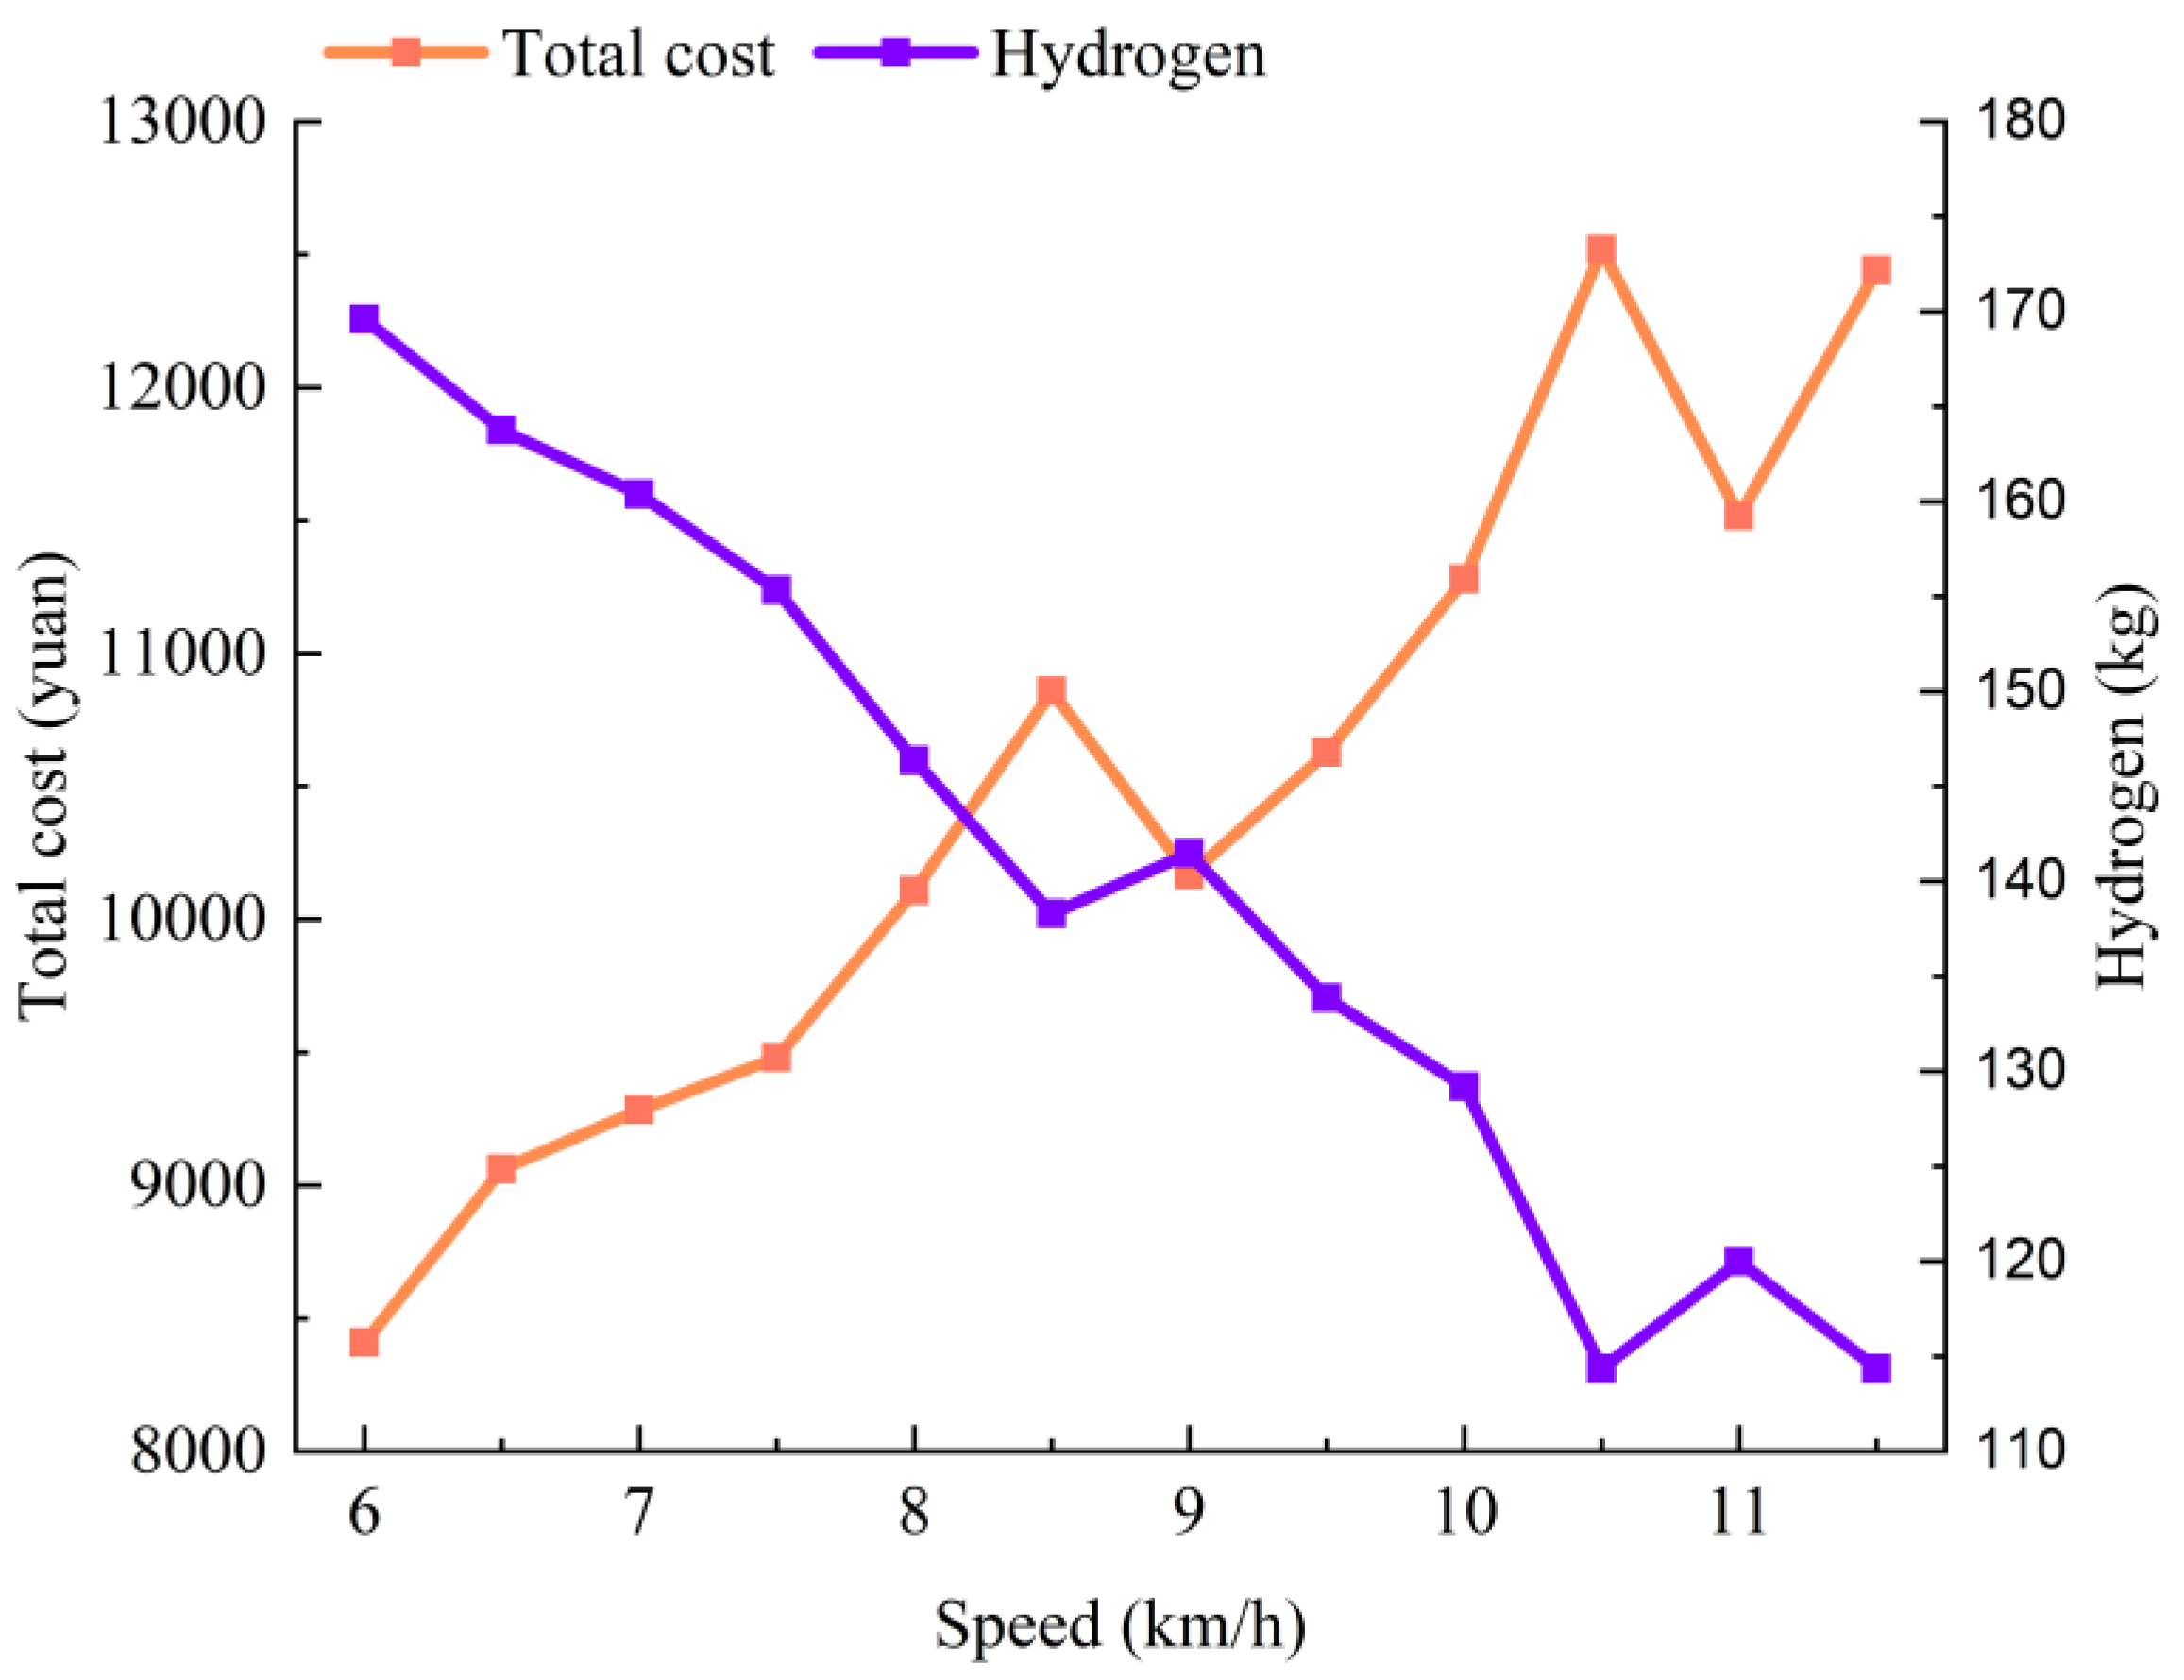
To explore the impact of key system parameters on optimization results, this paper focuses on analyzing the effects of ship speed on total cost and hydrogen delivery, as well as the effects of water price on total cost and water delivery and hydrogen price on total cost and hydrogen delivery.
Figure 14 shows the optimization results based on Scenario 1 with varying ship speeds. As shown in
Figure 14, when the ship speed is between 6 and 8.5 km/h or 9 and 10.5 km/h, the total system cost increases with the speed, mainly due to the increase in hydrogen consumption, which leads to a decrease in hydrogen delivery. However, at speeds of 9 and 11 km/h, the total cost suddenly decreases, primarily because the increased speed reduces the travel time between two islands, which, in turn, reduces hydrogen consumption and decreases navigation costs. Compared with a speed of 11.0 km/h, the increase in cost at a speed of 11.5 km/h is mainly due to the reduction in water and hydrogen delivery.
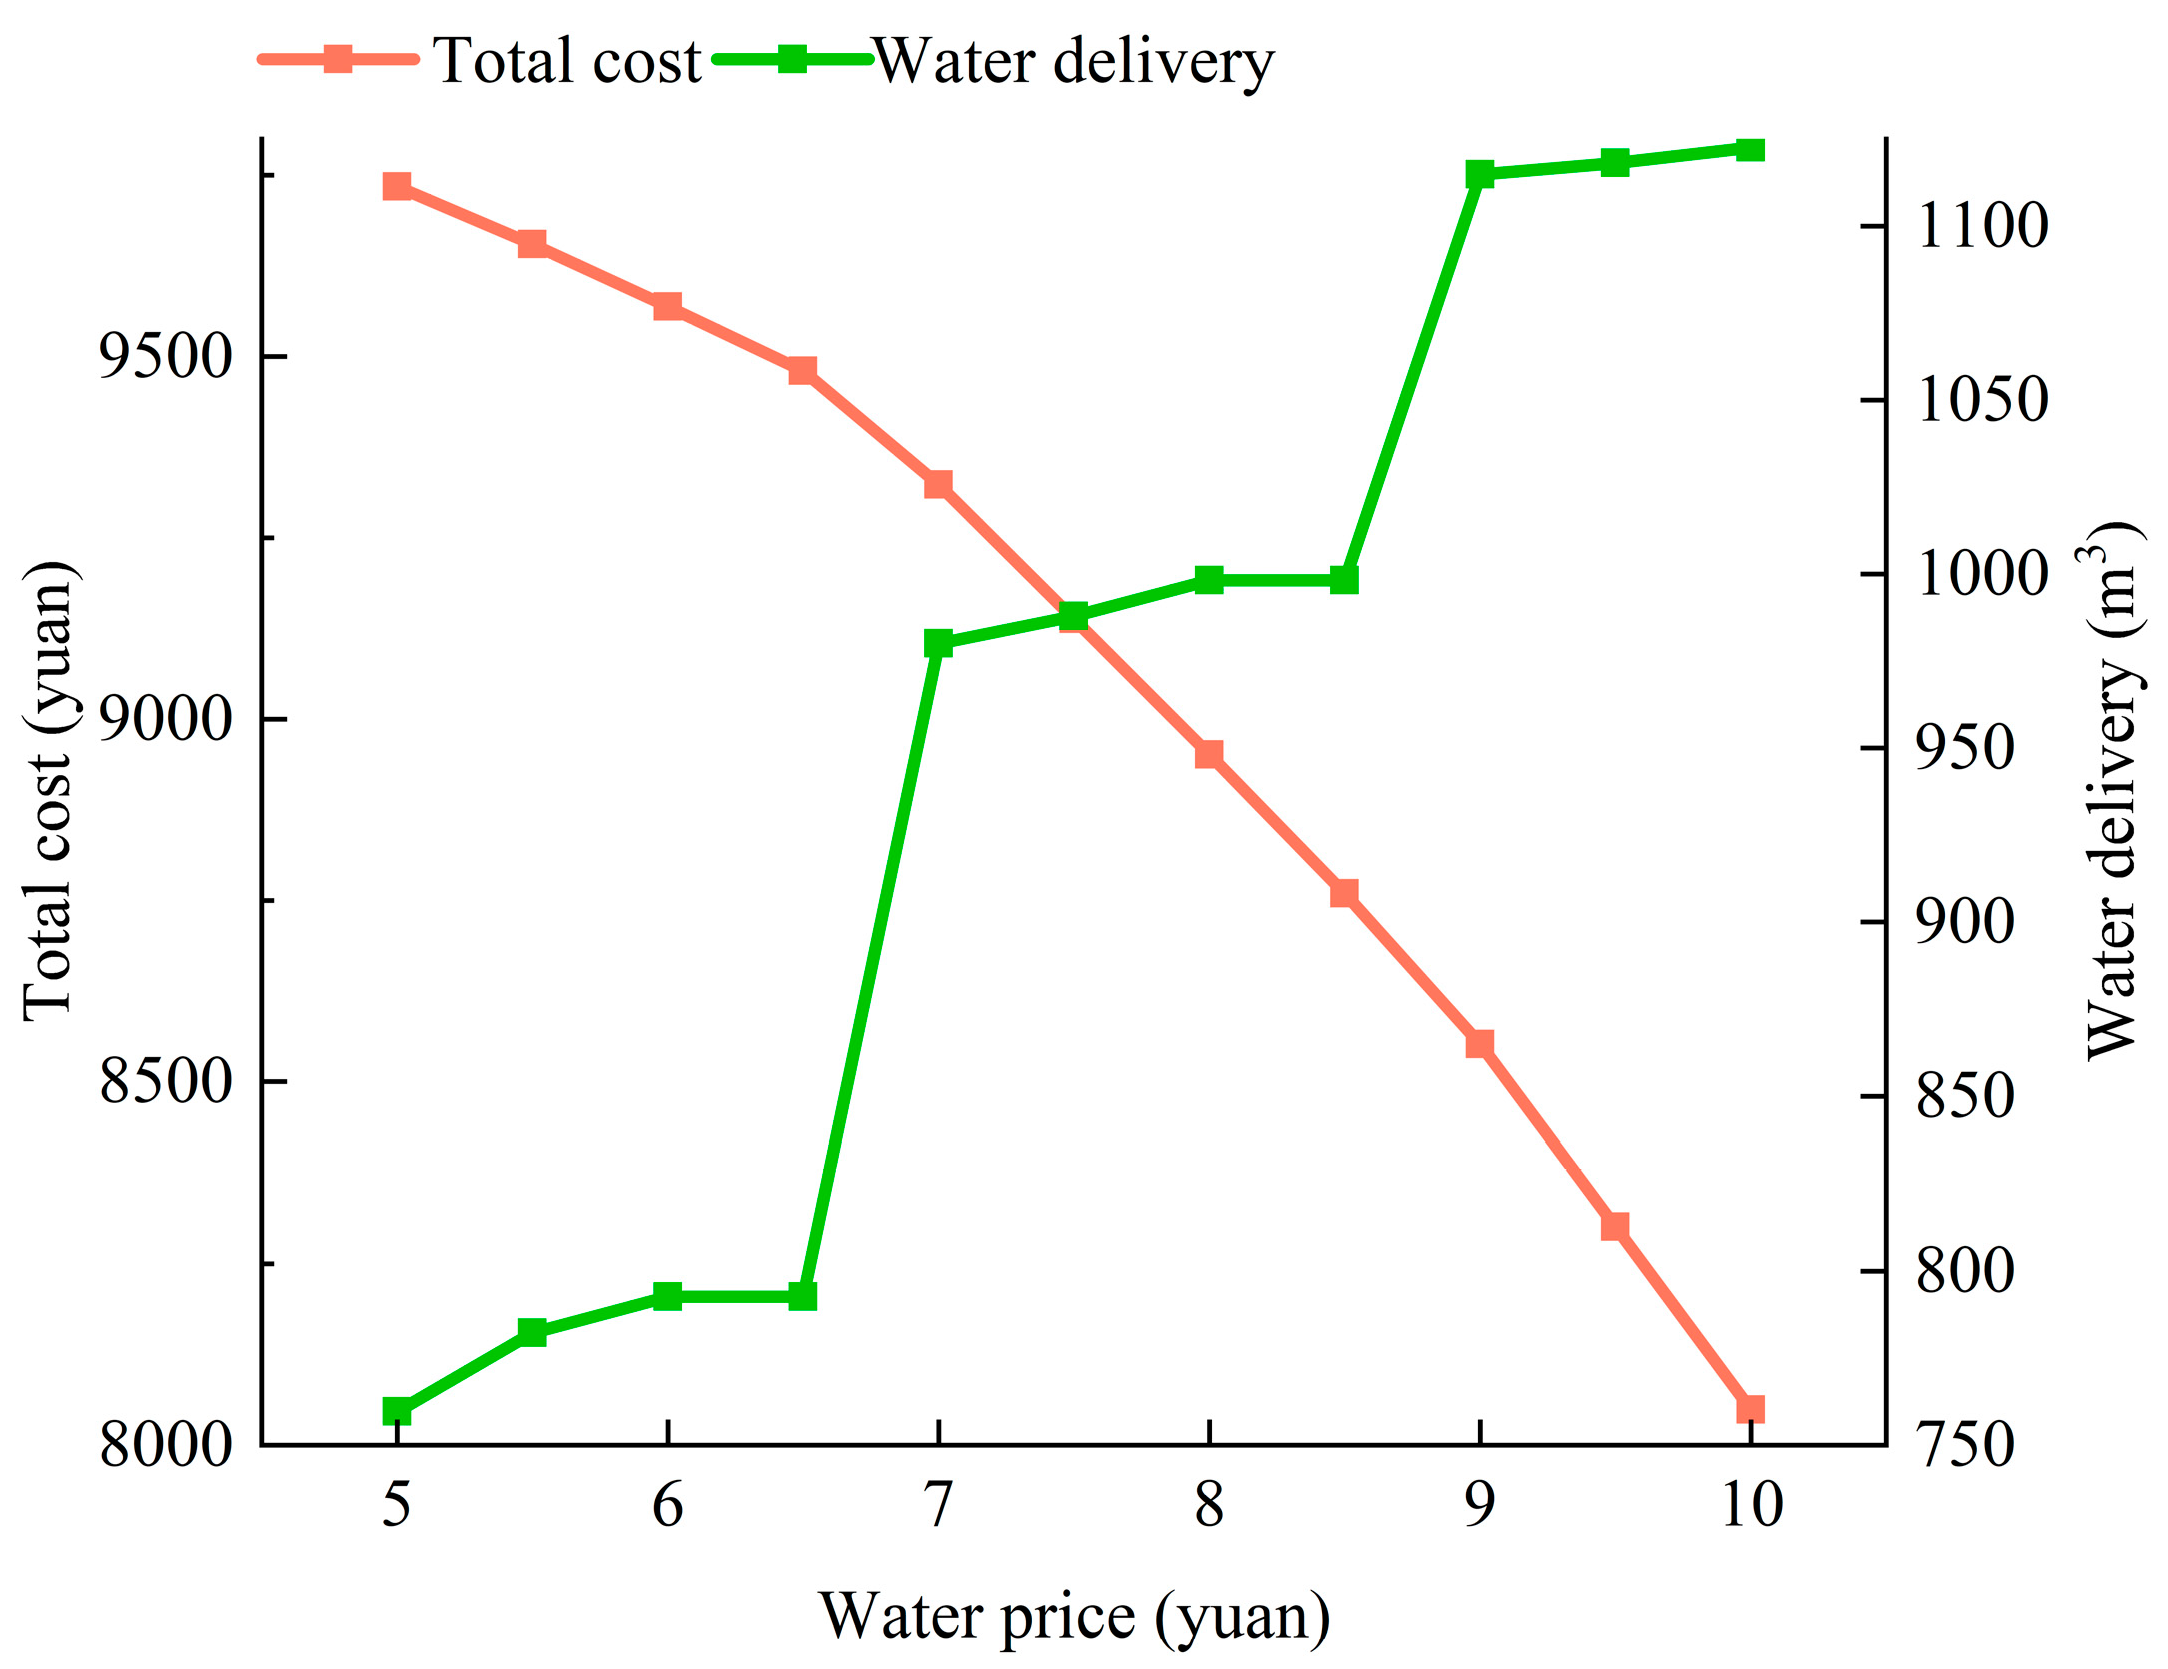
Figure 15 shows the optimization results based on Scenario 1 with varying water prices. As the water price increases, the total system cost shows a downward trend. When the water price is below 9 CNY/m
3, the system will increase water delivery to reduce costs, as the proportion of the water fee revenue increases. However, when the water price exceeds 9 CNY/m
3, the water delivery tends to stabilize as the price increases due to the stabilization of the output of the system’s equipment.
Figure 16 shows the optimization results based on Scenario 1 with varying hydrogen prices. As the hydrogen price increases, the total system cost shows a downward trend.
When the hydrogen price is below 85 CNY/kg, the system will increase hydrogen delivery to reduce costs, as the proportion of hydrogen revenue increases. However, when the hydrogen price exceeds 85 CNY/kg, the hydrogen delivery tends to stabilize as the price increases due to the stabilization of the output of the system’s equipment.
In summary, setting the ship’s speed and the prices of water and hydrogen is crucial for reducing the total system cost. Reasonably selecting the ship speed can increase hydrogen delivery, reduce unnecessary sailing consumption, lower sailing costs, and, ultimately, reduce overall costs. When the water price reaches 9 CNY/m3 or the hydrogen price reaches 85 CNY/kg, the output of each device tends to stabilize. Further increases in water or hydrogen prices have little effect on water or hydrogen delivery.
5.8. Analysis of the Model Scalability
The distance between each island was extended appropriately to test the scalability of the proposed model under longer sailing times. In the low-speed sailing mode, the sailing time between each island is 2 h. In the high-speed sailing mode, the sailing time between island 1 and island 2 is 2 h, while the sailing time between the other islands is 1 h. The results are shown in
Table 5. The total costs for Scenarios 1 to 3 are CNY 10,723, CNY 11,120, and CNY 11,031, respectively, with curtailment rates of 3.01%, 2.82%, and 4.45%, respectively. In the three scenarios, the resource islands provided 773.5 m
3, 737.5 m
3, and 730.4 m
3 of water; 3201.3 kWh, 3201.3 kWh, and 3247.2 kWh of electricity; and 150.2 kg, 144.8 kg, and 149.2 kg of resources to the load island.
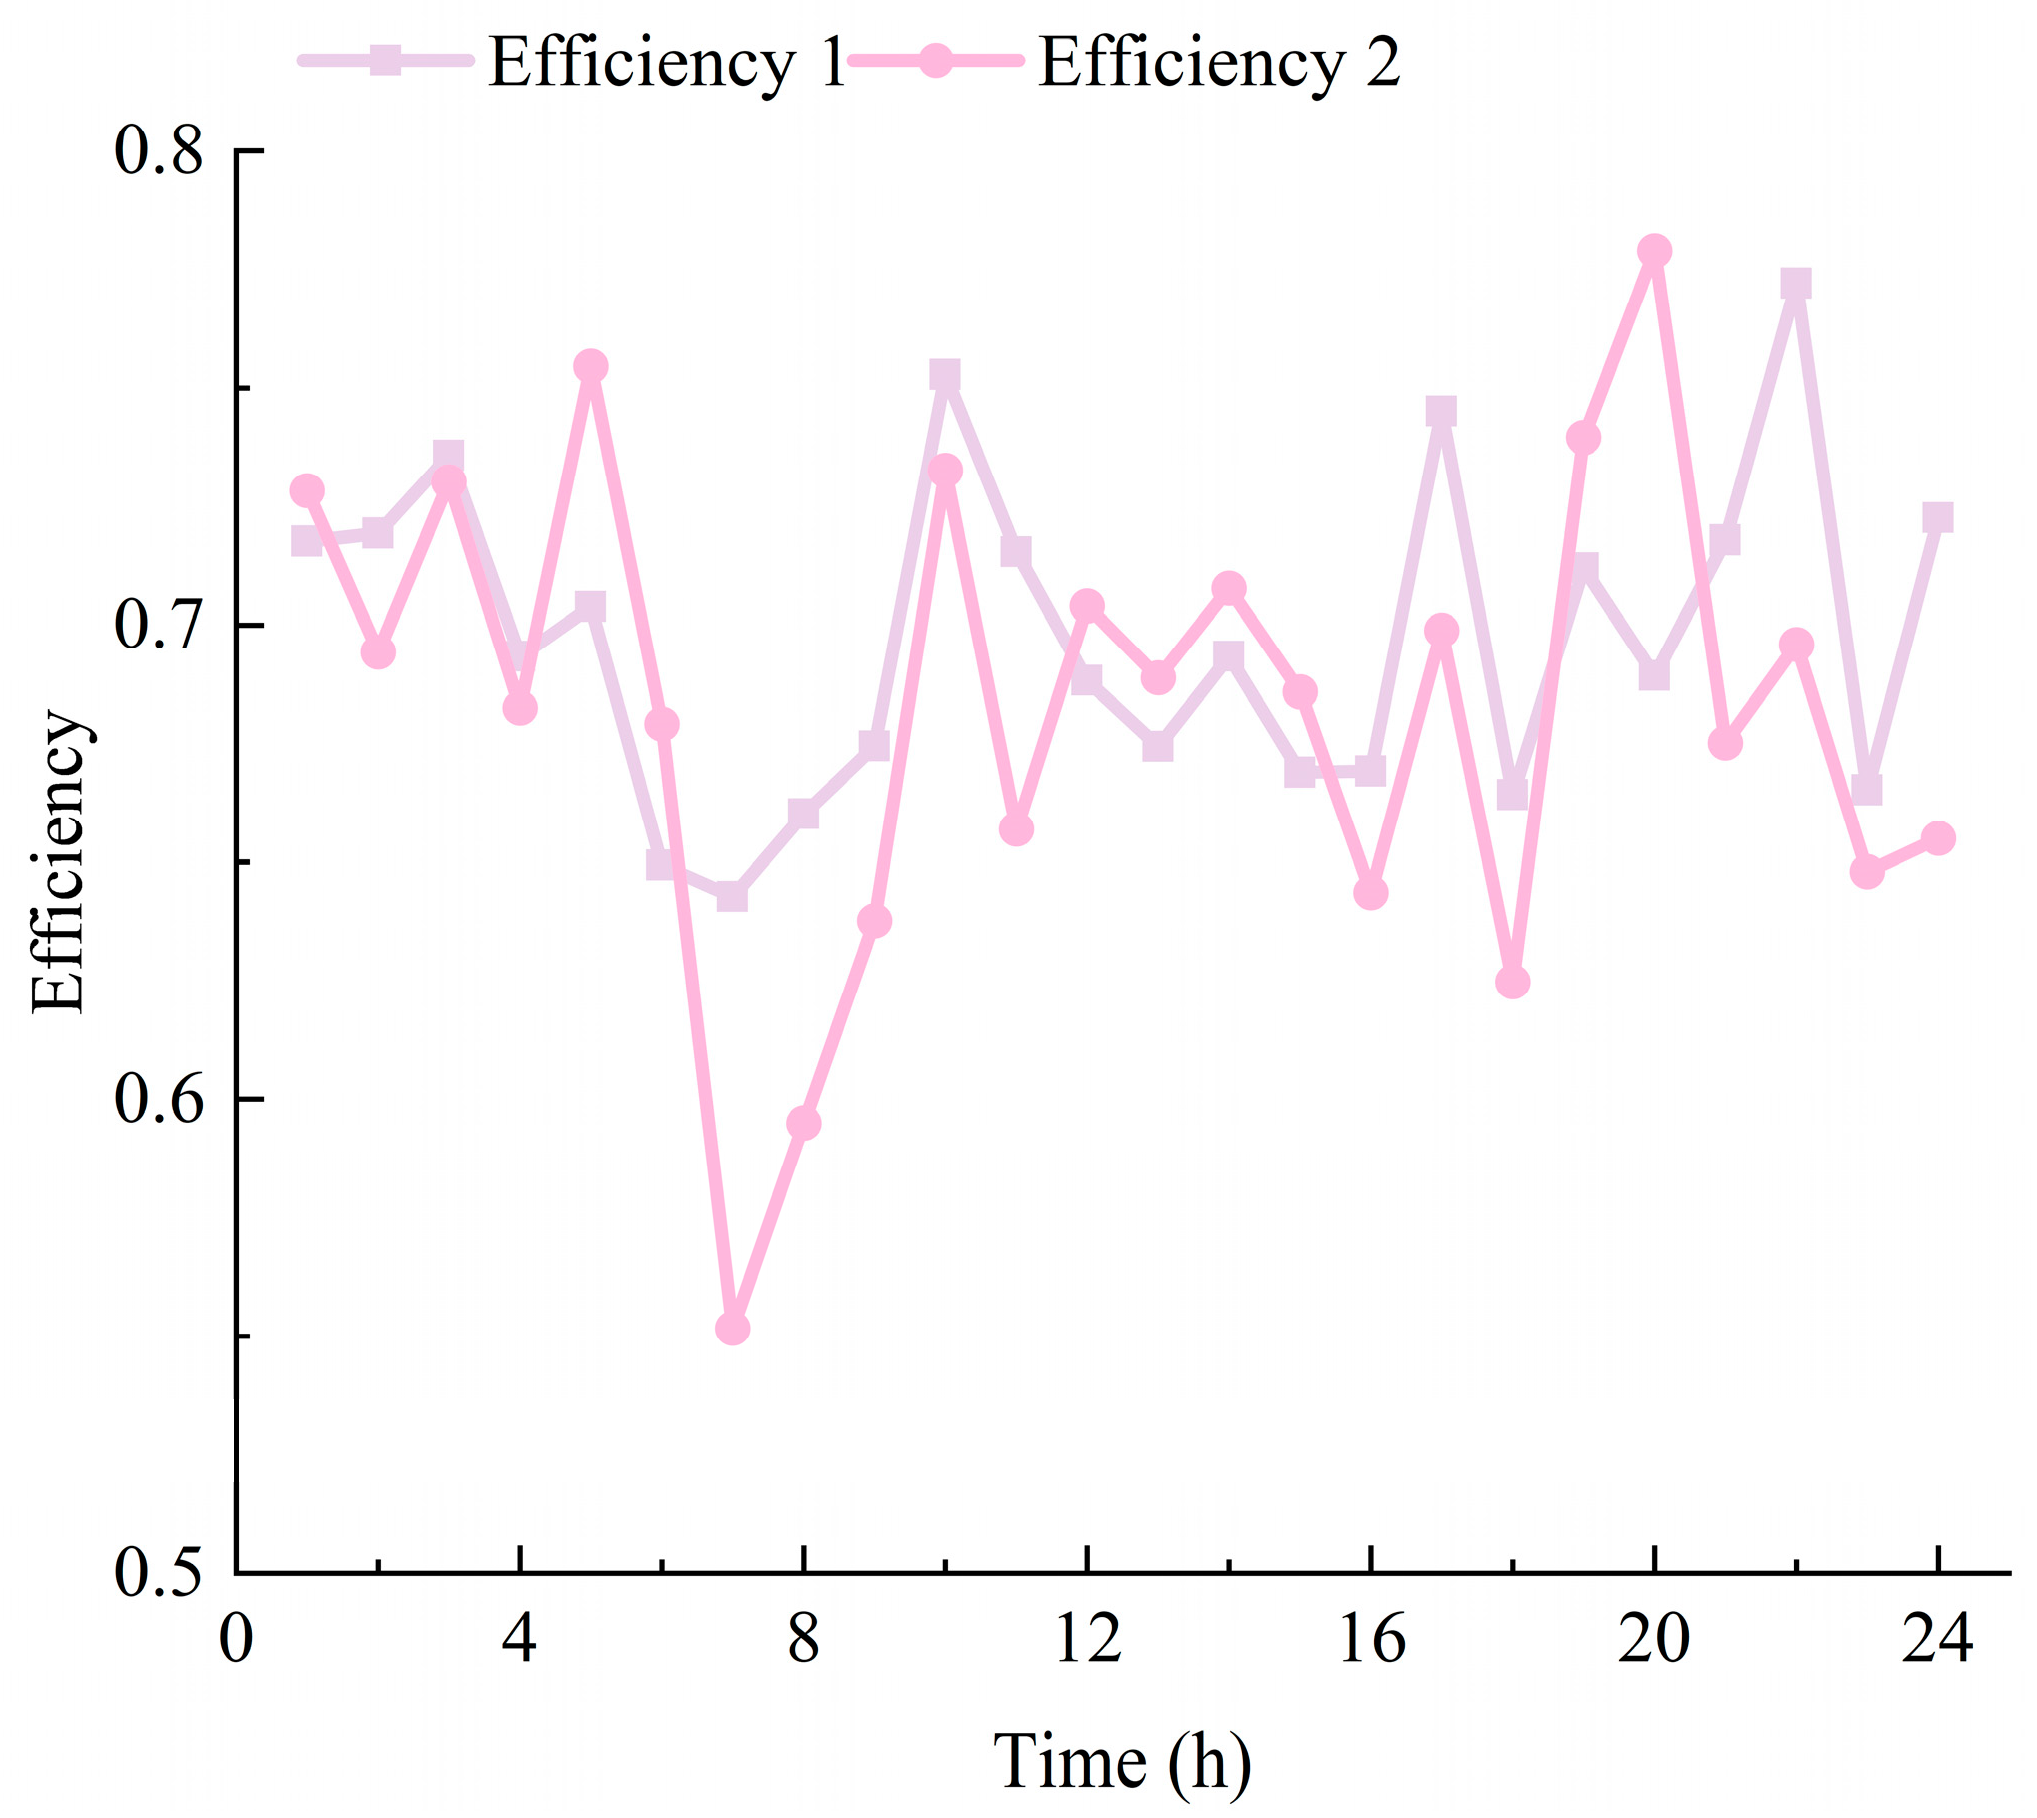
Figure 17 shows the efficiency comparison of Scenario 1 and Scenario 2 for each time period, where Efficiency 1 and Efficiency 2 represent the efficiencies of Scenario 1 and Scenario 2, respectively. The overall operational efficiencies of Scenario 1 and Scenario 2 are 70.08% and 68.64%, respectively. It can be seen that, similar to the unexpanded scenario, the variable-efficiency scenario has higher efficiency than the corresponding fixed-efficiency scenario during most time periods, and the overall operational efficiency is also higher. In conclusion, the proposed strategy has good economic benefits, with a low curtailment rate and higher overall operational efficiency.


