Abstract
After a ship suffers an external strike, the system is often in a poor state of battle damage. Currently, the support capacity of the system in all aspects decreases dramatically, the operation interval narrows, and it is not easy to ensure the completion of the long-term mission chain, especially when it involves impact loads, which is more significant. Given this, this paper proposes a restoration strategy for the power system of battle-damaged ships based on the long-term mission chain. First, the Ship Power System (SPS) is modelled and analyzed to obtain the multi-case operating characteristics of various types of loads, including impact loads under the mission chain. Second, the frequency and power support capability of energy storage is mined and quantified, and the limitations of its frequency support, power interaction, and other multi-operating states are characterized, based on which the multi-operating state switching strategy of the system containing energy storage is formed, to enhance the active support capability of the system. Subsequently, a frequency response model of the system is established. This model takes into account the support provided by energy storage, analyzes the dynamic evolution of system frequency under the disturbance of directly connected impact loads. Based on this analysis, the safe operating boundary of the system is identified. Finally, a two-stage SPS optimization model is proposed based on the above, and the effectiveness and superiority of this paper’s strategy are verified through simulation analysis of typical scenarios and comparison of multiple strategies.
1. Introduction
On the modern battlefield, the stable operation of the SPS is essential for maintaining the ship’s overall performance and combat effectiveness [1]. However, the battlefield environment is constantly changing, making it almost inevitable for the electric power system to encounter various failures caused by enemy fire. Consequently, responding quickly and effectively to all types of failures to ensure the stability of the ship’s power system and the reliability of the power supply for key loads has become the focus of current research [2].
The reconfiguration technology of the power system network is a crucial strategy for battle damage recovery. It involves reconfiguring the network structure of the system and the operating state of the load after sustaining damage. This approach aims to help the system swiftly recover from faults and ensure stable and peaceful operations [3,4,5]. In recent years, many scholars have extensively researched various aspects of the SPS fault recovery method and have achieved relatively good results using this strategy. To address the issue of poor algorithm convergence, the authors of [6] propose a network reconfiguration strategy for shipboard power systems based on an improved Gray Wolf algorithm. This enhancement is achieved through Tent chaos initialization, discretization of Gray Wolf individuals, and adjustments to the convergence factor, all aimed at ensuring the recovery speed from system faults and the accuracy of convergence. Additionally, the authors of [7] introduce a distributed reconfiguration strategy for the latest ship control structure, which divides the existing reconfiguration into regional and global reconfiguration, leading to improved reconfigurability of the evaluation system and the reconfiguration scheme. The authors of [8] present a dynamic reconfiguration optimization strategy for the SPS that considers the time-varying characteristics of the load to enhance the sustainable operational capacity of the ship under fault conditions and the power supply quality of the network.
However, the above research mainly focuses on the static reconfiguration optimization of ship failure scenarios involving only a single time section. In fact, in view of the continuity of the ship’s mission chain and its inherent complexity, the internal loads and equipment operating states of the system still need to be dynamically optimized and adjusted in time after reconfiguration. Suppose we continue to rely on static reconfiguration as the primary means to maintain system stability. In that case, it will be challenging to ensure the long-term stable operation of the system and the safety of the power supply.
To further complicate the situation, with the modernization and upgrading of ships and the enhancement of strategic needs, high-power shock loads such as high-precision radars and high-energy electromagnetic cannons have been widely integrated into shipboard systems to meet mission requirements [9,10,11]. Although this initiative has improved the combat effectiveness of ships, it has also increased the risk of system operation during battle damage, which significantly impacts stability. The intense electric shock generated during the startup and operation of high-power equipment presents a greater challenge to the ship’s power system. Therefore, adequate measures must be taken to ensure that ships can still maintain strong combat effectiveness and resilience under extreme battle damage conditions.
Considering the possibility that the ship’s main propulsion system could be compromised during battle damage scenarios, exploring the feasibility of employing auxiliary generators for emergency propulsion is of practical significance. Currently, utilizing auxiliary generators to temporarily power the propulsion system can substantially enhance the ship’s survivability and resilience against severe damage to the main engines. Achieving this capability requires specific engineering adjustments, such as adapting the electrical power distribution system, integrating frequency converters to enable generators to operate in motor mode, and implementing appropriate control logic to safely engage and disengage propulsion systems under emergency conditions [12,13].
Additionally, the SPS is equipped with various energy storage devices that enhance the system’s operational effectiveness and stability, ensuring a reliable power supply [14,15]. For instance, reference [16] optimizes the energy storage devices in real-time, taking into account the ship’s dynamic load characteristics, which boosts the overall operational efficiency of the system. The authors of [17] propose a parallel power supply strategy using generators and battery packs, which can significantly improve power supply efficiency under high load conditions. More importantly, with fast response capabilities, the energy storage devices can effectively regulate system frequency to address frequency instability caused by load fluctuations [18]. For example, the authors of [19,20] implement a control strategy that combines virtual sag control, virtual inertia control, and virtual negative inertia control to respond to system frequency deviation and provide frequency support swiftly. Therefore, leveraging the inherent support capability of the system, introducing a rapid adjustment mechanism for energy storage frequency can help mitigate frequency degradation issues caused by inrush load inputs and ensure the system remains within the safe operational threshold.
Unlike generators, the performance of energy storage devices, being a finite resource, is limited by several factors, such as the state of charge. During a prolonged, high-intensity mission chain, especially during sustained operations lasting several hours, the capacity of the energy storage equipment may gradually diminish, making it difficult to meet the system’s ongoing power demands. In a battle-damaged condition, the system may experience varying degrees of damage, further stretching the capacity of the energy storage equipment and complicating the flexible execution of the mission chain and its ultimate success. Therefore, fully leveraging and utilizing the support features of the energy storage equipment while reasonably scheduling other adjustable resources in the system to ensure the flexibility and completion of the mission chain has become a significant challenge.
In view of this, the purpose of this paper is to study the safe operation requirements and optimized recovery methods of ship power system, and to propose a restoration strategy for the power system of battle-damaged ships based on the long-term mission chain in view of the situation of containing high-power impact load and limited energy storage support effect. First, through modeling and analysis of various types of load conditions in the ship power system, the dynamic response law and time-varying characteristics of load power under different conditions are revealed. Subsequently, considering the dual characteristics of frequency support and power interaction of energy storage devices, an energy storage operation and management strategy adapted to the operating characteristics of ships is proposed. Secondly, to cope with the system frequency problem caused by the frequent switching of high-power impact loads, a system frequency response model is established, and the dynamic safety analysis of frequency is carried out. Finally, based on the above research content, a two-stage SPS optimal reconfiguration model undercounting and multiple constraints are constructed in this paper. Through the simulation analysis of typical scenarios and multi-strategy comparison, the effectiveness and superiority of the strategy proposed in this paper are verified to provide strong support for the stable operation of the naval power system.
2. Modeling and Analysis of Ship Power System (SPS)
2.1. Operational Architecture of SPS
Figure 1 shows the SPS’s topology. It is divided into two independent subsystems isolated by inter-area switches. Each subsystem contains load clusters powered by main and auxiliary generators. To enhance survivability and combat capability in the event of damage, the system integrates an energy storage cluster that exchanges power with the system through a converter.
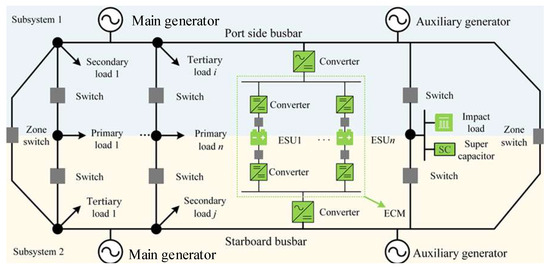
Figure 1.
Topology diagram of SPS.
The load-casting and switching operation is achieved by regulating the circuit breaker: the primary load uses a dual-system power supply mode, which can be switched, while the secondary and tertiary loads operate in a single-system power supply mode. Additionally, the system is equipped with impact loads, such as radar and electromagnetic artillery, which work in conjunction with a supercapacitor. When the system is functioning normally, the supercapacitor can buffer and reduce transient disturbances to ensure frequency safety. However, if the supercapacitor is damaged and accessed forcibly, it can trigger significant power fluctuations, instantly decreasing the system frequency, leading to a blackout and jeopardizing the operation of other critical equipment.
2.2. Conceptual Description and Equipment Modeling Related to SPS
2.2.1. Classification of Operating Conditions Under the Mission
To align with the actual ship operation requirements and quantify the risk level associated with the operating conditions (OCs), the following three primary operating conditions are established:
- (1)
- Cruising condition: The ship is currently at a lower risk level, with its main purpose being reconnaissance and navigation. In this state, all types of loads are functioning at normal power.
- (2)
- Combat condition: The ship encounters a significant level of risk; its primary purpose is to engage the enemy and ensure its own safety. Under these circumstances, the ship’s weapon load and defense systems operate at full capacity.
- (3)
- Emergency condition: The ship is currently facing a very high level of risk, and the main goal is to exit the battle to safeguard the ship’s vitality quickly. In this situation, the ship’s power load and defense load operate at increased capacity.
2.2.2. Types and Prioritization of Loads
Based on the functionality and power characteristics of the loads, they are classified into three main categories:
- (1)
- Mission Load (ML): In the SPS, the Mission Loads mainly include power loads, weapon loads, and defense loads. Their distinctive feature lies in the fact that the operating power magnitude of these loads adjusts according to changes in operating conditions, such as ML1 and ML2 in Figure 2.
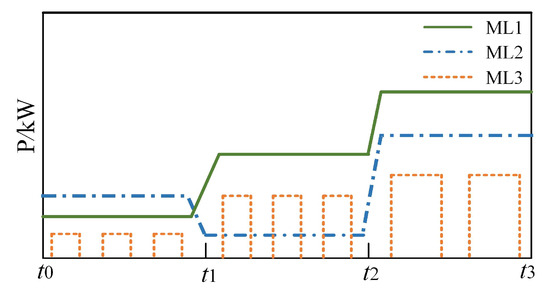 Figure 2. Diagram of power changes in Mission Load.
Mission loads include a small number of impact loads (IL), which can change power instantaneously and affect grid security, such as ML3 in Figure 2. When the supercapacitor is functioning normally, it operates alongside them; however, if the supercapacitor is damaged, it must be directly connected to the AC grid and simplified to a periodic, constant power load to protect the system’s performance [14].
- (2)
- Flexible Load (FL): Flexible loads are service class loads that can adjust their power within a specific range, such as air conditioning, and can operate at low power when the ship is damaged, thereby enhancing the flexibility and reserve of system power.
- (3)
- Normal Load (NL): Normal loads in the SPS primarily consist of pumps, piping loads, and similar components. This type of load does not exhibit power characteristics and generally maintains a constant power operation.
Shiploads are typically classified into three priority levels, in descending order of their importance to system operation: primary, secondary, and tertiary loads.
To quantify the degree of prioritization for each load under various operating conditions, a matrix of weight coefficients is utilized as follows:
where represents the weight value of the load i in the oc j, and the larger its value is, the higher priority it represents; n is the total number of loads in the system.
2.2.3. Modeling Analysis of Mission Chain
This paper presents the concept of a mission chain, which comprises a series of timeframes reflecting different operating conditions. These conditions denote the SPS’s requirements for the operation of system-related equipment during the mission duration. In conjunction with the preceding analysis, any changes in operating conditions lead to adjustments in load power and priority level, as illustrated in Figure 3.
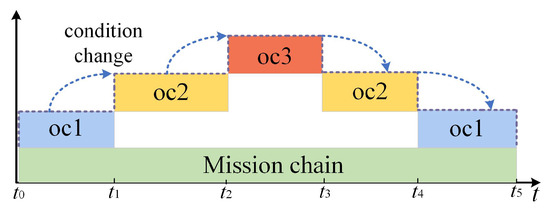
Figure 3.
Diagram of mission chain changes.
Due to the limited internal resources of war-damaged ships, the SPS must continually optimize the operational status of equipment in the configuration system, driven by a high-intensity mission chain, to ensure a continuous power supply for high-priority loads and enhance combat performance.
3. Operational Strategies for Energy Storage Cluster Systems
This subsection proposes a control strategy using the energy storage cluster management system (ECM) to improve the flexibility and reliability of energy storage devices and meet diverse operational requirements.
The ECM is structured into a three-layer control architecture that includes scheduling control, monitoring management, and action execution, as illustrated in Figure 4.
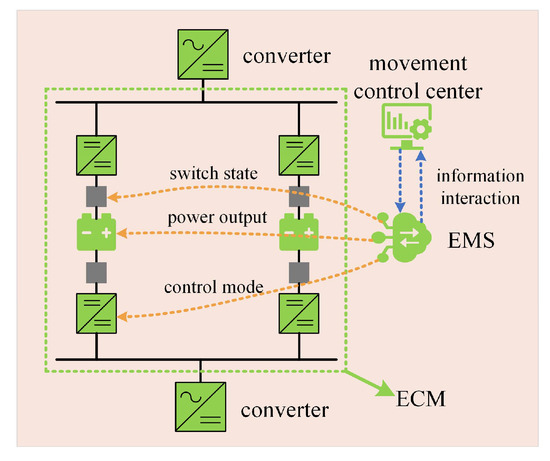
Figure 4.
ECM control architecture diagram.
- Scheduling Control Layer: This develops and issues operational plans based on system operational planning and lower-level status information.
- Monitoring management: This monitors information from lower levels, passes it on to higher levels, and implements control according to the operating plan.
- Action Execution Layer: It consists of energy storage units, switches, and converters, which receive commands and execute operations to meet system operation requirements.
To achieve precise control of each energy storage unit (ESU), these units are managed and configured from the following three aspects:
- (1)
- The initial damage state of the ESU in the system, along with their varying states of charge (soc) at different time intervals, necessitates real-time monitoring and updating of the operational status of each ESU:
- (2)
- Ships are powered by port and starboard zones, and the energy flow is regional. Regulating the switching state and reconfiguring the ESU area to ensure its spatial uniqueness is crucial.
- (3)
- The power output characteristics of the ESU depend on the converter mode, with different modes suited for different power loads. When the system load changes, the ESU must adjust the mode in real-time to ensure the safety of power and frequency:
The ESU utilizing the frequency-supported model only responds to changes in the system frequency, with the output power adjusted accordingly. The detailed model is provided in Section 4.
The power support mode of the ESU does not engage in frequency modulation and exclusively offers constant power support as instructed. Its power response model is as follows:
where are Boolean variables used to indicate the identification bits of the charging and discharging state of the ESU i in time t; and are the charging and discharging power of the ESU i in time t, respectively; and and are the upper and lower limits of the charging state set by the ESU.
Generally, this hierarchical coordination not only enables dynamic power allocation, but also enhances the system’s survivability by providing timely and decentralized support under partial faults.
4. Survivability Analysis for SPS Frequency Safety Boundaries Supported by Energy Storage
To investigate the influence of impact loads directly connected to the system on frequency safety, a modeling analysis of the dynamic process of system frequency change under perturbation is conducted.
4.1. SPS Frequency Response Model
The SPS is part of the compact power system, and the system frequency response (SFR) model is typically used for frequency security analysis. Additionally, since the SPS subsystem includes multiple generators, the multi-machine system is equivalently aggregated into a single-machine system to reduce the order of the system model [21].
When the system is connected to an impact load with a power magnitude of , the first-order equations of the equivalent SFR model of the system are expressed as follows:
where the generator frequency response equivalent model is as follows:
where is the power output of the generator; is the equivalent inertia time constant of the generator; and is the equivalent gain coefficient of the generator.
When the SPS is damaged, the system’s capacity to withstand impact load is limited, and the ESU is necessary for a rapid response to ensure frequency safety. The SFR model for the ESU is as follows [22]:
where is the output power of the ESU; is the sag regulation factor of the ESU; and is the response time constant of the ESU.
Additionally, the ESU adds virtual inertia to the system, enhancing its frequency stability. The equivalent system inertia can be calculated:
where n is the total number of ESU in the system using the frequency support mode; and denote the inertia constant and rated capacity of ESU i, respectively.
Based on the analysis above, the equivalent process of the SFR model for SPS is illustrated in Figure 5, different colors of the boxes represent the individual modules in this model.
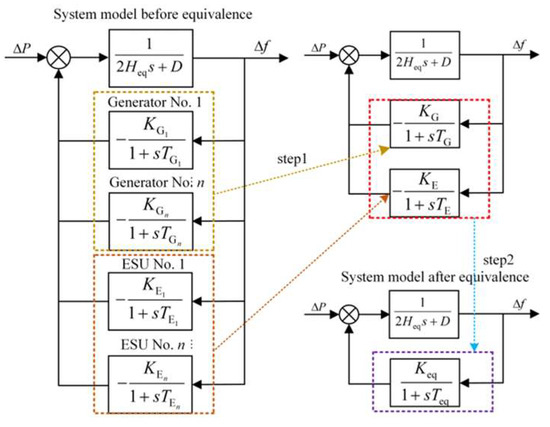
Figure 5.
The SFR model of SPS.
The equivalent SFR model equations for the system with ESU support are as follows:
The derivation of Equation (17) and the inverse Laplace transform results in the following expression in the frequency-time domain:
The detailed calculations of the equivalent and intermediate variables presented in this subsection are shown in Appendix A, Appendix B and Appendix C.
4.2. Analysis of System Frequency Safety Indicators and the Dynamic Process
The indicators for evaluating the frequency stability of the system [23] mainly include the maximum value of the system frequency variation , the maximum value of the frequency deviation and the final value of the frequency stability .
Where for , the rate of change of the system frequency is generally maximized at the initial moment when the system is perturbed. Therefore, by substituting the condition into the equation shown in Equation (18), the following expression can be obtained:
Similarly, when the system frequency hits its lowest point, substituting this condition into Equation (18) results in the expression as follows:
Since the frequency threshold is often set in the SPS to trigger the low-frequency load-shedding device to remove the load and prevent the system frequency from collapsing. Therefore, is used as the frequency constraint in this paper to ensure the normal operation and frequency safety of the system with respect to the safety indexes mentioned above.
Finally, for , the following expression can be obtained by taking the limit of Equation (18) and substituting:
In summary, the system is examined regarding the impact disturbance, comparing it with and without the ESU for frequency support effects and safety and stability indicators, as illustrated in Figure 6.
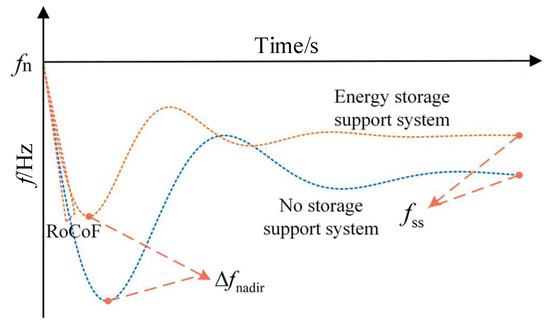
Figure 6.
Comparison of system frequency changes under different operation strategy.
Figure 6 illustrates the frequency response of a shipboard power system under a disturbance, and compares different scenarios with/without energy storage support. The system with energy storage exhibits a lower Rate of Change of Frequency (RoCoF), a reduced frequency deviation (), and a faster convergence to the steady-state frequency , demonstrating its enhanced ability to mitigate frequency deviations and stabilize system dynamics. In other word, after utilizing frequency support mode, ESU can effectively enhance the system’s frequency safety margin, improve dynamic stability, and mitigate frequency collapse.
The proposed frequency security boundary directly reflects the system’s tolerance to impact loads under different energy storage configurations, thus serving as a quantitative indicator for survivability evaluation. The analysis of energy consumption for the ESU set to frequency support mode is presented in Appendix B.
4.3. Analysis of Safe Operating Boundaries for System Frequencies
The analysis in the previous subsection indicates that the lowest point of the system frequency variation is associated with the power size of the inrush load connected to the system and the equivalent parameters.
Figure 7 illustrates that the support capacity of the generator and energy storage varies across different parameters and configurations, resulting in varying maximum disturbance power that the system can endure. In this figure, the darker the color, the more disturbance power the system can withstand. Specifically, the support capacity of both the main and auxiliary generators is influenced by operating parameters and system damage. In contrast, the energy storage unit primarily depends on the configuration mode and quantity. This figure quantitatively demonstrates that survivability under impact loads is jointly determined by the available inertia and fast-response reserves, thus emphasizing the necessity of coordinated support planning in battle-damaged scenarios.
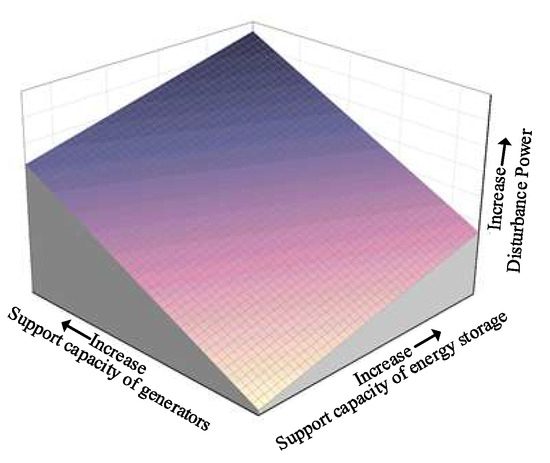
Figure 7.
Safe operation boundary diagram for system frequency.
In summary, to maintain system frequency safety and ensure normal operation, frequency safety calibration occurs in three steps:
- (1)
- Obtaining the basic operating parameters of each generator and ESU in the system.
- (2)
- Iterate through every operating condition of the generator and every configuration of the ESU to determine the maximum disturbance power that the system can handle and derive the safe power operating range.
- (3)
- Detect and determine the current damage status of the system and identify the minimum configuration requirements of the ESU for each time period based on the extent of the damage and the power of the impact load.
Thus, to access an impact load with power magnitude P at time t, the constraints that must be satisfied within the system are expressed as follows:
where: is the minimum number of required ESU for the system demand; n is the total number of ESUs in the system. This calibration strategy ensures that the system retains minimum required dynamic reserves for fault recovery, which is critical to guaranteeing survivability in successive mission stages.
5. Mission Chain-Driven Optimization Strategies for Battle-Damaged Ships
5.1. Objective Function and Operational Constraints of the System
5.1.1. Objective Function
According to the analysis in Section 2.2.3, to ensure the sustained combat effectiveness and vitality of the SPS, the objective function is the weighted sum of the loads connected under the mission chain:
where T is the total number of time slots in the mission chain; N is the number of loads in the system; , , and denote the weighting factor, input state, and operating power of load i at time t, respectively; and denotes the damage state of load i.
5.1.2. Operational Constraints
- Capacity constraint of generator
- 2
- Topological constraint of the line
To prevent circulating currents in the lines, the system is designed with a radial power supply.
where and are the switching state variables of the vital loads connected to System 1 and System 2 lines, respectively, which contain alternate paths.
To prevent overloading the power line, the flow of power through it, in ship power systems, constraints related to reactive power are typically neglected due to short length and compact structure of onboard cables, thus we have the following condition:
where is the size of the total power flowing through line i at time t; is the maximum power capacity of the line i.
- 3
- Power constraint of the system
- 4
- Operational constraint of the ESU
Equations (10)–(12)
Equations (14)–(19)
- 5
- Frequency constraint of the system
where is the frequency of the system i at the moment t, and are the upper and lower limits of the system’s required frequency, usually set to 51 Hz to prevent high-frequency cut-off, and 49 Hz to prevent low-frequency load shedding.
5.2. Strategy Optimization Framework and Steps
The overall process of SPS refactoring and optimization consists of two stages, and the framework for its optimization strategy is illustrated in Figure 8.
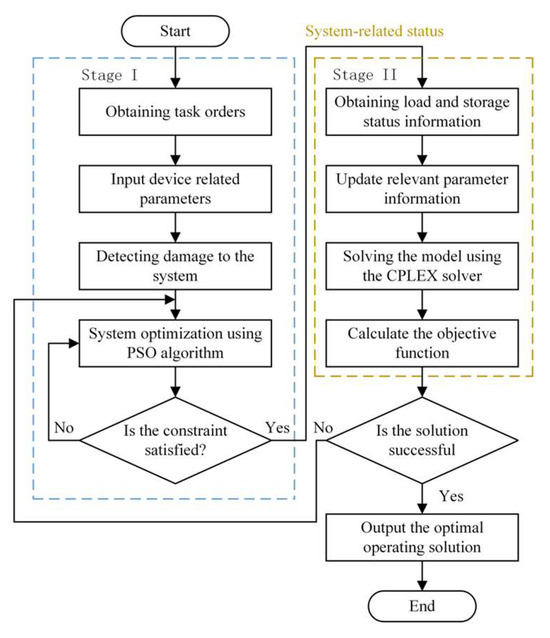
Figure 8.
SPS Strategy optimization framework diagram.
- (1)
- Stage 1: Obtain the relevant operating parameters of the system, detect any damage to the system, and cut off and transfer the load. Optimize the ESU access location reconstruction using the PSO algorithm as a solution.
- (2)
- Stage 2: Based on the reconstruction results and the mission instructions for Stage 1, obtain status information for the generators, ESU, and loads in each subsystem, optimize the power and mode configurations for the load and energy storage, and use the CPLEX solver to solve.
6. Simulation Analysis
6.1. Simulation Parameter Setting
The simulation was verified using the topological model illustrated in Figure 1. Detailed operating parameters of the equipment in the SPS are available in Appendix C.
The scheduled mission chain has a total duration of 4 h, with a minimum scheduling configuration period of 15 min, resulting in a total of 16 scheduling periods. The trend of the system load power changes, as indicated by the system settings for the mission chain and the system load power parameters, is illustrated in Figure 9.
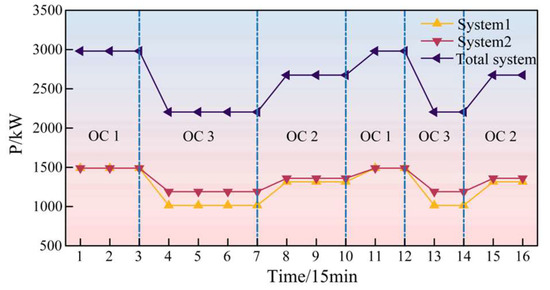
Figure 9.
Schematic diagram of power variation of the system.
To verify the applicability and effectiveness of the strategies in this article, the reconfiguration of the SPS is considered based on the following more severely damaged context:
- The auxiliary generators G2 and G4 were destroyed; (50% reduction in generation capacity);
- The primary power supply lines for L3 and L8 are damaged;
- The power supply lines from ESU2 to System 1 are damaged (30% reduction in energy storage capacity);
- The supercapacitor is damaged, and L17 is directly connected to the AC power grid.
This set of damage scenarios deliberately exceeds thresholds such as NATO ANEP-77 Tier-3 to emulate high-intensity warfare impacts against the ship power system. These failure settings are selected not only to reflect realistic fault conditions, but also to test the limits of system survivability under constrained resource availability.
The relationship between the frequency support of the system generator and the ESU, based on this damage scenario, is presented in Table 1.
6.2. Analysis of Simulation Results
6.2.1. Analysis of the Results of the Stage 1
Stage 1 involves reconstructing the system topology. The result of the optimal reconfiguration is shown in Figure 10. Below is an analysis of the load and ESU.
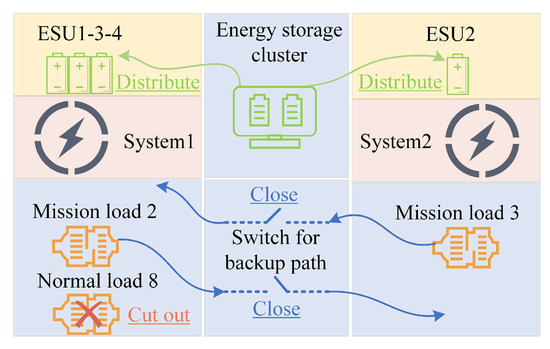
Figure 10.
Schematic diagram of SPS optimal reconfiguration.
Reconfiguration of the load: The important load L3 is transferred to System 1 via the backup path; the normal load L8 lacks a backup circuit and is directly disconnected; to ensure power balance in the subsystem, the important load L2 is transferred to System 2 through the backup path.
Reconfiguration of the ESU: According to Table 1, two ESUs in frequency support mode are necessary to guarantee 400 kW access to the impact load in System 1, along with the system power deficit and the details regarding the damage to the lines of ESU 2.

Table 1.
Frequency support range.
Table 1.
Frequency support range.
| Status of the Main Generator | Status of the Auxiliary Generator | Number of ESU in Frequency Support Mode | The Total of the Power Values of the Loads |
|---|---|---|---|
| Yes | No | 0 | [0~120) |
| Yes | No | 1 | [120~270) |
| Yes | No | 2 | [270~410) |
6.2.2. Analysis of the Results of the Stage 2
Stage 2 represents the optimal allocation of generators, loads, and the ESU for the system over a long time scale. The results of power optimization under its mission chain are illustrated in the figure below.
Analysis of Figure 11 indicates that the system dynamically balances the power of each component within the entire mission chain in real time to ensure power safety. Notably, the output efficiency of the two primary generators consistently holds at 100%, maximizing load access and optimizing the ESU under these conditions.
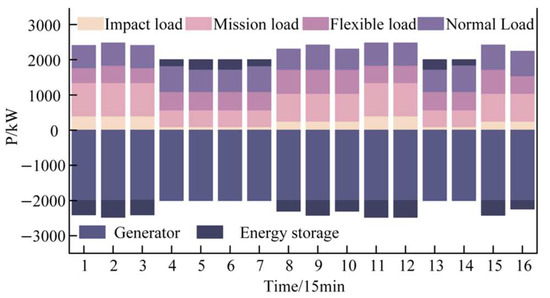
Figure 11.
Power balance diagram of the system.
- (1)
- Optimization of loads
The outcomes of load reconfiguration are evaluated based on the proportion of loads accessed (degree of mission completion), defined by the following equation:
where denotes the power consumed by load j of load type i at time t; is the total power of load type i at time t; and and denote the proportion of loads accessed of load type i and the system at time t, respectively.
By analyzing Figure 12 and combining it with the load parameters in Table A1, we draw the following conclusions:
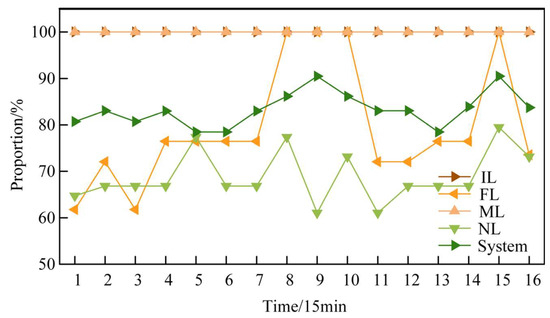
Figure 12.
The proportion of loads accessed.
- The general ML and IL in the system are all primary loads, and their weight values are consistently much higher than those of other load types within the mission chain. Consequently, their proportion is always maintained at 100%.
- The FL and NL include secondary and tertiary loads, and their proportion varies with changing working conditions; the overall proportion of the system also shifts with these conditions, generally conforming to the principle that low-power-deficiency conditions have a higher proportion, while high-power-deficiency conditions have a lower one.
From the two points above, it is evident that the load dynamic reconfiguration optimization of the system can maximally ensure the priority operation of high-power and high-priority loads while effectively enhancing the continuous long-term survivability and resilience of the battle-damaged SPS within the mission chain.
- (2)
- Optimization of the ESU
The figure below illustrates the results of the optimal allocation of the ESU within the system based on the mission chain.
Analysis of Figure 13 indicates that the support modes, along with the charge and discharge states of the ESU in the mission chain, continuously adjust to satisfy the system frequency security and power support requirements.
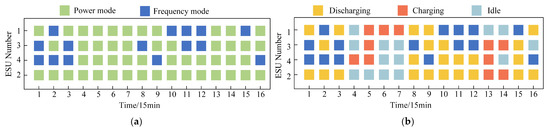
Figure 13.
(a) Support modes of ESU; (b) state of charge and discharge of the ESU.
To emphasize the ESU’s supporting role, the following analysis will explain the configuration results regarding power support for two types of requirements within the safe domain of system frequency.
First, the system’s frequency safety requirements need analysis, and the change in system frequency-related parameters is illustrated in the figure below.
Analysis of Figure 14 indicates that when the number of ESUs in the system’s frequency mode changes, both the virtual inertia provided by the ESUs and the overall equivalent inertia of the system also change. This means that the system’s ability to support disturbance power will likewise change.
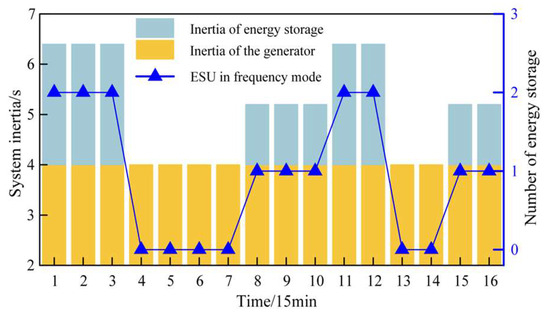
Figure 14.
State of charge and discharge of the ESU.
- The combined analysis of Figure 15a,b indicates that the impact load power fluctuates with the operating conditions; however, the system’s lowest frequency consistently stays above the threshold, the threshold is indicated as the red line in Figure 15b.
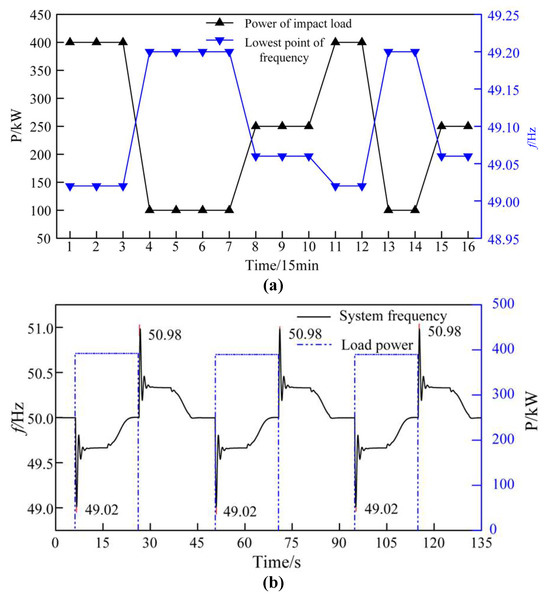 Figure 15. (a) Power of the load—frequency minimum of the system changes. (b) Sampling of frequency changes in the system.
Secondly, the soc change of the ESU needs to be analyzed. By combining the changes in the mission chain operating conditions with the analysis in Figure 16, we can derive the following charging and discharging rules for the ESU.
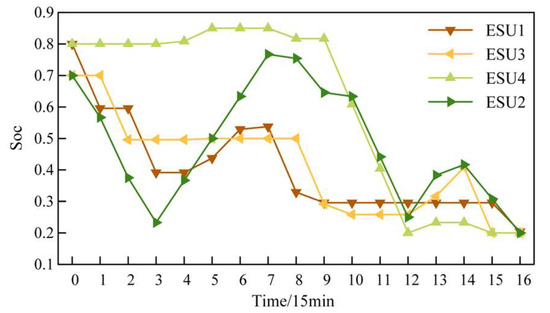
Figure 16.
Comparison of system frequency changes.
When the system experiences severe power shortages, the ESU discharges high power. Under relatively severe power shortages, the ESU discharges at a lower power level. When the system faces less severe power shortages, the ESU charges.
At the end of the mission chain, all ESUs are discharged to the specified soc threshold, ensuring efficient energy use and maximizing system load acceptance.
6.3. Comparative Analysis of Strategies
6.3.1. Analysis of Optimization Results for Different Strategies
To further emphasize the benefits of the strategies outlined in this article, the following five strategies will be analyzed comparatively based on the simulation conditions established in Section 6.1:
Strategy 1: Strategy in this article;
Strategy 2: In accordance with Strategy 1, yet without accounting for the optimization of the access location of ESU during Stage 1, where ESU1 and ESU2 connect to System 1, and ESU3 and ESU4 connect to System 2;
Strategy 3: In accordance with Strategy 1, the ESU only uses power mode and not frequency mode;
Strategy 4: In accordance with Strategy 1, it only considers the system’s power constraints and not its frequency constraints;
Strategy 5: No optimization.
The operation status and operational benefits of the system under each strategy optimization in the mission chain are presented in Table 2.
Table 2.
Comparative analysis of the effectiveness of strategies.
Table 2 indicates that when the load power varies, Strategy 5 is not optimized and fails to meet the system’s power and frequency constraints. While Strategy 4 is optimized and meets the power requirements, it overlooks the issue of the system’s frequency decreasing due to the integration of the impact load. When the impact load operates at 400 kW during Time 1 and is introduced into the system, the system’s frequency drops significantly below the required threshold.
Strategies 1, 2, and 3 all meet the operating constraints and have nearly equal load power values. However, Strategy 1 boasts the highest power-weighted value, making it the most efficient.
6.3.2. Analysis of Optimization Measures for ESU
This article examines the optimized configuration of the ESU. Below is a comparative analysis of the ESU-related configuration strategies based on the simulation results in Section 6.3.1.
- (1)
- Analysis of the advantages of ESU’s multi-support mode
Analyzing Figure 17a, Strategy 1 greatly enhances the overall system support capability thanks to the added support from the ESU, which ensures frequency safety of the impact load at maximum power. In contrast, Strategy 3 depends solely on the generator, which offers limited support capability and can only ensure frequency safety at minimum power.
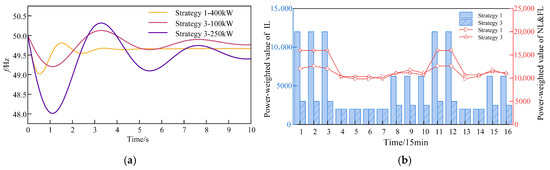
Figure 17.
(a) Comparison of power frequency variation; (b) comparison of benefits related to Strategies 1 and 3.
Analyzing Figure 17b, Strategy 1 consistently shows an impact load power weighting that is at least equal to that of Strategy 3 within the mission chain. In contrast, the other load weightings do not surpass those of Strategy 3. Due to the high impact load weighting, the total time load power weighted sum for Strategy 3 is lower than that of Strategy 1, leading to reduced operational efficiency, which corresponds with the findings in Table 2. The superior performance of Strategy 1 in maintaining frequency nadir and load access confirms that the integrated use of reconfiguration and energy storage significantly enhances system survivability.
- (2)
- Analysis of the advantages of the ESU centralized distribution solution
When analyzing Figure 18a, the ESU under Strategy 2 is in a fixed configuration and lacks a conversion path. If the system path of ESU2 is damaged, it will remain idle. To ensure maximum power access to the impact load, it must be moved from System 1 to System 2.
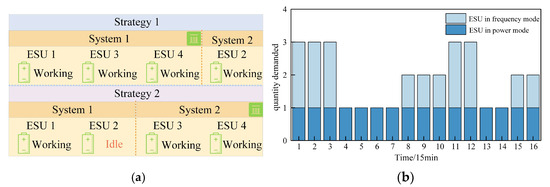
Figure 18.
Comparison of system configuration and operation status; (b) quantity demand for ESU support types.
Figure 18b illustrates that the variation in impact load power with operating conditions leads to a change in ESU demand. During high-power operation with impact load, the ESU is fully utilized for frequency support and lacks power flexibility. As a result, the total load power and the weighted sum for Strategy 2 are lower than those for Strategy 1. This leads to a lower benefit, which aligns with the findings presented in Table 2.
In summary, applying the strategy outlined in this paper will enable the ESU to fully optimize the system’s adaptability to various load types and achieve optimal operational efficiency throughout the mission chain.
7. Conclusions
This paper proposes an optimal operation strategy for ship power systems under battle damage, aiming to enhance system survivability and maintain mission continuity in long-term operational scenarios. By jointly optimizing load allocation and the coordinated use of energy storage units (ESUs), the strategy improves the system’s ability to respond flexibly and reliably under varying damage conditions. After simulating typical damage scenarios and various operating strategies, and comparing and analyzing the effectiveness and advantages of these strategies, the following conclusions were drawn:
- The system’s support capacity under battle damage is inherently constrained. Therefore, it is critical to dynamically allocate energy storage resources and adjust load profiles based on real-time damage assessments in order to sustain power supply to mission-critical loads and maximize survivability.
- The proposed Energy Storage Cluster Management system (ECM) significantly improves both the frequency safety margin and operational adaptability. By utilizing multi-mode support and centrally coordinated configuration, the ECM ensures accurate matching between power supply and diverse load demands, thereby strengthening the system’s resilience and enabling reliable completion of mission chains under adverse conditions.
Author Contributions
Conceptualization, C.B. and Y.T.; methodology, C.B. and F.W.; software, C.B. and Y.T.; validation, C.B. and F.W.; formal analysis, X.L.; investigation, Y.T.; resources, F.W.; data curation, Y.T.; writing—original draft preparation, C.B. and Y.T.; writing—review and editing, F.W.; visualization, C.B. and Y.T.; supervision, F.W. and X.L.; project administration, F.W.; funding acquisition, F.W. All authors have read and agreed to the published version of the manuscript.
Funding
This research was funded by National Nature Science Foundation of China, the name of this project is Basic Theory and Methods of Gray Starting for Novel Power Systems, the grant number is U22B20106.
Data Availability Statement
Data are contained within the article.
Conflicts of Interest
The authors declare no conflicts of interest.
Appendix A
- (1)
- The relevant parameters of the multi-machine system model are calculated as follows:
- (2)
- The parameters related to energy storage are determined as follows:
- (3)
- Other relevant system parameters are calculated as follows:
Appendix B
The process for analyzing the change in the ESU using the frequency mode is as follows.
When the ESU is set to frequency support mode, its output power varies dynamically with frequency.
Figure A1 illustrates that there are three key nodes for frequency and power changes: load input, secondary startup, and load shedding, the shadow part is the power deviation area during frequency regulation, reflecting the energy response of the system. When the load is introduced into the system, the system frequency drops significantly. The ESU and the generator collaborate to stabilize the frequency, after which the secondary frequency modulation commences. The generator increases its power, the ESU decreases to zero, and the frequency returns to its rated level. The load shedding process is similar and will not be detailed here.
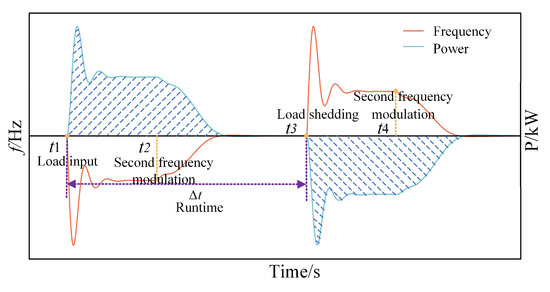
Figure A1.
Comparison of system frequency power variation.
Appendix C
The operating parameters of the system are as follows:
Table A1.
Parameters of load.
Table A1.
Parameters of load.
| Load | PL,i/kW | Prioritization | Type | Weight | System |
|---|---|---|---|---|---|
| L1 | 75/125/200 | Primary | ML | 20/18/23 | 1 |
| L2 | 100/200/150 | Primary | ML | 22/20/16 | 1 |
| L3 | 170/270/320 | Primary | ML | 18/23/25 | 2 |
| L4 | 130/200/280 | Primary | ML | 20/12/25 | 2 |
| L5 | 100 | Primary | ML | 5/14/10 | 1 |
| L6 | 120 | Tertiary | NL | 7/10/6 | 1 |
| L7 | 105 | Tertiary | NL | 6/7/10 | 1 |
| L8 | 95 | Secondary | NL | 10/4/13 | 1 |
| L9 | 135 | Secondary | NL | 7/10/15 | 2 |
| L10 | 120 | Tertiary | NL | 5/8/11 | 2 |
| L11 | 160 | Tertiary | NL | 7/4/9 | 2 |
| L12 | 115 | Secondary | NL | 11/6/13 | 2 |
| L13 | 50/100/180 | Secondary | FL | 10/5/12 | 1 |
| L14 | 40/80/140 | Tertiary | FL | 6/11/9 | 1 |
| L15 | 60/130/200 | Secondary | FL | 12/7/11 | 2 |
| L16 | 70/110/160 | Tertiary | FL | 5/10/8 | 2 |
| L17 | 100/250/400 | Primary | IL | 20/25/30 | 1 |
For instance, considering the power and weight of L1, its power ratings of 75/125/200 and its weight of 20/18/23 align with the values in three different working conditions. Similarly, the power ratings for L13 of 50/100/180 correspond to the three operational power gears.
Table A2.
Parameters of generator.
Table A2.
Parameters of generator.
| Generator | S/kVA | HG/s | TG/s | KG |
|---|---|---|---|---|
| G1 | 1000 | 4 | 2.5 | 20 |
| G2 | 1000 | 4 | 2.5 | 20 |
| G3 | 500 | 4 | 2.5 | 20 |
| G4 | 500 | 4 | 2.5 | 20 |
G1 and G2 serve as the primary generators for Systems 1 and 2, respectively, while G3 and G4 function as the auxiliary generators for those same systems.
Table A3.
Parameters of ESU.
Table A3.
Parameters of ESU.
| ESU | S/kVA | HE/s | TG/s | KG |
|---|---|---|---|---|
| 1 | 300 | 4 | 0.5 | 15 |
| 2 | 300 | 4 | 0.5 | 15 |
| 3 | 300 | 4 | 0.5 | 15 |
| 4 | 300 | 4 | 0.5 | 15 |
Among them, the fluctuation range of the soc is set to [0.1~0.9], and the initial states of charge for the four ESUs are 0.8, 0.7, 0.8, and 0.7, respectively. Additionally, the range for the ESU charging and discharging power is [−250 kW~250 kW].
References
- Frangopoulos, C.A. Developments, Trends, and Challenges in Optimization of Ship Energy Systems. Appl. Sci. 2020, 10, 4639. [Google Scholar] [CrossRef]
- Liang, Z.; Zhu, W.; Shi, J.; Zhu, Z.; Zhi, P. Ship Integrated Power System reconfiguration research under partial observation. Energy Rep. 2022, 8, 444–452. [Google Scholar] [CrossRef]
- Babaei, M.; Shi, J.; Abdelwahed, S. A survey on fault detection, isolation, and reconfiguration methods in electric ship power systems. IEEE Access 2018, 6, 9430–9441. [Google Scholar] [CrossRef]
- Zhang, T.; Wu, D.; Li, L.; Yamashita, A.S.; Huang, S. A fault reconfiguration strategy based on adjustable space operator discrete state transition algorithm for ship microgrid system. Electr. Power Syst. Res. 2022, 205, 107707. [Google Scholar] [CrossRef]
- Wang, C.; Liu, Y.; Zhao, Y. Application of dynamic neighborhood small population particle swarm optimization for reconfiguration of shipboard power system. Eng. Appl. Artif. Intell. 2013, 26, 1255–1262. [Google Scholar] [CrossRef]
- Zhang, X.; Xiao, J.; Wang, X. Research on fault reconstruction algorithm of electric shipboard power system. In Proceedings of the 2021 3rd International Conference on Intelligent Control, Measurement and Signal Processing and Intelligent Oil Field (ICMSP), Xi’an, China, 23–25 July 2021; pp. 164–168. [Google Scholar]
- Han, S.; Yang, J.; Zhan, X.; Wu, D. Fault Reconstruction Strategy for Ship Power Systems Considering Reliability Constraints. Power Syst. Prot. Control 2020, 48, 14–21. [Google Scholar] [CrossRef]
- Zhu, W.; Shi, J.; Zhi, P.; Fan, L.; Lim, G.J. Distributed reconfiguration of a hybrid shipboard power system. IEEE Trans. Power Syst. 2020, 36, 4–16. [Google Scholar] [CrossRef]
- Doerry, N. Naval power systems: Integrated power systems for the continuity of the electrical power supply. IEEE Electrif. Mag. 2015, 3, 12–21. [Google Scholar] [CrossRef]
- McCoy, T.J. Integrated power systems—An outline of requirements and functionalities for ships. Proc. IEEE 2015, 103, 2276–2284. [Google Scholar] [CrossRef]
- Kim, S.-Y.; Choe, S.; Ko, S.; Sul, S.-K. A naval integrated power system with a battery energy storage system: Fuel efficiency, reliability, and quality of power. IEEE Electrif. Mag. 2015, 3, 22–33. [Google Scholar] [CrossRef]
- Choi, E.; Kim, H. Advanced Energy Management System for Generator–Battery Hybrid Power System in Ships: A Novel Approach with Optimal Control Algorithms. J. Mar. Sci. Eng. 2024, 12, 1755. [Google Scholar] [CrossRef]
- Hong, S.H.; Kim, D.M.; Kim, S.J. Power Control Strategy Optimization to Improve Energy Efficiency of the Hybrid Electric Propulsion Ship. IEEE Access 2024, 12, 22534–22545. [Google Scholar] [CrossRef]
- Moghadam, H.M.; Khooban, M.H.; Dragicevic, T.; Masoudian, A. Using interval type2 fuzzy controller in ship power systems in presence of pulsed power loads. In Proceedings of the 2018 IEEE International Conference on Electrical Systems for Aircraft, Railway, Ship Propulsion and Road Vehicles & International Transportation Electrification Conference (ESARS-ITEC), Nottingham, UK, 7–9 November 2018; pp. 1–6. [Google Scholar]
- Sarrias-Mena, R.; Fernandez-Ramirez, L.M.; Garcia-Vazquez, C.A.; Ugalde-Loo, C.E.; Jenkins, N.; Jurado, F. Modelling and control of a medium-voltage DC distribution system with energy storage. In Proceedings of the 2016 IEEE International Energy Conference (ENERGYCON), Leuven, Belgium, 4–8 April 2016; pp. 1–6. [Google Scholar]
- Othman, M.; Anvari-Moghaddam, A.; Ahamad, N.; Chun-Lien, S.; Guerrero, J.M. Scheduling of power generation in hybrid shipboard microgrids with energy storage systems. In Proceedings of the 2018 IEEE International Conference on Environment and Electrical Engineering and 2018 IEEE Industrial and Commercial Power Systems Europe (EEEIC/I&CPS Europe), Palermo, Italy, 12–15 June 2018; pp. 1–6. [Google Scholar]
- Accetta, A.; Pucci, M. Energy management system in DC micro-grids of smart ships: Main gen-set fuel consumption minimization and fault compensation. IEEE Trans. Ind. Appl. 2019, 55, 3097–3113. [Google Scholar] [CrossRef]
- Ibrahim, L.O.; Chung, I.-Y.; Youn, J.; Shim, J.W.; Sung, Y.-M.; Yoon, M.; Suh, J. Coordinated frequency control of an energy storage system with a generator for frequency regulation in a power plant. Sustainability 2022, 14, 16933. [Google Scholar] [CrossRef]
- Fang, C.; Tang, Y.; Ye, R.; Lin, Z.; Zhu, Z.; Wen, B.; Ye, C. Adaptive control strategy of energy storage system participating in primary frequency regulation. Processes 2020, 8, 687. [Google Scholar] [CrossRef]
- Yu, J.; Liao, S.; Xu, J. Frequency control strategy for coordinated energy storage system and flexible load in isolated power system. Energy Rep. 2022, 8, 966–979. [Google Scholar] [CrossRef]
- Shi, Q.; Li, F.; Cui, H. Analytical method to aggregate multi-machine SFR model with applications in power system dynamic studies. IEEE Trans. Power Syst. 2018, 33, 6355–6367. [Google Scholar] [CrossRef]
- Zhu, D.; Zhang, Y.-J.A. Optimal coordinated control of multiple battery energy storage systems for primary frequency regulation. IEEE Trans. Power Syst. 2018, 34, 555–565. [Google Scholar] [CrossRef]
- Anderson, P.; Mirheydar, M. A low-order system frequency response model. IEEE Trans. Power Syst. 1990, 5, 720–729. [Google Scholar] [CrossRef]
Disclaimer/Publisher’s Note: The statements, opinions and data contained in all publications are solely those of the individual author(s) and contributor(s) and not of MDPI and/or the editor(s). MDPI and/or the editor(s) disclaim responsibility for any injury to people or property resulting from any ideas, methods, instructions or products referred to in the content. |
© 2025 by the authors. Licensee MDPI, Basel, Switzerland. This article is an open access article distributed under the terms and conditions of the Creative Commons Attribution (CC BY) license (https://creativecommons.org/licenses/by/4.0/).