Abstract
Despite the growing application of storage for curtailment mitigation, its cost-effectiveness remains uncertain. This study evaluates the Levelized Cost of Storage, which also represents an implicit threshold revenue, for Lithium-ion Battery Energy Storage Systems deployed for photovoltaic curtailment mitigation. Specifically, the LCOS is assessed—using a mathematical simulation model—for various curtailment scenarios defined by maximum levels (10–40%), hourly profiles (upper limit and proportional), and growth rates (2, 5, and 10 years) at three storage system capacities (0.33, 0.50, 0.67 h) and two European locations (Cagliari and Berlin). The results indicate that the LCOS of batteries deployed for curtailment mitigation is, on average, comparable to that of systems used for bulk energy storage applications (155–320 EUR/MWh) in Cagliari (180–410 EUR/MWh). In contrast, in Berlin, the lower and more variable photovoltaic generation results in significantly higher LCOS values (200–750 EUR/MWh). For both locations, the lowest LCOS values (180 EUR/MWh for Cagliari and 200 EUR/MWh for Berlin), obtained for very high curtailment levels (40%), are significantly above average electricity prices (108 EUR/MWh for Cagliari and 78 EUR/MWh for Berlin), suggesting that BESSs for curtailment mitigation are competitive in the day-ahead market only if their electricity is sold at a significantly higher price. This is particularly true for lower curtailment levels. Indeed, for a curtailment level of 10% reached in 5 years, the LCOS for a 0.5 h BESS capacity is approximately 255 EUR/MWh in Cagliari and 460 EUR/MWh in Berlin. The study further highlights that the curtailment scenario significantly affects the Levelized Cost of Storage, with the upper limit hourly profile being more conservative.
1. Introduction
The International Energy Agency (IEA) [1] forecasts that over 5.5 TW of Renewable Energy Source (RES) capacity will be added worldwide by 2030, with photovoltaic (PV) systems expected to contribute 80% of this growth. By 2030, RESs are expected to supply nearly half of global electricity, with Variable Renewable Energy Sources (VRESs) accounting for 30% of the global electricity mix. However, if not joined with suitable mitigation strategies [2], this rapid growth in VRES capacity will lead to a substantial increase in generation curtailment. The latter refers to the reduction in power output due to various constraints, including grid safety [3], market imbalances (excess production relative to demand) [4], and operational requirements. Curtailment variation over time primarily depends on the residual load (load net of production from VRES) [5], which is influenced by numerous factors, including overall load, generation profile, minimum production levels from conventional sources for grid safety, interconnection capacity, import–export power exchanges, market conditions, policies, and others.
In countries where mitigation efforts have not kept pace with VRES expansion, such as Chile, Ireland, and the United Kingdom, curtailment rates had already reached 5% to 15% of potential production by 2024 [1]. This significant reduction in energy output affects both the profitability of existing projects and the financial viability of new projects. Frew et al. [6] calculated that with 100% VRES penetration, U.S. grid system costs could double or triple. Jamroen et al. [7] analyzed the Thailand case study, concluding that neglecting the share of curtailment reduced profitability of PV systems by more than 20%. However, given the large number of influencing factors, curtailment forecasting is highly complex [8].
Several strategies have been proposed by the California Independent System Operator (CAISO) [9] for mitigating the effect of curtailment, such as enhancing system flexibility to accommodate higher shares of VRESs, implementing demand response to align consumption with generation patterns, and promoting geographical diversification to balance opposite generation and consumption trends. In the list of strategies, storage is prioritized as the first option. In fact, in the CAISO balancing area, Battery Energy Storage System (BESS) capacity grew from 500 MW in 2020 to 11,200 MW in June 2024. The support of BESS deployment is confirmed by numerous recent and forthcoming policy mechanisms worldwide. In the European Union, the REPowerEU [10] plan, the revised Electricity Market Design proposal [11], the Clean Energy Package [12], and the recommendations on energy storage [13] promote investments in flexibility assets, including storage, through targeted auctions, subsidies, and capacity remuneration mechanisms. Financial support to BESSs is further provided via instruments such as the Innovation Fund [14] and the Temporary Crisis and Transition Framework [15]. In the United States, the Inflation Reduction Act [16] introduced an investment tax credit for standalone storage, while in China, the 14th Five-Year Plan (for new energy storage development) [17] mandates large-scale storage integration, supported by regulatory incentives and market participation frameworks.
Clearly, the implementation of BESSs entails both capital and operational costs, which must necessarily be recovered through revenues. In other words, and specific terms, the Levelized Revenue of Electricity (LROE) from BESSs must exceed the Levelized Cost of Storage (LCOS) [18].
Despite the growing role of BESSs in mitigating curtailment, most LCOS values reported in the literature are rarely estimated for applications focused on curtailment mitigation. Instead, they often reflect systems designed for energy arbitrage or are calculated without considering curtailment at all, which may result in differing cost assessments and performance metrics. For example, for utility-scale stationary power applications, Lazard [19] reports LCOS values between 170 and 350 USD/MWh, while Rahman et al. [20] and Li et al. [21] estimate 180 USD/MWh and 310 USD/MWh. These values are calculated without accounting for curtailment-driven operation and therefore do not reflect the unique operational patterns of systems deployed for curtailment mitigation. This leads to a first gap: the lack of LCOS values estimated under curtailed-driven operation.
To the authors’ knowledge, only a limited number of studies have investigated the correlation between LCOS and curtailment, primarily focusing on wind energy. Among these, Rayit et al. [22] estimated the maximum LCOS at which BESSs used for wind curtailment mitigation remained economically viable in a specific case study in the UK. The results indicate that, to achieve an internal rate of return (IRR) of 8%, an LCOS below 150 GBP/kWh would be required. Johnson et al. [23] defined an energy storage cost of 780 USD/kW (ten hours of storage capacity) as necessary to reduce wind curtailment in four locations in the US. These studies, however, refer exclusively to wind energy curtailment. This highlights a second gap: the absence of LCOS analyses for BESSs deployed to mitigate photovoltaic curtailment. The relevance of this gap is further supported by recent studies. Veronese et al. [24] and Manzolini et al. [25] emphasized the importance of analyzing LCOS variation with VRES penetration, while Prol et al. [26] called for further investigation into the impact of curtailment mitigation on levelized costs.
Therefore, this study addresses the above gaps by evaluating the LCOS of Lithium-ion BESSs dedicated to PV curtailment mitigation. The analysis considers a range of curtailment scenarios (10–40%) defined by different hourly profiles (upper limit and proportional) and time horizons (2, 5, and 10 years). It further includes three storage capacities (0.33, 0.50, 0.67 h) and compares two locations—Cagliari (Italy) and Berlin (Germany)—with distinct PV characteristics. Therefore, the analysis examines the influence of three factors on LCOS, specifically the curtailment scenario, the battery capacity, and the geographic location.
Since the LCOS also represents an implicit revenue threshold, the results of this study are relevant for identifying the minimum revenue required for a BESS to be economically viable as a curtailment mitigation strategy. In this context, the findings can support the design of policies and incentive schemes aimed at achieving decarbonization targets by specifically promoting this important, albeit niche [26], application of BESSs.
The remainder of the paper is organized as follows. Section 2 presents a description of the methodology considered (simulation of PV-BESS system, definition of curtailment scenarios, calculation of LCOS), Section 3 presents the results for the considered scenarios as well as a sensitivity analysis, and Section 4 presents the conclusions.
2. Methods
The study employs a mathematical model implemented in MATLAB R2024b [27], with hourly time step computational simulations.
This section is structured as follows: Section 2.1 introduces the generation system in which the BESS is implemented, along with its operating logic; Section 2.2 describes the curtailment scenarios; and Section 2.3 reports the economic assumptions underlying the calculation of the Levelized Cost of Storage.
2.1. PV-BESS System
The system under consideration was a utility-scale PV power plant equipped with a BESS unit. The system is managed to always prioritize grid feed-ins, with the BESS intended to store non-dispatchable (otherwise curtailed) PV generation and to discharge it when dispatch is once again permitted.
Schematics of the energy flows and operating logic are shown in Figure 1a and Figure 1b, respectively. Depending on the curtailment scenario and related dispatch limitations, PV production is either fully or partially fed to the grid (EPV,G). In the latter case, otherwise curtailed PV production is directed to the BESS for charging (EPV,BESS) until the battery charge limit is reached. Once this limit is achieved, any surplus PV production is curtailed (EPV,CURT). According to Jones-Albertus et al. [28], the sum of EPV,G and EPV,BESS is referred to as valuable photovoltaic electricity (EPV,VAL). The stored energy is fed into the grid (EBESS,G) when dispatch is allowed, simultaneously with EPV,G. Allowing simultaneous feed-in from both the PV system and the BESS represents a strategic approach for the effective use of the BESS, especially during morning and evening hours. Indeed, during these periods, the residual load (excluding VRES) is typically high. Therefore, discharging the battery while feeding in PV energy enhances system support and grid stability.
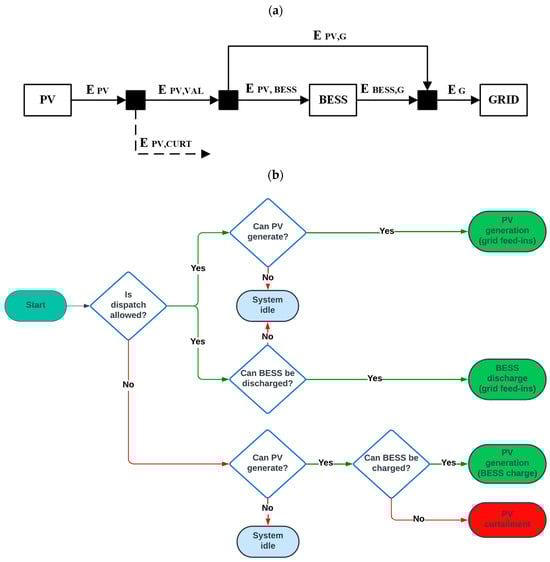
Figure 1.
Energy flows (a) and operating logic (b).
At each time step, the following energy balance equations are satisfied:
The PV generation, sourced from PVGIS [29], is based on the ERA5 solar radiation database, azimuth and slope angles optimized for maximizing generation in the considered area, modules with crystalline silicon cells with a nominal efficiency (STC) of 22.6% [30], a system loss of 14% [29], and a generation reduction of 0.7% per year [31].
The BESS is a utility-scale Lithium-ion battery with a variable net capacity (EBESS,NOM), herein expressed in terms of storage hours (HBESS), as a function of nominal PV production:
This study considers three typical BESS capacities for equipping utility-scale PV systems, which have been defined by the Fraunhofer Institute: 0.33, 0.50, and 0.67 h [32]. As reported by TERNA for stationary applications [33], a unitary C-RATE (defined as the rate at which the BESS charges or discharges relative to its maximum capacity) is assumed, as well as a round-trip efficiency (ηRT) of 90% [34], a daily self-discharge rate of 0.2% [34], and an overall capacity loss of 1.4% per year [35].
2.2. Curtailment Scenarios
If not equipped with storage systems of sufficient capacity, PV power plants, such as the one described in Section 2.1, are expected to experience increasing curtailment levels of their net energy production in the coming years. The yearly curtailment of PV generation (CURT) is defined as
The curtailment scenarios considered in the present analysis involve a maximum curtailment level (CURTMAX) ranging from 10% to 40%, achieved through linear growth over 2, 5, or 10 years. It is clarified that these curtailment scenarios are externally imposed as boundary conditions and do not result from dynamic grid simulations, with the latter aspect representing an interesting development of the work.
As reported by the IEA [36], some countries are already reaching a 20% curtailment level. Therefore, the minimum value of 10% and the maximum value of 40% represent half and double the maximum current level, respectively. Clearly, the 2-year scenario represents a short-term horizon, the 5-year scenario represents a medium-term horizon, and the 10-year scenario represents a long-term horizon.
The two hourly profiles (named the upper limit (UL) and proportional (PR) profiles) reported by Kato et al. [37] and illustrated in Figure 2 were considered and compared for the hourly distribution of the curtailment level.
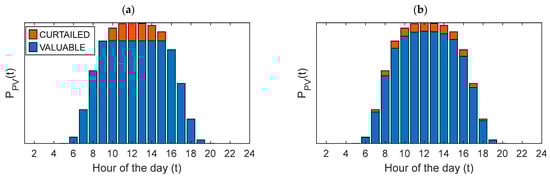
Figure 2.
Upper limit (UL) (a) and proportional (PR) (b) profiles of hourly curtailment (typical day).
In the upper limit profile (Figure 2a), PV energy is curtailed once a specific power threshold is reached. In contrast, in the proportional profile (Figure 2b), curtailment occurs proportionally to the PV power. These profiles therefore simulate curtailment orders or generation reduction signals transmitted by Transmission System Operators to the control systems of photovoltaic plants.
In the upper limit profile, peak generation is curtailed first. As a result, PV generation is primarily reduced during the central hours of the day and the months with the highest PV production. In contrast, the proportional profile applies the same percentage of curtailment across all hours of the day and throughout the entire year.
To the authors’ knowledge, there is still a lack of simulation models for curtailment profiles in the literature, as well as of consolidated data sets in official reports. However, it is interesting to observe (Figure 3) that the 2023 CAISO [9] curtailment profile aligns quite well with the proportional curtailment profile.
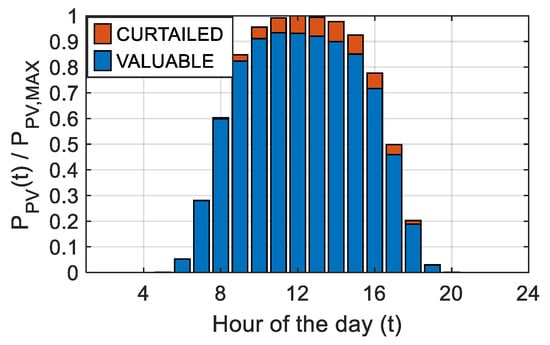
Figure 3.
Generalized CAISO profile of hourly curtailment (average 2023).
In summary, this analysis examines varying levels of CURTMAX for six different scenarios characterized by two key factors. The first is the time frame in which the maximum curtailment level (CURTMAX) is reached, specifically in 2, 5, or 10 years. The second is the hourly curtailment distribution, which follows either an upper limit (UL) or a proportional (PR) profile.
For better clarity, Figure 4 shows the distribution of curtailed and valuable PV generation over the system lifetime when CURTMAX reaches 20% in 10 years (UL profile), for HBESS = 0 h (a) and HBESS = 0.67 h (b). As can be seen, the total producibility (EPV) of the system (sum of blue, orange, and yellow bars) decreases over time due to the degradation of the PV modules. Additionally, the CURTMAX level of 20% is reached by the 10th year. Clearly, the presence of the BESS allows the minimization of the curtailment of EPV (Figure 4b).
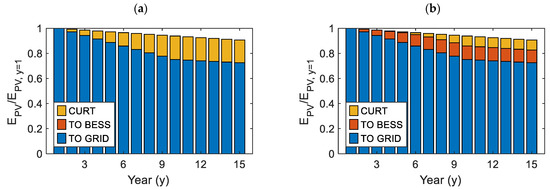
Figure 4.
Curtailed and valuable PV generation over system lifetime when CURTMAX reaches 20% in 10 years (UL profile) for HBESS = 0 h (a) and HBESS = 0.67 h (b).
2.3. Economic Assumptions
The Levelized Cost of Storage for Curtailment Mitigation (LCOSCM) was calculated based on the LCOS formulation by Jülch et al. [38], but with charging costs considered null, since the BESS is charged solely with electricity that would otherwise be curtailed:
where I0 is the investment cost, O&M is the cost for operation and maintenance, and EBESS,G is the electricity discharged, which accounts for the aforementioned yearly capacity loss due to BESS degradation. BESS replacement is not considered, as the LCOS calculation is based on the assumed lifetime of the BESS system (15 years [32,34]). Other assumptions are reported in Table 1. A sensitivity analysis of the LCOSCM by varying the investment cost and the discount rate is reported in the Sensitivity Analysis Section.

Table 1.
BESS cost assumptions (utility-scale).
3. Results and Discussion
The LCOSCM was evaluated for two locations (Cagliari, Italy, and Berlin, Germany) that are very different in terms of PV energy potential. First, the yearly PV energy generation in Cagliari, given the assumption previously reported, is around 1600 kWh/kW, while in Berlin, it is approximately 1000 kWh/kW. Moreover, the monthly distribution of PV generation differs significantly between the two locations, as shown in Figure 5 (average daily generation per month). Indeed, Cagliari (Figure 5a) exhibits a more uniform PV generation across months, whereas Berlin (Figure 5b) shows strong seasonality, with a sharp summer peak and low winter values. In Cagliari, variations are gradual, while in Berlin, production increases rapidly until May and then decreases sharply after September. The trend observed in Figure 5a is typical of a Mediterranean climate with consistent solar irradiation throughout the year, whereas the trend in Figure 5b is characteristic of a temperate climate.
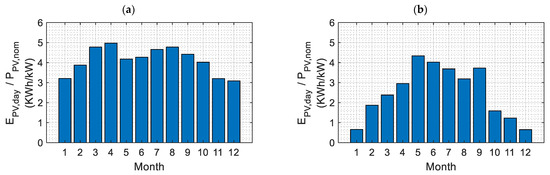
Figure 5.
Average daily PV generation per month in (a) Cagliari, Italy, and (b) Berlin, Germany.
Given this, Figure 6 shows the overall yearly curtailment of PV generation for the two locations, highlighting the difference while considering the two hourly curtailment profiles as functions of CURTMAX and for the three BESS capacities. It is clear that the effectiveness of the BESS in curtailment mitigation depends on the hourly curtailment profile. As can be observed, the BESS is less effective in mitigating curtailment when an upper limit profile is considered, compared to a proportional profile, due to the higher concentration of curtailment during peak months. As a result, in the case of the UL profile, curtailment remains very low during winter months (low PV generation), leading to limited battery utilization on average. In contrast, with the PR profile, curtailment is more evenly distributed throughout the 12 months, allowing better battery utilization even during winter months. This is particularly evident in Berlin (Figure 6b), where there is significant variability between winter and summer months, and the UL profile does not curtail winter production unless very high CURTMAX levels are reached. As a consequence, with the PR profile, the battery is able to mitigate curtailment even during winter months, leading to a lower achievable curtailment level. On the contrary, in Cagliari (Figure 6a), where the average daily photovoltaic production is relatively uniform across different months, the upper limit and proportional curtailment profiles lead to very similar results in terms of daily curtailment (and consequent BESS mitigation capacity).
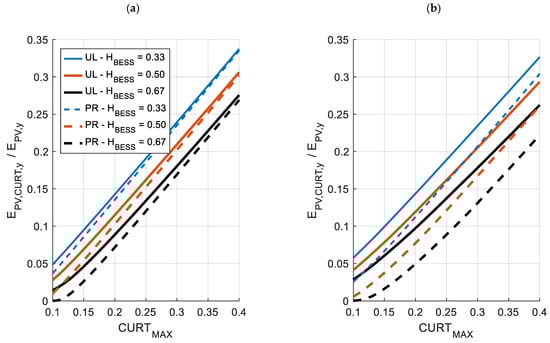
Figure 6.
Curtailment of PV generation as function of CURTMAX and HBESS for (a) Cagliari, Italy, and (b) Berlin, Germany. Upper limit (UL) and proportional (PR) profiles of hourly curtailment.
Therefore, as a general conclusion, in analyses where a curtailment profile needs to be estimated, a more conservative assumption is to use an upper limit hourly curtailment profile rather than a proportional one, particularly in temperate climate areas.
Figure 7 and Figure 8 report the LCOSCM for the two locations and the different curtailment scenarios as functions of CURTMAX and for storage capacities (HBESS) of 0.33, 0.50, and 0.67 h. In particular, Figure 7a–c refer to Cagliari, Italy, and Figure 8a–c to Berlin, Germany. For each location, Figure 7 and Figure 8 show the LCOSCM for the short-term horizon (2 years), the medium-term horizon (5 years), and the long-term horizon (10 years). The LCOSCM values obtained considering the upper limit (UL) profile of hourly curtailment are represented with solid lines, while dashed lines represent the proportional (PR) hourly curtailment profile.
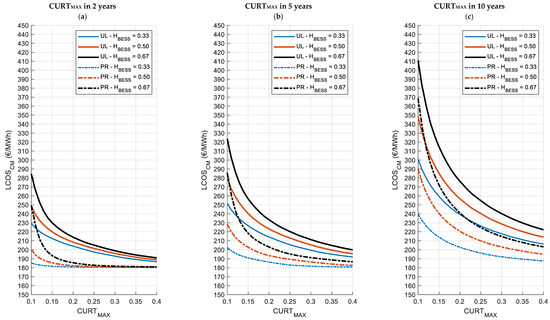
Figure 7.
The LCOSCM as a function of CURTMAX for the three BESS capacities and the two hourly curtailment profiles in the short-term (a), medium-term (b) and long-term (c) horizons. Cagliari, Italy.
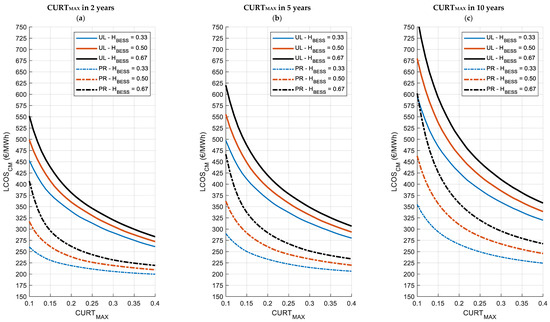
Figure 8.
The LCOSCM as a function of CURTMAX for the three BESS capacities and the two hourly curtailment profiles in the short-term (a), medium-term (b) and long-term (c) horizons. Berlin, Germany.
Among the general considerations for both Figure 7a–c and Figure 8a–c, it can be observed that a higher CURTMAX leads to a lower LCOSCM, as more energy becomes available for charging the BESS. Consequently, the system’s costs are distributed over a greater discharged energy amount, reducing the LCOSCM. For the same reason, the sooner this maximum level is reached, the lower the LCOSCM.
However, as the maximum curtailment level (CURTMAX) increases, the LCOS curves of larger storage capacities converge toward the LCOSCM curves of smaller storage capacities, indicating that they approaching saturation and that, under these conditions, storage capacity is no longer influential: this is particularly evident in Figure 7a (PR profile). For CURTMAX > 0.25, BESS saturation is reached for all capacities and additional increases in curtailment no longer significantly impact on LCOSCM as the system is already operating at its full potential.
In any case, the minimum LCOSCM values (around 180 EUR/MWh for Cagliari and 200 EUR/MWh for Berlin) are significantly higher than the recent average day-ahead electricity selling prices in the respective countries (108 and 78 EUR/MWh [39,40]). It is therefore evident that, if LCOSCM is considered the minimum revenue required for a BESS system to be economically viable as a strategy for mitigating PV curtailment, such systems are competitive in the day-ahead market only when the price at which their electricity is sold significantly exceeds the average day-ahead electricity selling prices. Their deployment can thus only be justified in more profitable markets, such as flexibility markets.
Another aspect of interest is that, as expected, the LCOSCM curves for the upper limit profile are consistently higher than those for the proportional profile. This difference arises because the upper limit profile results in lower curtailments during winter months, reducing the energy available for the BESS. As a result, costs are allocated over a smaller discharged energy amount, leading to a higher LCOSCM compared to the proportional profile.
With reference to the location, in the case of Cagliari (Figure 7a–c) it can be observed that for low curtailment levels (10%), LCOSCM values are extremely high, reaching up to 280, 320, and 410 EUR/MWh for time horizons of 2, 5, and 10 years, respectively. However, as curtailment increases to 40%, LCOSCM values decrease to around 180–190 EUR/MWh, with minimal differences across all time horizons.
In the short term (2 years—Figure 7a), LCOSCM shows high variability across different storage capacities when CURTMAX is below 20%. Beyond this threshold, values converge to 190–200 EUR/MWh for the upper limit profile and 180–185 EUR/MWh for the proportional profile. In the medium term (5 years—Figure 7b), a similar pattern is observed, with significant LCOSCM variations for CURTMAX values below 25%. Beyond this point, values stabilize around 200–210 EUR/MWh for the upper limit profile and 180–190 EUR/MWh for the proportional profile. In the long term (10 years—Figure 7c), variability persists for CURTMAX values below 30%, after which LCOSCM values remain 20 EUR/MWh apart for both the upper limit and proportional profiles. This reduction in variability—or convergence of the curves—confirms the approaching of the saturation condition even in the greatest BESS.
In Berlin (Figure 8a–c), LCOSCM values exhibit significant variations depending on the curtailment level and time horizon. For low curtailment levels (10%), the LCOSCM reaches exceptionally high values, up to 550 EUR/MWh for 2 years, 625 EUR/MWh for 5 years, and over 750 EUR/MWh for 10 years. As curtailment increases to 40%, LCOSCM values decrease, ranging between 225 and 250 EUR/MWh for the proportional profile and 275–350 EUR/MWh for the upper limit profile, with noticeably higher values for longer time horizons.
In the short term (2 years—Figure 8a), LCOSCM exhibits high variability across different storage capacities for CURTMAX values below 25%. Beyond this threshold, values converge toward 275 EUR/MWh for the upper limit and 225 EUR/MWh for the proportional profile. In the medium term (5 years—Figure 8b), a similar trend is observed, with significant variability for CURTMAX values below 30%, followed by convergence around 300 EUR/MWh for the upper limit and 225 EUR/MWh for the proportional profile. In the long term (10 years—Figure 8c), LCOSCM remains highly variable for CURTMAX values below 35%, after which values stabilize, maintaining a 20–25 EUR/MWh difference between the UL and PR profiles.
Several considerations can be made when comparing the results between the two locations.
First, in Berlin, LCOSCM values are consistently higher than in Cagliari for all curtailment scenarios and BESS capacities. At 10% CURTMAX, LCOSCM reaches exceptionally high values, exceeding 750 EUR/MWh for a 10-year horizon, compared to 410 EUR/MWh in Cagliari. Even at 40% CURTMAX, where LCOSCM is significantly reduced, values in Berlin remain substantially higher (225–350 EUR/MWh) than in Cagliari (180–190 EUR/MWh). These differences suggest that the economic viability of the BESS is more challenging in Berlin due to the lower photovoltaic potential and higher seasonal variability.
Second, the curtailment profile has a noticeable impact on LCOSCM. Across both locations, the upper limit profile consistently leads to higher LCOSCM values compared to the proportional profile, although this difference is particularly evident in climates where monthly photovoltaic production exhibits high variability (Berlin).
Finally, in both locations, the LCOS becomes less sensitive to storage capacity as CURTMAX exceeds 25–30%, indicating that such curtailment levels allow the costs of even larger systems to be distributed over a sufficient energy share, thereby limiting LCOSCM.
In conclusion, depending on the storage size, curtailment scenario, and location, the LCOSCM value can differ significantly. Therefore, it is crucial that official reports present LCOS values differentiated by application (PV-coupled for curtailment mitigation, self-consumption, arbitrage, etc.), storage size, curtailment evolution scenario, and specific geographical area.
Table 2 and Table 3 summarize the minimum and maximum LCOSCM values calculated for each scenario in Cagliari and Berlin, respectively. LCOSCM values exceeding the LCOS range for BESSs defined in [19] (155–320 EUR/MWh) are marked with an asterisk. While in Cagliari only two scenarios result in LCOSCM values outside this range, the situation in Berlin is significantly more critical. This indicates that the levelized cost of BESSs used for curtailment mitigation is, on average, close to that of BESSs used for bulk energy storage applications in Cagliari, but not in Berlin.
Table 2.
Summary of LCOSCM of BESSs for curtailment mitigation in Cagliari, Italy.
Table 3.
Summary of LCOSCM of BESSs for curtailment mitigation in Berlin, Germany.
Sensitivity Analysis
To assess the impact of key techno-economic parameters on LCOSCM, Figure 9 presents the results of a sensitivity analysis, where the investment cost (I0), discount rate (r), and round-trip efficiency (ηRT) are varied. In more detail, ηRT is varied within ±5% of its reference value (0.90), the discount rate from 70% to 130% of its baseline value (2.5%), and the investment cost (I0) is varied only in the downward direction, from its baseline value (500 EUR/kWh) to 70% (350 EUR/kWh), in line with the cost projections by the Fraunhofer Institute, which estimates a 30% reduction by 2035 [32].
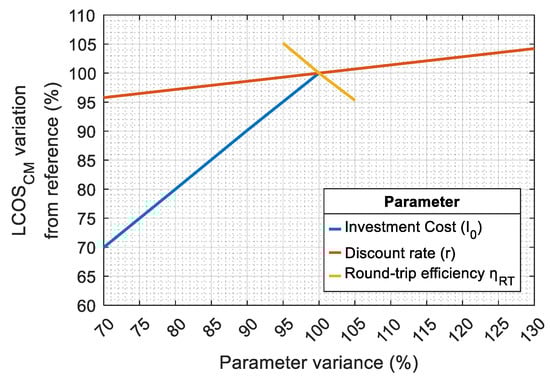
Figure 9.
Sensitivity analysis (reference conditions: HBESS = 0.5; ηRT = 0.90; CURTMAX = 0.25; medium-term horizon).
Since the results are consistent across both locations (Cagliari and Berlin) and curtailment profiles (UL and PR), they are presented in a single graph and refer to intermediate conditions, specifically a BESS duration (HBESS) of 0.5 h, a maximum curtailment level (CURTMAX) of 25%, and a medium-term (5-year) horizon.
As can be observed, the LCOS is strongly influenced by both investment cost and BESS efficiency, while the impact of the discount rate is relatively smaller.
4. Conclusions
This study assesses the LCOS of BESSs implemented for mitigating the curtailment of PV power generation systems. The analysis was conducted for three typical BESS capacities, two European locations, and various curtailment evolution scenarios. These scenarios are simulated as a combination of maximum curtailment level, time to reach this curtailment level, and hourly curtailment profile.
The results highlight a clear disparity in LCOS between the two locations studied. Cagliari (Italy), with its relatively high and uniform PV generation, exhibits lower LCOS values compared to Berlin (Germany), which experiences lower generation and higher seasonal variability. Consequently, the LCOS of BESSs used for curtailment mitigation is, on average, close to that of BESSs used for bulk energy storage applications (155–320 EUR/MWh) in Cagliari, but not in Berlin. For a maximum curtailment level of 10% reached in 5 years, the LCOS for a 0.5 h BESS capacity is approximately 255 EUR/MWh in Cagliari and 460 EUR/MWh in Berlin (average across hourly curtailment profiles). This difference underscores the more challenging economic viability of BESSs in locations with lower photovoltaic potential and greater seasonal fluctuations in power production. However, even the lowest LCOS values (180 EUR/MWh for Cagliari and 200 EUR/MWh for Berlin) are still well above recent average electricity prices (108 EUR/MWh for Cagliari and 78 EUR/MWh for Berlin). This demonstrates that BESSs implemented for curtailment mitigation are only competitive in the day-ahead market if their electricity is sold at a price significantly higher than the average price. Profitability, however, may be higher in flexibility markets, making this an interesting area for future research. The deployment of BESSs for photovoltaic curtailment mitigation could also be promoted through targeted incentive measures based on, among other factors, the geographical area and related photovoltaic potential.
However, it is clear that curtailment mitigation cannot rely solely on BESSs. Achieving effective mitigation will require a combination of strategies, including demand response, alternative storage technologies, and advanced grid management solutions. Furthermore, integrating flexible loads and enhancing forecasting capabilities for renewable generation can optimize the use of energy storage and reduce curtailment. Additionally, decentralized energy systems and energy communities may play crucial roles in balancing supply and demand at a local level, providing greater flexibility and resilience to the grid.
A further finding of the study is that the hourly curtailment profile—upper limit or proportional—greatly affects the LCOS, with the upper limit profile leading to higher costs, particularly in locations with significant seasonal variation like Berlin.
The study also reveals that as the maximum curtailment level increases beyond 25–30%, LCOS values tend to converge for all storage capacities. This convergence suggests that higher curtailment levels allow the costs of larger batteries to be distributed over a larger mitigation effect, reducing the LCOS.
These findings emphasize the need for further research to develop curtailment scenarios with sufficient temporal resolution and a time horizon comparable with the system’s lifetime, as well as to validate existing curtailment scenarios.
In conclusion, the economic viability of BESSs for curtailment mitigation is highly dependent on their application, storage size, curtailment scenario, and location. Therefore, official reports should incorporate these factors to better reflect the diverse conditions that influence the economic performance of BESSs.
Author Contributions
Conceptualization: L.M. and D.C.; Data Curation: L.M.; Formal Analysis: L.M., D.C. and M.P.; Investigation: L.M.; Methodology: L.M. and D.C.; Project Administration: L.M. and D.C.; Software: L.M.; Supervision: D.C.; Validation: L.M.; Visualization: L.M. and M.P.; Writing—Original Draft: L.M.; Writing—Review and Editing: L.M., D.C. and M.P. All authors have read and agreed to the published version of the manuscript.
Funding
This paper is part of a research initiative financed under the National Recovery and Resilience Plan (NRRP), Mission 4, Component 2, Investment 1.3—Call for tender No. 1561 dated 11/10/2022, of Ministero dell’Università e della Ricerca (MUR); funded by the European Union—NextGenerationEU. Project PE0021 “Network 4 Energy Sustainable Transition—NEST”, CUP F53C22777, Annex E Decree No. 1561/2022.
Data Availability Statement
Data will be made available on request.
Acknowledgments
During the preparation of this manuscript, the authors used OpenAI ChatGPT for the purposes of text editing. The authors take full responsibility for the content of this publication.
Conflicts of Interest
The authors declare no conflicts of interest.
Abbreviations
The following abbreviations are used in this manuscript:
| Symbols | |
| CURT | Yearly curtailment |
| CURTMAX | Maximum yearly curtailment across the system lifetime |
| E | Electricity |
| EBESS,G | Electricity discharged by the BESS and fed into the grid |
| EG | Overall electricity fed into the grid |
| EPV | Electricity producible by the PV plant (including curtailment) |
| EPV,CURT | PV generation curtailment |
| EPV,BESS | Electricity generated by the PV system and used to charge the BESS |
| EPV,G | Electricity generated by the PV system and fed into the grid |
| EPV,VAL | Valuable (not curtailed) electricity generated by the PV system |
| HBESS | BESS capacity (hours of PV nominal power) |
| P | Power |
| r | Discount rate |
| y | Year |
| Y | System lifetime |
| ηRT | BESS round-trip efficiency |
| Acronyms | |
| BESS | Battery Energy Storage System |
| LCOE | Levelized Cost of Electricity |
| PV | Photovoltaic |
| VRES | Variable Renewable Energy Source |
References
- International Energy Agency (IEA). Renewables 2024; IEA: Paris, France, 2024. [Google Scholar]
- Arabzadeh, V.; Frank, R. Creating a Renewable Energy-Powered Energy System: Extreme Scenarios and Novel Solutions for Large-Scale Renewable Power Integration. Appl. Energy 2024, 374, 124088. [Google Scholar] [CrossRef]
- Borbáth, T.; Van Hertem, D. Appropriate Transmission Grid Representation for European Resource Adequacy Assessments. Appl. Energy 2024, 355, 122378. [Google Scholar] [CrossRef]
- Fraunholz, C.; Tash, A.; Scheben, H.; Zillich, A. Demand Curtailment Allocation in Interconnected Electricity Markets. Appl. Energy 2025, 377, 124679. [Google Scholar] [CrossRef]
- Ruggles, T.H.; Caldeira, K. Wind and Solar Generation May Reduce the Inter-Annual Variability of Peak Residual Load in Certain Electricity Systems. Appl. Energy 2022, 305, 117773. [Google Scholar] [CrossRef]
- Frew, B.A.; Becker, S.; Dvorak, M.J.; Andresen, G.B.; Jacobson, M.Z. Flexibility Mechanisms and Pathways to a Highly Renewable US Electricity Future. Energy 2016, 101, 65–78. [Google Scholar] [CrossRef]
- Jamroen, C.; Vongkoon, P.; Ma, T. Techno-Economic Assessment of Grid-Connected Residential Photovoltaic Systems Considering Overvoltage-Induced Generation Curtailment. Energy Rep. 2024, 11, 5059–5068. [Google Scholar] [CrossRef]
- Shams, M.H.; Niaz, H.; Hashemi, B.; Jay Liu, J.; Siano, P.; Anvari-Moghaddam, A. Artificial Intelligence-Based Prediction and Analysis of the Oversupply of Wind and Solar Energy in Power Systems. Energy Convers. Manag. 2021, 250, 114892. [Google Scholar] [CrossRef]
- CAISO (California ISO). Available online: http://www.caiso.com/Pages/default.aspx (accessed on 12 March 2024).
- REPowerEU. Available online: https://commission.europa.eu/strategy-and-policy/priorities-2019-2024/european-green-deal/repowereu-affordable-secure-and-sustainable-energy-europe_en (accessed on 9 April 2025).
- Electricity Market Design. Available online: https://energy.ec.europa.eu/topics/markets-and-consumers/electricity-market-design_en (accessed on 9 April 2025).
- EU Agency for the Cooperation of Energy Regulators (ACER). Clean Energy Package. Available online: https://www.acer.europa.eu/electricity/about-electricity/clean-energy-package (accessed on 9 April 2025).
- Recommendations on Energy Storage. Available online: https://energy.ec.europa.eu/topics/research-and-technology/energy-storage/recommendations-energy-storage_en (accessed on 9 April 2025).
- European Commission. Innovation Fund. Available online: https://climate.ec.europa.eu/eu-action/eu-funding-climate-action/innovation-fund_en (accessed on 9 April 2025).
- European Commission. Temporary Crisis and Transition Framework. Available online: https://competition-policy.ec.europa.eu/state-aid/temporary-crisis-and-transition-framework_en (accessed on 9 April 2025).
- Internal Revenue Service. Inflation Reduction Act of 2022. Available online: https://www.irs.gov/inflation-reduction-act-of-2022 (accessed on 9 April 2025).
- Li, Q.; Yu, X.; Li, H. Batteries: From China’s 13th to 14th Five-Year Plan. eTransportation 2022, 14, 100201. [Google Scholar] [CrossRef]
- Glenk, G.; Reichelstein, S. The Economic Dynamics of Competing Power Generation Sources. Renew. Sustain. Energy Rev. 2022, 168, 112758. [Google Scholar] [CrossRef]
- Lazard. Levelized Cost of Energy+. Available online: https://www.lazard.com/research-insights/levelized-cost-of-energyplus/ (accessed on 7 April 2025).
- Rahman, M.M.; Oni, A.O.; Gemechu, E.; Kumar, A. The Development of Techno-Economic Models for the Assessment of Utility-Scale Electro-Chemical Battery Storage Systems. Appl. Energy 2021, 283, 116343. [Google Scholar] [CrossRef]
- Li, L.; Wang, B.; Jiao, K.; Ni, M.; Du, Q.; Liu, Y.; Li, B.; Ling, G.; Wang, C. Comparative Techno-Economic Analysis of Large-Scale Renewable Energy Storage Technologies. Energy AI 2023, 14, 100282. [Google Scholar] [CrossRef]
- Rayit, N.S.; Chowdhury, J.I.; Balta-Ozkan, N. Techno-Economic Optimisation of Battery Storage for Grid-Level Energy Services Using Curtailed Energy from Wind. J. Energy Storage 2021, 39, 102641. [Google Scholar] [CrossRef]
- Johnson, J.X.; De Kleine, R.; Keoleian, G.A. Assessment of Energy Storage for Transmission-Constrained Wind. Appl. Energy 2014, 124, 377–388. [Google Scholar] [CrossRef]
- Veronese, E.; Manzolini, G.; Moser, D. Improving the Traditional Levelized Cost of Electricity Approach by Including the Integration Costs in the Techno-Economic Evaluation of Future Photovoltaic Plants. Int. J. Energy Res. 2021, 45, 9252–9269. [Google Scholar] [CrossRef]
- Manzolini, G.; di Milano, P.; Binotti, M.; Gentile, G.; Picotti, G.; Pilotti, L.; Cholette, M.E. Actual Cost of Electricity: An Economic Index to Overcome Levelized Cost of Electricity Limits. iScience 2024, 27, 109897. [Google Scholar] [CrossRef]
- López Prol, J.; Zilberman, D. No Alarms and No Surprises: Dynamics of Renewable Energy Curtailment in California. Energy Econ. 2023, 126, 106974. [Google Scholar] [CrossRef]
- The MathWorks Inc. MATLAB Version: R2024b; The MathWorks Inc.: Natick, MA, USA, 2024. [Google Scholar]
- Jones-Albertus, R.; Cole, W.; Denholm, P.; Feldman, D.; Woodhouse, M.; Margolis, R. Solar on the Rise: How Cost Declines and Grid Integration Shape Solar’s Growth Potential in the United States. MRS Energy Sustain. 2018, 5, E4. [Google Scholar] [CrossRef]
- European Commission. JRC Photovoltaic Geographical Information System (PVGIS). Available online: https://re.jrc.ec.europa.eu/pvg_tools/en/ (accessed on 5 October 2024).
- SunPower®. SunPower® Solar Panels | Maxeon6-475W. Available online: https://sunpower.maxeon.com/it/sites/default/files/2019-09/sunpower-maxeon-serie-x-x22-360-x21-345-commerciale.pdf (accessed on 19 September 2023).
- Rahman, T.; Al Mansur, A.; Hossain Lipu, M.S.; Rahman, M.S.; Ashique, R.H.; Houran, M.A.; Elavarasan, R.M.; Hossain, E. Investigation of Degradation of Solar Photovoltaics: A Review of Aging Factors, Impacts, and Future Directions toward Sustainable Energy Management. Energies 2023, 16, 3706. [Google Scholar] [CrossRef]
- Fraunhofer Institute for Solar Energy Systems ISE. Levelized Cost of Electricity—Renewable Energy Technologies; Fraunhofer Institute for Solar Energy Systems ISE: Freiburg, Germany, 2024. [Google Scholar]
- Terna. Study on Reference Technologies for Electricity Storage; TERNA S.p.A: Rome, Italy, 2023. [Google Scholar]
- Kebede, A.A.; Kalogiannis, T.; Van Mierlo, J.; Berecibar, M. A Comprehensive Review of Stationary Energy Storage Devices for Large Scale Renewable Energy Sources Grid Integration. Renew. Sustain. Energy Rev. 2022, 159, 112213. [Google Scholar] [CrossRef]
- Grimaldi, A.; Minuto, F.D.; Perol, A.; Casagrande, S.; Lanzini, A. Ageing and Energy Performance Analysis of a Utility-Scale Lithium-Ion Battery for Power Grid Applications through a Data-Driven Empirical Modelling Approach. J. Energy Storage 2023, 65, 107232. [Google Scholar] [CrossRef]
- International Energy Agency (IEA). Renewable Energy Market Update-June 2023; IEA: Paris, France, 2023. [Google Scholar]
- Kato, T.; Imanaka, M.; Kurimoto, M.; Sugimoto, S. Impact of Power Output Curtailment Control of Photovoltaic Power Generation on Grid Frequency. IFAC-Pap. 2020, 53, 12157–12162. [Google Scholar] [CrossRef]
- Jülch, V. Comparison of Electricity Storage Options Using Levelized Cost of Storage (LCOS) Method. Appl. Energy 2016, 183, 1594–1606. [Google Scholar] [CrossRef]
- PUN Index GME. Available online: https://gme.mercatoelettrico.org/en-us/Home/Results/Electricity/MGP/Results/PUN (accessed on 17 February 2025).
- Bundesnetzagentur. Bundesnetzagentur Publishes 2024 Electricity Market Data. Press, 3 January 2025. Available online: https://www.bundesnetzagentur.de/SharedDocs/Pressemitteilungen/EN/2025/20250103_SMARD.html (accessed on 17 February 2025).
Disclaimer/Publisher’s Note: The statements, opinions and data contained in all publications are solely those of the individual author(s) and contributor(s) and not of MDPI and/or the editor(s). MDPI and/or the editor(s) disclaim responsibility for any injury to people or property resulting from any ideas, methods, instructions or products referred to in the content. |
© 2025 by the authors. Licensee MDPI, Basel, Switzerland. This article is an open access article distributed under the terms and conditions of the Creative Commons Attribution (CC BY) license (https://creativecommons.org/licenses/by/4.0/).