Abstract
The application of fluidized bed reactors to biomass fast pyrolysis is regarded as a promising technology for enabling high-value utilization of biomass. This work established a three-dimensional numerical model of an industrial-scale fluidized bed reactor for biomass catalytic pyrolysis, employing the multiphase particle-in-cell method (MP-PIC) and coupling catalytic pyrolysis kinetics. Primary gas flow rate and biomass–catalyst injection modes were optimized to further improve the performance of the reactor. The model received additional validation from experimental data, primarily to ensure prediction accuracy. The results revealed that an optimal primary gas flow rate of 4 kg/s achieved a peak catalytic efficiency of 71.3%. Using maximum high-quality liquid fuels and adopting a relatively dispersed inlet mode with opposite jetting for biomass and catalyst promoted uniform particle distribution and thermal homogeneity in the dense phase zone, further increasing the catalytic efficiency to 75.6%. With the integration of the multiphase particle-in-cell (MP-PIC) method with catalytic pyrolysis kinetics at the industrial-scale, this work could provide theoretical guidance for designing fluidized bed catalytic pyrolysis reactors and optimizing biomass catalytic pyrolysis processes.
1. Introduction
Biomass, as the sole renewable carbon-containing resource, has gained significant attention as a promising alternative to petroleum-based energy sources due to the exacerbating energy crisis and environmental degradation [1,2,3]. Biomass pyrolysis—a process that decomposes biomass into liquid, gas, and biochar at high temperature in the absence of oxygen or with minimal oxygen [4]—currently constitutes an important route for biomass conversion [5,6]. This process can selectively produce three categories of high-value products, namely, premium liquid fuels, high-value-added chemicals, and high-performance carbon materials [7]. Pyrolysis gas could be utilized for direct combustion to supply energy or synthesize high-value-added materials such as graphene [8], while biochar finds extensive applications in pollutant adsorption [9,10], soil improvement [11,12], etc., depending on its specific properties. However, bio-oil suffers from several drawbacks, including high oxygen content, low heating value, and poor instability compared to petroleum, which significantly limits its application [13]. Hence, catalytic pyrolysis is frequently employed to overcome these challenges, enhancing the quality of the bio-oil product [14].
The pyrolysis reactor serves as a crucial role within the entire biomass pyrolysis system [15]. Fluidized bed reactors are widely employed for biomass thermochemical conversion due to their advantages of intensive gas–solid mixing uniformity and rapid heat-mass transfer efficiency [16]. Nevertheless, industrial applications still face persistent challenges, including heat-reaction imbalances and low catalytic efficiency. Though experimental studies offer direct insights into the pyrolysis mechanisms, they are often constrained by high operational costs and stringent reactor requirements. Therefore, comprehensive investigations applying more efficient tools are essential to better understand the thermochemical processes in industrial-scale fluidized bed reactors.
Numerical simulation has become an increasingly effective approach for studying biomass thermochemical conversion in fluidized bed reactors, particularly for analyzing dynamics of gas–solid interaction dynamics [17,18], thermal energy exchange mechanisms [19,20], and multiphase chemical reactions [21,22,23]. The Eulerian–Eulerian and Eulerian–Lagrangian frameworks for numerical simulation were universally employed in a previous study [24]. Within the Eulerian–Eulerian approach, the gas and solid phase are considered mutually as permeating continua, limiting access to obtain particle-scale information. Conversely, the Eulerian–Lagrangian method can easily capture detailed particle interactions but requires substantial computational resources. The multiphase particle-in-cell (MP-PIC) method, operating within the Eulerian–Lagrangian framework, enables computationally efficient modeling of industrial-scale gas–solid systems while retaining particle-scale fidelity [25]. Significantly, the current studies indicate a notable absence of three-dimensional models and optimization of industrial-scale fluidized bed reactors based on the MP-PIC method.
Multiphase flow dynamics within fluidized beds has persistently captured significant attention from scientific and engineering communities [26]. Operational parameters and reactor geometry critically influence fluidized bed performance, as evidenced by recent experimental and computational studies. Gao et al. [27] conducted a combined numerical and experimental study examining how fluidization intensity impacts fast pyrolysis of bioslurry. Their research revealed that maintaining a flow rate of 2.0 L/min produced optimal fluidization conditions for the process. Duan et al. [28] developed a multi-compartment fluidized bed reactor specifically for biomass fast pyrolysis. Their research focused on analyzing how feeding rate and the dimensions of the compartment divider openings influenced flow dynamics. Those investigations aimed to refine both feeding parameters and internal configuration of the reactor for optimal performance. It is notable that inlet configurations have received limited attention in the existing literature and remain insufficiently investigated despite their substantial influence on the hydrodynamic behavior and catalytic efficiency of fluidized bed reactors.
For biomass pyrolysis, researchers have established a comprehensive, multi-step, and multi-component kinetic model [29]. However, the kinetic models for catalytic pyrolysis remain inadequately characterized, as most scale-up studies of fluidized bed reactors have prioritized particle mixing and heat transfer over reaction kinetics integration [30]. The unclear biomass catalytic pyrolysis kinetic models make it challenging to explore heat–mass transfer coupling mechanisms and the difficulties created in scaling up the reactor and regulating the products. Consequently, numerical simulations of coupling catalytic pyrolysis kinetics in fluidized bed reactors are essential to provide actionable insights for industrial process optimization.
This work established a three-dimensional numerical industrial-scale fluidized bed reactor for biomass catalytic pyrolysis, employing the MP-PIC method and coupling catalytic pyrolysis kinetics. First, the model was validated through comparison with experimental data to ensure model reliability. Subsequently, the effect of primary gas flow rate (PGFR) and biomass and catalyst inlet modes on transport phenomena and reaction dynamics were investigated and further optimized. It is expected that this work can offer actionable insights for designing a fluidized bed catalytic pyrolysis reactor and optimizing the biomass catalytic pyrolysis processes.
2. Mathematical Model
Employing a model built by the Eulerian–Lagrangian method, MP-PIC was used to simulate the catalytic pyrolysis process of biomass within the fluidized bed. The governing equations—including the continuity equation, momentum equation, energy equation, and species transport equations of gas and solid phases (biomass, catalyst)—are summarized below.
2.1. Governing Equations for Gas Phase
The continuity equation and the momentum equation for the gas phase are as follows [31]:
where εg is the volume fraction of the gas phase, Sg-p is the momentum exchange rate between gas and solid phase, Dp is the aerodynamic drag function, and τg is the stress tensor of the gas phase and is calculated using the large eddy simulation (LES) model [32]:
The species transport equation for the gas composition is shown as follows:
where Yi is the mass fraction of gas components i, and Dt is the turbulent mass diffusivity.
The energy transport equation is applied to solve the temperature of the gas phase, as shown below:
where E is the enthalpy, Φ is the viscous dissipation, Sinter is the energy exchange between the gas and solid phases, qdiff is the enthalpy diffusion, Q is the energy source by chemical reactions, λmol is the molecular conductivity, and λeddy is the turbulent conductivity.
2.2. Governing Equation for Solid Phase
Within the MP-PIC method, particle behavior is modeled using a transport equation for particle distribution function (PDF), which is given as follows [31]:
The fluidized bed reactor for biomass catalytic pyrolysis includes two kinds of particles: biomass and catalyst. Granular dynamics in binary-particle systems are governed by a particle acceleration formulation [33]:
where εp is the volume fraction of the solid phase, τp is the solids contact stress, which depends on spatial location, and τD is the damping time due to inelastic particle collisions.
The mass and energy transport equations for the solid phase are the following:
where Cp,i is the concentration of solid species i, and Cv is the specific heat of the solid phase.
The energy exchange rate between gas and solid phase is as follows:
2.3. Drag Model
Within a fluidized system, drag plays a crucial role to govern the momentum exchange between the fluid and solid phases. The drag model adopted in this study is the Wen-Yu–Ergun model. This hybrid model combines the Wen-Yu [34] and Ergun [35] drag models and is extensively employed for simulating the hydrodynamic behavior of Geldart B and D particles within a fluidized bed:
where εcp is the volume fraction of the close-pack solid phase, rp is the radius of the particle, and Cd is the drag coefficient which is expressed below.
2.4. Hydrodynamic and Catalytic Parameters
Within fluidized bed reactors, porosity serves as an important quantitative indicator of fluidization quality. This work calculated the porosity ε under a relatively stable state using the following expression [36]:
where Ar is the Archimedes number.
The catalytic efficiency ηcata was expressed as follows:
where Mvo,out is the mass of volatiles at the reactor outlet and Mvo0 is the total mass of volatiles releasing from the biomass.
2.5. Chemical Reaction Model
This study employed a simplified one-step multi-reaction kinetics model to describe physicochemical transformation pathways of catalytic pyrolysis, encompassing moisture releasing, devolatilization, and the volatiles catalytic pyrolysis. The biomass, namely pinewood, was represented as the mixture of char, volatiles, moisture, and ash. Its particle size distribution ranged from 0.18 to 0.84 mm in diameter. The acidic zeolite catalyst used was a commercially sourced ZSM-5, supplied by FCC S.A. (Rio de Janeiro, Brazil), and its diameter was about 0.05 mm.
2.5.1. Moisture Releasing
Upon injection into the reactor, biomass particles underwent progressive heating through thermal energy transfer from preheated carrier gas, catalyst particles, and reactor walls. Then moisture, namely the un-combined water within the particles, initiated vaporization as the particle temperature reached vaporization temperature. Consistent with conventional biomass pyrolysis modeling approaches, the moisture releasing process was modeled as a pseudo chemical process by the Arrhenius first-order equation [37]:
2.5.2. Devolatilization
After moisture releasing, the temperature of the biomass particles increased continuously and the volatiles began to be released. This investigation employed the Arrhenius first-order reaction model to represent primary devolatilization dynamics, selected for its intrinsic mathematical simplicity. The stoichiometric coefficients (α1, α2) were empirically derived from the pyrolysis experiment, coupled with proximate and ultimate analysis [38,39], as shown in Table 1; α1 and α2 were 0.88 and 0.12, respectively:

Table 1.
Proximate and ultimate analysis of biomass.
2.5.3. Volatile Catalytic Pyrolysis
The catalytic conversion of volatiles (R3–R5) is a heterogeneous reaction and is presented employing the shrinking-core model. These processes were assumed to be kinetically controlled with the gas diffusion effects deemed to be negligible relative to the intrinsic reaction kinetics. The kinetic parameters were derived through nonlinear regression analysis according to the study of Mendes et al. [38]:
The associated kinetic parameters are presented in Table 2.
Table 2.
Reaction kinetic parameters.
3. Model Setup
3.1. Overall Research Framework
The overall research framework of this work is illustrated in Figure 1. The MP-PIC approach was employed to establish a gas–solid multiphase flow model, coupled with the catalytic pyrolysis kinetics to construct a three-dimensional model of an industrial-scale fluidized reactor. Then, the model validation was conducted against the experimental data of the product distribution. Finally, optimization was conducted focusing on the primary gas flow rate (2–6 kg/s) and biomass–catalyst inlet modes (five different types of modes) and the optimization targets prioritized the maximal bio-oil yield and catalytic efficiency.
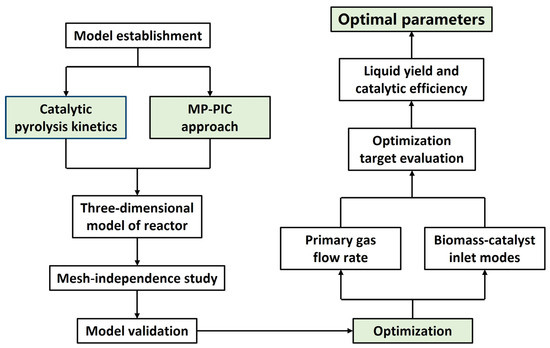
Figure 1.
Overall research framework.
3.2. Geometry
In this work, a three-dimensional model of a fluidized bed reactor was established, and the entire domain was discretized via a Cartesian grid generator employing the Cartesian cut-cell approach [40], as illustrated in Figure 2. The reactor configuration featured a height of 25.5 m with a top outlet (Width (W) × Depth (D): 2.4 m × 1.8 m).
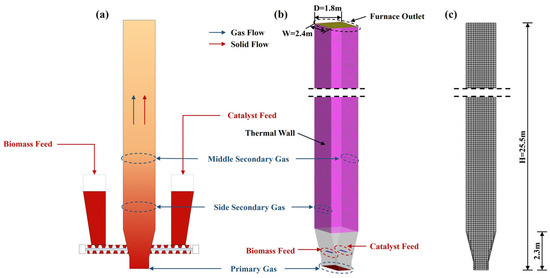
Figure 2.
Schematic diagram of a fluidized bed reactor: (a) fluidized bed reactor system; (b) geometrical structure of the reactor; (c) Cartesian grid of the reactor.
3.3. Simulation Setting and Numerical Scheme
All inlets utilized the mass flow inlet condition, while the top outlet was set to the pressure outlet condition. The biomass feedstock and catalyst were injected from both the left and right sides at a height of 1 m, respectively. Pure nitrogen constituted the initial gas phase, being uniformly injected from the bottom of the reactor, and the secondary gas was introduced from a height of 3.6 m and 6.6 m of the reactor, separately.
For the wall boundary, the gas phase utilized a no-slip wall boundary, while the particle phase employed a partial-slip wall boundary. The dilute-phase region maintained a constant thermal wall temperature of 500 °C which is a suitable temperature for catalytic pyrolysis. The catalyst was preheated to 973.15 K, serving as one of the thermal energy sources to ensure that the biomass particles reached the required pyrolysis temperature. To minimize the impact of the secondary gas, all secondary gas flow rates were set to 0.909 kg/s. All simulations were extended to 60 s to achieve pseudo-steady conditions, employing adaptive temporal resolution (1.0 × 10⁻⁵~1.0 × 10⁻³ s) governed by the Courant–Friedrichs–-Lewy (CFL) scheme to ensure the solution converged. The fundamental model setting parameters are presented in Table 3.
Table 3.
Model setting parameters.
3.4. Inlet Modes Setting
The inlet modes, including the gas and feedstock inlet modes, significantly impact the hydrodynamic performance, heat transfer, and catalytic pyrolysis reaction. This work examined the biomass and catalyst inlet designs, where the dual-inlet interactions induce complex coupling phenomena that significantly influence biomass catalytic pyrolysis reaction efficiency. Consequently, based on the established model and the optimized PGFR, the effects of the five inlet modes illustrated in Figure 3 on the hydrodynamic performance, heat transfer, and catalytic characteristics were investigated in this work. Li et al. [41] pointed out that altering the biomass inlet mode from a single nozzle to a dual-nozzle system with opposing jets accounted for an increase in the number of local circulation areas of the solid phase and a more homogeneous particle distribution. Therefore, all five tested inlet modes in this work employed dual or multiple nozzles, jetting opposite, to achieve superior particle mixing uniformity.
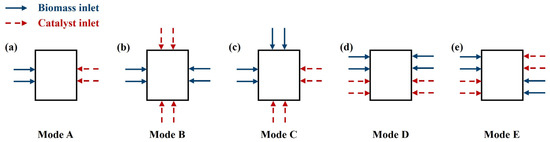
Figure 3.
Schematic diagram of biomass and catalyst inlet modes: (a) Mode A; (b) Mode B; (c) Mode C; (d) Mode D; (e) Mode E.
4. Results and Discussion
4.1. Mesh-Independence Study
To begin with, grid checker utility was used to scrutinize the uniformity of the grid along the x, y, and z coordinates. This was a critical step to ensure that the disparity between the tiniest and biggest cells, which was standardized by dividing by the smallest values in each coordinate, was not excessive. The difference was limited to under five, which struck a balance between preserving numerical integrity and optimizing computational speed. Subsequently, a mesh independence analysis was performed to confirm the suitability of the grid spacing for achieving precise model outcomes. This research involved three cases to assess the influence of the mesh refinement on the simulation outcomes. Comparative analyses of the simulation results across grids with 44,200, 78,400, and 96,784 cells were conducted. Figure 4a reveals that the grid spaces in all three coordinate directions remain below 1.5 when normalized against their minimum values. This confirms that the computational cells maintain sufficient uniformity while meeting the required precision standards across all grid configurations.
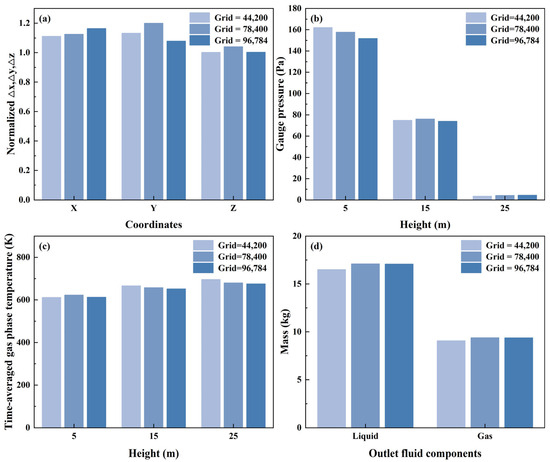
Figure 4.
Comparison of simulation results with three different mesh numbers: (a) grid uniformity; (b) reactor gauge pressure; (c) time–averaged gas phase temperature; (d) reactor outlet fluid components.
Figure 4b,c show that predictions of reactor gauge pressure and time–averaged gas phase temperature are relatively similar across the three cases, with no significant variation observed. As presented in Figure 4d, the predicted reactor outlet fluid components for the latter two cases are nearly identical. However, the first case exhibits more significant discrepancies in the predicted reactor outlet fluid components compared to the other two cases, suggesting that insufficient mesh resolution could compromise the result accuracy. After balancing predictive reliability and computational performance, a configuration comprising 78,400 cells was selected for the subsequent studies.
4.2. Model Verification
The validity of the model was confirmed by comparing its results with the fluidized bed biomass catalytic pyrolysis experiments conducted by Mendes et al. [38]. A reactor model was established based on the description of Mendes et al., coupling the developed catalytic pyrolysis kinetics above. Simulations were conducted at different temperatures, and the reliability of the model was validated by comparing the simulated product yields with the experimental measurements.
As presented in Figure 5, predicted yields of the catalytic pyrolysis are contrasted with the experimental data. The analysis shows a strong alignment between the forecasted and actual data at different temperatures, with discrepancies confined to a permissible margin of 10%.
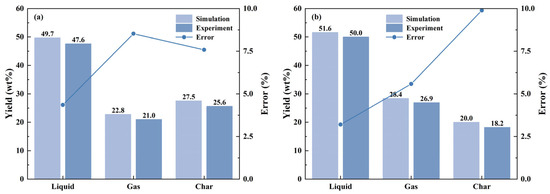
Figure 5.
Comparison of the experiment and simulation data for the yield of catalytic pyrolysis products at different temperatures: (a) 450 °C; (b) 500 °C.
4.3. Influence of the Primary Gas Flow Rate
Hydrodynamic behavior within a fluidized bed reactor is highly sensitive to the operational and design parameters. As a key operational parameter, the primary gas flow rate (PGFR) impacts product distribution and yield by controlling the residence time of the gas phase [43].
As presented in Table 4, the porosity increased with rising PGFR and was consistently above 0.9, indicating improved fluidization performance at higher PGFR. All porosity values exhibited the characteristics of a fast fluidized bed. As shown in Figure 6a,b, key axial positions within the bed height are indicated by gray dashed lines, corresponding to the biomass feedstock and catalyst inlet, side secondary gas inlet, and middle secondary gas inlet. Figure 6a reveals that the solid phase volume fraction peaks near the biomass and catalyst inlet and then declines with increasing bed height. Additionally, the dense zone exhibits a greater solid volume fraction compared to the dilute zone, consistent with standard fluidized bed reactor distributions [44]. As the PGFR escalates from 2 kg/s to 6 kg/s, the solid phase volume fraction in the dense zone diminishes from 0.00867 to 0.00253. This decrease suggests reduced particle residence time may enhance reactor efficiency, to some extent. However, excessively high PGFR may cause particles to be entrained before complete conversion, while excessively low PGFR may result in poor fluidization of particles, thus hindering the process of heat and mass transfer.
Table 4.
Porosity at different PGFRs.
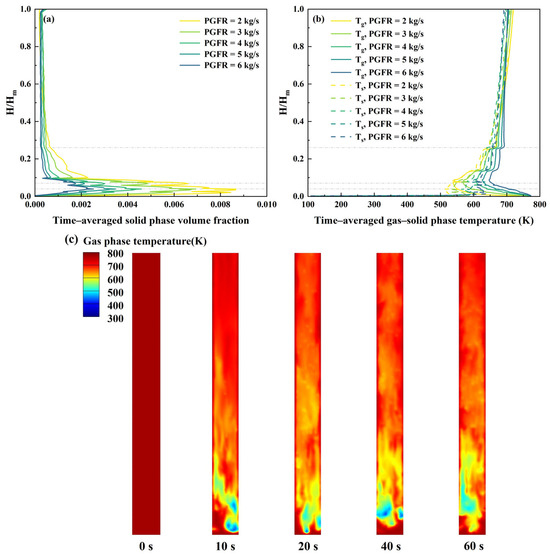
Figure 6.
Hydrodynamic and heat transfer performance at different PGFR using Mode A: (a) time–averaged solid phase volume fraction; (b) time–averaged gas and solid phase temperature; (c) gas phase temperature at different time in central vertical plane of the reactor (PGFR = 4 kg/s).
Figure 6b,c depict the temperature distribution of the gas–solid phase. In the dense zone, the gas phase temperature decreases while the solid phase temperature increases with the height of the bed. The gas phase temperature reaches a minimum of about 538 °C near the biomass feedstock and catalyst inlet. In the dilute zone, both the gas and solid phase temperature increase gradually and a temperature gradient is observed at the middle secondary gas inlet. Furthermore, both gas and solid phase temperature tend to rise when the PGFR decreases, ultimately reaching approximately 700 °C. To minimize excessive energy consumption during the subsequent condensation process, the PGFR should not be set too low.
Generally speaking, a lower PGFR enhances the homogeneity of the biomass–catalyst mixing while prolonging the residence time of the gas phase within the reactor. This extended contact facilitates secondary cracking reactions, converting the condensable vapors into lighter gaseous products. Consequently, the product distribution shifts, with liquid production declining and gas production rising. Conversely, increasing the PGFR shortens the residence time of the gas phase, which limits the secondary cracking and ultimately leads to higher liquid yields [45]. As demonstrated in Figure 7a, the catalytic efficiency initially increases and subsequently declines with an increase in PGFR, reaching a peak of 71.3% at a PGFR of 4 kg/s. Notably, the liquid yield also reaches its maximum at this PGFR. This phenomenon likely occurs because an excessively high PGFR may expel volatiles from the reactor before they can adequately interact with the catalyst particles, thereby diminishing the catalytic efficiency. Combining the time–averaged mass fraction of products shown in Figure 7b,c, the time–averaged mass fraction increases as the PGFR decreases, which suggests that an excessively long residence time of products within the reactor may cause over-cracking of the liquid products [46], whereas an overly short residence time may lead to incomplete reactions. Both scenarios result in reduced catalytic efficiency and liquid yield. Hence, the optimal PGFR is 4 kg/s, ensuring an adequate heat-mass transfer between the volatiles and catalyst, while also preventing excessive cracking of products.
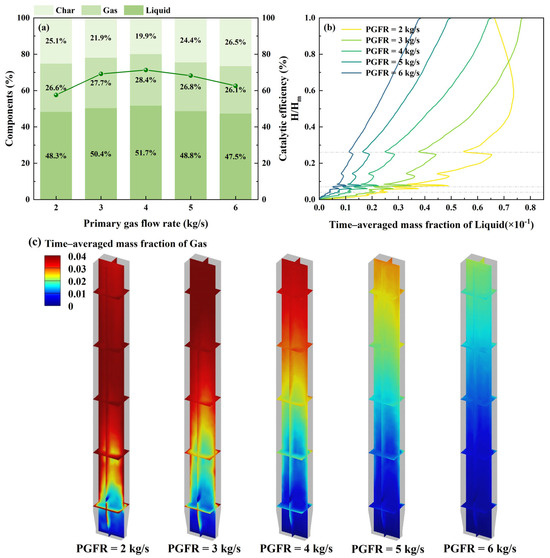
Figure 7.
Catalytic pyrolysis characteristics at different PGFR: (a) product components; (b) time–averaged mass fraction of liquid; (c) time–averaged mass fraction distribution of gas.
4.4. Influence of the Biomass and Catalyst Inlet Mode
As presented in Figure 8a, the volume fraction of the solid phase generally increases and then decreases with the increasing bed height, reaching a maximum of approximately 0.006 near the biomass feedstock and catalyst inlet. However, the inlet modes have a limited effect on the overall distribution of the solid phase volume fraction. This phenomenon may be attributed to the constant PGFR of 4 kg/s, which the solid phase volume fraction highly depends on [47]. Figure 8c presents the time–averaged vertical velocity distribution of the gas phase. It reveals that the gas phase velocity peaks near the biomass inlet due to the rapid pyrolysis process. This localized acceleration occurs because the breakdown of biomass generates additional gas products, creating a surge in flow speed within this specific region [41]. The gas phase velocity demonstrates a tendency to fall in the dense zone near the wall, and some areas of a pronounced velocity gradient are observed within the dense zone. This flow characteristic likely originates from the progressive accumulation of biomass and catalyst particles at the inlet, creating localized flow resistance. Notably, Mode B, which employs a symmetrical distribution of biomass and catalyst inlets on all four sides, exhibits a relatively symmetrical gas phase velocity distribution. This symmetry leads to a more uniform gas phase velocity distribution, which enhances the mixing of particles, and consequently improves the heat and mass transfer efficiency.
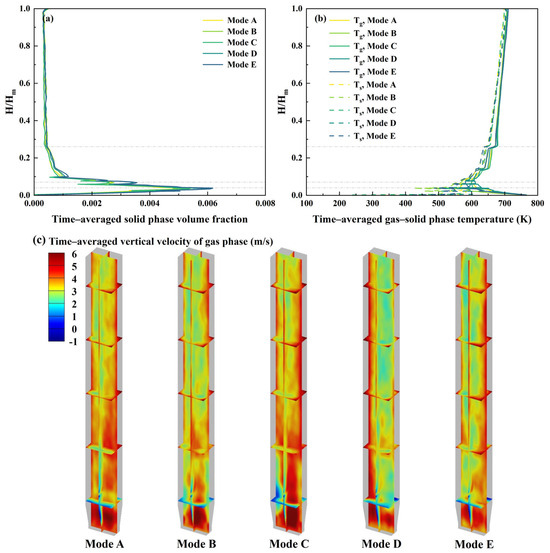
Figure 8.
Hydrodynamic and heat transfer performance at different biomass and catalyst inlet modes: (a) time–averaged solid phase volume fraction; (b) time–averaged gas and solid phase temperature; (c) time–averaged vertical velocity of gas phase.
Figure 8b presents the time–averaged gas and solid phase temperature. The gas and solid phase temperature initially decrease before rising steadily with the bed height, and the solid phase exhibits greater temperature variation. Near the biomass feedstock inlet, a distinct low-temperature region emerges in the gas phase, typically ranging between 550 °C and 650 °C. This temperature dip occurs because the incoming gas undergoes convective cooling upon contact with the biomass, causing a noticeable drop in temperature. Near the secondary gas inlet, there is also a temperature reduction of approximately 100 °C in the gas phase, but this reduction is less pronounced than that near the biomass feedstock inlet. This is because the temperature of the biomass particles rises to some extent due to the heat exchange with both carrier gas and high-temperature catalyst particles as they move upward [42]. On the whole, the temperatures of both gas and solid phases are lower in the dense zone. This cooling effect occurs primarily because this region handles the energy-intensive processes like moisture release and devolatilization, which absorb substantial amounts of heat. As the volatiles from the biomass pyrolysis move upward with the carrier gas, they elevate the temperature of both gas and solid phases, resulting in a gradual heating effect throughout the middle and upper sections of the reactor. In contrast, the opposite biomass and catalyst inlet configuration, such as Mode B, reduces the solid phase temperature gradient to within 50 °C in the dense zone. This might be because under this inlet configuration, the biomass and catalyst particles are mixed more evenly, resulting in a more effective heat conduction and consequently a more uniform overall temperature distribution.
The inlet modes of the biomass and catalyst significantly influence the uniformity of particle mixing in the dense zone, thereby affecting the heat and mass transfer efficiency [48]. As shown in Figure 9a, catalytic efficiency and product yield vary across the different inlet modes. The relatively low catalytic efficiency and liquid yield observed in Mode D may occur because the biomass feedstock and catalyst inlets have relatively concentrated conditions with no opposite jetting. This configuration results in poor mixing uniformity between the biomass and catalyst, reducing the thermal and mass transfer efficiency. Conversely, Mode A and Mode E employ an inlet configuration featuring opposite jetting, which enhances the mixing uniformity of particles and improves the heat-mass transfer efficiency. Therefore, the catalytic efficiency achieved by these two modes is relatively higher. Notably, Mode B and Mode C have a more dispersed inlet configuration that also incorporates opposing jets. This approach further enhances the mixing uniformity of particles within the dense zone, increasing the heat–mass transfer efficiency and catalytic efficiency. In particular, Mode B achieves the highest catalytic efficiency of 75.6%.
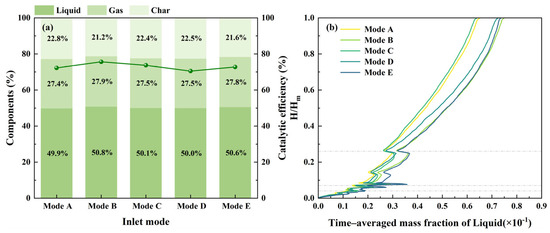
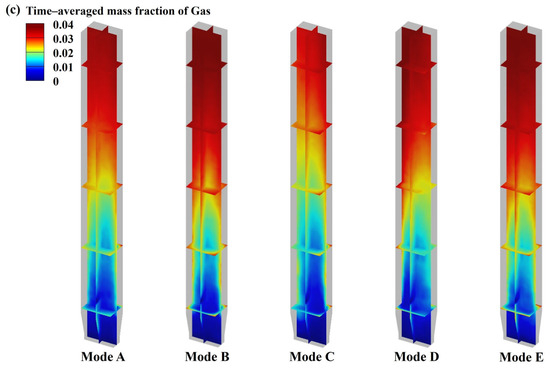
Figure 9.
Catalytic pyrolysis characteristics at different biomass and catalyst inlet modes: (a) products components; (b) time–averaged mass fraction of liquid; (c) time–averaged mass fraction distribution of gas.
Figure 9b,c, which illustrate the time–averaged mass fraction of products, show that the biomass and catalyst inlet modes have no significant impact on the overall distribution tendency of the products. The time–averaged mass fraction of products typically increases with increasing bed height, mainly because the volatiles generated from the biomass pyrolysis in the dense zone ascend with the carrier gas and primarily contact the catalyst particles located above the dense zone for the catalytic reactions.
5. Conclusions
In this study, a three-dimensional industrial-scale fluidized bed reactor for biomass catalytic pyrolysis was modeled, employing the multiphase particle-in-cell (MP-PIC) method and coupling catalytic pyrolysis kinetics. Then, the primary gas flow rate (PGFR) and the biomass and catalyst inlet configurations were further optimized. It is expected that this work could offer practical theoretical support for fluidized bed reactor design and biomass catalytic pyrolysis process optimization. The key conclusions are drawn as follows:
- (1)
- An excessively low PGFR may result in poor fluidization of particles, degrading the heat–mass transfer, and causing over-cracking of condensable vapor due to extended residence time. Excessively high PGFR may also cause particles and pyrolysis vapor to be blown out before complete conversion, reducing the heat–mass transfer efficiency. Optimization revealed that 4 kg/s was the optimal PGFR, delivering 71.3% catalytic efficiency.
- (2)
- The biomass and catalyst inlet modes primarily govern the catalytic efficiency and the product yield by influencing hydrodynamic behavior and heat transfer performance in the dense zone of the reactor. In summary, adopting a relatively dispersed inlet mode with opposite jetting for biomass and catalyst, namely Mode B, enhanced the mixing uniformity and intensified the heat–mass transfer efficiency, further increasing the catalytic efficiency to 75.6%.
In this work, a simplified global kinetic model for biomass catalytic pyrolysis was used due to the complexity of the catalytic pyrolysis reaction mechanism in this work. In future work, the catalytic pyrolysis kinetic model will be further expanded to better predict and optimize the hydrodynamic and heat-mass transfer performance in fluidized bed reactors for biomass catalytic pyrolysis.
Author Contributions
Conceptualization, R.L. and H.Z.; methodology, R.L. and H.Z.; software, R.L. and S.W.; validation, R.L.; formal analysis, R.L. and X.F.; writing—original draft preparation, R.L.; writing—review and editing, Y.T., S.W. and H.Z.; visualization, R.L. All authors have read and agreed to the published version of the manuscript.
Funding
This research was funded by National Key Research and Development Program of China, grant number 2024YFB4206205.
Data Availability Statement
The original contributions presented in the study are included in the article; further inquiries can be directed to the corresponding author.
Conflicts of Interest
The authors declare no conflicts of interest.
References
- Hao, J.; Xu, F.; Yang, D.; Wang, B.; Qiao, Y.; Tian, Y. Analytical Pyrolysis of Biomass Using Pyrolysis-Gas Chromatography/Mass Spectrometry. Renew. Sustain. Energy Rev. 2025, 208, 115090. [Google Scholar] [CrossRef]
- Yang, Q.; Zhou, H.; Bartocci, P.; Fantozzi, F.; Mašek, O.; Agblevor, F.A.; Wei, Z.; Yang, H.; Chen, H.; Lu, X.; et al. Prospective Contributions of Biomass Pyrolysis to China’s 2050 Carbon Reduction and Renewable Energy Goals. Nat. Commun. 2021, 12, 1698. [Google Scholar] [CrossRef] [PubMed]
- Kan, T.; Strezov, V.; Evans, T.J. Lignocellulosic Biomass Pyrolysis: A Review of Product Properties and Effects of Pyrolysis Parameters. Renew. Sustain. Energy Rev. 2016, 57, 1126–1140. [Google Scholar] [CrossRef]
- Pyshye, S.; Lypko, Y.; Demchuk, Y.; Kukhar, O.; Korchak, B.; Pochapska, I.; Zhytnetskyi, I. Characteristics and Applications of Waste Tire Pyrolysis Products: A Review. Chem. Chem. Technol. 2024, 18, 244–257. [Google Scholar] [CrossRef]
- Dhyani, V.; Bhaskar, T. A Comprehensive Review on the Pyrolysis of Lignocellulosic Biomass. Renew. Energy 2018, 129, 695–716. [Google Scholar] [CrossRef]
- Vuppaladadiyam, A.K.; Vuppaladadiyam, S.S.V.; Awasthi, A.; Sahoo, A.; Rehman, S.; Pant, K.K.; Murugavelh, S.; Huang, Q.; Anthony, E.; Fennel, P.; et al. Biomass Pyrolysis: A Review on Recent Advancements and Green Hydrogen Production. Bioresour. Technol. 2022, 364, 128087. [Google Scholar] [CrossRef]
- Ragauskas, A.J.; Beckham, G.T.; Biddy, M.J.; Chandra, R.; Chen, F.; Davis, M.F.; Davison, B.H.; Dixon, R.A.; Gilna, P.; Keller, M.; et al. Lignin Valorization: Improving Lignin Processing in the Biorefinery. Science 2014, 344, 1246843. [Google Scholar] [CrossRef]
- Zhang, S.; Jiang, S.; Huang, B.; Shen, X.; Chen, W.; Zhou, T.; Cheng, H.; Cheng, B.; Wu, C.; Li, W.; et al. Sustainable Production of Value-Added Carbon Nanomaterials from Biomass Pyrolysis. Nat. Sustain. 2020, 3, 753–760. [Google Scholar] [CrossRef]
- Gao, Y.; Gao, W.; Zhu, H.; Chen, H.; Yan, S.; Zhao, M.; Sun, H.; Zhang, J.; Zhang, S. A Review on N-Doped Biochar for Oxidative Degradation of Organic Contaminants in Wastewater by Persulfate Activation. Int. J. Environ. Res. Public Health 2022, 19, 14805. [Google Scholar] [CrossRef]
- Xie, N.; Wang, H.; You, C. Role of Oxygen Functional Groups in Pb2+ Adsorption from Aqueous Solution on Carbonaceous Surface: A Density Functional Theory Study. J. Hazard. Mater. 2021, 405, 124221. [Google Scholar] [CrossRef]
- Leng, L.; Huang, H. An Overview of the Effect of Pyrolysis Process Parameters on Biochar Stability. Bioresour. Technol. 2018, 270, 627–642. [Google Scholar] [CrossRef] [PubMed]
- Chaturvedi, S.; Singh, S.V.; Dhyani, V.C.; Govindaraju, K.; Vinu, R.; Mandal, S. Characterization, Bioenergy Value, and Thermal Stability of Biochars Derived from Diverse Agriculture and Forestry Lignocellulosic Wastes. Biomass Convers. Biorefinery 2023, 13, 879–892. [Google Scholar] [CrossRef]
- Liu, J.; Hou, Q.; Ju, M.; Ji, P.; Sun, Q.; Li, W. Biomass Pyrolysis Technology by Catalytic Fast Pyrolysis, Catalytic Co-Pyrolysis and Microwave-Assisted Pyrolysis: A Review. Catalysts 2020, 10, 742. [Google Scholar] [CrossRef]
- Yang, H.; Chen, Z.; Chen, W.; Chen, Y.; Wang, X.; Chen, H. Role of Porous Structure and Active O-Containing Groups of Activated Biochar Catalyst during Biomass Catalytic Pyrolysis. Energy 2020, 210, 118646. [Google Scholar] [CrossRef]
- Cai, W.; Luo, Z.; Zhou, J.; Wang, Q. A Review on the Selection of Raw Materials and Reactors for Biomass Fast Pyrolysis in China. Fuel Process. Technol. 2021, 221, 106919. [Google Scholar] [CrossRef]
- Yang, S.; Wan, Z.; Wang, S.; Wang, H. Reactive MP-PIC Investigation of Heat and Mass Transfer Behaviors during the Biomass Pyrolysis in a Fluidized Bed Reactor. J. Environ. Chem. Eng. 2021, 9, 105047. [Google Scholar] [CrossRef]
- Lu, Y.; Zhou, Y.; Yang, L.; Hu, X.; Luo, X.; Chen, H. Verification of Optimal Models for 2D-Full Loop Simulation of Circulating Fluidized Bed. Adv. Powder Technol. 2018, 29, 2765–2774. [Google Scholar] [CrossRef]
- Zhu, H.P.; Zhou, Z.Y.; Yang, R.Y.; Yu, A.B. Discrete Particle Simulation of Particulate Systems: A Review of Major Applications and Findings. Chem. Eng. Sci. 2008, 63, 5728–5770. [Google Scholar] [CrossRef]
- Wang, S.; Luo, K.; Hu, C.; Lin, J.; Fan, J. CFD-DEM Simulation of Heat Transfer in Fluidized Beds: Model Verification, Validation, and Application. Chem. Eng. Sci. 2019, 197, 280–295. [Google Scholar] [CrossRef]
- Zhou, Z.Y.; Yu, A.B.; Zulli, P. Particle Scale Study of Heat Transfer in Packed and Bubbling Fluidized Beds. AIChE J. 2009, 55, 868–884. [Google Scholar] [CrossRef]
- Zhuo, Y.; Shen, Y. Three-Dimensional Transient Modelling of Coal and Coke Co-Combustion in the Dynamic Raceway of Ironmaking Blast Furnaces. Appl. Energy 2020, 261, 114456. [Google Scholar] [CrossRef]
- Kang, P.; Hu, X.E.; Lu, Y.; Wang, K.; Zhang, R.; Han, L.; Yuan, H.; Chen, H.; Luo, X.; Zhou, Y.J. Modeling and Optimization for Gas Distribution Patterns on Biomass Gasification Performance of a Bubbling Spout Fluidized Bed. Energy Fuels 2020, 34, 1750–1763. [Google Scholar] [CrossRef]
- Liu, Y.; Shen, Y. Modelling and Optimisation of Biomass Injection in Ironmaking Blast Furnaces. Prog. Energy Combust. Sci. 2021, 87, 100952. [Google Scholar] [CrossRef]
- Zhong, W.; Yu, A.; Zhou, G.; Xie, J.; Zhang, H. CFD Simulation of Dense Particulate Reaction System: Approaches, Recent Advances and Applications. Chem. Eng. Sci. 2016, 140, 16–43. [Google Scholar] [CrossRef]
- Hu, C.; Luo, K.; Wang, S.; Sun, L.; Fan, J. Influences of Operating Parameters on the Fluidized Bed Coal Gasification Process: A Coarse-Grained CFD-DEM Study. Chem. Eng. Sci. 2019, 195, 693–706. [Google Scholar] [CrossRef]
- Thapa, R.K.; Frohner, A.; Tondl, G.; Pfeifer, C.; Halvorsen, B.M. Circulating Fluidized Bed Combustion Reactor: Computational Particle Fluid Dynamic Model Validation and Gas Feed Position Optimization. Comput. Chem. Eng. 2016, 92, 180–188. [Google Scholar] [CrossRef]
- Gao, W.; Chen, H.; Liao, Y.; Wu, Y.; Zhu, H.; Zhang, H.; Weng, J.; Guo, X.; Hu, X.; Lin, X.; et al. Experimental and Numerical Investigation on Effect of Fluidization Degree and Temperature on Bed Agglomeration during Bioslurry Fast Pyrolysis in a Fluidized Bed. Fuel Process. Technol. 2025, 273, 108229. [Google Scholar] [CrossRef]
- Duan, J.; Fang, L.; Gao, S.; Zhang, Z.; Wang, W. Numerical Simulation and Structural Optimization of Multi-Compartment Fluidized Bed Reactor for Biomass Fast Pyrolysis. Chem. Eng. Process.-Process Intensif. 2019, 140, 114–126. [Google Scholar] [CrossRef]
- Ranzi, E.; Cuoci, A.; Faravelli, T.; Frassoldati, A.; Migliavacca, G.; Pierucci, S.; Sommariva, S. Chemical Kinetics of Biomass Pyrolysis. Energy Fuels 2008, 22, 4292–4300. [Google Scholar] [CrossRef]
- Cardoso, J.; Silva, V.; Eusébio, D.; Brito, P.; Hall, M.J.; Tarelho, L. Comparative Scaling Analysis of Two Different Sized Pilot-Scale Fluidized Bed Reactors Operating with Biomass Substrates. Energy 2018, 151, 520–535. [Google Scholar] [CrossRef]
- Snider, D.M.; Clark, S.M.; O’Rourke, P.J. Eulerian–Lagrangian Method for Three-Dimensional Thermal Reacting Flow with Application to Coal Gasifiers. Chem. Eng. Sci. 2011, 66, 1285–1295. [Google Scholar] [CrossRef]
- Smagorinsky, J. General Circulation Experiments with the Primitive Equations. Mon. Weather Rev. 1963, 91, 99–164. [Google Scholar] [CrossRef]
- Liu, H.; Cattolica, R.J.; Seiser, R. CFD Studies on Biomass Gasification in a Pilot-Scale Dual Fluidized-Bed System. Int. J. Hydrogen Energy 2016, 41, 11974–11989. [Google Scholar] [CrossRef]
- Wen, C.Y.; Yu, Y.H. A Generalized Method for Predicting the Minimum Fluidization Velocity. AIChE J. 1966, 12, 610–612. [Google Scholar] [CrossRef]
- Sabri, E. Fluid Flow through Packed Columns. Chem. Eng. Prog. 1952, 48, 89–94. [Google Scholar]
- Pyshyev, S.; Prysiazhnyi, Y.; Shved, M.; Kułażyński, M.; Miroshnichenko, D. Effect of Hydrodynamic Parameters on the Oxidative Desulphurisation of Low Rank Coal. Int. J. Coal Sci. Technol. 2018, 5, 213–229. [Google Scholar] [CrossRef]
- Chan, W.-C.R.; Kelbon, M.; Krieger, B.B. Modelling and Experimental Verification of Physical and Chemical Processes during Pyrolysis of a Large Biomass Particle. Fuel 1985, 64, 1505–1513. [Google Scholar] [CrossRef]
- Mendes, F.L.; Ximenes, V.L.; de Almeida, M.B.B.; Azevedo, D.A.; Tessarolo, N.S.; de Rezende Pinho, A. Catalytic Pyrolysis of Sugarcane Bagasse and Pinewood in a Pilot Scale Unit. J. Anal. Appl. Pyrolysis 2016, 122, 395–404. [Google Scholar] [CrossRef]
- Wang, L.; Yang, Y.; Zhong, Q.; Li, Q.; Jiang, T. Gasification of Pine Sawdust via Synergetic Conversion Using Iron Ore as a Catalyst. Bioresour. Technol. 2022, 355, 127240. [Google Scholar] [CrossRef]
- Tucker, P.G.; Pan, Z. A Cartesian Cut Cell Method for Incompressible Viscous Flow. Appl. Math. Model. 2000, 24, 591–606. [Google Scholar] [CrossRef]
- Cai, L.; Wang, Q.; Xiong, Q.; Wang, X.; Fu, L.; Han, L.; Wang, Z.; Zhou, Y. Numerical Simulation and Multi-Process Coupling Analysis for Biomass Pyrolysis Fluidized Bed Reactor Based on Synergistic Effects between Biomass and Nitrogen Inlet Modes. J. Anal. Appl. Pyrolysis 2023, 169, 105801. [Google Scholar] [CrossRef]
- Kang, P.; Zhang, G.; Ge, Z.; Zha, Z.; Zhang, H. Three-Dimensional Modelling and Optimization of an Industrial Dual Fluidized Bed Biomass Gasification Decoupling Combustion Reactor. Appl. Energy 2022, 311, 118619. [Google Scholar] [CrossRef]
- Ly, H.V.; Lim, D.-H.; Sim, J.W.; Kim, S.-S.; Kim, J. Catalytic Pyrolysis of Tulip Tree (Liriodendron) in Bubbling Fluidized-Bed Reactor for Upgrading Bio-Oil Using Dolomite Catalyst. Energy 2018, 162, 564–575. [Google Scholar] [CrossRef]
- Zhao, G.; Shi, X.; Wu, Y.; Wang, M.; Zhang, M.; Gao, J.; Lan, X. 3D CFD Simulation of Gas-Solids Hydrodynamics and Bubbles Behaviors in Empty and Packed Bubbling Fluidized Beds. Powder Technol. 2019, 351, 1–15. [Google Scholar] [CrossRef]
- Ly, H.V.; Kim, S.-S.; Woo, H.C.; Choi, J.H.; Suh, D.J.; Kim, J. Fast Pyrolysis of Macroalga Saccharina Japonica in a Bubbling Fluidized-Bed Reactor for Bio-Oil Production. Energy 2015, 93, 1436–1446. [Google Scholar] [CrossRef]
- Ly, H.V.; Tran, Q.K.; Kim, S.-S.; Kim, J.; Choi, S.S.; Oh, C. Catalytic Upgrade for Pyrolysis of Food Waste in a Bubbling Fluidized-Bed Reactor. Environ. Pollut. 2021, 275, 116023. [Google Scholar] [CrossRef]
- Heo, H.S.; Park, H.J.; Park, Y.-K.; Ryu, C.; Suh, D.J.; Suh, Y.-W.; Yim, J.-H.; Kim, S.-S. Bio-Oil Production from Fast Pyrolysis of Waste Furniture Sawdust in a Fluidized Bed. Bioresour. Technol. 2010, 101, S91–S96. [Google Scholar] [CrossRef]
- Wu, F.; Zhang, X.; Zhou, W.; Ma, X. Numerical Simulation and Optimization of Hydrodynamics in a Novel Integral Multi-Jet Spout-Fluidized Bed. Powder Technol. 2018, 336, 112–121. [Google Scholar] [CrossRef]
Disclaimer/Publisher’s Note: The statements, opinions and data contained in all publications are solely those of the individual author(s) and contributor(s) and not of MDPI and/or the editor(s). MDPI and/or the editor(s) disclaim responsibility for any injury to people or property resulting from any ideas, methods, instructions or products referred to in the content. |
© 2025 by the authors. Licensee MDPI, Basel, Switzerland. This article is an open access article distributed under the terms and conditions of the Creative Commons Attribution (CC BY) license (https://creativecommons.org/licenses/by/4.0/).