Abstract
Thermoacoustic devices, such as refrigerators and heat pumps, present unique measurement challenges due to the simultaneous presence of rapidly fluctuating acoustic parameters and more stable thermal variables. Accurate and informative measurements during operation are crucial for developing effective control algorithms and optimizing performance under specific conditions. However, issues like inappropriate sampling frequencies and excessive data storage can lead to unintended averaging, compromising measurement quality. This study introduces a comprehensive experimental procedure aimed at enhancing the reliability of measurements in thermoacoustic systems. The approach encompasses meticulous experimental design, identification of measurement uncertainties and influencing factors during standard operation, and a statistical uncertainty analysis. Experimental findings reveal a significant reduction in temperature measurement uncertainty with increased thermoacoustic channel length and highlight the substantial impact of device structural features on performance. These insights are instrumental for refining measurement protocols and advancing the development of efficient thermoacoustic technologies.
1. Introduction
Researchers are constantly seeking novel structures of energy systems. Power-to-X technology is the most promising technology, and it can influence integrated energy systems significantly [1,2]. This vast family of energy solutions comprises technologies that generate alternative fuels using renewable electricity. The concept gained wide attention, which is understandable. The potential gains from the broad utilization of these solutions are extraordinary. However, the introduction into the market of this concept requires developing novel ideas for many processes and techniques, which the power-to-X technology utilizes as a unit process. One of them is cooling, which is of great importance, especially in systems with compression of carbon dioxide [3] or methanol reactors, which are also driven by an exothermic reaction [4]. The thermoacoustic phenomenon brings great novelty and effectiveness to cooling systems, and such an idea has already been analyzed in some energy applications [5,6,7]. In this paper, the concept of a thermoacoustic cooler for energy applications is experimentally developed. The article presents insights into the experimental campaign that has been performed.
The thermoacoustic phenomenon was first considered as a spontaneous emission of sound by a volume of an arbitrary gas (air originally), fulfilling a cylindrical or box-shaped channel due to heat or cold production [8]. The physical phenomenon described in this way (e.g., by Rayleigh in 1877 [9]) has remained a matter of investigation for dozens of years [9,10], and devices where vibration is induced in volumes of gas and used as a source of acoustic power (so-called thermoacoustic engines) are under intensive research [11,12].
The discussed phenomenon is often described in detail by analyzing the thermodynamic processes occurring when a gas with an infinitely small volume is subjected to certain acoustic and thermal boundary conditions appearing during the thermoacoustic phenomenon. When the gas is subjected to the impact of an acoustic wave, while a porous body made of a material with a high specific heat capacity is immersed in the gas volume and the acoustic wave is able to pass through the body, the following subsequent stages of the thermodynamic cycle can be distinguished [13,14,15,16]:
- The gas portion is shifted towards the antinode of the acoustic pressure due to the impact of the wave; it is compressed and warmed up;
- The convective heat transfer occurs between the warm gas and the porous body, which results in local heating of the porous structure;
- The gas portion is shifted towards the node of the acoustic pressure due to the impact of the wave; it expands and cools down;
- The convective heat transfer occurs between the porous body and the cold gas, which results in local cooling of the porous structure.
The simplest thermoacoustic device, generating a flux of heat or cold from a soundwave-induced thermodynamic cycle, consists of a volume of a working medium (working gas) which is limited by a stiff container (an acoustic channel), a porous body (a regenerative heat exchanger or regenerator), and a source of an acoustic wave forcing the phenomenon (an oscillating piston or a vibrating membrane of a loudspeaker), mounted at one of the ends of the acoustic channel. When considering more complex devices which are able to extract the generated thermal power, two exchangers, whether comprising the geometry and material of the regenerator or not, are located adjacent to the external sides of the regenerator.
In a system consisting of the above-mentioned elements, the emission of an acoustic wave with a frequency equal to the resonant frequency of the acoustic channel will produce a stable temperature gradient along the exchanger. Such a device takes the role of a thermoacoustic heat pump [17]. The relative position of the heating and cooling areas (i.e., the position of the cold and hot exchangers in relation to the regenerative exchanger if all three units are present) depends on the length of the sound wave and the location of the regenerator in the acoustic channel [8,17].
1.1. Review of Experimental Data
Despite substantial progress in the development of numerical methods and a significant share of computational research in the currently conducted analyses in the field of thermoacoustics [12,18,19], the literature still offers very few experimental studies on the discussed phenomenon [20,21].
Tests are also being conducted to verify new concepts of thermoacoustic devices [22,23,24]. The literature describes a complex experiment intended to identify the operating parameters of a hybrid thermoacoustic cooler system, achieving a cooling power of just over 500 W with an exergy efficiency of 58% [22]. The paper [23] describes the testing of a system of inter-connected thermoacoustic devices of the engine-cooler type with adjustable geometric parameters. The results indicate that it is possible to significantly adjust the momentary thermal parameters of the system by modifying the system geometry. There is also a discussion of an experiment performed to verify the parameters of a prototype thermoacoustic heat pump, which makes it possible to achieve a COP value of 3 at a temperature of the lower heat source of 0 °C [24]. The recent research described in [25] is focused on the investigation of the operating parameters of a square-duct thermoacoustic unit operating as a high-amplitude wave-sourced heat pump, working with a polypropylene regenerator made of a set of thin-walled pipes. The researchers obtained a maximum stable temperature difference along the regenerator exceeding 14 °C [25].
In [26], there is a description of a compact thermoacoustic cooling device using a mixture of helium and argon (in the volumetric ratio of 70% helium/30% argon) at a pressure of 40 bar as the acoustic wave propagation medium. A characteristic feature of the geometry of the presented solution is the division of the acoustic channel into two parts with different volumes (8 dm3 and 4 dm3, respectively) achieved by an appropriate location of the acoustic inductor. This design enables the separation of the core of the thermoacoustic device, containing a set of heat exchangers, from the space of the working gas, not participating in the excitation of the thermoacoustic effect, which is necessary to equalize the pressure on both sides of the vibrating inductor. The respective exchangers implemented in the core of the device are made using different techniques: the hot and the cold exchanger are made of a copper alloy as a finned shell-and-tube exchanger and a finned exchanger, respectively, whereas the regenerative exchanger is made of a combined set of 214 steel mesh discs with the wire diameter of 4.3 × 10⁻² mm. In the tested device, where the inductor movement amplitude was set at a level of 8.5 mm, the obtained values of the COP coefficient totaled 1.89 and 1.32 when the temperature of the cold heat exchanger was 13.3° and 3.6 °C, respectively.
Important as it is, widespread experimental activity in the field of thermoacoustic devices is not easy because the necessary measurements face a great number of difficulties, including the following:
- The need to ensure the highest possible accuracy of temperature and dynamic pressure measurements [27], which involves the need to use highly sensitive measuring instruments [28];
- The need to maintain a high sampling frequency of the acoustic pressure measurements to collect a significant amount of data in a short period of time [29];
- The need to prevent potential distortion of the system acoustic parameters due to the influence of the device components in contact with the working gas—for example, by modifying the exciting wave frequency followed by a significant reduction in the amplitude or echo induction [29,30];
- The need to identify the inertia of the applied instruments [28] and to synchronize the measurements in the case of using sets of measuring sensors.
The quality of the obtained acoustic data may be significantly compromised by issues such as mismatched sampling frequency, delayed transmission between measuring channels, or lack of instrument calibration [28,31,32].
Therefore, improving the quality of performed measurements seems to be a vital issue. The research quality can be improved using the knowledge of statistics and experimental design. In the case of initial measurements, when a number of strict configurations are investigated to identify ranges of possible optimal solutions, its application might be especially beneficial, since experimental design is fundamental in the selection of an appropriate experiment [26]. Nonetheless, it requires profound consideration of the variables to be investigated, the parameters which are going to change in respective cases and possible states, and the characteristic factors considered during a given test, since proper allocation of attribute levels to respective selections is essential [33].
The use of experimental design may be beneficial in the field of agricultural research, especially when the experiment concerns fertilizers and pesticides, but also in plant crossing or in the research concerning the implementation of new technologies [34]. The use of experimental design in research in the food industry enables a reduction in reagents and other materials, shortening the research duration and optimizing energy resources [35]. Moreover, the studies described in the literature [36,37] prove the importance of carrying out conscious experimental research based on a selected design in the areas of management [36] as well as biology and medicine [37]. These designs are also widely used in hydrogeology [38]. Among the available designs, the Plackett–Burman design was particularly considered for application in the presented thermoacoustic investigation. Although this design remains one of the most important methods of factorial design utilized in experimental design [39] and finds numerous applications (sensitivity analysis of industrial printed-circuit heat exchangers [40], fuel processing procedure optimization [40], and biochemical and chemical processes optimization [41,42,43]), its selection was based on its beneficial characteristics. First of all, in the case of partial confounding of the analyzed parameters, if this design is used, the results of partial confounding tend to average out and some true conclusions can still be drawn about factors which are partially confounded with one another [40]. Furthermore, the Plackett–Burman design can easily be combined with optimization algorithms [39], which points to its wide applicability in future research.
1.2. Data Analysis Approaches
Nonetheless, the use of experimental design supports only the methodology of the performed experiments, whereas significant errors might come from the distortion of acquired data. Thus, the application of tools supporting extraction of the most important information even from a biased signal is essential.
The basic tool used in the analysis is the Fourier transform, which enables the representation of the collected signal in the frequency domain [44,45]. This tool is useful in obtaining information from periodic signals [46]. It is widely applied not only in classical audio signal analysis [46] but also in image processing, power systems, and machinery diagnostics [47,48,49]. The Fourier transform is characterized by noise immunity and enhancement of periodic features, which is strongly beneficial when considering its application for thermoacoustic systems [46]. Since the signal collected from a microphone and transformed by an analog–digital converter (e.g., in the form of a sound card) is a discrete signal, the Discrete Fourier Transform (DFT) can be used. Transformation of the acoustic pressure signal in successive characteristic points of the investigated system makes it possible to determine the frequency of acoustic waves propagating in the working gas and to approximate their origin. DFT-based analysis is deemed to exhibit both good accuracy and a low computational burden [49].
The results of the DFT performance make it possible to emphasize the frequency of all component waves of the collected signal. In the event of a reflection of the forcing wave, e.g., at the edge of an exchanger made of a partially flexible material and characterized by insufficient porosity, a component with a high amplitude and frequency close to the frequency of the primary wave may appear in the collected signal. Furthermore, the DFT computational speed can be affected by asynchronous sampling and interharmonics [50]. Similarly, when the system parameters are affected by external acoustic waves with significant amplitudes, identifying the components may require increasing the amplitude resolution of the DFT. This can be achieved by multiplying the signal through parametric windows. This action is particularly important at the stage of identifying the presence of a stable acoustic resonance and excluding the appearance of beats. By applying one or more shaped windows to the dataset, as Hann and Kaiser windows, the discontinuities at the ends of the window assumed by the DFT can be significantly reduced [51]. The Kaiser window is considered suitable for signal filtering, as it controls the pass band and stops band ripples simultaneously [52]. Furthermore, the use of the Kaiser window gives better results in algebraic image reconstruction as well as in data prediction in genomics than other applicable windows [53,54]. Additionally, the windowed signal was further analyzed using the cepstrum analysis. Although the cepstrum was originally used to detect echoes in seismic signals, it has found superior applicability in the separation of the forcing function and the transfer function in mechanical systems and diagnostics of local faults in gears and variable speed machines [55,56,57]. If combined with other periodic data analysis techniques, the cepstrum analysis might vitally help to reconstruct complex patterns (as pressure parameters in the spark ignition engine [58] or cavitation traces [59]) using simple instrumentation. Furthermore, the cepstrum is commonly used as a single/multiple echo detector in mixed signals [60,61]. Despite limited resolution and problems with power leakage, in the case of appearance of two echoes with a shift, a trace of the echo and the shift are visible in the cepstrum as well [61], which might give the vital reason to apply the cepstrum analysis in diagnostics of standing-wave thermoacoustic devices.
Due to the great number of interacting factors, as well as the influence of the forcing wave source (a membrane loudspeaker usually), serious measuring errors are expected occasionally. In order to eliminate them from the collected data series early, additional mathematical tools, based on a number of statistical tests, can be used.
The first of the statistical tests, i.e., the Q-Dixon test [62] consists in ranking of the measurements made in a given measurement series in the ascending order, identifying the values being the farthest from the assumed expected value and then determining the value of the test coefficient [62]. In the case of temperature and sound pressure measurements, by assumption the expected value might be equal to the average value from measurements belonging to a given series.
The determined value of the test coefficient is compared with the critical value, computed for a given confidence level and the number of measurements made in a given measurement series. If the value of the test coefficient is greater than the critical value for a measurement, potentially representing a gross error, the measurement result will be rejected as a gross error [62].
In order to make an alternative evaluation of the measurement results in terms of the occurrence of gross errors, subsequent measurement series were evaluated using the Grubbs test [63]. This test is valid for series with a normal distribution and assumes the reference of the absolute value of the difference between the measurement value, which is potentially a gross error, and the average value of the measurement series’ standard deviation. The value of the Grubbs test coefficient is then compared with the critical value determined for a given number of measurements in a series and for a given confidence level. If the value of the test coefficient is greater than the determined critical value, then the measurement potentially representing a gross error should be considered erroneous [63]. The selection of the discussed test was supported by its wide acceptance, critical values available to large datasets [64], high efficiency, and adequacy in the indeterminacy environment [65]—especially if the number of suspected outliers tends to their actual number [64]. Furthermore, the Grubbs test can be applied in various fields, such as in the detection of outliers in flood series, the analysis of advanced manufacturing systems, medical data analysis, and the identification of abnormal energy consumption in power systems [65,66].
The possibility of using the Grubbs test depends on proving the normal distribution of the measurement series to which the tested measurement belongs [63]. For this reason, in order to identify whether the distribution of the measurement values in the series corresponds to the normal distribution, each series was subjected to the Kolmogorov–Smirnov (K-S) test [67]. Basically, the K-S test is used to measure the similarity between two empirical sets of data, as it indicates to what extent the investigated sets are generated by the same mechanism with the same probability density [68].
The K-S test uses a comparison of the empirical distribution function with a stabilized theoretical distribution, adopted on the basis of the verified null hypothesis, according to which the tested distribution of the number of statistic values corresponds to the normal distribution [67]. This test assumes the ascending ordering of the measurement series with further standardization of the measurement (sample) values to the form of a normal distribution N(0,1). Finally, the distribution function of the standardized empirical distribution is determined [67]. If the determined value of the test statistic takes a value equal to or greater than the critical value of the normal distribution at the assumed confidence level, there is no basis to conclude that the distribution of measurements in a given measurement series corresponds to the normal distribution [67].
Apart from simple normal distribution testing, the K-S test is applied for many other purposes, such as identifying unexpected mechanisms of forcing heavy ion collisions in nuclear units [69], increasing the quality of the input dataset for wavelet packet analysis in water hydraulic motor fault detection [70], direct detection of cracks and faults of gears [71], and improving the quality of optimization of wind energy harvesting [68], which proves its universality and wide applicability.
1.3. Recent Studies on Thermoacoustic Devices
Thermoacoustic devices are constantly being investigated using numerous methods. The authors of the paper [72] were the first to describe in detail the phenomenon of hysteresis in quarter-wave thermoacoustic engines, integrating CFD methods, mathematical modeling, and experiments. The innovative nature of the work stems from the identification of the influence of stack parameters (e.g., gap and position) on acoustic amplitude hysteresis, which provides practical guidance for reducing ignition temperature and increasing the dynamic stability of thermoacoustic engines. In [73], the researchers developed a two-stage prototype of a travelling-wave thermoacoustic cooler, achieving a cooling capacity of nearly 300 W at a temperature close to 0 °C. The novelty of this work is the practical implementation of a configuration coupling two linear motors with a cooling system, ensuring high transduction efficiency and compactness of the system. The authors emphasize the importance of effective acoustic matching and analyze the influence of the inertance-compliance configuration. The study [74] developed a travelling-wave-based refrigerator achieving 210 W of cooling power at 233 K and a COP of 30% relative to Carnot COP. The key innovation is the use of a toroidal resonator with a feedback loop, which recovers acoustic power from the device output and reintroduces it to the input, significantly increasing efficiency. The system uses a precisely designed steel-mesh regenerator and an advanced phase shift network to optimize the Stirling cycle in an acoustic environment. Fundamental experimental work was presented in the paper [75]. The article compares different methods of cooling a cold–heat exchanger in a thermoacoustic engine. The innovation lies in the use of passive heat exchangers with heat pipes, which operate without the need for electrical power. Although the pressure amplitudes obtained were lower than in the case of water cooling, the heat pipe system showed stable oscillations and potential for completely “electricity-free” cooling devices—which is of great importance for sustainable energy technologies and applications in areas without access to electricity. The modeling approach used in the article [76] presents an innovative cooling system—TADTAR (ThermoAcoustically-Driven ThermoAcoustic Refrigerator)—which converts waste heat into acoustic energy to power the refrigerator. The innovation lies in the full integration of the engine and the thermoacoustic refrigerator, which allows cooling without using compressors, freons, or moving parts. The authors of the paper [76] optimized the system’s geometry using DeltaEC software, achieving a COP = 4 and 73% Carnot efficiency, which is a significant result in environmentally friendly refrigeration technologies.
Fundamental work for the community of researchers of thermoacoustic devices was presented in the review [77] of multiphysics couplings in thermoacoustic devices, covering thermal–acoustic, acoustic–mechanical, and mechanical–electrical effects. The innovation of the article lies in the systematization of knowledge in the context of physical couplings, which allows for a better understanding of energy conversion mechanisms and provides a valuable basis for further optimization of thermoacoustic systems.
1.4. Novelty of This Paper
Despite the potentially attractive features of thermoacoustic refrigeration solutions and the continuous progress, these devices are still in the research phase, and widespread market applications are not available. This is due to many different reasons; one of them is the search for new materials and methods of regenerator construction. New possibilities are opening up here through 3D printing technology and materials. The novelty of the presented research is a successful attempt to induce the thermoacoustic phenomenon using 3D-printed heat regenerators. One of the aims of this work is to share the practical experience gained during the experimental campaign and the data analysis process. The dedicated laboratory stand was designed and constructed for automated measurements. This paper presents the developed design, introduces the reader into the calibration process, and provides a novel approach to data processing, which reveals an effective method of managing automated measurements of the thermoacoustic device.
This paper is organized as follows. Section 2 shows the methods used in the experimental research, the developed test stand, the calibration of the equipment, and the measuring procedures. It also describes the heat regenerators used in this study. Results and discussion for the analyzed regenerators are shown in Section 3. Finally, Section 4 concludes this paper and presents the possible directions for further research.
2. Materials and Methods
2.1. Procedure
This subsection presents the entire experiment procedure in bullet points to clearly and transparently communicate the work performed. All points are expanded upon and described in detail later in Section 2.
- Preparation of the experimental rig: The experiment was conducted on a specially designed test rig consisting of a thermoacoustic unit, an automation and control system, and a hermetic pressure chamber. The length of the acoustic channel was adjusted within the range of 250–450 mm.
- Installation of regenerators and sensors: Regenerators of various lengths, porosities, and materials were installed inside the acoustic channel. Temperature sensors (Pt100 class A) were placed in holes located 3 mm from the front surfaces of the regenerator and next to the membrane loudspeaker.
- Temperature and pressure measurements: During the experiment, the temperatures at the ends of the regenerator, the average temperature inside the chamber, and the operating pressure were recorded. The acoustic pressure was measured using a condenser microphone, which was moved along the axis of the channel by a stepper motor.
- Experiment procedure: A loudspeaker emitting an acoustic wave at the resonance frequency was activated, and measurements were then taken at a steady state. Five repetitions of the measurements were performed for each set of parameters.
- Calibration: The temperature measurement system was calibrated using a Fluke® 9142 calibrator, with set temperature values and controlled heating/cooling times.
- Experiment planning: The Plackett–Burman design was used to identify significant variables affecting the results (regenerator length and porosity; working gas parameters).
- Data analysis: The data were statistically processed, gross errors were removed using the Q-Dixon and Grubbs tests, the normality of the distribution was tested (K-S test), and then the measurement uncertainty was estimated. The acoustic data were analyzed using Fourier transform (DFT) and cepstral analysis.
2.2. Experimental Setup
2.2.1. Test Bed
The presented experimental research was performed using the experimental setup shown in Figure 1, with a schematic view shown in Figure 1a and the photo of the actual rig shown in Figure 1b. It is composed of a thermoacoustic unit (1), an automation and control system (2), and a sealed vessel (3) holding the investigated device. Photographs of the setup are shown in Figure 2a–c.
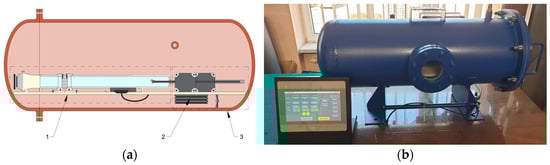
Figure 1.
(a) Schematic view of the test stand: 1—thermoacoustic unit, 2—automation and control system, and 3—sealed vessel; (b) photo of the test stand.
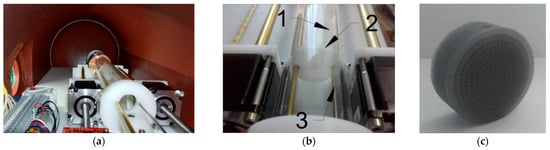
Figure 2.
(a) Photograph of the thermoacoustic unit bed inside the sealed vessel; (b) photograph of the adjustable stiff wall system: 1—thermoacoustic unit resonance tube, 2—stiff wall, and 3—driving rod; (c) example of a 3D-printed regenerator.
The thermoacoustic device consists of a cylindrical, quarter-wavelength, polycarbonate acoustic channel closed with a movable stiff wall made of polyvinyl chloride at one end and a membrane loudspeaker (GDN 13/40/2, Tonsil, Poland) at the other. The loudspeaker was connected to the rest of the channel using a quasi-conical bypass, extending this part of the cylindrical channel. A regenerative heat exchanger was placed inside the channel using two double-sided flanges made of polylactic acid, which separated the channel into two parts of approximately ¼ and ¾ of the total length, respectively. The shorter part was mounted on a movable plate, which enabled the utilization of regenerators with various geometrical and material features (length; porosity). The movable stiff wall closing the acoustic channel was connected by a threaded bar stock to a stepper motor, operated by a commercial PLC unit, which made it possible to change the acoustic channel length in the range from 250 mm to 450 mm. The system is placed in a closed vessel, which allows for studying the system’s behavior under variable parameters, such as changes in the working gas or conditions of increased pressure.
The following quantities were selected to perform the fundamental measurements during the thermoacoustic unit operation: the temperatures at the opposite front surfaces of the regenerator, the mean temperature inside the vessel, and the working gas pressure inside the vessel. As an additional measurement, to identify the acoustic conditions inside the channel during the setup operation, the acoustic pressure amplitude was also identified.
The unit was equipped with three temperature sensors, two of which were located inside the regenerator and mounted there through two sleeves drilled in the respective flanges. In order to place them inside, the exchanger was equipped with two half-diameter-long wells, perpendicular to its axis and located 3 mm away from its opposite front sides, respectively. The third sensor was located at the edge of the loudspeaker. It was used to determine the working gas temperature close to the acoustic wave source.
All temperature measurements in the investigated unit were performed using standard Pt100 sensors. Since this type of industrial sensor can be burdened with a high measuring error [78], the use of sensors of the highest accuracy classes, i.e., class AA or class A, was proposed. Due to significant difficulties in accessing miniature class AA sensors, the system was equipped with a class A sensor, characterized by the measurement uncertainty defined by the following relation (1) [79]:
where u(T)max is the standard temperature measurement uncertainty (in Celsius degrees), and T is the measurement value (in Celsius degrees).
The Pt100 sensor is widely used and facilitates the construction of a measurement circuit. However, the properties of the analog-to-digital converter play an essential role in this case. If the converter’s resolution is too low, a wide range of resistance values will correspond to a single bit of data sent to the measurement system. For example, using an 8-bit converter with a sensor with a measuring range of 950 K (from −150 °C to 800 °C) translates into a conversion factor of approximately 120 K per bit, which can significantly increase measurement uncertainty. An incorrect transducer response may result from improperly selected sensitivity, i.e., the range of detected analog values—the same input signal may be interpreted differently depending on the transducer used. In addition, when the frequency of recorded changes is changed, there may be a significant modification of the error distribution—a configuration suitable for slow temperature changes may generate significant deviations in the case of sudden temperature jumps, e.g., due to acoustic resonance interference. Equally important are the properties of the sensor itself—an increase in its mass can cause significant discrepancies between the actual and measured temperatures.
For this reason, in most laboratory and field applications it is necessary to use 16-bit or 24-bit converters, limiting the quantization error, which is a component of the analog-to-digital conversion error, to fractional values of the error produced for the 8-bit converter [80]. Therefore, the temperature sensors used in the experimental testing were connected to a 14-bit digital data acquisition card with the Modbus RTU output.
Considering their miniaturized geometry, the influence of their heat capacity was assumed as negligible.
2.2.2. Calibration Procedure
In order to verify the functioning of the temperature measuring track and its parameters, its operation was analyzed in comparison to calibration data. The analysis was performed in the form of identifying the set of final measurements (transmitted via the Modbus protocol) in terms of both the sensor temperature value and the rate of the temperature change. A dedicated device for calibrating temperature sensors—Fluke® 9142—was used as the test apparatus. A diagram of the active part of the test apparatus is shown in Figure 3.
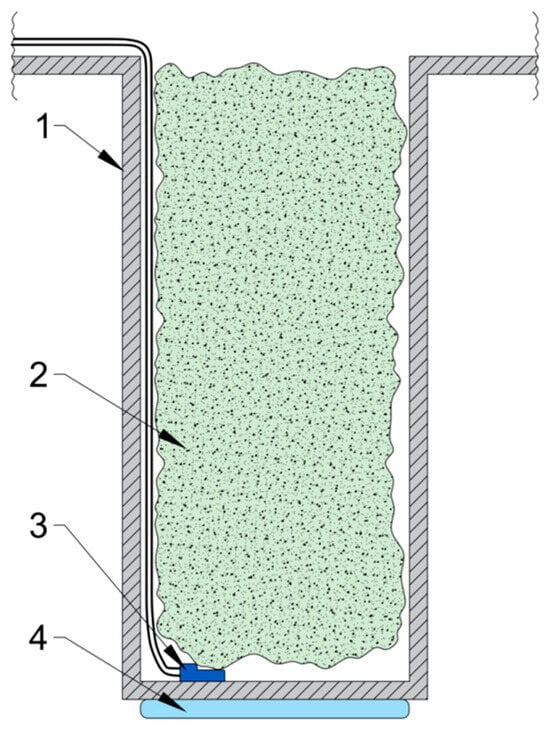
Figure 3.
Schematic view of the test apparatus well with the tested sensor: 1—well wall, 2—porous cellulose insulation, 3—tested sensor, and 4—heating/cooling system of the apparatus.
The experimental procedure involved forcing the calibration device system with the inserted Pt100 sensors to a steady state and then forcing a change in the device temperature by successive cooling and heating at preset values. Both the cooling and the heating time were set as variables independent of the set temperature values. Although the assumed testing procedure differs significantly from the heat transfer conditions appearing during experimental tests (no pressure oscillations at acoustic frequencies), some similarities can be found due to the presence of porous insulation. The applied thermal insulation limits free convection of heat from the sensor’s surface towards ambient air. Similar limitation takes place inside the regenerator in the direction perpendicular to the direction of an acoustic wave propagation. Furthermore, by blocking the sensor’s possible movement beyond its steady position at the bottom of the well, the insulation enhances direct conduction between the well wall and the sensor—a mechanism also observed during the experimental analysis (as conduction between the Pt100 sensor and the solid walls of the regenerator body). This conclusion is supported by a brief comparison of the average heat transfer coefficients estimated for acoustic pressure oscillations and the calibration well environment for expected standard conditions.
The mean value of the convective heat transfer coefficient for the test apparatus well (h = 1.0 W/m2K) is roughly ten times lower than for the experimental conditions (h = 10.3 W/m2K) [81], which means a significant drop in the heat transfer quality and thus a higher risk of error propagation. Therefore, achieving acceptable quality of measurements during tests ensures proper quality of measurements during the experiment.
The testing parameters for subsequent variants of the analysis are listed in Table 1. The time series of calibrating the device temperature indicated by the built-in reference sensor, as well as the data of the tested Pt100 sensor, are shown in Figure 4a–d.

Table 1.
Temperature measurement track testing conditions.
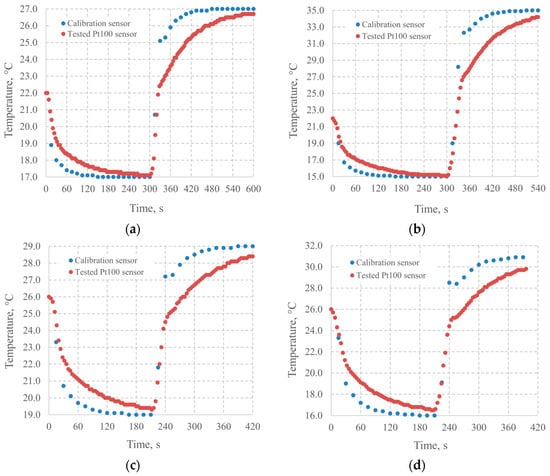
Figure 4.
Results of the temperature measurement track for (a) the first, (b) the second, (c) the third, and (d) the fourth testing conditions, respectively.
As indicated in Figure 4, the temperature indicated by the tested track follows the temperature shown by the calibration sensor with a delay, approximately equal to 180 s during the first and third sets of testing conditions, as in Figure 4a,b. Nonetheless, due to convergent trendlines of temperature indication, an acceptable difference in temperature is shown even for measurement periods shorter than expected delay, as plotted in Figure 4c,d.
The measurement of static and acoustic pressure is equally important. The identification of the dynamic pressure amplitude, increasing successively due to the propagating acoustic wave and the resulting resonance, enables identification of acoustic conditions taking place in the analyzed system. This might involve the analysis of complex wave signals consisting of the source wave and higher order harmonics, as well as single or multiple echoes. Furthermore, the porous body fulfilling the role of a regenerator might substantially affect the system acoustic properties by acting either as a low- or a high-pass filter or both [82,83]. Some distortion of the acoustic field might be introduced by imperfect representation of the shape of the wave generated by the membrane loudspeaker. Due to the non-negligible inertia of the vibrating mass, as well as the finite stiffness of the membrane material, the shape of the emitted acoustic wave might differ from the input shape (e.g., sine), especially if some square components (e.g., originating from the amplifier or the power supply unit) are present. Hence, identification of the real shape of the wave induced in the operating unit might provide the information supporting the acoustic pressure measurements. The measurement of static pressure enables estimation of the energy density associated with the oscillating movement of a gas portion.
In order to perform the acoustic pressure measurement, a sound pressure sensor was located inside the acoustic channel. The sensor was mounted coaxially to the channel using a long bushing crossing the closing stiff wall and supported by a movable rail, operated by a stepper motor. This solution ensured an almost continuous change in the position of the sensor.
For this reason, an advantageous solution is to use an acoustic pressure sensor in the form of an omnidirectional microphone, which enables the reading of signals coming from various sources, including low-energy ones. The disadvantage of this solution is the necessity to carry out a basic signal analysis in order to extract the components corresponding to the forcing wave, white noise, and low-amplitude waves resulting from the reflection and scattering of the forcing wave. The alternative solution, i.e., the use of a single or a bidirectional sensor, significantly simplifies the process of mathematical analysis of the collected data but creates the risk of having to repeat the measurements many times in the event of significant disturbances.
For this reason, an electret condenser microphone with a signal detection frequency in the range of 102–104 Hz and a maximum sound pressure level of 58 dB was used as a sound pressure sensor on the test stand [84].
In the acoustic pressure measuring track it is often necessary to use a signal amplifier system. The key issue is the proper selection of the amplification factor—in the case of complex measurement systems, it is too low a value and may cause an increase in the share of white noise and crosstalk from other measuring tracks. Nevertheless, excessive gain can be a potential source of crosstalk to other paths on the one hand and make it difficult to separate the signal components during its mathematical analysis on the other. Moreover, proper mapping of the signal shape requires the use of an amplifier with a sufficiently high slew rate, not less than the product of the maximum expected angular frequency of the collected signal and its maximum value expressed in voltage at the microphone circuit contacts, according to relation (2):
where SR is the slew rate, Vamp is the voltage at the microphone contacts at the maximum sound pressure, and fmax is the highest frequency component of the recorded signal.
Based on the estimated model analyses and technical parameters of the measuring circuit, the maximum voltage and frequency values were assumed at the level of 2.5 V and 12 kHz, respectively. Therefore, in the described experimental setup, a low-voltage electronic amplifier was used with nominal amplification of the acoustic pressure level of 12 dB and the slew rate of 1.5 × 10⁶ V/s [85].
The signal collected from the microphone was analyzed using the basic tools of mathematical analysis and signal processing, taking into account (i) the Discrete Fourier Transform (DFT) for the signal multiplied by parametric window and (ii) the cepstrum.
The measurement of static pressure was carried out using a standardized pressure sensor operating in the range from 0 to 10 bar. The output signal from the applied sensor was a standardized current signal in the range from 4 to 20 mA. A 14-bit analog-to-digital converter with two current inputs with a resolution of 3.75 μA and a processing time of 16 ms [86] was placed in the static pressure measuring track. The output current signal was transferred using a common Modbus RTU port.
2.2.3. Heat Regenerators
In order to identify the fundamental dependence of the operating properties of the investigated unit on its features, a set of regenerative heat exchangers was used during the experimental study. All the investigated regenerators consisted of cylinders with a diameter of 57 mm but differing from each other in length (i.e., 17 mm, 21 mm, and 25 mm) and structure (both the number and shape of pores, as well as the material used). The crucial geometries were assumed as regenerators with 25 and 406 cylindrical pores (corresponding to 40.5% and 11.1% porosity, respectively), made of ultraviolet-hardened polyester resin, acrylonitryle-butadiene styrene, and polyterephtalate. The materials were selected based on the availability for rapid prototyping, which was used to manufacture respective elements, as well as their low thermal conductivity, deemed crucial to enhance the device operation in the case of low-power thermoacoustic units.
In order to select the statistically significant variables for further experimental design consideration, a set of initial measurements—following the Plackett–Burman design concept [87,88]—was performed. The selected Plackett–Burman design means a two-level factorial design with a reduced number of measurements required to screen the importance of individual variables [89,90]. Due to a significant reduction in the costs of experiments (the number of the required experiments was roughly halved compared to the regular fractional factorial design), it is convenient. However, its application assumes negligibility of the interaction between subsequent factors and a low number of those influencing factors among all factors being investigated [90]. Nonetheless, the Plackett–Burman design is known for its capability to detect possible interactions even if their presence was not considered during the experiment [89]. Although a large number of separate factors might affect the final output of the phenomenon under consideration, their values (levels) have to be achievable in combination with each other [91]. Therefore, some of them might be grouped. To provide an example, for practical reasons it is unachievable to separate specific heat capacity and thermal conductivity of the working gas; thus, the type of the gas or its descriptive expression might be used instead. Since this stage of this study covered a brief investigation of the individual dependence of subsequent variables on the obtained results, all the factors controlled at the experimental setup were considered either individually or in groups. The length of the regenerator, its geometrical properties, the length of the acoustic channel, the working medium properties, and the working medium pressure were assumed as changed variables at this stage of this study, whereas the temperatures at the regenerator opposite sides and the difference between them were set as the resulting dependent variables.
The discussed geometrical-material properties of the regenerator included the variability of the exchanger internal geometry, taking account of the size of the pores and their number, which had a direct impact on porosity. Although the assumed geometries might differ between each other in material, due to the sophisticated definition of material properties in the assumed two-level design, this condition was not considered. A similar simplification was applied with regard to the working medium properties, which were classified simply as “beneficial” and “unbeneficial”, corresponding to the properties of helium and carbon dioxide, respectively [91,92].
In order to take account of their different features, the polyester–resin (SLA) regenerator with a porosity of 40.5% and the polyterephtalate (PET) exchanger with a porosity of 11.1% were assumed. The lengths of the regenerator were assumed to be 21 mm and 30 mm, corresponding to the extremes of available 3D-printed exchangers. The range in the lengths of the investigated acoustic channel was from the minimum to the maximum length which could be set using the applied setup, whereas the set of the investigated pressure values included two arbitrary pressures from the allowable pressure range limited by the vessel structure, with the higher value corresponding to the upper boundary. In order to minimize the influence of temporary measuring errors, all the measurements were repeated four times (giving a total number of five values collected for a single case under investigation).
Based on the obtained results, average values of the respective measurements as well as squared differences between all the measurements and the calculated averages were computed. Finally, the test coefficient value was calculated for all respective variables changed during subsequent measuring series. By comparing the computed test value with the critical value obtained for a given number of measurements and for the number of states of a given variable, the hypothesis of the statistical impact of a given variable on the obtained data was either accepted or rejected.
In light of this initial consideration, proper selection of the variability range of all assumed influencing variables is of particular importance, although generally it is smaller compared to the range used in more advanced research, such as optimization [91]. Therefore, only the limited range of variability of subsequent factors presented in Table 2 below was assumed.
Table 2.
Variables and their ranges of variability considered in the Plackett–Burman initial screening analysis.
To satisfy the criterion of at least seven influencing factors in the set, the fundamental variables were extended by two virtual factors with no meaning in relation to the setup parameters. Although the sequence of levels of respective variables should be randomized to prevent error propagation, it is often impractical due to the risk of component wearing. Furthermore, considering the saturated Plackett–Burman design, the sequence is unimportant for the final results [90,91]. Therefore, the logical sequence of measurements was assumed instead. The set of all considered sequences is shown in Table 3.
Table 3.
Set of sequences in the constructed Plackett–Burman design matrix.
Based on the performed investigation and statistical analysis, three variables (out of five real and two virtual factors) were identified as statistically significant (active): the regenerator length, its porosity, and the working medium properties. Following the information gathered from the initial analysis, the set of performed experiments covered all the initially assumed values of the variables identified as statistically significant. This assumption concerns the concept of the augmented Plackett and Burman design, where a set of additional values of active (result-influencing) variables perform the role of central points [90]. Such an approach extends the internal limitation of the two-level design by enabling the prediction of higher-order dependencies [90]. As for the remaining variables, which were identified as statistically unimportant (inert), only the two extreme values of the initially assumed set were covered in the final set of the performed experiments.
The raw experimental data collected from the timeseries during the emission of sound at a specified frequency (corresponding to the estimated resonant frequency for a given working medium and its temperature) and within a short time after its completion, included the data related to temporary values of temperatures at opposite sides of the regenerator, the acoustic pressure measurement results, and the values of pressure inside the vessel. The experiment was concluded by complex processing of the collected data.
2.3. Data Processing and Measurement Uncertainty
The first stage of the raw data processing consisted of sorting the data related to the respective variables, which was facilitated by saving the data collected and gathered from respective tracks in the single-comma-separated value format. Next, the extracted temperature and acoustic pressure time series were transferred to different data processing pathways.
The temperature data were duplicated, with original series used for the Q-Dixon statistical testing and further comparison with the Dixon critical value, in order to find gross errors within the collected data. All measurements indicated by the performed test as potential errors were marked but not erased at this stage of the analysis. The copied series was used to perform the K-S statistical test of similarity to investigate the normality of the collected data distribution. In the case of rejection of the null hypothesis, all potentially erroneous results indicated by the Q-Dixon test were assumed to be gross errors and erased from the set. If the null hypothesis was accepted, the copied series was investigated by the Grubbs statistical test and verified by comparing the obtained values with the critical values of the test. Next, the results of the Q-Dixon and the Grubbs test were compared to each other, and only the measurements marked as erroneous by both tests were rejected from the experimental data set. At the next stage, the uncertainty analysis, based on the uncertainty propagation rule, was performed for the respective temperature measurements present in the final set.
The acoustic pressure data were doubled, with the original time series used to perform the cepstrum analysis, and the copy of the obtained signal was multiplied by the Kaiser window function. The windowed signal was further used to proceed with the Discrete Fourier Transform. The resulting data were combined with the results of the cepstrum analysis. Finally, the frequency and amplitude uncertainty analysis was performed, with the potential error ranges conjugated with the processed data.
The uncertainty of respective measurements was calculated using the uncertainty propagation rule, with the principal uncertainty defined by the nominal error linked to each of the applied instruments and to the analog–digital converter operating at each respective canal of the data acquisition system and responsible for the collection and transmission of sensor outputs.
Considering the temperature measurement track, the maximum error related to the measurement is expressed by a function of the results, as shown in Equation (3).
where δm(Ti) is the maximum instrumental error related to the i-th temperature measurement, and Ti is the result of the i-th measurement (in Celsius degrees).
The maximum error induced by the converter, being a sum of discretization and quantification errors, was declared by the manufacturer at the level of 0.5 °C. The total error at the temperature measurement track is thus expressed by Equation (4).
where δ(Ti) is the maximum error related to the i-th temperature measurement, and Ti is the result of the i-th measurement (in Celsius degrees).
The uncertainty of the acoustic pressure measurement was estimated based on the declared maximum sensitivity deviation, corresponding to 2 dB (approximately 2.8 × 10⁻⁵ Pa). In relation to the voltage output signal, the stated error corresponds to a 0.03 mV voltage error at the nominal 1 kHz calibration conditions.
The flowchart illustrating the computational processing of the data collected from the sensors is shown in Figure 5.
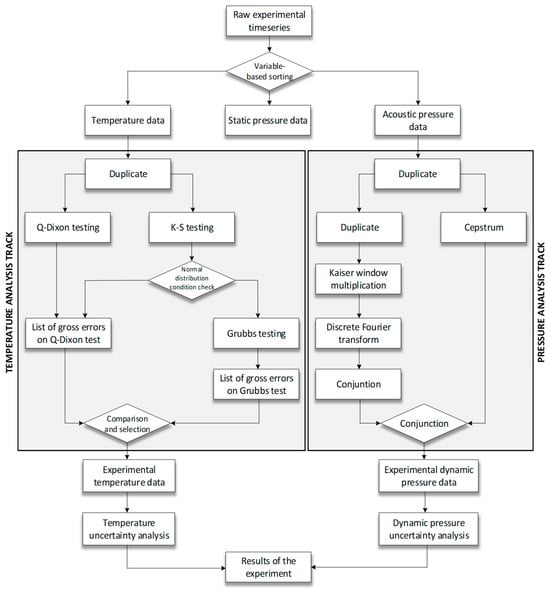
Figure 5.
Computational processing of raw experimental data.
The assumed Kaiser window was selected due to its wide applicability in signal analysis and reconstruction [38,93].
The experimental procedure was preceded by determination of the operating features of the acoustic signal-inducing unit, comprising the signal generator, an amplifier, and a loudspeaker interconnected with a series of transducers. The shape of the generated acoustic wave as well as the frequencies of the fundamental components of its spectrum were assumed as the essential parameters analyzed at this stage. Both of these parameters were identified close to the regenerator (with an 11 mm offset originating from the acoustic pressure sensor mounting) as well as at a 55 mm distance, under the conditions of the emission of a pure sine waveform set on the virtual generator. The results of the testing are presented in Figure 6 and Figure 7 for the regenerator proximity and the specified distance, respectively.
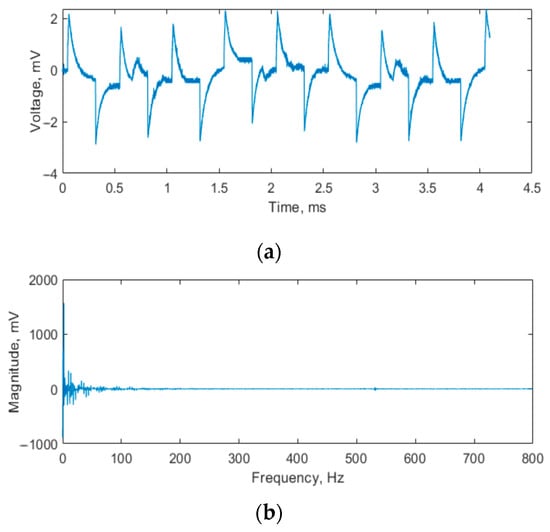
Figure 6.
Shape of the obtained signal (a) and its spectrum (b) for the measuring point in the regenerator proximity (actual distance from the regenerator wall: 11 mm).
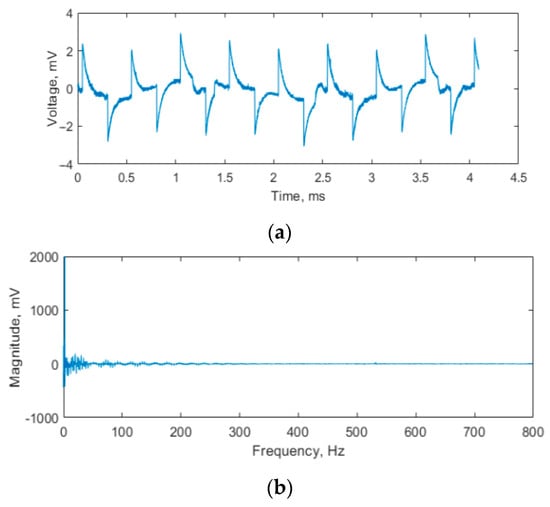
Figure 7.
Shape of the obtained signal (a) and its spectrum (b) for the measuring point in the regenerator proximity (actual distance from the regenerator wall: 66 mm).
The observed shape of the acoustic wave differs substantially from the pure sine set on the virtual signal generator. Nonetheless, the obtained waveform follows a typical representation of a square wave in membrane loudspeakers, which suggests a strong influence of the digital amplifier power system (supplied with a square-impulse DC generator) on the final signal. The noise observed in the spectrum of the obtained signals is at an acceptable level for both of the cases under investigation and is primarily related to low frequencies, which are not considered suitable for further consideration. Furthermore, the max voltage induced by acoustic pressure in the sensor located 66 mm from the regenerator wall (Figure 7) is higher by roughly 9% than in the sensor located 11 mm from the wall (Figure 6). This proves an active participation of the regenerator in acoustic energy dissipation inside the investigated design. Since the energy transfer to the regenerator volume remains the main operational target of the soundwave induction inside the investigated device, the overall operation of the acoustic signal-inducing unit may be deemed as acceptable for the analytical purpose.
3. Results and Discussion
The results of the respective series of measurements, which were mathematically analyzed to delete gross errors, were used to compute the arithmetic mean and standard deviation of the series. The data showing the average temperature difference between the opposite sides of the regenerator, as well as standard deviation of the results, are listed in Table 4.
Table 4.
Averaged results of measurements performed according to the Plackett–Burman design.
In order to examine the significance of the data obtained from the experiments performed according to the Plackett–Burman design, selected series were extended by measurements performed for an additional pressure value (equal to 4.2 bar) and for the acoustic channel length (equal to 450 mm), as well as for an additional working gas type (dry synthetic air). The results collected for the extended series, indicating the arithmetic mean of the series and standard deviation of respective data points, are shown in Figure 8.
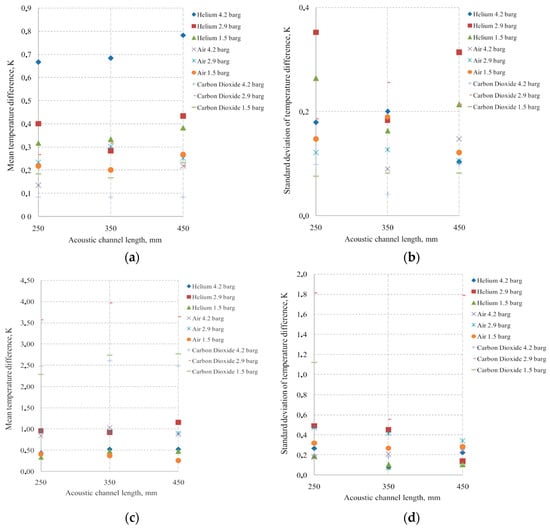
Figure 8.
Temperature difference along the 25 mm regenerator: (a,b) mean and standard deviation for PET; (c,d) mean and standard deviation for SLA.
As indicated in Table 4, the highest temperature difference along the regenerator (equal to 4.0 K) was observed for the regenerator made of polyester resin (SLA) with a porosity of 0.405. Furthermore, using such structural features of the regenerator generally leads to a visible drop in the standard deviation of the measurements performed for the respective environmental conditions. As shown in Figure 8, the lower temperature difference for the PET/0.111 regenerator may result from local disruption of the standing wave, after which the incoming sine wave cannot maintain within the regenerator’s control volume. Due to higher porosity leading to a smaller influence of the acoustic wave reflection/refraction on the front of the exchanger, the SLA/0.405 regenerator seems more resistant to wave-shape imperfections and their effect on the heat transfer.
An analysis of the data listed in Table 4 reveals an essential impact of the working gas type and pressure on the observed temperature difference. The mean temperature differences obtained for the carbon dioxide (CO2) used as the working gas are significantly higher than the differences obtained for similar environmental conditions with helium (He) as the working medium, which is true for a vast majority of the investigated cases. This observation, although seemingly contradictory to the literature [8,14,93], suggests the vital importance of the inducing acoustic wave frequency, which is directly related to the speed of sound within a particular working medium. Since the speed of sound in helium is significantly higher compared to carbon dioxide, the obtained results show the crucial effect of internal losses appearing within the regenerator, which are linearly dependent on the inducing wave velocity squared [8,93].
Another observation resulting from the analysis of the obtained data is the dependence of the standard deviation of the results on the acoustic channel length, which is visible in Table 4 and also in Figure 8b,d. For most of the performed experimental series, the standard deviation of the temperature difference measurements is much lower for the 250 mm long acoustic channel than for the length of 350 mm (at the same working conditions). Extending this to the additional measurements using the 450 mm long acoustic channel, a further drop in the deviation of the results is observed. Nonetheless, the rate of this change is directly related to other environmental and structural properties of the unit (including the regenerator material and length, the working medium type and pressure, etc.). Of all the factors influencing the rate of change in the deviation of the results, the regenerator structural features (material and porosity) seem to be the most important, as can be seen by comparing Figure 8b,d. For the latter, for all the data series (except helium with the 2.9 bar working pressure), an increase in the acoustic channel length was followed by an exponential drop in the deviation of the results. This might be due to the drop in the inducing sound frequency and hence the local velocity of the acoustic wave, leaving more time for the temperature measurement track to react, as well as to the decrease in possible acoustic resonance distortion caused by quick interference of the reflected wave (which might be distorted, e.g., by partial reflection off the regenerator front) with the following inducing wave.
4. Conclusions and Recommendations for Future Work
The presented investigation covers an assessment of methodology for increasing the quality of compact thermoacoustic device measurements. The introduced method included the design of an appropriate experimental plan and identification of measurement uncertainties and the factors which might influence them during the measurements, as well as the statistics-based path for gross error detection and fundamental uncertainty analysis. A detailed assessment of the proposed methodology was performed based on experimental data, covering a set of different operational conditions and constructional features of the thermoacoustic device. The conclusions are as follows:
- The collected results concerning the obtained temperature difference along the regenerator prove the essential impact of structural features—material and porosity—on the unit performance. Among the tested set of features, the exchanger made of polyester resin (SLA) with a porosity of 0.405 was characterized by the highest temperature difference equal to 4K. This result coincides with the conclusions of previous investigations on thermoacoustic units presented in [8,27,86].
- The experiment also shows the importance of the speed of sound depending on the applied working medium and environmental conditions, as well as its effect on the thermoacoustic device’s performance. The observed influence can be explained by the results of analytical and experimental research described in the literature [8,17], showing an increase in the internal acoustic power losses taking place in the regenerator with the speed of the wave propagation squared. Hence, for small thermoacoustic units, the speed of sound propagation in selected working media substantially affects the device’s final performance and becomes a factor which is more important than its thermal properties (either beneficial or unbeneficial).
- The experimental data obtained during the investigations point to a substantial drop in the temperature difference measurement uncertainty, expressed by the standard deviation, with an increase in the acoustic channel length. This observation may be due to a decrease in the acoustic wave velocity, which reduces the measurement track time constant required to maintain acceptable accuracy of the measurement and to the smaller risk of permanent distortion of the acoustic wave, e.g., on the front side of the regenerator. Thus, the reliability of temperature measurements in small thermoacoustic units could be improved by either increasing the acoustic channel length or using measurement tracks with a reduced time constant.
- The introduction of the assessed methodology for measurements of the compact devices was followed by the identification of essential factors influencing the expected performance, as well as the estimation of operational parameters of the device with changes in its characteristics. The observations and conclusions were withdrawn with a limited number of experiments. Therefore, the proposed method might be deemed effective when analyzing compact thermoacoustic units.
- The results of the experiments confirm the possibility of effectively inducing the thermoacoustic phenomenon in a compact device using regenerative exchangers manufactured using 3D printing. Extension of the proposed method on large thermoacoustic devices, as well as its further assessment, remain the scope of future research. However, for this technology to be more widely used in engineering practice, further research focused on improving its efficiency is necessary. It is recommended that work on optimizing the geometry and materials of the regenerator continue, as well as developing design solutions that enable higher temperature gradients to be achieved. The authors will continue their work in this area.
Author Contributions
Conceptualization, L.R.; Data curation, L.R. and K.G.; Formal analysis, L.R. and K.G.; Funding acquisition, L.R.; Investigation, L.R. and K.G.; Methodology, L.R. and K.G.; Project administration, L.R.; Resources, K.G. and E.R.; Software, L.R.; Supervision, L.R. and W.U.; Validation, L.R., K.G., E.R. and W.U.; Visualization, K.G.; Writing—original draft, K.G.; Writing—review and editing, W.U. All authors have read and agreed to the published version of the manuscript.
Funding
The research was financed by Silesian University of Technology statutory research funds.
Data Availability Statement
The original contributions presented in this study are included in this article. Further inquiries can be directed to the corresponding author.
Acknowledgments
During the preparation of this manuscript, the authors used ChatGPT (GPT-4-turbo, May 2024 release) for improving the clarity of the abstract and selected parts of the text (according to the suggestions during the review process). The authors have reviewed and edited the output and take full responsibility for the content of this publication.
Conflicts of Interest
The authors declare no conflicts of interest.
Abbreviations and Symbols
The following abbreviations and symbols are used in this manuscript:
| Symbol | Description |
| ABS | Acrylonitrile butadiene styrene |
| ADC | Analog-to-digital converter |
| CO2 | Carbon dioxide (working gas) |
| COP | Coefficient of Performance |
| DFT | Discrete Fourier Transform |
| fmax | Maximum frequency component of the signal, Hz |
| h | Convective heat transfer coefficient, W/m2K |
| He | Helium (working gas) |
| δ(Ti) | Total error of temperature measurement Ti, °C |
| δm(Ti) | Maximum instrumental error for temperature measurement Ti, °C |
| ΔT | Temperature difference across regenerator, K |
| PET | Polyethylene terephthalate |
| PLC | Programmable Logic Controller |
| RTU | Remote Terminal Unit (used in Modbus communication) |
| SLA | Stereolithography resin (UV-cured polyester resin used in 3D printing) |
| SR | Slew rate of amplifier, V/s |
| T | Temperature, °C |
| u(T)max | Maximum standard temperature measurement uncertainty, °C |
| Vamp | Voltage at microphone terminals, V |
| x1 | Acoustic channel length, mm |
| x2 | Regenerator length, mm |
| x3 | Regenerator porosity |
| x4 | Working gas pressure, bar |
| x5 | Working gas type |
| y | Resulting temperature difference across regenerator, K |
References
- Jurczyk, M.; Węcel, D.; Uchman, W.; Skorek-Osikowska, A. Assessment of operational performance for an integrated ‘power to synthetic natural gas’ system. Energies 2022, 15, 74. [Google Scholar] [CrossRef]
- Uchman, W.; Kotowicz, J. Varying load distribution impacts on the operation of a hydrogen generator plant. Int. J. Hydrogen Energy 2021, 46, 39095–39107. [Google Scholar] [CrossRef]
- Kotowicz, J.; Brzęczek, M. Methods to increase the efficiency of production and purification installations of renewable methanol. Renew. Energy 2021, 177, 568–583. [Google Scholar] [CrossRef]
- Kotowicz, J.; Węcel, D.; Kwilinski, A.; Brzęczek, M. Efficiency of the power-to-gas-to-liquid-to-power system based on green methanol. Appl. Energy 2022, 314, 118933. [Google Scholar] [CrossRef]
- Wang, X.; Xu, J.; Wu, Z.; Luo, E. A thermoacoustic refrigerator with multiple-bypass expansion cooling configuration for natural gas liquefaction. Appl. Energy 2022, 313, 118780. [Google Scholar] [CrossRef]
- Xu, J.; Hu, J.; Luo, E.; Hu, J.; Zhang, L.; Hochgreb, S. Numerical study on a heat-driven piston-coupled multi-stage thermoacoustic-Stirling cooler. Appl. Energy 2022, 305, 117904. [Google Scholar] [CrossRef]
- Yang, R.; Meir, A.; Ramon, G.Z. Theoretical performance characteristics of a traveling-wave phase-change thermoacoustic engine for low-grade heat recovery. Appl. Energy 2020, 261, 114377. [Google Scholar] [CrossRef]
- Tijani, M.E.H. Loudspeaker-Driven Thermo-Acoustic Refrigeration; Technische Universiteit Eindhoven: Eindhoven, The Netherlands, 2001. [Google Scholar]
- Strutt, J.W. The Theory of Sound; Dover: New York, NY, USA, 1945; Volume 2. [Google Scholar]
- Sarpotdar, S.M.; Ananthkrishnan, N.; Sharma, S.D. The Rijke Tube—A Thermo-acoustic Device. Resonance 2003, 1, 59–71. [Google Scholar] [CrossRef]
- Saechan, P.; Jaworski, A.J. Numerical studies of co-axial travelling-wave thermo-acoustic cooler powered by standing-wave thermoacoustic engine. Renew. Energy 2019, 139, 600–610. [Google Scholar] [CrossRef]
- Rogoziński, K.; Nowak, I.; Nowak, G. Modeling the operation of a thermoacoustic engine. Energy 2017, 138, 249–256. [Google Scholar] [CrossRef]
- Bassem, M.M.; Ueda, Y.; Akisawa, A. Thermoacoustic Stirling Heat Pump Working as a Heater. Appl. Phys. Express 2011, 4, 107301. [Google Scholar] [CrossRef]
- Tijani, M.E.H.; Spoelstra, S. High Temperature Thermoacoustic Heat Pump. In Proceedings of the 19th International Congress on Sound and Vibration, Vilnius, Lithuania, 8–12 August 2012. [Google Scholar]
- Kikuchi, R.; Tsuda, K.; Bassem, M.M.; Ueda, Y. Measurement of performance of thermoacoustic heat pump in a −3 to 160 °C temperature range. Appl. Phys. Express 2015, 54, 117101. [Google Scholar] [CrossRef]
- Widyaparaga, A.; Koshimizu, T.; Noda, E.; Sakoda, N.; Kohno, M.; Takata, Y. The frequency dependent regenerator cold section and hot section positional reversal in a coaxial type thermoacoustic Stirling heat pump. Cryogenics 2011, 51, 591–597. [Google Scholar] [CrossRef]
- Rossing, T.D. (Ed.) Springer Handbook of Acoustics; Springer Science + Business Media LLC: New York, NY, USA, 2007. [Google Scholar]
- Rahpeima, R.; Ebrahimi, R. Numerical investigation of the effect of stack geometrical parameters and thermo-physical properties on performance of a standing wave thermoacoustic refrigerator. Appl. Therm. Eng. 2019, 149, 1203–1214. [Google Scholar] [CrossRef]
- Zhang, D.; Jiang, E.; Shen, C.; Zhou, J. Numerical analysis on thermoacoustic prime mover. J. Sound Vib. 2019, 463, 114946. [Google Scholar] [CrossRef]
- Kajurek, J.; Rusowicz, A.; Grzebielec, A. The Influence of Stack Position and Acoustic Frequency on the Performance of Thermoacoustic Refrigerator with the Standing Wave. Arch. Thermodyn. 2017, 38, 89–107. [Google Scholar] [CrossRef]
- Alamir, M.A. Experimental Study of the Temperature Variations in a Standing Wave Loudspeaker Driven Thermoacoustic Refrigerator. Therm. Sci. Eng. Prog. 2020, 17, 100361. [Google Scholar] [CrossRef]
- Hou, M.; Wu, Z.; Hu, J.; Zhang, L.; Luo, E. Experimental study on a thermoacoustic combined cooling and power technology for natural gas liquefaction. Energy Procedia 2019, 158, 2284–2289. [Google Scholar] [CrossRef]
- Alcock, A.C.; Tartibu, L.K.; Jen, T.C. Experimental investigation of an adjustable thermoacoustically-driven thermoacoustic refrigerator. Int. J. Refrig. 2018, 94, 71–86. [Google Scholar] [CrossRef]
- Yang, Z.; Yanyan, C.; Guoyao, Y.; Ercang, L.; Yuan, Z. Experimental Investigation on a Linear-compressor Driven Travelling-wave Thermoacoustic Heat Pump. Energy Procedia 2015, 75, 1844–1849. [Google Scholar] [CrossRef][Green Version]
- Harikumar, G.; Ho, K.H.; Wang, K.; Dubey, S.; Duan, F. Thermoacoustic energy conversion in a square duct. Energy Procedia 2019, 158, 1811–1816. [Google Scholar] [CrossRef]
- Ramadan, I.A.; Bailliet, H.; Poignand, G.; Gardner, D. Design, manufacturing and testing of a compact thermoacoustic refrigerator. Appl. Therm. Eng. 2021, 189, 116705. [Google Scholar] [CrossRef]
- Shivakumara, N.V.; Arya, B. Experimental Performance Evaluation of Thermoacoustic Refrigerator made up of Poly-Vinyl-Chloride for different Parallel Plate Stacks using Air as a working medium. Mater. Today: Proc. 2020, 22, 2160–2171. [Google Scholar] [CrossRef]
- Sun, Y.; Rao, Z.; Zhao, D.; Wang, B.; Sun, D.; Sun, X. Characterizing nonlinear dynamic features of self-sustained thermoacoustic oscillations in a premixed swirling combustor. Appl. Energy 2020, 264, 114698. [Google Scholar] [CrossRef]
- Wang, K.; Sun, D.; Xu, Y.; Shen, Q.; Zou, J.; Zhang, X.; Qiu, L. Experimental study on a 500 W traveling-wave thermoacoustic electric generator. Energy Procedia 2014, 61, 2271–2274. [Google Scholar] [CrossRef][Green Version]
- Jena, D.P.; Panigrahi, S.N. Numerically estimating acoustic transmission loss of a reactive muffler with and without mean flow. Measurement 2017, 109, 168–186. [Google Scholar] [CrossRef]
- Erriu, M.; Genta, G.; Ripa, D.M.; Buogo, S.; Pili, F.M.G.; Piras, V.; Barbato, G.; Levi, R. Ultra-sonic transparency of sonication tubes exposed to various frequencies: A metrological evaluation of modifications and uncertainty of acoustic pressures. Measurement 2016, 80, 148–153. [Google Scholar] [CrossRef]
- Palitó, T.T.C.; Assagra, Y.A.O.; Altafim, R.A.P.; Carmo, J.P.; Altafim, R.A.C. Low-cost electro-acoustic system based on ferroelectret transducer for characterizing liquids. Measurement 2019, 131, 42–49. [Google Scholar] [CrossRef]
- Mariel, P.; Hoyos, D.; Meyerhoff, J.; Czajkowski, M.; Dekker, T.; Glenk, K.; Jacobsen, J.B.; Liebe, U.; Olsen, S.B.; Sagebiel, J.; et al. Environmental Valuation with Discrete Choice Experiments. Springer Briefs in Economics; Springer: Cham, Switzerland, 2020. [Google Scholar]
- Dhiya, G.; Bhardwaj, K.K.; Ahlawat, I.; Verma, S. Role of experimental designs in agricultural research. In Proceedings of the National Seminar on Mathematics Day, Bhilai, India, 22 December 2020. [Google Scholar]
- Jambrak, A.R. What is the Purpose of Experimental Design? Experimental design of power ultrasound processing of food products. Food Process. Technol. 2011, 2, 1000102e. [Google Scholar]
- Hsu, D.K. Experimental Design for Mediation Tests. Acad. Manag. Annu. Meet. Proc. 2020, 1, 12657. [Google Scholar] [CrossRef]
- Kilkenny, C.; Parsons, N.; Kadyszewski, E.; Festing, M.F.W.; Cuthill, I.C.; Fry, D.; Hutton, J.L.; Altman, D. Survey of the Quality of Experimental Design, Statistical Analysis and Reporting of Research Using Animals. PLoS ONE 2009, 4, e7824. [Google Scholar] [CrossRef] [PubMed]
- Tarakanov, A.; Elsheikh, A.E. Optimal Bayesian experimental design for subsurface flow problems. Comput. Methods Appl. Mech. Eng. 2020, 370, 113208. [Google Scholar] [CrossRef]
- Azizi, D.; Gharabaghi, M.; Saeedi, N. Optimization of the coal flotation procedure using the Plackett–Burman design methodology and kinetic analysis. Fuel Process. Technol. 2014, 128, 111–118. [Google Scholar] [CrossRef]
- Bennett, K.; Chen, Y.-T. A two-level Plackett-Burman non-geometric experimental design for main and two factor interaction sensitivity analysis of zigzag-channel PCHEs. Therm. Sci. Eng. Prog. 2019, 11, 167–194. [Google Scholar] [CrossRef]
- Thiruchelvi, R.; Venkataraghavan, R.; Sharmila, D. Optimization of environmental parameters by Plackett-Burman design and response surface methodology for the adsorption of Malachite green onto Gracilaria edulis. Mater. Today Proc. 2021, 37, 1859–1864. [Google Scholar] [CrossRef]
- Li, M.; Eskridge, K.; Liu, E.; Wilkins, M. Enhancement of polyhydroxybutyrate (PHB) production by 10-fold from alkaline pretreatment liquor with an oxidative enzyme-mediator-surfactant system under Plackett-Burman and central composite designs. Bioresour. Technol. 2019, 281, 99–106. [Google Scholar] [CrossRef]
- Borges, P.R.S.; Tavares, E.G.; Guimarães, I.C.; de Paulo Rocha, R.; Araujo, A.B.S.; Nunes, E.E.; de Barros Vilas Boas, E.V. Obtaining a protocol for extraction of phenolics from açaí fruit pulp through Plackett–Burman design and response surface methodology. Food Chem. 2016, 210, 189–199. [Google Scholar] [CrossRef]
- Weinsstein, E.W. Discrete Fourier Transform, MathWorld—A Wolfram Web Resource. Available online: https://mathworld.wolfram.com/DiscreteFourierTransform.html (accessed on 23 May 2022).
- Oppenheim, A.V.; Shaefer, R. Discrete-Time Signal Processing; Prentice Hall: Upper Saddle River, NJ, USA, 2009. [Google Scholar]
- Prabhakar, D.V.N.; Kumar, M.S.; Krishna, A.G. A Novel Hybrid Transform approach with integration of Fast Fourier, Discrete Wavelet and Discrete Shearlet Transforms for prediction of surface roughness on machined surfaces. Measurement 2020, 164, 108011. [Google Scholar] [CrossRef]
- Chlanda, A.; Oberbek, P.; Heljak, M.; Kijeńska-Gawrońska, E.; Bolek, T.; Gloc, M.; John, Ł.; Janeta, M.; Woźniak, M.J. Fabrication, multi-scale characterization and In-Vitro evaluation of porous-hybrid bioactive glass polymer-coated scaffolds for bone tissue engineering. Mater. Sci. Eng. C 2019, 94, 516–523. [Google Scholar] [CrossRef]
- Vashisht, R.K.; Peng, Q. Crack detection in the rotor ball bearing system using switching control strategy and Short Time Fourier Transform. J. Sound Vib. 2018, 432, 502–529. [Google Scholar] [CrossRef]
- Belega, D.; Petri, D.; Dallet, D. Accurate frequency estimation of a noisy sine-wave by means of an interpolated discrete-time Fourier transform algorithm. Measurement 2018, 116, 685–691. [Google Scholar] [CrossRef]
- Yao, J.; Tang, B.; Zhao, J. Improved discrete Fourier transform algorithm for harmonic analysis of rotor system. Measurement 2016, 83, 57–71. [Google Scholar] [CrossRef]
- Berryman, F.; Pynsent, P.; Cubillo, J. The effect of windowing in Fourier transform profilometry applied to noisy images. Opt. Lasers Eng. 2004, 41, 815–825. [Google Scholar] [CrossRef]
- Mohapatra, B.N.; Mohapatra, R.K. Performance Analysis on frequency response of Finite Impulse Response Filter. Procedia Comput. Sci. 2016, 79, 729–736. [Google Scholar] [CrossRef][Green Version]
- Carbalho, B.M.; Herman, G.T. Low-dose, large-angled cone-beam helical CT data reconstruction using algebraic reconstruction techniques. Image Vis. Comput. 2007, 25, 78–94. [Google Scholar] [CrossRef]
- Das, L.; Nanda, S.; Das, J.K. An integrated approach for identification of exon locations using recursive Gauss Newton tuned adaptive Kaiser window. Genomics 2019, 111, 284–296. [Google Scholar] [CrossRef] [PubMed]
- Randall, R.B. A history of cepstrum analysis and its application to mechanical problems. Mech. Syst. Signal Process. 2017, 97, 3–19. [Google Scholar] [CrossRef]
- Randall, R.B.; Antoni, J.; Smith, W.A. A survey of the application of the cepstrum to structural modal analysis. Mech. Syst. Signal Process. 2019, 118, 716–741. [Google Scholar] [CrossRef]
- Liang, B.; Iwnicki, S.D.; Zhao, Y. Application of power spectrum, cepstrum, higher order spectrum and neural network analyses for induction motor fault diagnosis. Mech. Syst. Signal Process. 2013, 39, 342–360. [Google Scholar] [CrossRef]
- Jafari, M.; Verma, P.; Zare, A.; Borghesani, P.; Bodisco, T.A.; Ristovski, Z.D.; Brown, R.J. In-cylinder pressure reconstruction by engine acoustic emission. Mech. Syst. Signal Process. 2021, 152, 107490. [Google Scholar] [CrossRef]
- Gudra, T.; Opielinski, K.J. Applying spectrum analysis and cepstrum analysis to examine the cavitation threshold in water and in salt solution. Ultrasonics 2004, 42, 621–627. [Google Scholar] [CrossRef] [PubMed]
- Kawamura, Y.; Tsurushima, M.; Ito, Y.; Mizutani, K.; Yamachika, S.; Aoshima, N.; Ha, E. Fundamental study on ultrasonic measurement system to detect penetration of boulders using cepstrum analysis. Ultrasonics 2007, 46, 266–269. [Google Scholar] [CrossRef] [PubMed]
- Bonnardot, F. Influence of speed fluctuation on cepstrum. Mech. Syst. Signal Process. 2019, 119, 81–99. [Google Scholar] [CrossRef]
- Rorabacher, D.B. Statistical Treatment for Rejection of Deviant Values: Critical Values of Dixon Q Parameter and Related Subrange Ratios at the 95 Percent Confidence Level. Anal. Chem. 1991, 63, 139–146. [Google Scholar] [CrossRef]
- Grubbs, F.E. Sample criteria for testing outlying observations. Ann. Math. Stat. 1950, 21, 27–58. [Google Scholar] [CrossRef]
- Jain, R.B. A recursive version of Grubbs’ test for detecting multiple outliers in environmental and chemical data. Clin. Biochem. 2010, 43, 1030–1033. [Google Scholar] [CrossRef]
- Aslam, M. Introducing Grubbs’s test for detecting outliers under neutrosophic statistics—An application to medical data. J. King Saud Univ.-Sci. 2020, 32, 2696–2700. [Google Scholar] [CrossRef]
- Xu, C.; Chen, H. Abnormal energy consumption detection for GSHP system based on ensemble deep learning and statistical modeling method. Int. J. Refrig. 2020, 114, 106–117. [Google Scholar] [CrossRef]
- Krawczyk, A.; Słomka, T. Podstawowe metody modelowania w geologii [Basic Modelling Methods in Geology]. In Materiały Pomocnicze do Ćwiczeń [Auxiliary Materials for Classes]; Wydawnictwo AGH: Kraków, Poland, 1982. [Google Scholar]
- Saeed, M.A.; Ahmed, Z.; Zhang, W. Optimal approach for wind resource assessment using Kolmogorov-Smirnov statistic: A case study for large-scale wind farm in Pakistan. Renew. Energy 2021, 168, 1229–1248. [Google Scholar] [CrossRef]
- Tomášik, B.; Melo, I.; Torrieri, G.; Vogel, S.; Bleicher, M. The use of Kolmogorov-Smirnov test in event-by-event analysis. Nucl. Phys. A 2009, 830, 195c–198c. [Google Scholar] [CrossRef]
- Chen, H.X.; Chua, P.S.K.; Lim, G.H. Fault degradation assessment of water hydraulic motor by impulse vibration signal with Wavelet Packet Analysis and Kolmogorov–Smirnov Test. Mech. Syst. Signal Process. 2008, 22, 1670–1684. [Google Scholar] [CrossRef]
- Wang, X.; Makis, V. Autoregressive model-based gear shaft fault diagnosis using the Kolmogorov–Smirnov test. J. Sound Vib. 2009, 327, 413–423. [Google Scholar] [CrossRef]
- Wang, K.; Tao, S.; Li, Z.; Li, X.; Tang, L.; Chen, G. Investigation on the hysteresis behavior of a quarter-wavelength standing-wave thermoacoustic engine. Int. J. Mech. Sci. 2025, 290, 110084. [Google Scholar] [CrossRef]
- Yahya, S.G.; Hamood, A.; Jaworski, A.J.; Mao, X. Development of a two-stage thermoacoustic refrigerator prototype. Int. J. Thermofluids 2024, 24, 100903. [Google Scholar] [CrossRef]
- Pierens, M.; Thermeau, J.P.; Le Polles, T.; Duthill, P. Development of a thermoacoustic travelling-wave refrigerator. In Proceedings of the Scoustics 2012 Nantes Conference, Nantes, France, 23–27 April 2012. [Google Scholar]
- Chen, G.; Wang, K.; Tao, S.; Gao, L.; Xu, J.; Tang, L. Experimental study on the cooling performances of thermoacoustic heat exchangers International. J. Heat Mass Transf. 2025, 241, 125759. [Google Scholar] [CrossRef]
- Mugisho, P.; Tartibu, L. Development of a thermoacoustically-driven thermoacoustic refrigerator powered by residual heat, International. J. Eng. Trends Technol. 2025, 73, 192–206. [Google Scholar] [CrossRef]
- Chen, G.; Tang, L.; Mace, B.; Yu, Z. Multi-physics coupling in thermoacoustic devices: A review. Renew. Sustain. Energy Rev. 2021, 146, 111170. [Google Scholar] [CrossRef]
- GHM Group. Basics of Precision Temperature Measuring with Pt100-Probes. In Informational Brochure GHM Group; Greisinger: Jenins, Switzerland, 2020. [Google Scholar]
- PN-EN 60751:1997+A2:2010; Industrial Platinum Resistance Thermometers. Polish Committee for Standardization (PKN): Warsaw, Poland, 2010.
- Kulka, Z.; Libura, A.; Nadachowski, M. Przetworniki Analogowo-Cyfrowe i Cyfrowo-Analogowe [Analog-to-Digital and Digital-to-Analog Converters]; Wydawnictwa Komunikacji i Łączności: Warszawa, Poland, 1987. [Google Scholar]
- Nellis, G.F.; Klein, S.A. Heat Transfer; Cambridge University Press: London, UK, 2009. [Google Scholar]
- Aygün, H.; Attenborough, K.; Lauriks, W.; Langton, C.M. Ultrasonic wave propagation in Stereo-lithographical bone replicas. J. Acoust. Soc. Am. 2010, 127, 3781–3789. [Google Scholar] [CrossRef]
- Aygün, H.; Attenborough, K.; Lauriks, W.; Rubini, P.A.; Langton, C.M. Wave propagation in stereo-lithographical bone replicas at oblique incidence. Appl. Acoust. 2011, 72, 458–463. [Google Scholar] [CrossRef]
- Challenge Electronics. CEM-C9745 JAD462P2.54R Omni-Directional Foil Electret Condenser Microphone. In Product Brochure; Challenge Electronics: Deer Park, NY, USA, 2010. [Google Scholar]
- Fairchild Semiconductor. LMV321, LMV358, LMV324 General Purpose, Low Voltage, Rail-to-Rail Output Amplifiers. In Product Brochure; Fairchild Semiconductor: Sunnyvale, CA, USA, 2012. [Google Scholar]
- SFAR. SDM-8AI Expansion Module—8 Analog Inputs. In Product Brochure; SFAR: Gdynia, Poland, 2014. [Google Scholar]
- Korzyński, M. Metodyka Eksperymentu: Planowanie, Realizacja i Statystyczne Opracowanie Wyników Eksperymentów Technologicznych [Experimental Design Methodology: Planning, Implementation and Statistical Processing of the Results of Technological Experiments]; Wydawnictwa Naukowo-Techniczne: Warszawa, Poland, 2006. [Google Scholar]
- Casler, M.D. Fundamentals of Experimental Design: Guidelines for Designing Successful Experiments. Agronomy 2015, 107, 692–705. [Google Scholar] [CrossRef]
- Wiik, H.E. Methods for Analying the 12 Run Plackett-Burman Design. Master’s Thesis, Norwegian University of Science and Technology, Trondheim, Norway, 2014. [Google Scholar]
- Quinlan, K.R.; Lin, D.K.J. Run order considerations for Plackett and Burman designs. J. Stat. Plan. Inference 2015, 165, 56–62. [Google Scholar] [CrossRef]
- Vanaja, K.; Shobha Rani, R.H. Design of Experiments: Concept and Application of Plackett Burman Design. Clin. Res. Regul. Aff. 2007, 24, 1–23. [Google Scholar] [CrossRef]
- Spoelstra, S. Thermoacoustic Technology for Energy Applications. In Final Report; Energy research Centre of the Netherlands: Petten, The Netherlands, 2012. [Google Scholar]
- Smith, J.O. Spectral Audio Signal Processing; Stanford University: Stanford, CA, USA, 2011. [Google Scholar]


Disclaimer/Publisher’s Note: The statements, opinions and data contained in all publications are solely those of the individual author(s) and contributor(s) and not of MDPI and/or the editor(s). MDPI and/or the editor(s) disclaim responsibility for any injury to people or property resulting from any ideas, methods, instructions or products referred to in the content. |
© 2025 by the authors. Licensee MDPI, Basel, Switzerland. This article is an open access article distributed under the terms and conditions of the Creative Commons Attribution (CC BY) license (https://creativecommons.org/licenses/by/4.0/).