
Evaluating the Suitability of Ground-Mounted Photovoltaic System Selection and the Differences Between Expert Assessments and Firm Location Preferences: A Case Study of Tainan City


Abstract
1. Introduction
- Review the history of PV system applications across various countries for a comprehensive understanding of the experiences and challenges encountered during their implementation. The study also categorizes the evaluation criteria for PV system site selection, in order to develop an evaluation model for site selection.
- Examine existing PV sites, utilizing the established evaluation model to analyze the discrepancies between the theoretical model and real-world applications. Based on these findings, the study provides recommendations and solutions for future deployment of PV system.
2. Literature Review
2.1. The Rise of Renewable Energy and Solar Energy
2.2. Current Status of PV Development and Key Factors in Site Selection
2.3. Research Methods for PV Site Selection
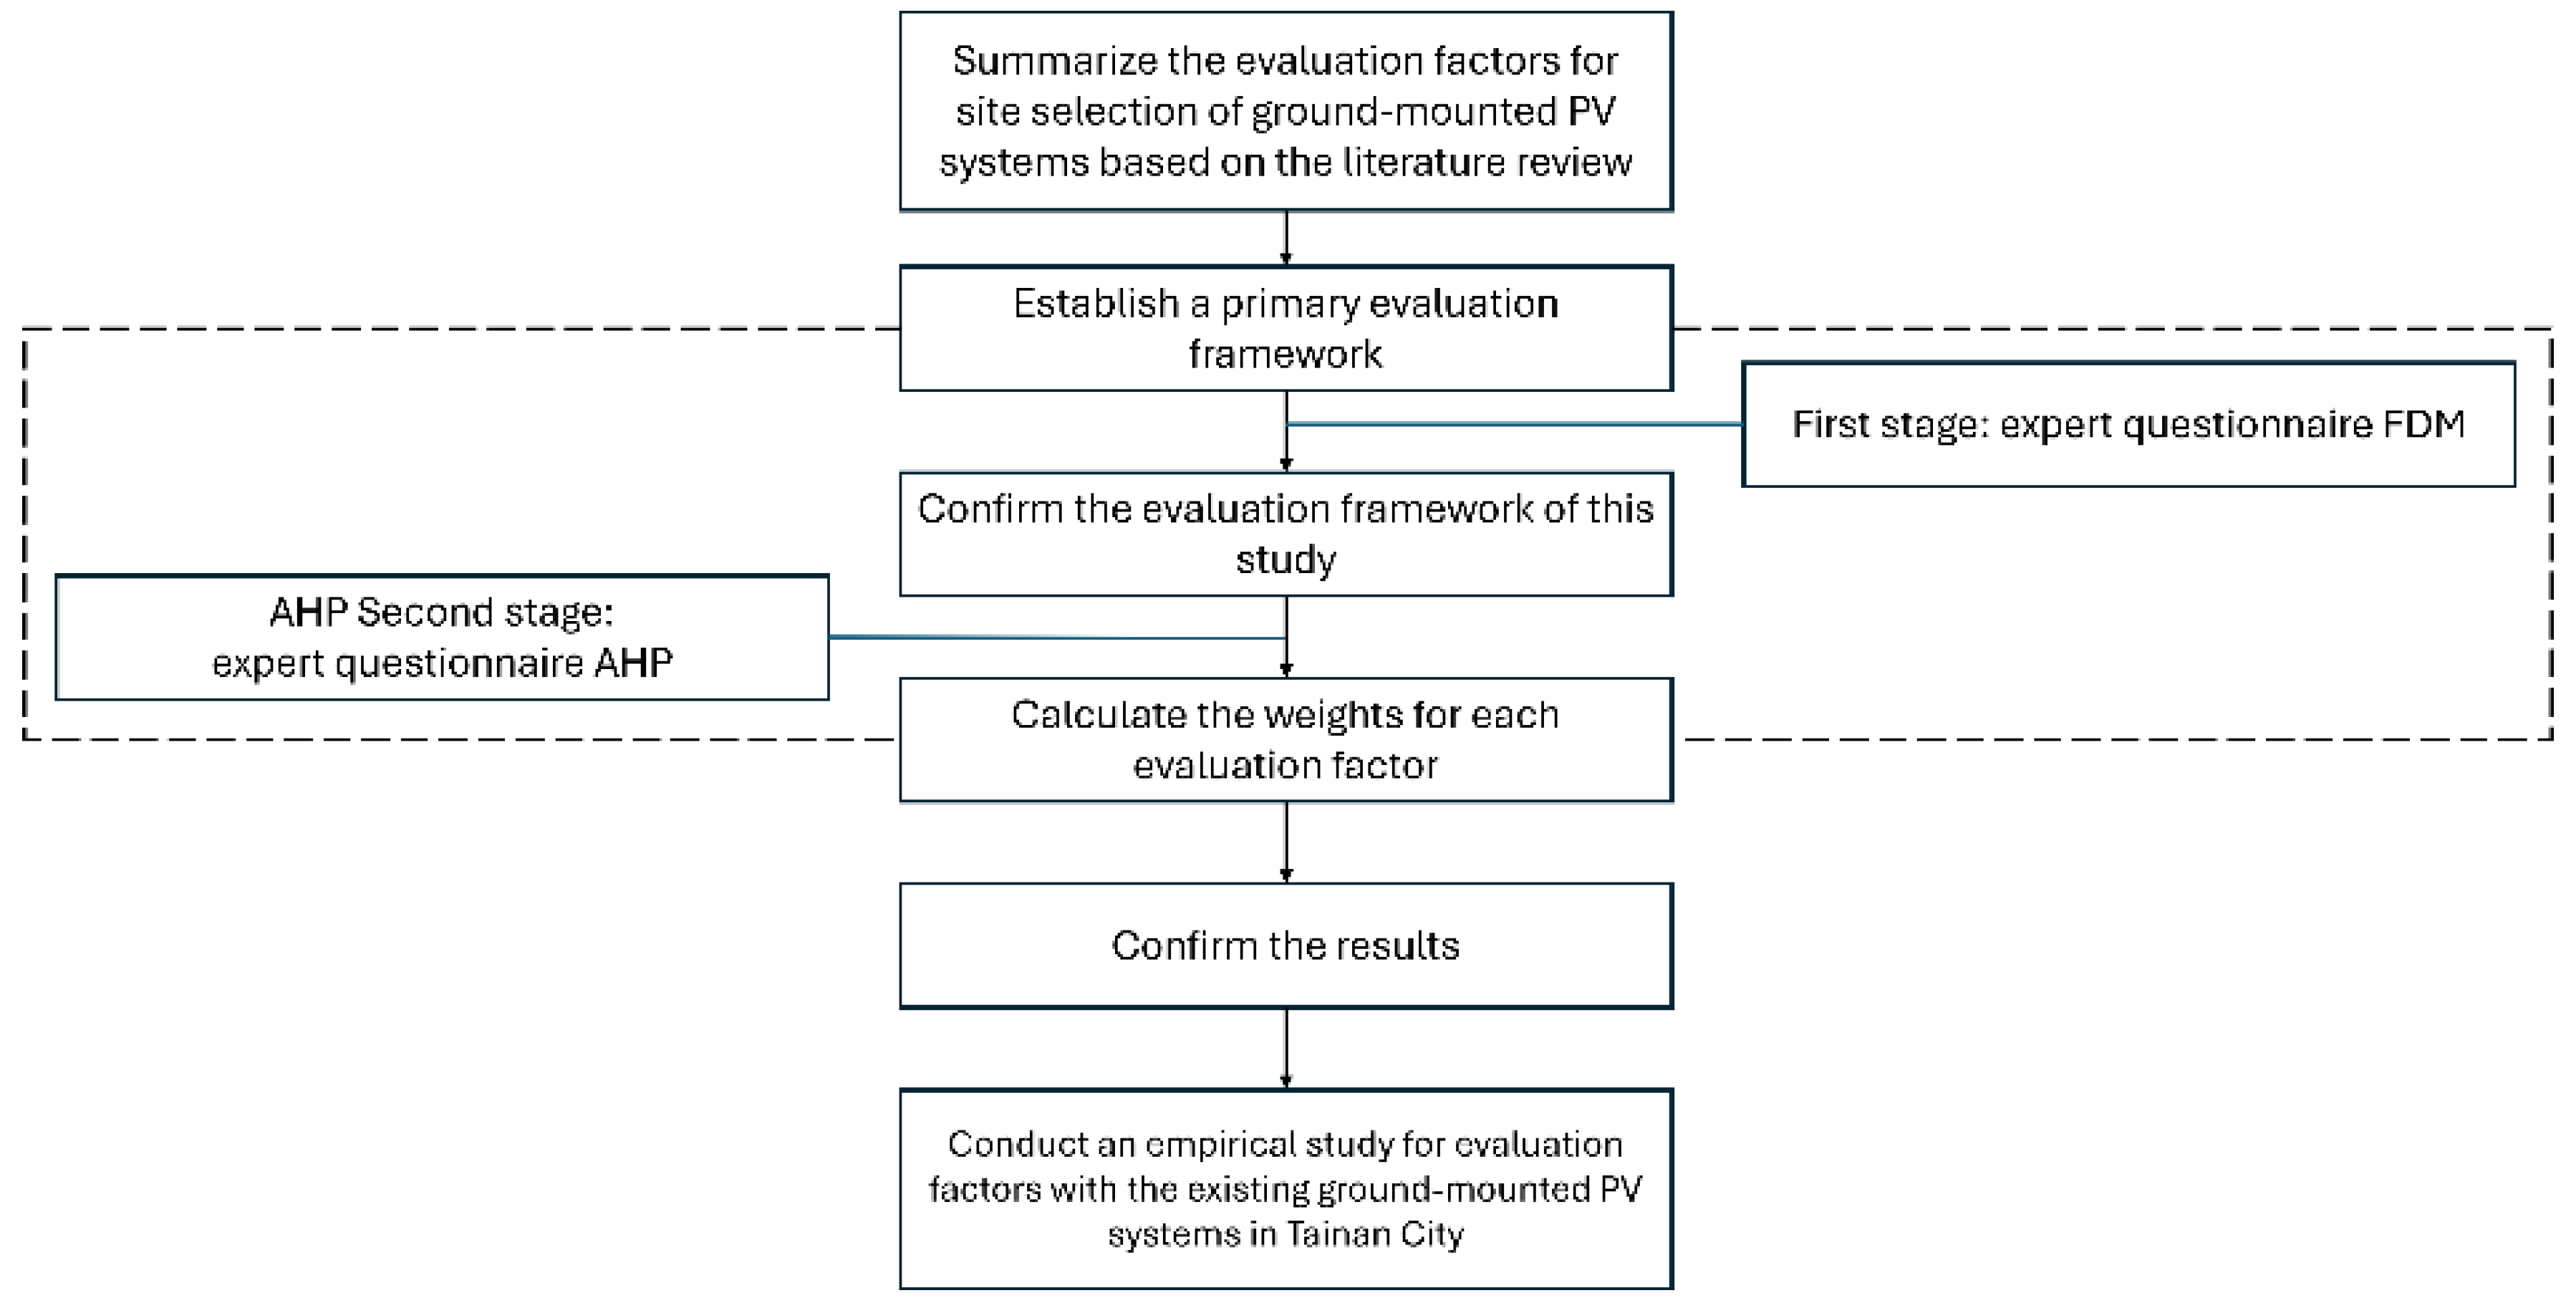
3. Research Design
3.1. Research Methods
3.2. Delphi Method (DM)
3.3. Analytic Hierarchy Process (AHP)
4. Case Study
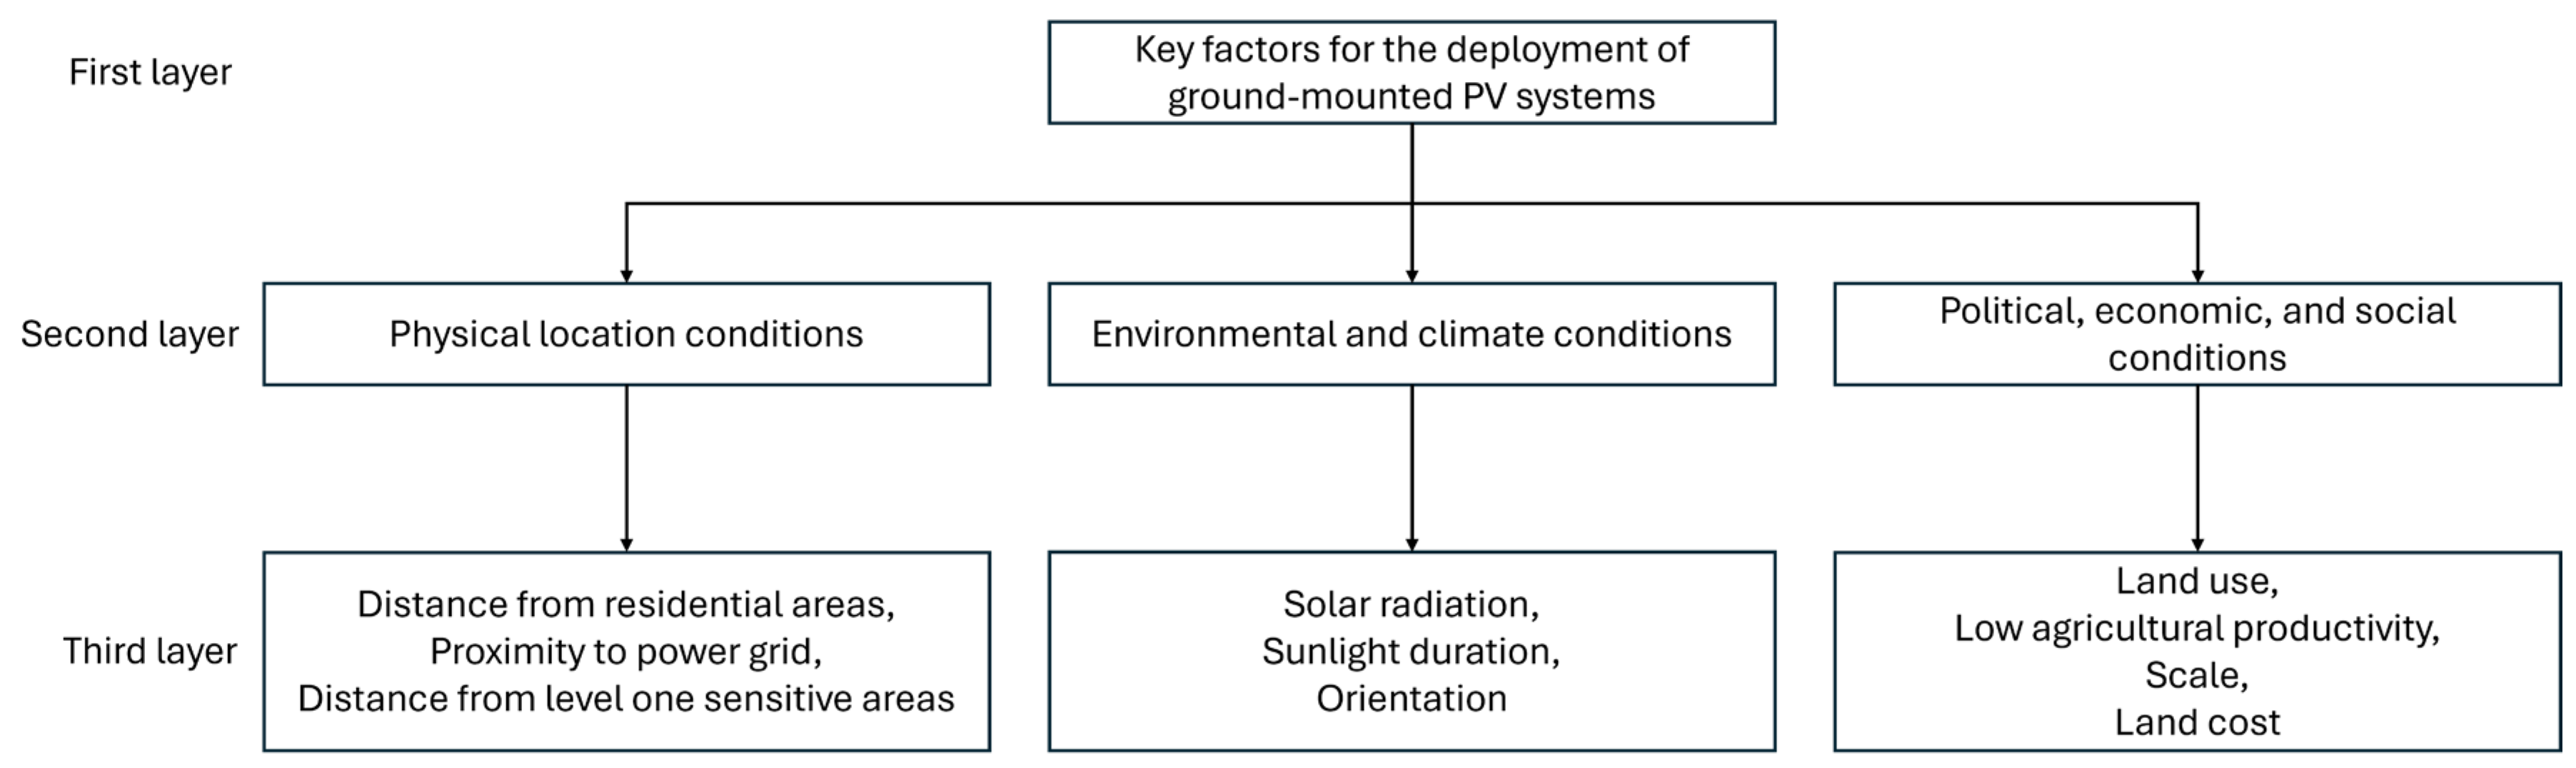
4.1. Establishment of the Evaluation Model
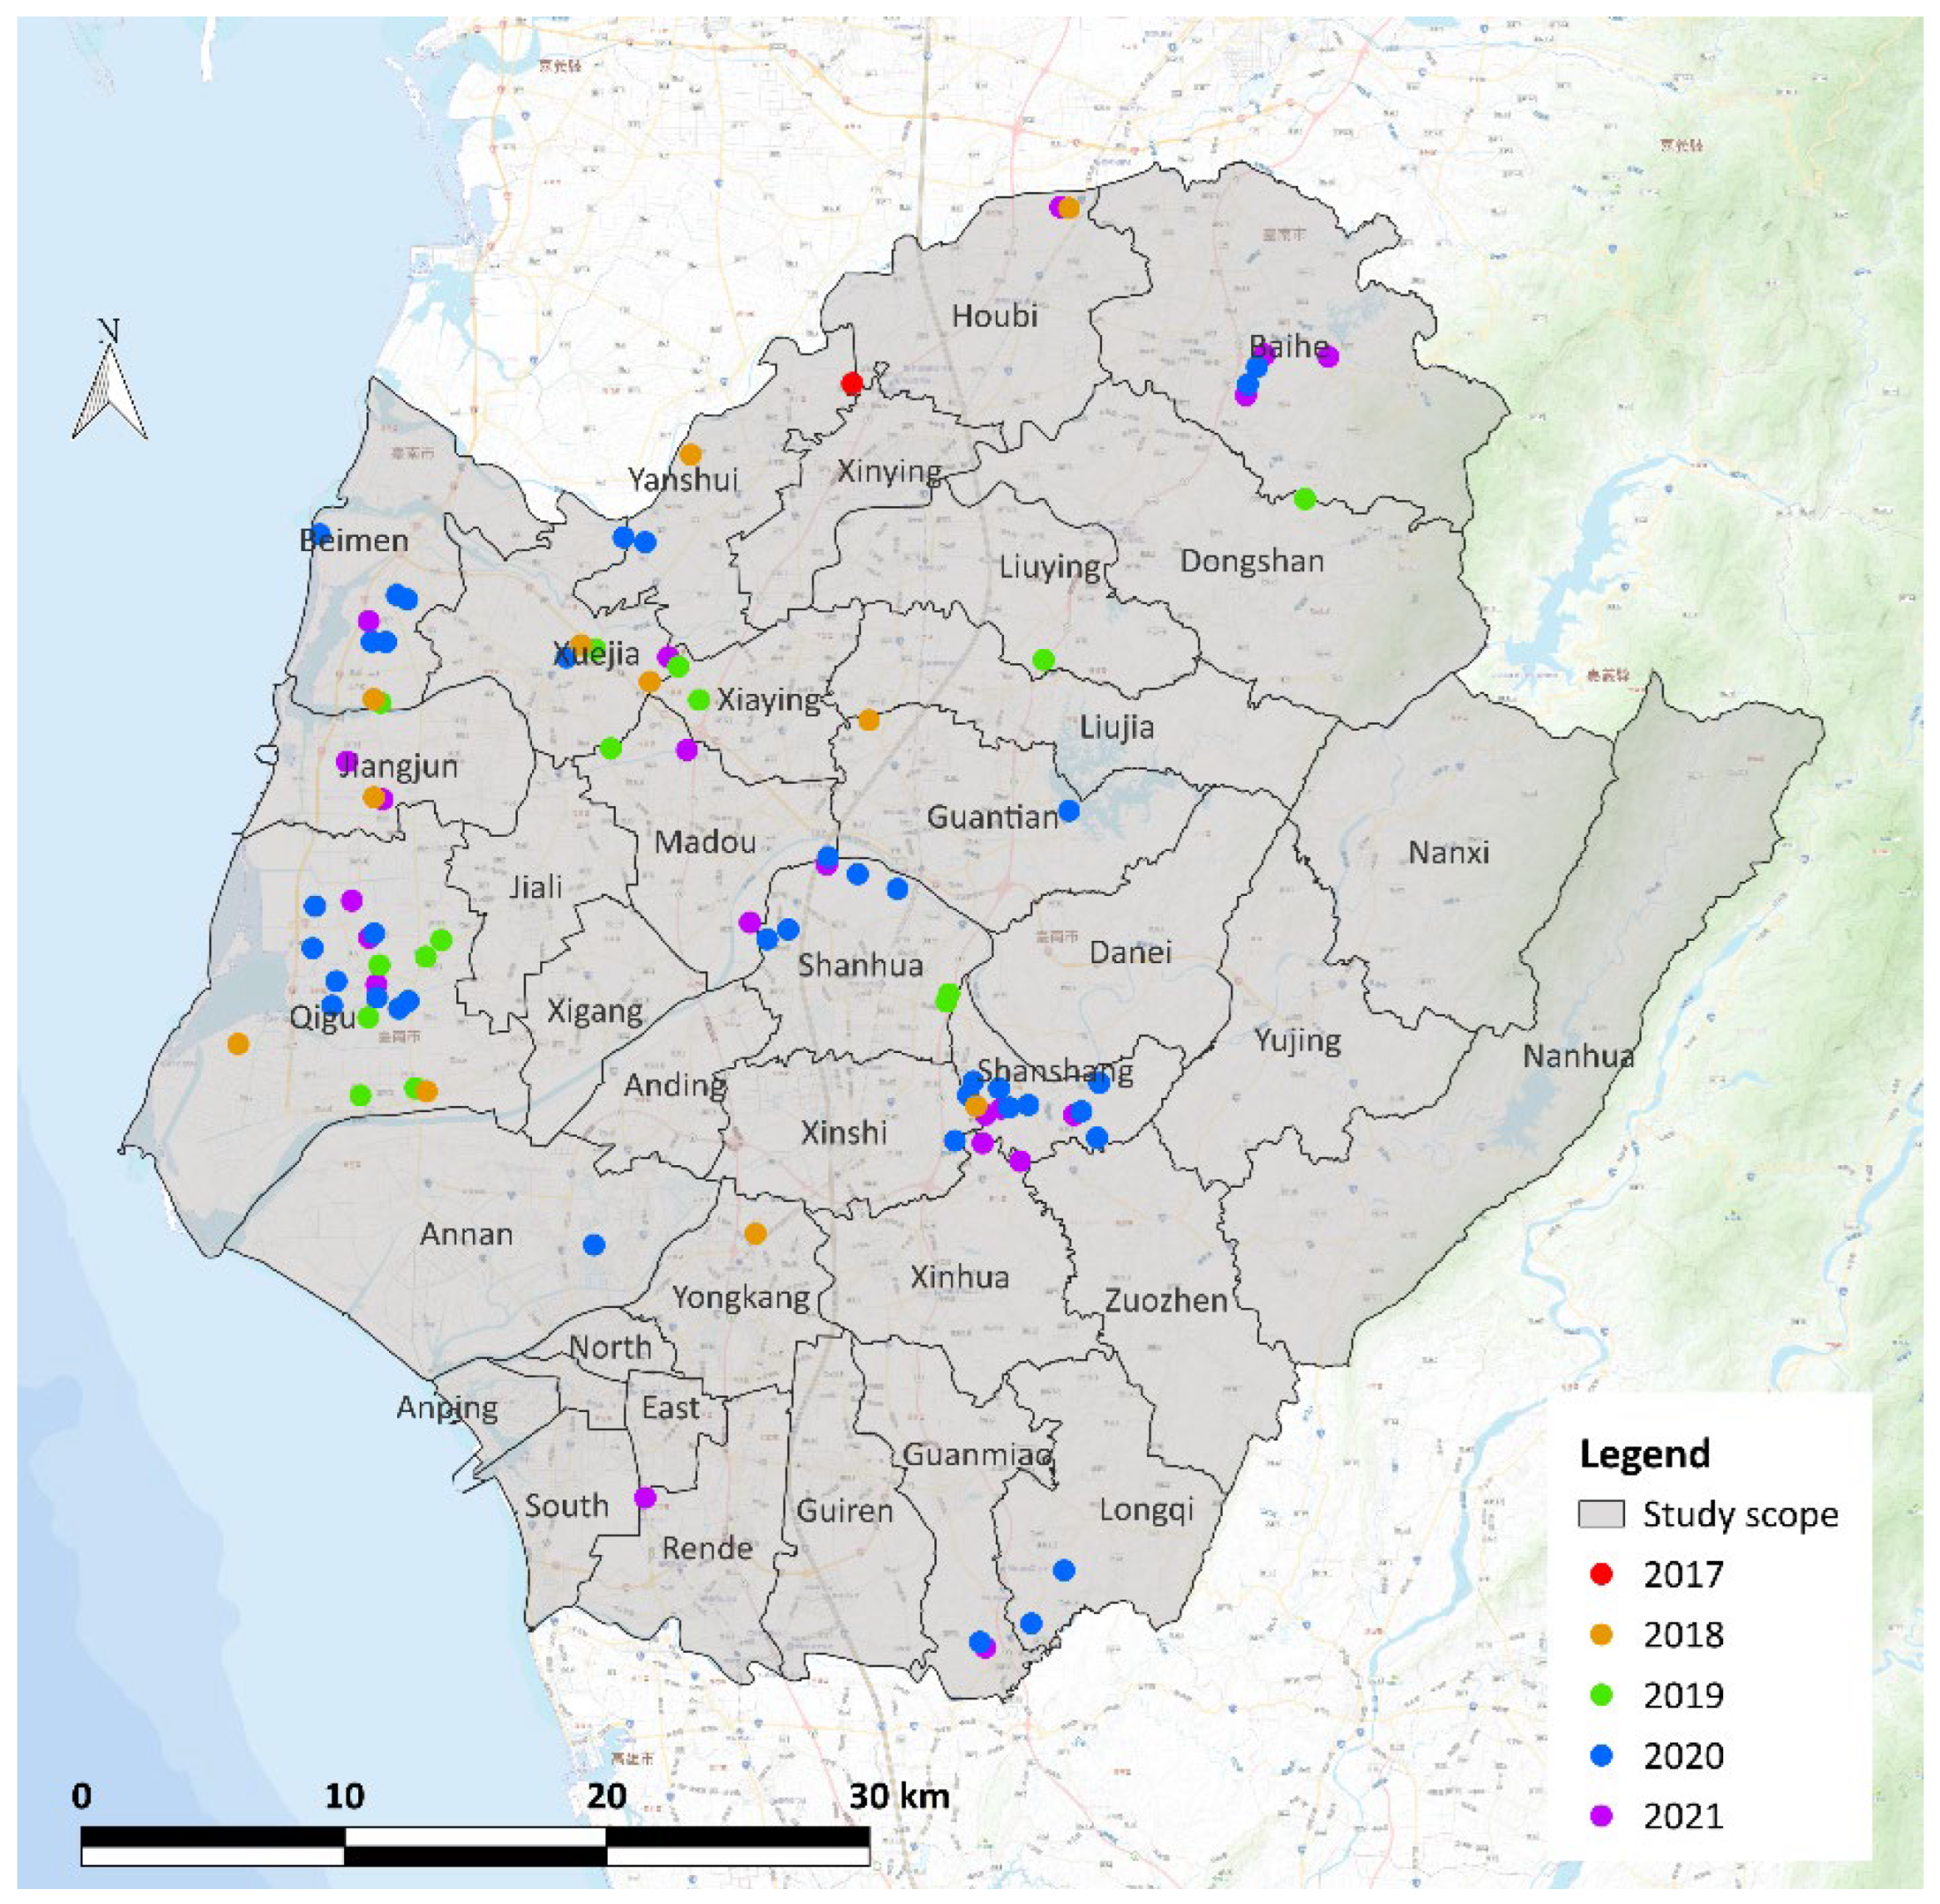
4.2. Existing PV Sites in Tainan City
4.3. Empirical Results and Discussion
5. Discussion, Conclusions and Suggestions
Author Contributions
Funding
Data Availability Statement
Acknowledgments
Conflicts of Interest
References
- Stocker, T. Climate change 2013: The Physical Science Basis: Working Group I Contribution to the Fifth Assessment Report of the Intergovernmental Panel on Climate Change; Cambridge University Press: Cambridge, UK, 2014. [Google Scholar]
- UN-Habitat. Urban Planning Law for Climate Smart Cities; Urban Law Module: Nairobi, Kenya, 2022. [Google Scholar]
- Pan, S.-C.; Fan, P.; Hu, T.-S.; Li, H.-Y.; Liu, W.-S. An Anticipatory Practice for the Future of Science Parks: Understanding the Indices and Mechanisms on Different Spatial Scales of Regional Innovation Systems. Sustainability 2024, 16, 4600. [Google Scholar] [CrossRef]
- Pan, S.-C.; Hu, T.-S.; You, J.-X.; Chang, S.-L. Characteristics and influencing factors of economic resilience in industrial parks. Heliyon 2023, 9, e14812. [Google Scholar] [CrossRef]
- Luo, L.H. When Farmland is Planted with Electricity—A Brief Discussion on the Impact of Setting up Solar Photovoltaic Facilities in the Scope of Agricultural Land. Sci. Technol. Policy Perspect. 2020, 10, 48–60. [Google Scholar]
- Set the System Type. Single Service Window for Solar Photovoltaics. 6 January 2023. Available online: https://www.mrpv.org.tw/Article/PubArticle.aspx?type=setup_info&post_id=61 (accessed on 17 February 2023).
- NRDC. Renewable Energy: The Clean Facts. 2022. Available online: https://www.nrdc.org/stories/renewable-energy-clean-facts (accessed on 24 July 2023).
- Guaita-Pradas, I.; Marques-Perez, I.; Gallego, A.; Segura, B. Analyzing territory for the sustainable development of solar photovoltaic power using GIS databases. Environ. Monit. Assess. 2019, 191, 764. [Google Scholar] [CrossRef]
- Dresselhaus, M.S.; Thomas, I.L. Alternative energy technologies. Nature 2001, 414, 332–337. [Google Scholar] [CrossRef]
- Mohtasham, J. Review Article-Renewable Energies. Energy Procedia 2015, 74, 1289–1297. [Google Scholar] [CrossRef]
- Bhuyan, G.S. World-wide status for harnessing ocean renewable resources. In Proceedings of the IEEE PES General Meeting, Minneapolis, MN, USA, 25–29 July 2010. [Google Scholar]
- Ellabban, O.; Abu-Rub, H.; Blaabjerg, F. Renewable energy resources: Current status, future prospects and their enabling technology. Renew. Sustain. Energy Rev. 2014, 39, 748–764. [Google Scholar] [CrossRef]
- Ding, M.; Xu, Z.; Wang, W.; Wang, X.; Song, Y.; Chen, D. A review on China’s large-scale PV integration: Progress, challenges and recommendations. Renew. Sustain. Energy Rev. 2016, 53, 639–652. [Google Scholar] [CrossRef]
- Wang, T.; Wu, G.; Chen, J.; Cui, P.; Chen, Z.; Yan, Y.; Zhang, Y.; Li, M.; Niu, D.; Li, B.; et al. Integration of solar technology to modern greenhouse in China: Current status, challenges and prospect. Renew. Sustain. Energy Rev. 2017, 70, 1178–1188. [Google Scholar] [CrossRef]
- Li, C.; Wang, H.; Miao, H.; Ye, B. The economic and social performance of integrated photovoltaic and agricultural greenhouses systems: Case study in China. Appl. Energy 2017, 190, 204–212. [Google Scholar] [CrossRef]
- Hernandez, R.R.; Easter, S.B.; Murphy-Mariscal, M.L.; Maestre, F.T.; Tavassoli, M.; Allen, E.B.; Barrows, C.W.; Belnap, J.; Ochoa-Hueso, R.; Ravi, S.; et al. Environmental impacts of utility-scale solar energy. Renew. Sustain. Energy Rev. 2014, 29, 766–779. [Google Scholar] [CrossRef]
- Wen, D.; Gao, W.; Qian, F.; Gu, Q.; Ren, J. Development of solar photovoltaic industry and market in China, Germany, Japan and the United States of America using incentive policies. Energy Explor. Exploit. 2021, 39, 1429–1456. [Google Scholar] [CrossRef]
- Sindhu, S.; Nehra, V.; Luthra, S. Investigation of feasibility study of solar farms deployment using hybrid AHP-TOPSIS analysis: Case study of India. Renew. Sustain. Energy Rev. 2017, 73, 496–511. [Google Scholar] [CrossRef]
- Guptha, R.; Puppala, H.; Kanuganti, S. Integrating fuzzy AHP and GIS to prioritize sites for the solar plant installation. In Proceedings of the 12th International Conference on Fuzzy Systems and Knowledge Discovery (FSKD), Zhangjiajie, China, 15–17 August 2015. [Google Scholar]
- Castillo, C.P.; e Silva, F.B.; Lavalle, C. An assessment of the regional potential for solar power generation in EU-28. Energy Policy 2016, 88, 86–99. [Google Scholar] [CrossRef]
- Merrouni, A.A.; Elalaoui, F.E.; Mezrhab, A.; Mezrhab, A.; Ghennioui, A. Large scale PV sites selection by combining GIS and Analytical Hierarchy Process. Case study: Eastern Morocco. Renew. Energy 2018, 119, 863–873. [Google Scholar] [CrossRef]
- Wang, C.-N.; Dang, T.-T.; Bayer, J. A two-stage multiple criteria decision making for site selection of solar photovoltaic (PV) power plant: A case study in Taiwan. IEEE Access 2021, 9, 75509–75525. [Google Scholar] [CrossRef]
- Palmer, D.; Gottschalg, R.; Betts, T. The future scope of large-scale solar in the UK: Site suitability and target analysis. Renew. Energy 2019, 133, 1136–1146. [Google Scholar] [CrossRef]
- Yousefi, H.; Hafeznia, H.; Yousefi-Sahzabi, A. Spatial site selection for solar power plants using a gis-based boolean-fuzzy logic model: A case study of Markazi Province, Iran. Energies 2018, 11, 1648. [Google Scholar] [CrossRef]
- Rediske, G.; Siluk, J.C.M.; Gastaldo, N.G.; Rigo, P.D.; Rosa, C.B. Determinant factors in site selection for photovoltaic projects: A systematic review. Int. J. Energy Res. 2019, 43, 1689–1701. [Google Scholar] [CrossRef]
- Sabo, M.L.; Mariun, N.; Hizam, H.; Radzi, M.A.M.; Zakaria, A. Spatial matching of large-scale grid-connected photovoltaic power generation with utility demand in Peninsular Malaysia. Appl. Energy 2017, 191, 663–688. [Google Scholar] [CrossRef]
- Sánchez-Lozano, J.; García-Cascales, M.S.; Lamata, M.T. Comparative TOPSIS-ELECTRE TRI methods for optimal sites for photovoltaic solar farms. Case study in Spain. J. Clean. Prod. 2016, 127, 387–398. [Google Scholar] [CrossRef]
- Colak, H.E.; Memisoglu, T.; Gercek, Y. Optimal site selection for solar photovoltaic (PV) power plants using GIS and AHP: A case study of Malatya Province, Turkey. Renew. Energy 2020, 149, 565–576. [Google Scholar] [CrossRef]
- Vagiona, D.G. Comparative Multicriteria Analysis methods for ranking sites for solar farm deployment: A Case study in Greece. Energies 2021, 14, 8371. [Google Scholar] [CrossRef]
- Saaty, R.W. The analytic hierarchy process—What it is and how it is used. Math. Model. 1987, 9, 161–176. [Google Scholar] [CrossRef]
- Feng, C.M.; Lin, J.J. Methods of Urban and Regional Analysis, 2nd ed.; Jiandu Culture: Hsinchu County, Taiwan, 2008. [Google Scholar]
- Wang, G.; Qin, L.; Li, G.; Chen, L. Landfill site selection using spatial information technologies and AHP: A case study in Beijing, China. J. Environ. Manag. 2009, 90, 2414–2421. [Google Scholar] [CrossRef]
- Shao, M.; Han, Z.; Sun, J.; Xiao, C.; Zhang, S.; Zhao, Y. A review of multi-criteria decision making applications for renewable energy site selection. Renew. Energy 2020, 157, 377–403. [Google Scholar] [CrossRef]
- Zheng, T.B. A Fuzzy Assessment Model for the Maturity of Software Organizations to Enhance Personnel Capabilities. Master’s Thesis, Graduate Institute of Information Management, Department of Information Management, National Taiwan University of Science and Technology, Taipei, Taiwan, 2001. [Google Scholar]
- Bureau of Energy, Ministry of Economic Affairs. International Renewable Energy Development Trends and Policies. 2 June 2021. Available online: https://www.re.org.tw/knowledge/more.aspx?cid=201&id=3966 (accessed on 26 July 2022).
- Lin, H.-P.; Hu, T.-S. Knowledge interaction and spatial dynamics in industrial districts. Sustainability 2017, 9, 1421. [Google Scholar] [CrossRef]
- Okoli, C.; Pawlowski, S.D. The Delphi method as a research tool: An example, design considerations and applications. Inf. Manag. 2004, 42, 15–29. [Google Scholar] [CrossRef]

| Type of Source | Advantage | Disadvantage |
|---|---|---|
| Hydropower |
|
|
| Solar energy |
| |
| Wind power |
|
|
| Biomass |
|
|
| Geothermal |
|
|
| Ocean energy |
|
|
| Perspective | Evaluation Factor |
|---|---|
| Physical Location Conditions | 1-1 Population density: The demand of electricity is closely related to population size. PV systems installed in areas with high population densities can serve a large number of people [19]. Thus, population density and its potential of energy demand is a significant evaluation factor. |
| 1-2 Distance from residential areas: Large PV systems are unsuitable near residential zones, as they may interfere with urban development [18]. In cases where PV systems need to be installed in densely populated areas, buffer zones or other strategies should be considered to minimize the impact on residents [20]. | |
| 1-3 Proximity to road networks: Because PV systems require access during installation and for subsequent maintenance activities, it is generally advisable to locate them in areas with easy access to transportation [21]. | |
| 1-4 Proximity to power grid: The distance between PV systems and the power grid can hinder the efficient supply of renewable energy, due to energy losses occur in transmission [7]. Thus, the proximity of PV systems to the power grid is a critical factor for PV site selection. | |
| 1-5 Distance from protected areas: Installing artificial infrastructure in the regions with abundant natural resources can disrupt bird migration and lead to deforestation, which further threatens wildlife [7]. Accordingly, such sensitive environmental areas are typically considered inappropriate for the development of solar power systems in many countries [20]. | |
| Environmental & Climate Conditions | 2-1 Air temperature: While abundant sunlight is a favorable condition to PV systems, excessive sunlight can lead to overheating, which reduces the efficiency and output of the systems [22]. |
| 2-2 Relative humidity: When the water vapor in the air reaches saturation and condenses on the surface of solar panels, the resulting dew enhances the accumulation of dust, which reduces the efficiency of power generation [22]. | |
| 2-3 Solar radiation: The amount of solar radiation required to meet the threshold for developing ground-mounted PV systems depends on the evaluation criteria in different countries. This factor influences the subsequent cost-effectiveness calculations for deployment [23]. | |
| 2-4 Sunlight duration: Sunlight is an intermittent energy resource, and the total power generated by PV systems is determined by the daily duration of sunlight exposure [22]. | |
| 2-5 Wind speed: Strong wind conditions may result in the misalignment of photovoltaic panels from their originally designed orientation [19]. In more severe cases, strong winds may damage the panels [22]. | |
| 2-6 Elevation: Installing PV systems in high-altitude areas not only increases construction difficulties but also raises the construction costs and affects power transmission [7,24]. | |
| 2-7 Slope: The land slope can affect the efficiency of power generation from PV systems. When solar panels are installed on steep slopes, they may block each other, reducing the overall power output. | |
| 2-8 Orientation: For optimal radiation absorption, panels should be aligned with the direction of sunlight. In the Southern Hemisphere, panels should face geographic north, while in the Northern Hemisphere, they should face geographic south [25]. | |
| Political, Economic, and Social Conditions | 3-1 Land use: Land use is one of the most influential factors for PV site selection [26]. Areas with certain land uses are unsuitable for the installation of PV system. |
| 3-2 Low agricultural productivity: Land with potential for agricultural use should be dedicated to crop production, so these areas are not appropriate for the installation of PV systems [27]. | |
| 3-3 Visual impact: PV systems are visually detrimental to natural landscape, reducing quality of life in the region [25]. | |
| 3-4 Land cover: Sites for PV system installations should avoid areas that have already been utilized [28]. The most suitable locations have sparse vegetation [7]. | |
| 3-5 Scale: It is generally necessary to find a location sufficient to accommodate large PV systems [27]. An upper limit for the installation area can help minimize environmental impact and other effects on surrounding areas. | |
| 3-6 Land cost: Ground-mounted PV systems typically require large areas of land, making land acquisition a challenge due to high costs [25]. As land costs increase, the overall costs of installation rise significantly [19]. |
| Number | Field of Expertise | Organization |
|---|---|---|
| 1 | Public Sector | Industrial Park Management Unit, Economic Development Department, Hsinchu County Government |
| 2 | Industrial Development Administration, Ministry of Economic Affairs | |
| 3 | Energy Administration, Ministry of Economic Affairs | |
| 4 | Bureau of Urban Development, Tainan City Government | |
| 5 | Southern Taiwan Science Park Bureau, National Science and Technology Council | |
| 6 | Foundation | Industry Service Center, Industrial Technology Research Institute |
| 7 | Industry | Y. KU Planning Intl. Co. |
| 8 | Sinotech Engineering Consultants, Ltd. | |
| 9 | Kai Yuan KYC Co., Ltd. | |
| 10 | Sheng Yang Engineering Consultants Ltd. | |
| 11 | Ri Xi Energy Ltd. | |
| 12 | WINCHAIN CONSULTANTS CO., LTD. | |
| 13 | Academic Community | Department of Land Economics, National Cheng Chi University |
| 14 | Department of Real Estate Management, National Pingtung University | |
| 15 | Program in Interdisciplinary Studies, National Sun Yat-sen University | |
| 16 | Local Creative Development Center, Southern Taiwan University of Science and Technology | |
| 17 | Maste’sr Degree Program for Intelligent City and Community Planning, Chung Hua University |
| The Most Conservative Triangular Fuzzy Function | The Most Optimistic Triangular Fuzzy Function | Test Value | Expert Consensus Value | Optimal Value | ||||||||
|---|---|---|---|---|---|---|---|---|---|---|---|---|
| li | ui | mi | Li | Ui | Mi | Zi | Hi | Min | Max | GM | ||
| Physical Location Conditions | Population Density | 1 | 7 | 3.02 | 2 | 9 | 5.95 | −2.07 | 4.49 | 2 | 8 | 4.62 |
| Distance from Residential Areas | 2 | 7 | 4.33 | 6 | 9 | 7.63 | 2.30 | 6.38 | 4 | 8 | 6.06 | |
| Proximity to Road Networks | 1 | 7 | 3.27 | 3 | 9 | 6.35 | −0.93 | 4.89 | 2 | 8 | 4.98 | |
| Proximity to Power Grid | 2 | 8 | 5.17 | 7 | 9 | 8.59 | 2.42 | 7.36 | 3 | 9 | 6.78 | |
| Distance from Environmentally Sensitive Areas | 3 | 8 | 5.57 | 6 | 9 | 8.57 | 1.01 | 7.03 | 5 | 8 | 7.08 | |
| Environmental and Climate Conditions | Air Temperature | 1 | 6 | 2.97 | 3 | 9 | 6.07 | 0.10 | 4.51 | 2 | 7 | 4.47 |
| Relative Humidity | 1 | 6 | 2.37 | 2 | 8 | 5.09 | −1.28 | 3.84 | 2 | 7 | 3.98 | |
| Solar Radiation | 4 | 8 | 5.66 | 6 | 9 | 8.29 | 0.63 | 6.99 | 3 | 8 | 6.60 | |
| Sunlight Duration | 5 | 7 | 6.14 | 9 | 9 | 9.00 | 4.86 | 9.00 | 6 | 9 | 7.60 | |
| Wind Speed | 1 | 5 | 2.18 | 2 | 9 | 4.82 | −0.36 | 3.50 | 2 | 7 | 3.69 | |
| Elevation | 1 | 6 | 2.93 | 3 | 9 | 5.81 | −0.13 | 4.43 | 2 | 7 | 4.44 | |
| Slope | 1 | 7 | 3.17 | 3 | 9 | 6.14 | −1.02 | 4.80 | 2 | 8 | 4.75 | |
| Orientation | 1 | 8 | 4.12 | 4 | 9 | 7.12 | −0.99 | 5.78 | 2 | 9 | 5.60 | |
| Political, Economic, and Social Conditions | Land Use | 3 | 7 | 5.14 | 6 | 9 | 7.97 | 1.82 | 6.51 | 3 | 8 | 6.24 |
| Low agricultural productivity | 3 | 8 | 4.71 | 5 | 9 | 7.72 | 0.01 | 6.36 | 2 | 8 | 5.85 | |
| Visual Impact | 1 | 6 | 3.49 | 4 | 9 | 6.60 | 1.11 | 5.02 | 3 | 8 | 5.15 | |
| Land Cover | 1 | 6 | 3.49 | 4 | 9 | 6.07 | 0.58 | 4.90 | 3 | 8 | 4.94 | |
| Scale | 3 | 7 | 5.14 | 5 | 9 | 7.77 | 0.63 | 6.20 | 2 | 8 | 6.06 | |
| Land Cost | 3 | 7 | 5.43 | 7 | 9 | 8.51 | 3.08 | 7.00 | 4 | 8 | 6.61 | |
| Perspective | Evaluation Factor | |||||
|---|---|---|---|---|---|---|
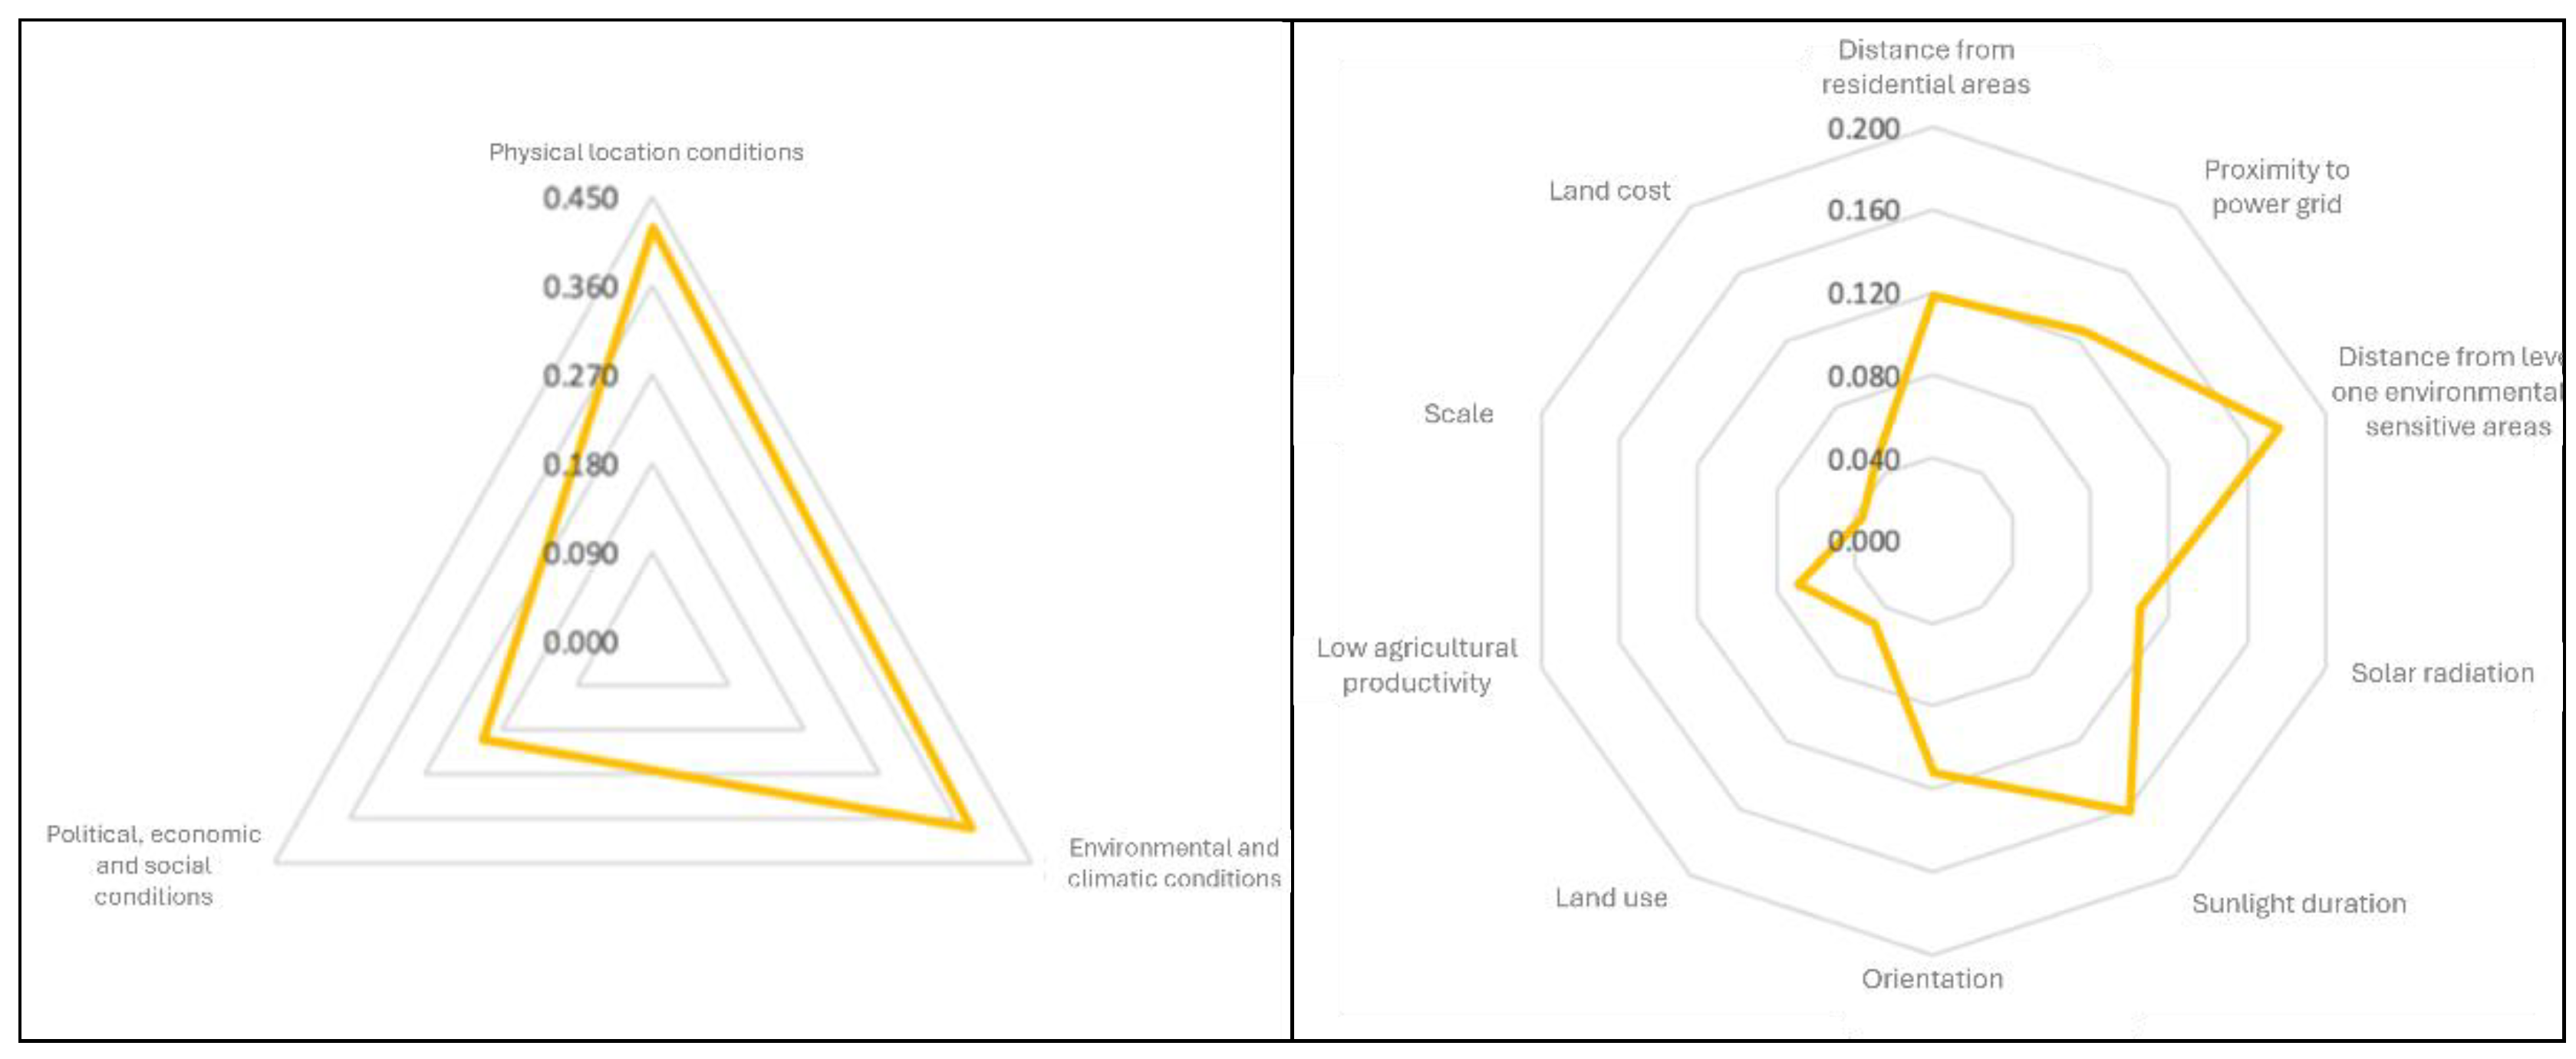
| Item | Local Weight (NW1) | Ranking | Item | Local Weight (NW2) | Total Weight (NW1*NW2) | Ranking |
| Physical location conditions | 0.419 | 1 | Distance from residential areas | 0.282 | 0.118 | 4 |
| Proximity to power grid | 0.298 | 0.125 | 3 | |||
| Distance from level 1 environmentally sensitive areas | 0.421 | 0.176 | 1 | |||
| Environmental and climate conditions | 0.380 | 2 | Solar radiation | 0.277 | 0.105 | 6 |
| Sunlight duration | 0.427 | 0.162 | 2 | |||
| Orientation | 0.296 | 0.113 | 5 | |||
| Political, economic, and social conditions | 0.201 | 3 | Land use | 0.245 | 0.049 | 8 |
| Low agricultural productivity | 0.342 | 0.069 | 7 | |||
| Scale | 0.180 | 0.036 | 10 | |||
| Land cost | 0.231 | 0.047 | 9 | |||
| Site | Year of Application | Power Company Name | Power Plant Name | District | Section | Land Area (m2) |
|---|---|---|---|---|---|---|
| Ground-mounted PV sites | ||||||
| 1 | 2017 | Yu Ting Electric Co., Ltd. | Xinying Landfill No. 1 and No. 2 Solar Power Plants | Xinying District | Hou Chen Section | 75,760 |
| 2 | 2018 | SIN JHONG SOLAR POWER CO., LTD. | Sin Jhong Xuejia Type 1 Solar Power Plant | Xuejia District | Xuejialiao Section Chai Tzu Section | 280,211 |
| 3 | 2019 | Tien Chin Energy Co., Ltd. | Tien Chin Phase 1 Solar Power Plant | Qigu District | Qigu Section Yucheng Section | 100,680 |
| 4 | 2019 | CHIMEI Green Energy Co., Ltd. | Chimei Green Energy Phase 2 Shanhua Ground-Mounted Solar Power Plant | Shanhua District | Chiehpa Section 2nd Subsection | 158,717 |
| 5 | 2020 | Hao Yang Electric Co., Ltd. | Hao Yang No. 2 Solar Power Plant | Beimen District | Xidiliao Section Erchonggang Subsection | 17,008 |
| 6 | 2021 | Shuo Ming No. 1 Co., Ltd. | Shan Shang Solar Power Plant | Shanshang District | Fengte Section | 163,199 |
| Fishery-solar power system | ||||||
| 7 | 2021 | Hsueh Tsan Energy Co., Ltd. | Tainan City Xuejia PV Zone Development Project (Phase 1) (Fishery-Solar Hybrid Demonstration Zone) | Xuejia District | Xuejialiao Section | 180,937 |
| Perspective | Evaluation Factors | Explanation for Calculation Values | ||
|---|---|---|---|---|
| Physical Location Conditions | Distance from Residential Areas | Total number of households within a 500-m distance around the site. | ||
| Proximity to Power Grid | Distance (km) from the site to the nearest electrical substation. | |||
| Distance from Environmental Sensitive Areas | The total number of “level one environmentally sensitive items” to be examined within the area where the site is located. | |||
| Environmental and Climate Conditions | Solar Radiation | Classifying the daily solar radiation of Tainan City into two levels. | 1 | The one with the best GHI value. |
| 2 | The one with the second-best GHI value. | |||
| Sunlight Duration | The conditions for all sites are identical, so the value is 1 for all. | |||
| 1 Orientation | Classifying orientations into three levels. | 1 | Facing south | |
| 2 | Facing east, west, and flat regions | |||
| 3 | Facing north | |||
| Political, Economic, and Social Conditions | Land Use | Classifying land use into three levels. | 1 | The installation of PV systems does not affect the original land use. |
| 2 | The installation of PV systems coexists with the original land use. | |||
| 3 | The installation of PV systems replaces the original land use. | |||
| Low Agricultural Productivity | Classifying the agricultural productivity into two levels. | 1 | Without agricultural use. | |
| 2 | With agricultural use. | |||
| Scale | Classifying the areas of PV systems into four levels. | 1 | Land area ranging from 6 to 15 hectares. | |
| 2 | Land area ranging from 1 to 5 hectares and from 16 to 20 hectares. | |||
| 3 | Land area ranging from 21 to 25 hectares. | |||
| 4 | Land area greater than 26 hectares. | |||
| Land Cost | The unit price of each site. (priced in New Taiwan dollars, NTD) | |||
| Perspective | Evaluation Factor | Yu Ting (Xinying) | Sin Jhong (Xuejia) | Tien Chin (Qigu) | Chimei (Shanhua) | Hao Yang (Beimen) | Shuo Ming (ShanShang) | Hsueh Tsan Fishery-Solar Power (Xuejia) |
|---|---|---|---|---|---|---|---|---|
| Physical Location Conditions | Distance from Residential Areas | 28 | 15 | 204 | 9 | 33 | 37 | 12 |
| Proximity to Power Grid | 3.749 | 10.674 | 14.969 | 6.586 | 18.713 | 1.129 | 9.649 | |
| Distance from Level 1 Environmentally Sensitive Areas | 6 | 6 | 7 | 5 | 8 | 7 | 6 | |
| Environmental and Climate Conditions | Solar Radiation | 2 | 1 | 1 | 2 | 1 | 2 | 1 |
| Sunlight Duration | Due to the inability to obtain the solar radiation hours for individual sites, it is assumed that all installations located in Tainan City receive the same amount of solar radiation hours. | |||||||
| Orientation | 1 | 2 | 1 | 1 | 3 | 2 | 2 | |
| Political, Economic, and Social Conditions | Land Use | 1 | 3 | 3 | 1 | 3 | 3 | 2 |
| Low Agricultural Productivity | 1 | 2 | 1 | 2 | 2 | 1 | 2 | |
| Scale | 1 | 4 | 1 | 1 | 2 | 2 | 2 | |
| Land Cost | 640 | 560 | 773 | 9200 | 570 | 898 | 520 | |
Disclaimer/Publisher’s Note: The statements, opinions and data contained in all publications are solely those of the individual author(s) and contributor(s) and not of MDPI and/or the editor(s). MDPI and/or the editor(s) disclaim responsibility for any injury to people or property resulting from any ideas, methods, instructions or products referred to in the content. |
© 2025 by the authors. Licensee MDPI, Basel, Switzerland. This article is an open access article distributed under the terms and conditions of the Creative Commons Attribution (CC BY) license (https://creativecommons.org/licenses/by/4.0/).
Share and Cite
Chia, P.-C.; Sho, K.; Li, H.-Y.; Hu, T.-S.; Chang, C.-C. Evaluating the Suitability of Ground-Mounted Photovoltaic System Selection and the Differences Between Expert Assessments and Firm Location Preferences: A Case Study of Tainan City. Energies 2025, 18, 3559. https://doi.org/10.3390/en18133559
Chia P-C, Sho K, Li H-Y, Hu T-S, Chang C-C. Evaluating the Suitability of Ground-Mounted Photovoltaic System Selection and the Differences Between Expert Assessments and Firm Location Preferences: A Case Study of Tainan City. Energies. 2025; 18(13):3559. https://doi.org/10.3390/en18133559
Chicago/Turabian StyleChia, Ping-Ching, Kojiro Sho, Han-Yu Li, Tai-Shan Hu, and Chia-Chen Chang. 2025. "Evaluating the Suitability of Ground-Mounted Photovoltaic System Selection and the Differences Between Expert Assessments and Firm Location Preferences: A Case Study of Tainan City" Energies 18, no. 13: 3559. https://doi.org/10.3390/en18133559
APA StyleChia, P.-C., Sho, K., Li, H.-Y., Hu, T.-S., & Chang, C.-C. (2025). Evaluating the Suitability of Ground-Mounted Photovoltaic System Selection and the Differences Between Expert Assessments and Firm Location Preferences: A Case Study of Tainan City. Energies, 18(13), 3559. https://doi.org/10.3390/en18133559