Article

Risk Spillover of Energy-Related Systems Under a Carbon Neutral Target

1
State Grid Zhejiang Electric Power Co., Ltd., Construction Company, Hangzhou 310016, China
2
CEC Technical & Economic Consulting Center of Power Construction, Electric Power Development Research Institute Co., Ltd., Beijing 100053, China
3
School of Economics and Management, North China Electric Power University, Beijing 102206, China
*
Author to whom correspondence should be addressed.
Energies 2025, 18(13), 3515; https://doi.org/10.3390/en18133515
Submission received: 22 April 2025 / Revised: 22 June 2025 / Accepted: 30 June 2025 / Published: 3 July 2025

Abstract

Under the background of climate change, the risk spillover within the energy system is constantly intensifying. Clarifying the coupling relationship between entities within the energy system can help policymakers propose more reasonable policy measures and strengthen risk prevention. To estimate the risk spillover of energy-related systems, this paper constructs five subsystems: the fossil fuel subsystem, the electricity subsystem, the green bond subsystem, the renewable energy subsystem, and the carbon subsystem. Then, a quantitative risk analysis is conducted on two major energy consumption/carbon emission entities, China and Europe, based on the DCC-GARCH-CoVaR method. The result shows that (1) Markets of the same type often have more significant dynamic correlations. Of these, the average dynamic correlation coefficient of GBI-CABI (the Chinese green bond subsystem) and FR-DE (the European electricity subsystem) are the largest, by 0.8552 and 0.7347. (2) The high correlation between energy markets results in serious risk contagion, and the overall risk spillover effect within the European energy system is about 2.6 times that within the Chinese energy system. Of these, EUA and CABI are the main risk connectors of each energy system.

1. Introduction

As one of the most critical issues today, climate change is a challenge all humanity shares [1]. The primary driver of climate change is the extensive release of greenhouse gases (GHGs), with carbon dioxide emissions being the predominant contributor [2]. To mitigate carbon dioxide emissions, as of April 2025, 152 countries have proposed a range of climate strategies aiming for “zero carbon” or “carbon neutral” goals (including 48 countries with legislation, 52 countries with policy documents, 12 countries with a declaration/pledge, and 40 countries in discussion (Energy & Climate Intelligence Unit: https://eciu.net/netzerotracker (accessed on 1 April 2025))).
The formulation or adjustment of policies often affects the decisions and behaviors of investors, thus affecting the market [3]. This effect continues to flow between markets, showing a trend of risk contagion, often called risk spillover [4]. In general, markets with high turnover rates, strong liquidity, and wide industry coverage are more likely to become risk transmitters. On the contrary, markets with incomplete mechanisms and relatively small scales are more likely to become risk receivers, which means that the market price of these are more likely to be affected by the previous ones. Due to the information transmission and product transactions throughout financial markets, the phrase “risk spillover” was first used in the financial fields. In addition to the traditional stock markets [5,6], scholars have focused more on risk spillovers inside the energy system in recent years [7,8]. As the main source of emissions, carbon dioxide emissions from energy account for over 80% of the global carbon dioxide emissions. Hence, the proposal of carbon neutrality targets is bound to affect the energy system, leading to risk contagion among energy-related markets [9].
Through analyzing and summarizing the existing literature, we found that the risk spillover of fossil fuel markets (FMs), represented by coal, oil, and natural gas, has received widespread attention [10]. Following closely behind is the carbon market (CM), which was first innovatively proposed in the Kyoto Protocol [11]. With the gradual extension of the coverage of the “energy industry” and related industries, some scholars have also begun to analyze the spillover effects within the electricity (EMs), green bond (GMs), and renewable energy markets (RMs) [12,13,14]. However, the studies above focus more on the risk spillovers between the same type of markets (within subsystems), while ignoring the risk contagion between different types of markets (across subsystems). Liu et al. [15] used the DY and BK indices to estimate the volatility spillover between FMs and EMs in Europe. Deng et al. [16] evaluated the asymmetric connectedness between FMs and China’s GM. Yousaf et al. [17] proposed a QVAR-based model to analyze the quantile connectedness between FMs and RMs in the United States. Similarly, the cross-market spillover effects between energy subsystems (other than FMs) have also been studied by scholars [18,19]. However, no thorough investigation has been conducted on all five aforementioned subsystems, which has caused an incomplete analysis of the sources and subjects of risk spillover in the energy system. Given the evolving energy transition trends, the relationship among these subsystems is getting tighter. Through the joint estimation of risk spillover within all the subsystems above, it can help collectively capture the full complexity of energy systems [20]. Figure 1 summarizes the literature introduced above.
As matter stands, the studies on the same type of market spillover effects typically examine cross-border/regional effects. However, when studying the spillover effects in different types of markets, most studies have only focused on one specific region (China/Europe/US). Thus, the universality of the proposed models cannot be verified, and the absence of external validation may also limit the results.
In terms of risk measurement, the value at risk (VaR) model is used to measure the maximum potential loss at a certain level of confidence, which is widely adopted in financial fields [21]. However, the VaR model focuses more on measuring risk and cannot model the risk spillovers between multiple systems or markets. Hence, the extended conditional value at risk (CoVaR) model is further introduced to address the aforementioned issues [22]. According to the calculation methods, it can be further divided into three types: quantile regression-based CoVaR [23], copula-based CoVaR [24], and multivariate GARCH-based CoVaR [25], which are widely applied in different scenarios depending on their applicability. Of these, the GARCH-based models can reflect the time-varying non-linear risk correlation, and the typical models mainly include the constant conditional correlation–GARCH model (CCC-GARCH) [26] and the BEKK-GARCH model [27]. However, the former cannot capture the dynamic correlation between multiple markets, and the economic meaning of the latter model parameters is not clear.
To address the aforementioned issues, we constructed a thorough risk spillover research framework for energy-related systems and conducted empirical analysis around some of the world’s largest energy economies. The contribution and innovation of this paper mainly lie in three aspects.
  • On the basis of the previous studies, the energy system is divided creatively into five subsystems in this paper, which can help collectively capture the full complexity of energy systems, especially given the evolving energy transition trends. Moreover, we examine risk spillovers between markets, not just within the same subsystem but also between markets across different systems.
  • This paper concentrates on two major carbon emission and energy consumption entities, China and Europe, which can view the issue of risk spillovers in energy systems from a broader global perspective, overcoming the constraints of the existing research scope.
  • The dynamic conditional correlation–GARCH (DCC-GARCH) and CoVaR approaches were adopted to capture the dynamic correlation and risk contagion among various market segments in the energy system. In the comparison with the traditional quantile regression-based CoVaR, the DCC-GARCH-CoVaR with fewer estimated parameters has better performance.
The remaining sections of this research are organized as follows. Following the introductory section, the methodology is introduced in Section 2. The empirical analysis is presented in Section 3, followed by the conclusions and policy implications in Section 4.

2. Methodology

2.1. Models

The DCC-GARCG-CoVaR model is utilized to characterize the dynamic correlation and risk spillovers between various markets within the energy system. The basic principles and steps of the models are introduced in this section.

2.1.1. DCC-GARCH Technology

The GARCH model was first proposed by Bollerslev in 1986 and is widely used to describe the volatility characteristics of markets. The steps are as follows [28]:
Step 1: Construct the rate of return (ROR) function
To ensure the stability of the data and model, it is necessary to convert the original unstable price data into stable ROR data. The ROR function is constructed in Formula (1)
R i , t = ( ln P i , t ln P i , t 1 ) × 100
where R i , t represents the ROR of the i -th market at time t and P represents the initial price.
Step 2: Construct the variance equation, as shown in Formula (2)
σ i , t 2 = ω i + α i ε i , t 1 2 + β i σ i , t 1 2
where σ i , t 2 represents the conditional variance of R i , t at time t ; ω i represents the constant term; ε i , t 1 2 represents the interference term of mean value equation at time t 1 ; α i and β i , respectively, represent the ARCH and GARCH coefficients of the equation; and α i + β i < 1 .
So far, the single-variable GARCH model has been constructed. Then, the DCC-GARCH model can be further expressed as follows [29]
y t = C x t + ε t
where y t represents the dependent variable matrix, x t represents the independent variable matrix, and C represents the coefficient matrix. Here, ε t = H t 1 / 2 ν t N ( 0 , H t ) .
To ensure that the ROR series is the positive definition, use Formula (4)
H t = D t R t D t D t = d i a g { h t i h t j } = h i i , t 0 0 h j j , t R t = ( Q t ) 1 Q t ( Q t ) 1
where H t represents the conditional covariance matrix, D t represents the diagonal matrix composed of the conditional standard deviations h t , R t represents the DCC matrix as shown in Formula (5), Q t represents the conditional variance matrix of the normalized residuals estimated by a single variable as shown in Formula (6), and Q t represents the diagonal matrix of Q t .
R t = ( ρ i j , t ) = 1 ρ 1 n , t ρ n 1 , t 1
Q t = ( 1 α β ) Q ¯ + α ( ε t 1 i ε t 1 j ) + β Q t 1 = q 11 , t q 1 n , t q n 1 , t q n n , t q i j , t = ( 1 α β ) q ¯ i j + α ( σ t n i σ t n j ) + β q i j , t 1
where Q ¯ represents the unconditional covariance matrix after normalizing the residuals, α represents the degree of influence of the standardized residual on the conditional variance of the one-period lag, and β represents the first-order degree of influence of the standardized residuals on the conditional variance. Here, α 0 , β 0 , 0 < α + β < 1 .
So far, the dynamic correlation coefficient between market i and market j can be expressed by Formula (7):
ρ i j , t = ( 1 α β ) q ¯ i j + α ( σ t n i σ t n j ) + β q i j , t 1 [ ( 1 α β ) q ¯ i j + β q i j , t 1 + α σ i , t n 2 ] 2 + [ ( 1 α β ) q ¯ i j + β q i j , t 1 + α σ j , t n 2 ] 2

2.1.2. CoVaR Approach

The VaR model was first proposed in 1993 and can give the maximum loss under certain conditions and reflect the risk intuitively. The VaR of a market can be calculated by Formula (8):
p r o b ( Δ P > V a R ) = 1 T
Based on VaR, the CoVaR [22] can be further expressed as follows
p r o b X i C o V a R q i j X j = V a R q j = 1 q
where C o V a R q i j represents the conditional risk value generated by market i to market j , X represents the risk loss, and q represents the quantile.
Therefore, the degree of systemic risk spillover from market j to financial market i can be expressed as follows:
Δ C o V a R q i j = C o V a R q i j V a R q j
Combining the DCC-GARCH model with the CoVaR model [23], the following formula can be obtained
V a R q , t i = μ ^ t i Q ( q ) h ^ t i C o V a R q i j = γ t i j V a R q , t i Δ C o V a R q i j = γ t i j ( V a R q , t i V a R 50 % , t i )
where μ ^ t i represents the mean value of the GARCH model estimation, h ^ t i represents the standard deviation of the DCC-GARCH model estimation, and Q ( q ) represents the quantile of ROR distribution of market i when the confidence level is 1 q , where γ t i j = ρ i j , t σ t j / σ t i .
To better reflect the degree of risk spillover, the indicator % Δ C o V a R q i j is used to characterize the risk spillover effect between markets, as shown in Formula (12):
% Δ C o V a R q i j = ( Δ C o V a R q i j / V a R q j ) × 100 %

2.2. Data Sources and Descriptive Statistics

2.2.1. Data Sources

To study the risk spillovers of the energy system, we first constructed five subsystems, and two typical representatives were selected for analysis in each subsystem, as shown in Table 1.
Chinese Energy System
(1)
Fossil fuel subsystem
According to BP, China’s total primary energy consumption in 2021 reached approximately 157.65 Exajoules (EJ). Of these, the consumption of coal, oil, and natural gas accounted for 54.7%, 19.4%, and 8.7%, respectively. Thus, the two fossil fuels mainly used in China (coal and oil) were selected as representatives in the fossil fuel subsystem. Referring to [30,31], we selected the thermal coal trading in Zhengzhou Commodity Exchange (ZCE) and crude oil produced in the Daqing field as the markets for analysis.
(2)
Electricity subsystem
In the electricity subsystem, the current Chinese power market mainly adopts the spot market trading method and is still in the pilot development stage. Therefore, China has not yet established an electricity futures market that could be used to select research objects in this paper. Referring to [42], we selected the stock prices of listed power companies to measure the development level of the electricity market. Thus, Huaneng Power International, Inc. and China Yangtze Power Co., Ltd. were selected as the typical representatives of the electricity subsystem.
(3)
Green bond subsystem
In the green bond subsystem, the China Green Bond Index and China Climate-Aligned Bond Index—the two earliest bond indexes established and issued in China—were mainly selected to reflect the development of the green bond markets.
(4)
Renewable energy subsystem
The selection method of representative objects in the renewable energy subsystem is similar to that in the electricity subsystem (selecting leading enterprises). However, the renewable energy industry chain is long, and there are a large number of enterprises from upstream research and development manufacturing to downstream terminal applications. Thus, we have selected the most representative renewable energy enterprises from the aspects of market size and company revenue to characterize the subsystem, referring to Ref. [32]. According to the list of “Top 500 Chinese Energy Enterprises in 2024” released by China’s Academy of Energy Economics, renewable energy-related companies such as Contemporary Amperex Technology Co., Ltd. and EVE Energy Co., Ltd. are both on the list (Neway valve was listed among the “Top 500 Chinese Energy Enterprises in 2024”: https://www.newayvalve.com/37/178 (accessed on 17 June 2025)). Of these, CATL ranks 14th on the list (which is also a leading position among all renewable energy-related enterprises).
(5)
Carbon subsystem
In the carbon subsystem, relatively few data are available because of the late official listing and trading time of the national unified carbon emission trading system (ETS). Therefore, the main research object of the carbon subsystem is the ETS in pilot areas. According to the carbon market information disclosure data, the cumulative trading volume in Guangdong’s ETS and Shenzhen’s ETS was CNY 4.130 billion and CNY 1.203 billion, respectively, as of June 2022, which has a better market operation effect than other pilot regions. Therefore, the Guangdong carbon market and Shenzhen’s carbon market were selected as representative research objects for the carbon subsystem.
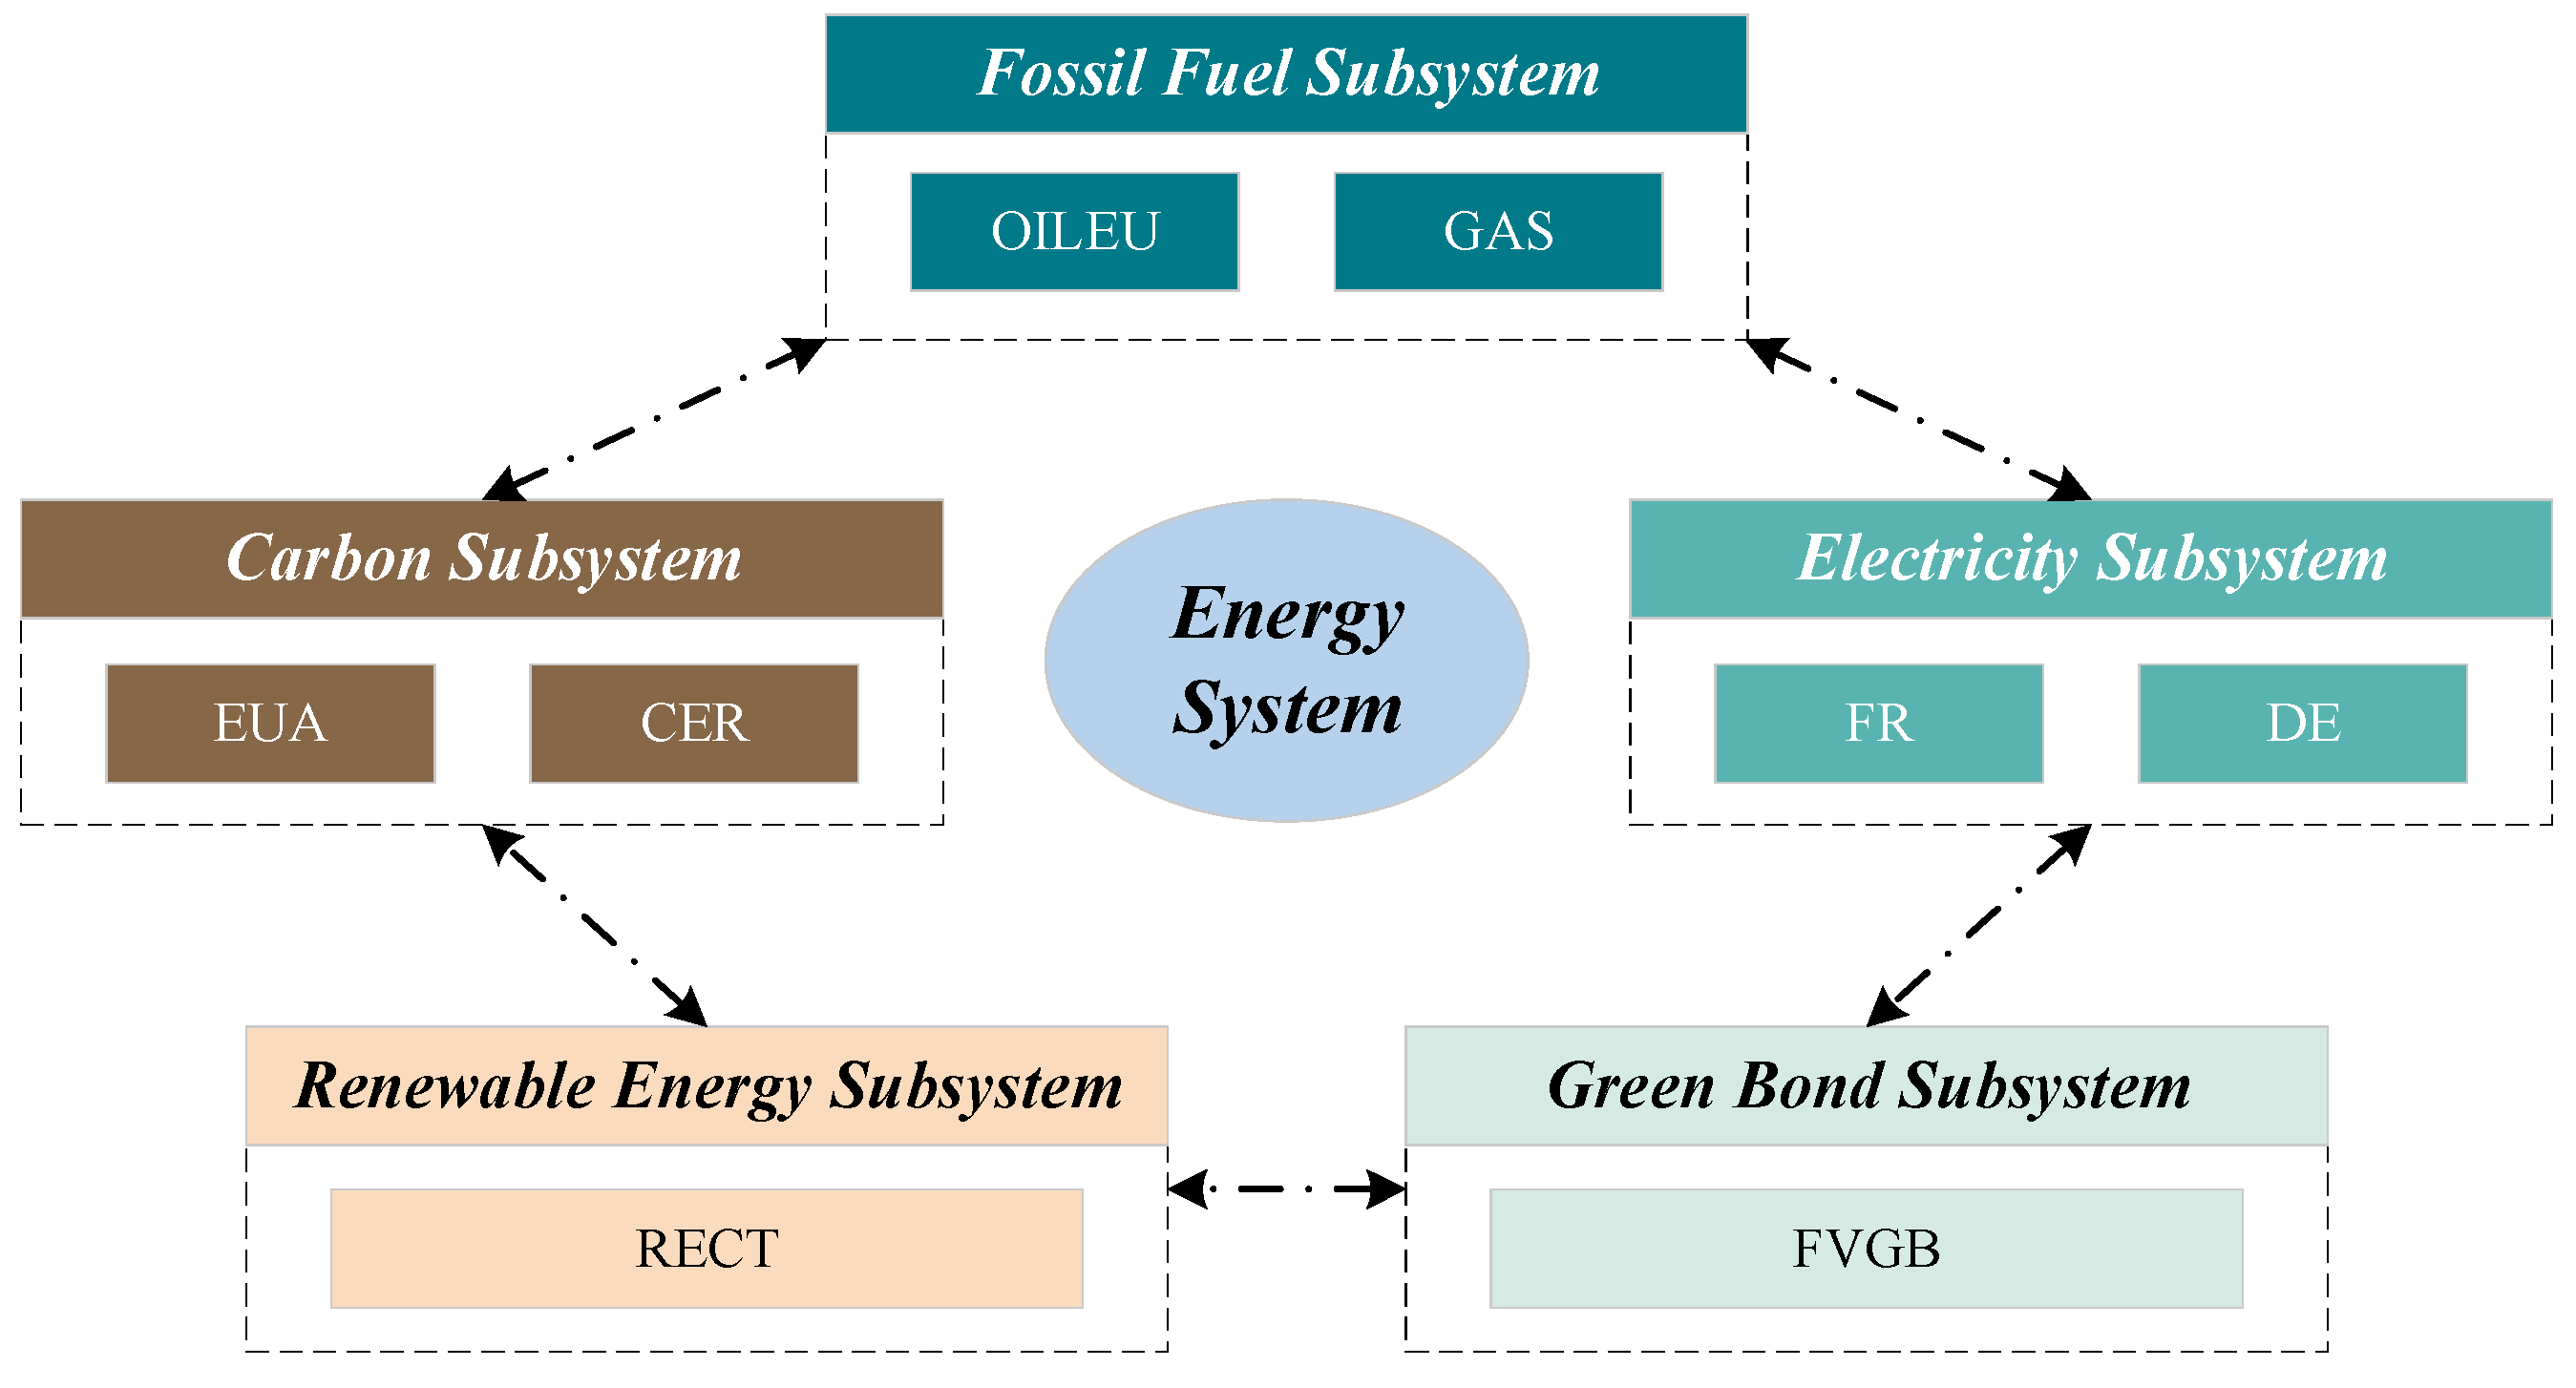
The framework diagram of the Chinese energy system and subsystems is shown in Figure 2.
As shown in Figure 2, the Chinese energy system constructed in this paper mainly consists of five subsystems and each subsystem includes two market segments (ten segments in total).
European Energy System
(1)
Fossil fuel subsystem
In contrast to China’s energy structure, the main energy sources consumed in Europe are oil and natural gas, accounting for 33.5% and 25.0%, respectively, of the total primary energy consumption in 2021. Thus, we selected these two main fossil fuels in Europe (oil and natural gas) as representatives in the fossil fuel subsystem. Referring to [37,38], we selected Brent crude oil and NBP natural gas as the represent markets for analysis.
(2)
Electricity subsystem
As for the electricity subsystem, the French and German electricity markets were mainly selected. On the one hand, these two countries were the largest electricity generation entities in Europe in 2021, reaching 547.2 and 548.5 Terawatt-hours (TWh), respectively. On the other hand, both countries have only one unified electricity market, unlike other regions (such as Norway, which has five segmented electricity markets).
(3)
Green bond subsystem and renewable energy subsystem
Referring to [39], we selected the Franklin Euro Green Bond and S&P/TSX Renewable Energy and Clean Technology Index as representatives of the green bond subsystem and renewable energy subsystem (due to data limitations, we were unable to obtain data on two market prices that were similar to other subsystems. Therefore, only one market was chosen as a representative in each of these two subsystems).
(4)
Carbon subsystem
Furthermore, the selection of representative markets within the European carbon subsystem differs from that of China. The European carbon market is mainly based on the European Union’s emission trading system (EU ETS). Hence, EUA and CER were selected as representatives.
The framework diagram of the European energy system and subsystems is shown in Figure 3.
As shown in Figure 3, the European energy system constructed in this paper mainly consists of five subsystems. Of these, the fossil fuel/electricity/carbon subsystems mainly include two market segments each, and the green bond/renewable energy subsystems mainly include one market segment (eight segments in total).

2.2.2. Descriptive Statistics

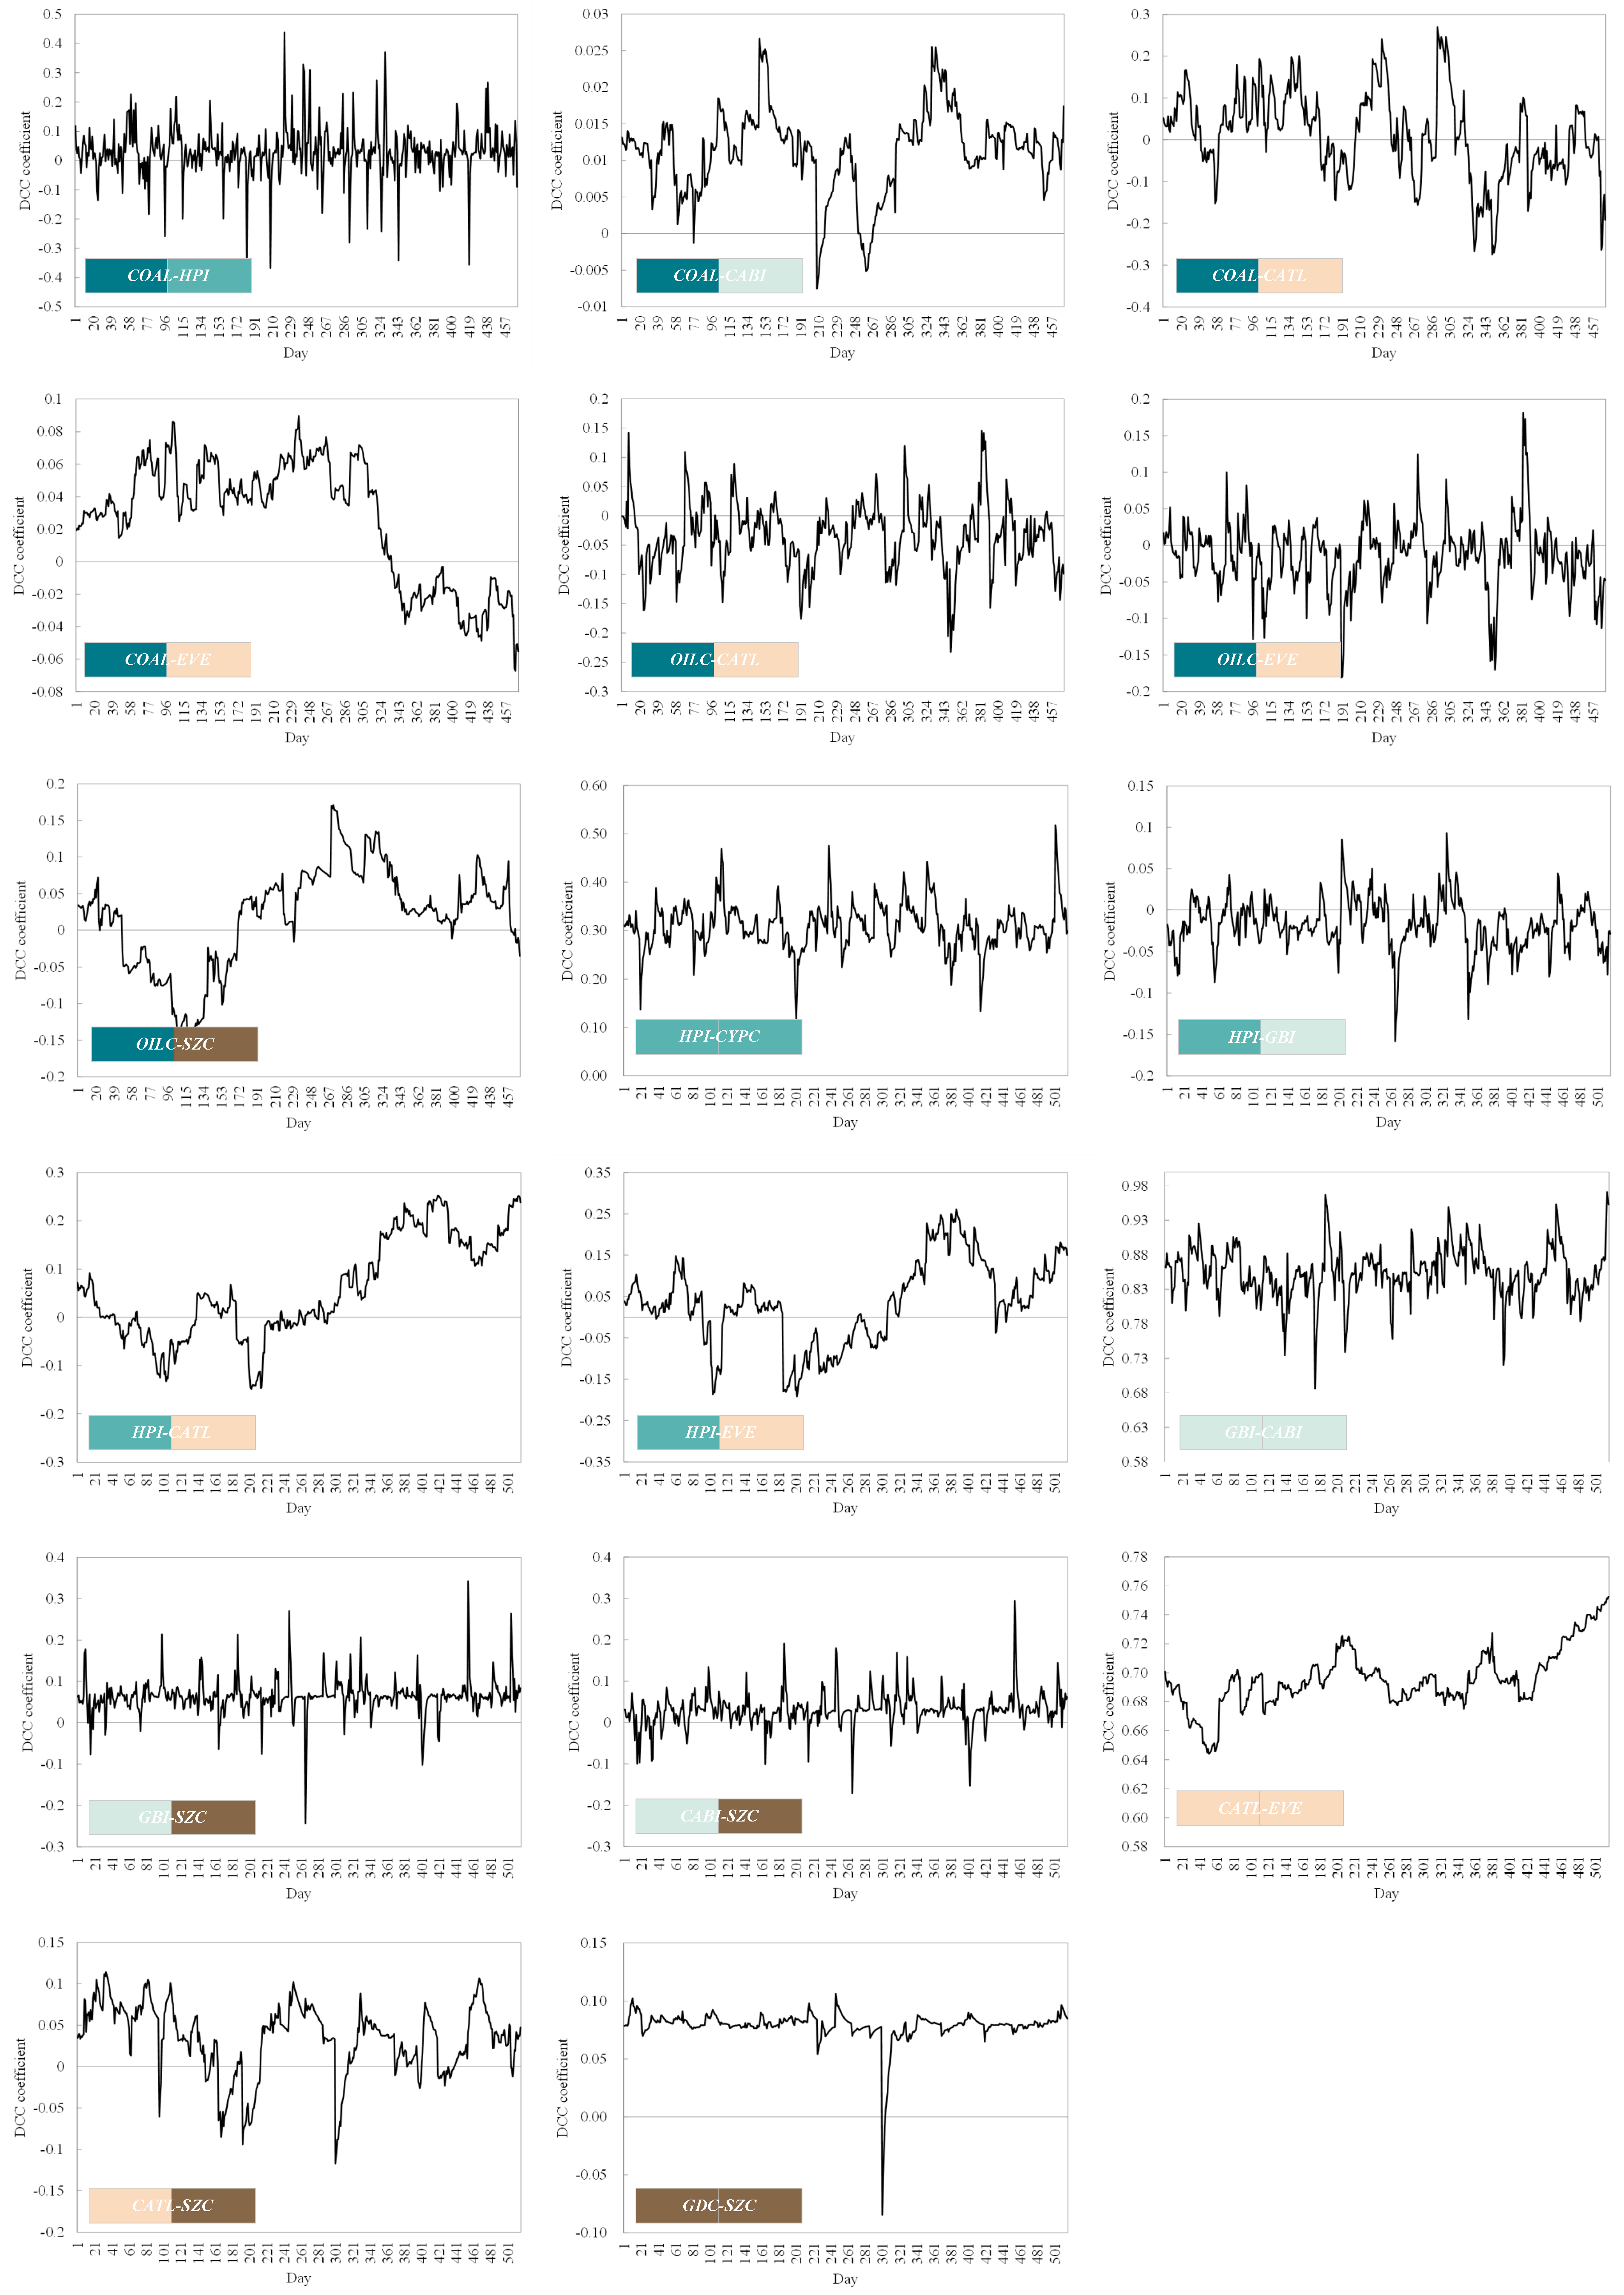
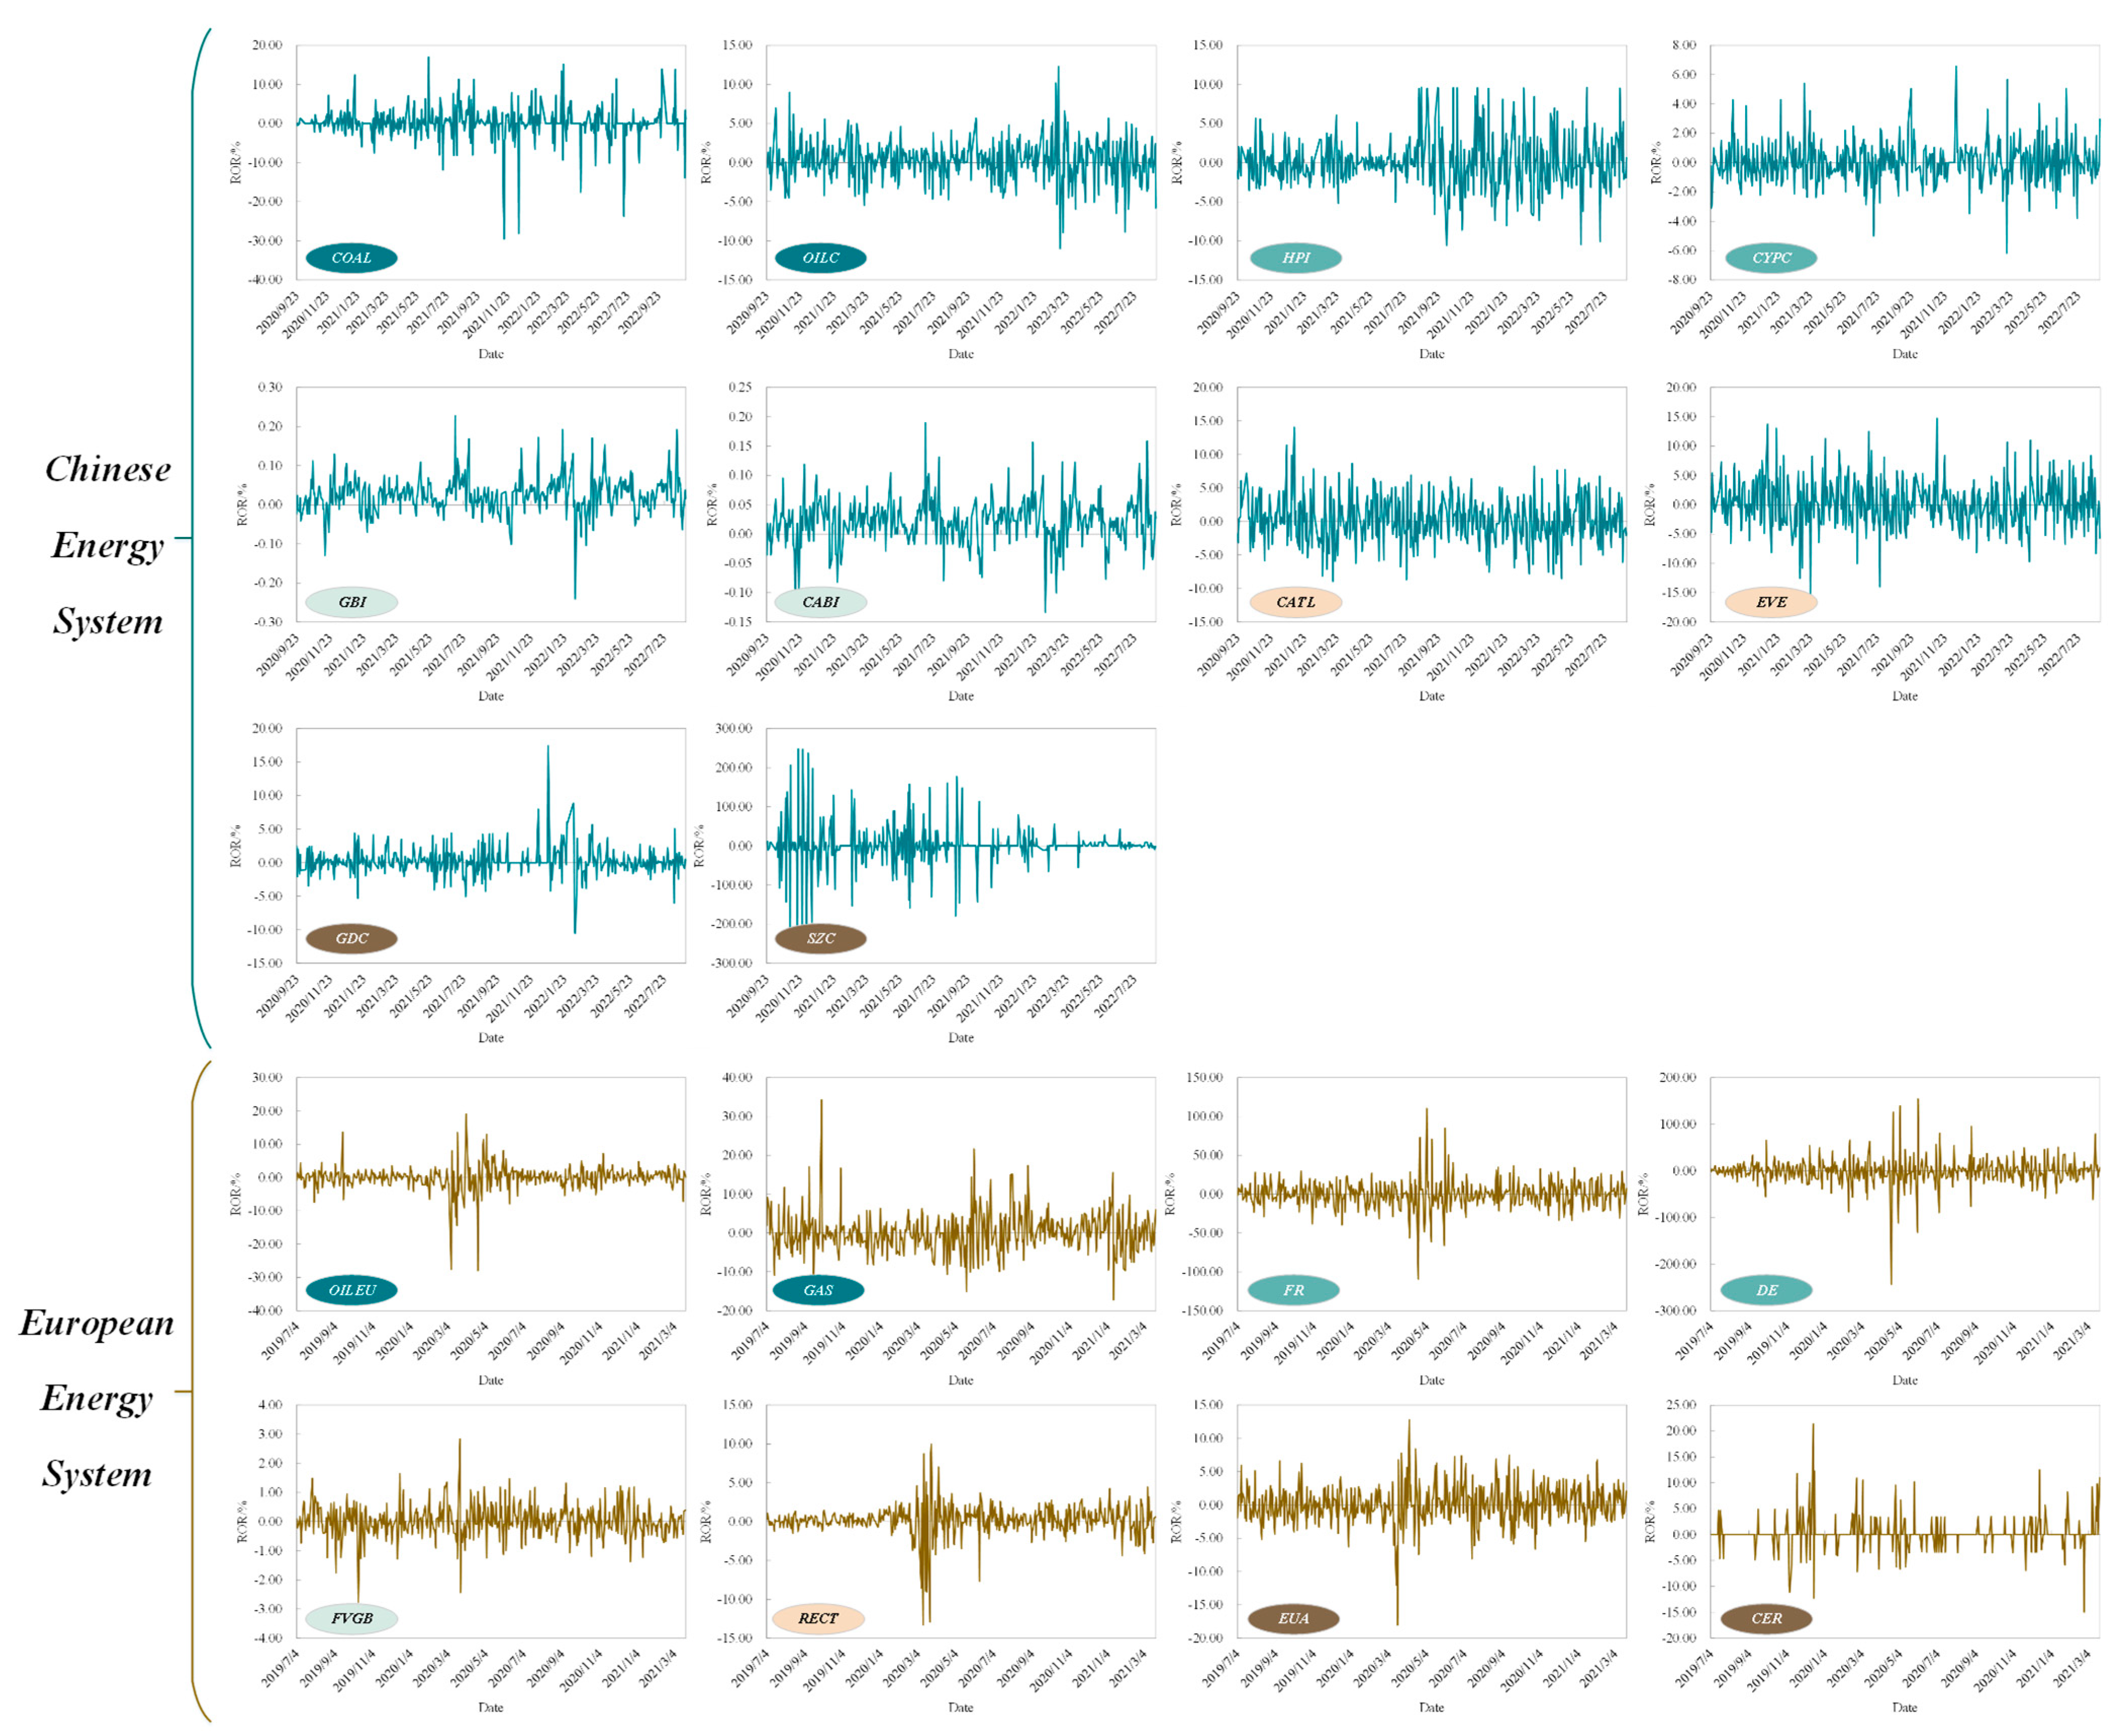
Considering the different timing of proposing carbon neutrality targets, market data on the Chinese energy system span from 22 September 2020 to 31 August 2022 (China proposed the carbon neutral target on 22 September 2020), and market data on the European energy system are from 4 July 2019 to 22 March 2021 (Europe proposed the carbon neutral target on November 2018; moreover, the EU discontinued CER’s operation for carbon offsetting and instead adopted a new international emission reduction mechanism under the Paris Agreement after March 2021). All data are sourced daily from the WIND database. The initial price data are converted into ROR data using Equation (1), as shown in Figure A1.
All markets exhibited apparent convergence in the ROR data changes, also called volatility clustering (Figure A1). In other words, the amplitude of price fluctuations tended to be persistent within a certain period. Large price fluctuations in the current period are often accompanied by large price fluctuations in the next period, similar to low volatility. The ROR descriptive statistics on the aforementioned markets are shown in Table A1.
The following conclusions can be obtained via Table A1:
(1) During the statistical period, the return of the carbon subsystem is significantly higher than that of other subsystems, for both the Chinese and European energy systems. By contrast, the average ROR of CYPC and DE in the electricity subsystem were the lowest at 0.0113 and −0.1397, respectively, in both energy systems. From the standard deviation, Chinese and European green bond subsystems exhibited gentle fluctuation trends. However, the standard deviation of SZC in the Chinese carbon subsystem reached 48.5808, indicating that the price fluctuation in the market is significant.
(2) In terms of skewness, the skewness of each market in each subsystem was not 0, indicating that the distribution of returns in each market is asymmetric. Furthermore, the kurtosis of each market was greater than 3, and the J-B statistics were significant at the level of 1%, suggesting that the ROR of each market is not a normal distribution but rather a typical leptokurtic distribution characteristic. This finding proves that the energy system has a feedback effect.
(3) All market RORs passed the ADF test and were significant at the 1% level, meaning that all markets are stable. Furthermore, all market RORs passed the ARCH-LM test and were significant at the 10% level. This finding implies an ARCH effect in each market so that GARCH modeling can be conducted for each market.

2.3. Research Framework

The research framework of this paper is shown in Figure 4.
As shown in Figure 4, the research framework is mainly divided into the following four steps:
Step 1: Energy system construction and data collection
First of all, it is necessary to clarify the research scope of this paper, that is, the construction of the energy system and subordinate subsystems. Meanwhile, considering the availability and applicability, a certain amount of market price data should be collected.
Step 2: Data preprocessing and descriptive statistical analysis
After collecting the original price data of each research object, it is necessary to convert them into stable ROR data through data preprocessing. Subsequently, descriptive statistics are required for each set of ROR sequence data. In addition to being able to summarize the characteristics of the processed data, it is also able to determine whether the data are stable and have an ARCH effect. The ADF test and ARCH-LM test are also the basis for the subsequent research.
Step 3: Dynamic correlation analysis based on the DCC-GARCH model
The dynamic correlation analysis is a prerequisite for judging the risk spillover effect within the energy system. In this step, it is first necessary to establish a single GARCH model for each research object and determine whether the parameter estimation results meet the conditions. Then, the dynamic correlation between various markets can be calculated using the DCC-GARCH model.
Step 4: Risk spillover effects analysis based on the CoVaR model
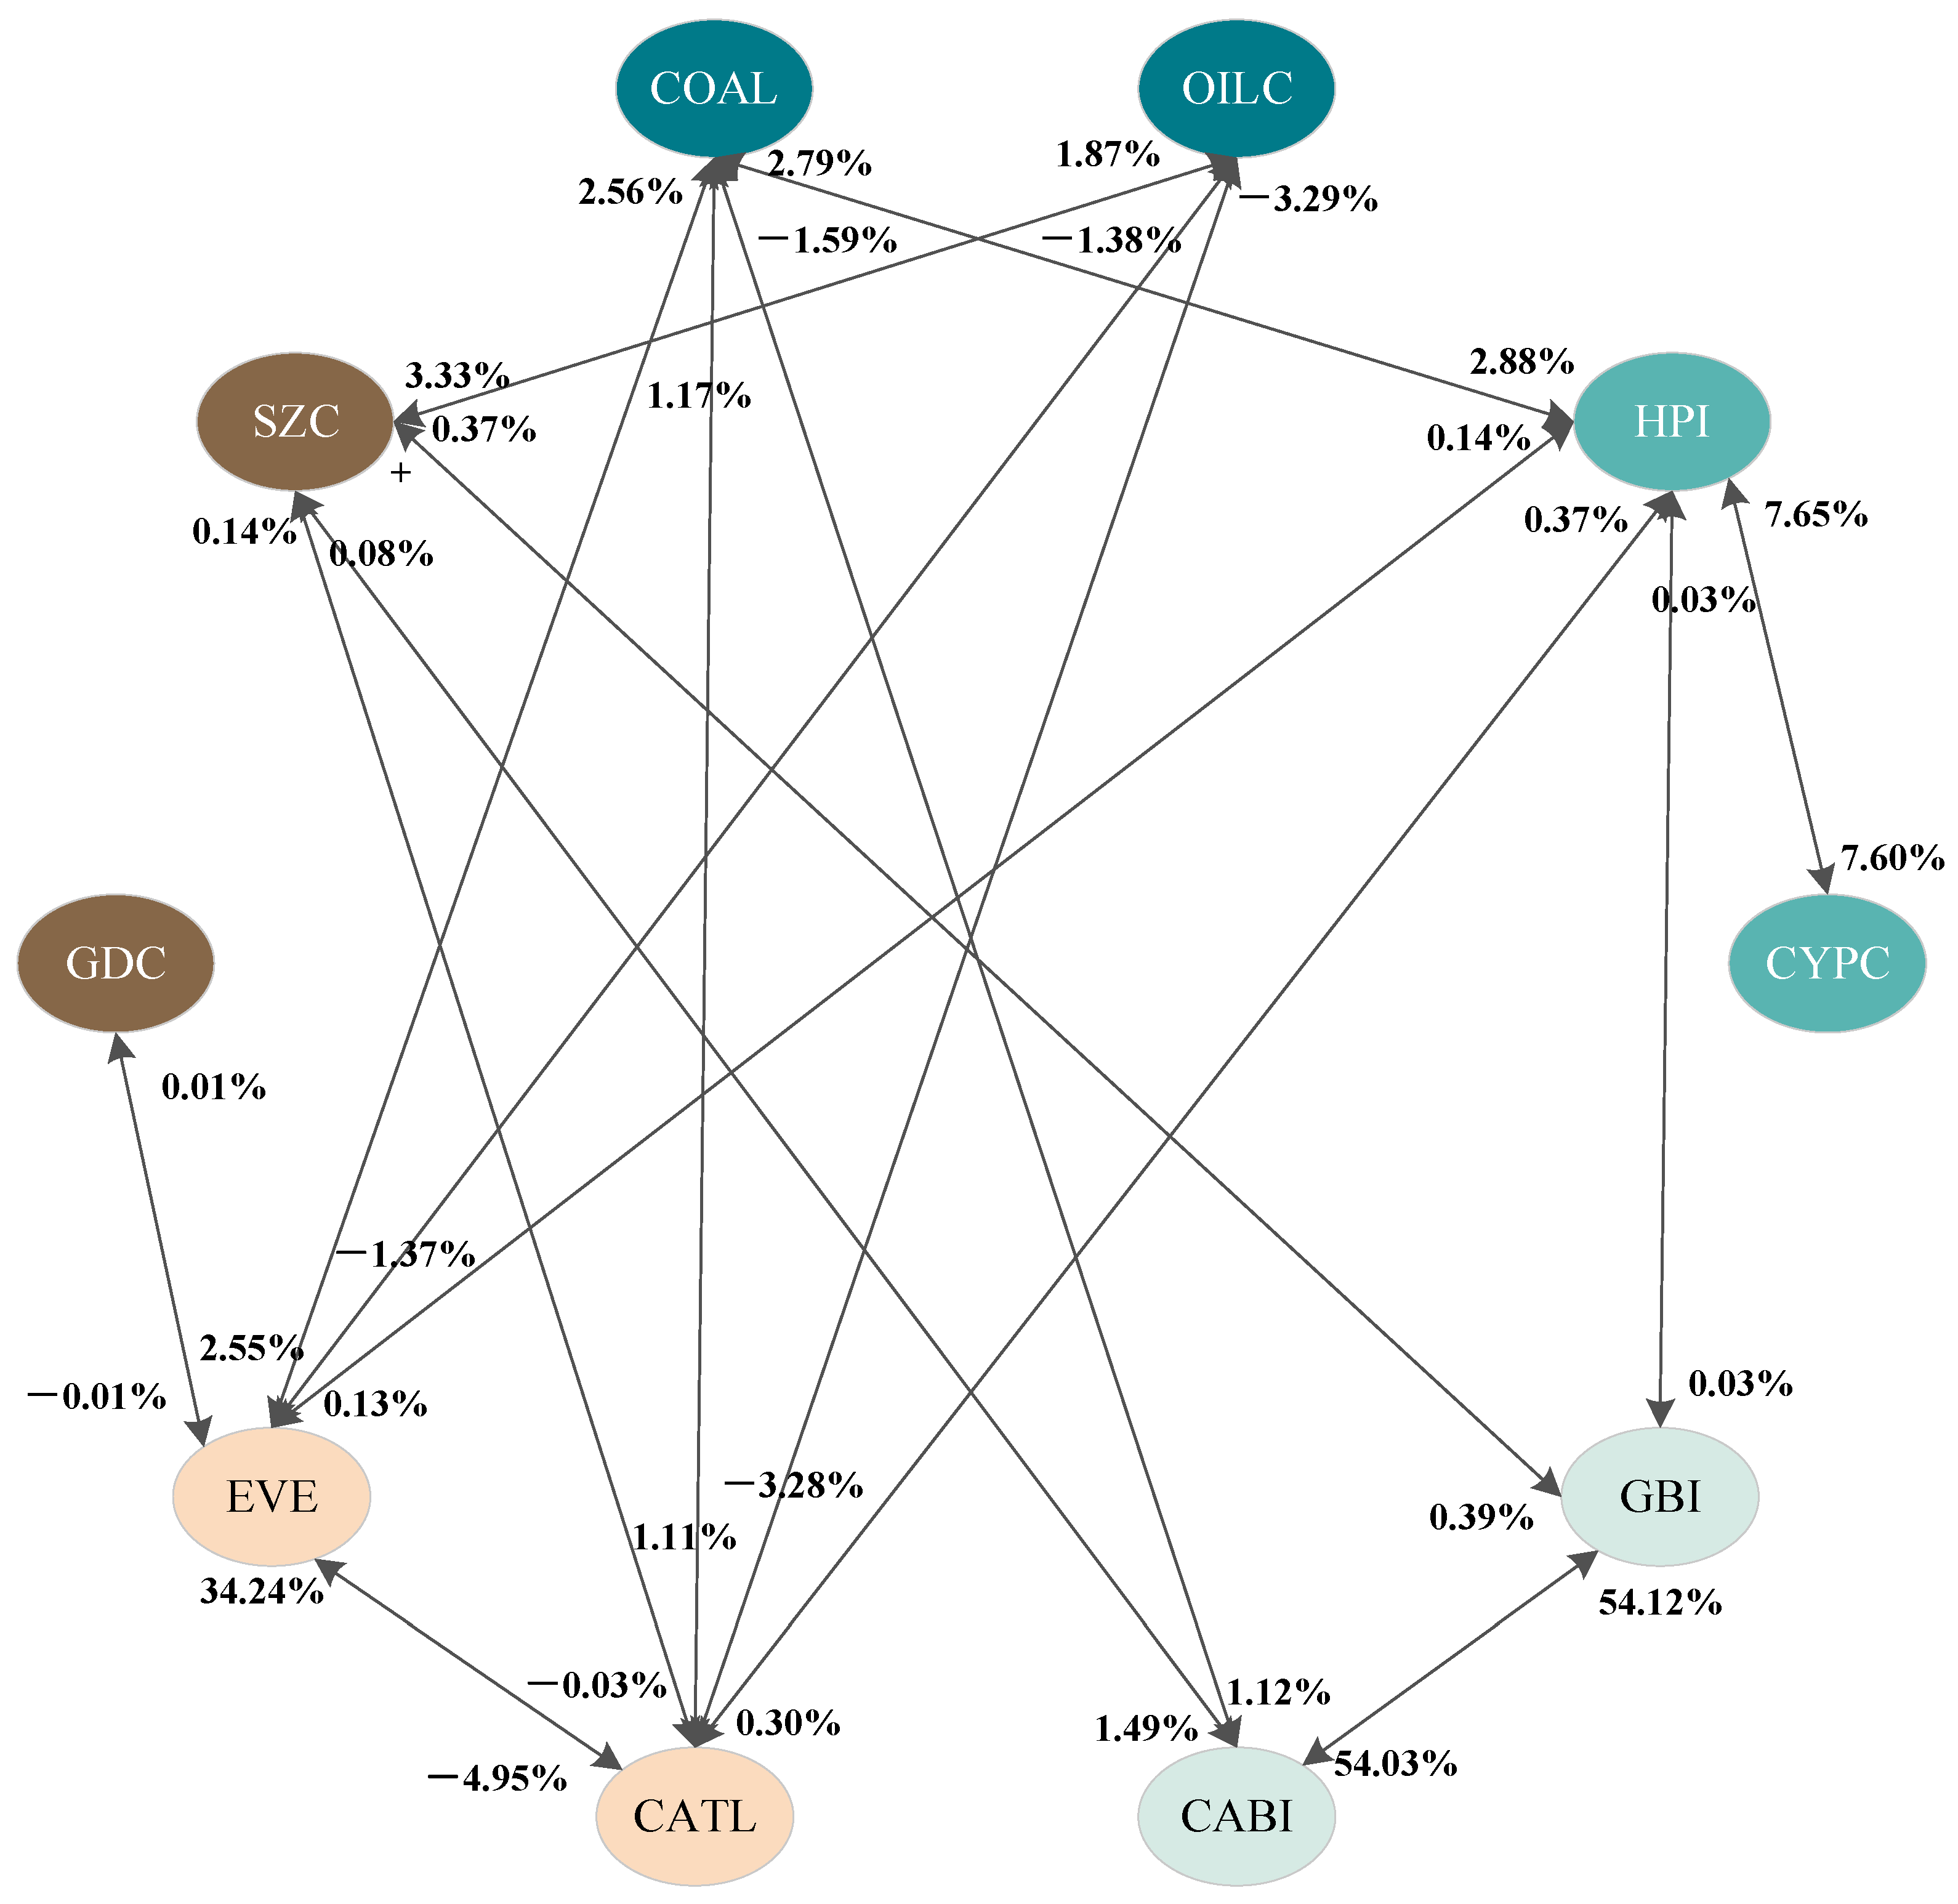
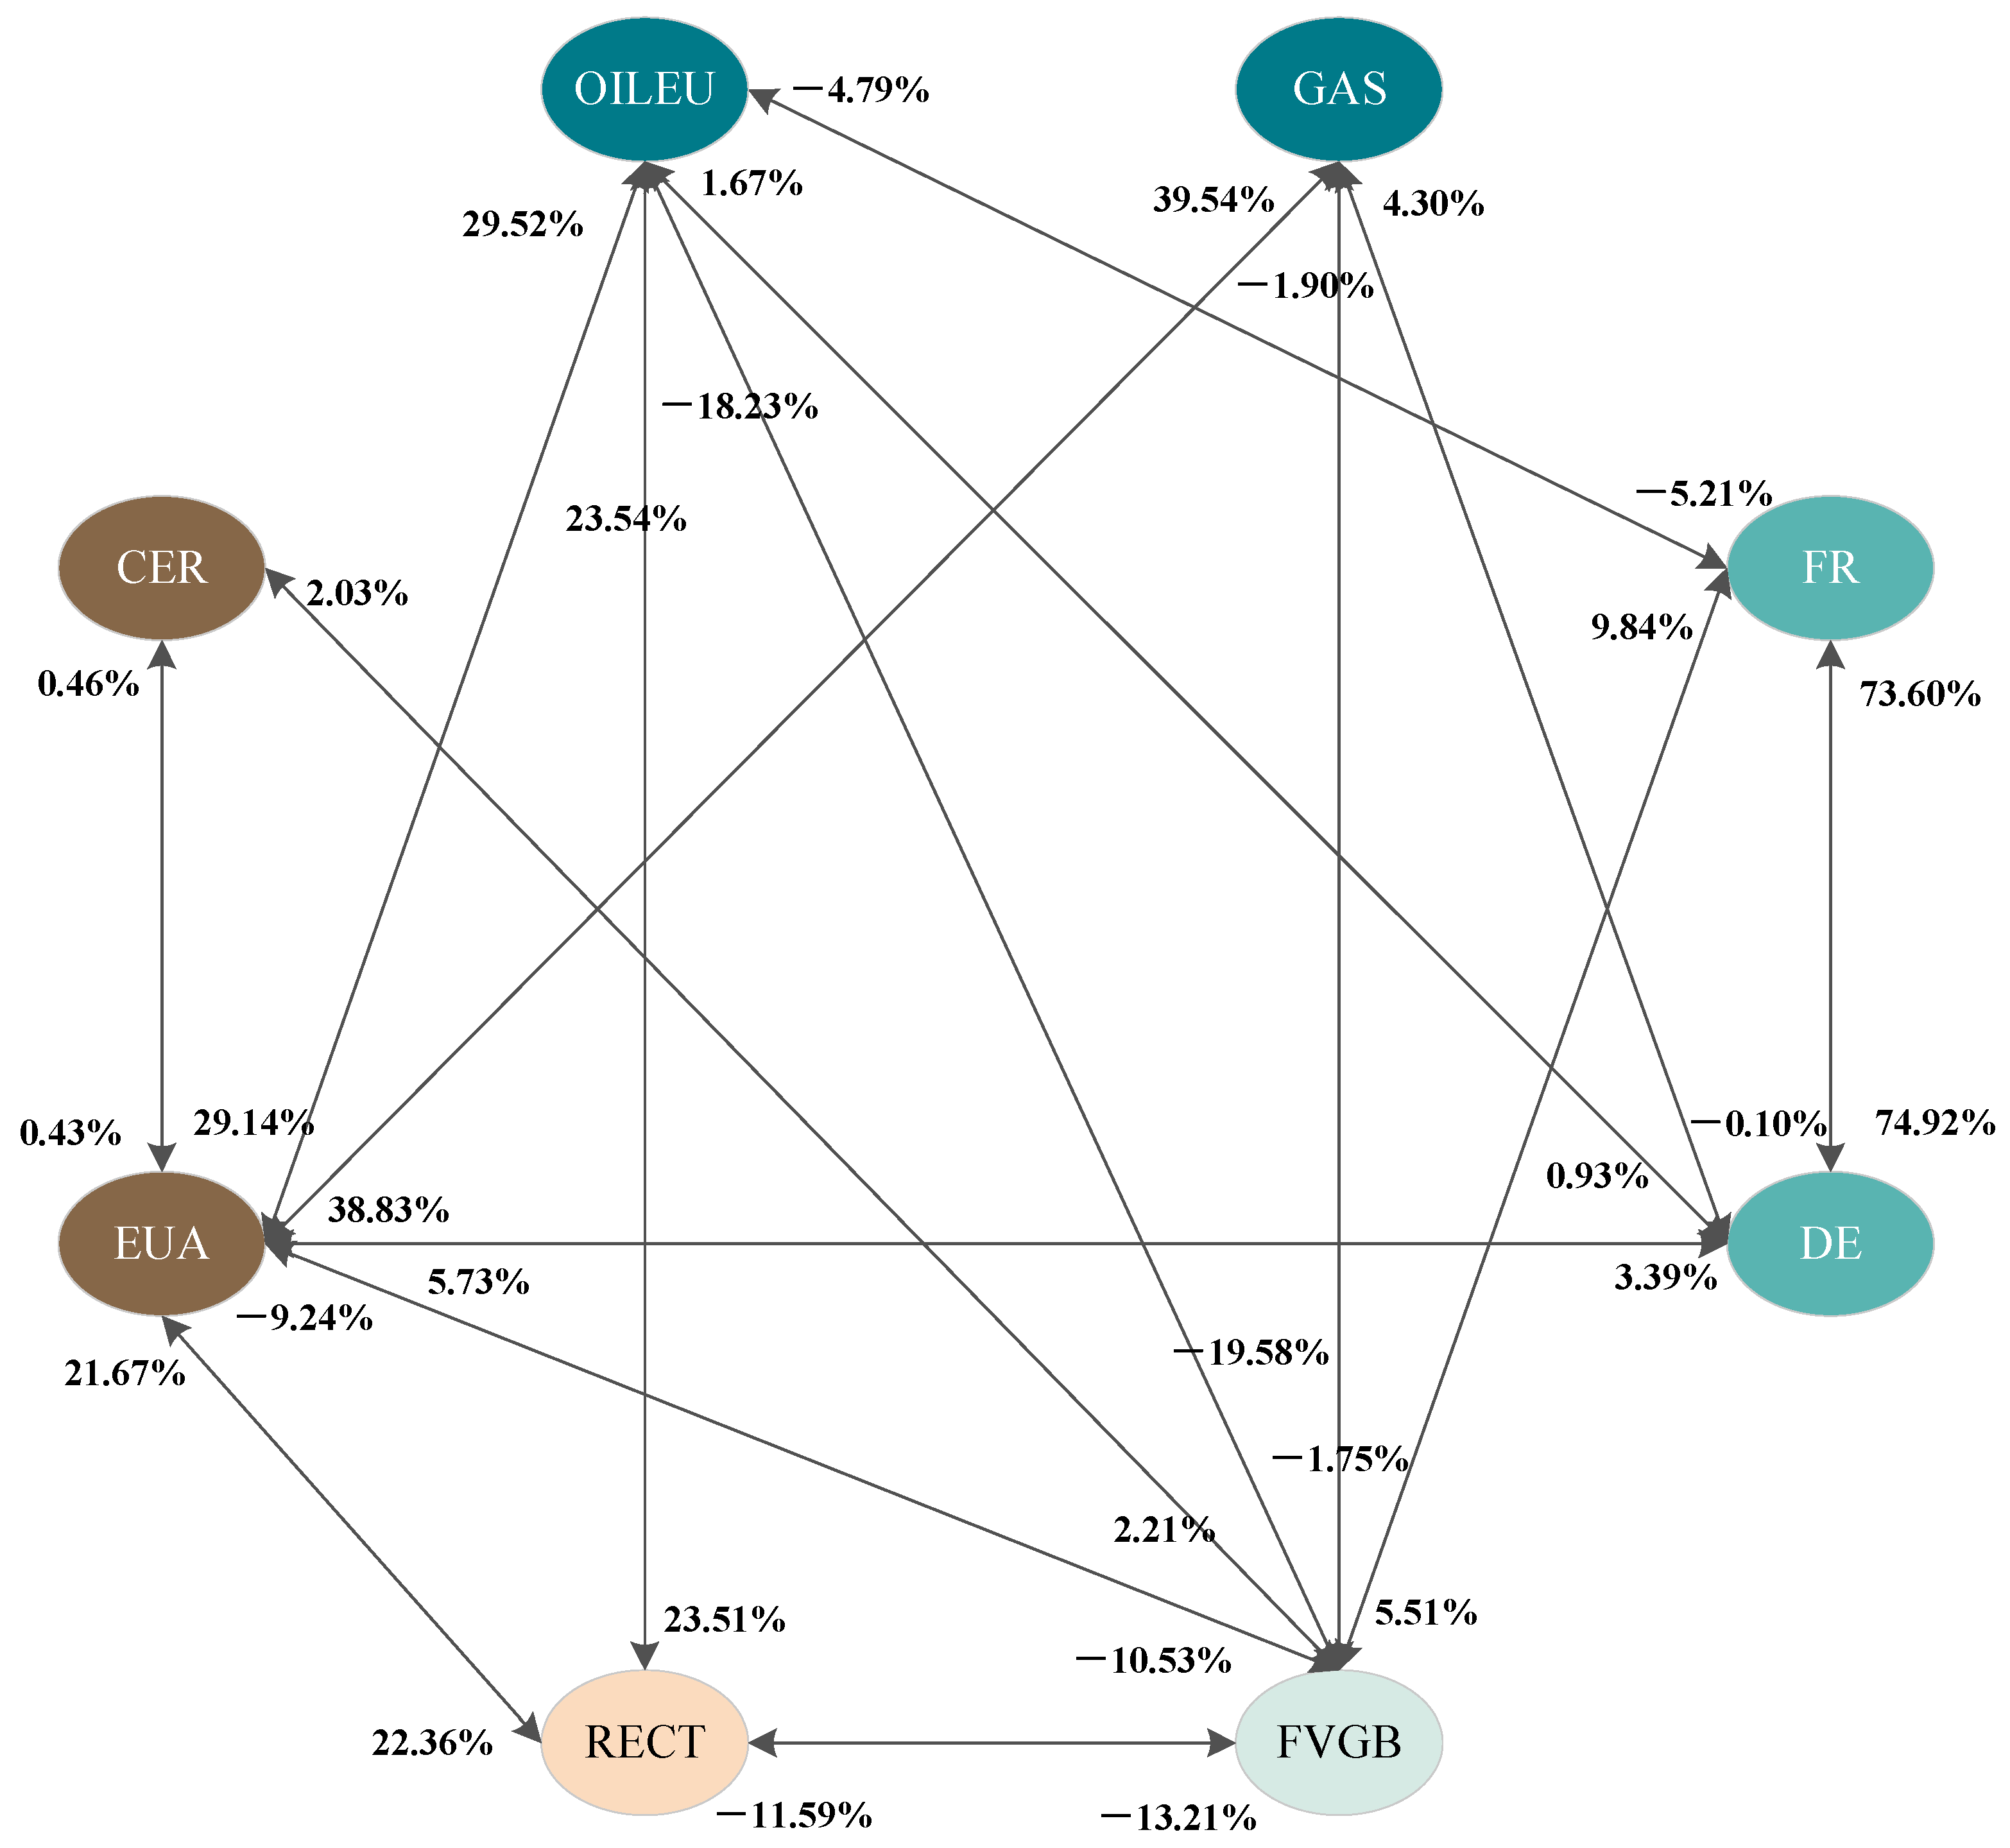
Before establishing the risk spillover model of the energy system, it is necessary to first test the estimated parameters of the DCC-GARCH model. If the research object meets the conditions of the estimated parameters, the risk spillover effect between markets can be further calculated by the CoVaR model. Finally, the risk transmission relationship between various markets is visualized through a risk network diagram, and the risk vulnerability of each subsystem is analyzed.

3. Empirical Analysis

3.1. Dynamic Correlation and Risk Spillover Analysis of the Chinese Energy Market

3.1.1. Dynamic Correlation Analysis of the Chinese Energy Market

Single Variable GARCH Model Construction
First, the single variable GARCH model of each market was established, and the estimated results are shown in Table 2.
The single variable GARCH parameter estimation results for all markets met the standard of α i + β i < 1 (Table 2). The bi-variable GARCH model was also constructed for the subsequent dynamic correlation analysis.
Bi-variable GARCH model construction
The parameter estimation results of the bi-variable GARCH model were then estimated, and the compliance of each market with standards of α 0 , β 0 , 0 < α + β < 1 is shown in Table 3.
In the Chinese energy system, the bi-variable GARCH model parameters of 17 pairs of markets could satisfy the requirements, while those of the other 28 pairs of markets could not. In other words, there was a significant dynamic correlation between these 17 pairs of markets, which can be further evaluated using the DCC-GARCH model.
Dynamic correlation relationship analysis
The dynamic correlation between various markets was further calculated (Figure A2). The descriptive statistical results of the dynamic correlation coefficients between markets are presented in Table 4.
The dynamic correlations between most markets had irregular time-varying characteristics (Figure A2), and their correlation relationships included both negative and positive correlations. However, there was also a stable positive correlation between the ROR of some markets, such as HPI-CYPC (electricity–electricity), GBI-CABI (green bonds–green bonds), and CATL-EVE (renewable energy–renewable energy). Overall, the RORs of the same type of markets within the same subsystem were more convergent and more likely to exhibit a trend of change in the same direction.
Because of the positive and negative differences in the dynamic correlation coefficients, simple averaging of the correlation coefficients at various times (Table 4) could not reflect the true dynamic correlation between markets. Therefore, an indicator of the true average dynamic correlation coefficient (TADCC) was calculated using Equation (13)
T A D C C , i j = 1 T t = 1 T ρ i j , t
where T A D C C , i j represents the true average value of the dynamic correlation coefficient between market i and market j .
The TADCCs between markets are listed in Table 5.
Compared with the simple average processing of dynamic correlation coefficients between various markets in Table A1, the TADCC in Table 5 more truly reflect the dynamic correlation between markets (the direction of time-varying correlations can be obtained in the figures). From the perspective of relevance ranking, the most relevant markets were GBI-CABI (green bond subsystem, T A D C C = 0.8552 ), CATL-EVE (renewable energy subsystem T A D C C = 0.6917 ), and HPI-CYPC (electricity subsystem T A D C C = 0.3081 ), indicating that the dynamic correlation between the same type of markets is more evident than that between different type markets. The top three ranking results of the average dynamic correlation were the same under the conventional average analysis, and the real average value was introduced in Equation (13) because the dynamic correlation of these three groups of markets has always been positive. For other markets, the dynamic correlation ranking among them has undergone significant changes.

3.1.2. Risk Spillover Effects Analysis of the Chinese Energy Market

Based on the calculation of dynamic correlation coefficients between various markets in the Chinese energy system, the C o V a R , Δ C o V a R , and % Δ C o V a R between markets were further studied, based on Equations (8)–(12). Table 6 elaborates on the risk spillover effects between markets. Of these, the spillover direction is from the previous market to the latter one, and the positive and negative values of Δ C o V a R represent the effect of risk spillovers.
As shown in Table 6, most intermarket risk spillovers were positive (26 times), and a few intermarket risk spillovers were negative (8 times), suggesting that the trends of risk changes among the markets within the Chinese energy system exhibit overall homogeneity. From the perspective of the spillover effects between markets, there was the most apparent risk spillover effect between the GBI and CABI markets (GBI-CABI: % Δ C o V a R = 54.03 % , CABI-GBI: % Δ C o V a R = 54.12 % ), and this risk spillover had two-way symmetry. As GBI and CABI are key index markets that reflect the development of green bonds in China, the risk spillovers between them were highly correlated. When the risk of one index increased, the risk of the other green bond index also significantly increased synchronously. Similarly, there was a certain two-way risk spillover effect between HPI and CYPC (HPI-CYPC: % Δ C o V a R = 7.60 % , CYPC-HPI: % Δ C o V a R = 7.65 % ). Although there was also a significant risk spillover effect between CATL and EVE within the renewable energy subsystem, this spillover effect was unidirectional and asymmetric, with the direction from CATL to EVE (CATL-EVE: % Δ C o V a R = 34.24 % , EVE-CATL: % Δ C o V a R = 4.95 % ). As a leading enterprise in the field of renewable energy, the increase in CATL’s risks can quickly be transmitted to other enterprises in the field. However, for EVE, with a relatively small market size, the risks it faces could not be “fed back” to CATL with good risk control capabilities; instead, they had a negative risk spillover effect on CATL. Overall, most of these significant risk spillovers occurred between markets of the same type within the same subsystem, and this result was also highly correlated with previous dynamic correlations between markets.
To clarify the risk spillover relationship among various subsystems, we used social network analysis (SNA) to construct a risk spillover network diagram of the Chinese energy system (Figure 5). The risk spillover effects to other markets and from other markets are listed in Table 7.
From the perspective of market connectivity, GBI and CABI within the green bond subsystem are key hubs for risk transmission. Specifically, the total risk spillover effects of GBI and CABI on the other markets were 54.43% and 55.78%, respectively, and the total risk spillovers from other markets to GBI and CABI were 54.54% and 56.64%, respectively. This phenomenon may be due to the late start of China’s green bond market. According to the WIND database, the number of newly issued green bonds in China in 2022 was 521, with an issuance scale of CNY 874.658 billion, approximately three times the new issuance scale of green bonds in 2020. The proposal of the carbon neutral goal has injected new vitality into the green bond market but has also brought more external risks. By contrast, CATL and EVE within the renewable energy subsystem exhibited significantly differentiated risk prevention capabilities. This phenomenon may be due to the different market shares and business scales of these two enterprises. According to the company’s financial report, the operating revenue of CATL and EVE in 2021 was CNY 130.4 billion and CNY 16.9 billion, respectively; the former being approximately eight times that of the latter. The different market positions affect the risk prevention capabilities of these enterprises, and having CATL makes it easier to transfer risks to EVE without receiving feedback from the latter. Notably, GDC and SZC have shown sluggish performance in risk acceptance and risk transmission. This phenomenon may be because the essence of the carbon market is a policy tool, and its prices are strictly regulated by the government. Furthermore, the free quota distribution method and the lack of participation by financial institutions have led to low liquidity in the carbon market, resulting in insensitivity to risks.
In order to verify the above conclusion, the Granger causality test was performed on CATL and EVE, and the results are shown in Table 8.
As shown in Table 8, the price of CATL with larger market capitalization can lead to the price fluctuation of EVE, which can provide empirical evidence for the previous results.

3.2. Dynamic Correlation and Risk Spillover Analysis of the European Energy Market

3.2.1. Dynamic Correlation Analysis of the European Energy Market

Single variable GARCH model construction
First, the single variable GARCH model of each market was established, and the estimated results are shown in Table 9.
The single variable GARCH parameter estimation results for all markets met the standard of α i + β i < 1 (Table 9). Then, the bi-variable GARCH model was also constructed for the subsequent dynamic correlation analysis.
Bi-variable GARCH model construction
The parameter estimation results of the bi-variable GARCH model were then estimated, and the compliance of each market with the standard of α 0 , β 0 , 0 < α + β < 1 is shown in Table 10.
In the European energy system, the bi-variable GARCH model parameters of 16 pairs of markets could satisfy the requirements, while those of the other 12 pairs of markets could not. In other words, there was a significant dynamic correlation between these 16 pairs of markets, which can be further evaluated using the DCC-GARCH model.
Dynamic correlation relationship analysis
The dynamic correlation between various markets was also calculated (Figure A3). The descriptive statistical results of the dynamic correlation coefficients between markets are presented in Table 11.
As shown in Figure A3, in addition to FR and DE within the electricity subsystem, there were also persistent unidirectional risk spillovers between some other cross-subsystem markets (OILEU and FVGB, DE and EUA, and RECT and EUA). By contrast, the dynamic correlation between EUA and CER in the carbon subsystem exhibited a time-varying positive and negative state. Similarly, the TADCC between markets is listed in Table 12.
As shown in Table 12, FR and DE within the electricity subsystem presented a high degree of dynamic correlation with a TADCC of 0.7347 (the TADCC is equal to the mean value shown in Table 11 because the dynamic correlation coefficient between the FR and DE markets has always been positive). Moreover, as the world’s leading emission system, the price changes of EUA are highly correlated with OILEU and GAS within the fossil fuel subsystem. Moreover, due to the adjustment of the carbon offsetting mechanism by the European Commission, the CER market’s transactions have stagnated, resulting in no or weak dynamic correlation between the CER market and other energy markets.

3.2.2. Risk Spillover Effects Analysis of the European Energy Market

Based on the calculation of dynamic correlation coefficients between markets in the European energy system, the C o V a R , Δ C o V a R , and % Δ C o V a R between markets were further studied based on Equations (8)–(12). Table 13 elaborates on the risk spillover effects between markets. For these, the spillover direction is from the previous market to the latter one, and the positive and negative values of Δ C o V a R represent the effect of risk spillovers.
As shown in Table 13, most markets’ risk spillovers were in the same direction as each other (except GAS and DE). In other words, when a market produces positive risk spillovers to another market, it will also be subject to positive risk spillovers from another market. From the perspective of the spillover effects between markets, there was the most apparent risk spillover effect between the FR and DE markets (FR-DE: % Δ C o V a R = 74.92 % , DE-FR: % Δ C o V a R = 73.60 % ), and this risk spillover had two-way symmetry. Furthermore, the two-way risk spillovers among EUA, GAS, and OILEU were also extremely significant, consistent with the previous dynamic correlation analysis results.
To clarify the risk spillover relationship among various subsystems, we used social network analysis (SNA) to construct a risk spillover network diagram of the European energy system (Figure 6). The risk spillover effects to other markets and from other markets are listed in Table 14.
From the perspective of market liquidity, EUA and CER in the carbon subsystem exhibit completely different performances. Of these, the former is the largest of all markets in the European energy system in terms of risk spillovers and risk inflows, and the latter is just the opposite. However, from the perspective of net risk spillovers, DE is the main risk transmitter, while GAS and FR are the main risk receivers.

3.3. Discussion

In Section 3.1 and Section 3.2, we have conducted risk spillover studies on the Chinese energy system and the European energy system, respectively. We can nevertheless find some commonalities between the two systems despite the variations in their market structure and price fluctuations. As a result, this section goes on to analyze the parallels and contrasts between the Chinese and European energy systems.
Due to data limitations, we could not select two representative markets within each European energy subsystem like in the Chinese energy system. Hence, the market linkage relationship within the European subsystems for green bonds and renewable energy has not been examined. Surprisingly, the dynamic correlation between markets within the European energy system is significantly stronger than that of the Chinese energy system. Of these, there are 16 pairs of European energy markets with significant dynamic correlations, accounting for 57.14% of the total combination. However, this proportion decreased to 37.78% in the Chinese energy system, which, to some extent, means that the liquidity and market efficiency of the Chinese energy system are weaker than those of the European energy system. Specifically, the correlation between markets within the same subsystem is significantly stronger than that between markets across subsystems, and this conclusion is applicable to both the Chinese energy system and the European energy system. However, the dynamic relationship between markets across subsystems seems to have different manifestations within the Chinese energy system and the European energy system. Of these, the correlation between markets across subsystems within the Chinese energy system is unstable and variable, showing a positive correlation for a certain period of time and a negative correlation for another period of time. In the European energy system, we have found that although the value of the dynamic correlation coefficient between some cross-subsystem markets has been constantly changing, the direction has remained unchanged (OLEU-FVGB, DE-EUA, ECT-EUA). This, to some extent, reflects the stability and dominant position of some European energy markets.
From the perspective of risk spillovers, the Chinese energy system and the European energy system exhibit distinct characteristics. Of these, the overall risk spillover effect within the Chinese energy system reached 196.39%, while the overall risk spillover effect within the European energy system reached 509.27%, which is about 2.6 times that of the former. Except for the green bond subsystem, the risk spillover effects of all other subsystems within the European energy system are significantly higher than those of the Chinese energy system. However, even within the same energy system, the performance of each subsystem and market is completely different. Specifically, in the Chinese energy system, the green bond subsystem and renewable energy subsystem are the main risk connectors, contributing to the risk spillover effects of [47.96%, 48.25%] and [110.21%, 111.18%], respectively (the values include both “to other markets” and “from other markets”). However, due to the imbalanced market position of CATL and EVE, the net risk spillover of the former reached 29.55%, while the net risk spillover of the latter reached −29.26%. In other words, from the perspective of risk transmission, the former dominates the latter. However, in the European energy system, this obvious risk-dominated mode does not exist, and the risk reception and transmission in most markets are basically balanced. The value of risk spillover effects can reflect the market efficiency to a certain extent [43], and the EUA launched in 2005 has the highest market efficiency within the European energy system.
Previous studies have shown that the joint distribution modeling method based on the copula function or the DCC-GARCH model can effectively describe the joint distribution of multiple returns, thus improving the accuracy of the CoVaR value [44]. In order to verify the superiority of the model used in this paper, it was compared with the traditional quantile regression CoVaR model. Taking FR and DE as an example, the quantile regression estimation coefficient is 1.0765, which is significant at the 1% confidence level. Further, we calculated the CoVaR results based on the quantile regression model (FR-DE: %ΔCoVaR = 37.80%, DE-FR: %ΔCoVaR = 36.63%). The results show that, compared with the quantile regression method, the DCC-GARCH model is more cautious, which means that it can provide decisionmakers with a more scientific and reasonable judgment basis.

4. Conclusions and Policy Implications

4.1. Conclusions

The proposed “zero carbon” and “carbon neutrality” targets are the key measures for countries to address climate change issues. As a significant emitter, promoting clean pro-duction and environmental protection in the energy sector is essential to achieving carbon emission reduction targets. Conversely, the proposed carbon neutral target will also have an impact on the energy system, so as to bring risk contagion among the energy markets. As significant contributors to global carbon emissions and energy consumption, this risk spillover analysis of the Chinese and European energy markets not only helps to enhance their own energy systems but also provides other emerging economies with a reference and experiences. Thus, in-depth research on the risk spillover effects of multi-energy systems based on the DCC-GARCH-CoVaR model was conducted in this study, which not only identified the risk contagion among subsystems within the energy system but also obtained the risk transmission relationship between the internal markets of each subsystem. The following conclusions and policy implications can be drawn:
(1) Even though there are fewer markets in the European energy system studied in this research than there are in the Chinese energy system, the market linkage within the former system is nevertheless much stronger than that within the latter. Specifically, the dynamic correlation across markets within the same subsystem is more significant in the Chinese energy system. Of these, the relationship between GBI and CABI within the green bond subsystem is the closest. However, the situation in the European energy system is quite different. The linkage between EUA and CER within the carbon subsystem is not close, despite the fact that they are members of the same subsystem. On the contrary, some cross-subsystem markets have closer linkage relationships, such as EUA and GAS/OILEU within the fossil fuel subsystem.
(2) The high correlation between markets also leads to the large-scale diffusion of risks, and the risk spillovers within the European energy system are about 2.6 times that within the Chinese energy system. It appears difficult for the carbon subsystem to suffer risk spillovers with other markets or subsystems within the Chinese energy system due to limited market liquidity and trading activity. The emerging green bond and renewable energy subsystems, however, are more susceptible to risk transmission. With the exception of the sluggish CER market, other markets in the European energy system have maintained a risk spillover impact ranging from 40.68% to 105.80%. It is interesting to note that the EUA market, which also derives from the carbon subsystem, is the largest market for risk spillovers.

4.2. Policy Implications and Future Directions

Based on the aforementioned conclusions, the following policy implications are pro-posed:
(1) For the market regulators and policymakers of the Chinese energy system, it is essential to strengthen supervision of the linkage among the energy markets and form a thorough risk management and monitoring system. On the basis of the research results in this paper, they can make effective risk responses from the following aspects:
Establish a cross-departmental/subsystem collaboration mechanism and release risk warning information (e.g., explore and establish real-time data-sharing platforms).
Strengthen the supervision of false information to avoid the large-scale transmission of risks and crack down on the trading behaviors of manipulating the energy markets. When there is a serious risk of contagion, cross-market circuit breakers can be introduced into the system.
Establish a closed-loop risk prevention and control mechanism of “pre-event, during the event, and post-event”. Of these, it is necessary to strengthen the identification of key risk points in advance, closely track and monitor the changes in risks during the process, and summarize the reasons and prepare for the next risk response afterwards.
The suggestions above also apply to the European energy system. However, the market regulators should concentrate more on the price fluctuations and risk spillovers from the EUA market. In the fourth phase of the EU ETS (2021–2030), stricter carbon emission control and targeted carbon leakage rules have been implemented. The constraints on the allowance amount and the gradual cancellation of free allowance distribution will further affect the EUA market, resulting in wider risk transmission. To this end, European policymakers need to vigorously improve policies related to the carbon market, such as expanding the coverage of entities and steadily promoting non-free allowances.
(2) For investors with information barriers, there is a lag in their perception of macroeconomic policy adjustments and energy market risks, resulting in investment losses caused by difficulty in rapidly altering their investment plans. As a result, investors should improve the information acquisition capabilities and actively follow the latest advancements in energy systems, especially those with high-risk spillover markets and subsystems. Moreover, investors can refer to the conclusions of this paper to diversify and optimize investment strategies centered on energy markets with minimal risk linkages. In addition, investors should undoubtedly improve their understanding of the energy market and develop sound investing ideas.

4.3. Limations and Future Directions

Although this paper has conducted extensive research on the energy systems of China and Europe, data factors still constrain its progress towards broader and more comprehensive results and conclusions. For instance, it is difficult to find suitable alternative/supplementary segments for some subsystems in the European energy system. In the future, we will strive to improve the completeness of data and further carry out analyses of risk spillovers of other major energy consumption and carbon emission entities. Moreover, cross-border energy system risk spillovers may be also a possible future research direction. From the perspective of risk contagion, an in-depth analysis of the major reasons behind this phenomenon would also be noteworthy. In a follow-up study, we will further explore the key policy events and explore the impact and effect of these major events.
From the perspective of the model, the DCC-GARCH-CoVaR model was adopted to solve the risk spillover issue in the energy system presented in this paper. Indeed, the superiority of this method in solving the problems has been demonstrated through previous research and comparative analysis. However, it cannot be denied that no model can be applied to all scenarios and problems simultaneously. Therefore, in the next step of our research, we plan to use a broader range of models for a comparative analysis to enhance the scientific rationality of the study.

Author Contributions

Conceptualization, F.L. and H.Y.; data curation, Y.C. and X.S.; writing—original draft preparation, Y.Z. and S.G.; methodology, Y.Z. and S.G.; supervision, F.L. and H.Y.; project administration, Y.C. and X.S. All authors have read and agreed to the published version of the manuscript.

Funding

This research received no external funding.

Data Availability Statement

The data presented in this study are available on request from the corresponding author due to the non-free database.

Acknowledgments

Thanks are due to the editors and reviewers for their valuable opinions, which were of great help in improving the quality of this paper.

Conflicts of Interest

Authors Fei Liu, Honglin Yao, Yanan Chen and Xingbei Song were employed by the State Grid Zhejiang Electric Power Co., Ltd., Construction Company. Author Yihang Zhao was employed by the Electric Power Development Research Institute Co., Ltd. The remaining authors declare that the research was conducted in the absence of any commercial or financial relationships that could be construed as a potential conflict of interest.

Appendix A

Figure A1. The ROR data of each market.
Energies 18 03515 g0a1
Table A1. The ROR descriptive statistics of the markets above.
SystemSubsystemMarketMeanStd. Dev.SkewnessKurtosisJarque–BeraADFARCH-LM
Chinese energy systemFossil fuel subsystemCOAL0.10433.2165−0.82077.3934430.7572 ***−18.3385 ***19.2280 ***
OILC0.20162.56870.02185.4523117.8068 ***−22.0917 ***6.3845 **
Electricity subsystemHPI0.05163.23720.41764.479862.5585 ***−13.7080 ***6.5484 ***
CYPC0.01131.39260.47006.3238258.5118 ***−24.2166 ***11.8732 ***
Green bond subsystemGBI0.02010.0484−1.258217.35234600.2970 ***−14.2292 ***5.6678 **
CABI0.01710.0420−1.222814.27122882.0990 ***−10.1037 ***4.3417 **
Renewable energy subsystemCATL0.12053.32320.22953.581911.9023 ***−23.0237 ***2.0114 *
EVE0.10703.97420.11804.386042.8287 ***−22.5658 ***2.5906 *
Carbon subsystemGDC0.20012.00641.121117.44844631.9520 ***−22.2121 ***8.6952 ***
SZC0.204348.58080.212812.62312010.3590 ***−17.5273 ***34.7957 ***
European energy systemFossil fuel subsystemOILEU0.00273.6528−1.500320.72835967.5210 ***−18.8339 ***33.4743 ***
GAS0.12305.12051.05248.5743655.3266 ***−19.4518 ***19.5326 ***
Electricity subsystemFR0.146418.03710.373611.27841275.2880 ***−13.8886 ***17.7792 ***
DE−0.139728.7529−0.856819.19904875.7060 ***−15.9073 ***7.9900 ***
Green bond subsystemFVGB−0.00370.5588−0.02626.3820211.1739 ***−21.5612 ***19.7712 ***
Renewable energy subsystemRECT0.13562.0757−1.258914.21552438.8220 ***−23.8014 ***49.6787 ***
Carbon subsystemEUA0.10812.9255−0.32457.2389339.4404 ***−22.6379 ***7.5680 ***
CER0.18672.99501.117913.84202262.0290 ***−13.7515 ***14.1395 ***
Noted: * represents significance at the 10% level; ** represents significance at the 5% level; *** represents significance at the 1% level.
Figure A2. The dynamic correlation coefficients between markets of the Chinese energy system.
Energies 18 03515 g0a2
Figure A3. The dynamic correlation coefficients between markets of the European energy system.
Energies 18 03515 g0a3

References

  1. Ivanova, M. Everyone, everywhere: The global challenge of climate change. Nature 2020, 579, 488–489. [Google Scholar] [CrossRef]
  2. Zhao, Y.; Su, Q.; Li, B.; Zhang, Y.; Wang, X.; Zhao, H.; Guo, S. Have those countries declaring “zero carbon” or “carbon neutral” climate goals achieved carbon emissions-economic growth decoupling? J. Clean. Prod. 2022, 363, 132450. [Google Scholar] [CrossRef]
  3. Gao, R.; Zhao, Y.; Zhang, B. The spillover effects of economic policy uncertainty on the oil, gold, and stock markets: Evidence from China. Int. J. Financ. Econ. 2021, 26, 2134–2141. [Google Scholar] [CrossRef]
  4. Gong, X.; Zhao, M.; Wu, Z.; Jia, K.; Xiong, X. Research on tail risk contagion in international energy markets—The quantile time-frequency volatility spillover perspective. Energy Econ. 2023, 121, 106678. [Google Scholar] [CrossRef]
  5. Su, X. Measuring extreme risk spillovers across international stock markets: A quantile variance decomposition analysis. N. Am. J. Econ. Financ. 2020, 51, 101098. [Google Scholar] [CrossRef]
  6. Chen, J.; Wang, X. Asymmetric Risk Spillovers Between China and ASEAN Stock Markets. IEEE Access 2021, 9, 141479–141503. [Google Scholar] [CrossRef]
  7. Zheng, H.; Gao, C.; Deng, J. Tail risk spillover and systemic importance among fossil energy markets: Evidence from China. N. Am. J. Econ. Financ. 2025, 79, 102461. [Google Scholar] [CrossRef]
  8. Zhou, W.; Chen, Y.; Chen, J. Risk spread in multiple energy markets: Extreme volatility spillover network analysis before and during the COVID-19 pandemic. Energy 2022, 256, 124580. [Google Scholar] [CrossRef]
  9. Bai, L.; Wei, Y.; Zhang, J.; Wang, Y.; Lucey, B. Diversification effects of China’s carbon neutral bond on renewable energy stock markets: A minimum connectedness portfolio approach. Energy Econ. 2023, 123, 106727. [Google Scholar] [CrossRef]
  10. An, S.; Gao, X.; An, H.; An, F.; Sun, Q.; Liu, S. Windowed volatility spillover effects among crude oil prices. Energy 2020, 200, 117521. [Google Scholar] [CrossRef]
  11. Xiao, Z.; Ma, S.; Sun, H.; Ren, J.; Feng, C.; Cui, S. Time-varying spillovers among pilot carbon emission trading markets in China. Environ. Sci. Pollut. Res. 2022, 29, 57421–57436. [Google Scholar] [CrossRef] [PubMed]
  12. Han, L.; Kordzakhia, N.; Trück, S. Volatility spillovers in Australian electricity markets. Energy Econ. 2020, 90, 104782. [Google Scholar] [CrossRef]
  13. Mensi, W.; Rehman, M.; Vo, X. Impacts of COVID-19 outbreak, macroeconomic and financial stress factors on price spillovers among green bond. Int. Rev. Financ. Anal. 2022, 81, 102125. [Google Scholar] [CrossRef] [PubMed]
  14. Zhou, W.; Gu, Q.; Chen, J. From volatility spillover to risk spread: An empirical study focuses on renewable energy markets. Renew. Energy 2021, 180, 329–342. [Google Scholar] [CrossRef]
  15. Liu, T.; He, X.; Nakajima, T.; Hamori, S. Influence of Fluctuations in Fossil Fuel Commodities on Electricity Markets: Evidence from Spot and Futures Markets in Europe. Energies 2020, 13, 1900. [Google Scholar] [CrossRef]
  16. Deng, J.; Guan, S.; Zheng, H.; Xing, X.; Liu, C. Dynamic spillovers and asymmetric connectedness between fossil energy and green financial markets: Evidence from China. Front. Energy Res. 2022, 10, 986341. [Google Scholar] [CrossRef]
  17. Yousaf, I.; Nekhili, R.; Umar, M. Extreme connectedness between renewable energy tokens and fossil fuel markets. Energy Econ. 2022, 114, 106305. [Google Scholar] [CrossRef]
  18. Zhao, Y.; Zhou, Z.; Zhang, K.; Huo, Y.; Sun, D.; Zhao, H.; Sun, J.; Guo, S. Research on spillover effect between carbon market and electricity market: Evidence from Northern Europe. Energy 2023, 263, 126107. [Google Scholar] [CrossRef]
  19. Jiang, D.; Jia, F. Extreme Spillover between Green Bonds and Clean Energy Markets. Sustainability 2022, 14, 6338. [Google Scholar] [CrossRef]
  20. Huang, J.; Zheng, B.; Du, M. How digital economy mitigates urban carbon emissions: The green facilitative power of industrial coagglomeration. Appl. Econ. 2025, 1–19. [Google Scholar] [CrossRef]
  21. Dias, A. Market capitalization and Value-at-Risk. J. Bank. Financ. 2013, 37, 5248–5260. [Google Scholar] [CrossRef]
  22. Sheng, J.; Li, J.; Yang, J.; Wang, Y.; Li, J. High-dimensional CoVaR risk spillover network from oil market to global stock markets—Lessons from the Kyoto Protocol. Front. Environ. Sci. 2023, 11, 1103625. [Google Scholar] [CrossRef]
  23. Keilbar, G.; Wang, W. Modelling systemic risk using neural network quantile regression. Empir. Econ. 2021, 62, 93–118. [Google Scholar] [CrossRef]
  24. Usman, M.; Jibran, M.; Amir-ud-Din, R.; Akhter, W. Decoupling hypothesis of Islamic stocks: Evidence from copula CoVaR approach. Borsa Istanb. Rev. 2019, 19, 56–63. [Google Scholar] [CrossRef]
  25. Cao, Y. Extreme risk spillovers across financial markets under different crises. Econ. Model. 2022, 116, 106026. [Google Scholar] [CrossRef]
  26. Bibi, A.; Kimouche, K. Whittle estimation in multivariate CCC-GARCH processes. Commun. Stat.-Theory Methods 2018, 48, 3921–3940. [Google Scholar] [CrossRef]
  27. Zhao, H.; Li, J.; Lei, Y.; Zhou, M. Risk spillover of banking across regions: Evidence from the belt and road countries. Emerg. Mark. Rev. 2022, 52, 100919. [Google Scholar] [CrossRef]
  28. Oh, D.; Park, Y. GARCH option pricing with volatility derivatives. J. Bank. Financ. 2023, 146, 106718. [Google Scholar] [CrossRef]
  29. Zhang, W.; He, X.; Hamori, S. Volatility spillover and investment strategies among sustainability-related financial indexes: Evidence from the DCC-GARCH-based dynamic connectedness and DCC-GARCH t-copula approach. Int. Rev. Financ. Anal. 2022, 83, 102223. [Google Scholar] [CrossRef]
  30. Pham, S.; Nguyen, T.; Do, H. Dynamic volatility connectedness between thermal coal futures and major cryptocurrencies: Evidence from China. Energy Econ. 2022, 112, 106114. [Google Scholar] [CrossRef]
  31. Cui, J.; Maghyereh, A. Time-frequency dependence and connectedness among global oil markets: Fresh evidence from higher-order moment perspective. J. Commod. Mark. 2023, 30, 100323. [Google Scholar] [CrossRef]
  32. Yi, R.; Li, B. The Pricing Model and Decomposition Measure of Stock Price: Based on the Perspective of Input-output Conversion and Relative Pricing. Chin. J. Manag. Sci. 2010, 18, 14–20. [Google Scholar]
  33. Guo, Y.; Deng, Y.; Zhang, H. How do composite and categorical economic policy uncertainties affect the long-term correlation between China’s stock and conventional/green bond markets? Financ. Res. Lett. 2023, 57, 104148. [Google Scholar] [CrossRef]
  34. Shi, Y.; Feng, Y.; Zhang, Q.; Shuai, J.; Niu, J. Does China’s new energy vehicles supply chain stock market have risk spillovers? Evidence from raw material price effect on lithium batteries. Energy 2023, 262, 125420. [Google Scholar] [CrossRef]
  35. Liu, X.; Jin, Z. An analysis of the interactions between electricity, fossil fuel and carbon market prices in Guangdong, China. Energy Sustain. Dev. 2020, 55, 82–94. [Google Scholar] [CrossRef]
  36. Chen, Y.; Wang, C.; Miao, J.; Zhou, T. Identifying Risk Transmission in Carbon Market With Energy, Commodity and Financial Markets: Evidence from Time-Frequency and Extreme Risk Spillovers. Front. Energy Res. 2022, 10, 922808. [Google Scholar] [CrossRef]
  37. Yang, Y.; Shao, Y.; Shao, H.; Song, X. The Time-Dependent Lead-Lag Relationship Between WTI and Brent Crude Oil Spot Markets. Front. Phys. 2020, 8, 132. [Google Scholar] [CrossRef]
  38. Li, R.; Joyeux, R.; Ripple, R. International Natural Gas Market Integration. Energy J. 2014, 35, 159–179. [Google Scholar] [CrossRef]
  39. Hanif, W.; Hernandez, J.; Mensi, W.; Kang, S.; Uddin, G.; Yoon, S. Nonlinear dependence and connectedness between clean/renewable energy sector equity and European emission allowance prices. Energy Econ. 2021, 101, 105409. [Google Scholar] [CrossRef]
  40. Reboredo, J. Volatility spillovers between the oil market and the European Union carbon emission market. Econ. Model. 2014, 36, 229–234. [Google Scholar] [CrossRef]
  41. Zeng, S.; Jia, J.; Su, B.; Jiang, C.; Zeng, G. The volatility spillover effect of the European Union (EU) carbon financial market. J. Clean. Prod. 2021, 282, 124394. [Google Scholar] [CrossRef]
  42. Wang, X.; Wang, W. The Risk Spillover Effect Between Carbon and Power Market—Based on BK Spillover Model. J. Ind. Technol. Econ. 2022, 41, 53–62. [Google Scholar]
  43. Wang, W.; Zhou, W.; Li, J.; Huang, Y. Volatility spillovers among Chinese carbon markets. China Popul. Resour. Environ. 2016, 26, 63–69. [Google Scholar]
  44. Wang, Z.; Lv, S.; Mao, X. A Study on Effectiveness of CoVaR Calculation Methods Based on Risk Spillover Features. Econ. Rev. 2014, 148–160. [Google Scholar] [CrossRef]
Figure 1. The recent literature on risk spillover within the energy system [10,11,12,13,14,15,16,17,18,19].
Energies 18 03515 g001
Figure 2. The framework diagram of Chinese energy system and subsystems.
Energies 18 03515 g002
Figure 3. The framework diagram of European energy system and subsystems.
Energies 18 03515 g003
Figure 4. The research framework of this paper.
Energies 18 03515 g004
Figure 5. The risk spillover network diagram of the Chinese energy system.
Energies 18 03515 g005
Figure 6. The risk spillover network diagram of the European energy system.
Energies 18 03515 g006
Table 1. The typical representatives selected in each subsystem.
SystemSubsystemTypical RepresentativesAbbreviations
Chinese energy systemFossil fuel subsystemThermal coal (ZCE) [30]COAL
Daqing oil [31]OILC
Electricity subsystemHuaneng Power International, Inc. [32]HPI
China Yangtze Power Co., Ltd.CYPC
Green bond subsystemChina Green Bond Index [33]GBI
China Climate-Aligned Bond IndexCABI
Renewable energy subsystemContemporary Amperex Technology Co., Limited [34]CATL
EVE Energy Co., Ltd.EVE
Carbon subsystemGuangdong’s carbon market [35]GDC
Shenzhen’s carbon market [36]SZC
European energy systemFossil fuel subsystemBrent Oil [37]OILEU
NBP natural gas [38]GAS
Electricity subsystemFrance’s electricity market [18]FR
Germany’s electricity market [18]DE
Green bond subsystemFranklin Euro green bondsFVGB
Renewable energy subsystemS&P/TSX Renewable Energy and Clean Technology Index [39]RECT
Carbon subsystemEuropean Union allowances [40]EUA
Certified emission reduction [41]CER
Table 2. The parameter estimation results of the single variable GARCH model.
SystemSubsystemMarket α i + β i
Chinese energy systemFossil fuel subsystemCOAL0.9983
OILC0.946
Electricity subsystemHPI0.9957
CYPC0.8608
Green bond subsystemGBI0.8618
CABI0.875
Renewable energy subsystemCATL0.8995
EVE0.5501
Carbon subsystemGDC0.432
SZC0.9932
Table 3. The compliance of Chinese markets with the standard of the bi-variable GARCH model.
MarketPass InspectionMarketFail to Pass Inspection
COAL-HPICOAL-OILC
COAL-CABICOAL-CYPC
COAL-CATLCOAL-GBI
COAL-EVECOAL-GDC
OILC-CATLCOAL-SZC
OILC-EVEOILC-HPI
OILC-SZCOILC-CYPC
HPI-CYPCOILC-GBI
HPI-GBIOILC-CABI
HPI-CATLOILC-GDC
HPI-EVEHPI-CABI
GBI-CABIHPI-GDC
GBI-SZCHPI-SZC
CABI-SZCCYPC-GBI
CATL-EVECYPC-CABI
CATL-SZCCYPC-CATL
EVE-GDCCYPC-EVE
CYPC-GDC
CYPC-SZC
GBI-CATL
GBI-EVE
GBI-GDC
CABI-CATL
CABI-EVE
CABI-GDC
CATL-GDC
EVE-SZC
GDC-SZC
Table 4. The descriptive statistical results of the dynamic correlation coefficients between markets of the Chinese energy system.
MarketMeanMedianMaximumMinimumStd. Dev.
COAL-HPI0.02900.02810.4380−0.43480.0844
COAL-CABI0.01120.01200.0266−0.00760.0057
COAL-CATL0.01190.01820.2700−0.27460.1022
COAL-EVE0.02630.03800.0896−0.06720.0368
OILC-CATL−0.0343−0.03280.1455−0.23210.0554
OILC-EVE−0.0143−0.01050.1814−0.18070.0451
OILC-SZC0.01890.02980.1708−0.14980.0676
HPI-CYPC0.30930.30810.51810.11770.0470
HPI-GBI−0.0176−0.01760.0930−0.15810.0295
HPI-CATL0.05640.03250.2524−0.14870.1025
HPI-EVE0.03620.03230.2611−0.19200.0997
GBI-CABI0.85450.85460.97090.68580.0363
GBI-SZC0.06360.06310.3425−0.24330.0415
CABI-SZC0.03020.02980.2947−0.17100.0406
CATL-EVE0.69570.69380.75260.64410.0200
CATL-SZC0.03430.03980.1141−0.11730.0424
EVE-GDC−0.0072−0.00720.4745−0.44670.0970
Table 5. The TADCC between markets of the Chinese energy system.
MarketsTADCCRankMarketsTADCCRank
COAL-HPI0.05979HPI-CATL0.08006
COAL-CABI0.011517HPI-EVE0.08264
COAL-CATL0.08225GBI-CABI0.85521
COAL-EVE0.041013GBI-SZC0.06647
OILC-CATL0.050811CABI-SZC0.038514
OILC-EVE0.033915CATL-EVE0.69172
OILC-SZC0.058710CATL-SZC0.047912
HPI-CYPC0.30813EVE-GDC0.06548
HPI-GBI0.027116
Table 6. The risk spillover effects between markets of the Chinese energy system.
Market C o V a R Δ C o V a R % Δ C o V a R q i j Market C o V a R Δ C o V a R % Δ C o V a R q i j
COAL-HPI0.17290.17162.88%HPI-COAL0.15280.14692.79%
COAL-CABI0.00070.00071.12%CABI-COAL0.0721−0.1025−1.59%
COAL-CATL0.07370.06861.11%CATL-COAL0.02510.02471.17%
COAL-EVE0.17620.17072.55%EVE-COAL0.15350.14952.56%
OILC-CATL−0.1961−0.1874−3.28%CATL-OILC−0.1651−0.1585−3.29%
OILC-EVE−0.1003−0.0964−1.37%EVE-OILC−0.0717−0.0690−1.38%
OILC-SZC0.52310.92263.33%SZC-OILC0.08420.08351.87%
HPI-CYPC2.83280.69657.60%CYPC-HPI6.45481.59557.65%
HPI-GBI0.0685−0.00120.03%GBI-HPI5.0224−0.09540.03%
HPI-CATL5.72100.30160.30%CATL-HPI5.43670.35350.37%
HPI-EVE6.58010.23400.13%EVE-HPI5.29880.20880.14%
GBI-CABI0.08350.052854.03%CABI-GBI0.09490.060154.12%
GBI-SZC61.75923.56190.37%SZC-GNI0.07410.00460.39%
CABI-SZC59.80871.52300.08%SZC-CABI0.08670.04271.49%
CATL-EVE9.02044.439934.24%EVE-CATL5.0752−0.3611−4.95%
CATL-SZC60.69672.45500.14%SZC-CATL5.3893−0.0415−0.03%
EVE-GDC3.0699−0.03100.01%GDC-EVE6.44990.0705−0.01%
Table 7. The risk spillover effects to other markets and from other markets of the Chinese energy system.
SubsystemMarketTo Other MarketsFrom Other MarketsNet Spill Risk
Fossil fuel subsystemCOAL7.65%8.11%−0.46%
OILC7.99%6.54%1.44%
Electricity subsystemHPI10.85%11.07%−0.22%
CYPC7.65%7.60%0.04%
Green bond subsystemGBI54.43%54.54%−0.11%
CABI55.78%56.64%−0.86%
Renewable energy subsystemCATL39.21%9.66%29.55%
EVE9.04%38.30%−29.26%
Carbon subsystemGDC0.01%0.01%0.00%
SZC3.78%3.92%−0.13%
Table 8. Granger causality test between CATL and EVE.
Parameter
EVE does not Granger-cause CATL0.3082
CATL does not Granger-cause EVE2.2575 *
Note: * represents significance at the 10% confidence level.
Table 9. The parameter estimation results of the single variable GARCH model.
SystemSubsystemMarket α i + β i
European energy SystemFossil fuel subsystemOILEU0.9855
GAS0.9877
Electricity subsystemFR0.9609
DE0.6115
Green bond subsystemFVGB0.7581
Renewable energy subsystemRECT0.9149
Carbon subsystemEUA0.9117
CER0.9345
Table 10. The compliance of each market with the standard of the bi-variable GARCH model.
MarketPass InspectionMarketFail to Pass Inspection
OILEU-FROILEU-GAS
OILEU-DEOILEU-CER
OILEU-FVGBGAS-FR
OILEU-RECTGAS-RECT
OILEU-EUAGAS-CER
GAS-DEFR-RECT
GAS-FVGBFR-EUA
GAS-EUAFR-CER
FR-DEDE-FVGB
FR-FVGBDE-RECT
DE-EUADE-CER
FVGB-RECTRECT-CER
FVGB-EUA
FVGB-CER
RECT-EUA
EUA-CER
Table 11. The descriptive statistical results of the dynamic correlation coefficients between markets of the European energy system.
MarketMeanMedianMaximumMinimumStd. Dev.
OILEU-FR−0.0480−0.04950.2020−0.27030.0669
OILEU-DE0.01670.01340.2408−0.14550.0357
OILEU-FVGB−0.1957−0.1888−0.0053−0.42740.0522
OILEU-RECT0.24130.24230.7632−0.26590.1299
OILEU-EUA0.29890.31090.6752−0.49170.1252
GAS-DE0.04290.04140.3465−0.36160.1141
GAS-FVGB−0.0175−0.01650.2809−0.32930.0659
GAS-EUA0.39490.40170.8040−0.33660.1325
FR-DE0.73470.72740.85480.62360.0546
FR-FVGB0.05510.05630.3770−0.25800.0618
DE-EUA0.05750.05810.1084−0.00290.0178
FVGB-RECT−0.1320−0.13380.1673−0.46830.1377
FVGB-EUA−0.1053−0.10930.2281−0.41650.0740
FVGB-CER0.02210.02210.2864−0.18490.0426
RECT-EUA0.22880.22830.41930.06300.0673
EUA-CER0.00440.00940.0331−0.03630.0168
Table 12. The TADCC between markets of the European energy system.
MarketsTADCCRankMarketsTADCCRank
OILEU-FR0.066011FR-DE0.73471
OILEU-DE0.025715FR-FVGB0.066510
OILEU-FVGB0.19576DE-EUA0.057512
OILEU-RECT0.24754FVGB-RECT0.15427
OILEU-EUA0.30443FVGB-EUA0.11498
GAS-DE0.09169FVGB-CER0.034414
GAS-FVGB0.048413RECT-EUA0.22885
GAS-EUA0.39842EUA-CER0.014816
Table 13. The risk spillover effects between markets of the European energy system.
Market C o V a R Δ C o V a R % Δ C o V a R q i j Market C o V a R % Δ C o V a R % Δ C o V a R q i j
OILEU-FR−1.1268−1.2236−5.21%FR-OILEU−0.1677−0.1672−4.79%
OILEU-DE0.84350.47110.93%DE-OILEU0.16460.16451.67%
OILEU-FVGB−0.1825−0.1826−19.58%FVGB-OILEU−1.0407−0.9694−18.23%
OILEU-RECT0.69670.678823.51%RECT-OILEU1.40151.367423.54%
OILEU-EUA1.41061.375329.14%EUA-OILEU1.65411.633729.52%
GAS-DE2.8360−0.0651−0.10%DE-GAS0.42710.42774.30%
GAS-FVGB−0.0158−0.0158−1.75%FVGB-GAS−0.1646−0.1786−1.90%
GAS-EUA1.80141.771438.83%EUA-GAS3.32253.327039.54%
FR-DE30.344030.942174.92%DE-FR19.552819.588473.60%
FR-FVGB0.04800.04805.51%FVGB-FR1.40742.51369.84%
DE-EUA0.26440.26365.73%EUA-DE2.60481.53433.39%
FVGB-RECT−0.4455−0.3911−11.59%RECT-FVGB−0.1324−0.1325−13.21%
FVGB-EUA−0.4818−0.4229−9.24%EUA-FVGB−0.1006−0.1006−10.53%
FVGB-CER0.10160.09342.03%CER-FVGB0.01980.01982.21%
RECT-EUA1.14191.081721.67%EUA-RECT0.71790.701622.36%
EUA-CER0.03170.03280.46%CER-EUA0.01690.01650.43%
Table 14. The risk spillover effects to other markets and from other markets of the European energy system.
SubsystemMarketTo Other MarketsFrom Other MarketsNet Spill Risk
Fossil fuel subsystemOILEU78.38%77.75%0.63%
GAS40.68%45.74%−5.06%
Electricity subsystemFR85.21%88.66%−3.44%
DE85.30%79.34%5.97%
Green bond subsystemFVGB52.83%52.79%0.04%
Renewable energy subsystemRECT58.43%57.46%0.97%
Carbon subsystemEUA105.80%105.05%0.74%
CER2.64%2.49%0.15%
Disclaimer/Publisher’s Note: The statements, opinions and data contained in all publications are solely those of the individual author(s) and contributor(s) and not of MDPI and/or the editor(s). MDPI and/or the editor(s) disclaim responsibility for any injury to people or property resulting from any ideas, methods, instructions or products referred to in the content.

