1. Introduction
To mitigate the global energy crisis, cut carbon emissions, and improve energy efficiency, the large-scale deployment of renewable energy has emerged as a key strategy for energy transformation. Although clean energy sources like solar and wind power offer notable environmental benefits, their intermittent and volatile nature presents substantial challenges to the stability of the power grid [
1,
2]. Against this backdrop, integrated energy systems (IESs) have been proposed as a sophisticated solution enabling multi-energy complementarity. Through the coordinated management of electricity, heating, and gas flows, IESs enhance cascade energy utilization far beyond that of conventional systems while also offering notable benefits in lowering carbon emission intensity [
3,
4,
5]. Recent reports indicate that most power utilities worldwide have launched IES pilot projects, signaling a transformative move from conventional single-energy supply models to integrated and diversified energy collaboration systems [
6].
Considerable progress has been achieved in IES planning research. For instance, ref. [
7] introduced an integrated planning framework that coordinates electricity, heat, and gas networks, effectively lowering carbon emissions and reducing system costs by utilizing a multi-stage dynamic optimization approach. In a more innovative approach, ref. [
8] proposed a bilateral planning framework based on Nash bargaining, which enhanced the overall benefits of community-level IESs and promoted fairer benefit allocation through a multi-party game-theoretic model. Notably, ref. [
9] proposed a low-carbon planning approach based on the entire lifecycle, which links carbon trading prices with the operational lifespan of equipment, offering a novel perspective for improving the economic efficiency of IESs.
While Energy Hub models have been extensively used in existing system modeling research, their shortcomings are increasingly evident. Conventional models primarily emphasize inter-system energy balance, often overlooking key factors such as line losses in the grid and the dynamic behavior of equipment, which can result in discrepancies between planning outcomes and actual engineering implementation [
10,
11]. Particularly in IESs with high renewable energy penetration, such simplified models may compromise system economic performance [
12].
Recent breakthroughs in Hydrogen Energy Storage Systems (HESSs) have introduced new opportunities for optimizing IESs. Emerging research indicates that modern HESS technologies offer higher cycle efficiency and lower costs, making them particularly effective in smoothing the variability in renewable energy sources [
13,
14]. Nonetheless, the limited dynamic response of HESSs in managing rapid power variations has driven research toward coordinated operation with battery energy storage systems (BESSs), forming hybrid storage strategies (HESS-BESS) [
15]. Empirical studies like [
16] reveal that incorporating battery storage systems (BESSs) as fast-response units improves system performance and extends energy storage lifespan.
Ongoing innovations in hybrid energy storage optimization have yielded promising results. The model introduced in [
17], which integrates electricity, hydrogen, and gas storage, enhances operational profitability and decreases reliance on external energy sources by leveraging revenue functions across multiple coupled markets. The comparative analyses in [
18] reveal that hybrid energy storage systems outperform single-storage configurations in terms of lifecycle cost and environmental impact, confirming the techno-economic benefits of multi-energy complementarity. While these advancements offer valuable theoretical support for IES planning, important challenges persist. Most existing models fail to sufficiently capture the dynamic influences of coupling technologies—such as Power-to-Hydrogen (P2H) and fuel cells—on power grid stability. Operational evidence suggests that the fluctuations introduced by these coupling devices can pose risks to system security [
19,
20].
The practical implementation of electric–hydrogen hybrid storage systems faces significant challenges tied to specific regional contexts and market structures. For instance, in regions with high renewable penetration but limited grid capacity (e.g., remote islands, rural grids, or industrial parks experiencing rapid renewable deployment), the inherent intermittency not only threatens grid stability (voltage deviations being a critical symptom) but also leads to substantial renewable curtailment during periods of excess generation. The concept of Local Electricity–Hydrogen Markets (LEHMs), as highlighted in recent research [
21], offers a promising framework for addressing these challenges. LEHMs propose utilizing surplus local renewable electricity for on-site hydrogen production via electrolysis, transforming the excess energy into a storable and versatile fuel. This approach directly tackles the root cause of voltage instability—renewable intermittency and load fluctuations—by providing a large-scale, flexible sink (electrolyzers) during periods of low demand/high generation and a controllable source (fuel cells) when needed. However, the economic viability and optimal sizing/placement of the hybrid storage components (BESSs and HESSs) within such localized energy systems are complex problems. Key challenges include the significant capital costs of electrolyzers and storage tanks, the efficiency losses in the power-to-hydrogen-to-power cycle, and the need for strategic siting to maximize grid support benefits like voltage stabilization. Our proposed multi-objective optimization model, explicitly incorporating grid voltage stability alongside cost and net load smoothing, directly addresses these critical planning challenges. It provides a quantitative framework for determining the economically and technically optimal configuration of electric–hydrogen storage within specific grid contexts, facilitating the practical realization of LEHM concepts and enhancing the resilience of distribution networks facing high renewable integration.
This study presents a novel multi-objective optimization approach tailored for electric–hydrogen hybrid energy storage systems. An enhanced IES model is developed, integrating multi-energy coupling dynamics, leading to three major technical innovations: First, an advanced HESS modeling framework that incorporates electrolyzer efficiency and hydrogen storage behavior is created. Second, voltage deviation-based stability metrics are introduced into the optimization objective to quantify grid performance. Third, an intelligent optimization architecture employing the Multi-Objective Artificial Hummingbird Algorithm (MOAHA) is constructed, which utilizes adaptive mutation strategies and Pareto front filtering for multi-dimensional optimization. Case studies verify that the proposed method significantly improves overall energy efficiency, reinforces voltage stability, and reduces the payback period of storage systems when compared to traditional approaches, offering key technical support for the evolution of modern power systems [
22].
Despite the growing interest in hybrid energy storage planning, most existing studies primarily emphasize economic or energy balancing objectives while overlooking voltage stability—a critical constraint in real-world distribution networks. Moreover, the dynamic impact of coupling devices such as electrolyzers and fuel cells on nodal voltage profiles is often ignored. To address this gap, this study proposes a multi-objective planning model that explicitly incorporates voltage deviation as a key optimization target, thus aligning technical feasibility with economic goals in the configuration of electric–hydrogen hybrid energy storage systems.
3. Objective Function
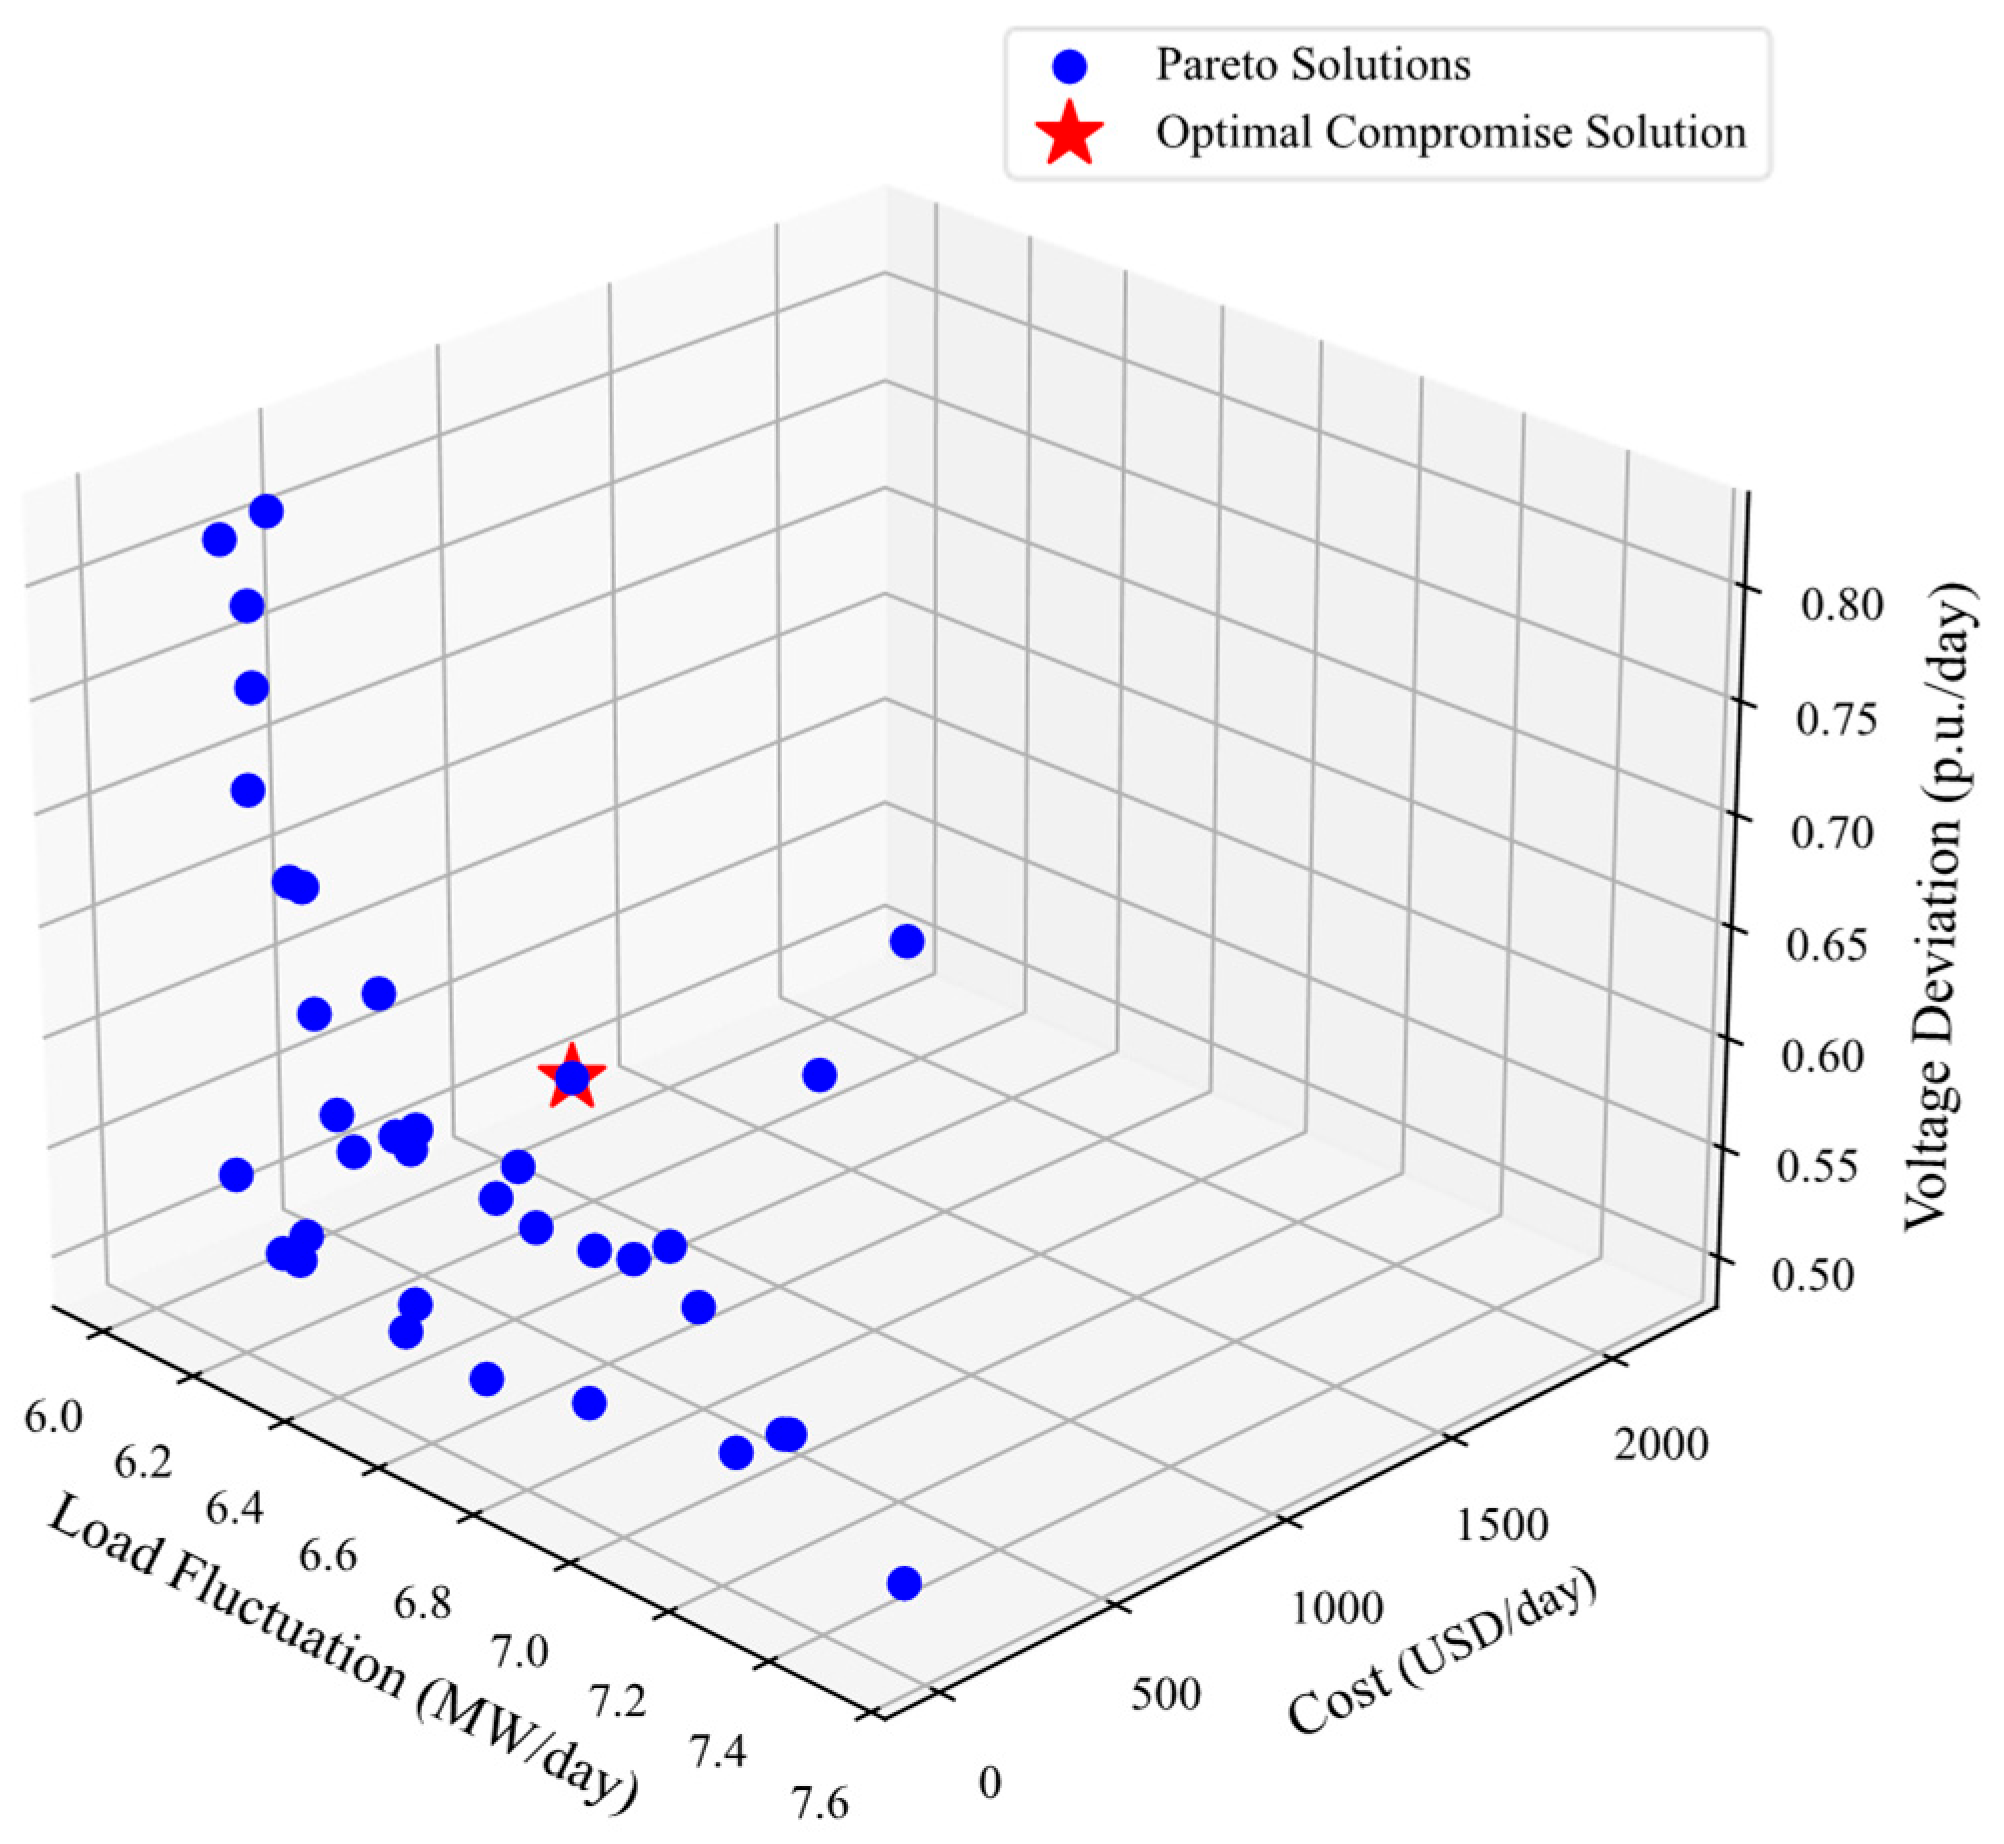
The optimization model is designed to simultaneously address economic and technical requirements. The total cost objective ensures the investment remains financially viable. Voltage deviation is included to promote voltage quality and enhance grid stability, especially under variable load and generation conditions. Net load fluctuation quantifies the smoothing effect of storage on renewable intermittency. Together, these three objectives reflect a balanced framework that optimizes both the cost-effectiveness and technical resilience of the integrated energy system.
3.1. Cost of Electric–Hydrogen Hybrid Energy Storage Configuration
The cost of planning and configuring electric–hydrogen hybrid energy storage mainly includes the total configuration cost, maintenance cost, replacement cost, and operational cost.
In this equation, indicates the total cost associated with configuring the energy storage system. , , and represent the maintenance, replacement, and operational costs of the energy storage system, respectively.
The total configuration cost is as follows:
In this equation, denotes the capital recovery factor. and correspond to the rated capacity and rated power of the i-th energy storage unit, respectively. is the number of configured units of type n. The terms and stand for the unit cost per capacity and per rated power, respectively. represents the expected lifetime of the energy storage system.
The maintenance cost is calculated as follows:
In this equation, is the maintenance coefficient of the energy storage system.
The replacement cost is as follows:
In this equation, refers to the replacement factor for the energy storage system. indicates how many times key components need to be replaced during the system’s service life. The parameter represents the annual cost decline rate, and r denotes the discount factor. In this study, the replacement cost coefficient is defined based on the expected operational lifespan of different energy storage components. Accordingly, the summation upper bound varies by equipment type: for the HESS (electrolyzer and fuel cell), it is set to 8–10 years; for the BESS, it is assumed to be 12–15 years. These values reflect typical service life ranges and are applied in the calculation of discounted replacement costs. The discount rate r used in the replacement cost model is set at 5%, representing a typical value for long-term infrastructure investments. The cost reduction rate θ is assumed to be 1.5% per year, reflecting technological learning and manufacturing scale-up trends in energy storage systems.
The operational cost is as follows:
In this equation, and represent the unit costs of energy purchase and sale, respectively.
A cost comparison is shown in
Table 2.
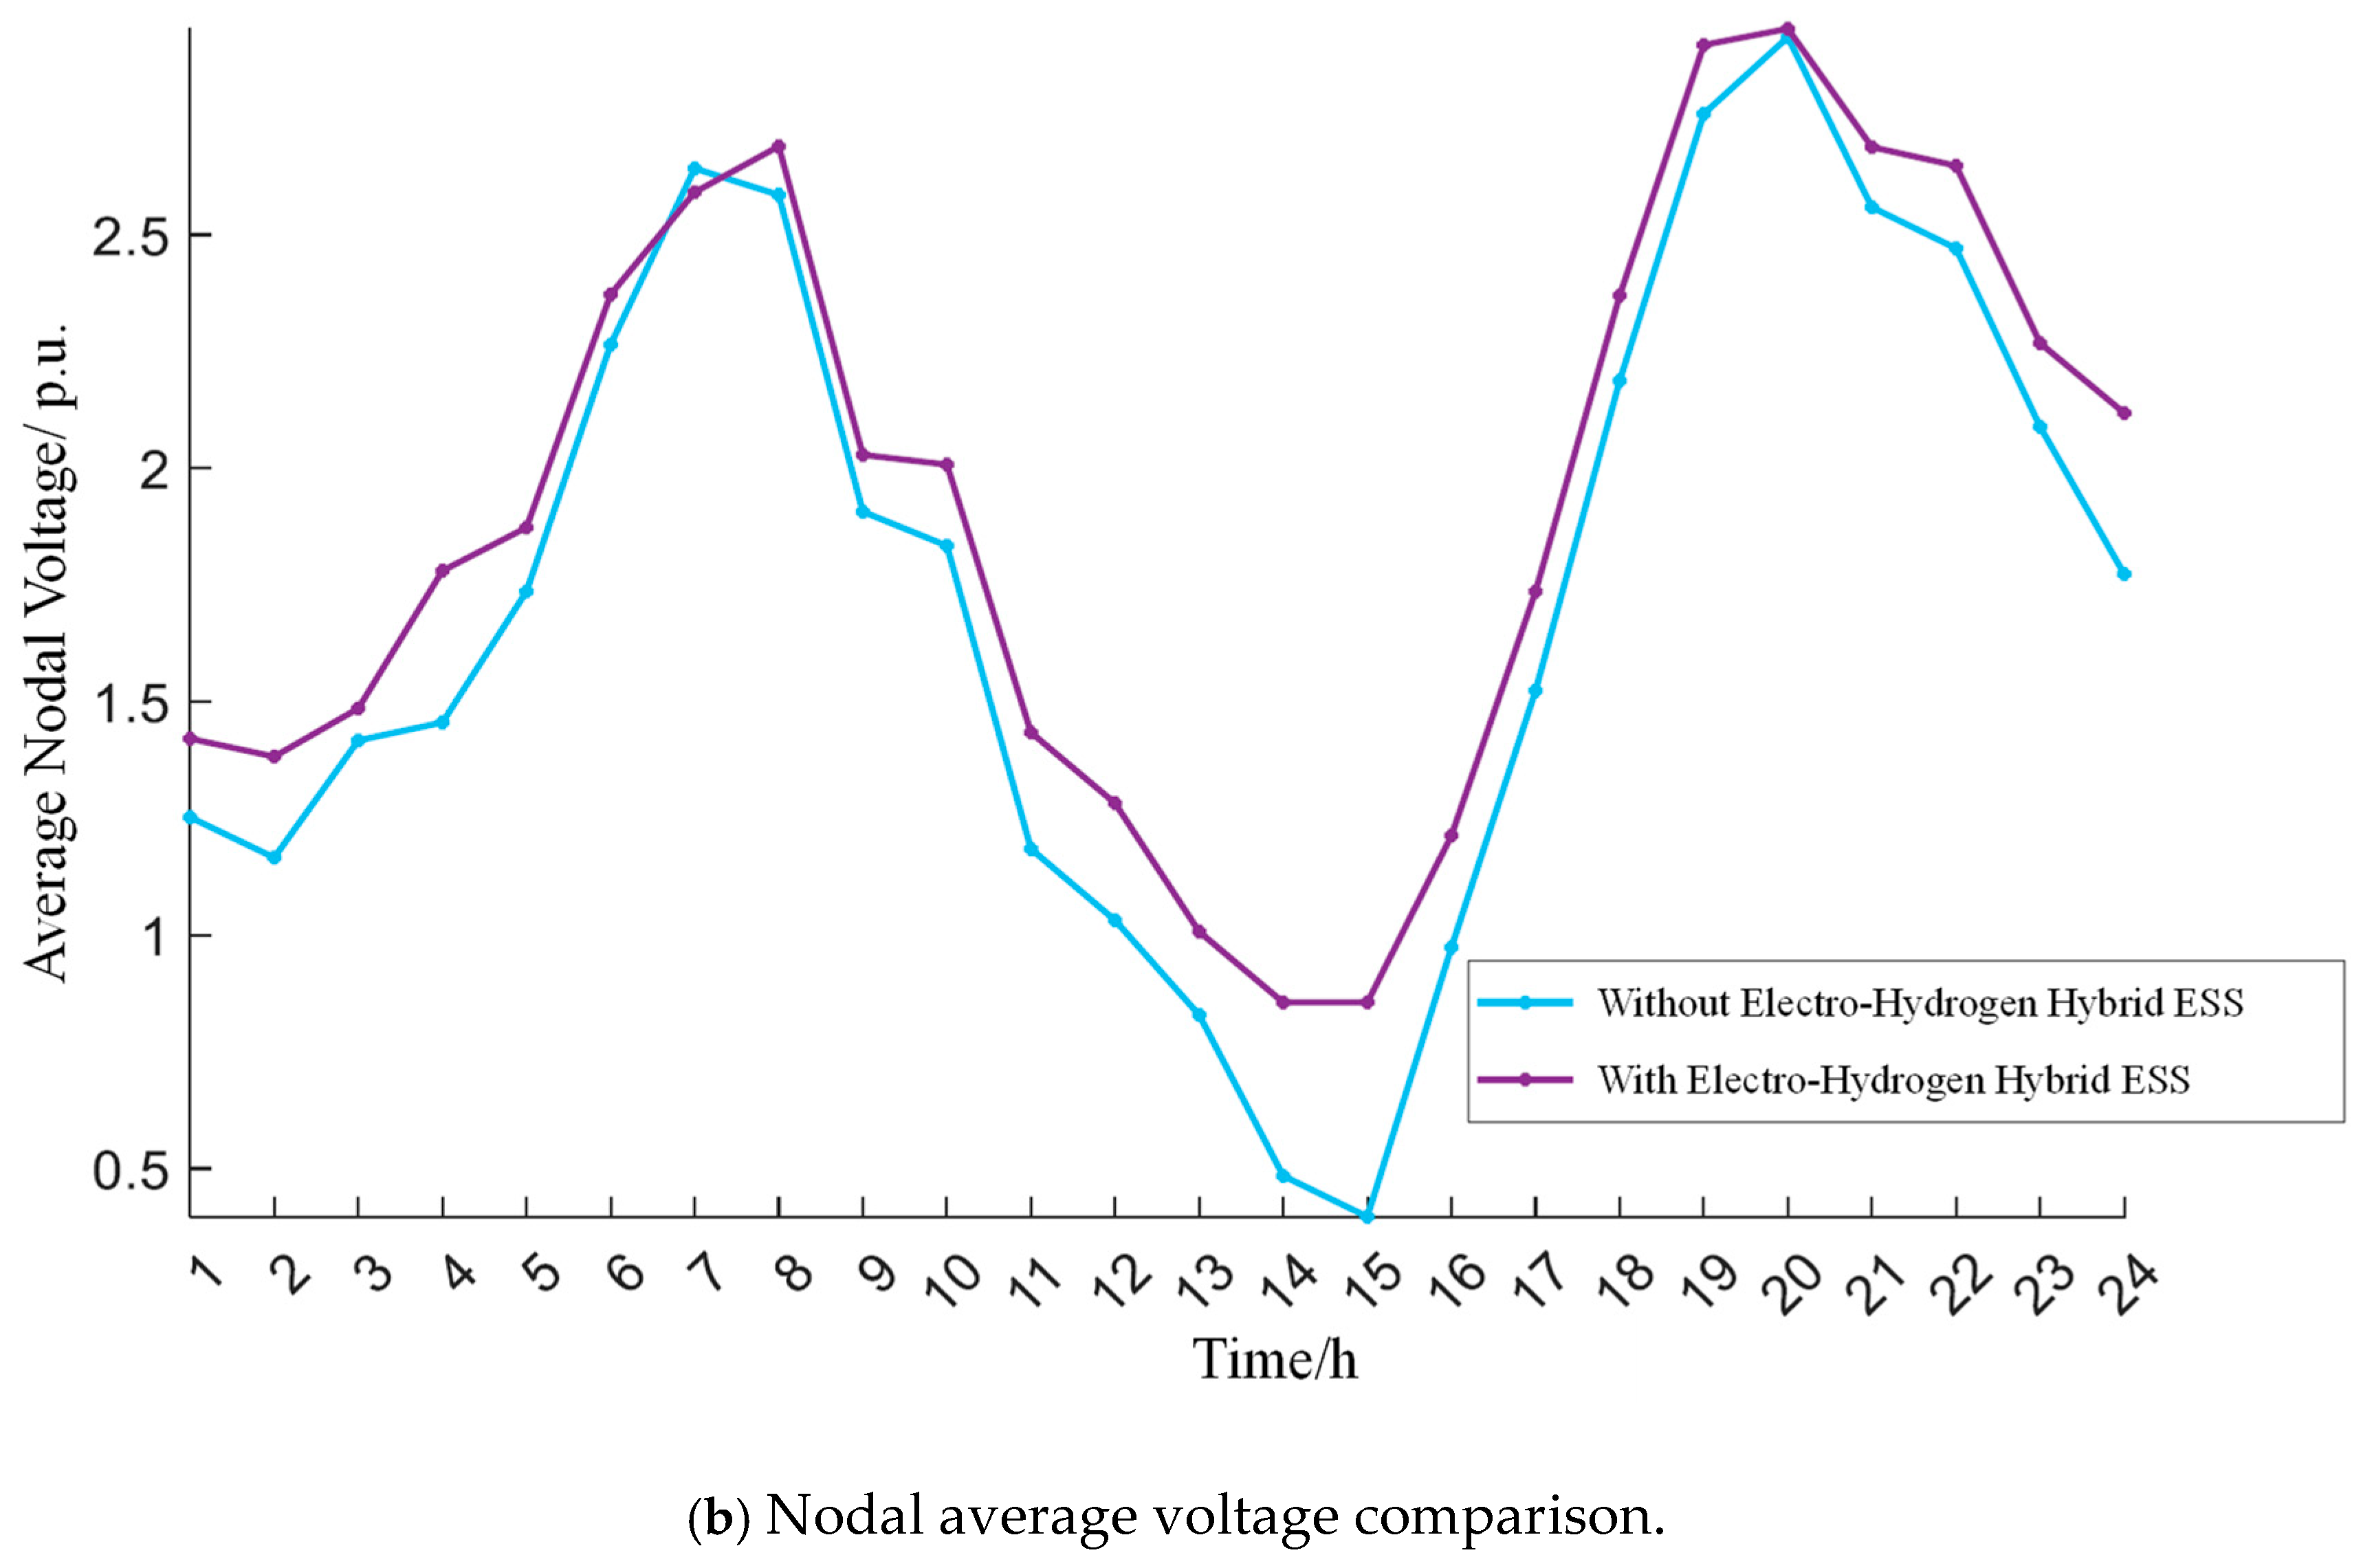
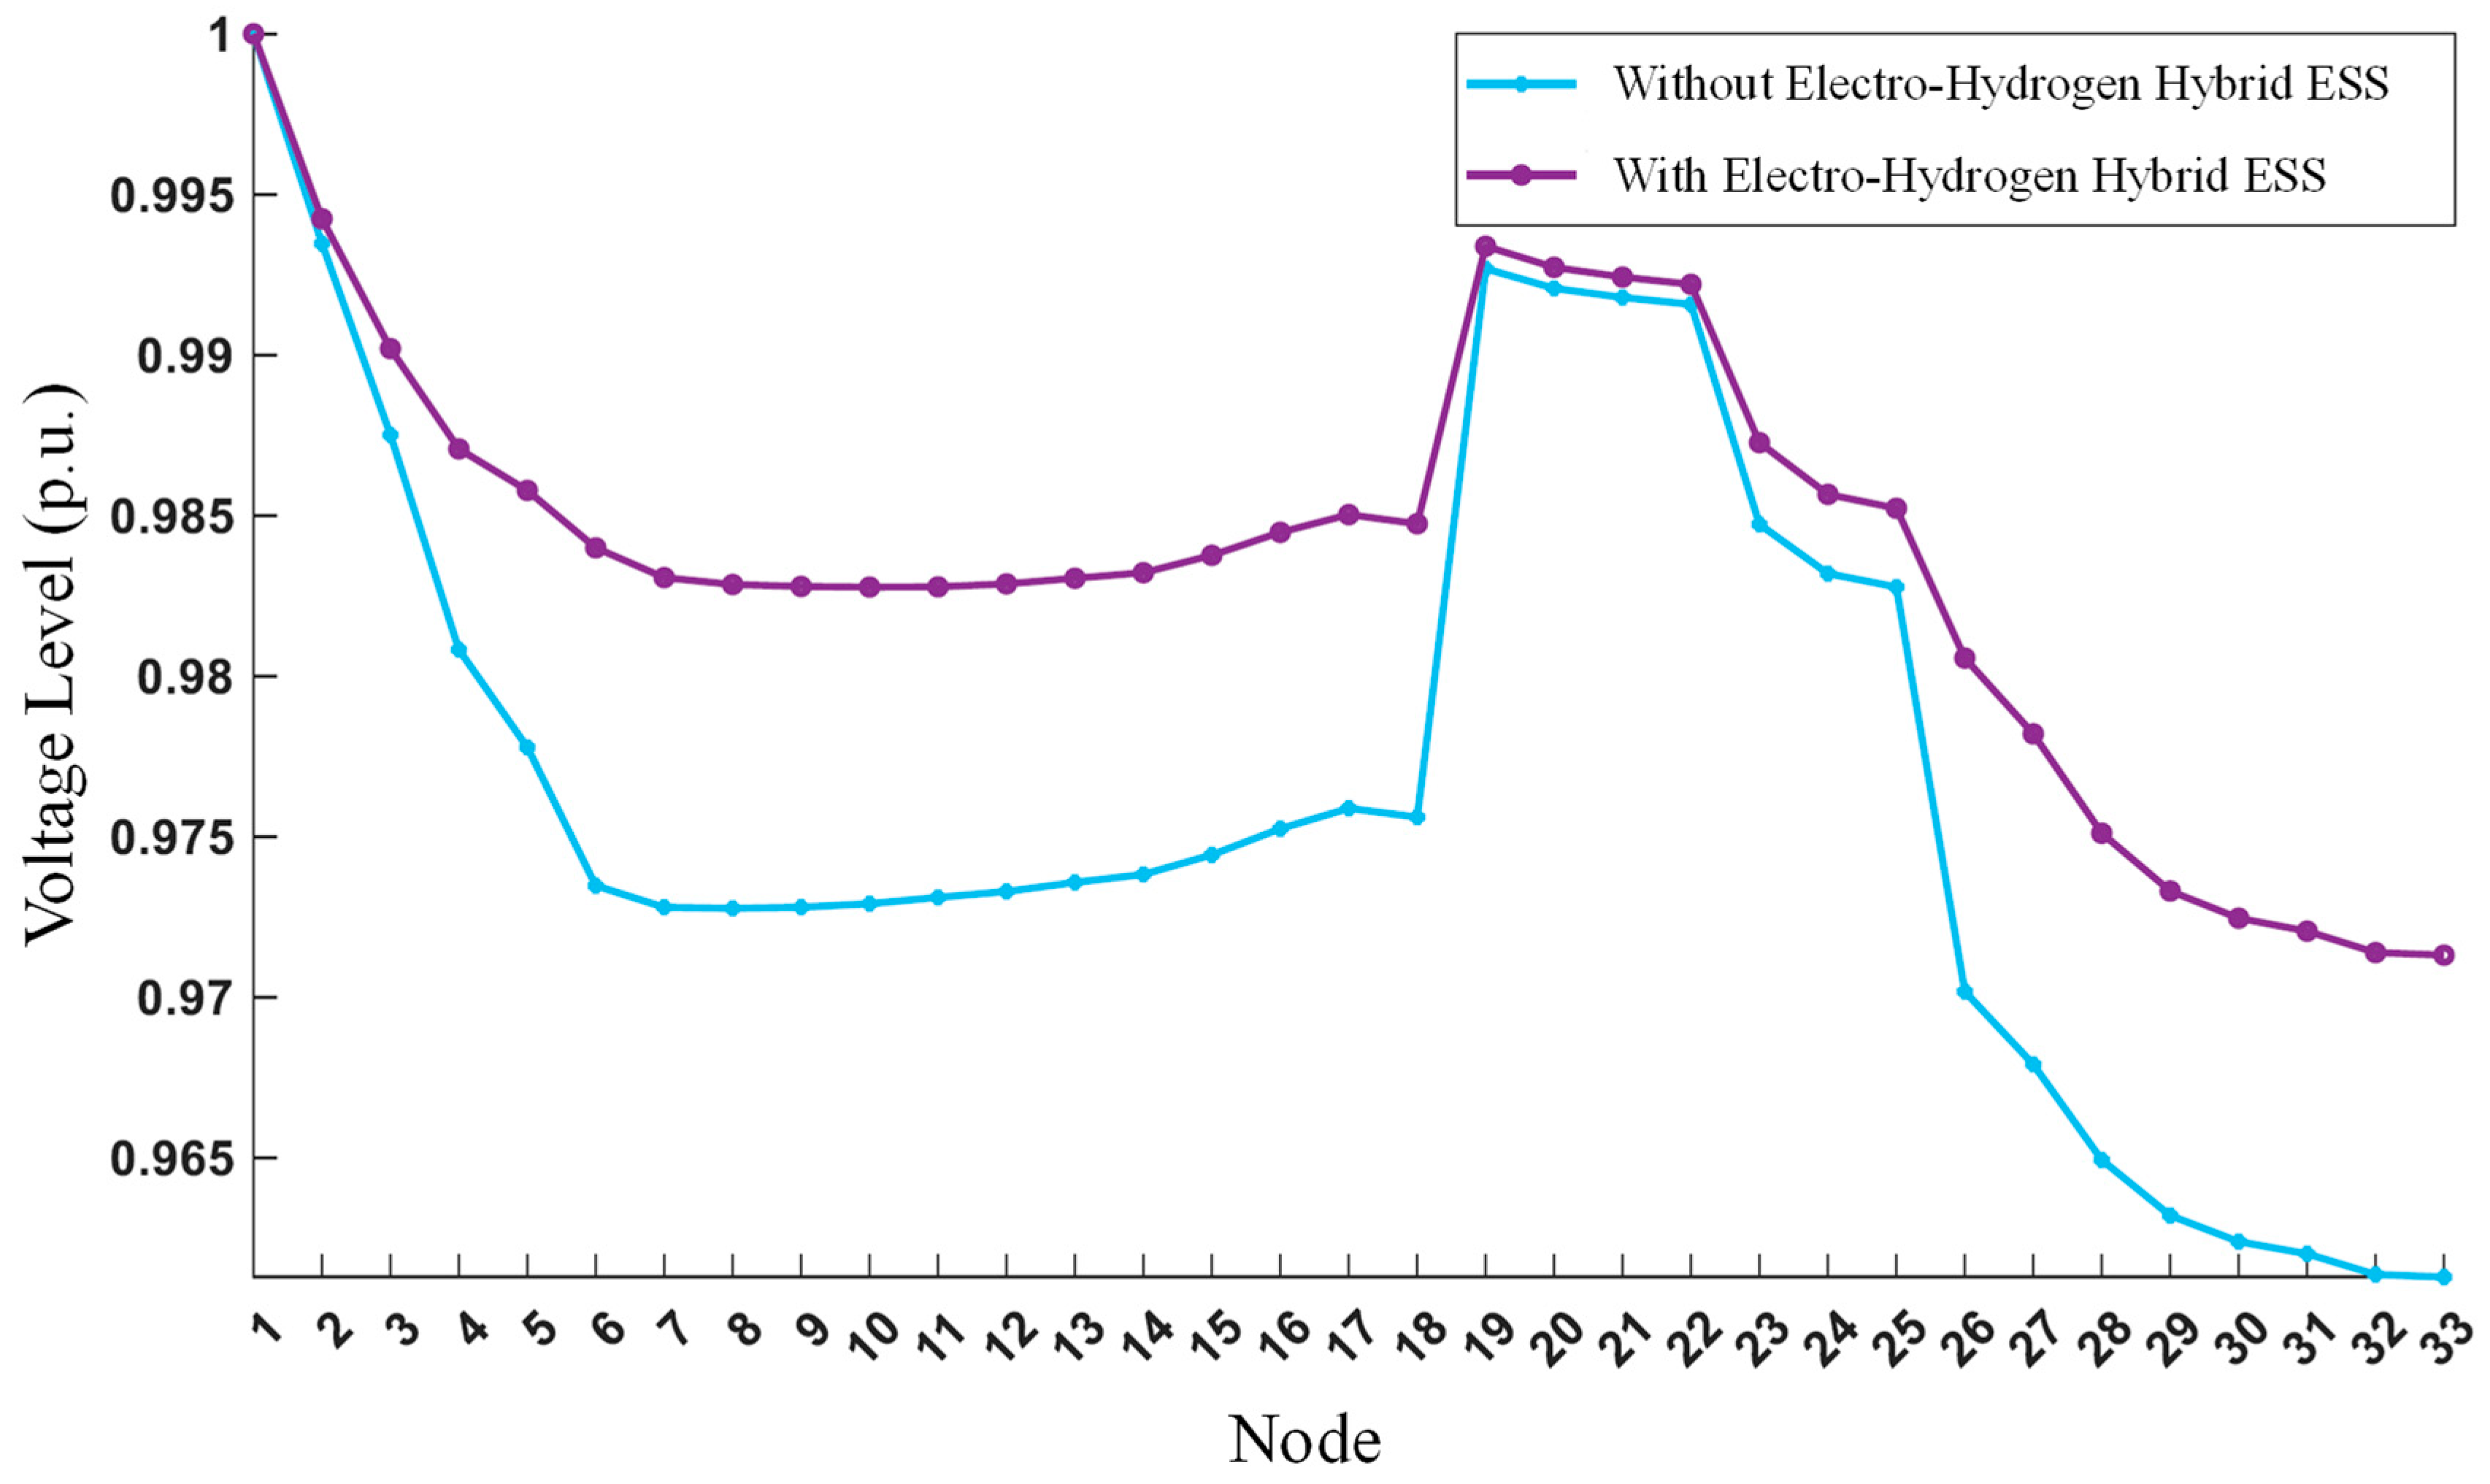
3.2. Voltage Deviation
In this equation, represents the voltage magnitude at the node where the energy storage is connected; represents the standard voltage magnitude at the node, which is specifically 1 p.u.
3.3. Net Load Fluctuation
In this equation, , , , , , , and represent the net load, electrical load power, electrical boiler power, CHP power output, wind power output, photovoltaic power output, and energy storage charging/discharging power, respectively.
3.4. Constraints
The power constraints in the distribution network are as follows:
The voltage constraints at the nodes in the distribution network are as follows:
In this equation, and represent the upper and lower voltage limits at node i, respectively.
The constraints on the installation capacity, installation power, and installation location of the ESS are as follows:
In this equation, and indicate the maximum and minimum allowable installation capacities of the ESS. Similarly, and define the upper and lower bounds of the rated power. The term identifies the node where the i-th unit is installed, while refers to the distribution network equipment located at node j.
The voltage constraints applied in this study (0.95–1.05 p.u.) align with commonly accepted grid operation standards such as IEEE Std 1547 [
28] and China’s DL/T 599-2005 (update DL/T 599-2016) [
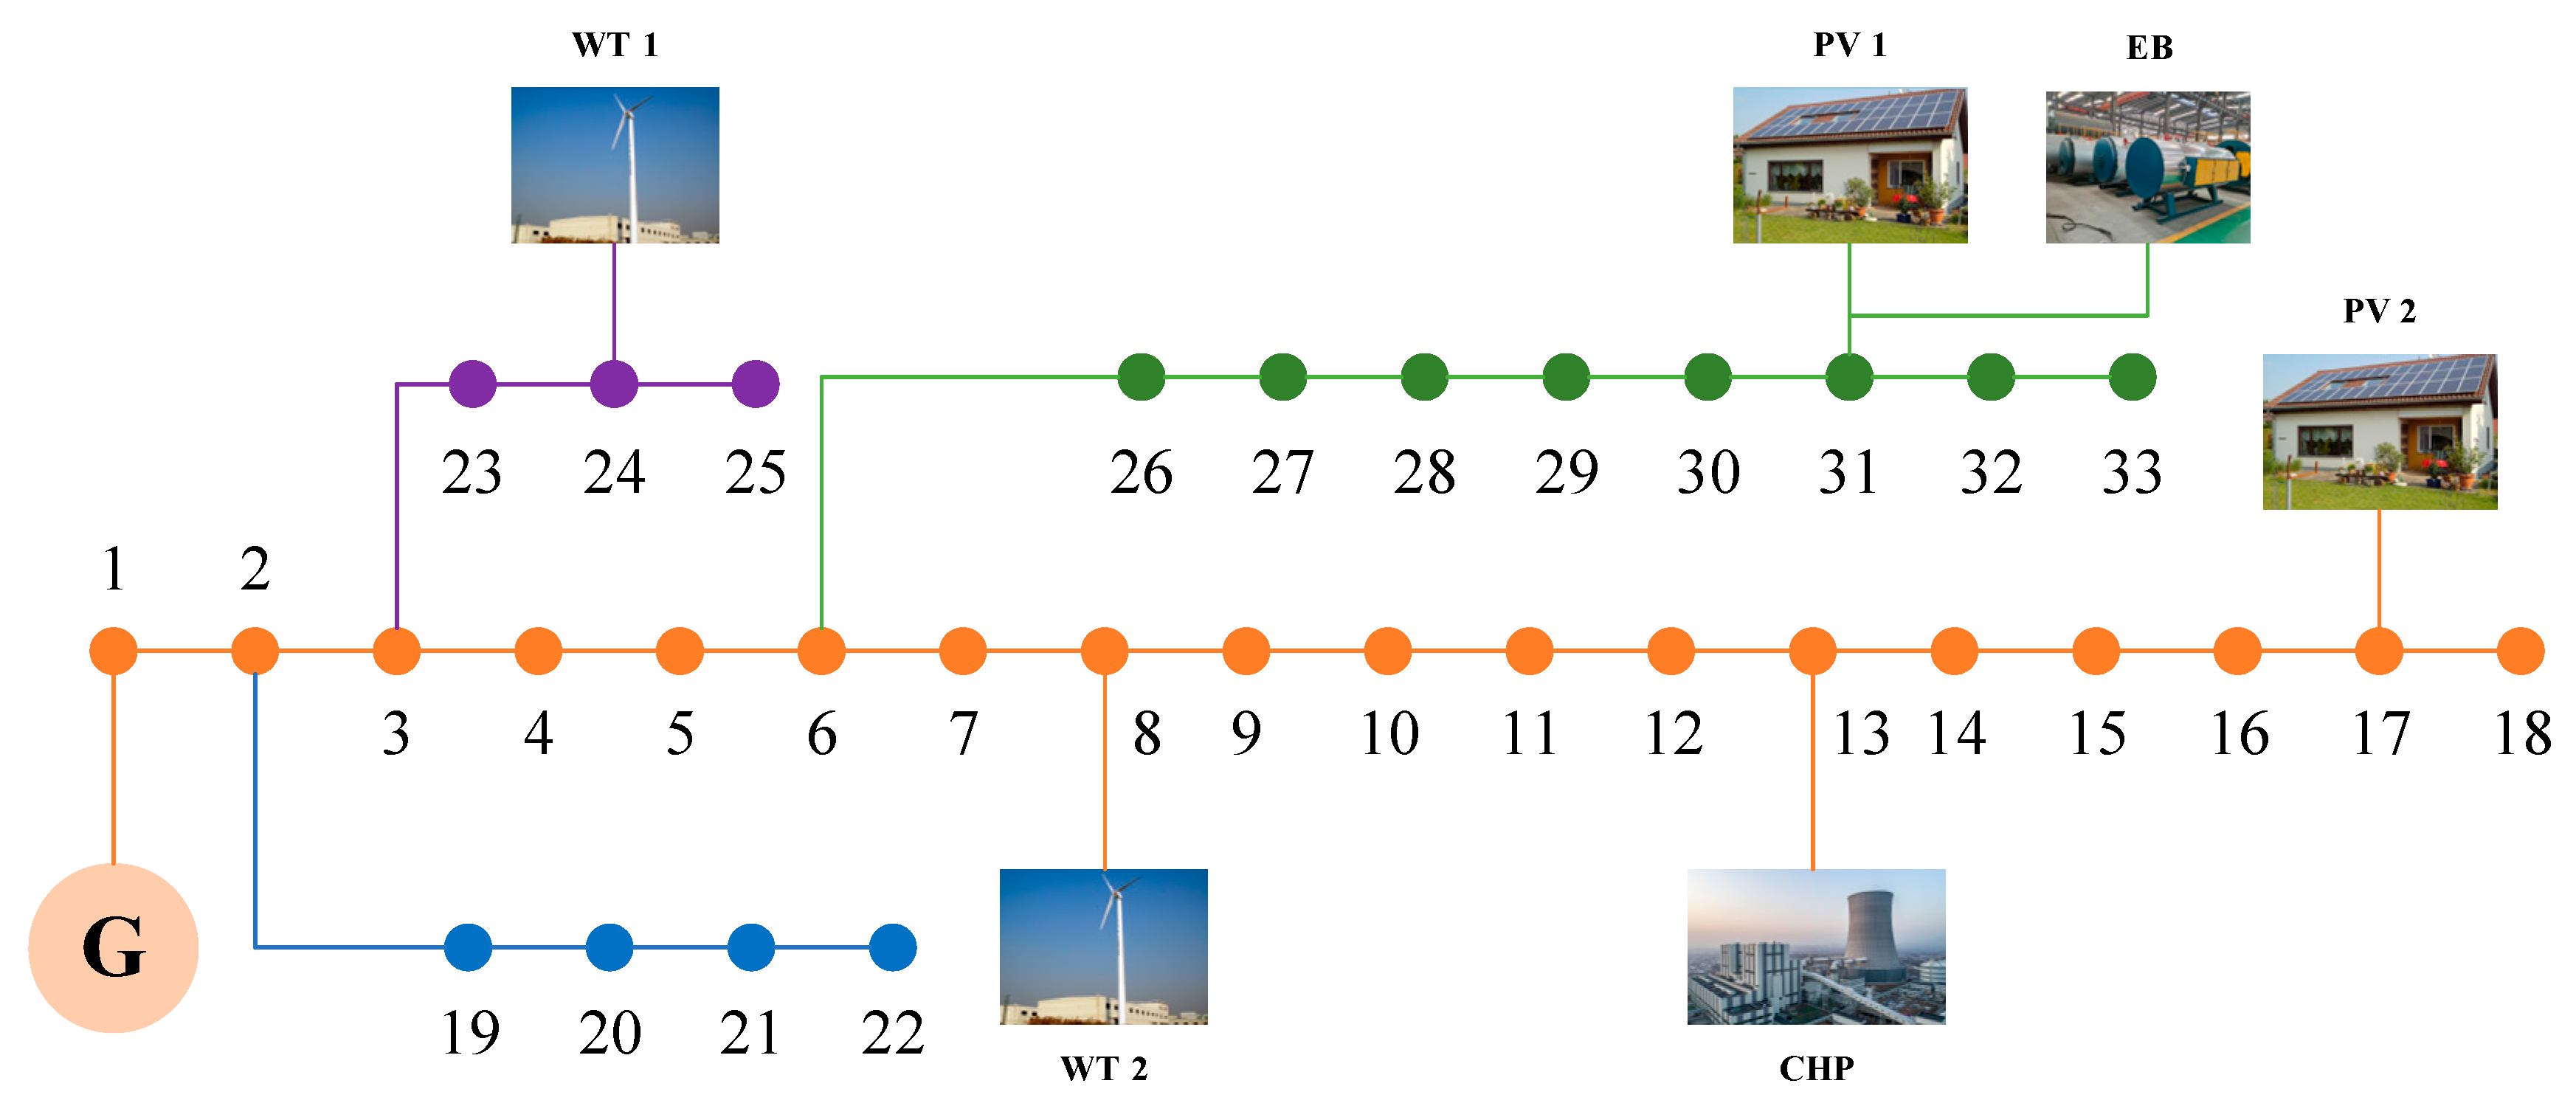
29], which define allowable voltage deviation limits in low- and medium-voltage distribution networks. Power capacity bounds for system elements are derived from the IEEE-33 bus test system specification. Minor adjustments were made for ESS capacity placement without compromising system realism or violating engineering feasibility.
6. Conclusions and Discussion
This research successfully developed a comprehensive optimization framework for electric–hydrogen hybrid ESS configuration, integrating multi-objective coordination mechanisms to simultaneously minimize capital expenditures, stabilize grid load profiles, and enhance voltage quality. The proposed model employs advanced algorithmic strategies to resolve the inherent conflicts between economic efficiency and technical performance, establishing a novel paradigm for energy storage planning in IESs. Through systematic scenario simulations and comparative analyses, this study yields critical insights into hybrid ESS functionality and grid interaction dynamics, as evidenced by two principal findings.
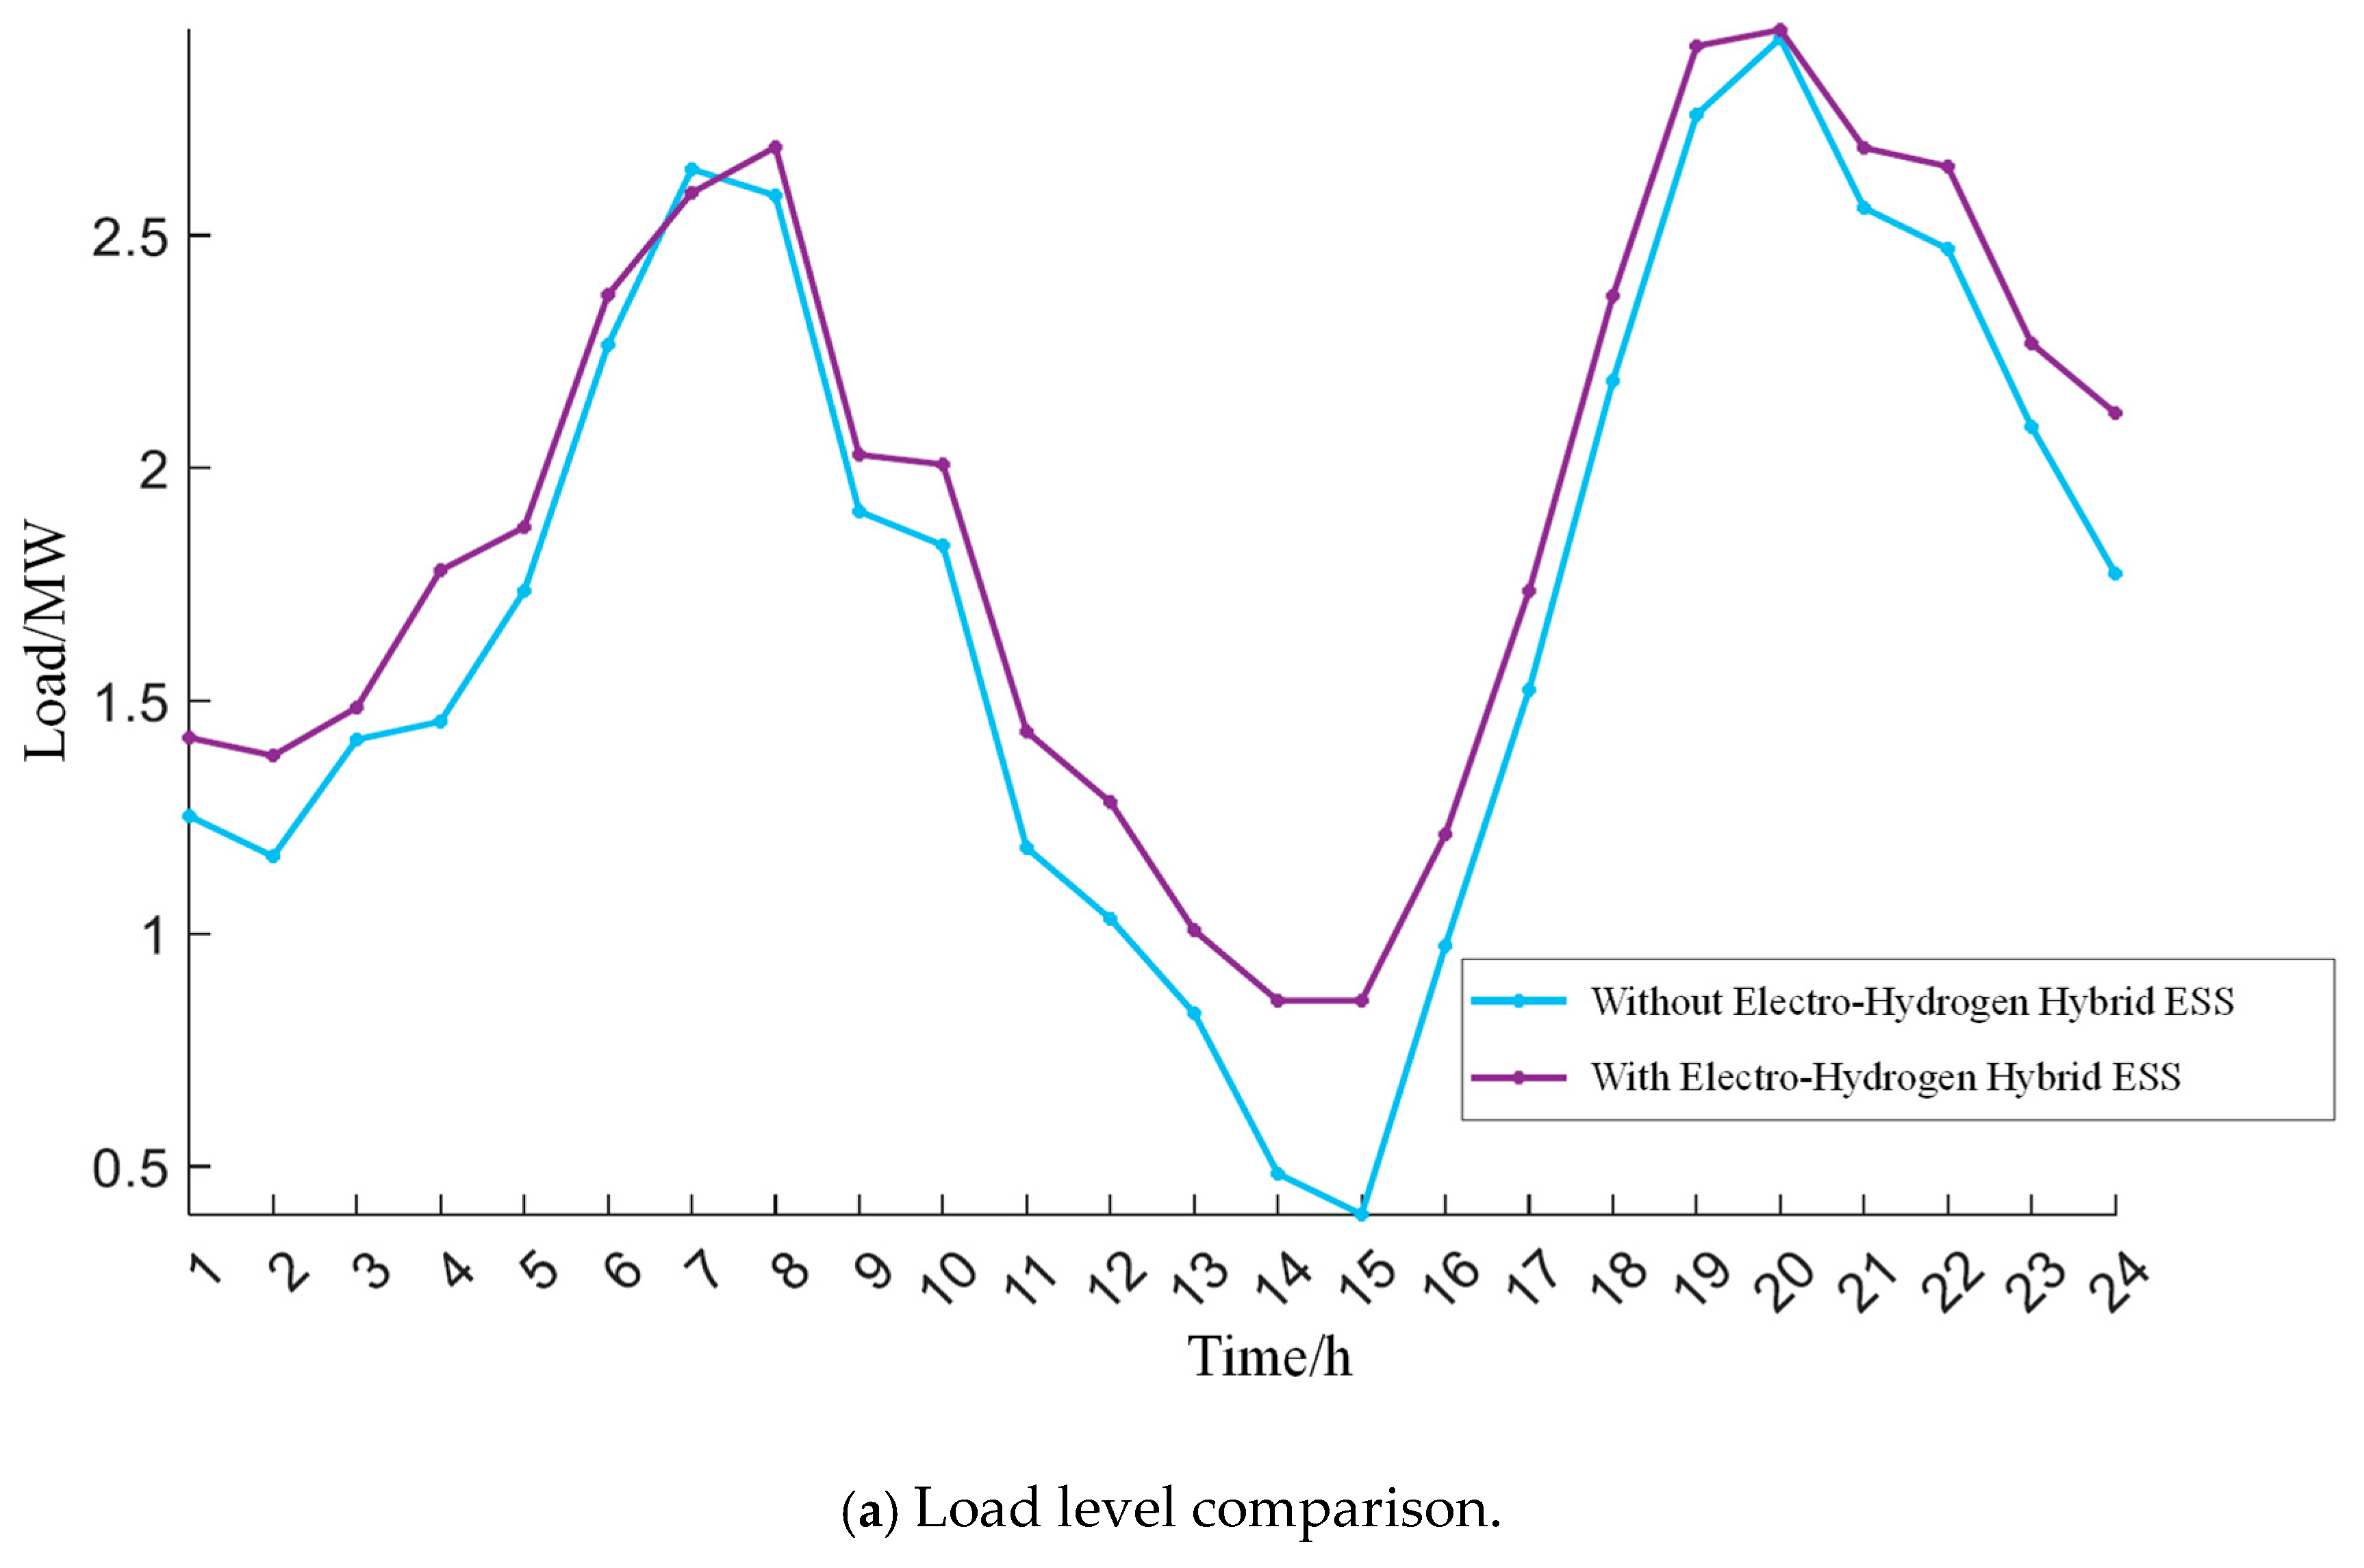
First, the implementation of a hybrid ESS demonstrates substantial voltage regulation benefits across IES nodes, particularly in networks with inherently low net load baselines. By strategically modulating charge–discharge cycles, the ESS effectively elevates minimum voltage thresholds while compressing voltage deviation ranges, transforming previously uneven voltage distributions into stable operational profiles. This voltage enhancement mechanism proves especially potent during load valley conditions, where ESS charging operations actively counteract voltage depression by elevating net load levels—a counterintuitive yet effective strategy that repurposes energy storage as both load-shaping and voltage-support infrastructure.
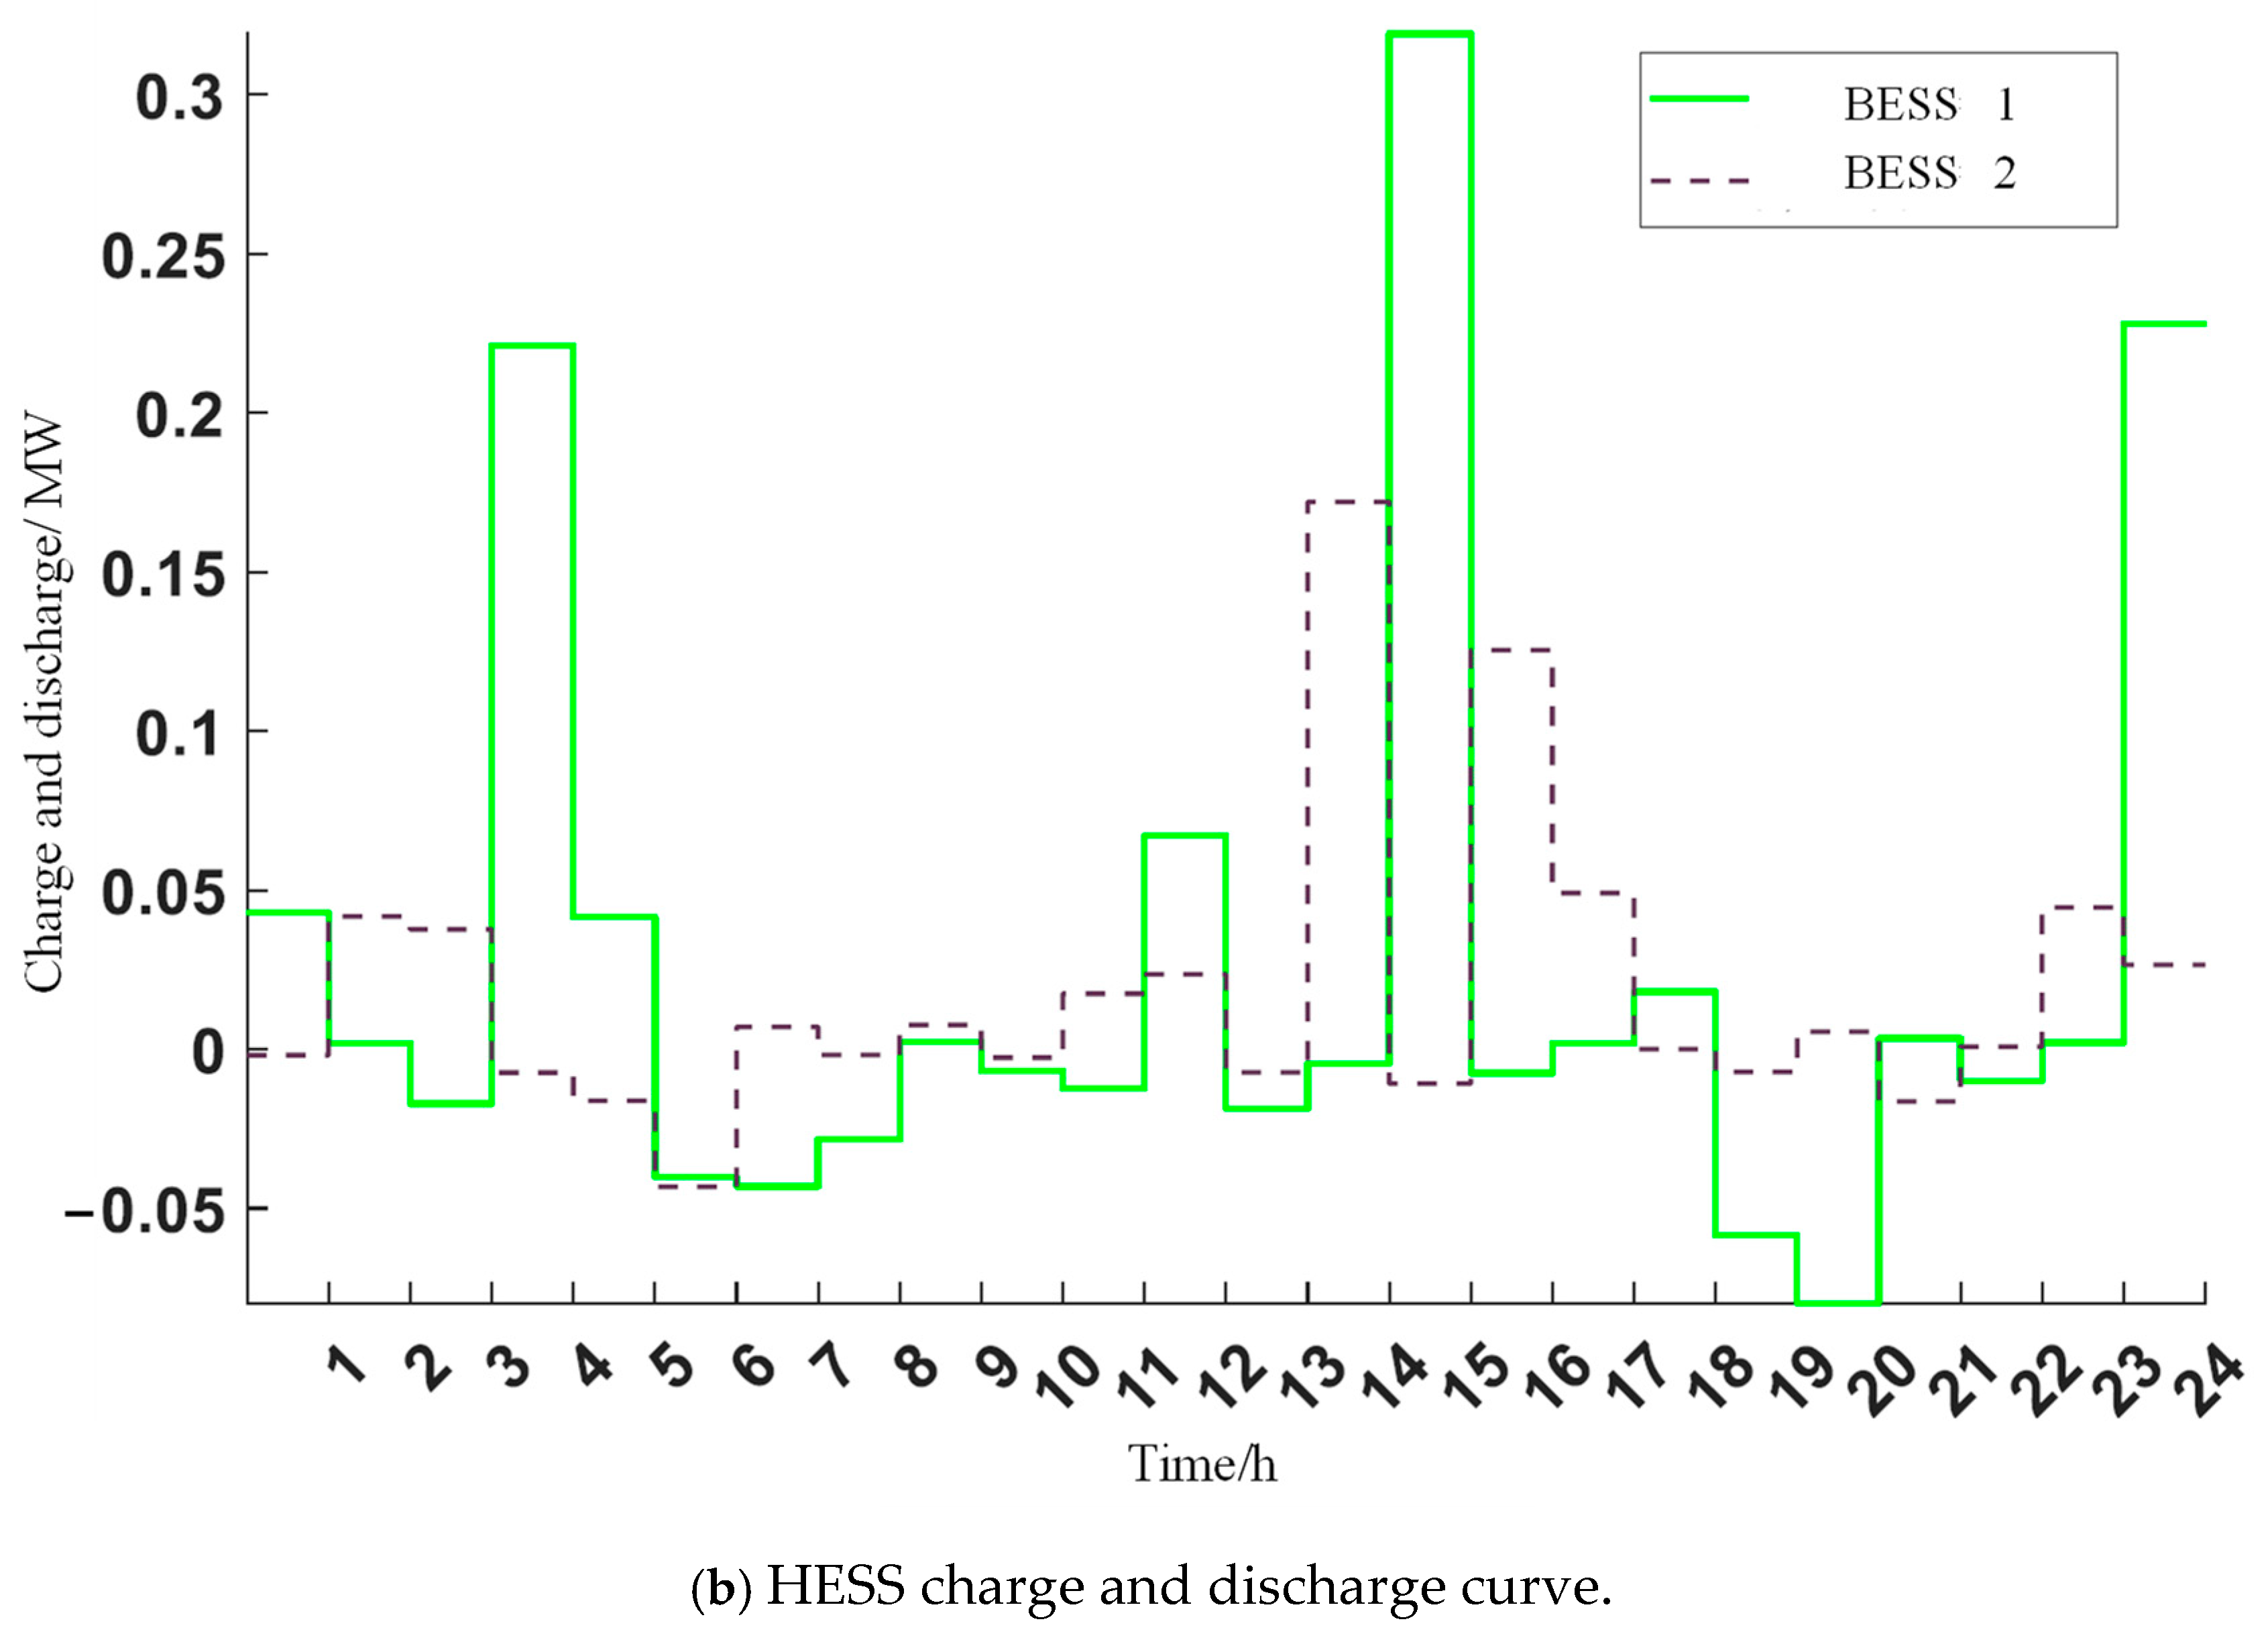
Second, the operational synergy between electric and hydrogen storage components unlocks unprecedented system flexibility. The hydrogen ESS capitalizes on off-peak periods to execute high-capacity charging via electrolyzer-based hydrogen production, efficiently absorbing surplus renewable generation while performing strategic valley filling. Conversely, battery ESS units deploy their rapid-response capabilities to address peak load demands through precision discharge operations. This temporal complementarity enables the hybrid system to decouple energy storage duration from power delivery constraints, achieving multi-timescale grid support unattainable through single-storage architectures.
While these findings advance hybrid ESS planning methodologies, the evolving energy landscape necessitates a deeper integration of demand-side dynamics. DR mechanisms—particularly price-elastic load adjustment and distributed energy resource coordination—are emerging as critical enablers for next-generation storage optimization. Future research will investigate bidirectional interactions between DSR strategies and ESS configuration, focusing on how consumer participation in load-shifting programs influences optimal storage sizing, technology selection, and operational scheduling. This expanded analytical scope aims to develop adaptive planning models that harmonize centralized storage deployment with decentralized demand flexibility, ultimately creating resilient, consumer-integrated energy systems capable of navigating the uncertainties inherent in renewable-dominant grids.
While the proposed optimization strategy demonstrates technical effectiveness, the practical deployment of electro-hydrogen hybrid energy storage systems must account for safety and geographic adaptability.
Safety and Regulatory Compliance: Hydrogen storage introduces the risks of flammability and leakage. International standards such as ISO 19880 [
36] (Hydrogen fueling stations) and IEC 62282 [
37] (Fuel cell technologies) prescribe design protocols for ventilation, leak detection, and hazard zoning. Adhering to these standards is essential when integrating hydrogen systems into urban or suburban grids.
Scalability to Diverse Grid Topologies: Though validated on the IEEE-33 system, the proposed approach can be adapted to larger-scale or rural grids by incorporating flexible node placement, variable line capacities, and location-dependent constraints. Future work will consider applying the model to realistic provincial-level distribution networks with geospatial and demographic variability.
Although fixed component parameters are used in this study, the model’s outcomes are sensitive to key equipment efficiencies. For example, the electrolyzer’s conversion efficiency influences both charging energy demand and operational costs, while hydrogen tank efficiency affects storage duration effectiveness. These parameters are expected to vary within engineering tolerances (e.g., 55–75% for electrolyzers, 85–98% for storage), and the model remains structurally stable across these ranges. Future work may consider Monte Carlo or scenario-based extensions to formally evaluate parameter uncertainty.
The current model adopts a deterministic framework using typical PV and wind generation profiles. While suitable for baseline evaluation, future extensions of this work will incorporate stochastic or scenario-based modeling (e.g., Monte Carlo simulation or robust optimization) to explicitly account for the inherent variability in renewable generation and load demand. This will improve planning robustness and reflect more realistic operating conditions.
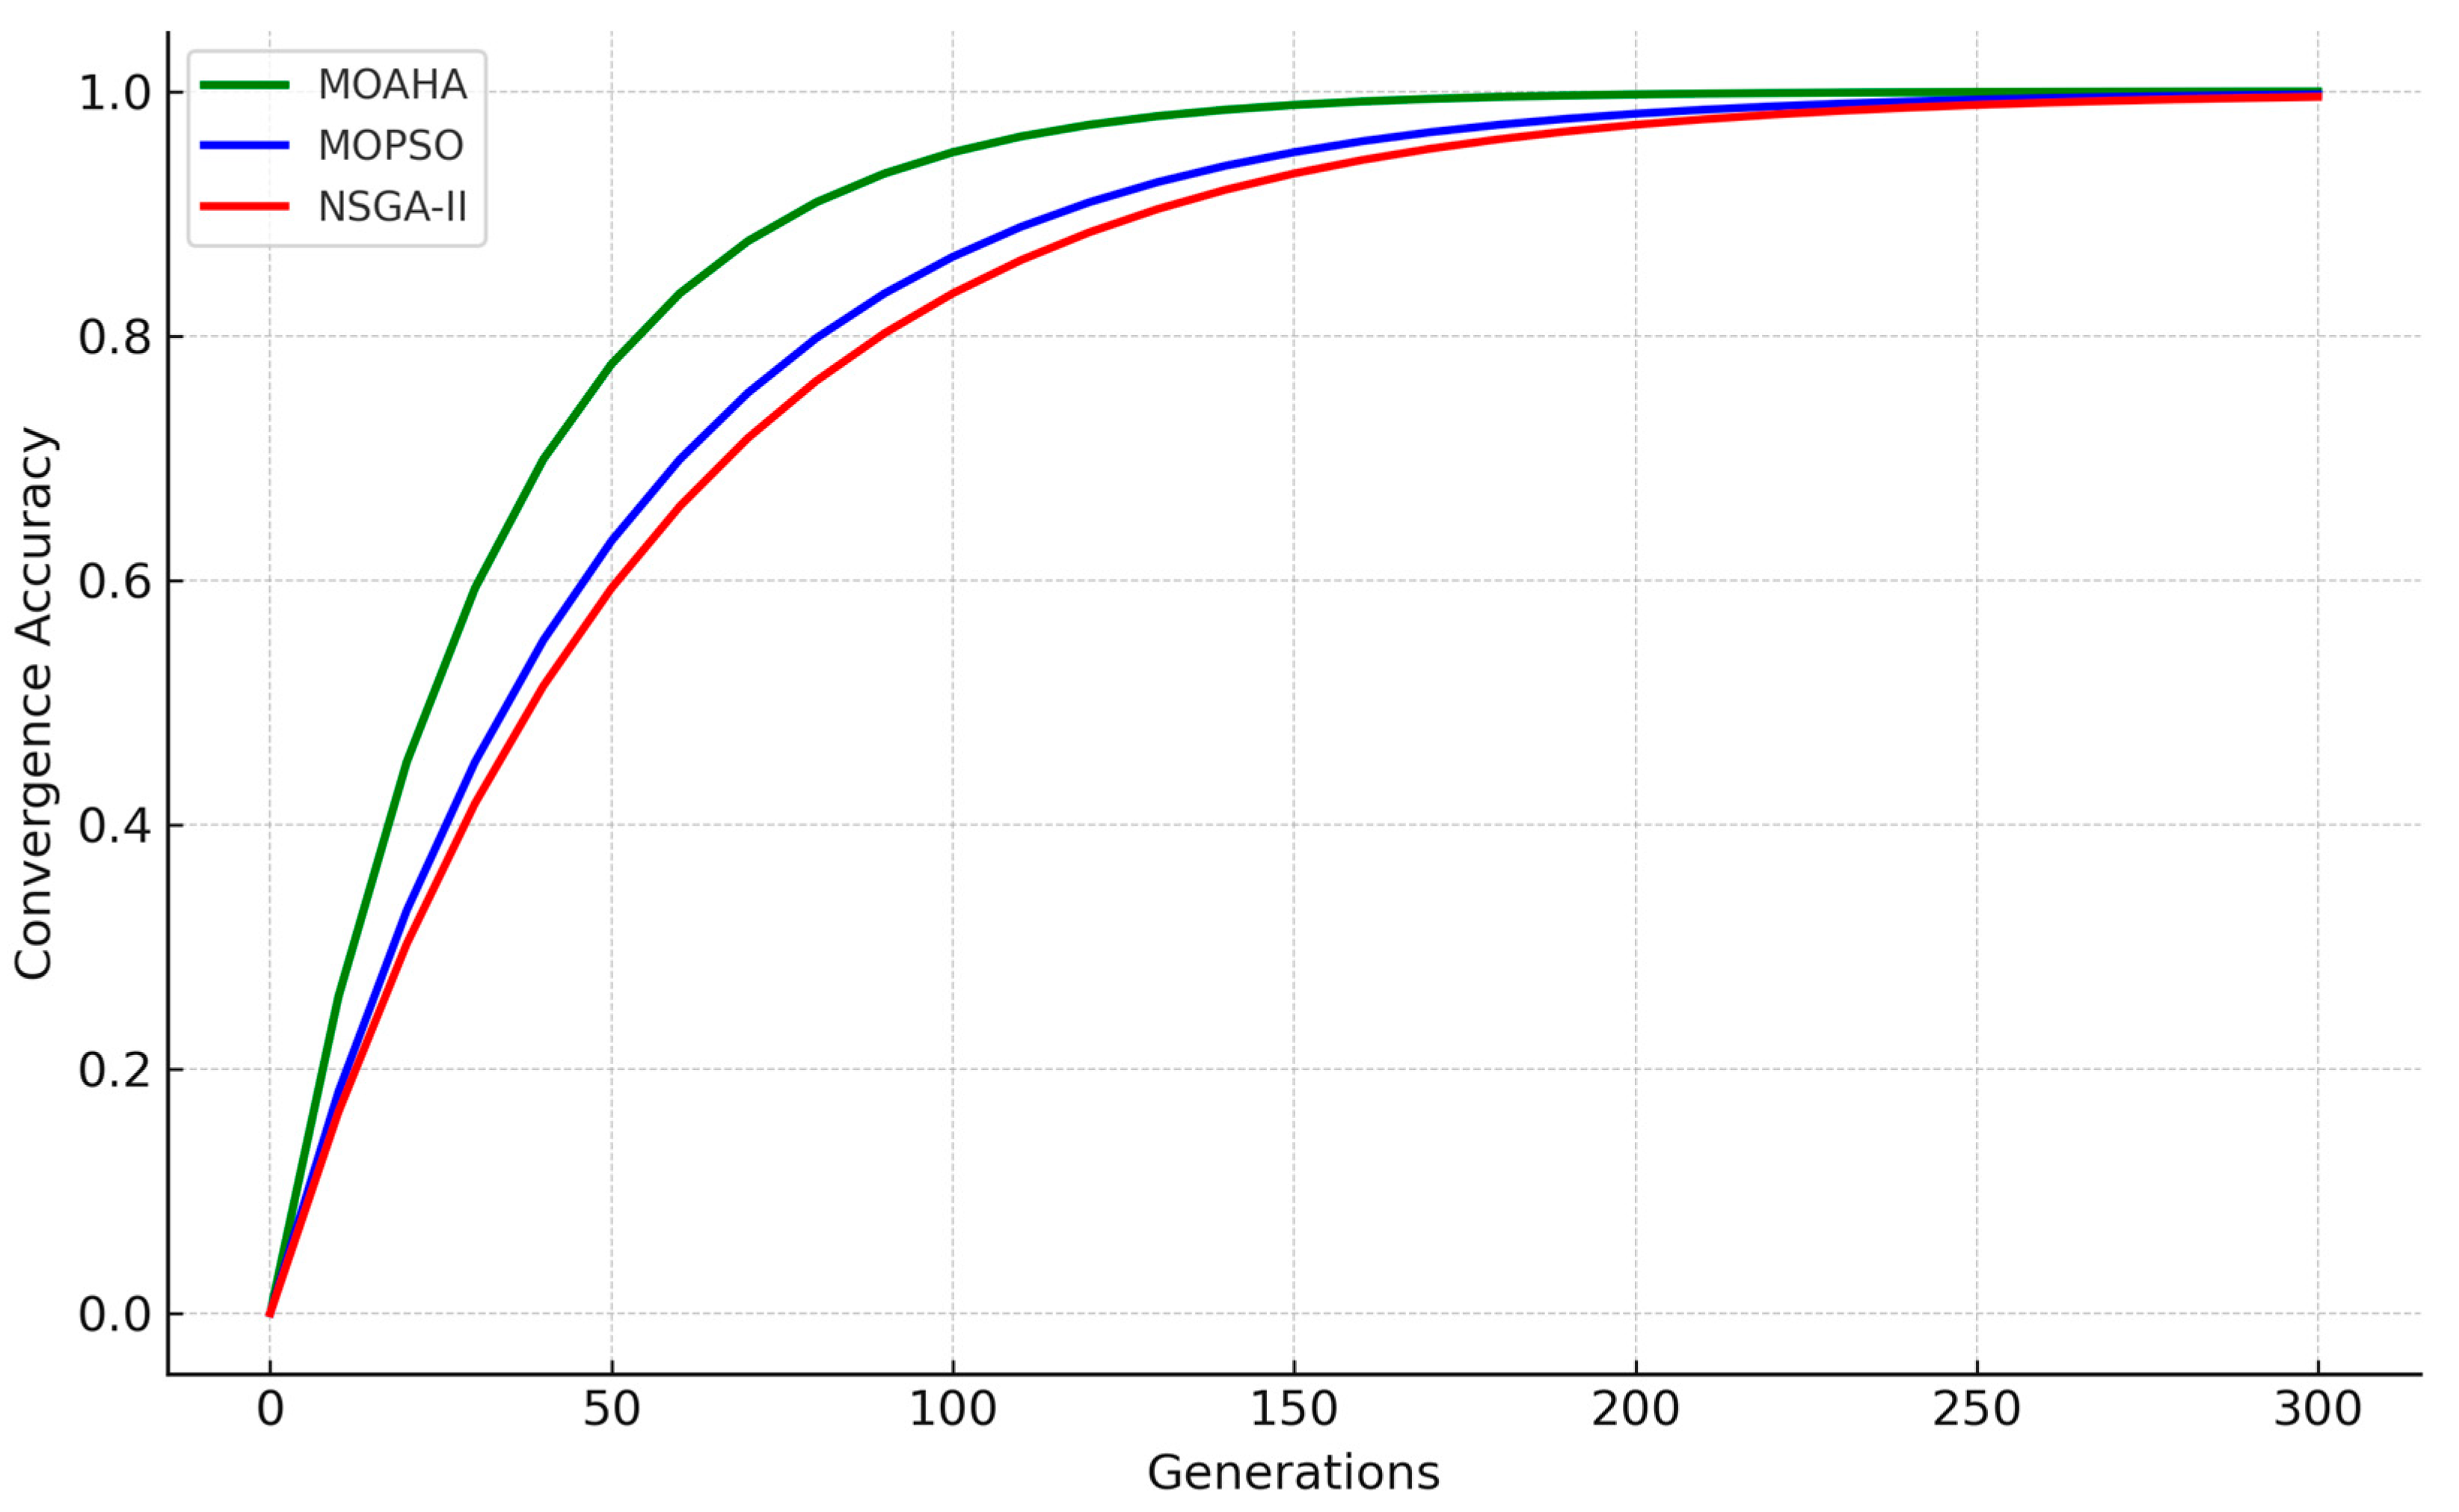
In this study, the Multi-Objective Artificial Hummingbird Algorithm (MOAHA) was employed to solve the configuration problem of electric–hydrogen hybrid energy storage systems due to its demonstrated advantages in handling non-convex, multi-objective problems. Its biologically inspired foraging strategies help avoid local optima and improve solution diversity, which is particularly beneficial for balancing cost, voltage stability, and net load fluctuation.
Although a detailed comparison with traditional metaheuristic algorithms such as NSGA-II, MOEA/D, or PSO was not conducted in this work, future research will aim to systematically evaluate the MOAHA’s performance against these benchmarks. The comparison will focus on metrics such as convergence speed, Pareto front distribution, and computational efficiency. This will provide a more comprehensive understanding of the algorithm’s applicability and robustness in complex power system planning tasks.
The current study examines two scenarios—without energy storage and with a hybrid BESS-HESS—to validate the proposed planning approach. In future work, we plan to expand the scenario framework to include BESS-only and HESS-only configurations. This will enable a more detailed comparative analysis of their individual performance in terms of voltage support, load balancing, and cost effectiveness and help clarify the synergistic value of combining both technologies in hybrid energy storage systems.
The current model assumes ideal battery operation, where SOC dynamics follow a simplified energy balance. Future work will aim to incorporate aging mechanisms (e.g., capacity fade, impedance rise) and thermal dynamics to reflect degradation and efficiency variations under different operating conditions. These enhancements will enable more realistic lifetime and performance evaluations of BESS components within the planning framework.


 and
and 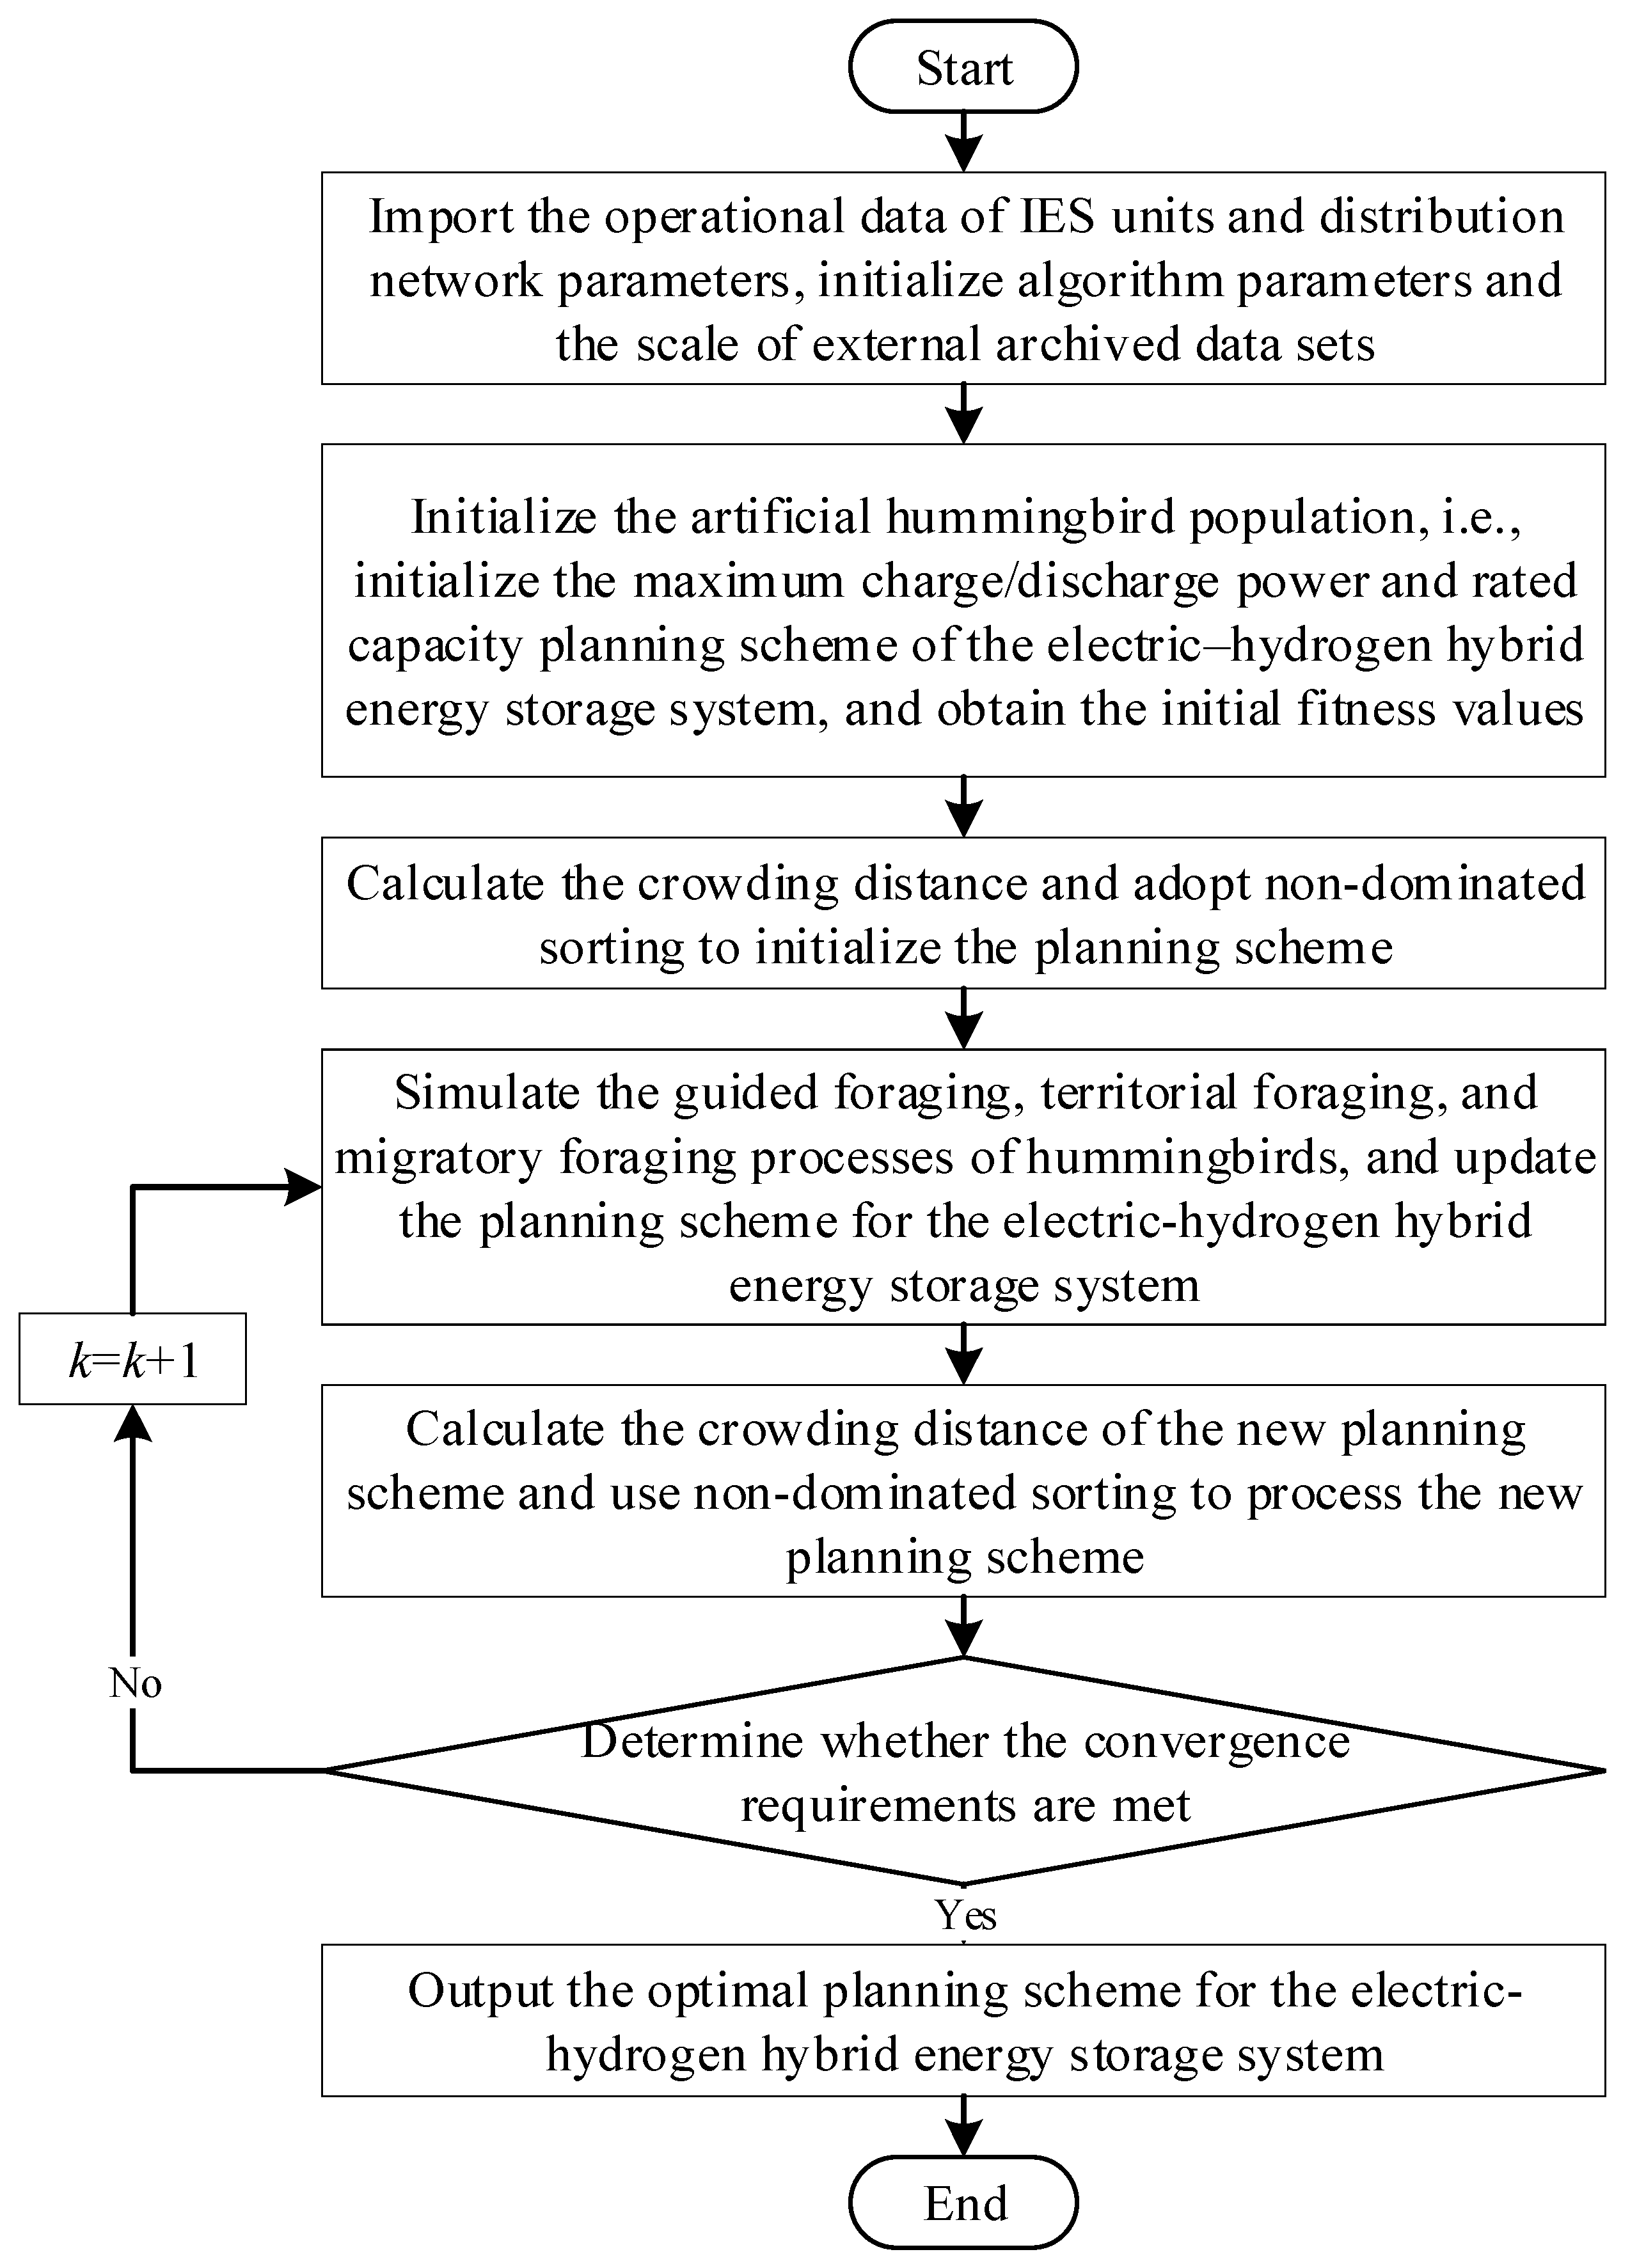

