Abstract
Reservoir heterogeneity, fluid property variations, and permeability contrasts across different geological layers result in significant disparities in water absorption capacities during oilfield development, often leading to premature water breakthrough, uneven sweep efficiency, and suboptimal waterflooding outcomes. The accurate determination of layer-specific water injection volumes is critical to addressing these challenges. This study focuses on a study area in China, employing comprehensive on-site investigations to evaluate the current state of layered water injection practices. The injection allocation strategy was optimized using a hybrid approach combining the splitting coefficient method and grey correlation analysis. Key challenges identified in the study area include severe reservoir heterogeneity, poor injection–production correspondence, rapid water cut escalation, and low recovery rates. Seven dominant influencing factors—the sedimentary microfacies coefficient, effective thickness, stimulation factor, well spacing, permeability, connectivity, and permeability range coefficient—were identified through grey correlation analysis. Field application of the proposed method across fourteen wells demonstrated significant improvements: a monthly oil production increase of 40 tons, a water production reduction of 399.24 m3/month, and a 2.45% decline in the water cut. The obtained results substantiate the method’s capability in resolving interlayer conflicts, optimizing oil recovery performance, and effectively controlling water channeling problems.
1. Introduction
Layered water injection technology has been widely recognized as an effective approach to enhance oilfield development and improve the ultimate recovery rates [1]. This technique involves grouping oil layers with similar physical properties into distinct injection intervals, allowing for targeted water injection based on the unique characteristics of each layer. The implementation of layered water injection relies on specialized distribution pipe strings, primarily composed of packers and water distributors, which enable the isolation of layers with varying properties and facilitate differential pressure-driven water injection. Over the years, this technology has evolved through several developmental stages: fixed layered water injection, concentric movable layered water injection, eccentric layered water injection, and integrated layered water injection. Each stage has introduced unique features, with corresponding advancements in supporting equipment, leading to continuous improvements in operational efficiency and effectiveness [2,3,4].
However, the process of water injection development is not without challenges. The injected water can significantly alter the physical properties of the reservoir, thereby modifying its original state. This transformation effect is particularly pronounced in high-permeability layers, where the physical properties tend to improve further, leading to even greater water absorption. Conversely, low-permeability layers often exhibit minimal transformation, resulting in limited water injectivity. This disparity creates a phenomenon where high-permeability layers absorb a disproportionate amount of water, while low-permeability layers remain underutilized, ultimately leading to suboptimal recovery rates. The asynchronous advancement of the water injection front across different layers exacerbates this issue, with high-permeability layers experiencing early water breakthrough and premature water flooding. This not only results in ineffective water injection cycles but also significantly reduces the overall oil recovery. The inherent anisotropy of reservoirs further intensifies the interlayer and intralayer conflicts, making it challenging to achieve uniform water injection. In practice, the dominance of high-permeability layers and the regional tongue penetration effect in areas of good permeability often lead to uneven water distribution, which directly contradicts the desired goal of balanced reservoir sweep efficiency.
To address these challenges, extensive research has been conducted to develop scientifically sound methods for the calculation of interval injection allocation in stratified water injection systems. Internationally, notable contributions include the displacement volume allocation method proposed by Anthony et al. in the United States, which focuses on determining the optimal economic water injection rate for large multi-well group water flooding [5,6,7]. Similarly, Jarrell et al. utilized the Hearn–Hall relationship curve to analyze the water injection rates in newly commissioned injection wells [8,9,10]. In the former Soviet Union, Zalov and colleagues employed statistical methods to investigate the correlation between the water injection rates and liquid production rates in production wells [11]. In China, following the widespread adoption of stratified water injection in various oilfields, numerous studies have been conducted to refine injection allocation methodologies. Among these, the correction coefficient method introduced by Liu Chengbin and Sun Changhong stands out. This method formulates an injection allocation formula by comprehensively considering factors such as the injection–production balance, water cut increase, oil well liquid supply capacity, block characteristics, and liquid production ratios in water-driven reservoirs [12]. Another significant contribution is the connected thickness ratio method developed by Wu Guo et al., which calculates the ratio of the connected effective thickness to the total effective thickness of oil wells, based on the planned underground liquid production volumes of all oil wells connected to a specific water injection well [13]. Additionally, advancements in intelligent well technologies have been investigated by researchers such as Chengjun et al., who developed mechanical intelligent layered water injection technologies, and Erzhen et al., who researched digital layered water injection technologies based on wave code communications [14,15]. These studies underscore the ongoing efforts to enhance water injection strategies through innovative technologies and methodologies.
Recent advances in layered water injection technology have focused on optimizing injection allocation strategies through innovative methodologies and technologies. Sharifpour et al. proposed a smart technique for water shutoff treatment in layered reservoirs, utilizing an engineered injection–production scheme to enhance the sweep efficiency and control water channeling [16]. Almeida et al. developed an optimization system for valve control in intelligent wells under uncertainties, demonstrating the potential for real-time adjustments to improve the injection allocation and production performance [17]. These studies highlight the growing trend of integrating intelligent systems and dynamic control mechanisms into water injection practices to address the complexities of reservoir heterogeneity and interlayer conflicts.
Additionally, research has been conducted on the application of machine learning and data analytics in optimizing water injection strategies. Haghighat Sefat et al. explored the reservoir uncertainty-tolerant, proactive control of intelligent wells, emphasizing the importance of adaptive management in heterogeneous reservoirs [18]. Dilib et al. presented a closed-loop feedback control system for the production optimization of intelligent wells under uncertainty, showcasing the potential for automated systems to enhance the injection allocation accuracy and efficiency [19]. These approaches leverage advanced computational techniques to process large volumes of reservoir data, enabling the more precise and dynamic allocation of water injection volumes across different layers.
However, despite these significant advancements, existing methods still have limitations. Traditional approaches, such as the Hearn–Hall empirical curve method and the connected thickness ratio method, rely heavily on static reservoir parameters and extensive data collection from injection–production well intervals. These methods often struggle to dynamically adapt to changing reservoir conditions and interlayer conflicts, particularly in highly heterogeneous reservoirs. The labor-intensive nature of data preparation and the lack of real-time adaptability limit their effectiveness in optimizing water injection strategies.
To overcome these limitations, this paper proposes a novel approach that focuses on well groups with water injection wells as the primary research unit. By employing the grey correlation analysis method, we derive a dynamic splitting coefficient through the normalization of correlation degrees. This coefficient is then used to allocate liquid production among oil wells within the well group, thereby determining the optimal injection allocation for water injection wells. Preliminary trial calculations demonstrate that this method can serve as a reliable conventional injection allocation technique. Unlike traditional methods that require extensive and labor-intensive data collection from injection–production well intervals, our approach simplifies the process by enabling quantitative injection allocation for individual water injection wells. This advancement provides valuable theoretical guidance in enhancing the development and management of waterflooding operations in oilfields.
2. Materials and Methods
2.1. Grey Correlation Coefficient Method and Principle
The grey correlation coefficient method serves as an effective approach to quantifying the influence degree and value of multiple factors. This method provides a quantitative framework for describing and comparing dynamic development trends, typically involving five analytical steps.
Step 1—Determination of Analysis Sequences: The analysis establishes the volume of water injection in the well pattern as the dependent variable, denoted as (Equation (1)). The influencing factors are the independent variables, denoted as , where = 1, 2, …, m (Equation (2)). The dependent variable data constitute the reference sequence, while each independent variable forms a comparison sequence.
Step 2—Dimensionless Transformation of Initial Sequences: Given the varying physical meanings and measurement units among different factors, the original variable sequences are normalized using the mean value method to eliminate dimensional differences and ensure comparability. Equation (3) is shown below, where = 0, 1, …, m.
Step 3—Calculation of Correlation Coefficient and Correlation Degree: The correlation coefficient, representing the degree of association between the comparison sequence and the reference sequence at specific time points, is computed. Subsequently, the correlation degree is derived through averaging these coefficients. The grey correlation coefficient measures the similarity between the comparison sequence and the reference sequence at each data point . The grey correlation coefficient is computed as in Equation (4), where −, = , = , and is the resolution coefficient.
Step 4—Implementation of Grey Correlation Analysis: In the application to actual geological and development data within the study area, the water injection profile coefficient of the injection well serves as the reference sequence. Th influencing factors are analyzed: the layer permeability, effective reservoir thickness, connectivity coefficient, interlayer interference coefficient, well spacing, stimulation factor, production thickness coefficient, number of connected oil wells, etc. The mean value method facilitates dimensionless transformation, with the resolution coefficient maintained at 0. The overall correlation degree for each factor is obtained by averaging the correlation coefficients (Equation (5)).
Step 5—Ranking of Influencing Factors: The final step involves calculating the correlation degrees for all factors influencing the splitting coefficient, thereby quantifying their relative impacts. Factors are ranked based on their correlation degrees . A higher indicates a stronger influence on the reference sequence.
This structured approach enables the systematic evaluation of multiple influencing factors in reservoir development, providing valuable insights for water injection optimization and production management.
2.2. Splitting Coefficient Calculation
The calculation of the splitting coefficient serves the essential purpose of facilitating rational injection rate allocation across individual intervals. This coefficient is subject to multiple influencing factors, as expressed in Equations (6) and (7).
The splitting coefficient (Equation (6)) represents the normalized contribution of layer to the total injection allocation. It is calculated by dividing the splitting condition value of layer by the sum of across all layers (). (Equation (7)) integrates geological and operational factors influencing layer-specific injectivity. Finally, the allocated water injection volume for layer (Equation (8)) is derived by multiplying the total well injection volume with . This ensures that high-priority layers receive proportionally higher injection volumes.
Given the substantial variations in geological characteristics, mining operations, and development conditions among different waterflooding blocks, each factor exhibits varying degrees of influence on the splitting coefficient. To address this complexity, the grey correlation analysis method is employed to quantitatively assess the relative impact of each factor, enabling dynamic weight assignment in the splitting coefficient formula. This analytical approach ensures that the optimized formula prioritizes dominant factors while suppressing noise from less influential parameters. As a result, it better reflects the specific conditions of the study area, serving as a robust foundation for precise injection allocation strategies.
3. Results
3.1. Field Description
The inverted nine-spot well pattern with 360 m spacing has been implemented for waterflooding development in the study area, which is a multi-layered sandstone reservoir. The completion type is perforated casing with packers and water distributors. The study area has permeability ranging from 80 to 220 mD and porosity ranging from 15% to 22%, which classifies it as having medium porosity and permeability. After multiple adjustments in the injection and production strategies, the reservoir has entered the middle–high water cut stage. The development history can be divided into five distinct phases: (1) oil testing and production testing, (2) intensive injection and production, (3) production decline, (4) low-rate stabilization, and (5) low-yield decline.
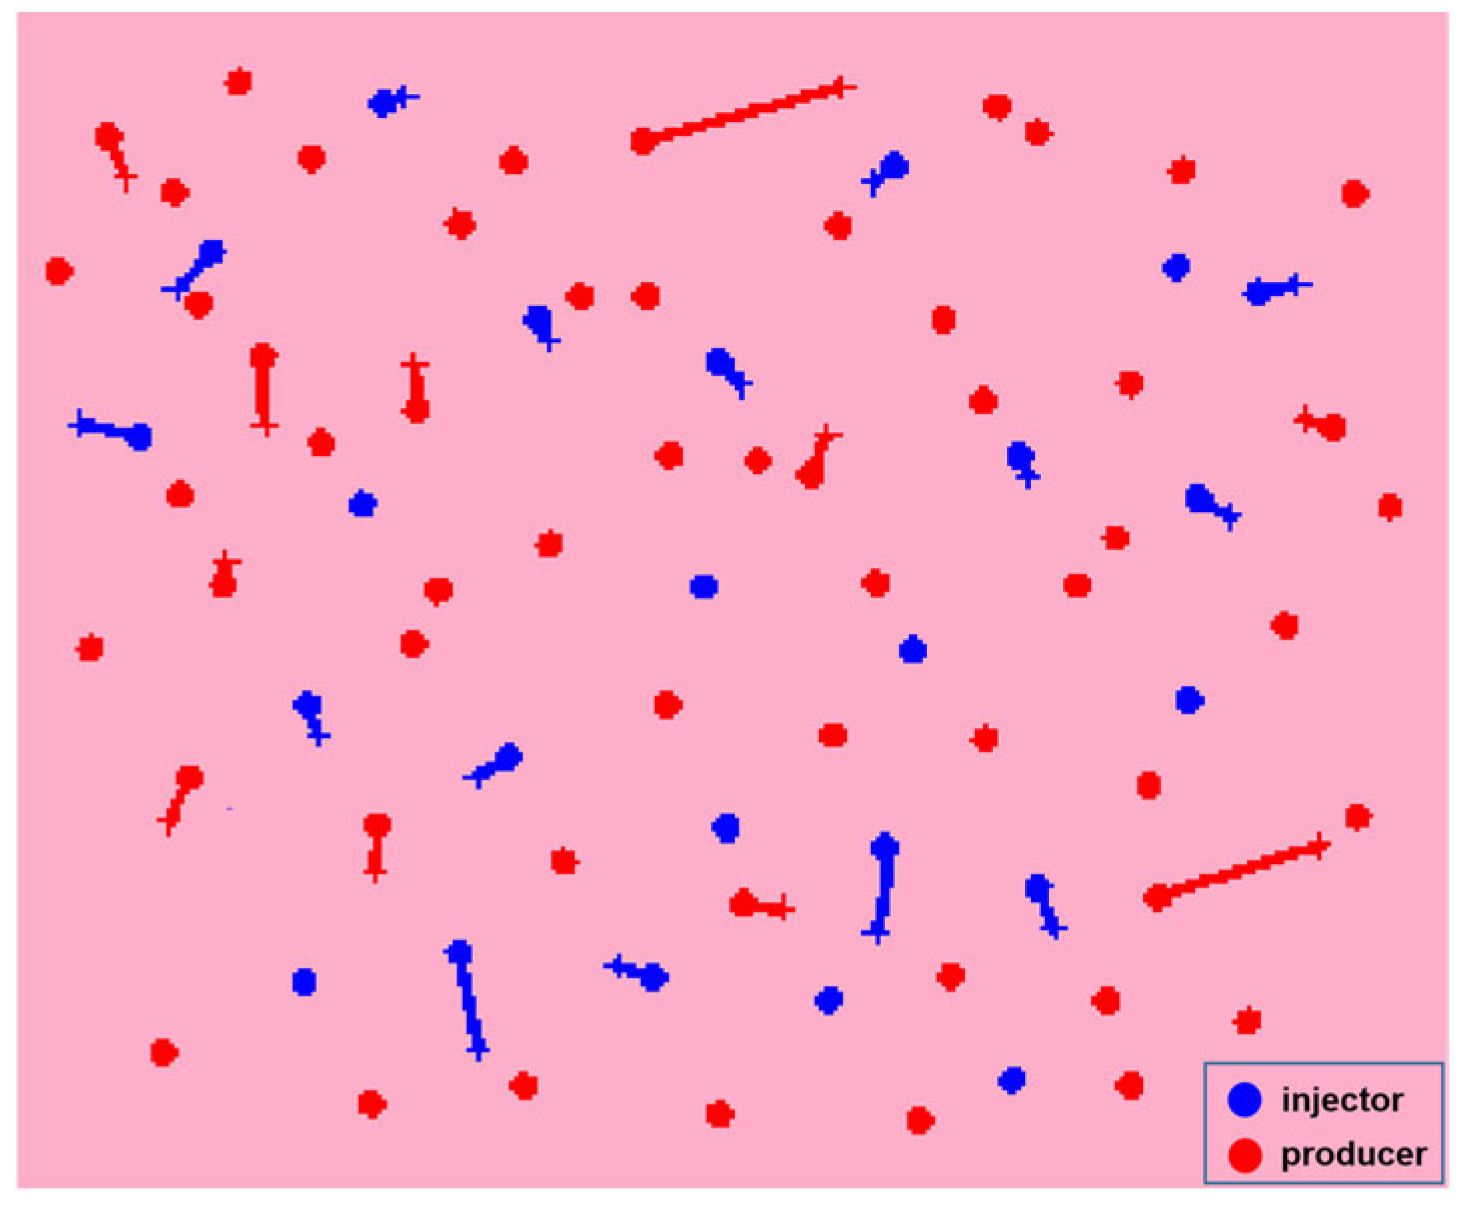
Currently, the study area comprises 80 wells, including 56 producers and 24 injectors, which are shown in Figure 1. The monthly oil production is 2480 tons with a water cut of 79.79%. The monthly injection volume is maintained at 3771 m3, resulting in an injection–production ratio of 1.11. The cumulative oil production has reached 1.156 million tons, corresponding to a recovery factor of 31%. Three critical challenges persist in reservoir development.
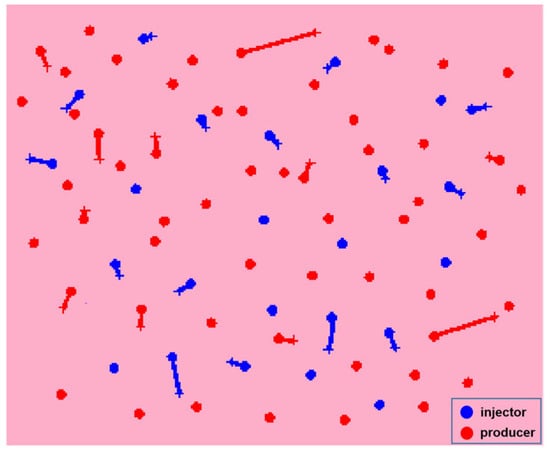
Figure 1.
Well locations in the study area.
The first one is severe reservoir heterogeneity and interlayer conflicts. The reservoir heterogeneity is significant, and there is a substantial contradiction between injection and production layers. The contradiction arises when injected water preferentially channels through high-permeability layers, bypassing low-permeability zones, leading to uneven sweep efficiency. Statistics from 24 profiles of 10 wells show that there are 114 perforated layers and 80 water-absorbing layers, accounting for 70.2% of the total layers. The perforated thickness is 313.9 m, and the water-absorbing thickness is 191.2 m, accounting for 60.9% of the total layers. The ratio of the maximum water-absorbing percentage to the minimum water-absorbing percentage is greater than 3 in 30% of the total wells.
The second one is the suboptimal well pattern configuration and injection–production correspondence. The perfection of the well pattern is low, and the corresponding relationship between injection and production is poor. Currently, due to the abandonment of water wells, the direction of the oil well effect is singular. Under the existing production well pattern conditions, the injection–production correspondence coefficients of some layers are lower than 0.7, and the injection–production correspondence has deteriorated. There are no water injection control wells according to the current well pattern conditions. Sixteen wells are affected in one direction, and seven wells are affected in two directions, resulting in poor injection–production correspondence.
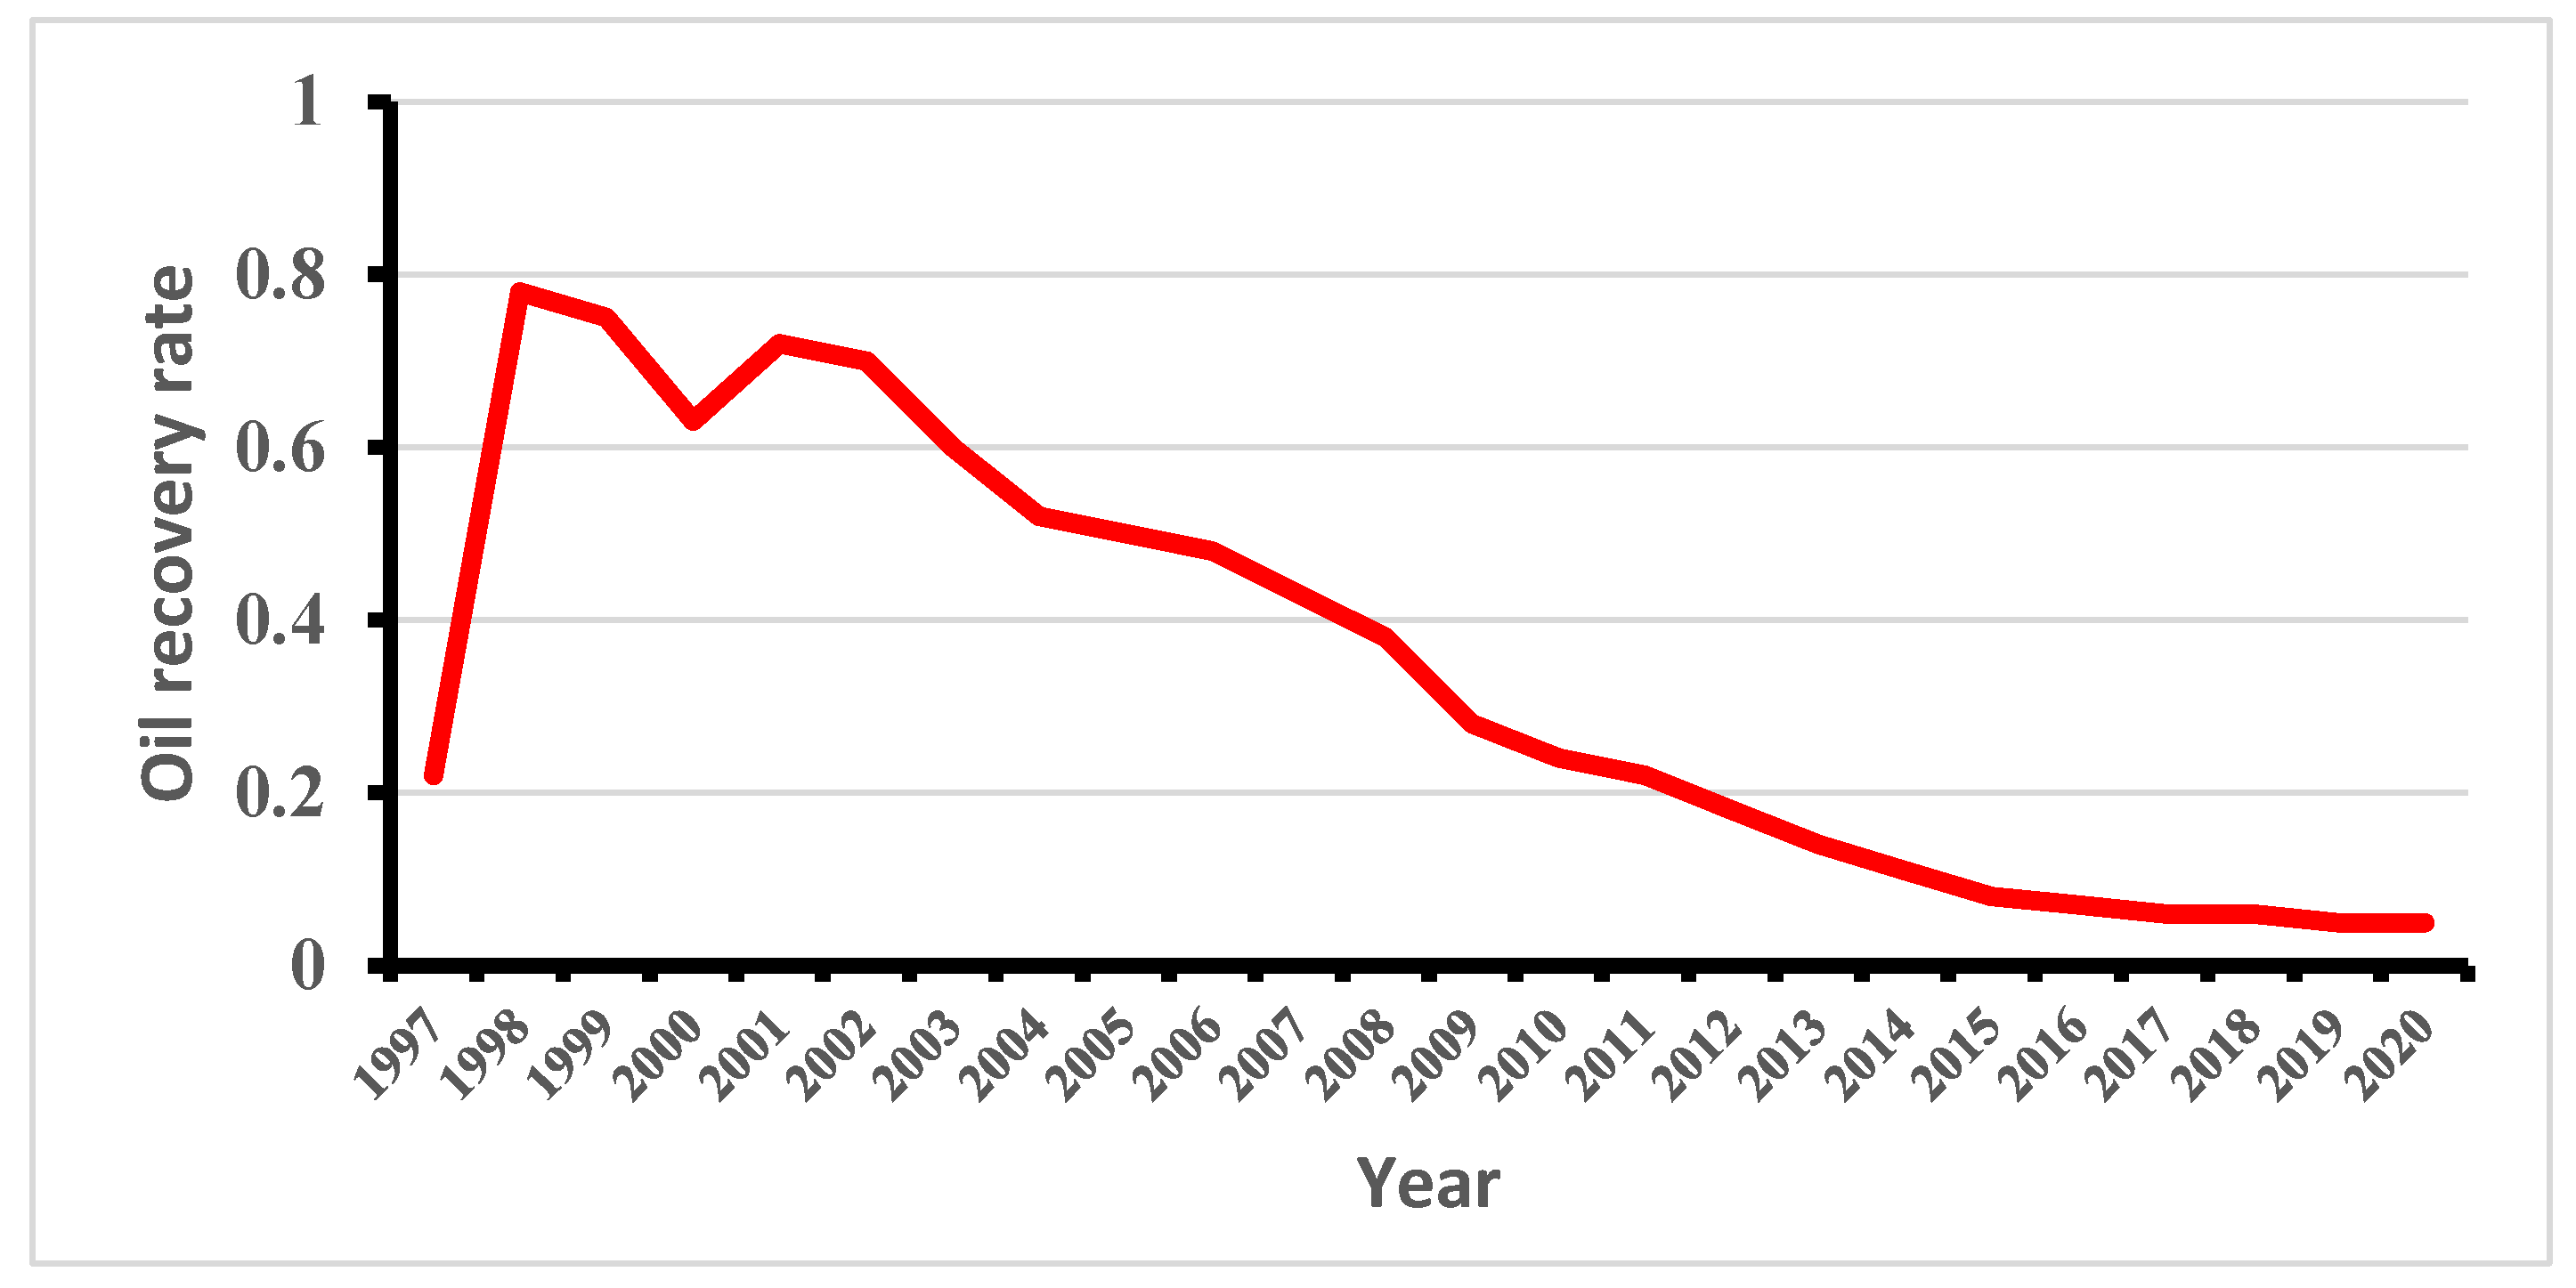
The third one is the low oil production rate and rapid water cut increase. The oil production rate is low, the water cut rises rapidly, and the recovery rate is low. The maximum oil production rate in the study area is 0.76%, and the oil production rate has been stable above 0.6% for only five years. Since 2004, the oil production rate has gradually decreased, and the current oil production rate is only 0.05% (Figure 2). The actual water-free recovery period of the reservoir is very short, at only five months, and the oil wells will see water within 12 months.

Figure 2.
Oil recovery rate of the reservoir in study area.
3.2. Influencing Factors of Splitting Coefficient and Calculation Results
The factors influencing the splitting coefficient can be categorized into two distinct groups. The first category comprises geological factors, including the interval permeability, connectivity coefficient between injection and production wells, sedimentary microfacies influence coefficient, and layer thickness. The second category encompasses anthropic factors, such as the number and spacing of injection and production wells, as well as the stimulation factor. The stimulation factor [20] represents the ratio of production from an oilfield block after enhanced recovery measures (such as fracturing and acidizing) to the production prior to these treatments.
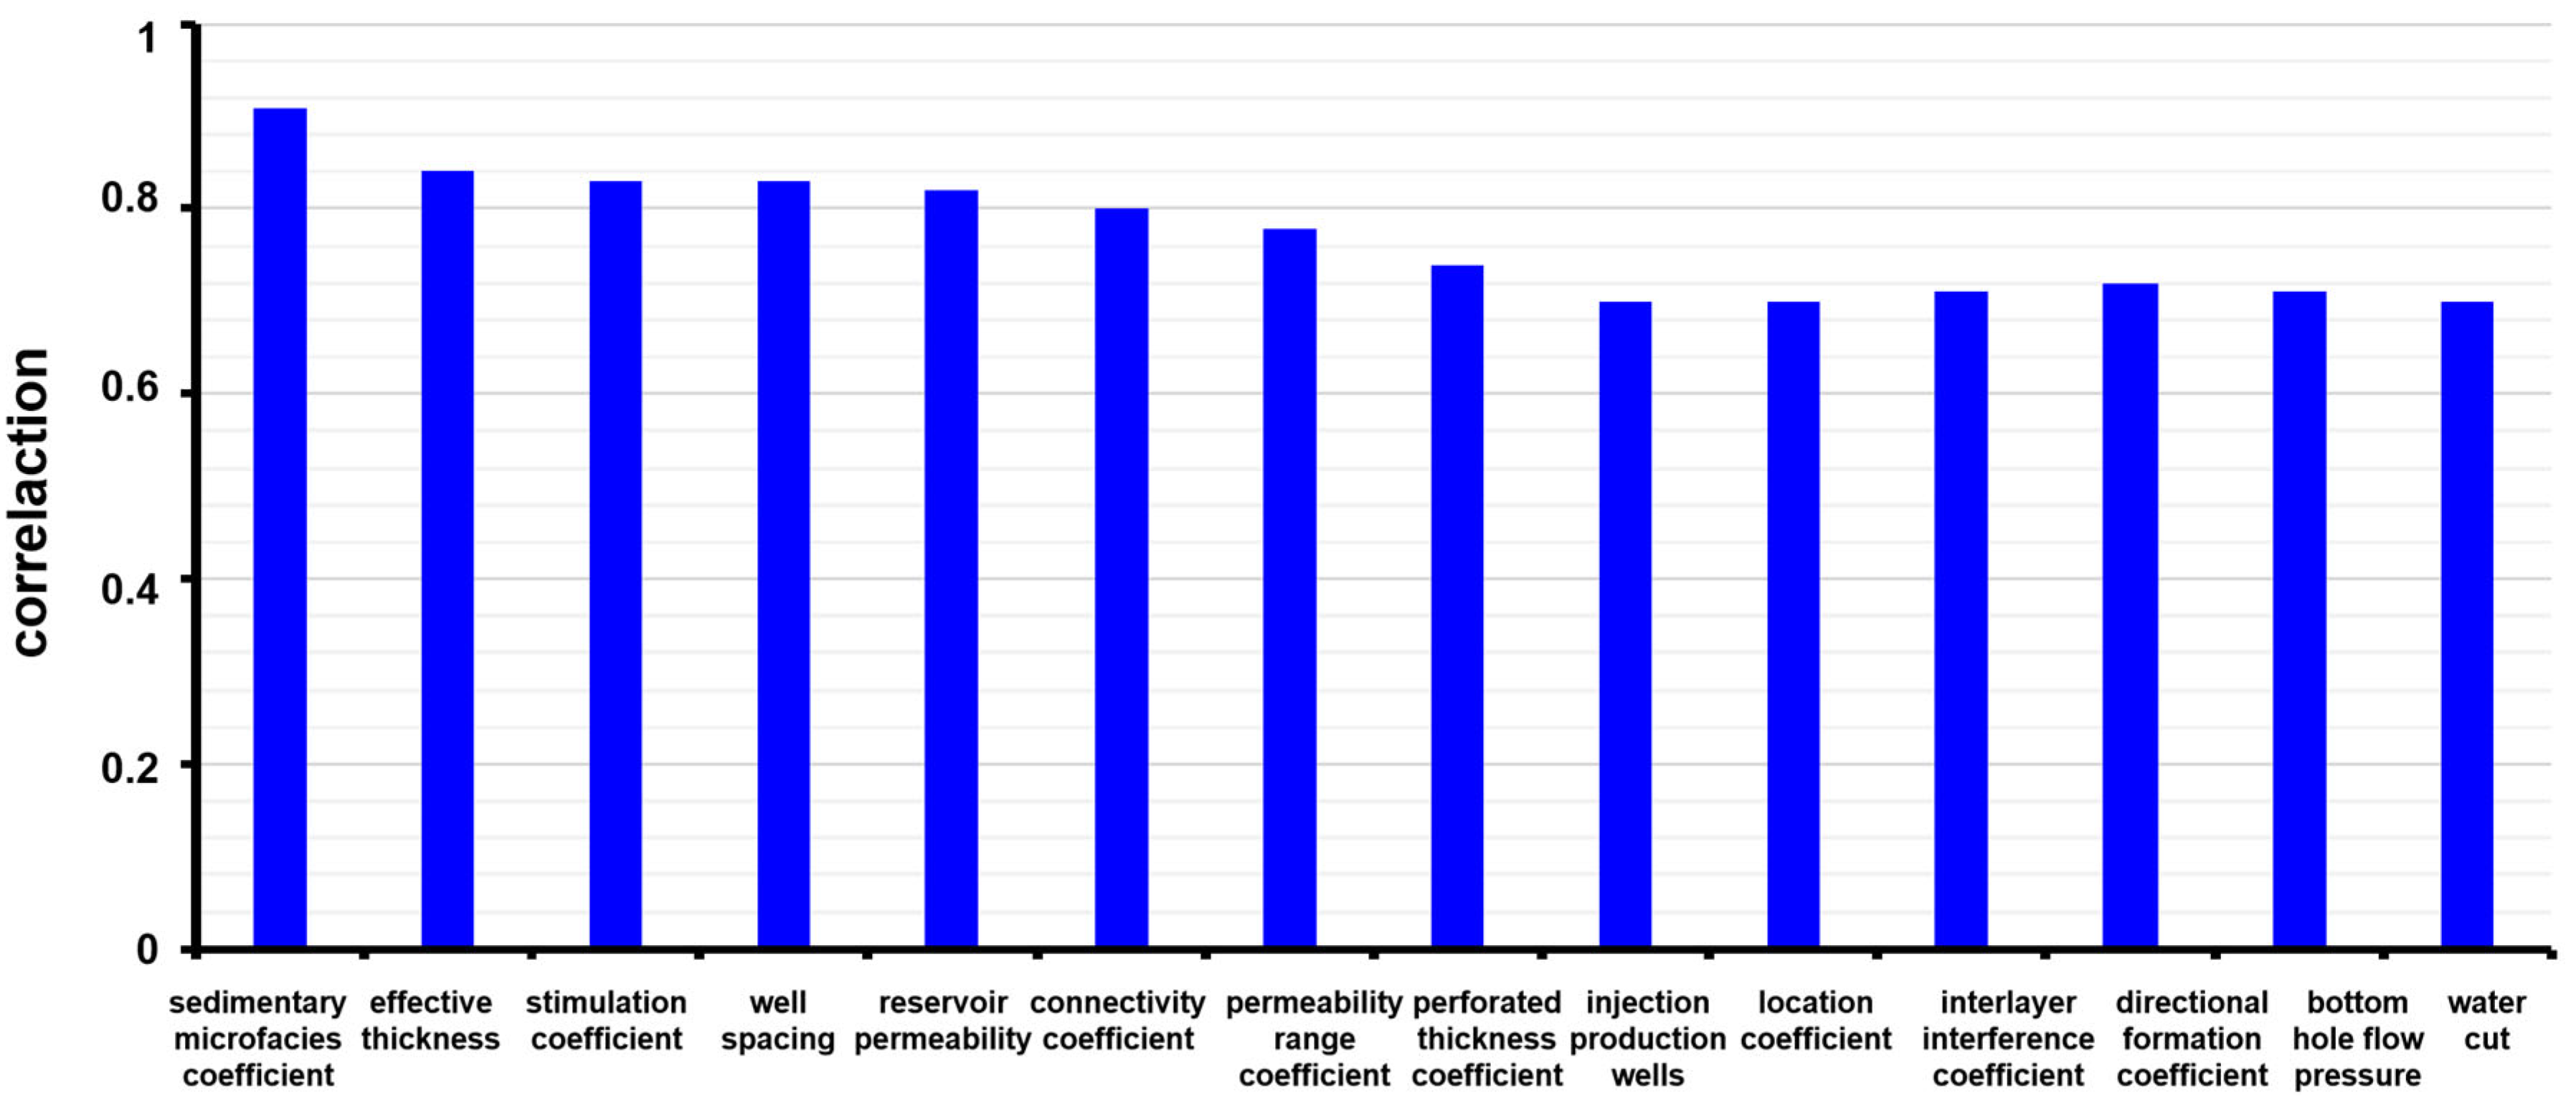
In this study, fourteen factors, including the sedimentary microfacies coefficient, connectivity coefficient, directional formation coefficient, and bottom hole flowing pressure, were selected as the comparison sequence. Based on the grey correlation coefficient calculations, the sedimentary microfacies coefficient and reservoir effective thickness were identified as the most significant factors affecting the water injection efficiency in the target block. These were followed by the measure transformation coefficient, connectivity coefficient, and permeability, while the exploitation thickness coefficient, oil layer effective thickness, and water cut exhibited the smallest influences.
The analysis demonstrates that increasing the number of injection wells and optimizing the well patterns in this block can significantly enhance the water injection efficiency. Additionally, stimulation measures such as fracturing and acidizing can also contribute to improved injection performance. The top seven factors influencing the splitting coefficient in the study area, ranked by their impacts, are the sedimentary microfacies coefficient, reservoir effective thickness, stimulation factor, well spacing, reservoir permeability, connectivity coefficient and permeability range coefficient, and perforated thickness coefficient (Figure 3).

Figure 3.
Correlation degrees of influencing factors of splitting coefficient.
3.3. Application of Grey Correlation Analysis
Based on the identified seven primary influencing factors, a comprehensive statistical analysis was conducted to evaluate their impacts on the splitting coefficient across two to five layers in fourteen wells. The results are systematically presented in the influencing factor table. These quantified factors were subsequently incorporated into the splitting coefficient calculation formula (Equation (6)) to determine the respective coefficients for the corresponding water injection zones in the fourteen wells, as detailed in Table 1.

Table 1.
Statistical table of influencing factors and splitting coefficients of fourteen wells.
The calculated splitting coefficients for the fourteen wells were subsequently applied to the water injection allocation formula (Equation (8)), enabling the determination of corresponding injection rates for each well. The quantitative results of the allocated water injection volumes are presented in Table 2.
Table 2.
Statistics of allocated water injection volumes of fourteen wells.
The application of the grey correlation coefficient method has demonstrated significant effectiveness in quantifying the relative influences of multiple factors on the splitting coefficient, thereby enabling optimized injection allocation strategies in the study area. The analytical results reveal that geological parameters, particularly the sedimentary microfacies coefficient and reservoir effective thickness, exert predominant control over the water injection efficiency. The refined splitting coefficient formula, developed through this systematic analysis, provides a scientifically robust foundation for injection rate allocation, ultimately leading to enhanced waterflooding performance and improved reservoir management outcomes.
4. Discussion
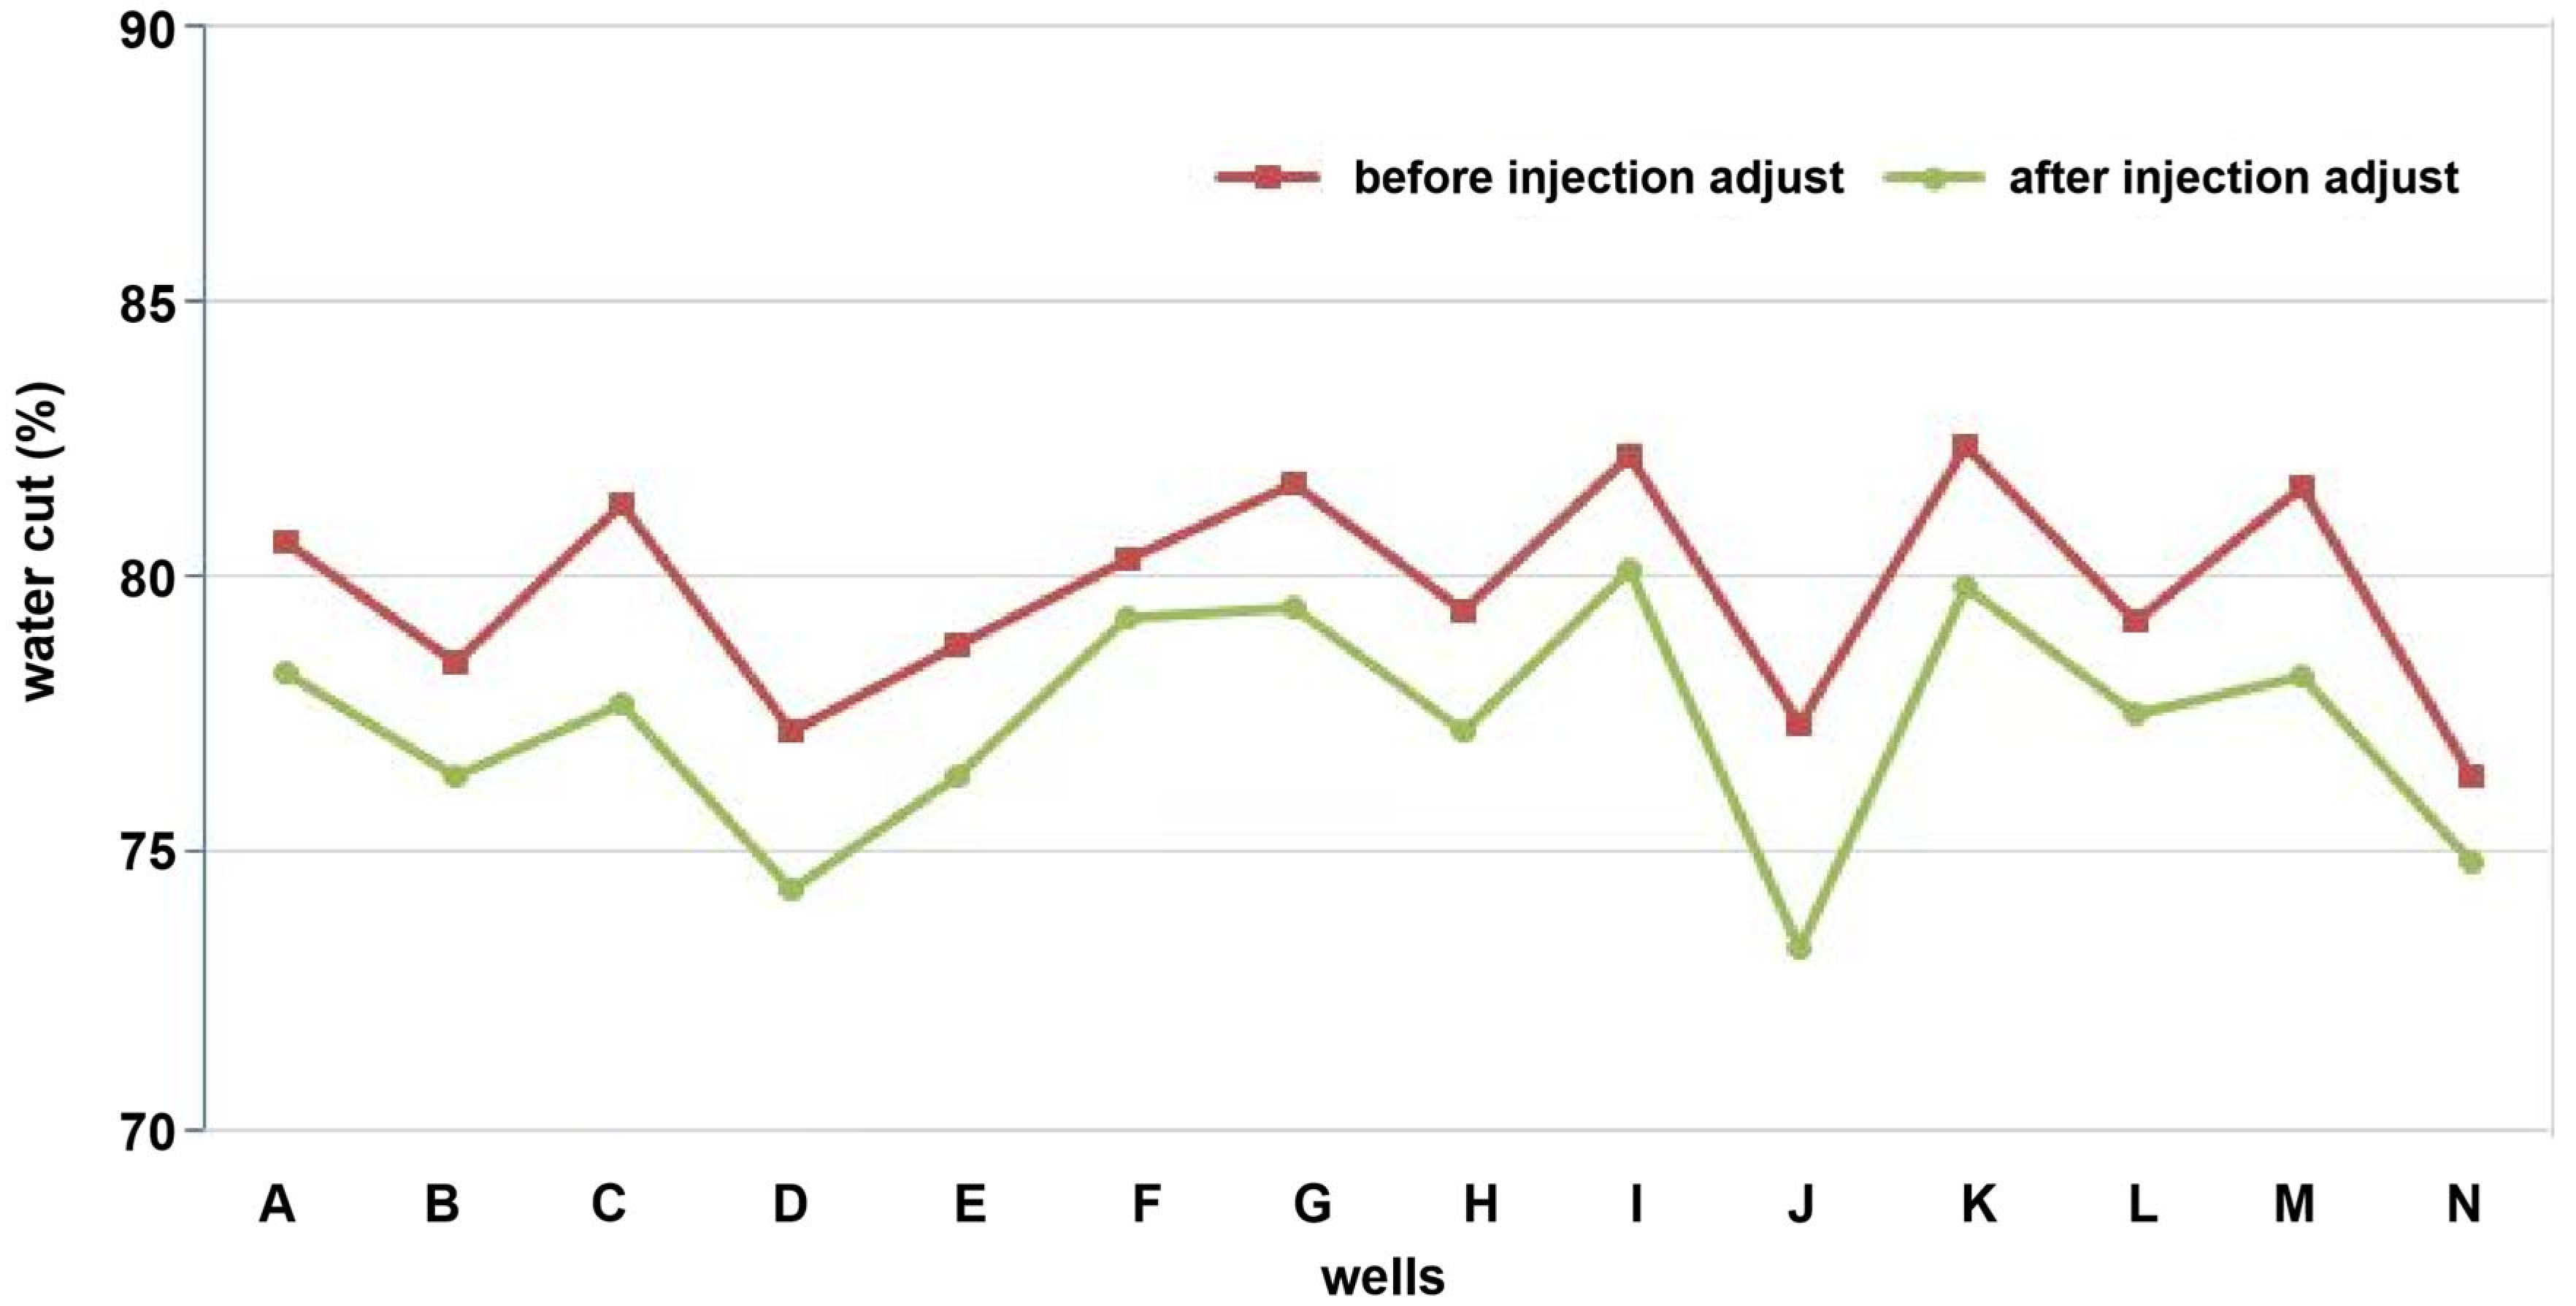
Since its implementation in October 2021, the proposed injection allocation method has been systematically applied to guide water injection strategies in the study area, with adjustments made monthly until May 2022. The results demonstrate significant improvements in production performance: the monthly oil production of the area increased from 2480 tons to 2520 tons, with an increase of 40 tons. Meanwhile, the monthly water production decreased from 2751.94 m3 to 2352.70 m3, with a decrease of 399.24 m3. Consequently, the average water cut of the block decreased by 2.45%, reaching 77.34%.
These outcomes confirm the applicability and effectiveness of the proposed method in optimizing water injection allocation, leading to enhanced oil recovery and reduced water production (Figure 4 and Figure 5). To contextualize these improvements, Table 3 compares the proposed method with two conventional approaches—the Hearn–Hall empirical curve method and the connected thickness ratio method—highlighting key advantages in dynamic adaptability and operational efficiency. The proposed method uniquely integrates dynamic operational factors and real-time production data, enabling adaptive allocation in heterogeneous reservoirs. In contrast, traditional methods rely on static parameters, struggling to address interlayer conflicts.
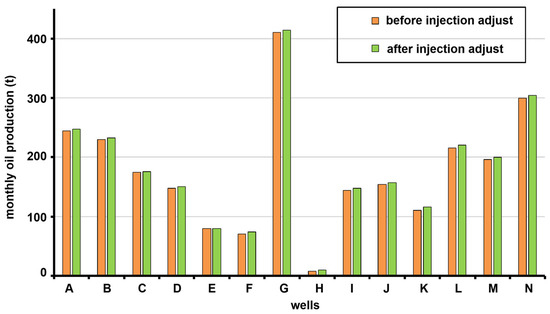
Figure 4.
Monthly oil production before and after injection adjustment.

Figure 5.
Water cut before and after injection adjustment.
Table 3.
Comparison between proposed method and existing approaches.
The success of this approach lies in its ability to rationally distribute the total water injection volumes across individual injection wells, effectively addressing inter-well heterogeneity and improving the sweep efficiency. In high-water-cut production wells, where water channeling between injectors and producers has been established, production allocation emerges as a critical factor influencing the injection strategies. From an optimization perspective, the recommended strategy for high-water-cut well areas involves reducing production allocation or shutting in high-water-cut wells, while moderately increasing production allocation in low-water-cut wells. This balanced approach ensures efficient fluid displacement and minimizes water breakthrough.
Furthermore, the study highlights the significant impact of the formation pressure dynamics on injection allocation. Under constant external conditions, maintaining or slightly increasing the formation pressure through controlled water injection is essential in sustaining the reservoir energy and optimizing recovery. These findings align with previous studies emphasizing the importance of pressure maintenance in waterflooding operations, particularly in heterogeneous reservoirs.
The results of this study contribute to the growing body of knowledge on waterflooding optimization in mature reservoirs. The proposed method not only addresses the specific challenges of the study area but also provides a transferable framework for similar reservoirs experiencing high water cuts and inter-well heterogeneity. Future research should focus on integrating real-time monitoring data and advanced reservoir simulation tools to further refine the injection strategies. Additionally, the application of intelligent optimization algorithms, such as machine learning models, could enhance the precision of injection allocation decisions, particularly in complex well patterns.
5. Conclusions
The study area is currently undergoing water injection development utilizing an inverted nine-spot well pattern with 360 m well spacing. The development process has progressed through five distinct stages: oil testing and production testing, strong injection and strong production, production decline, low-speed stable production, and low-yield decline. Key challenges in reservoir development include (1) significant reservoir heterogeneity and pronounced contradictions between injection and production layers; (2) a suboptimal well pattern configuration and poor injection–production correspondence; and (3) low oil production rates, rapid water cut escalation, and diminished recovery rates.
To address these challenges, 14 factors—including the sedimentary microfacies coefficient, connectivity coefficient, directional formation coefficient, and bottom hole flowing pressure—were selected for comprehensive analysis. Utilizing the grey correlation method, the top seven influencing factors were identified: the sedimentary microfacies coefficient, effective interval thickness, stimulation factor, well spacing, interval permeability, connectivity coefficient, and permeability range coefficient. The refined splitting coefficient formula facilitated precise injection allocation across fourteen wells, resulting in a 40-ton/month increase in oil production and a 399.24 m3/month reduction in water production. Field implementation successfully reduced the average water cut by 2.45%, achieving a final water cut of 77.34%. These results underscore the method’s efficacy in mitigating interlayer conflicts and enhancing the sweep efficiency.
This approach introduces three significant advancements over conventional methods. It incorporates real-time production performance data, which eliminates the dependence on static reservoir parameters, thereby enhancing the dynamic adaptability. Compared to traditional layer-specific static analysis, it reduces the data preparation workload, significantly improving the operational efficiency. Moreover, validated across fourteen wells, the framework demonstrates transferability to heterogeneous reservoirs with similar water cut characteristics, highlighting its scalability. While the method was validated in fourteen pilot wells, future studies will expand the sample size to broader reservoirs.
The proposed method leverages the grey correlation method to determine the influencing factors of the splitting coefficient, subsequently calculating the coefficient to derive distributed water injection volumes. By integrating production performance data from both injection and production wells, this method overcomes the limitations of traditional approaches, such as the labor-intensive data preparation associated with static layer data and static splitting methods. The method’s simplicity, practicality, and ability to discern patterns within complex datasets significantly reduce the workload while ensuring reliable results.
This study provides critical insights for the optimization of oilfield water injection development and offers a robust framework for improved reservoir management. The findings have substantial practical implications in terms of enhancing waterflooding operations, particularly in mature reservoirs with high heterogeneity and water cut challenges. Future research should focus on integrating advanced data analytics and machine learning techniques to further refine injection strategies and enhance the predictive accuracy.
Author Contributions
Conceptualization, B.H. and H.L.; Methodology, X.L., B.H., H.L. and J.Z.; Software, J.Z.; Investigation, X.L.; Data curation, H.G.; Writing—original draft, X.L. All authors have read and agreed to the published version of the manuscript.
Funding
The APC was funded by Research Institute of Petroleum Exploration & Development.
Data Availability Statement
The original contributions presented in the study are included in the article, further inquiries can be directed to the corresponding author.
Acknowledgments
The authors gratefully acknowledge the support from my mentor, Bing Hou, and Academician Liu, and the China University of Petroleum (Beijing), Artificial Intelligence Research Center, and Artificial Intelligence Technology R&D Center for Exploration and Development.
Conflicts of Interest
All authors declare that the research was conducted in the absence of any commercial or financial relationships that could be construed as a potential conflict of interest.
Abbreviations
The following abbreviations are used in this manuscript:
| reference sequence (dependent variable) | |
| comparison sequences (independent variables) | |
| k-th data point in i-th sequence | |
| dimensionless value of k-th data point in i-th sequence | |
| correlation coefficient | |
| resolution coefficient | |
| correlation degree | |
| layer | |
| splitting coefficient, dimensionless | |
| splitting condition value, dimensionless | |
| sedimentary microfacies coefficient, dimensionless | |
| effective thickness, m | |
| stimulation factor, dimensionless | |
| well spacing, m | |
| effective permeability, md | |
| connectivity coefficient, dimensionless | |
| permeability range coefficient, dimensionless | |
| interval injection allocation, m3 | |
| single-well injection allocation, m3 |
References
- Silin, D.B.; Patzek, T.W. Control model of water injection into a layered formation. SPE J. 2001, 6, 253–261. [Google Scholar] [CrossRef]
- Belayneh, M.; Geiger, S.; Matthai, S.K. Numerical simulation of water injection into layered fractured carbonate reservoir analogs. AAPG Bull. 2006, 90, 1473–1493. [Google Scholar] [CrossRef]
- El-Hadidi, S.M.; Falade, G.K.; Dabbouk, C.; Al-Ansari, F. Water injection profile modification in a layered reservoir with polymer treatment. SPE Reserv. Eval. Eng. 2000, 3, 197–203. [Google Scholar] [CrossRef]
- Zhou, Y.; Chen, H. Study on mechanism of layered water injection by pressure pulse control. J. Discret. Math. Sci. Cryptogr. 2018, 21, 1369–1372. [Google Scholar] [CrossRef]
- Moritis, G. Smart, intelligent wells provide real-time well control, monitoring. Oil Gas J. 2001, 99, 72. [Google Scholar]
- Payri, R.; Gimeno, J.; Marti-Aldaravi, P.; Viera, A. Measurements of the mass allocation for multiple injection strategies using the rate of injection and momentum flux signals. Int. J. Engine Res. 2021, 22, 1180–1195. [Google Scholar] [CrossRef]
- Zong, Y.; Bao, W.; Chang, J.; Hu, J.; Yang, Q.; Song, J.; Wu, M. Effect of fuel injection allocation on the combustion characteristics of a cavity-strut model scramjet. J. Aerosp. Eng. 2015, 28, 04014050. [Google Scholar] [CrossRef]
- Emre, E.; Khargonekar, P. Regulation of split linear systems over rings: Coefficient-assignment and observers. IEEE Trans. Autom. Control 1982, 27, 104–113. [Google Scholar] [CrossRef]
- Yin, T.; Zhendong, J.; Junli, L.; Weichao, Z.; Jinghui, L.; Ying, G. Research and Application of Cable-controlled Layered Water Injection Technology in Daqing Oilfield. Oil Forum 2022, 41, 94. [Google Scholar]
- Liu, Y.; Xiao, G.; Zhan, W.; Wang, J. Research and Application of Layered Profile Control and Water Injection Integrated Technology. Drill. Prod. Technol. 2022, 45, 89. [Google Scholar]
- Mneg, X.; Liu, Y.; Chen, Z.; Zhang, L.; Lan, F. Integration of Measurement and Adjustment Separate Injection Technology for Small Diameter Water Injection Well. Drill. Prod. Technol. 2022, 45, 95. [Google Scholar]
- Pitkänen, E.M.; Sirén, H.M.M. Capillary zone electrophoresis of lipoarabinomannan by multi-layered concentration. J. Sep. Sci. 2022, 45, 945–959. [Google Scholar] [CrossRef] [PubMed]
- Zhang, L.; Lou, J.; Wen, X.; Chen, X.; Liu, Z.; Sun, D.; Tan, J. Numerical Simulation of Pressure Loss of Crossing Bridge Short Joints of Layered Water Injection Tool Based on Fluent. J. Petrochem. Univ. 2021, 34, 64. [Google Scholar]
- Chengjun, Z.; Yue, L.; Lei, W.; Qinglong, Z.; Zongtong, M.; Zhaoyu, Z. Research and Application of Mechanical Intelligent Layered Water Injection Technology. J. Petrochem. Univ. 2019, 32, 99. [Google Scholar] [CrossRef]
- Erzhen, W.; Haien, Y.; Jiuzheng, Y.; Lingzhi, Y.; Zhenning, J.; Gaixing, H. Research and Field Application of Digital Layered Water Injection Technology Based on Wave Code Communications. Oil Forum 2022, 41, 100. [Google Scholar]
- Sharifpour, E.; Riazi, M.; Ayatollahi, S. Smart technique in water shutoff treatment for a layered reservoir through an engineered injection/production scheme. Ind. Eng. Chem. Res. 2015, 54, 11236–11246. [Google Scholar] [CrossRef]
- Almeida, L.F.; Vellasco, M.M.; Pacheco, M.A. Optimization system for valve control in intelligent wells under uncertainties. J. Pet. Sci. Eng. 2010, 73, 129–140. [Google Scholar] [CrossRef]
- Haghighat Sefat, M.; Elsheikh, A.H.; Muradov, K.M.; Davies, D.R. Reservoir uncertainty tolerant, proactive control of intelligent wells. Comput. Geosci. 2016, 20, 655–676. [Google Scholar] [CrossRef]
- Dilib, F.A.; Jackson, M.D. Closed-loop feedback control for production optimization of intelligent wells under uncertainty. SPE Prod. Oper. 2013, 28, 345–357. [Google Scholar]
- Wang, L.; Yin, H.; Zhang, J.; Zhao, H. Adaptability Study on Dividing Approach of Accurate Water Injection in Well Block D. Int. J. Fluid Dyn. 2014, 2, 46–51. [Google Scholar] [CrossRef]

Disclaimer/Publisher’s Note: The statements, opinions and data contained in all publications are solely those of the individual author(s) and contributor(s) and not of MDPI and/or the editor(s). MDPI and/or the editor(s) disclaim responsibility for any injury to people or property resulting from any ideas, methods, instructions or products referred to in the content. |
© 2025 by the authors. Licensee MDPI, Basel, Switzerland. This article is an open access article distributed under the terms and conditions of the Creative Commons Attribution (CC BY) license (https://creativecommons.org/licenses/by/4.0/).